User login
Novel lupus therapies take center stage
It’s been a banner year for treatment advances in systemic lupus erythematosus (SLE), with two drugs gaining approval for lupus nephritis while other promising molecules with novel mechanisms of action advanced smartly through the developmental pipeline, speakers agreed at the 2021 Rheumatology Winter Clinical Symposium.

“I think the most important thing in rheumatology in the last year is where we are now with lupus. With two drugs being approved for lupus nephritis, I think that’s really huge as we talk about treat-to-target,” said Alvin F. Wells, MD, PhD, a rheumatologist in Franklin, Wisc.
Martin Bergman, MD, concurred.
“Lupus has been blowing up in the past year. We have two new medications for lupus nephritis, we have two or three new mechanisms of action for therapy. I think that was one of the biggest things in rheumatology in the past year,” said Dr. Bergman, a rheumatologist at Drexel University in Philadelphia and in private practice in Ridley Park, Pa.
Together with Roy Fleischmann, MD, Dr. Wells spotlighted promising new molecules for the treatment of SLE, giant cell arteritis, vasculitis, rheumatoid arthritis, and osteoarthritis.
SLE
The two drugs approved in recent months specifically for lupus nephritis are voclosporin (Lupkynis) and belimumab (Benlysta), which has been approved for lupus for a decade. Voclosporin, an oral calcineurin inhibitor, is a modification of cyclosporine offering significant advantages over the older drug: It’s more potent, requires no dose titration, has a better safety profile, and is metabolized more quickly.
“A safer and easier-to-use calcineurin inhibitor is going to be huge,” Dr. Wells predicted.
Up for Food and Drug Administration review in the coming year on the basis of the positive phase 3 TULIP-1 and TULIP-2 trials is anifrolumab, a monoclonal antibody that binds to the type 1 interferon receptor subunit 1d. At 52 weeks in the pooled analysis, one or more SLE flares occurred in 33.6% of patients on anifrolumab and 42.9% of placebo-treated controls.
“This is not a blockbuster, but it’s a worthwhile addition, like belimumab,” according to Dr. Fleischmann, a rheumatologist at the University of Texas, Dallas.
Dr. Wells concurred, with a reservation: In a subgroup analysis of the TULIP trials, anifrolumab wasn’t significantly better than placebo in black patients, who tend to have more severe and tough-to-treat renal disease.
“Anifrolumab doesn’t look as effective as some other agents, and I’d be disinclined to give it to my black patients,” the rheumatologist said.
Dr. Fleischmann was far more enthusiastic about obinutuzumab (Gazyva), a humanized anti-CD20 monoclonal antibody already approved for the treatment of chronic lymphocytic leukemia and follicular lymphoma.

“It’s an anti-CD20, like rituximab. But it’s better than rituximab, it’s much more effective,” he said.
He pointed to the phase 2 NOBILITY trial, in which 125 patients with class III/IV lupus nephritis were randomized to a 1,000-mg infusion of obinutuzumab or placebo at weeks 0, 2, 24, and 26 and followed for 2 years. The complete renal response rate at 104 weeks in the obinutuzumab group was 41% and the partial renal response rate was 13%, compared to 23% and 6% in controls. The obinutuzumab group also did significantly better in terms of improvement in complement levels, double-stranded DNA, and estimated glomerular filtration rate. All this was accomplished even though the reduction in peripheral B cells dropped from 93% at week 24 to just 16% at week 104. This suggests that tissue levels of B cells in the kidney, joints, and skin may be more important than circulating B cell levels.
“This looks like a very promising agent for patients with lupus nephritis,” Dr. Wells said. “The fact that they got this long-term effect for 2 years with just four infusions is really impressive.”
Another promising drug is iberdomide, an oral modulator of the E3 ubiquitin ligase complex which decreases plasmacytoid dendritic cells and B cells while increasing T regulatory cells. In a phase 2b clinical trial in 288 patients with active SLE, all on background standard-of-care therapy, a 4-point or greater reduction in the SLE Responder Index (SRI-4) at week 24 was achieved in 54.3% of the group on iberdomide at 0.45 mg/day, a significantly better result than the 34.9% rate with placebo. This absolute 19.4% difference was even greater in the subgroup of patients with a high baseline level of the transcription factor Aiolos, where the absolute improvement over placebo was 32.9%. Similarly, the benefit of iberdomide was also enhanced in patients with a high baseline level of type 1 interferon, where the absolute difference was 26.8%. This raises the prospect that a bioassay could be developed to predict the likelihood of a favorable clinical response to the drug. Iberdomide was well tolerated, with fewer severe adverse events than in the control group.
A humanized monoclonal antibody known for now as BIIB059 demonstrated efficacy and was well tolerated in the phase 2 LILAC trial. BIIB059 binds to blood dendritic cell antigen 2 (BDCA2), a receptor specific to plasmacytoid dendritic cells, resulting in decreased production of type 1 interferon and other inflammatory cytokines. The LILAC trial included 132 SLE patients with active arthritis and skin disease who received subcutaneous injections of BIIB059 at 450 mg or placebo every 4 weeks, with an extra dose at week 2. The primary endpoint was met, with an absolute 15-joint reduction in the total number of tender or swollen joints from baseline to week 24 in the BIIB059 group, compared to an 11.6-joint reduction with placebo. In addition, the likelihood of an SRI-4 response at week 24 was 3.49-fold greater with BIIB059 than with placebo.
Dr. Wells noted that the BIIB059 group showed continued improvement from week 12 to week 24, unlike the response pattern seen with many biologics for rheumatoid arthritis, where a plateau is reached by 8-12 weeks.
Vasculitis
The positive results for the C5a receptor inhibitor avacopan for treatment of antineutrophil cytoplasmic antibody (ANCA)-associated vasculitis in the phase-3 ADVOCATE trial have been hailed by some rheumatologists as a major breakthrough, but Dr. Fleischmann isn’t so sure.
The trial randomized 331 patients to oral avacopan at 30 mg twice daily or oral prednisone, with all patients on either cyclophosphamide or rituximab. Avacopan was noninferior to prednisone in terms of remission at week 26, but superior to prednisone for sustained taper at week 52. The rate of serious adverse events was 45.1% with prednisone and 42.2% in the avacopan arm.
“This is a drug that’s going to be much, much more expensive than prednisone. There were people in our group who were ecstatic that this drug is going to come, but how much it’s going to be used, I don’t know,” Dr. Fleischmann said.
Dr. Wells said cost-benefit analyses will be needed in order to learn if avacopan’s anticipated high sticker price is offset by the cost of serious corticosteroid side effects such as avascular necrosis.
Giant cell arteritis
Mavrilimumab is a human monoclonal antibody that inhibits human granulocyte macrophage colony stimulating factor receptor alpha. It demonstrated impressive efficacy in a phase 2, double-blind, randomized, placebo-controlled trial conducted in 70 patients with biopsy-confirmed giant cell arteritis. Participants were on corticosteroids until they went into remission and were then randomized to mavrilimumab or placebo, with the steroids stopped. By week 26, 19% of patients in the mavrilimumab arm had flared, as compared to 46.4% of controls.
“This is a game changer,” Dr. Wells declared. “I struggle with these patients because I can’t get the IL-6 drugs approved for them. I need something else.”
Dr. Fleischmann has a good idea how he’ll use mavrilimumab, if it wins approval: “I think this is clearly a drug you would use in a patient you can’t get off steroids and you’re having all the steroid toxicity. I don’t know that you’d use it right away.”
Osteoarthritis
Dr. Fleischmann predicted that tanezumab, a monoclonal antibody directed against nerve growth factor, will win FDA approval in 2021 for the treatment of osteoarthritis pain in patients with an inadequate response or intolerance to standard-of-care NSAIDs and opioids. But he cautioned his colleagues not to expect too much from the biologic, which has a long and checkered developmental history.
“It works better than placebo. It does not work better than an NSAID or an opioid. So it should be reasonable in patients who cannot take an NSAID or cannot or will not take an opioid,” he said.
There are safety issues to be aware of with tanezumab, he added: clinically significant increased risks of peripheral neuropathy and joint space narrowing.
Rheumatoid arthritis
Dr. Wells thought one of the most interesting novel therapies for RA in the past year didn’t involve a pharmaceutical, but rather noninvasive auricular branch stimulation of the vagus nerve. He cited an open-label, 12-week, uncontrolled study in 27 patients with active RA who wore an ear clip for vagal nerve stimulation for 12 weeks. The mean Disease Activity Score in 28 joints using C-reactive protein (DAS28-CRP) – the primary study endpoint – improved from 6.30 at baseline to 3.76 at week 12. The number of tender joints dropped from 12.17 to 4.7, while the swollen joint count went from 7.0 to 3.44. Pain scores improved from 75.23 to 43.3. Scores on the Health Assessment Questionnaire Disability Index improved from 1.59 to 1.05. There was no significant change in CRP. All in all, a modest clinical effect achieved noninvasively.
“The thing that did it for me was the effect on MRI from baseline: decreased synovitis, osteitis, and bone erosion scores,” Dr. Wells said. “This is noninvasive, so patients who want to do medical marijuana or CBD can put an earring on their auricular nerve.”
Dr. Fleischmann scoffed. “An open-label study, 27 patients? Let me see the real study,” he quipped.
Dr. Fleischmann reported receiving clinical trial research grants from and serving as a consultant to more than a dozen pharmaceutical companies. Dr. Wells serves as a consultant to MiCare Path.
It’s been a banner year for treatment advances in systemic lupus erythematosus (SLE), with two drugs gaining approval for lupus nephritis while other promising molecules with novel mechanisms of action advanced smartly through the developmental pipeline, speakers agreed at the 2021 Rheumatology Winter Clinical Symposium.
“I think the most important thing in rheumatology in the last year is where we are now with lupus. With two drugs being approved for lupus nephritis, I think that’s really huge as we talk about treat-to-target,” said Alvin F. Wells, MD, PhD, a rheumatologist in Franklin, Wisc.
Martin Bergman, MD, concurred.
“Lupus has been blowing up in the past year. We have two new medications for lupus nephritis, we have two or three new mechanisms of action for therapy. I think that was one of the biggest things in rheumatology in the past year,” said Dr. Bergman, a rheumatologist at Drexel University in Philadelphia and in private practice in Ridley Park, Pa.
Together with Roy Fleischmann, MD, Dr. Wells spotlighted promising new molecules for the treatment of SLE, giant cell arteritis, vasculitis, rheumatoid arthritis, and osteoarthritis.
SLE
The two drugs approved in recent months specifically for lupus nephritis are voclosporin (Lupkynis) and belimumab (Benlysta), which has been approved for lupus for a decade. Voclosporin, an oral calcineurin inhibitor, is a modification of cyclosporine offering significant advantages over the older drug: It’s more potent, requires no dose titration, has a better safety profile, and is metabolized more quickly.
“A safer and easier-to-use calcineurin inhibitor is going to be huge,” Dr. Wells predicted.
Up for Food and Drug Administration review in the coming year on the basis of the positive phase 3 TULIP-1 and TULIP-2 trials is anifrolumab, a monoclonal antibody that binds to the type 1 interferon receptor subunit 1d. At 52 weeks in the pooled analysis, one or more SLE flares occurred in 33.6% of patients on anifrolumab and 42.9% of placebo-treated controls.
“This is not a blockbuster, but it’s a worthwhile addition, like belimumab,” according to Dr. Fleischmann, a rheumatologist at the University of Texas, Dallas.
Dr. Wells concurred, with a reservation: In a subgroup analysis of the TULIP trials, anifrolumab wasn’t significantly better than placebo in black patients, who tend to have more severe and tough-to-treat renal disease.
“Anifrolumab doesn’t look as effective as some other agents, and I’d be disinclined to give it to my black patients,” the rheumatologist said.
Dr. Fleischmann was far more enthusiastic about obinutuzumab (Gazyva), a humanized anti-CD20 monoclonal antibody already approved for the treatment of chronic lymphocytic leukemia and follicular lymphoma.
“It’s an anti-CD20, like rituximab. But it’s better than rituximab, it’s much more effective,” he said.
He pointed to the phase 2 NOBILITY trial, in which 125 patients with class III/IV lupus nephritis were randomized to a 1,000-mg infusion of obinutuzumab or placebo at weeks 0, 2, 24, and 26 and followed for 2 years. The complete renal response rate at 104 weeks in the obinutuzumab group was 41% and the partial renal response rate was 13%, compared to 23% and 6% in controls. The obinutuzumab group also did significantly better in terms of improvement in complement levels, double-stranded DNA, and estimated glomerular filtration rate. All this was accomplished even though the reduction in peripheral B cells dropped from 93% at week 24 to just 16% at week 104. This suggests that tissue levels of B cells in the kidney, joints, and skin may be more important than circulating B cell levels.
“This looks like a very promising agent for patients with lupus nephritis,” Dr. Wells said. “The fact that they got this long-term effect for 2 years with just four infusions is really impressive.”
Another promising drug is iberdomide, an oral modulator of the E3 ubiquitin ligase complex which decreases plasmacytoid dendritic cells and B cells while increasing T regulatory cells. In a phase 2b clinical trial in 288 patients with active SLE, all on background standard-of-care therapy, a 4-point or greater reduction in the SLE Responder Index (SRI-4) at week 24 was achieved in 54.3% of the group on iberdomide at 0.45 mg/day, a significantly better result than the 34.9% rate with placebo. This absolute 19.4% difference was even greater in the subgroup of patients with a high baseline level of the transcription factor Aiolos, where the absolute improvement over placebo was 32.9%. Similarly, the benefit of iberdomide was also enhanced in patients with a high baseline level of type 1 interferon, where the absolute difference was 26.8%. This raises the prospect that a bioassay could be developed to predict the likelihood of a favorable clinical response to the drug. Iberdomide was well tolerated, with fewer severe adverse events than in the control group.
A humanized monoclonal antibody known for now as BIIB059 demonstrated efficacy and was well tolerated in the phase 2 LILAC trial. BIIB059 binds to blood dendritic cell antigen 2 (BDCA2), a receptor specific to plasmacytoid dendritic cells, resulting in decreased production of type 1 interferon and other inflammatory cytokines. The LILAC trial included 132 SLE patients with active arthritis and skin disease who received subcutaneous injections of BIIB059 at 450 mg or placebo every 4 weeks, with an extra dose at week 2. The primary endpoint was met, with an absolute 15-joint reduction in the total number of tender or swollen joints from baseline to week 24 in the BIIB059 group, compared to an 11.6-joint reduction with placebo. In addition, the likelihood of an SRI-4 response at week 24 was 3.49-fold greater with BIIB059 than with placebo.
Dr. Wells noted that the BIIB059 group showed continued improvement from week 12 to week 24, unlike the response pattern seen with many biologics for rheumatoid arthritis, where a plateau is reached by 8-12 weeks.
Vasculitis
The positive results for the C5a receptor inhibitor avacopan for treatment of antineutrophil cytoplasmic antibody (ANCA)-associated vasculitis in the phase-3 ADVOCATE trial have been hailed by some rheumatologists as a major breakthrough, but Dr. Fleischmann isn’t so sure.
The trial randomized 331 patients to oral avacopan at 30 mg twice daily or oral prednisone, with all patients on either cyclophosphamide or rituximab. Avacopan was noninferior to prednisone in terms of remission at week 26, but superior to prednisone for sustained taper at week 52. The rate of serious adverse events was 45.1% with prednisone and 42.2% in the avacopan arm.
“This is a drug that’s going to be much, much more expensive than prednisone. There were people in our group who were ecstatic that this drug is going to come, but how much it’s going to be used, I don’t know,” Dr. Fleischmann said.
Dr. Wells said cost-benefit analyses will be needed in order to learn if avacopan’s anticipated high sticker price is offset by the cost of serious corticosteroid side effects such as avascular necrosis.
Giant cell arteritis
Mavrilimumab is a human monoclonal antibody that inhibits human granulocyte macrophage colony stimulating factor receptor alpha. It demonstrated impressive efficacy in a phase 2, double-blind, randomized, placebo-controlled trial conducted in 70 patients with biopsy-confirmed giant cell arteritis. Participants were on corticosteroids until they went into remission and were then randomized to mavrilimumab or placebo, with the steroids stopped. By week 26, 19% of patients in the mavrilimumab arm had flared, as compared to 46.4% of controls.
“This is a game changer,” Dr. Wells declared. “I struggle with these patients because I can’t get the IL-6 drugs approved for them. I need something else.”
Dr. Fleischmann has a good idea how he’ll use mavrilimumab, if it wins approval: “I think this is clearly a drug you would use in a patient you can’t get off steroids and you’re having all the steroid toxicity. I don’t know that you’d use it right away.”
Osteoarthritis
Dr. Fleischmann predicted that tanezumab, a monoclonal antibody directed against nerve growth factor, will win FDA approval in 2021 for the treatment of osteoarthritis pain in patients with an inadequate response or intolerance to standard-of-care NSAIDs and opioids. But he cautioned his colleagues not to expect too much from the biologic, which has a long and checkered developmental history.
“It works better than placebo. It does not work better than an NSAID or an opioid. So it should be reasonable in patients who cannot take an NSAID or cannot or will not take an opioid,” he said.
There are safety issues to be aware of with tanezumab, he added: clinically significant increased risks of peripheral neuropathy and joint space narrowing.
Rheumatoid arthritis
Dr. Wells thought one of the most interesting novel therapies for RA in the past year didn’t involve a pharmaceutical, but rather noninvasive auricular branch stimulation of the vagus nerve. He cited an open-label, 12-week, uncontrolled study in 27 patients with active RA who wore an ear clip for vagal nerve stimulation for 12 weeks. The mean Disease Activity Score in 28 joints using C-reactive protein (DAS28-CRP) – the primary study endpoint – improved from 6.30 at baseline to 3.76 at week 12. The number of tender joints dropped from 12.17 to 4.7, while the swollen joint count went from 7.0 to 3.44. Pain scores improved from 75.23 to 43.3. Scores on the Health Assessment Questionnaire Disability Index improved from 1.59 to 1.05. There was no significant change in CRP. All in all, a modest clinical effect achieved noninvasively.
“The thing that did it for me was the effect on MRI from baseline: decreased synovitis, osteitis, and bone erosion scores,” Dr. Wells said. “This is noninvasive, so patients who want to do medical marijuana or CBD can put an earring on their auricular nerve.”
Dr. Fleischmann scoffed. “An open-label study, 27 patients? Let me see the real study,” he quipped.
Dr. Fleischmann reported receiving clinical trial research grants from and serving as a consultant to more than a dozen pharmaceutical companies. Dr. Wells serves as a consultant to MiCare Path.
FROM RWCS 2021
FDA authorizes first molecular at-home, OTC COVID-19 test
The U.S. Food and Drug Administration has granted emergency use authorization (EUA) for the Cue COVID-19 Test for Home and Over The Counter Use (Cue OTC Test, Cue Health).
The Cue OTC Test is the first molecular diagnostic test available to consumers without a prescription.
The test detects genetic material from SARS-CoV-2 present in the nostrils and delivers results in about 20 minutes to the user’s mobile smart device via the Cue Health app.
In testing, the Cue OTC Test correctly identified 96% of positive nasal swab samples from individuals known to have symptoms and correctly identified 100% of positive samples from individuals without symptoms.
The test is intended for use in people aged 2 years and older with and without symptoms.
“With this authorization, consumers can purchase and self-administer one of the easiest, fastest, and most accurate tests without a prescription,” Clint Sever, cofounder and chief product officer of Cue Health, said in a news release.
“This FDA authorization will help us improve patient outcomes with a solution that provides the accuracy of central lab tests, with the speed and accessibility required to address emergent global health issues,” he said.
Cue Health expects to produce more than 100,000 single-use test kits per day by this summer. Dena Cook, the company’s chief communications officer, told this news organization that the company hasn’t announced pricing information yet, but the price will be “comparable” to other price points and other products on the market.
“The FDA continues to prioritize the availability of more at-home testing options in response to the pandemic,” Jeff Shuren, MD, JD, director of the FDA’s Center for Devices and Radiological Health, said in a statement.
“Cue COVID-19 Test for Home and Over-the-Counter Use provides access to accurate and reliable testing at home, without a prescription. The FDA will continue to work collaboratively with test developers to advance effective testing options for doctors, clinicians, and the public,” he said.
In June, the FDA granted an EUA to Cue Health’s COVID-19 test for use in clinical and point-of-care settings.
The test is currently being used in hospitals, physicians’ offices, and dental clinics, as well as schools, essential businesses, nursing homes, and other congregate-care facilities. The test is also being distributed through a program led by the U.S. Department of Defense and the U.S. Department of Health & Human Services across several states.
A version of this article first appeared on Medscape.com.
Missed visits during pandemic cause ‘detrimental ripple effects’
according to a new report from the Urban Institute.
Among the adults who postponed or missed care, 32.6% said the gap worsened one or more health conditions or limited their ability to work or perform daily activities. The findings highlight “the detrimental ripple effects of delaying or forgoing care on overall health, functioning, and well-being,” researchers write.
The survey, conducted among 4,007 U.S. adults aged 18-64 in September 2020, found that adults with one or more chronic conditions were more likely than adults without chronic conditions to have delayed or missed care (40.7% vs. 26.4%). Adults with a mental health condition were particularly likely to have delayed or gone without care, write Dulce Gonzalez, MPP, a research associate in the Health Policy Center at the Urban Institute, and colleagues.
Doctors are already seeing the consequences of the missed visits, says Jacqueline W. Fincher, MD, president of the American College of Physicians.
Two of her patients with chronic conditions missed appointments last year. By the time they resumed care in 2021, their previsit lab tests showed significant kidney deterioration.
“Lo and behold, their kidneys were in failure. … One was in the hospital for 3 days and the other one was in for 5 days,” said Dr. Fincher, who practices general internal medicine in Georgia.
Dr. Fincher’s office has been proactive about calling patients with chronic diseases who missed follow-up visits or laboratory testing or who may have run out of medication, she said.
In her experience, delays mainly have been because of patients postponing visits. “We have stayed open the whole time now,” Dr. Fincher said. Her office offers telemedicine visits and in-person visits with safety precautions.
Still, some patients have decided to postpone care during the pandemic instead of asking their primary care doctor what they should do.
“We do know that chronic problems left without appropriate follow-up can create worse problems for them in terms of stroke, heart attack, and end organ damage,” Dr. Fincher said.
Lost lives
Future studies may help researchers understand the effects of delayed and missed care during the pandemic, said Russell S. Phillips, MD, director of the Center for Primary Care at Harvard Medical School, Boston.
“Although it is still early, and more data on patient outcomes will need to be collected, I anticipate that the ... delays in diagnosis, in cancer screening, and in management of chronic illness will result in lost lives and will emphasize the important role that primary care plays in saving lives,” Dr. Phillips said.
During the first several months of the pandemic, there were fewer diagnoses of hypertension, diabetes, and depression, Dr. Phillips said.
“In addition, and most importantly, the mortality rate for non-COVID conditions increased, suggesting that patients were not seeking care for symptoms of stroke or heart attack, which can be fatal if untreated,” he said. “We have also seen substantial decreases in cancer screening tests such as colonoscopy, and modeling studies suggest this will cost more lives based on delayed diagnoses of cancer.”
Vaccinating patients against COVID-19 may help primary care practices and patients get back on track, Dr. Phillips suggested.
In the meantime, some patients remain reluctant to come in. “Volumes are still lower than prepandemic, so it is challenging to overcome what is likely to be pent-up demand,” he told this news organization in an email. “Additionally, the continued burden of evaluating, testing, and monitoring patients with COVID or COVID-like symptoms makes it difficult to focus on chronic illness.”
Care most often skipped
The Urban Institute survey asked respondents about delays in prescription drugs, general doctor and specialist visits, going to a hospital, preventive health screenings or medical tests, treatment or follow-up care, dental care, mental health care or counseling, treatment or counseling for alcohol or drug use, and other types of medical care.
Dental care was the most common type of care that adults delayed or did not receive because of the pandemic (25.3%), followed by general doctor or specialist visits (20.6%) and preventive health screenings or medical tests (15.5%).
Black adults were more likely than White or Hispanic/Latinx adults to have delayed or forgone care (39.7% vs. 34.3% and 35.5%), the researchers found. Compared with adults with higher incomes, adults with lower incomes were more likely to have missed multiple types of care (26.6% vs. 20.3%).
The report by the Urban Institute researchers was supported by the Robert Wood Johnson Foundation. Dr. Phillips is an adviser to two telemedicine companies, Bicycle Health and Grow Health. Dr. Fincher has disclosed no relevant financial disclosures.
A version of this article first appeared on Medscape.com.
Postoperative Neurologic Deficits in a Veteran With Recent COVID-19
Anesthesia providers should be aware of COVID-19 sensitive stroke code practices and maintain heightened vigilance for the need to implement perioperative stroke mitigation strategies.
The risk of perioperative stroke in noncardiac, nonneurologic, nonvascular surgery ranges from 0.1 to 1.9% and is associated with increased mortality.1,2 Stroke mechanisms include both ischemia (large and small vessel occlusion, cardioembolism, anemic-tissue hypoxia, cerebral hypoperfusion) and hemorrhage.1 Risk factors for perioperative stroke include prior cerebral vascular accident (CVA), hypertension, aged > 62 years, acute renal insufficiency, dialysis, and recent myocardial infarction (MI).2
Introduction
COVID-19 was declared a pandemic by the World Health Organization in March 2020.3 COVID-19 has certainly affected the veteran population; between February and May 2020, more than 60,000 veterans were tested for COVID-19 with a positive rate of about 9%.4 While primarily affecting the respiratory system, there are increasing reports of COVID-19 neurologic manifestations: headache, hypogeusia, hyposomia, seizure, encephalitis, and acute stroke.5 In an early case series from Wuhan, China, 36% of 214 patients with COVID-19 reported neurologic complications, and acute CVAs were more common in patients with severe (compared to milder) viral disease presentations (5.7% vs 0.8%).6 Large vessel stroke was a presenting feature in another report of 5 patients aged < 50 years.7
The mechanism of ischemic stroke in the setting of COVID-19 is unclear.8 Indeed, stroke and COVID-19 share similar risk factors (eg, hypertension, diabetes mellitus [DM], older age), and immobile critically ill patients may already be prone to developing stroke.5,9 However, COVID-19 is associated with arterial and venous thromboembolism, elevated D-dimer and fibrinogen levels, and antiphospholipid antibody production. This prothrombotic state may be linked to cytokine-induced endothelial damage, mononuclear cell activation, tissue factor expression, and ultimately thrombin propagation and platelet activation.8
The rates of perioperative stroke may change as more patients with COVID-19 present for surgery, and the anesthesiology care team must prioritize mitigation efforts in high-risk patients, including veterans. Reducing the elevated stroke burden within the US Department of Veterans Affairs (VA) Veterans Health Administration (VHA) is a public health priority.10 We present the case of a veteran with prior CVA and recent positive COVID-19 testing who experienced transient weakness and dysarthria following plastic surgery. The patient discussed provided written Health Insurance Portability and Accountability Act consent for publication of this report.
Case Presentation
A 75-year-old male veteran presented to the Minneapolis VA Medical Center in Minnesota with chronic left foot ulceration necessitating debridement and flap coverage. His medical history was significant for hypertension, type 2 DM, anemia of chronic disease, and coronary artery disease (left ventricular ejection fraction, 50%). Additionally, he had prior ischemic strokes in the oculomotor nucleus (in 2004 with internuclear ophthalmoplegia) and left ventral medulla (in 2019 with right hemiparesis). During his 2019 poststroke rehabilitation, he was diagnosed with mild neurocognitive deficit not attributable to his strokes. The patient’s medications included amlodipine, lisinopril, atorvastatin, clopidogrel (lifelong for secondary stroke prevention), metformin, and glipizide. The debridement procedure was initially delayed 3 weeks due to positive routine preoperative COVID-19 nasopharyngeal testing, though he reported no respiratory symptoms or fever. During the delay, the primary team prescribed daily oral rivaroxaban for thrombosis prophylaxis in addition to clopidogrel. One week prior to surgery, his repeat COVID-19 test was negative and prophylactic anticoagulation stopped.
On the day of surgery, the patient was hemodynamically stable: heart rate 86 beats/min, blood pressure 167/93 mm Hg (baseline 120-150 mm Hg systolic pressure), respiratory rate 16 breaths/min, oxygen saturation 99% without supplemental oxygen, temperature 97.1 °F. He received amlodipine and clopidogrel, but not lisinopril, that morning. No focal neurologic deficits were appreciated on preoperative examination, and resolution of symptoms related to the 2 prior MIs was confirmed. Preoperative glucose was 163 mg/dL. Femoral and sciatic peripheral nerve blocks were done for postoperative analgesia. A preinduction arterial line was placed and 2 mg of midazolam was administered for anxiolysis. Induction of general anesthesia with oral endotracheal intubation proceeded uneventfully; he was positioned prone.
Given his stroke risk factors, mean arterial pressure was maintained > 70 mm Hg for the duration of surgery. No vasoactive infusions were necessary and no β-blocking agents were administered. Insulin infusion was required; the maximum-recorded glucose was 219 mg/dL. Arterial blood gas samples were routinely drawn; acid-base balance was well maintained, PaO2 was > 185 mm Hg, and PaCO2 ranged from 29.4 to 38.5 mm Hg. The patient received 2 units of packed red blood cells for nadir hemoglobin of 7.5 mg/dL. At surgery end, we fully reversed neuromuscular blockade with suggamadex. The patient was returned to a supine position and extubated uneventfully after demonstrating the ability to follow commands.
During postanesthesia care unit (PACU) handoff, the patient exhibited acute speech impairment. He was able to state his name on repetition but seemed confused and sedated. Prompt formal neurology evaluation (stroke code) was sought. Initial National Institutes of Health (NIH) stroke scale score was 8 (1 for level of consciousness, 1 for minor right facial droop, 1 for right arm drift, 3 for right leg with no effort against gravity, 1 for right partial sensory loss, and 1 for mild dysarthria). The patient was oriented only to self. Other findings included mild right facial droop and dysarthria. On a 5-point strength scale, he scored 4 for the right deltoid, biceps, triceps, wrist extensors, right knee flexion, right dorsiflexion, and plantarflexion, 2 for right hip flexion, and ≥ 4 for right knee extension. Positive sensory findings were notable for decreased pin prick sensation on the right limbs.
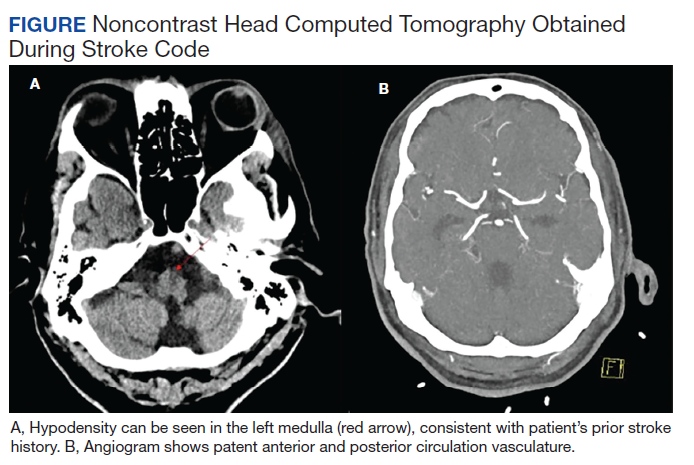
We obtained emergent head computed tomography (CT) that was negative for acute abnormalities; CT angiography was negative for large vessel occlusion or clinically significant stenosis (Figure). On returning to the PACU from the CT scanner, the patient regained symmetric strength in both arms, right leg was antigravity, and his speech had normalized. Prior to PACU discharge 2 hours later, the patient was back to his prehospitalization neurologic function and NIH stroke scale was 0. Given this rapid clinical resolution, no acute stroke interventions were done, though permissive hypertension was recommended by the neurologist during PACU recovery.
The neurology team concluded that the patient’s symptoms were likely secondary to recrudescence of previous stroke symptoms in the setting of brief postoperative delirium (POD). However, we could not exclude transient ischemic attack or new cardioembolism, therefore patient was started on dual antiplatelet therapy for 3 weeks. Unfortunately, elective confirmatory magnetic resonance imaging (MRI) was not sought to confirm new ischemic changes due hospital COVID-19 restrictions on nonessential scanning. Neurology did not recommend carotid duplex ultrasound given patent vasculature on the head and neck CT angiography. Finally, the patient had undergone surface echocardiography 3 weeks prior to surgery that showed a left ventricular ejection fraction of 50% without significant valvular abnormalities, thrombus, or interatrial shunting, so repeated study was deferred.
Formal neurology consultation did not extend beyond postoperative day 1. One month after surgery, the anesthesiology team visited the patient during inpatient rehabilitation; he had not developed further focal neurologic symptoms or delirium. His strength was equal bilaterally and no speech deficits were noted. Unfortunately, the patient was readmitted to the hospital for continued foot wound drainage 2 months postoperatively, though no focal neurologic deficits were documented on his medical admission history and physical. No long term sequalae of his COVID-19 infection have been suspected.
Discussion
We report a veteran with prior stroke and COVID-19 who experienced postoperative speech and motor deficit despite deliberate risk factor mitigation. This case calls for increased vigilance by anesthesia providers to employ proper perioperative stroke management and anticoagulation strategies, and to be prepared for prompt intervention with COVID-19-sensitive practices should the need for advanced airway management or thrombectomy arises.
The exact etiology of the postoperative neurologic deficit in our patient is unknown. The most likely possibility is that this represents poststroke recrudescence (PSR), knowing he had a previous left medullary infarct that presented similarly.11 PSR is a phenomenon in which prior stroke symptoms recur acutely and transiently in the setting of physiologic stressors—also known as locus minoris resistantiae.12 Triggers include γ aminobutyric acid (GABA) mediating anesthetic agents such as midazolam, opioids (eg, fentanyl or hydromorphone), infection, or relative cerebral hypoperfusion.11,13,14 The focality of our patient’s presentation favors PSR in the context of brief POD; of note, these entities share similar risk factors.15 Our patient did indeed receive low-dose preoperative midazolam in the context of mild preoperative neurocognitive deficit, which may have predisposed him to POD.
Though less likely, our patient’s presentation could have been explained by a new cerebrovascular event—transient ischemic attack vs new MI. Speech and right-sided motor/sensory deficits can localize to the left middle cerebral artery or small penetrating arteries of the left brainstem or deep white matter. MRI was not performed to exclude this possibility due to hospital-wide COVID-19 precautions minimizing nonessential MRIs unlikely to change clinical management. We speculate, however, that due to recent SARS-CoV-2 infection, our patient may have been at higher risk for cerebrovascular events due to subclinical endothelial damage and/or microclot in predisposed neurovasculature. Though our patient had interval COVID-19 negative tests, the timeframe of coronavirus procoagulant effects is unknown.16
There are well-established guidelines for perioperative stroke management published by the Society for Neuroscience in Anesthesiology and Critical Care (SNACC).17 This case exemplifies many recommendations including tight hemodynamic and glucose control, optimized oxygen delivery, avoidance of intraoperative β blockade, and prompt neurologic consultation. Additionally, special precaution was taken to ensure continuation of antiplatelet therapy on the day of surgery; in light of COVID-19 prothrombosis risk we considered this essential. Low-dose enoxaparin was also instituted on postoperative day 1. Prophylactic anticoagulation with low molecular weight heparin (LMWH) is recommended for hospitalized COVID-19–positive patients, though perioperatively, this must be weighed against hemorrhagic stroke transformation and surgical bleeding.8,16 Interestingly, the benefit of LMWH may partly relate to its anti-inflammatory effects, of which higher levels are observed in COVID-19.16,18
Though substantial health care provider energy and hospital resource utilization is presently focused on controlling the COVID-19 pandemic, the importance of appropriate stroke code processes must not be neglected. Recently, SNACC released anesthetic guidelines for endovascular ischemic stroke management that reflect COVID-19 precautions; highlights include personal protective equipment (PPE) utilization, risk-benefit analysis of general anesthesia (with early decision to intubate) vs sedation techniques for thrombectomy, and airway management strategies to minimize aerosolization exposure.19 Finally, negative pressure rooms relative to PACU and operating room locations need to be known and marked, as well as the necessary airway equipment and PPE to transfer patients safely to and from angiography suites.
Conclusions
We discuss a surgical patient with prior SARS-CoV-2 infection at elevated stroke risk that experienced recurrence of neurologic deficits postoperatively. This case informs anesthesia providers of the broad differential diagnosis for focal neurological deficits to include PSR and the possible contribution of COVID-19 to elevated acute stroke risk. Perioperative physicians, including VHA practitioners, with knowledge of current COVID-19 practices are primed to coordinate multidisciplinary efforts during stroke codes and ensuring appropriate anticoagulation.
Acknowledgments
The authors would like to thank perioperative care teams across the world caring for COVID-19 patients safely.
1. Vlisides P, Mashour GA. Perioperative stroke. Can J Anaesth. 2016;63(2):193-204. doi:10.1007/s12630-015-0494-9
2. Mashour GA, Shanks AM, Kheterpal S. Perioperative stroke and associated mortality after noncardiac, nonneurologic surgery. Anesthesiology. 2011;114(6):1289-1296. doi:10.1097/ALN.0b013e318216e7f4
3. Cucinotta D, Vanelli M. WHO Declares COVID-19 a Pandemic. Acta Biomed. 2020;91(1):157-160. Published 2020 Mar 19. doi:10.23750/abm.v91i1.9397
4. Rentsch CT, Kidwai-Khan F, Tate JP, et al. Covid-19 by Race and Ethnicity: A National Cohort Study of 6 Million United States Veterans. Preprint. medRxiv. 2020;2020.05.12.20099135. Published 2020 May 18. doi:10.1101/2020.05.12.20099135
5. Montalvan V, Lee J, Bueso T, De Toledo J, Rivas K. Neurological manifestations of COVID-19 and other coronavirus infections: A systematic review. Clin Neurol Neurosurg. 2020;194:105921. doi:10.1016/j.clineuro.2020.105921
6. Mao L, Jin H, Wang M, et al. Neurologic Manifestations of Hospitalized Patients With Coronavirus Disease 2019 in Wuhan, China. JAMA Neurol. 2020;77(6):683-690. doi:10.1001/jamaneurol.2020.1127
7. Oxley TJ, Mocco J, Majidi S, et al. Large-Vessel Stroke as a Presenting Feature of Covid-19 in the Young. N Engl J Med. 2020;382(20):e60. doi:10.1056/NEJMc2009787
8. Beyrouti R, Adams ME, Benjamin L, et al. Characteristics of ischaemic stroke associated with COVID-19. J Neurol Neurosurg Psychiatry. 2020;91(8):889-891. doi:10.1136/jnnp-2020-323586
9. Needham EJ, Chou SH, Coles AJ, Menon DK. Neurological Implications of COVID-19 Infections. Neurocrit Care. 2020;32(3):667-671. doi:10.1007/s12028-020-00978-4
10. Lich KH, Tian Y, Beadles CA, et al. Strategic planning to reduce the burden of stroke among veterans: using simulation modeling to inform decision making. Stroke. 2014;45(7):2078-2084. doi:10.1161/STROKEAHA.114.004694
11. Topcuoglu MA, Saka E, Silverman SB, Schwamm LH, Singhal AB. Recrudescence of Deficits After Stroke: Clinical and Imaging Phenotype, Triggers, and Risk Factors. JAMA Neurol. 2017;74(9):1048-1055. doi:10.1001/jamaneurol.2017.1668
12. Jun-O’connell AH, Henninger N, Moonis M, Silver B, Ionete C, Goddeau RP. Recrudescence of old stroke deficits among transient neurological attacks. Neurohospitalist. 2019;9(4):183-189. doi:10.1177/194187441982928813. Karnik HS, Jain RA. Anesthesia for patients with prior stroke. J Neuroanaesthesiology Crit Care. 2018;5(3):150-157. doi:10.1055/s-0038-1673549
14. Minhas JS, Rook W, Panerai RB, et al. Pathophysiological and clinical considerations in the perioperative care of patients with a previous ischaemic stroke: a multidisciplinary narrative review. Br J Anaesth. 2020;124(2):183-196. doi:10.1016/j.bja.2019.10.021
15. Aldecoa C, Bettelli G, Bilotta F, et al. European Society of Anaesthesiology evidence-based and consensus-based guideline on postoperative delirium [published correction appears in Eur J Anaesthesiol. 2018 Sep;35(9):718-719]. Eur J Anaesthesiol. 2017;34(4):192-214. doi:10.1097/EJA.0000000000000594
16. Thachil J, Tang N, Gando S, et al. ISTH interim guidance on recognition and management of coagulopathy in COVID-19. J Thromb Haemost. 2020;18(5):1023-1026. doi:10.1111/jth.14810
17. Mashour GA, Moore LE, Lele AV, Robicsek SA, Gelb AW. Perioperative care of patients at high risk for stroke during or after non-cardiac, non-neurologic surgery: consensus statement from the Society for Neuroscience in Anesthesiology and Critical Care*. J Neurosurg Anesthesiol. 2014;26(4):273-285. doi:10.1097/ana.0000000000000087
18. Ghannam M, Alshaer Q, Al-Chalabi M, Zakarna L, Robertson J, Manousakis G. Neurological involvement of coronavirus disease 2019: a systematic review. J Neurol. 2020;267(11):3135-3153. doi:10.1007/s00415-020-09990-2
19. Sharma D, Rasmussen M, Han R, et al. Anesthetic Management of Endovascular Treatment of Acute Ischemic Stroke During COVID-19 Pandemic: Consensus Statement From Society for Neuroscience in Anesthesiology & Critical Care (SNACC): Endorsed by Society of Vascular & Interventional Neurology (SVIN), Society of NeuroInterventional Surgery (SNIS), Neurocritical Care Society (NCS), European Society of Minimally Invasive Neurological Therapy (ESMINT) and American Association of Neurological Surgeons (AANS) and Congress of Neurological Surgeons (CNS) Cerebrovascular Section. J Neurosurg Anesthesiol. 2020;32(3):193-201. doi:10.1097/ANA.0000000000000688
Anesthesia providers should be aware of COVID-19 sensitive stroke code practices and maintain heightened vigilance for the need to implement perioperative stroke mitigation strategies.
Anesthesia providers should be aware of COVID-19 sensitive stroke code practices and maintain heightened vigilance for the need to implement perioperative stroke mitigation strategies.
The risk of perioperative stroke in noncardiac, nonneurologic, nonvascular surgery ranges from 0.1 to 1.9% and is associated with increased mortality.1,2 Stroke mechanisms include both ischemia (large and small vessel occlusion, cardioembolism, anemic-tissue hypoxia, cerebral hypoperfusion) and hemorrhage.1 Risk factors for perioperative stroke include prior cerebral vascular accident (CVA), hypertension, aged > 62 years, acute renal insufficiency, dialysis, and recent myocardial infarction (MI).2
Introduction
COVID-19 was declared a pandemic by the World Health Organization in March 2020.3 COVID-19 has certainly affected the veteran population; between February and May 2020, more than 60,000 veterans were tested for COVID-19 with a positive rate of about 9%.4 While primarily affecting the respiratory system, there are increasing reports of COVID-19 neurologic manifestations: headache, hypogeusia, hyposomia, seizure, encephalitis, and acute stroke.5 In an early case series from Wuhan, China, 36% of 214 patients with COVID-19 reported neurologic complications, and acute CVAs were more common in patients with severe (compared to milder) viral disease presentations (5.7% vs 0.8%).6 Large vessel stroke was a presenting feature in another report of 5 patients aged < 50 years.7
The mechanism of ischemic stroke in the setting of COVID-19 is unclear.8 Indeed, stroke and COVID-19 share similar risk factors (eg, hypertension, diabetes mellitus [DM], older age), and immobile critically ill patients may already be prone to developing stroke.5,9 However, COVID-19 is associated with arterial and venous thromboembolism, elevated D-dimer and fibrinogen levels, and antiphospholipid antibody production. This prothrombotic state may be linked to cytokine-induced endothelial damage, mononuclear cell activation, tissue factor expression, and ultimately thrombin propagation and platelet activation.8
The rates of perioperative stroke may change as more patients with COVID-19 present for surgery, and the anesthesiology care team must prioritize mitigation efforts in high-risk patients, including veterans. Reducing the elevated stroke burden within the US Department of Veterans Affairs (VA) Veterans Health Administration (VHA) is a public health priority.10 We present the case of a veteran with prior CVA and recent positive COVID-19 testing who experienced transient weakness and dysarthria following plastic surgery. The patient discussed provided written Health Insurance Portability and Accountability Act consent for publication of this report.
Case Presentation
A 75-year-old male veteran presented to the Minneapolis VA Medical Center in Minnesota with chronic left foot ulceration necessitating debridement and flap coverage. His medical history was significant for hypertension, type 2 DM, anemia of chronic disease, and coronary artery disease (left ventricular ejection fraction, 50%). Additionally, he had prior ischemic strokes in the oculomotor nucleus (in 2004 with internuclear ophthalmoplegia) and left ventral medulla (in 2019 with right hemiparesis). During his 2019 poststroke rehabilitation, he was diagnosed with mild neurocognitive deficit not attributable to his strokes. The patient’s medications included amlodipine, lisinopril, atorvastatin, clopidogrel (lifelong for secondary stroke prevention), metformin, and glipizide. The debridement procedure was initially delayed 3 weeks due to positive routine preoperative COVID-19 nasopharyngeal testing, though he reported no respiratory symptoms or fever. During the delay, the primary team prescribed daily oral rivaroxaban for thrombosis prophylaxis in addition to clopidogrel. One week prior to surgery, his repeat COVID-19 test was negative and prophylactic anticoagulation stopped.
On the day of surgery, the patient was hemodynamically stable: heart rate 86 beats/min, blood pressure 167/93 mm Hg (baseline 120-150 mm Hg systolic pressure), respiratory rate 16 breaths/min, oxygen saturation 99% without supplemental oxygen, temperature 97.1 °F. He received amlodipine and clopidogrel, but not lisinopril, that morning. No focal neurologic deficits were appreciated on preoperative examination, and resolution of symptoms related to the 2 prior MIs was confirmed. Preoperative glucose was 163 mg/dL. Femoral and sciatic peripheral nerve blocks were done for postoperative analgesia. A preinduction arterial line was placed and 2 mg of midazolam was administered for anxiolysis. Induction of general anesthesia with oral endotracheal intubation proceeded uneventfully; he was positioned prone.
Given his stroke risk factors, mean arterial pressure was maintained > 70 mm Hg for the duration of surgery. No vasoactive infusions were necessary and no β-blocking agents were administered. Insulin infusion was required; the maximum-recorded glucose was 219 mg/dL. Arterial blood gas samples were routinely drawn; acid-base balance was well maintained, PaO2 was > 185 mm Hg, and PaCO2 ranged from 29.4 to 38.5 mm Hg. The patient received 2 units of packed red blood cells for nadir hemoglobin of 7.5 mg/dL. At surgery end, we fully reversed neuromuscular blockade with suggamadex. The patient was returned to a supine position and extubated uneventfully after demonstrating the ability to follow commands.
During postanesthesia care unit (PACU) handoff, the patient exhibited acute speech impairment. He was able to state his name on repetition but seemed confused and sedated. Prompt formal neurology evaluation (stroke code) was sought. Initial National Institutes of Health (NIH) stroke scale score was 8 (1 for level of consciousness, 1 for minor right facial droop, 1 for right arm drift, 3 for right leg with no effort against gravity, 1 for right partial sensory loss, and 1 for mild dysarthria). The patient was oriented only to self. Other findings included mild right facial droop and dysarthria. On a 5-point strength scale, he scored 4 for the right deltoid, biceps, triceps, wrist extensors, right knee flexion, right dorsiflexion, and plantarflexion, 2 for right hip flexion, and ≥ 4 for right knee extension. Positive sensory findings were notable for decreased pin prick sensation on the right limbs.
We obtained emergent head computed tomography (CT) that was negative for acute abnormalities; CT angiography was negative for large vessel occlusion or clinically significant stenosis (Figure). On returning to the PACU from the CT scanner, the patient regained symmetric strength in both arms, right leg was antigravity, and his speech had normalized. Prior to PACU discharge 2 hours later, the patient was back to his prehospitalization neurologic function and NIH stroke scale was 0. Given this rapid clinical resolution, no acute stroke interventions were done, though permissive hypertension was recommended by the neurologist during PACU recovery.
The neurology team concluded that the patient’s symptoms were likely secondary to recrudescence of previous stroke symptoms in the setting of brief postoperative delirium (POD). However, we could not exclude transient ischemic attack or new cardioembolism, therefore patient was started on dual antiplatelet therapy for 3 weeks. Unfortunately, elective confirmatory magnetic resonance imaging (MRI) was not sought to confirm new ischemic changes due hospital COVID-19 restrictions on nonessential scanning. Neurology did not recommend carotid duplex ultrasound given patent vasculature on the head and neck CT angiography. Finally, the patient had undergone surface echocardiography 3 weeks prior to surgery that showed a left ventricular ejection fraction of 50% without significant valvular abnormalities, thrombus, or interatrial shunting, so repeated study was deferred.
Formal neurology consultation did not extend beyond postoperative day 1. One month after surgery, the anesthesiology team visited the patient during inpatient rehabilitation; he had not developed further focal neurologic symptoms or delirium. His strength was equal bilaterally and no speech deficits were noted. Unfortunately, the patient was readmitted to the hospital for continued foot wound drainage 2 months postoperatively, though no focal neurologic deficits were documented on his medical admission history and physical. No long term sequalae of his COVID-19 infection have been suspected.
Discussion
We report a veteran with prior stroke and COVID-19 who experienced postoperative speech and motor deficit despite deliberate risk factor mitigation. This case calls for increased vigilance by anesthesia providers to employ proper perioperative stroke management and anticoagulation strategies, and to be prepared for prompt intervention with COVID-19-sensitive practices should the need for advanced airway management or thrombectomy arises.
The exact etiology of the postoperative neurologic deficit in our patient is unknown. The most likely possibility is that this represents poststroke recrudescence (PSR), knowing he had a previous left medullary infarct that presented similarly.11 PSR is a phenomenon in which prior stroke symptoms recur acutely and transiently in the setting of physiologic stressors—also known as locus minoris resistantiae.12 Triggers include γ aminobutyric acid (GABA) mediating anesthetic agents such as midazolam, opioids (eg, fentanyl or hydromorphone), infection, or relative cerebral hypoperfusion.11,13,14 The focality of our patient’s presentation favors PSR in the context of brief POD; of note, these entities share similar risk factors.15 Our patient did indeed receive low-dose preoperative midazolam in the context of mild preoperative neurocognitive deficit, which may have predisposed him to POD.
Though less likely, our patient’s presentation could have been explained by a new cerebrovascular event—transient ischemic attack vs new MI. Speech and right-sided motor/sensory deficits can localize to the left middle cerebral artery or small penetrating arteries of the left brainstem or deep white matter. MRI was not performed to exclude this possibility due to hospital-wide COVID-19 precautions minimizing nonessential MRIs unlikely to change clinical management. We speculate, however, that due to recent SARS-CoV-2 infection, our patient may have been at higher risk for cerebrovascular events due to subclinical endothelial damage and/or microclot in predisposed neurovasculature. Though our patient had interval COVID-19 negative tests, the timeframe of coronavirus procoagulant effects is unknown.16
There are well-established guidelines for perioperative stroke management published by the Society for Neuroscience in Anesthesiology and Critical Care (SNACC).17 This case exemplifies many recommendations including tight hemodynamic and glucose control, optimized oxygen delivery, avoidance of intraoperative β blockade, and prompt neurologic consultation. Additionally, special precaution was taken to ensure continuation of antiplatelet therapy on the day of surgery; in light of COVID-19 prothrombosis risk we considered this essential. Low-dose enoxaparin was also instituted on postoperative day 1. Prophylactic anticoagulation with low molecular weight heparin (LMWH) is recommended for hospitalized COVID-19–positive patients, though perioperatively, this must be weighed against hemorrhagic stroke transformation and surgical bleeding.8,16 Interestingly, the benefit of LMWH may partly relate to its anti-inflammatory effects, of which higher levels are observed in COVID-19.16,18
Though substantial health care provider energy and hospital resource utilization is presently focused on controlling the COVID-19 pandemic, the importance of appropriate stroke code processes must not be neglected. Recently, SNACC released anesthetic guidelines for endovascular ischemic stroke management that reflect COVID-19 precautions; highlights include personal protective equipment (PPE) utilization, risk-benefit analysis of general anesthesia (with early decision to intubate) vs sedation techniques for thrombectomy, and airway management strategies to minimize aerosolization exposure.19 Finally, negative pressure rooms relative to PACU and operating room locations need to be known and marked, as well as the necessary airway equipment and PPE to transfer patients safely to and from angiography suites.
Conclusions
We discuss a surgical patient with prior SARS-CoV-2 infection at elevated stroke risk that experienced recurrence of neurologic deficits postoperatively. This case informs anesthesia providers of the broad differential diagnosis for focal neurological deficits to include PSR and the possible contribution of COVID-19 to elevated acute stroke risk. Perioperative physicians, including VHA practitioners, with knowledge of current COVID-19 practices are primed to coordinate multidisciplinary efforts during stroke codes and ensuring appropriate anticoagulation.
Acknowledgments
The authors would like to thank perioperative care teams across the world caring for COVID-19 patients safely.
1. Vlisides P, Mashour GA. Perioperative stroke. Can J Anaesth. 2016;63(2):193-204. doi:10.1007/s12630-015-0494-9
2. Mashour GA, Shanks AM, Kheterpal S. Perioperative stroke and associated mortality after noncardiac, nonneurologic surgery. Anesthesiology. 2011;114(6):1289-1296. doi:10.1097/ALN.0b013e318216e7f4
3. Cucinotta D, Vanelli M. WHO Declares COVID-19 a Pandemic. Acta Biomed. 2020;91(1):157-160. Published 2020 Mar 19. doi:10.23750/abm.v91i1.9397
4. Rentsch CT, Kidwai-Khan F, Tate JP, et al. Covid-19 by Race and Ethnicity: A National Cohort Study of 6 Million United States Veterans. Preprint. medRxiv. 2020;2020.05.12.20099135. Published 2020 May 18. doi:10.1101/2020.05.12.20099135
5. Montalvan V, Lee J, Bueso T, De Toledo J, Rivas K. Neurological manifestations of COVID-19 and other coronavirus infections: A systematic review. Clin Neurol Neurosurg. 2020;194:105921. doi:10.1016/j.clineuro.2020.105921
6. Mao L, Jin H, Wang M, et al. Neurologic Manifestations of Hospitalized Patients With Coronavirus Disease 2019 in Wuhan, China. JAMA Neurol. 2020;77(6):683-690. doi:10.1001/jamaneurol.2020.1127
7. Oxley TJ, Mocco J, Majidi S, et al. Large-Vessel Stroke as a Presenting Feature of Covid-19 in the Young. N Engl J Med. 2020;382(20):e60. doi:10.1056/NEJMc2009787
8. Beyrouti R, Adams ME, Benjamin L, et al. Characteristics of ischaemic stroke associated with COVID-19. J Neurol Neurosurg Psychiatry. 2020;91(8):889-891. doi:10.1136/jnnp-2020-323586
9. Needham EJ, Chou SH, Coles AJ, Menon DK. Neurological Implications of COVID-19 Infections. Neurocrit Care. 2020;32(3):667-671. doi:10.1007/s12028-020-00978-4
10. Lich KH, Tian Y, Beadles CA, et al. Strategic planning to reduce the burden of stroke among veterans: using simulation modeling to inform decision making. Stroke. 2014;45(7):2078-2084. doi:10.1161/STROKEAHA.114.004694
11. Topcuoglu MA, Saka E, Silverman SB, Schwamm LH, Singhal AB. Recrudescence of Deficits After Stroke: Clinical and Imaging Phenotype, Triggers, and Risk Factors. JAMA Neurol. 2017;74(9):1048-1055. doi:10.1001/jamaneurol.2017.1668
12. Jun-O’connell AH, Henninger N, Moonis M, Silver B, Ionete C, Goddeau RP. Recrudescence of old stroke deficits among transient neurological attacks. Neurohospitalist. 2019;9(4):183-189. doi:10.1177/194187441982928813. Karnik HS, Jain RA. Anesthesia for patients with prior stroke. J Neuroanaesthesiology Crit Care. 2018;5(3):150-157. doi:10.1055/s-0038-1673549
14. Minhas JS, Rook W, Panerai RB, et al. Pathophysiological and clinical considerations in the perioperative care of patients with a previous ischaemic stroke: a multidisciplinary narrative review. Br J Anaesth. 2020;124(2):183-196. doi:10.1016/j.bja.2019.10.021
15. Aldecoa C, Bettelli G, Bilotta F, et al. European Society of Anaesthesiology evidence-based and consensus-based guideline on postoperative delirium [published correction appears in Eur J Anaesthesiol. 2018 Sep;35(9):718-719]. Eur J Anaesthesiol. 2017;34(4):192-214. doi:10.1097/EJA.0000000000000594
16. Thachil J, Tang N, Gando S, et al. ISTH interim guidance on recognition and management of coagulopathy in COVID-19. J Thromb Haemost. 2020;18(5):1023-1026. doi:10.1111/jth.14810
17. Mashour GA, Moore LE, Lele AV, Robicsek SA, Gelb AW. Perioperative care of patients at high risk for stroke during or after non-cardiac, non-neurologic surgery: consensus statement from the Society for Neuroscience in Anesthesiology and Critical Care*. J Neurosurg Anesthesiol. 2014;26(4):273-285. doi:10.1097/ana.0000000000000087
18. Ghannam M, Alshaer Q, Al-Chalabi M, Zakarna L, Robertson J, Manousakis G. Neurological involvement of coronavirus disease 2019: a systematic review. J Neurol. 2020;267(11):3135-3153. doi:10.1007/s00415-020-09990-2
19. Sharma D, Rasmussen M, Han R, et al. Anesthetic Management of Endovascular Treatment of Acute Ischemic Stroke During COVID-19 Pandemic: Consensus Statement From Society for Neuroscience in Anesthesiology & Critical Care (SNACC): Endorsed by Society of Vascular & Interventional Neurology (SVIN), Society of NeuroInterventional Surgery (SNIS), Neurocritical Care Society (NCS), European Society of Minimally Invasive Neurological Therapy (ESMINT) and American Association of Neurological Surgeons (AANS) and Congress of Neurological Surgeons (CNS) Cerebrovascular Section. J Neurosurg Anesthesiol. 2020;32(3):193-201. doi:10.1097/ANA.0000000000000688
Amputation Care Quality and Satisfaction With Prosthetic Limb Services: A Longitudinal Study of Veterans With Upper Limb Amputation
Veterans with upper limb amputation (ULA) are a small, but important population, who have received more attention in the past decade due to the increased growth of the population of veterans with conflict-related amputation from recent military engagements. Among the 808 veterans with ULA receiving any care in the US Department of Veterans Affairs (VA) from 2010 to 2015 who participated in our national study, an estimated 28 to 35% had a conflict-related amputation.1 The care of these individuals with ULA is highly specialized, and there is a recognized shortage of experienced professionals in this area.2,3 The provision of high-quality prosthetic care is increasingly complex with advances in technology, such as externally powered devices with multiple functions.
The VA is a comprehensive, integrated health care system that serves more than 8.9 million veterans each year. Interdisciplinary amputation care is provided within the VA through a traditional clinic setting or by using one of several currently available virtual care modalities.4,5 In consultation with the veteran, VA health care providers (HCPs) prescribe prostheses and services based on the clinical needs and furnish authorized items and services to eligible veterans. Prescribed items and/or services are furnished either by internal VA resources or through a community-based prosthetist who is an authorized vendor or contractor. Although several studies have reported that the majority of veterans with ULA utilize VA services for at least some aspects of their health care, little is known about: (1) prosthetic limb care satisfaction or the quality of care that veterans receive; or (2) how care within the VA or Department of Defense (DoD) compares with care provided in the civilian sector.6-8
Earlier studies that examined the amputation rehabilitation services received by veterans with ULA pointed to quality gaps in care and differences in satisfaction in the VA and DoD when compared with the civilian sector but were limited in their scope and methodology.7,8 A 2008 study of veterans of the Vietnam War, Operation Iraqi Freedom (OIF), and Operation Enduring Freedom (OEF) compared satisfaction by location of care receipt (DoD only, VA only, private only, and multiple sources). That study dichotomized response categories for items related to satisfaction with care (satisfied/not), but did not estimate degree of satisfaction, calculate summary scores of the items, or utilize validated care satisfaction metrics. That study found that a greater proportion of Vietnam War veterans (compared with OIF/OEF veterans receiving care in the private sector) agreed that they “had a role in choosing prosthesis” and disagreed that they wanted to change their current prosthesis to another type.7 The assumption made by the authors is that much of this private sector care was actually VA-sponsored care prescribed and procured by the VA but delivered in the community. However, no data were collected to confirm or refute this assumption, and it is possible that some care was both VA sponsored and delivered, some was VA sponsored but commercially delivered, and in some cases, care was sponsored by other sources and delivered in still other facilities.
A 2012 VA Office of the Inspector General study of OIF, OEF, and Operation New Dawn (OND) veterans reported lower prosthetic satisfaction for veterans with upper limb when compared with lower limb amputation and described respondents concerns about lack of VA prosthetic expertise, difficulty with accessing VA services, and dissatisfaction with the sometimes lengthy approval process for obtaining fee-basis or VA contract care.8 Although this report suggested that there were quality gaps and areas for improvement, it did not employ validated metrics of prosthesis or care satisfaction and instead relied on qualitative data collected through telephone interviews.
Given the VA effort to enhance the quality and consistency of its amputation care services through the formal establishment of the Amputation System of Care, which began in 2008, further evaluation of care satisfaction and quality of care is warranted. In 2014 the VA and DoD released the first evidence-based clinical practice guidelines (CPGs) for the rehabilitation of persons with ULA.2 The CPG describes care paths to improve outcomes and basic tenets of amputation rehabilitation care and can be used to identify process activities that are essential aspects of quality care. However, the extent to which the CPG has impacted the quality and timeliness of care for veterans with ULA are presently unclear.
Thus, the purposes of this study were to: (1) measure veteran satisfaction with prosthetic limb care and identify factors associated with service satisfaction; (2) assess quality indicators that potentially reflect CPG) adoption; (3) compare care satisfaction and quality for those who received care in or outside of the VA or DoD; and (4) evaluate change in satisfaction over time.
Methods
The study was approved by the VA Central Institutional Review Board (IRB) (Study #16-20) and Human Research Protection Office, U.S. Army Medical Research and Development Command. The sampling frame consisted of veterans with major ULA who received care in the VA between 2010 and 2015 identified in VA Corporate Data Warehouse. We sent recruitment packages to nondeceased veterans who had current addresses and phone numbers. Those who did not opt out or inform us that they did not meet eligibility criteria were contacted by study interviewers. A waiver of documentation of written informed consent was obtained from the VA Central IRB. When reached by the study interviewer, Veterans provided oral informed consent. At baseline, 808 veterans were interviewed for a response rate of 47.7% as calculated by the American Association for Public Opinion Research (AAPOR) methodology.9 Follow-up interviews approximately 1 year later (mean [SD] 367 [16.8] days), were conducted with 585 respondents for a 72.4% response rate (Figure).
Survey Content
Development and pilot testing of the survey instrument previously was reported.1 The content of the survey drew from existing survey items and metrics, and included new items specifically designed to address patterns of amputation care, based on care goals within the CPG. All new and modified items were tested and refined through cognitive interviews with 10 participants, and tested with an additional 13 participants.
The survey collected data on demographics, amputation characteristics (year of amputation, level, laterality, and etiology), current prosthesis use, and type of prosthesis. This article focused on the sections of the survey pertaining to satisfaction with prosthetic care and indicators of quality of care. A description of the content of the full survey and a synopsis of overall findings are reported in a prior publication.1 The key independent, dependent, and other variables utilized in the analyses reported in this manuscript are described below.
Primary Independent Variables
In the follow-up survey, we asked respondents whether they had any amputation care in the prior 12 months, and if so to indicate where they had gone for care. We categorized respondents as having received VA/DoD care if they reported any care at the VA or DoD, and as having received non-VA/DoD care if they did not report care at the VA or DoD but indicated that they had received amputation care between baseline and follow-up.
Two primary outcomes were utilized; the Orthotics and Prosthetics User’s Survey (OPUS), client satisfaction with services scale (CSS), and a measure of care quality specifically developed for this study. The CSS is a measure developed specifically for orthotic and prosthesis users.10 This 11-item scale measures satisfaction with prosthetic limb services and contains items evaluating facets of care such as courtesy received from prosthetists and clinical staff, care coordination, appointment wait time, willingness of the prosthetist to listen to participant concerns, and satisfaction with prosthesis training. Items are rated on a 4-point scale (strongly agree [1] to strongly disagree [4]), thus higher CSS scores indicate worse satisfaction with services. The CSS was administered only to prosthesis users.
The Quality of Care assessment developed for this study contained items pertaining to amputation related care receipt and care quality. These items were generated by the study team in consultation with representatives from the VA/DoD Extremity Amputation Center of Excellence after review of the ULA rehabilitation CPG. Survey questions asked respondents about the clinicians visited for amputation related care in the past 12 months, whether they had an annual amputation-related checkup, whether any clinician had assessed their function, worked with them to identify goals, and/or to develop an amputation-related care plan. Respondents were also asked whether there had been family/caregiver involvement in their care and care coordination, whether a peer visitor was involved in their initial care, whether they had received information about amputation management in the prior year, and whether they had amputation-related pain. Those that indicated that they had amputation-related pain were subsequently asked whether their pain was well managed, whether they used medication for pain management, and whether they used any nonpharmaceutical strategies.
Quality of Care Index
We initially developed 15 indicator items of quality of care. We selected 7 of the items to create a summary index. We omitted 3 items about pain management, since these items were completed only by participants who indicated that they had experienced pain; however, we examined the 3 pain items individually given the importance of this topic. We omitted an additional 2 items from the summary index because they would not be sensitive to change because they pertained to the care in the year after initial amputation. One of these items asked whether caregivers were involved in initial amputation management and the other asked whether a peer visit occurred after amputation. Another 3 items were omitted because they only were completed by small subsamples due to intentional skip patterns in the survey. These items addressed whether clinical HCPs discussed amputation care goals in the prior year, worked to develop a care plan in the prior year, or helped to coordinate care after a move. Completion rates for all items considered for the index are shown in eAppendix 1 (Available at doi:10.12788/fp.0096). After item selection, we generated an index score, which was the number of reported “yes” responses to the seven relevant items.
Other Variables
We created a single variable called level/laterality which categorized ULA as unilateral or bilateral. We further categorized respondents with unilateral amputation by their amputation level. We categorized respondents as transradial for wrist joint or below the elbow amputations; transhumeral for at or above the elbow amputations; and shoulder for shoulder joint or forequarter amputations. Participants indicated the amputation etiology using 7 yes/no variables: combat injury, accident, burn, cancer, diabetes mellitus, and infection. Participants could select ≥ 1 etiology.
Primary prosthesis type was categorized as body powered, myoelectric/hybrid, cosmetic, other/unknown, or nonuser. The service era was classified based on amputation date as Before Vietnam, Vietnam War, After Vietnam to Gulf War, After Gulf War to September 10, 2001, and September 11, 2001 to present. For race, individuals with > 1 race were classified as other. We classified participants by region, using the station identification of the most recent VA medical center that they had visited between January 1, 2010 and December 30, 2015.
The survey also employed 2 measures of satisfaction with the prosthesis, the Trinity Amputation and Prosthetic Experience Scale (TAPES) satisfaction scale and the OPUS Client Satisfaction with Devices (CSD). TAPES consists of 10 items addressing color, shape, noise, appearance, weight, usefulness, reliability, fit, comfort and overall satisfaction.11 Items are rated on a 5-point Likert scale from very dissatisfied (1) to very satisfied (5). An 8-item version of the CSD scale was created for this study, after conducting a Rasch analysis (using Winsteps version 4.4.2) of the original 11-item CSD. The 8 items assess satisfaction with prosthesis fit, weight, comfort, donning ease, appearance, durability, skin contact, and pain. Items are rated on a 4-point scale from strongly agree (1) to strongly disagree (4); higher CSD scores indicate less satisfaction with devices. Psychometric analysis of the revised CSD score was reported in a prior publication.12 We also reported on the CSS using the original 10-item measure.
Data Analyses
We described characteristics of respondents at baseline and follow-up. We used baseline data to calculate CSS scores and described scores for all participants, for subgroups of unilateral and bilateral amputees, and for unilateral amputees stratified by amputation level. Wilcoxon rank sum tests were used to compare the CSS item and total scores of 461 prosthesis users with unilateral amputation and 29 with bilateral amputation. To identify factors that we hypothesized might be associated with CSS scores at baseline, we developed separate bivariate linear regression models. We added those factors that were associated with CSS scores at P ≤ .1 in bivariate analyses to a multivariable linear regression model of factors associated with CSS score. The P ≤ .1 threshold was used to ensure that relevant confounders were controlled for in regression models. We excluded 309 participants with no reported prosthesis use (who were not asked to complete the CSS), 20 participants with other/unknown prosthesis types, and 106 with missing data on amputation care in the prior year or on satisfaction metrics. We used baseline data for this analysis to maximize the sample size.
We compared CSS scores for those who reported receiving care within or outside of the VA or DoD in the prior year, using Wilcoxon Mann-Whitney rank tests. We also compared scores of individual quality of care items for these groups using Fisher exact tests. We chose to examine individual items rather than the full Index because several items specified care receipt within the VA and thus would be inappropriate to utilize in comparisons by site location; however, we described responses to all items. In these analyses, we excluded 2 respondents who had conflicting information regarding location of care. We used follow-up data for this analysis because it allowed us to identify location of care received in the prior year.
We also described the CSS scores, the 7-item Quality of Care Index and responses to other items related to quality of care at baseline and follow-up. To examine whether satisfaction with prosthetic care or aspects of care quality had changed over time, we compared baseline and follow-up CSS and quality of care scores for respondents who had measures at both times using Wilcoxon signed ranks tests. Individual items were compared using McNemar tests.
Results
Respondents were 97.4% male and included 776 unilateral amputees and 32 bilateral amputees with a mean (SD) age of 63.3 (14.1) years (Table 1). Respondents had lost their limbs a mean (SD) 31.4 (14.1) years prior, and half were transradial, 34.2% transhumeral, and 11.6% shoulder amputation. At baseline 185 (22.9%) participants received amputation-related care in the prior year and 118 (20.2%) participants received amputation-related care within 1 year of follow-up. Of respondents, 113 (19.3%) stated that their care was between baseline and follow-up and 89 (78.8%) of these received care at either the VA, the DoD or both; just 16 (14.2%) received care elsewhere.
Mean (SD) CSS scores were highest (lower satisfaction) for those with amputation at the shoulder and lowest for those with transhumeral amputation: 42.2 (20.0) vs 33.4 (20.8). Persons with bilateral amputation were less satisfied in almost every category when compared with those with unilateral amputation, although the total CSS score was not substantially different. Wilcoxon rank sum analyses revealed statistically significant differences in wait time satisfaction: bilateral amputees were less satisfied than unilateral amputees. Factors associated with overall CSS score in bivariate analyses were CSD score, TAPES score, amputation care receipt, prosthesis type, race, and region of care (eAppendix 2, available at doi:10.12788/fp.0096).
In the multivariate regression model of baseline CSS scores, only 2 variables were independently associated with CSS scores: CSD score and recent amputation care (Table 3). For each 1-point increase in CSD score there was a 0.7 point increase in CSS score. Those with amputation care in the prior year had higher satisfaction when compared with those who had not received care (P = .003).
For participants who indicated that they received amputation care between baseline and follow-up, CSS mean (SD) scores were better, but not statistically different, for those who reported care in the VA or DoD vs private care, 31.6 (22.6) vs 38.0 (17.7) (Table 4). When compared with community-based care, more participants who received care in the VA or DoD in the prior year had a functional assessment in that time period (33.7% vs 7.1%, P = .06), were contacted by HCPs outside of appointments (42.7% vs 18.8%, P = .07), and received information about amputation care in the prior year (41.6% vs 0%, P =.002). There was no difference in the proportion whose family/caregivers were involved in care in the prior year.
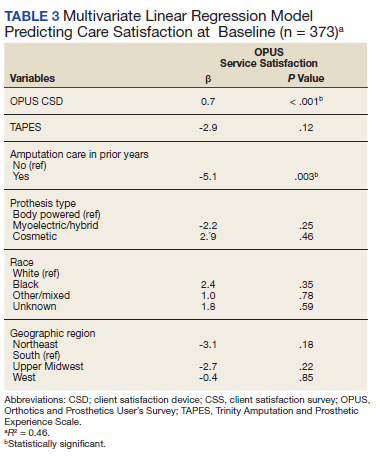
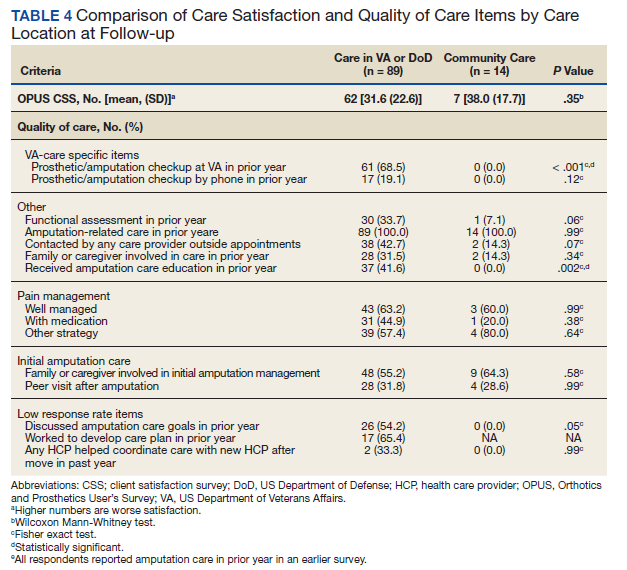
No statistically significant differences were observed in paired comparisons of the CSS and Quality of Care Index at baseline or follow-up for all participants with data at both time points (Table 5; eAppendix 3 available at doi:10.12788/fp.0096). Individual pain measures did not differ significantly between timepoints. Quality Index mean (SD) scores were 1.3 (1.5) and 1.2 (1.5) at baseline and follow-up, respectively (P = .07). For the 214 prosthesis users with longitudinal data, baseline CSS mean (SD) scores were generally worse at baseline than at follow-up: 34.4 (19.8) vs 32.5 (21.0) (P = .23). Family/caregiver involvement in amputation care was significantly higher in the year before baseline when compared with the year prior to follow-up (24.4% vs 17.7%, P = .001). There were no other statistically significant differences in Quality of Care items between baseline and follow-up.
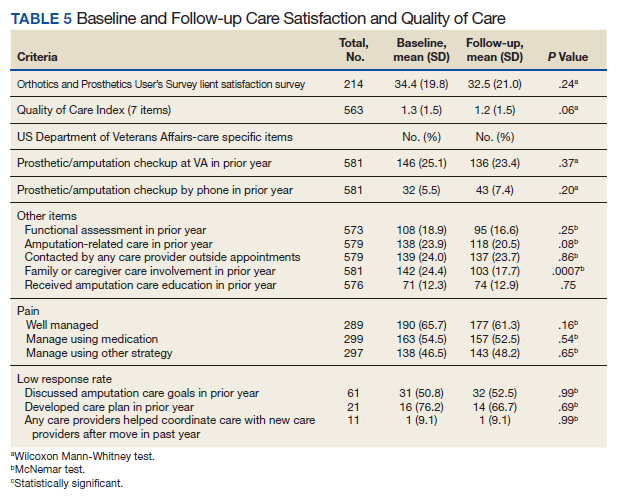
Discussion
Our longitudinal study provides insights into the experiences of veterans with major ULA related to satisfaction with prosthetic limb care services and receipt of amputation-related care. We reported on the development and use of a new summary measure of amputation care quality, which we designed to capture some of the key elements of care quality as provided in the VA/DoD CPG.2
We used baseline data to identify factors independently associated with prosthetic limb care satisfaction as measured by a previously validated measure, the OPUS CSS. The CSS addresses satisfaction with prosthetic limb services and does not reflect satisfaction with other amputation care services. We found that persons who received amputation care in the prior year had CSS scores that were a mean 5.1 points better than those who had not received recent care. Although causality cannot be determined with this investigation, this finding highlights an important relationship between frequency of care and satisfaction, which can be leveraged by the VA in future care initiatives. Care satisfaction was also better by 0.7 points for every 1-point decrease (indicating higher satisfaction) in the OPUS CSD prosthetic satisfaction scale. This finding isn’t surprising, given that a major purpose of prosthetic limb care services is to procure and fit a satisfactory device. To determine whether these same relationships were observed in the smaller, longitudinal cohort data at follow-up, we repeated these models and found similar relationships between recent care receipt and prosthesis satisfaction and satisfaction with services. We believe that these findings are meaningful and emphasize the importance of both service and device satisfaction to the veteran with an ULA. Lower service satisfaction scores among those with amputations at the shoulder and those with bilateral limb loss suggest that these individuals may benefit from different service delivery approaches.
We did observe a difference in satisfaction scores by geographic region in the follow-up (but not the baseline) data with satisfaction higher in the Western vs the Southern region (data not shown). This finding suggests a need for continued monitoring of care satisfaction over time to determine whether differences by region persist. We grouped respondents into geographic region based on the location where they had received their most recent VA care of any type. Many veterans receive care at multiple VA locations. Thus, it is possible that some veterans received their amputation care at a non-VA facility or a VA facility in a different region.
Our findings related to prosthetic limb care services satisfaction are generalizable to veteran prosthesis users. Findings may not be generalizable to nonusers, because in our study, the CSS only was administered to prosthesis users. Thus, we were unable to identify factors associated with care satisfaction for persons who were not current users of an upper limb prosthesis.
The study findings confirmed that most veterans with ULA receive amputation-related care in the VA or DoD. We compared CSS and Quality of Care item scores for those who reported receiving care at the VA or DoD vs elsewhere. Amputation care within the VA is complex. Some services are provided at VA facilities and some are ordered by VA clinicians but provided by community-based HCPs. However, we found that better (though not statistically significantly different) CSS scores and several Quality of Care items were endorsed by a significantly more of those reporting care in the VA or DoD as compared to elsewhere. Given the dissemination of a rehabilitation of upper limb amputees CPG, we hypothesized that VA and DoD HCPs would be more aware of care guidelines and would provide better care. Overall, our findings supported this hypothesis while also suggesting that areas such as caregiver involvement and peer visitation may benefit from additional attention and program improvement.
We used longitudinal data to describe and compare CSS and Quality of Care Index scores. Our analyses did not detect any statistically significant differences between baseline and follow-up. This finding may reflect that this was a relatively stable population with regard to amputation experiences given the mean time since amputation was 31.4 years. However, we also recognize that our measures may not have captured all aspects of care satisfaction or quality. It is possible that there were other changes that had occurred over the course of the year that were not captured by the CSS or by the Quality of Care Index. It is also possible that some implementation and adoption of the CPG had happened prior to our baseline survey. Finally, it is possible that some elements of the CPG have not yet been fully integrated into clinical care. We believe that the latter is likely, given that nearly 80% of respondents did not report receiving any amputation care within the past year at follow-up, though the CPGs recommend an annual visit.
Aside from recall bias, 2 explanations must be considered relative to the low rate of adherence to the CPG recommendation for an annual follow-up. The first is that the CPG simply may not be widely adopted. The second is that the majority of patients with ULA who use prostheses use a body-powered system. These tend to be low maintenance, long-lasting systems and may ultimately not need annual maintenance and repair. Further, if the veteran’s body-powered system is functioning properly and health status has not changed, they may simply be opting out of an annual visit despite the CPG recommendation. Nonetheless, this apparent low rate of annual follow-up emphasizes the need for additional process improvement measures for the VA.
Strengths and Limitations
The VA provides a unique setting for a nationally representative study of amputation rehabilitation because it has centralized data sources that can be used to identify veterans with ULA. Our study had a strong response rate, and its prosthetic limb care satisfaction findings are generalizable to all veterans with major ULA who received VA care from 2010 to 2015. However, there are limits to generalizability outside of this population to civilians or to veterans who do not receive VA care. To examine possible nonresponse bias, which could limit generalizability, we compared the baseline characteristics of respondents and nonrespondents to the follow-up study (eAppendix 4 available at doi:10.12788/fp.0096). There were no significant differences in satisfaction, quality of care, or receipt of amputation-related care between those lost to follow-up and those with follow-up data. Although, we did find small differences in gender, race, and service era (defined by amputation date). We do not believe that these differences threaten the interpretation of findings at follow-up, but there may be limits to generalizability of these findings to the full baseline sample. The data were from a telephone survey of veterans. It is possible that some veterans did not recall their care receipt or did not understand some of the questions and thus may not have accurately answered questions related to type of care received or the timing of that care.
Our interpretation of findings comparing care received within the VA and DoD or elsewhere is also limited because we cannot say with certainty whether those who indicated no care in the VA or DoD actually had care that was sponsored by the VA or DoD as contract or fee-basis care. Just 8 respondents indicated that they had received care only outside of the VA or DoD in the prior year. There were also some limitations in the collection of data about care location. We asked about receipt of amputation care in the prior year and about location of any amputation care received between baseline and follow-up, and there were differences in responses. Thus, we used a combination of these items to identify location of care received in the prior year.
Despite these limitations, we believe that our study provides novel, important findings about the satisfaction with prosthetic limb care services and quality of amputation rehabilitation care for veterans. Findings from this study can be used to address amputation and prosthetic limb care satisfaction and quality weaknesses highlighted and to benchmark care satisfaction and CPG compliance. Other studies evaluating care guideline compliance have used indicators obtained from clinical records or data repositories.13-15 Future work could combine self-reported satisfaction and care quality measures with indicators obtained from clinical or repository sources to provide a more complete snapshot of care delivery.
Conclusions
We reported on a national survey of veterans with major upper limb loss that assessed satisfaction with prosthetic limb care services and quality of amputation care. Satisfaction with prosthetic limb care was independently associated with satisfaction with the prosthesis, and receipt of care within the prior year. Most of the veterans surveyed received care within the VA or DoD and reported receiving higher quality of care, when compared with those who received care outside of the VA or DoD. Satisfaction with care and quality of care were stable over the year of this study. Data presented in this study can serve to direct VA amputation care process improvement initiatives as benchmarks for future work. Future studies are needed to track satisfaction with and quality of care for veterans with ULA.
1. Resnik L, Ekerholm S, Borgia M, Clark MA. A national study of veterans with major upper limb amputation: Survey methods, participants, and summary findings. PLoS One. 2019;14(3):e0213578. Published 2019 Mar 14. doi:10.1371/journal.pone.0213578
2. US Department of Defense, US Department of Veterans Affairs, Management of Upper Extremity Amputation Rehabilitation Working Group. VA/DoD clinical practice guideline for the management of upper extremity amputation rehabilitation.Published 2014. Accessed February 18, 2021. https://www.healthquality.va.gov/guidelines/Rehab/UEAR/VADoDCPGManagementofUEAR121614Corrected508.pdf
3. Jette AM. The Promise of Assistive Technology to Enhance Work Participation. Phys Ther. 2017;97(7):691-692. doi:10.1093/ptj/pzx054
4. Webster JB, Poorman CE, Cifu DX. Guest editorial: Department of Veterans Affairs amputations system of care: 5 years of accomplishments and outcomes. J Rehabil Res Dev. 2014;51(4):vii-xvi. doi:10.1682/JRRD.2014.01.0024
5. Scholten J, Poorman C, Culver L, Webster JB. Department of Veterans Affairs polytrauma telerehabilitation: twenty-first century care. Phys Med Rehabil Clin N Am. 2019;30(1):207-215. doi:10.1016/j.pmr.2018.08.003
6. Melcer T, Walker J, Bhatnagar V, Richard E. Clinic use at the Departments of Defense and Veterans Affairs following combat related amputations. Mil Med. 2020;185(1-2):e244-e253. doi:10.1093/milmed/usz149
7. Berke GM, Fergason J, Milani JR, et al. Comparison of satisfaction with current prosthetic care in veterans and servicemembers from Vietnam and OIF/OEF conflicts with major traumatic limb loss. J Rehabil Res Dev. 2010;47(4):361-371. doi:10.1682/jrrd.2009.12.0193
8. US Department of Veterans Affairs, Office of Inspector General. Healthcare inspection prosthetic limb care in VA facilities. Published March 8, 2012. Accessed February 18, 2021. https://www.va.gov/oig/pubs/VAOIG-11-02138-116.pdf 9. American Association for Public Opinion Research. Response rates - an overview. Accessed February 18, 2021. https://www.aapor.org/Education-Resources/For-Researchers/Poll-Survey-FAQ/Response-Rates-An-Overview.aspx
10. Heinemann AW, Bode RK, O’Reilly C. Development and measurement properties of the Orthotics and Prosthetics Users’ Survey (OPUS): a comprehensive set of clinical outcome instruments. Prosthet Orthot Int. 2003;27(3):191-206. doi:10.1080/03093640308726682
11. Desmond DM, MacLachlan M. Factor structure of the Trinity Amputation and Prosthesis Experience Scales (TAPES) with individuals with acquired upper limb amputations. Am J Phys Med Rehabil. 2005;84(7):506-513. doi:10.1097/01.phm.0000166885.16180.63
12. Resnik L, Borgia M, Heinemann AW, Clark MA. Prosthesis satisfaction in a national sample of veterans with upper limb amputation. Prosthet Orthot Int. 2020;44(2):81-91. doi:10.1177/0309364619895201
13. Ho TH, Caughey GE, Shakib S. Guideline compliance in chronic heart failure patients with multiple comorbid diseases: evaluation of an individualised multidisciplinary model of care. PLoS One. 2014;9(4):e93129. Published 2014 Apr 8. doi:10.1371/journal.pone.0093129
14. Mitchell KB, Lin H, Shen Y, et al. DCIS and axillary nodal evaluation: compliance with national guidelines. BMC Surg. 2017;17(1):12. Published 2017 Feb 7. doi:10.1186/s12893-017-0210-5
15. Moesker MJ, de Groot JF, Damen NL, et al. Guideline compliance for bridging anticoagulation use in vitamin-K antagonist patients; practice variation and factors associated with non-compliance. Thromb J. 2019;17:15. Published 2019 Aug 5. doi:10.1186/s12959-019-0204-x
Veterans with upper limb amputation (ULA) are a small, but important population, who have received more attention in the past decade due to the increased growth of the population of veterans with conflict-related amputation from recent military engagements. Among the 808 veterans with ULA receiving any care in the US Department of Veterans Affairs (VA) from 2010 to 2015 who participated in our national study, an estimated 28 to 35% had a conflict-related amputation.1 The care of these individuals with ULA is highly specialized, and there is a recognized shortage of experienced professionals in this area.2,3 The provision of high-quality prosthetic care is increasingly complex with advances in technology, such as externally powered devices with multiple functions.
The VA is a comprehensive, integrated health care system that serves more than 8.9 million veterans each year. Interdisciplinary amputation care is provided within the VA through a traditional clinic setting or by using one of several currently available virtual care modalities.4,5 In consultation with the veteran, VA health care providers (HCPs) prescribe prostheses and services based on the clinical needs and furnish authorized items and services to eligible veterans. Prescribed items and/or services are furnished either by internal VA resources or through a community-based prosthetist who is an authorized vendor or contractor. Although several studies have reported that the majority of veterans with ULA utilize VA services for at least some aspects of their health care, little is known about: (1) prosthetic limb care satisfaction or the quality of care that veterans receive; or (2) how care within the VA or Department of Defense (DoD) compares with care provided in the civilian sector.6-8
Earlier studies that examined the amputation rehabilitation services received by veterans with ULA pointed to quality gaps in care and differences in satisfaction in the VA and DoD when compared with the civilian sector but were limited in their scope and methodology.7,8 A 2008 study of veterans of the Vietnam War, Operation Iraqi Freedom (OIF), and Operation Enduring Freedom (OEF) compared satisfaction by location of care receipt (DoD only, VA only, private only, and multiple sources). That study dichotomized response categories for items related to satisfaction with care (satisfied/not), but did not estimate degree of satisfaction, calculate summary scores of the items, or utilize validated care satisfaction metrics. That study found that a greater proportion of Vietnam War veterans (compared with OIF/OEF veterans receiving care in the private sector) agreed that they “had a role in choosing prosthesis” and disagreed that they wanted to change their current prosthesis to another type.7 The assumption made by the authors is that much of this private sector care was actually VA-sponsored care prescribed and procured by the VA but delivered in the community. However, no data were collected to confirm or refute this assumption, and it is possible that some care was both VA sponsored and delivered, some was VA sponsored but commercially delivered, and in some cases, care was sponsored by other sources and delivered in still other facilities.
A 2012 VA Office of the Inspector General study of OIF, OEF, and Operation New Dawn (OND) veterans reported lower prosthetic satisfaction for veterans with upper limb when compared with lower limb amputation and described respondents concerns about lack of VA prosthetic expertise, difficulty with accessing VA services, and dissatisfaction with the sometimes lengthy approval process for obtaining fee-basis or VA contract care.8 Although this report suggested that there were quality gaps and areas for improvement, it did not employ validated metrics of prosthesis or care satisfaction and instead relied on qualitative data collected through telephone interviews.
Given the VA effort to enhance the quality and consistency of its amputation care services through the formal establishment of the Amputation System of Care, which began in 2008, further evaluation of care satisfaction and quality of care is warranted. In 2014 the VA and DoD released the first evidence-based clinical practice guidelines (CPGs) for the rehabilitation of persons with ULA.2 The CPG describes care paths to improve outcomes and basic tenets of amputation rehabilitation care and can be used to identify process activities that are essential aspects of quality care. However, the extent to which the CPG has impacted the quality and timeliness of care for veterans with ULA are presently unclear.
Thus, the purposes of this study were to: (1) measure veteran satisfaction with prosthetic limb care and identify factors associated with service satisfaction; (2) assess quality indicators that potentially reflect CPG) adoption; (3) compare care satisfaction and quality for those who received care in or outside of the VA or DoD; and (4) evaluate change in satisfaction over time.
Methods
The study was approved by the VA Central Institutional Review Board (IRB) (Study #16-20) and Human Research Protection Office, U.S. Army Medical Research and Development Command. The sampling frame consisted of veterans with major ULA who received care in the VA between 2010 and 2015 identified in VA Corporate Data Warehouse. We sent recruitment packages to nondeceased veterans who had current addresses and phone numbers. Those who did not opt out or inform us that they did not meet eligibility criteria were contacted by study interviewers. A waiver of documentation of written informed consent was obtained from the VA Central IRB. When reached by the study interviewer, Veterans provided oral informed consent. At baseline, 808 veterans were interviewed for a response rate of 47.7% as calculated by the American Association for Public Opinion Research (AAPOR) methodology.9 Follow-up interviews approximately 1 year later (mean [SD] 367 [16.8] days), were conducted with 585 respondents for a 72.4% response rate (Figure).
Survey Content
Development and pilot testing of the survey instrument previously was reported.1 The content of the survey drew from existing survey items and metrics, and included new items specifically designed to address patterns of amputation care, based on care goals within the CPG. All new and modified items were tested and refined through cognitive interviews with 10 participants, and tested with an additional 13 participants.
The survey collected data on demographics, amputation characteristics (year of amputation, level, laterality, and etiology), current prosthesis use, and type of prosthesis. This article focused on the sections of the survey pertaining to satisfaction with prosthetic care and indicators of quality of care. A description of the content of the full survey and a synopsis of overall findings are reported in a prior publication.1 The key independent, dependent, and other variables utilized in the analyses reported in this manuscript are described below.
Primary Independent Variables
In the follow-up survey, we asked respondents whether they had any amputation care in the prior 12 months, and if so to indicate where they had gone for care. We categorized respondents as having received VA/DoD care if they reported any care at the VA or DoD, and as having received non-VA/DoD care if they did not report care at the VA or DoD but indicated that they had received amputation care between baseline and follow-up.
Two primary outcomes were utilized; the Orthotics and Prosthetics User’s Survey (OPUS), client satisfaction with services scale (CSS), and a measure of care quality specifically developed for this study. The CSS is a measure developed specifically for orthotic and prosthesis users.10 This 11-item scale measures satisfaction with prosthetic limb services and contains items evaluating facets of care such as courtesy received from prosthetists and clinical staff, care coordination, appointment wait time, willingness of the prosthetist to listen to participant concerns, and satisfaction with prosthesis training. Items are rated on a 4-point scale (strongly agree [1] to strongly disagree [4]), thus higher CSS scores indicate worse satisfaction with services. The CSS was administered only to prosthesis users.
The Quality of Care assessment developed for this study contained items pertaining to amputation related care receipt and care quality. These items were generated by the study team in consultation with representatives from the VA/DoD Extremity Amputation Center of Excellence after review of the ULA rehabilitation CPG. Survey questions asked respondents about the clinicians visited for amputation related care in the past 12 months, whether they had an annual amputation-related checkup, whether any clinician had assessed their function, worked with them to identify goals, and/or to develop an amputation-related care plan. Respondents were also asked whether there had been family/caregiver involvement in their care and care coordination, whether a peer visitor was involved in their initial care, whether they had received information about amputation management in the prior year, and whether they had amputation-related pain. Those that indicated that they had amputation-related pain were subsequently asked whether their pain was well managed, whether they used medication for pain management, and whether they used any nonpharmaceutical strategies.
Quality of Care Index
We initially developed 15 indicator items of quality of care. We selected 7 of the items to create a summary index. We omitted 3 items about pain management, since these items were completed only by participants who indicated that they had experienced pain; however, we examined the 3 pain items individually given the importance of this topic. We omitted an additional 2 items from the summary index because they would not be sensitive to change because they pertained to the care in the year after initial amputation. One of these items asked whether caregivers were involved in initial amputation management and the other asked whether a peer visit occurred after amputation. Another 3 items were omitted because they only were completed by small subsamples due to intentional skip patterns in the survey. These items addressed whether clinical HCPs discussed amputation care goals in the prior year, worked to develop a care plan in the prior year, or helped to coordinate care after a move. Completion rates for all items considered for the index are shown in eAppendix 1 (Available at doi:10.12788/fp.0096). After item selection, we generated an index score, which was the number of reported “yes” responses to the seven relevant items.
Other Variables
We created a single variable called level/laterality which categorized ULA as unilateral or bilateral. We further categorized respondents with unilateral amputation by their amputation level. We categorized respondents as transradial for wrist joint or below the elbow amputations; transhumeral for at or above the elbow amputations; and shoulder for shoulder joint or forequarter amputations. Participants indicated the amputation etiology using 7 yes/no variables: combat injury, accident, burn, cancer, diabetes mellitus, and infection. Participants could select ≥ 1 etiology.
Primary prosthesis type was categorized as body powered, myoelectric/hybrid, cosmetic, other/unknown, or nonuser. The service era was classified based on amputation date as Before Vietnam, Vietnam War, After Vietnam to Gulf War, After Gulf War to September 10, 2001, and September 11, 2001 to present. For race, individuals with > 1 race were classified as other. We classified participants by region, using the station identification of the most recent VA medical center that they had visited between January 1, 2010 and December 30, 2015.
The survey also employed 2 measures of satisfaction with the prosthesis, the Trinity Amputation and Prosthetic Experience Scale (TAPES) satisfaction scale and the OPUS Client Satisfaction with Devices (CSD). TAPES consists of 10 items addressing color, shape, noise, appearance, weight, usefulness, reliability, fit, comfort and overall satisfaction.11 Items are rated on a 5-point Likert scale from very dissatisfied (1) to very satisfied (5). An 8-item version of the CSD scale was created for this study, after conducting a Rasch analysis (using Winsteps version 4.4.2) of the original 11-item CSD. The 8 items assess satisfaction with prosthesis fit, weight, comfort, donning ease, appearance, durability, skin contact, and pain. Items are rated on a 4-point scale from strongly agree (1) to strongly disagree (4); higher CSD scores indicate less satisfaction with devices. Psychometric analysis of the revised CSD score was reported in a prior publication.12 We also reported on the CSS using the original 10-item measure.
Data Analyses
We described characteristics of respondents at baseline and follow-up. We used baseline data to calculate CSS scores and described scores for all participants, for subgroups of unilateral and bilateral amputees, and for unilateral amputees stratified by amputation level. Wilcoxon rank sum tests were used to compare the CSS item and total scores of 461 prosthesis users with unilateral amputation and 29 with bilateral amputation. To identify factors that we hypothesized might be associated with CSS scores at baseline, we developed separate bivariate linear regression models. We added those factors that were associated with CSS scores at P ≤ .1 in bivariate analyses to a multivariable linear regression model of factors associated with CSS score. The P ≤ .1 threshold was used to ensure that relevant confounders were controlled for in regression models. We excluded 309 participants with no reported prosthesis use (who were not asked to complete the CSS), 20 participants with other/unknown prosthesis types, and 106 with missing data on amputation care in the prior year or on satisfaction metrics. We used baseline data for this analysis to maximize the sample size.
We compared CSS scores for those who reported receiving care within or outside of the VA or DoD in the prior year, using Wilcoxon Mann-Whitney rank tests. We also compared scores of individual quality of care items for these groups using Fisher exact tests. We chose to examine individual items rather than the full Index because several items specified care receipt within the VA and thus would be inappropriate to utilize in comparisons by site location; however, we described responses to all items. In these analyses, we excluded 2 respondents who had conflicting information regarding location of care. We used follow-up data for this analysis because it allowed us to identify location of care received in the prior year.
We also described the CSS scores, the 7-item Quality of Care Index and responses to other items related to quality of care at baseline and follow-up. To examine whether satisfaction with prosthetic care or aspects of care quality had changed over time, we compared baseline and follow-up CSS and quality of care scores for respondents who had measures at both times using Wilcoxon signed ranks tests. Individual items were compared using McNemar tests.
Results
Respondents were 97.4% male and included 776 unilateral amputees and 32 bilateral amputees with a mean (SD) age of 63.3 (14.1) years (Table 1). Respondents had lost their limbs a mean (SD) 31.4 (14.1) years prior, and half were transradial, 34.2% transhumeral, and 11.6% shoulder amputation. At baseline 185 (22.9%) participants received amputation-related care in the prior year and 118 (20.2%) participants received amputation-related care within 1 year of follow-up. Of respondents, 113 (19.3%) stated that their care was between baseline and follow-up and 89 (78.8%) of these received care at either the VA, the DoD or both; just 16 (14.2%) received care elsewhere.
Mean (SD) CSS scores were highest (lower satisfaction) for those with amputation at the shoulder and lowest for those with transhumeral amputation: 42.2 (20.0) vs 33.4 (20.8). Persons with bilateral amputation were less satisfied in almost every category when compared with those with unilateral amputation, although the total CSS score was not substantially different. Wilcoxon rank sum analyses revealed statistically significant differences in wait time satisfaction: bilateral amputees were less satisfied than unilateral amputees. Factors associated with overall CSS score in bivariate analyses were CSD score, TAPES score, amputation care receipt, prosthesis type, race, and region of care (eAppendix 2, available at doi:10.12788/fp.0096).
In the multivariate regression model of baseline CSS scores, only 2 variables were independently associated with CSS scores: CSD score and recent amputation care (Table 3). For each 1-point increase in CSD score there was a 0.7 point increase in CSS score. Those with amputation care in the prior year had higher satisfaction when compared with those who had not received care (P = .003).
For participants who indicated that they received amputation care between baseline and follow-up, CSS mean (SD) scores were better, but not statistically different, for those who reported care in the VA or DoD vs private care, 31.6 (22.6) vs 38.0 (17.7) (Table 4). When compared with community-based care, more participants who received care in the VA or DoD in the prior year had a functional assessment in that time period (33.7% vs 7.1%, P = .06), were contacted by HCPs outside of appointments (42.7% vs 18.8%, P = .07), and received information about amputation care in the prior year (41.6% vs 0%, P =.002). There was no difference in the proportion whose family/caregivers were involved in care in the prior year.
No statistically significant differences were observed in paired comparisons of the CSS and Quality of Care Index at baseline or follow-up for all participants with data at both time points (Table 5; eAppendix 3 available at doi:10.12788/fp.0096). Individual pain measures did not differ significantly between timepoints. Quality Index mean (SD) scores were 1.3 (1.5) and 1.2 (1.5) at baseline and follow-up, respectively (P = .07). For the 214 prosthesis users with longitudinal data, baseline CSS mean (SD) scores were generally worse at baseline than at follow-up: 34.4 (19.8) vs 32.5 (21.0) (P = .23). Family/caregiver involvement in amputation care was significantly higher in the year before baseline when compared with the year prior to follow-up (24.4% vs 17.7%, P = .001). There were no other statistically significant differences in Quality of Care items between baseline and follow-up.
Discussion
Our longitudinal study provides insights into the experiences of veterans with major ULA related to satisfaction with prosthetic limb care services and receipt of amputation-related care. We reported on the development and use of a new summary measure of amputation care quality, which we designed to capture some of the key elements of care quality as provided in the VA/DoD CPG.2
We used baseline data to identify factors independently associated with prosthetic limb care satisfaction as measured by a previously validated measure, the OPUS CSS. The CSS addresses satisfaction with prosthetic limb services and does not reflect satisfaction with other amputation care services. We found that persons who received amputation care in the prior year had CSS scores that were a mean 5.1 points better than those who had not received recent care. Although causality cannot be determined with this investigation, this finding highlights an important relationship between frequency of care and satisfaction, which can be leveraged by the VA in future care initiatives. Care satisfaction was also better by 0.7 points for every 1-point decrease (indicating higher satisfaction) in the OPUS CSD prosthetic satisfaction scale. This finding isn’t surprising, given that a major purpose of prosthetic limb care services is to procure and fit a satisfactory device. To determine whether these same relationships were observed in the smaller, longitudinal cohort data at follow-up, we repeated these models and found similar relationships between recent care receipt and prosthesis satisfaction and satisfaction with services. We believe that these findings are meaningful and emphasize the importance of both service and device satisfaction to the veteran with an ULA. Lower service satisfaction scores among those with amputations at the shoulder and those with bilateral limb loss suggest that these individuals may benefit from different service delivery approaches.
We did observe a difference in satisfaction scores by geographic region in the follow-up (but not the baseline) data with satisfaction higher in the Western vs the Southern region (data not shown). This finding suggests a need for continued monitoring of care satisfaction over time to determine whether differences by region persist. We grouped respondents into geographic region based on the location where they had received their most recent VA care of any type. Many veterans receive care at multiple VA locations. Thus, it is possible that some veterans received their amputation care at a non-VA facility or a VA facility in a different region.
Our findings related to prosthetic limb care services satisfaction are generalizable to veteran prosthesis users. Findings may not be generalizable to nonusers, because in our study, the CSS only was administered to prosthesis users. Thus, we were unable to identify factors associated with care satisfaction for persons who were not current users of an upper limb prosthesis.
The study findings confirmed that most veterans with ULA receive amputation-related care in the VA or DoD. We compared CSS and Quality of Care item scores for those who reported receiving care at the VA or DoD vs elsewhere. Amputation care within the VA is complex. Some services are provided at VA facilities and some are ordered by VA clinicians but provided by community-based HCPs. However, we found that better (though not statistically significantly different) CSS scores and several Quality of Care items were endorsed by a significantly more of those reporting care in the VA or DoD as compared to elsewhere. Given the dissemination of a rehabilitation of upper limb amputees CPG, we hypothesized that VA and DoD HCPs would be more aware of care guidelines and would provide better care. Overall, our findings supported this hypothesis while also suggesting that areas such as caregiver involvement and peer visitation may benefit from additional attention and program improvement.
We used longitudinal data to describe and compare CSS and Quality of Care Index scores. Our analyses did not detect any statistically significant differences between baseline and follow-up. This finding may reflect that this was a relatively stable population with regard to amputation experiences given the mean time since amputation was 31.4 years. However, we also recognize that our measures may not have captured all aspects of care satisfaction or quality. It is possible that there were other changes that had occurred over the course of the year that were not captured by the CSS or by the Quality of Care Index. It is also possible that some implementation and adoption of the CPG had happened prior to our baseline survey. Finally, it is possible that some elements of the CPG have not yet been fully integrated into clinical care. We believe that the latter is likely, given that nearly 80% of respondents did not report receiving any amputation care within the past year at follow-up, though the CPGs recommend an annual visit.
Aside from recall bias, 2 explanations must be considered relative to the low rate of adherence to the CPG recommendation for an annual follow-up. The first is that the CPG simply may not be widely adopted. The second is that the majority of patients with ULA who use prostheses use a body-powered system. These tend to be low maintenance, long-lasting systems and may ultimately not need annual maintenance and repair. Further, if the veteran’s body-powered system is functioning properly and health status has not changed, they may simply be opting out of an annual visit despite the CPG recommendation. Nonetheless, this apparent low rate of annual follow-up emphasizes the need for additional process improvement measures for the VA.
Strengths and Limitations
The VA provides a unique setting for a nationally representative study of amputation rehabilitation because it has centralized data sources that can be used to identify veterans with ULA. Our study had a strong response rate, and its prosthetic limb care satisfaction findings are generalizable to all veterans with major ULA who received VA care from 2010 to 2015. However, there are limits to generalizability outside of this population to civilians or to veterans who do not receive VA care. To examine possible nonresponse bias, which could limit generalizability, we compared the baseline characteristics of respondents and nonrespondents to the follow-up study (eAppendix 4 available at doi:10.12788/fp.0096). There were no significant differences in satisfaction, quality of care, or receipt of amputation-related care between those lost to follow-up and those with follow-up data. Although, we did find small differences in gender, race, and service era (defined by amputation date). We do not believe that these differences threaten the interpretation of findings at follow-up, but there may be limits to generalizability of these findings to the full baseline sample. The data were from a telephone survey of veterans. It is possible that some veterans did not recall their care receipt or did not understand some of the questions and thus may not have accurately answered questions related to type of care received or the timing of that care.
Our interpretation of findings comparing care received within the VA and DoD or elsewhere is also limited because we cannot say with certainty whether those who indicated no care in the VA or DoD actually had care that was sponsored by the VA or DoD as contract or fee-basis care. Just 8 respondents indicated that they had received care only outside of the VA or DoD in the prior year. There were also some limitations in the collection of data about care location. We asked about receipt of amputation care in the prior year and about location of any amputation care received between baseline and follow-up, and there were differences in responses. Thus, we used a combination of these items to identify location of care received in the prior year.
Despite these limitations, we believe that our study provides novel, important findings about the satisfaction with prosthetic limb care services and quality of amputation rehabilitation care for veterans. Findings from this study can be used to address amputation and prosthetic limb care satisfaction and quality weaknesses highlighted and to benchmark care satisfaction and CPG compliance. Other studies evaluating care guideline compliance have used indicators obtained from clinical records or data repositories.13-15 Future work could combine self-reported satisfaction and care quality measures with indicators obtained from clinical or repository sources to provide a more complete snapshot of care delivery.
Conclusions
We reported on a national survey of veterans with major upper limb loss that assessed satisfaction with prosthetic limb care services and quality of amputation care. Satisfaction with prosthetic limb care was independently associated with satisfaction with the prosthesis, and receipt of care within the prior year. Most of the veterans surveyed received care within the VA or DoD and reported receiving higher quality of care, when compared with those who received care outside of the VA or DoD. Satisfaction with care and quality of care were stable over the year of this study. Data presented in this study can serve to direct VA amputation care process improvement initiatives as benchmarks for future work. Future studies are needed to track satisfaction with and quality of care for veterans with ULA.
1. Resnik L, Ekerholm S, Borgia M, Clark MA. A national study of veterans with major upper limb amputation: Survey methods, participants, and summary findings. PLoS One. 2019;14(3):e0213578. Published 2019 Mar 14. doi:10.1371/journal.pone.0213578
2. US Department of Defense, US Department of Veterans Affairs, Management of Upper Extremity Amputation Rehabilitation Working Group. VA/DoD clinical practice guideline for the management of upper extremity amputation rehabilitation.Published 2014. Accessed February 18, 2021. https://www.healthquality.va.gov/guidelines/Rehab/UEAR/VADoDCPGManagementofUEAR121614Corrected508.pdf
3. Jette AM. The Promise of Assistive Technology to Enhance Work Participation. Phys Ther. 2017;97(7):691-692. doi:10.1093/ptj/pzx054
4. Webster JB, Poorman CE, Cifu DX. Guest editorial: Department of Veterans Affairs amputations system of care: 5 years of accomplishments and outcomes. J Rehabil Res Dev. 2014;51(4):vii-xvi. doi:10.1682/JRRD.2014.01.0024
5. Scholten J, Poorman C, Culver L, Webster JB. Department of Veterans Affairs polytrauma telerehabilitation: twenty-first century care. Phys Med Rehabil Clin N Am. 2019;30(1):207-215. doi:10.1016/j.pmr.2018.08.003
6. Melcer T, Walker J, Bhatnagar V, Richard E. Clinic use at the Departments of Defense and Veterans Affairs following combat related amputations. Mil Med. 2020;185(1-2):e244-e253. doi:10.1093/milmed/usz149
7. Berke GM, Fergason J, Milani JR, et al. Comparison of satisfaction with current prosthetic care in veterans and servicemembers from Vietnam and OIF/OEF conflicts with major traumatic limb loss. J Rehabil Res Dev. 2010;47(4):361-371. doi:10.1682/jrrd.2009.12.0193
8. US Department of Veterans Affairs, Office of Inspector General. Healthcare inspection prosthetic limb care in VA facilities. Published March 8, 2012. Accessed February 18, 2021. https://www.va.gov/oig/pubs/VAOIG-11-02138-116.pdf 9. American Association for Public Opinion Research. Response rates - an overview. Accessed February 18, 2021. https://www.aapor.org/Education-Resources/For-Researchers/Poll-Survey-FAQ/Response-Rates-An-Overview.aspx
10. Heinemann AW, Bode RK, O’Reilly C. Development and measurement properties of the Orthotics and Prosthetics Users’ Survey (OPUS): a comprehensive set of clinical outcome instruments. Prosthet Orthot Int. 2003;27(3):191-206. doi:10.1080/03093640308726682
11. Desmond DM, MacLachlan M. Factor structure of the Trinity Amputation and Prosthesis Experience Scales (TAPES) with individuals with acquired upper limb amputations. Am J Phys Med Rehabil. 2005;84(7):506-513. doi:10.1097/01.phm.0000166885.16180.63
12. Resnik L, Borgia M, Heinemann AW, Clark MA. Prosthesis satisfaction in a national sample of veterans with upper limb amputation. Prosthet Orthot Int. 2020;44(2):81-91. doi:10.1177/0309364619895201
13. Ho TH, Caughey GE, Shakib S. Guideline compliance in chronic heart failure patients with multiple comorbid diseases: evaluation of an individualised multidisciplinary model of care. PLoS One. 2014;9(4):e93129. Published 2014 Apr 8. doi:10.1371/journal.pone.0093129
14. Mitchell KB, Lin H, Shen Y, et al. DCIS and axillary nodal evaluation: compliance with national guidelines. BMC Surg. 2017;17(1):12. Published 2017 Feb 7. doi:10.1186/s12893-017-0210-5
15. Moesker MJ, de Groot JF, Damen NL, et al. Guideline compliance for bridging anticoagulation use in vitamin-K antagonist patients; practice variation and factors associated with non-compliance. Thromb J. 2019;17:15. Published 2019 Aug 5. doi:10.1186/s12959-019-0204-x
Impact of an Oral Antineoplastic Renewal Clinic on Medication Possession Ratio and Cost-Savings
Evaluation of oral antineoplastic agent (OAN) adherence patterns have identified correlations between nonadherence or over-adherence and poorer disease-related outcomes. Multiple studies have focused on imatinib use in chronic myeloid leukemia (CML) due to its continuous, long-term use. A study by Ganesan and colleagues found that nonadherence to imatinib showed a significant decrease in 5-year event-free survival between 76.7% of adherent participants compared with 59.8% of nonadherent participants.1 This study found that 44% of patients who were adherent to imatinib achieved complete cytogenetic response vs only 26% of patients who were nonadherent. In another study of imatinib for CML, major molecular response (MMR) was strongly correlated with adherence and no patients with adherence < 80% were able to achieve MMR.2 Similarly, in studies of tamoxifen for breast cancer, < 80% adherence resulted in a 10% decrease in survival when compared to those who were more adherent.3,4
In addition to the clinical implications of nonadherence, there can be a significant cost associated with suboptimal use of these medications. The price of a single dose of OAN medication may cost as much as $440.5
The benefits of multidisciplinary care teams have been identified in many studies.6,7 While studies are limited in oncology, pharmacists provide vital contributions to the oncology multidisciplinary team when managing OANs as these health care professionals have expert knowledge of the medications, potential adverse events (AEs), and necessary monitoring parameters.8 In one study, patients seen by the pharmacist-led oral chemotherapy management program experienced improved clinical outcomes and response to therapy when compared with preintervention patients (early molecular response, 88.9% vs 54.8%, P = .01; major molecular response, 83.3% vs 57.6%, P = .06).9 During the study, 318 AEs were reported, leading to 235 pharmacist interventions to ameliorate AEs and improve adherence.
The primary objective of this study was to measure the impact of a pharmacist-driven OAN renewal clinic on medication adherence. The secondary objective was to estimate cost-savings of this new service.
Methods
Prior to July 2014, several limitations were identified related to OAN prescribing and monitoring at the Richard L. Roudebush Veterans Affairs Medical Center in Indianapolis, Indiana (RLRVAMC). The prescription ordering process relied primarily on the patient to initiate refills, rather than the prescriber OAN prescriptions also lacked consistency for number of refills or quantities dispensed. Furthermore, ordering of antineoplastic products was not limited to hematology/oncology providers. Patients were identified with significant supply on hand at the time of medication discontinuation, creating concerns for medication waste, tolerability, and nonadherence.
As a result, opportunities were identified to improve the prescribing process, recommended monitoring, toxicity and tolerability evaluation, medication reconciliation, and medication adherence. In July of 2014, the RLRVAMC adopted a new chemotherapy order entry system capable of restricting prescriptions to hematology/oncology providers and limiting dispensed quantities and refill amounts. A comprehensive pharmacist driven OAN renewal clinic was implemented on September 1, 2014 with the goal of improving long-term adherence and tolerability, in addition to minimizing medication waste.
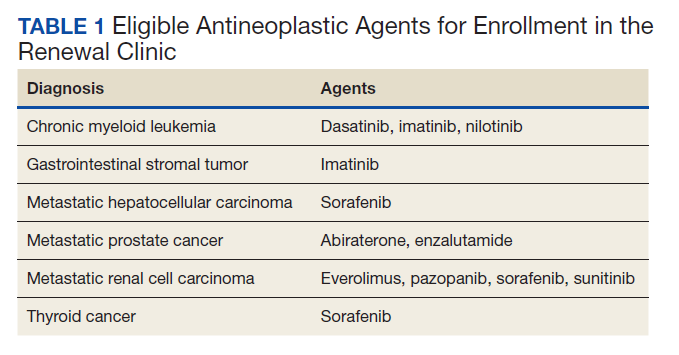
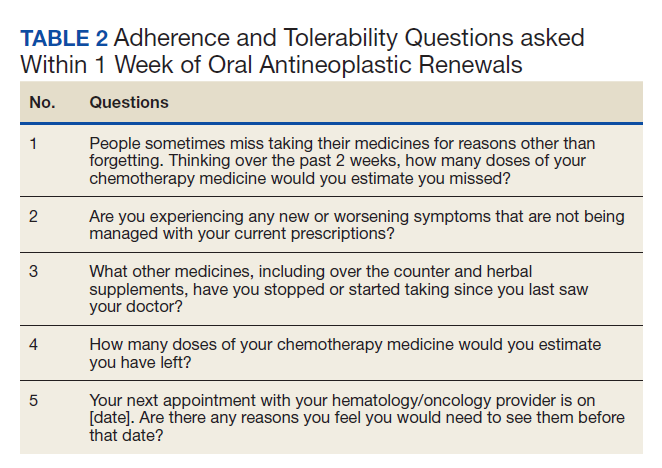
Patients were eligible for enrollment in the clinic if they had a cancer diagnosis and were concomitantly prescribed an OAN outlined in Table 1. All eligible patients were automatically enrolled in the clinic when they were deemed stable on their OAN by a hematology/oncology pharmacy specialist. Stability was defined as ≤ Grade 1 symptoms associated with the toxicities of OAN therapy managed with or without intervention as defined by the Common Terminology Criteria for Adverse Events (CTCAE) version 4.03. Once enrolled in the renewal clinic, patients were called by an oncology pharmacy resident (PGY2) 1 week prior to any OAN refill due date. Patients were asked a series of 5 adherence and tolerability questions (Table 2) to evaluate renewal criteria for approval or need for further evaluation. These questions were developed based on targeted information and published reports on monitoring adherence.10,11 Criteria for renewal included: < 10% self-reported missed doses of the OAN during the previous dispensing period, no hospitalizations or emergency department visits since most recent hematology/oncology provider appointment, no changes to concomitant medication therapies, and no new or worsening medication-related AEs. Patients meeting all criteria were given a 30-day supply of OAN. Prescribing, dispensing, and delivery of OAN were facilitated by the pharmacist. Patient cases that did not meet criteria for renewal were escalated to the hematology/oncology provider or oncology clinical pharmacy specialist for further evaluation.
Study Design and Setting
This was a pre/post retrospective cohort, quality improvement study of patients enrolled in the RLRVAMC OAN pharmacist renewal clinic. The study was deemed exempt from institutional review board (IRB) by the US Department of Veterans Affairs (VA) Research and Development Department.
Study Population
Patients were included in the preimplementation group if they had received at least 2 prescriptions of an eligible OAN. Therapy for the preimplementation group was required to be a monthly duration > 21 days and between the dates of September 1, 2013 and August 31, 2014. Patients were included in the postimplementation group if they had received at least 2 prescriptions of the studied OANs between September 1, 2014 and January 31, 2015. Patients were excluded if they had filled < 2 prescriptions of OAN; were managed by a non-VA oncologist or hematologist; or received an OAN other than those listed in Table 1.
Data Collection
For all patients in both the pre- and postimplementation cohorts, a standardized data collection tool was used to collect the following via electronic health record review by a PGY2 oncology resident: age, race, gender, oral antineoplastic agent, refill dates, days’ supply, estimated unit cost per dose cancer diagnosis, distance from the RLRVAMC, copay status, presence of hospitalizations/ED visits/dosage reductions, discontinuation rates, reasons for discontinuation, and total number of current prescriptions. The presence or absence of dosage reductions were collected to identify concerns for tolerability, but only the original dose for the preimplementation group and dosage at time of clinic enrollment for the postimplementation group was included in the analysis.
Outcomes and Statistical Analyses
The primary outcome was medication adherence defined as the median medication possession ratio (MPR) before and after implementation of the clinic. Secondary outcomes included the proportion of patients who were adherent from before implementation to after and estimated cost-savings of this clinic after implementation. MPR was used to estimate medication adherence by taking the cumulative day supply of medication on hand divided by the number of days on therapy.12 Number of days on therapy was determined by taking the difference on the start date of the new medication regimen and the discontinuation date of the same regimen. Patients were grouped by adherence into one of the following categories: < 0.8, 0.8 to 0.89, 0.9 to 1, and > 1.1. Patients were considered adherent if they reported taking ≥ 90% (MPR ≥ 0.9) of prescribed doses, adopted from the study by Anderson and colleagues.12 A patient with an MPR > 1, likely due to filling prior to the anticipated refill date, was considered 100% adherent (MPR = 1). If a patient switched OAN during the study, both agents were included as separate entities.
A conservative estimate of cost-savings was made by multiplying the RLRVAMC cost per unit of medication at time of initial prescription fill by the number of units taken each day multiplied by the total days’ supply on hand at time of therapy discontinuation. Patients with an MPR < 1 at time of therapy discontinuation were assumed to have zero remaining units on hand and zero cost savings was estimated. Waste, for purposes of cost-savings, was calculated for all MPR values > 1. Additional supply anticipated to be on hand from dose reductions was not included in the estimated cost of unused medication.
Descriptive statistics compared demographic characteristics between the pre- and postimplementation groups. MPR data were not normally distributed, which required the use of nonparametric Mann-Whitney U tests to compare pre- and postMPRs. Pearson χ2 compared the proportion of adherent patients between groups while descriptive statistics were used to estimate cost savings. Significance was determined based on a P value < .05. IBM SPSS Statistics software was used for all statistical analyses. As this was a complete sample of all eligible subjects, no sample size calculation was performed.
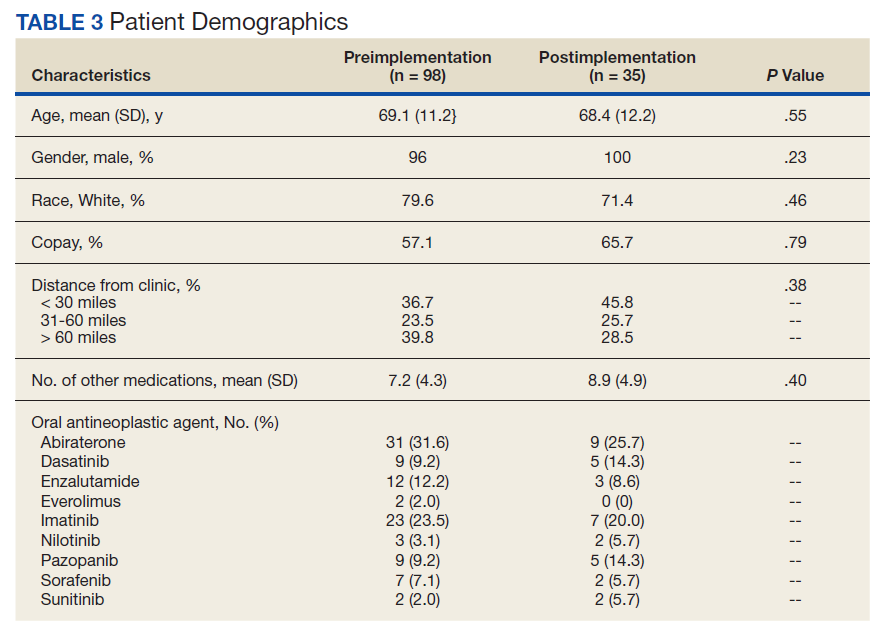
Results
In the preimplementation period, 246 patients received an OAN and 61 patients received an OAN in the postimplementation period (Figure 1). Of the 246 patients in the preimplementation period, 98 were eligible and included in the preimplementation group. Similarly, of the 61 patients in the postimplementation period, 35 patients met inclusion criteria for the postimplementation group. The study population was predominantly male with an average age of approximately 70 years in both groups (Table 3). More than 70% of the population in each group was White. No statistically significant differences between groups were identified. The most commonly prescribed OAN in the preimplementation group were abiraterone, imatinib, and enzalutamide (Table 3). In the postimplementation group, the most commonly prescribed agents were abiraterone, imatinib, pazopanib, and dasatinib. No significant differences were observed in prescribing of individual agents between the pre- and postimplementation groups or other characteristics that may affect adherence including patient copay status, number of concomitant medications, and driving distance from the RLRVAMC.
Thirty-six (36.7%) patients in the preimplementation group were considered nonadherent (MPR < 0.9) and 18 (18.4%) had an MPR < 0.8. Fifteen (15.3%) patients in the preimplementation clinic were considered overadherent (MPR > 1.1). Forty-seven (47.9%) patients in the preimplementation group were considered adherent (MPR 0.9 - 1.1) while all 35 (100%) patients in the postimplementation group were considered adherent (MPR 0.9 - 1.1). No non- or overadherent patients were identified in the postimplementation group (Figure 2). The median MPR for all patients in the preimplementation group was 0.94 compared with 1.06 (P < .001) in the postimplementation group.
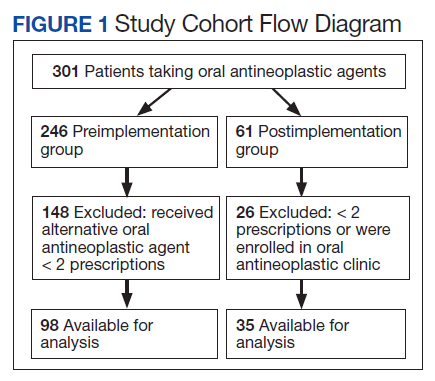
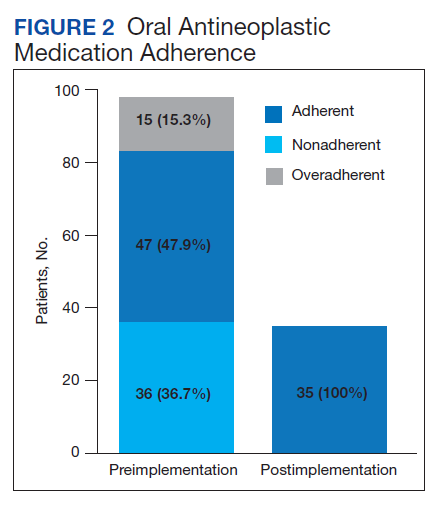
Thirty-five (35.7%) patients had therapy discontinued or held in the preimplementation group compared with 2 (5.7%) patients in the postimplementation group (P < .001). Reasons for discontinuation in the preimplementation group included disease progression (n = 27), death (n = 3), lost to follow up (n = 2), and intolerability of therapy (n = 3). Both patients that discontinued therapy in the postimplementation group did so due to disease progression. Of the 35 patients who had their OAN discontinued or held in the preimplementation group, 14 patients had excess supply on hand at time of discontinuation. The estimated value of the unused medication was $37,890. Nine (25%) of the 35 patients who discontinued therapy had a dosage reduction during the course of therapy and the additional supply was not included in the cost estimate. Similarly, 1 of the 2 patients in the postimplementation group had their OAN discontinued during study. The cost of oversupply of medication at the time of therapy discontinuation was estimated at $1,555. No patients in the postimplementation group had dose reductions. After implementation of the OAN renewal clinic, the total cost savings between pre ($37,890) and postimplementation ($1,555) groups was $36,355.
Discussion
OANs are widely used therapies, with more than 25 million doses administered per year in the United States alone.12 The use of these agents will continue to grow as more targeted agents become available and patients request more convenient treatment options. The role for hematology/oncology clinical pharmacy services must adapt to this increased usage of OANs, including increasing pharmacist involvement in medication education, adherence and tolerability assessments, and proactive drug interaction monitoring.However, additional research is needed to determine optimal management strategies.
Our study aimed to compare OAN adherence among patients at a tertiary care VA hospital before and after implementation of a renewal clinic. The preimplementation population had a median MPR of 0.94 compared with 1.06 in the postimplementation group (P < .001). Although an ideal MPR is 1.0, we aimed for a slightly higher MPR to allow a supply buffer in the event of prescription delivery delays, as more than 90% of prescriptions are mailed to patients from a regional mail-order pharmacy. Importantly, the median MPRs do not adequately convey the impact from this clinic. The proportion of patients who were considered adherent to OANs increased from 47.9% in the preimplementation to 100% in the postimplementation period. These finding suggest that the clinical pharmacist role to assess and encourage adherence through monitoring tolerability of these OANs improved the overall medication taking experience of these patients.
Upon initial evaluation of adherence pre- and postimplementation, median adherence rates in both groups appeared to be above goal at 0.94 and 1.06 respectively. Patients in the postimplementation group intentionally received a 5- to 7-day supply buffer to account for potential prescription delivery delays due to holidays and inclement weather. This would indicate that the patients in the postimplementation group would have 15% oversupply due to the 5-day supply buffer. After correcting for patients with confounding reasons for excess (dose reductions, breaks in treatment, etc.), the median MPR in the prerefill clinic group decreased to 0.9 and the MPR in the postrefill clinic group increased slightly to 1.08. Although the median adherence rate in both the pre- and postimplementation groups were above goal of 0.90, 36% of the patients in the preimplementation group were considered nonadherent (MPR < 0.9) compared with no patients in the postimplementation group. Therefore, our intervention to improve patient adherence appeared to be beneficial at our institution.
In addition to improving adherence, one of the goals of the renewal clinic was to minimize excess supply at the time of therapy discontinuation. This was accomplished by aligning medication fills with medical visits and objective monitoring, as well as limiting supply to no more than 30 days. Of the patients in the postimplementation group, only 1 patient had remaining medication at the time of therapy discontinuation compared with 14 patients in the preimplementation group. The estimated cost savings from excess supply was $36,335. Limiting the amount of unused supply not only saves money for the patient and the institution, but also decreases opportunity for improper hazardous waste disposal and unnecessary exposure of hazardous materials to others.
Our results show the pharmacist intervention in the coordination of renewals improved adherence, minimized medication waste, and saved money. The cost of pharmacist time participating in the refill clinic was not calculated. Each visit was completed in approximately 5 minutes, with subsequent documentation and coordination taking an additional 5 to 10 minutes. During the launch of this service, the oncology pharmacy resident provided all coverage of the clinic. Oversite of the resident was provided by hematology/oncology clinical pharmacy specialists. We have continued to utilize pharmacy resident coverage since that time to meet education needs and keep the estimated cost per visit low. Another option in the case that pharmacy residents are not available would be utilization of a pharmacy technician, intern, or professional student to conduct the adherence and tolerability phone assessments. Our escalation protocol allows intervention by clinical pharmacy specialist and/or other health care providers when necessary. Trainees have only required basic training on how to use the protocol.
Limitations
Due to this study’s retrospective design, an inherent limitation is dependence on prescriber and refill records for documentation of initiation and discontinuation dates. Therefore, only the association of impact of pharmacist intervention on medication adherence can be determined as opposed to causation. We did not take into account discrepancies in day supply secondary to ‘held’ therapies, dose reductions, or doses supplied during an inpatient admission, which may alter estimates of MPR and cost-savings data. Patients in the postimplementation group intentionally received a 5 to 7-day supply buffer to account for potential prescription delivery delays due to holidays and inclement weather. This would indicate that the patients in the postimplementation group would have 15% oversupply due to the 5-day supply buffer, thereby skewing MPR values. This study did not account for cost avoidance resulting from early identification and management of toxicity. Finally, the postimplementation data only spans 4 months and a longer duration of time is needed to more accurately determine sustainability of renewal clinic interventions and provide comprehensive evaluation of cost-avoidance.
Conclusion
Implementation of an OAN renewal clinic was associated with an increase in MPR, improved proportion of patients considered adherent, and an estimated $36,335 cost-savings. However, prospective evaluation and a longer study duration are needed to determine causality of improved adherence and cost-savings associated with a pharmacist-driven OAN renewal clinic.
1. Ganesan P, Sagar TG, Dubashi B, et al. Nonadherence to imatinib adversely affects event free survival in chronic phase chronic myeloid leukemia. Am J Hematol 2011; 86: 471-474. doi:10.1002/ajh.22019
2. Marin D, Bazeos A, Mahon FX, et al. Adherence is the critical factor for achieving molecular responses in patients with chronic myeloid leukemia who achieve complete cytogenetic responses on imatinib. J Clin Oncol 2010; 28: 2381-2388. doi:10.1200/JCO.2009.26.3087
3. McCowan C, Shearer J, Donnan PT, et al. Cohort study examining tamoxifen adherence and its relationship to mortality in women with breast cancer. Br J Cancer 2008; 99: 1763-1768. doi:10.1038/sj.bjc.6604758
4. Lexicomp Online. Sunitinib. Hudson, Ohio: Lexi-Comp, Inc; August 20, 2019.
5. Babiker A, El Husseini M, Al Nemri A, et al. Health care professional development: Working as a team to improve patient care. Sudan J Paediatr. 2014;14(2):9-16.
6. Spence MM, Makarem AF, Reyes SL, et al. Evaluation of an outpatient pharmacy clinical services program on adherence and clinical outcomes among patients with diabetes and/or coronary artery disease. J Manag Care Spec Pharm. 2014;20(10):1036-1045. doi:10.18553/jmcp.2014.20.10.1036
7. Holle LM, Puri S, Clement JM. Physician-pharmacist collaboration for oral chemotherapy monitoring: Insights from an academic genitourinary oncology practice. J Oncol Pharm Pract 2015; doi:10.1177/1078155215581524
8. Muluneh B, Schneider M, Faso A, et al. Improved Adherence Rates and Clinical Outcomes of an Integrated, Closed-Loop, Pharmacist-Led Oral Chemotherapy Management Program. Journal of Oncology Practice. 2018;14(6):371-333. doi:10.1200/JOP.17.00039.
9. Font R, Espinas JA, Gil-Gil M, et al. Prescription refill, patient self-report and physician report in assessing adherence to oral endocrine therapy in early breast cancer patients: a retrospective cohort study in Catalonia, Spain. British Journal of Cancer. 2012 ;107(8):1249-1256. doi:10.1038/bjc.2012.389.
10. Anderson KR, Chambers CR, Lam N, et al. Medication adherence among adults prescribed imatinib, dasatinib, or nilotinib for the treatment of chronic myeloid leukemia. J Oncol Pharm Practice. 2015;21(1):19–25. doi:10.1177/1078155213520261
11. Weingart SN, Brown E, Bach PB, et al. NCCN Task Force Report: oral chemotherapy. J Natl Compr Canc Netw. 2008;6(3): S1-S14.
Evaluation of oral antineoplastic agent (OAN) adherence patterns have identified correlations between nonadherence or over-adherence and poorer disease-related outcomes. Multiple studies have focused on imatinib use in chronic myeloid leukemia (CML) due to its continuous, long-term use. A study by Ganesan and colleagues found that nonadherence to imatinib showed a significant decrease in 5-year event-free survival between 76.7% of adherent participants compared with 59.8% of nonadherent participants.1 This study found that 44% of patients who were adherent to imatinib achieved complete cytogenetic response vs only 26% of patients who were nonadherent. In another study of imatinib for CML, major molecular response (MMR) was strongly correlated with adherence and no patients with adherence < 80% were able to achieve MMR.2 Similarly, in studies of tamoxifen for breast cancer, < 80% adherence resulted in a 10% decrease in survival when compared to those who were more adherent.3,4
In addition to the clinical implications of nonadherence, there can be a significant cost associated with suboptimal use of these medications. The price of a single dose of OAN medication may cost as much as $440.5
The benefits of multidisciplinary care teams have been identified in many studies.6,7 While studies are limited in oncology, pharmacists provide vital contributions to the oncology multidisciplinary team when managing OANs as these health care professionals have expert knowledge of the medications, potential adverse events (AEs), and necessary monitoring parameters.8 In one study, patients seen by the pharmacist-led oral chemotherapy management program experienced improved clinical outcomes and response to therapy when compared with preintervention patients (early molecular response, 88.9% vs 54.8%, P = .01; major molecular response, 83.3% vs 57.6%, P = .06).9 During the study, 318 AEs were reported, leading to 235 pharmacist interventions to ameliorate AEs and improve adherence.
The primary objective of this study was to measure the impact of a pharmacist-driven OAN renewal clinic on medication adherence. The secondary objective was to estimate cost-savings of this new service.
Methods
Prior to July 2014, several limitations were identified related to OAN prescribing and monitoring at the Richard L. Roudebush Veterans Affairs Medical Center in Indianapolis, Indiana (RLRVAMC). The prescription ordering process relied primarily on the patient to initiate refills, rather than the prescriber OAN prescriptions also lacked consistency for number of refills or quantities dispensed. Furthermore, ordering of antineoplastic products was not limited to hematology/oncology providers. Patients were identified with significant supply on hand at the time of medication discontinuation, creating concerns for medication waste, tolerability, and nonadherence.
As a result, opportunities were identified to improve the prescribing process, recommended monitoring, toxicity and tolerability evaluation, medication reconciliation, and medication adherence. In July of 2014, the RLRVAMC adopted a new chemotherapy order entry system capable of restricting prescriptions to hematology/oncology providers and limiting dispensed quantities and refill amounts. A comprehensive pharmacist driven OAN renewal clinic was implemented on September 1, 2014 with the goal of improving long-term adherence and tolerability, in addition to minimizing medication waste.
Patients were eligible for enrollment in the clinic if they had a cancer diagnosis and were concomitantly prescribed an OAN outlined in Table 1. All eligible patients were automatically enrolled in the clinic when they were deemed stable on their OAN by a hematology/oncology pharmacy specialist. Stability was defined as ≤ Grade 1 symptoms associated with the toxicities of OAN therapy managed with or without intervention as defined by the Common Terminology Criteria for Adverse Events (CTCAE) version 4.03. Once enrolled in the renewal clinic, patients were called by an oncology pharmacy resident (PGY2) 1 week prior to any OAN refill due date. Patients were asked a series of 5 adherence and tolerability questions (Table 2) to evaluate renewal criteria for approval or need for further evaluation. These questions were developed based on targeted information and published reports on monitoring adherence.10,11 Criteria for renewal included: < 10% self-reported missed doses of the OAN during the previous dispensing period, no hospitalizations or emergency department visits since most recent hematology/oncology provider appointment, no changes to concomitant medication therapies, and no new or worsening medication-related AEs. Patients meeting all criteria were given a 30-day supply of OAN. Prescribing, dispensing, and delivery of OAN were facilitated by the pharmacist. Patient cases that did not meet criteria for renewal were escalated to the hematology/oncology provider or oncology clinical pharmacy specialist for further evaluation.
Study Design and Setting
This was a pre/post retrospective cohort, quality improvement study of patients enrolled in the RLRVAMC OAN pharmacist renewal clinic. The study was deemed exempt from institutional review board (IRB) by the US Department of Veterans Affairs (VA) Research and Development Department.
Study Population
Patients were included in the preimplementation group if they had received at least 2 prescriptions of an eligible OAN. Therapy for the preimplementation group was required to be a monthly duration > 21 days and between the dates of September 1, 2013 and August 31, 2014. Patients were included in the postimplementation group if they had received at least 2 prescriptions of the studied OANs between September 1, 2014 and January 31, 2015. Patients were excluded if they had filled < 2 prescriptions of OAN; were managed by a non-VA oncologist or hematologist; or received an OAN other than those listed in Table 1.
Data Collection
For all patients in both the pre- and postimplementation cohorts, a standardized data collection tool was used to collect the following via electronic health record review by a PGY2 oncology resident: age, race, gender, oral antineoplastic agent, refill dates, days’ supply, estimated unit cost per dose cancer diagnosis, distance from the RLRVAMC, copay status, presence of hospitalizations/ED visits/dosage reductions, discontinuation rates, reasons for discontinuation, and total number of current prescriptions. The presence or absence of dosage reductions were collected to identify concerns for tolerability, but only the original dose for the preimplementation group and dosage at time of clinic enrollment for the postimplementation group was included in the analysis.
Outcomes and Statistical Analyses
The primary outcome was medication adherence defined as the median medication possession ratio (MPR) before and after implementation of the clinic. Secondary outcomes included the proportion of patients who were adherent from before implementation to after and estimated cost-savings of this clinic after implementation. MPR was used to estimate medication adherence by taking the cumulative day supply of medication on hand divided by the number of days on therapy.12 Number of days on therapy was determined by taking the difference on the start date of the new medication regimen and the discontinuation date of the same regimen. Patients were grouped by adherence into one of the following categories: < 0.8, 0.8 to 0.89, 0.9 to 1, and > 1.1. Patients were considered adherent if they reported taking ≥ 90% (MPR ≥ 0.9) of prescribed doses, adopted from the study by Anderson and colleagues.12 A patient with an MPR > 1, likely due to filling prior to the anticipated refill date, was considered 100% adherent (MPR = 1). If a patient switched OAN during the study, both agents were included as separate entities.
A conservative estimate of cost-savings was made by multiplying the RLRVAMC cost per unit of medication at time of initial prescription fill by the number of units taken each day multiplied by the total days’ supply on hand at time of therapy discontinuation. Patients with an MPR < 1 at time of therapy discontinuation were assumed to have zero remaining units on hand and zero cost savings was estimated. Waste, for purposes of cost-savings, was calculated for all MPR values > 1. Additional supply anticipated to be on hand from dose reductions was not included in the estimated cost of unused medication.
Descriptive statistics compared demographic characteristics between the pre- and postimplementation groups. MPR data were not normally distributed, which required the use of nonparametric Mann-Whitney U tests to compare pre- and postMPRs. Pearson χ2 compared the proportion of adherent patients between groups while descriptive statistics were used to estimate cost savings. Significance was determined based on a P value < .05. IBM SPSS Statistics software was used for all statistical analyses. As this was a complete sample of all eligible subjects, no sample size calculation was performed.
Results
In the preimplementation period, 246 patients received an OAN and 61 patients received an OAN in the postimplementation period (Figure 1). Of the 246 patients in the preimplementation period, 98 were eligible and included in the preimplementation group. Similarly, of the 61 patients in the postimplementation period, 35 patients met inclusion criteria for the postimplementation group. The study population was predominantly male with an average age of approximately 70 years in both groups (Table 3). More than 70% of the population in each group was White. No statistically significant differences between groups were identified. The most commonly prescribed OAN in the preimplementation group were abiraterone, imatinib, and enzalutamide (Table 3). In the postimplementation group, the most commonly prescribed agents were abiraterone, imatinib, pazopanib, and dasatinib. No significant differences were observed in prescribing of individual agents between the pre- and postimplementation groups or other characteristics that may affect adherence including patient copay status, number of concomitant medications, and driving distance from the RLRVAMC.
Thirty-six (36.7%) patients in the preimplementation group were considered nonadherent (MPR < 0.9) and 18 (18.4%) had an MPR < 0.8. Fifteen (15.3%) patients in the preimplementation clinic were considered overadherent (MPR > 1.1). Forty-seven (47.9%) patients in the preimplementation group were considered adherent (MPR 0.9 - 1.1) while all 35 (100%) patients in the postimplementation group were considered adherent (MPR 0.9 - 1.1). No non- or overadherent patients were identified in the postimplementation group (Figure 2). The median MPR for all patients in the preimplementation group was 0.94 compared with 1.06 (P < .001) in the postimplementation group.
Thirty-five (35.7%) patients had therapy discontinued or held in the preimplementation group compared with 2 (5.7%) patients in the postimplementation group (P < .001). Reasons for discontinuation in the preimplementation group included disease progression (n = 27), death (n = 3), lost to follow up (n = 2), and intolerability of therapy (n = 3). Both patients that discontinued therapy in the postimplementation group did so due to disease progression. Of the 35 patients who had their OAN discontinued or held in the preimplementation group, 14 patients had excess supply on hand at time of discontinuation. The estimated value of the unused medication was $37,890. Nine (25%) of the 35 patients who discontinued therapy had a dosage reduction during the course of therapy and the additional supply was not included in the cost estimate. Similarly, 1 of the 2 patients in the postimplementation group had their OAN discontinued during study. The cost of oversupply of medication at the time of therapy discontinuation was estimated at $1,555. No patients in the postimplementation group had dose reductions. After implementation of the OAN renewal clinic, the total cost savings between pre ($37,890) and postimplementation ($1,555) groups was $36,355.
Discussion
OANs are widely used therapies, with more than 25 million doses administered per year in the United States alone.12 The use of these agents will continue to grow as more targeted agents become available and patients request more convenient treatment options. The role for hematology/oncology clinical pharmacy services must adapt to this increased usage of OANs, including increasing pharmacist involvement in medication education, adherence and tolerability assessments, and proactive drug interaction monitoring.However, additional research is needed to determine optimal management strategies.
Our study aimed to compare OAN adherence among patients at a tertiary care VA hospital before and after implementation of a renewal clinic. The preimplementation population had a median MPR of 0.94 compared with 1.06 in the postimplementation group (P < .001). Although an ideal MPR is 1.0, we aimed for a slightly higher MPR to allow a supply buffer in the event of prescription delivery delays, as more than 90% of prescriptions are mailed to patients from a regional mail-order pharmacy. Importantly, the median MPRs do not adequately convey the impact from this clinic. The proportion of patients who were considered adherent to OANs increased from 47.9% in the preimplementation to 100% in the postimplementation period. These finding suggest that the clinical pharmacist role to assess and encourage adherence through monitoring tolerability of these OANs improved the overall medication taking experience of these patients.
Upon initial evaluation of adherence pre- and postimplementation, median adherence rates in both groups appeared to be above goal at 0.94 and 1.06 respectively. Patients in the postimplementation group intentionally received a 5- to 7-day supply buffer to account for potential prescription delivery delays due to holidays and inclement weather. This would indicate that the patients in the postimplementation group would have 15% oversupply due to the 5-day supply buffer. After correcting for patients with confounding reasons for excess (dose reductions, breaks in treatment, etc.), the median MPR in the prerefill clinic group decreased to 0.9 and the MPR in the postrefill clinic group increased slightly to 1.08. Although the median adherence rate in both the pre- and postimplementation groups were above goal of 0.90, 36% of the patients in the preimplementation group were considered nonadherent (MPR < 0.9) compared with no patients in the postimplementation group. Therefore, our intervention to improve patient adherence appeared to be beneficial at our institution.
In addition to improving adherence, one of the goals of the renewal clinic was to minimize excess supply at the time of therapy discontinuation. This was accomplished by aligning medication fills with medical visits and objective monitoring, as well as limiting supply to no more than 30 days. Of the patients in the postimplementation group, only 1 patient had remaining medication at the time of therapy discontinuation compared with 14 patients in the preimplementation group. The estimated cost savings from excess supply was $36,335. Limiting the amount of unused supply not only saves money for the patient and the institution, but also decreases opportunity for improper hazardous waste disposal and unnecessary exposure of hazardous materials to others.
Our results show the pharmacist intervention in the coordination of renewals improved adherence, minimized medication waste, and saved money. The cost of pharmacist time participating in the refill clinic was not calculated. Each visit was completed in approximately 5 minutes, with subsequent documentation and coordination taking an additional 5 to 10 minutes. During the launch of this service, the oncology pharmacy resident provided all coverage of the clinic. Oversite of the resident was provided by hematology/oncology clinical pharmacy specialists. We have continued to utilize pharmacy resident coverage since that time to meet education needs and keep the estimated cost per visit low. Another option in the case that pharmacy residents are not available would be utilization of a pharmacy technician, intern, or professional student to conduct the adherence and tolerability phone assessments. Our escalation protocol allows intervention by clinical pharmacy specialist and/or other health care providers when necessary. Trainees have only required basic training on how to use the protocol.
Limitations
Due to this study’s retrospective design, an inherent limitation is dependence on prescriber and refill records for documentation of initiation and discontinuation dates. Therefore, only the association of impact of pharmacist intervention on medication adherence can be determined as opposed to causation. We did not take into account discrepancies in day supply secondary to ‘held’ therapies, dose reductions, or doses supplied during an inpatient admission, which may alter estimates of MPR and cost-savings data. Patients in the postimplementation group intentionally received a 5 to 7-day supply buffer to account for potential prescription delivery delays due to holidays and inclement weather. This would indicate that the patients in the postimplementation group would have 15% oversupply due to the 5-day supply buffer, thereby skewing MPR values. This study did not account for cost avoidance resulting from early identification and management of toxicity. Finally, the postimplementation data only spans 4 months and a longer duration of time is needed to more accurately determine sustainability of renewal clinic interventions and provide comprehensive evaluation of cost-avoidance.
Conclusion
Implementation of an OAN renewal clinic was associated with an increase in MPR, improved proportion of patients considered adherent, and an estimated $36,335 cost-savings. However, prospective evaluation and a longer study duration are needed to determine causality of improved adherence and cost-savings associated with a pharmacist-driven OAN renewal clinic.
1. Ganesan P, Sagar TG, Dubashi B, et al. Nonadherence to imatinib adversely affects event free survival in chronic phase chronic myeloid leukemia. Am J Hematol 2011; 86: 471-474. doi:10.1002/ajh.22019
2. Marin D, Bazeos A, Mahon FX, et al. Adherence is the critical factor for achieving molecular responses in patients with chronic myeloid leukemia who achieve complete cytogenetic responses on imatinib. J Clin Oncol 2010; 28: 2381-2388. doi:10.1200/JCO.2009.26.3087
3. McCowan C, Shearer J, Donnan PT, et al. Cohort study examining tamoxifen adherence and its relationship to mortality in women with breast cancer. Br J Cancer 2008; 99: 1763-1768. doi:10.1038/sj.bjc.6604758
4. Lexicomp Online. Sunitinib. Hudson, Ohio: Lexi-Comp, Inc; August 20, 2019.
5. Babiker A, El Husseini M, Al Nemri A, et al. Health care professional development: Working as a team to improve patient care. Sudan J Paediatr. 2014;14(2):9-16.
6. Spence MM, Makarem AF, Reyes SL, et al. Evaluation of an outpatient pharmacy clinical services program on adherence and clinical outcomes among patients with diabetes and/or coronary artery disease. J Manag Care Spec Pharm. 2014;20(10):1036-1045. doi:10.18553/jmcp.2014.20.10.1036
7. Holle LM, Puri S, Clement JM. Physician-pharmacist collaboration for oral chemotherapy monitoring: Insights from an academic genitourinary oncology practice. J Oncol Pharm Pract 2015; doi:10.1177/1078155215581524
8. Muluneh B, Schneider M, Faso A, et al. Improved Adherence Rates and Clinical Outcomes of an Integrated, Closed-Loop, Pharmacist-Led Oral Chemotherapy Management Program. Journal of Oncology Practice. 2018;14(6):371-333. doi:10.1200/JOP.17.00039.
9. Font R, Espinas JA, Gil-Gil M, et al. Prescription refill, patient self-report and physician report in assessing adherence to oral endocrine therapy in early breast cancer patients: a retrospective cohort study in Catalonia, Spain. British Journal of Cancer. 2012 ;107(8):1249-1256. doi:10.1038/bjc.2012.389.
10. Anderson KR, Chambers CR, Lam N, et al. Medication adherence among adults prescribed imatinib, dasatinib, or nilotinib for the treatment of chronic myeloid leukemia. J Oncol Pharm Practice. 2015;21(1):19–25. doi:10.1177/1078155213520261
11. Weingart SN, Brown E, Bach PB, et al. NCCN Task Force Report: oral chemotherapy. J Natl Compr Canc Netw. 2008;6(3): S1-S14.
Role of Speech Pathology in a Multidisciplinary Approach to a Patient With Mild Traumatic Brain Injury
Speech-language pathologists can fill a unique need in the treatment of patients with several conditions that are seen regularly in primary care.
Speech-language pathologists (SLPs) are integral to the comprehensive treatment of mild traumatic brain injury (mTBI), yet the evaluation and treatment options they offer may not be known to all primary care providers (PCPs). As the research on the management and treatment of mTBI continues to evolve, the PCPs role in referring patients with mTBI to the appropriate resources becomes imperative.
mTBI is a common injury in both military and civilian settings, but it can be difficult to diagnose and is not always well understood. Long-term debilitating effects have been associated with mTBI, with literature linking it to an increased risk of developing Alzheimer disease, motor neuron disease, and Parkinson disease.1 In addition, mTBI is a strong predictor for the development of posttraumatic stress disorder (PTSD). Among returning Iraq and Afghanistan service members, the incidence of mTBI associated mental health conditions have been reported to be as high as 22.8%, affecting > 320,000 veterans.2-5
The US Department of Veteran Affairs (VA) health care system offers these returning veterans a comprehensive, multidisciplinary treatment strategy. The care is often coordinated by the veteran’s patient aligned care team (PACT) that consists of a PCP, nurses, and a medical support associate. The US Department of Defense (DoD) and VA also facilitated the development of a clinical practice guideline (CPG) that can be used by the PACT and other health care providers to support evidence based patient-centered care. This CPG is extensive and has recommendations for evaluation and treatment of mTBI and the symptoms associated such as impaired memory and alterations in executive function.6
The following hypothetical case is based on an actual patient. This case illustrates the role of speech pathology in caring for patients with mTBI.
Case Presentation
A 25-year-old male combat veteran presented to his VA PACT team for a new patient visit. As part of the screening of his medical history, mTBI was fully defined for the patient to include “alteration” in consciousness. This reminded the patient of an injury that occurred 1 year prior to presentation during a routine convoy mission. He was riding in the back of a Humvee when it hit a large pothole slamming his head into the side of the vehicle. He reported that he felt “dazed and dizzy” with “ringing” in his ears immediately following the event, without an overt loss of consciousness. He was unable to seek medical attention secondary to the urgency of the convoy mission, so he “shook it off” and kept going. Later that week he noted headache and insomnia. He was seen and evaluated by his health care provider for insomnia, but when questioned he reported no head trauma as he had forgotten the incident. Upon follow-up with his PCP, he reported his headaches were manageable, and his insomnia was somewhat improved with recommended life-style modifications and good sleep hygiene.
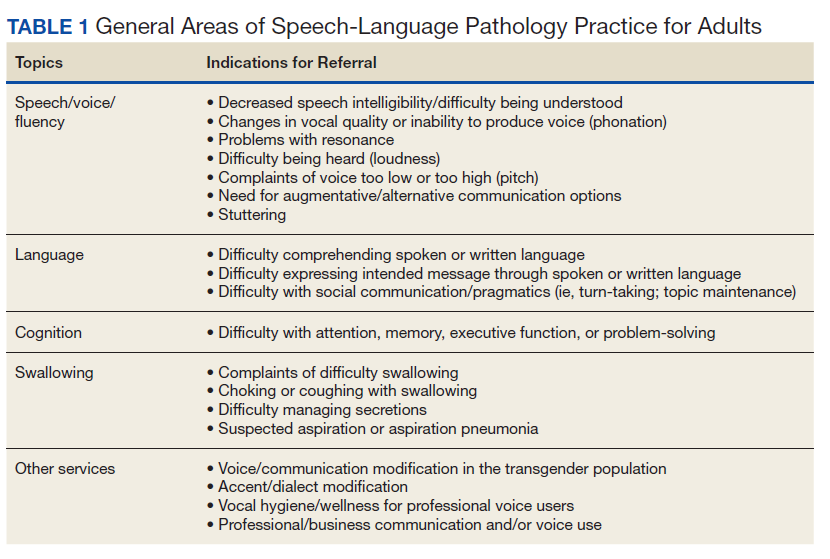
He still had frequent headaches, dizziness, and some insomnia. However, his chief concern was that he was struggling with new schoolwork. He noted that he was a straight-A student prior to his military service. A review of his medical history in his medical chart showed that a previous PCP had treated his associated symptoms of insomnia and headache without improvement. In addition, he had recently been diagnosed with PTSD. As his symptoms had lasted > 90 days, not resolved with initial treatment in primary care, and were causing a significant impact on his activities of daily living, his PCP placed a consult to Speech Pathology for cognitive-linguistic assessment and treatment, if indicated, noting that he may have had a mTBI.6 Although not intended to be comprehensive, Table 1 describes several clinical areas where a speech pathology referral may be appropriate.
The Role of the Speech-Language Pathologist
The speech-language pathologist takes an additional history of the patient. This better quantifies specific details of the veteran’s functional concerns pertaining to possible difficulty with attention, memory, executive function, visuospatial awareness, etc. Examples might include difficulty with attention/memory, including not remembering what to get at the store, forgetting to take medications, forgetting appointments, and difficulty in school, among many others. Reports of feeling “stupid” also are common. Assessment varies by clinician, but it is not uncommon for the SLP to administer a battery of evaluations to help identify a range of possible impairments. Choosing testing that is sensitive to even mild impairment is important and should be used in combination with subjective complaints. Mild deficits can sometimes be missed in those with average performance, but whose premorbid intelligence was above average. One combination of test batteries sometimes utilized is the Wechsler Test of Adult Reading (WTAR), the Repeatable Battery for the Assessment of Neuropsychological Status (RBANS), the Ruff Figural Fluency Test (RFFT), the Controlled Oral Word Association Test (COWAT), and Trails A and B (Table 2).
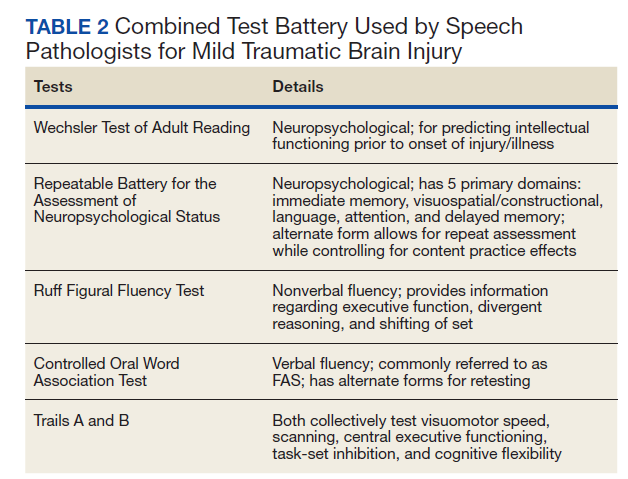
The initial testing results are discussed with the veteran. If patient concerns and/or testing reveal impairment that is amenable to treatment and the veteran wishes to proceed, subsequent treatment sessions are scheduled. The first treatment session is spent establishing and prioritizing functional goals specific to that individual and their needs (eg, for daily life, work, school). In a case of subacute or older mTBI, as is often seen in veterans coming to the VA, intervention often targets strategies and techniques that can help the individual compensate for current deficits.
Many patients already own a smartphone, so this device often is used functionally as a cognitive prosthetic as early as the first treatment session. In an effort to immediately start addressing important issues like medication management and attending appointments, the veteran is educated to the benefit of entering important information into the calendar and/or reminder apps on their phone and setting associated alarms that would serve as a reminder for what was entered. Patients are often encouraged by the positive impact of these initial strategies and look forward to future treatment sessions to address compensation for their functional deficits.
If a veteran with TBI has numerous needs, it can be beneficial for the care team to discuss the care plan at an interdisciplinary team meeting. It is not uncommon for veterans like the one discussed above to be referred to neurology (persistent headaches and further neurological evaluation); mental health (PTSD treatment and family support/counseling options); occupational therapy (visuospatial needs); and audiology (vestibular concerns). Social work involvement is often extremely beneficial for coordination of care in more complex cases. If patient is having difficulty making healthy eating choices or with meal preparation, a consult to a dietitian may prove invaluable. Concerns related to trouble with medication adherence (beyond memory-related adherence issues that speech pathology would address) or polypharmacy can be directed to a clinical pharmacy specialist, who could prepare a medication chart, review optimal medication timing, and provide education on adverse effects. A veteran's communication with the team can be facilitated through secure messaging (a method of secure emailing) and encouraging use of the My HealtheVet portal. With this modality, patients could review chart notes and results and share them with non-VA health care providers and/or family members as indicated.
A whole health approach also may appeal to some mTBI patients. This approach focuses on the totality of patient needs for healthy living and on patient-centered goal setting. Services provided may differ at various VA medical centers, but the PACT team can connect the veteran to the services of interest.
Conclusions
A team approach to veterans with mTBI provides a comprehensive way to treat the various problems associated with the condition. Further research into the role of multidisciplinary teams in the management of mTBI was recommended in the 2016 CPG.6 The unique role that the speech-language pathologist plays as part of this team has been highlighted, as it is important that PCP’s be aware of the extent of evaluation and treatment services they offer. Beyond mTBI, speech pathologists evaluate and treat patients with several conditions that are seen regularly in primary care.
1. McKee AC, Robinson ME. Military-related traumatic brain injury and neurodegeneration. Alzheimers Dement. 2014;10(3 suppl):S242-S253. doi:10.1016/j.jalz.2014.04.003
2. Yurgil KA, Barkauskas DA, Vasterling JJ, et al. Association between traumatic brain injury and risk of posttraumatic stress disorder in active-duty Marines. JAMA Psychiatry. 2014;71(2):149-157. doi:10.1001/jamapsychiatry.2013.3080
3. Chin DL, Zeber JE. Mental Health Outcomes Among Military Service Members After Severe Injury in Combat and TBI. Mil Med. 2020;185(5-6):e711-e718. doi:10.1093/milmed/usz440
4. Hoge CW, Auchterlonie JL, Milliken CS. Mental health problems, use of mental health services, and attrition from military service after returning from deployment to Iraq or Afghanistan. JAMA. 2006;295(9):1023-1032. doi:10.1001/jama.295.9.1023
5. Miles SR, Harik JM, Hundt NE, et al. Delivery of mental health treatment to combat veterans with psychiatric diagnoses and TBI histories. PLoS One. 2017;12(9):e0184265. Published 2017 Sep 8. doi:10.1371/journal.pone.0184265
6. US Department of Defense, US Department of Veterans Affairs; Management of Concussion/mTBI Working Group. VA/DoD clinical practice guideline for management of concussion/mild traumatic brain injury. Version 2.0. Published February 2016. Accessed February 8, 2021. https://www.healthquality.va.gov/guidelines/Rehab/mtbi/mTBICPGFullCPG50821816.pdf
Speech-language pathologists can fill a unique need in the treatment of patients with several conditions that are seen regularly in primary care.
Speech-language pathologists can fill a unique need in the treatment of patients with several conditions that are seen regularly in primary care.
Speech-language pathologists (SLPs) are integral to the comprehensive treatment of mild traumatic brain injury (mTBI), yet the evaluation and treatment options they offer may not be known to all primary care providers (PCPs). As the research on the management and treatment of mTBI continues to evolve, the PCPs role in referring patients with mTBI to the appropriate resources becomes imperative.
mTBI is a common injury in both military and civilian settings, but it can be difficult to diagnose and is not always well understood. Long-term debilitating effects have been associated with mTBI, with literature linking it to an increased risk of developing Alzheimer disease, motor neuron disease, and Parkinson disease.1 In addition, mTBI is a strong predictor for the development of posttraumatic stress disorder (PTSD). Among returning Iraq and Afghanistan service members, the incidence of mTBI associated mental health conditions have been reported to be as high as 22.8%, affecting > 320,000 veterans.2-5
The US Department of Veteran Affairs (VA) health care system offers these returning veterans a comprehensive, multidisciplinary treatment strategy. The care is often coordinated by the veteran’s patient aligned care team (PACT) that consists of a PCP, nurses, and a medical support associate. The US Department of Defense (DoD) and VA also facilitated the development of a clinical practice guideline (CPG) that can be used by the PACT and other health care providers to support evidence based patient-centered care. This CPG is extensive and has recommendations for evaluation and treatment of mTBI and the symptoms associated such as impaired memory and alterations in executive function.6
The following hypothetical case is based on an actual patient. This case illustrates the role of speech pathology in caring for patients with mTBI.
Case Presentation
A 25-year-old male combat veteran presented to his VA PACT team for a new patient visit. As part of the screening of his medical history, mTBI was fully defined for the patient to include “alteration” in consciousness. This reminded the patient of an injury that occurred 1 year prior to presentation during a routine convoy mission. He was riding in the back of a Humvee when it hit a large pothole slamming his head into the side of the vehicle. He reported that he felt “dazed and dizzy” with “ringing” in his ears immediately following the event, without an overt loss of consciousness. He was unable to seek medical attention secondary to the urgency of the convoy mission, so he “shook it off” and kept going. Later that week he noted headache and insomnia. He was seen and evaluated by his health care provider for insomnia, but when questioned he reported no head trauma as he had forgotten the incident. Upon follow-up with his PCP, he reported his headaches were manageable, and his insomnia was somewhat improved with recommended life-style modifications and good sleep hygiene.
He still had frequent headaches, dizziness, and some insomnia. However, his chief concern was that he was struggling with new schoolwork. He noted that he was a straight-A student prior to his military service. A review of his medical history in his medical chart showed that a previous PCP had treated his associated symptoms of insomnia and headache without improvement. In addition, he had recently been diagnosed with PTSD. As his symptoms had lasted > 90 days, not resolved with initial treatment in primary care, and were causing a significant impact on his activities of daily living, his PCP placed a consult to Speech Pathology for cognitive-linguistic assessment and treatment, if indicated, noting that he may have had a mTBI.6 Although not intended to be comprehensive, Table 1 describes several clinical areas where a speech pathology referral may be appropriate.
The Role of the Speech-Language Pathologist
The speech-language pathologist takes an additional history of the patient. This better quantifies specific details of the veteran’s functional concerns pertaining to possible difficulty with attention, memory, executive function, visuospatial awareness, etc. Examples might include difficulty with attention/memory, including not remembering what to get at the store, forgetting to take medications, forgetting appointments, and difficulty in school, among many others. Reports of feeling “stupid” also are common. Assessment varies by clinician, but it is not uncommon for the SLP to administer a battery of evaluations to help identify a range of possible impairments. Choosing testing that is sensitive to even mild impairment is important and should be used in combination with subjective complaints. Mild deficits can sometimes be missed in those with average performance, but whose premorbid intelligence was above average. One combination of test batteries sometimes utilized is the Wechsler Test of Adult Reading (WTAR), the Repeatable Battery for the Assessment of Neuropsychological Status (RBANS), the Ruff Figural Fluency Test (RFFT), the Controlled Oral Word Association Test (COWAT), and Trails A and B (Table 2).
The initial testing results are discussed with the veteran. If patient concerns and/or testing reveal impairment that is amenable to treatment and the veteran wishes to proceed, subsequent treatment sessions are scheduled. The first treatment session is spent establishing and prioritizing functional goals specific to that individual and their needs (eg, for daily life, work, school). In a case of subacute or older mTBI, as is often seen in veterans coming to the VA, intervention often targets strategies and techniques that can help the individual compensate for current deficits.
Many patients already own a smartphone, so this device often is used functionally as a cognitive prosthetic as early as the first treatment session. In an effort to immediately start addressing important issues like medication management and attending appointments, the veteran is educated to the benefit of entering important information into the calendar and/or reminder apps on their phone and setting associated alarms that would serve as a reminder for what was entered. Patients are often encouraged by the positive impact of these initial strategies and look forward to future treatment sessions to address compensation for their functional deficits.
If a veteran with TBI has numerous needs, it can be beneficial for the care team to discuss the care plan at an interdisciplinary team meeting. It is not uncommon for veterans like the one discussed above to be referred to neurology (persistent headaches and further neurological evaluation); mental health (PTSD treatment and family support/counseling options); occupational therapy (visuospatial needs); and audiology (vestibular concerns). Social work involvement is often extremely beneficial for coordination of care in more complex cases. If patient is having difficulty making healthy eating choices or with meal preparation, a consult to a dietitian may prove invaluable. Concerns related to trouble with medication adherence (beyond memory-related adherence issues that speech pathology would address) or polypharmacy can be directed to a clinical pharmacy specialist, who could prepare a medication chart, review optimal medication timing, and provide education on adverse effects. A veteran's communication with the team can be facilitated through secure messaging (a method of secure emailing) and encouraging use of the My HealtheVet portal. With this modality, patients could review chart notes and results and share them with non-VA health care providers and/or family members as indicated.
A whole health approach also may appeal to some mTBI patients. This approach focuses on the totality of patient needs for healthy living and on patient-centered goal setting. Services provided may differ at various VA medical centers, but the PACT team can connect the veteran to the services of interest.
Conclusions
A team approach to veterans with mTBI provides a comprehensive way to treat the various problems associated with the condition. Further research into the role of multidisciplinary teams in the management of mTBI was recommended in the 2016 CPG.6 The unique role that the speech-language pathologist plays as part of this team has been highlighted, as it is important that PCP’s be aware of the extent of evaluation and treatment services they offer. Beyond mTBI, speech pathologists evaluate and treat patients with several conditions that are seen regularly in primary care.
1. McKee AC, Robinson ME. Military-related traumatic brain injury and neurodegeneration. Alzheimers Dement. 2014;10(3 suppl):S242-S253. doi:10.1016/j.jalz.2014.04.003
2. Yurgil KA, Barkauskas DA, Vasterling JJ, et al. Association between traumatic brain injury and risk of posttraumatic stress disorder in active-duty Marines. JAMA Psychiatry. 2014;71(2):149-157. doi:10.1001/jamapsychiatry.2013.3080
3. Chin DL, Zeber JE. Mental Health Outcomes Among Military Service Members After Severe Injury in Combat and TBI. Mil Med. 2020;185(5-6):e711-e718. doi:10.1093/milmed/usz440
4. Hoge CW, Auchterlonie JL, Milliken CS. Mental health problems, use of mental health services, and attrition from military service after returning from deployment to Iraq or Afghanistan. JAMA. 2006;295(9):1023-1032. doi:10.1001/jama.295.9.1023
5. Miles SR, Harik JM, Hundt NE, et al. Delivery of mental health treatment to combat veterans with psychiatric diagnoses and TBI histories. PLoS One. 2017;12(9):e0184265. Published 2017 Sep 8. doi:10.1371/journal.pone.0184265
6. US Department of Defense, US Department of Veterans Affairs; Management of Concussion/mTBI Working Group. VA/DoD clinical practice guideline for management of concussion/mild traumatic brain injury. Version 2.0. Published February 2016. Accessed February 8, 2021. https://www.healthquality.va.gov/guidelines/Rehab/mtbi/mTBICPGFullCPG50821816.pdf
Preliminary Evaluation of an Order Template to Improve Diagnosis and Testosterone Therapy of Hypogonadism in Veterans
Testosterone treatment is clinically indicated when a patient presents with symptoms and signs and biochemical evidence of testosterone deficiency, ie, male hypogonadism. Laboratory confirmation of hypogonadism requires repeatedly low serum testosterone concentrations; between 8
Recent studies have reported an increase in testosterone prescriptions and raised concerns regarding health care provider (HCP) prescribing practices despite current clinical practice guidelines from major societies, such as the Endocrine Society. In the US from 2001 to 2011, testosterone use among men aged ≥ 40 years increased more than 3-fold in all age groups.3 Subsequently in the years from 2013 to 2016, prescription rates declined perhaps due to the cardiovascular and stroke concerns.4
In the US Department of Veterans Affairs (VA), new testosterone prescriptions across VA medical centers increased from 20,437 in fiscal year (FY) 2009 to 36,394 in FY 2012. Yet only 3.1% of men who received testosterone therapy had 2 or more low morning total or free testosterone concentrations measured; LH and/or FSH levels assessed; and presence of contraindications to therapy documented. Remarkably, 16.5% of these veterans did not have a testosterone level tested prior to being prescribed testosterone. Among veterans who were prescribed testosterone, 1.4% had a diagnosis of prostate cancer, 7.6% had a diagnosis of obstructive sleep apnea (OSA), and 3.5% had elevated hematocrit at baseline.5 These findings raised concerns of whether the diagnosis and etiology of hypogonadism were appropriately established and risks were considered before testosterone treatment was initiated.5,6
To further understand VA prescribing practices of testosterone therapy, a 2018 VA Office of the Inspector General (OIG) report evaluated the initiation and follow-up of testosterone replacement therapy. The OIG randomly sampled and reviewed 1,091 male patients who filled at least 1 outpatient testosterone prescription from VA in FY 2014 and who did not have a prior testosterone prescription in FY 2013. Patients were followed through September 30, 2015. Within 1 year prior to initiating testosterone, only 1.5% had clinical signs and symptoms of testosterone deficiency documented prior to testosterone testing (76% within 18 months of starting testosterone); only 9.1% of veterans had the recommended measurements of 2 low morning testosterone levels; and only 12% had LH and FSH levels measured. Within 3 to 6 months after starting testosterone therapy, only 24% of veterans were assessed for symptom improvement, and 29% to 33% were evaluated for adverse effects, hematocrit levels and adherence to the therapy. The OIG report concluded that VA HCPs were not adhering to guidelines (referencing the Endocrine Society guidelines) when evaluating and treating veterans with testosterone deficiency.7
Considering the OIG recommendations and need to improve current practices among providers, VA Puget Sound Health Care System (VAPSHCS) in Washington established a multidisciplinary workgroup consisting of an endocrinologist, geriatrician, primary care provider (PCP), pharmacists, VA information technology (IT) specialist, and health products support (HPS) clinical team in the spring of 2019 to assess and improve testosterone prescribing practices.
Methods
A testosterone order template was developed, approved by VAPSHCS Pharmacy and Therapeutics Committee, and implemented on July 1, 2019, at VAPSHCS, a 1a medical facility caring for more than 112,000 veterans. Given its potential risks and the propensity for varied prescribing practices, testosterone was designated as a restricted drug requiring a prior authorization drug request (PADR) and required completion of the testosterone order template in the Computerized Patient Record System (CPRS).
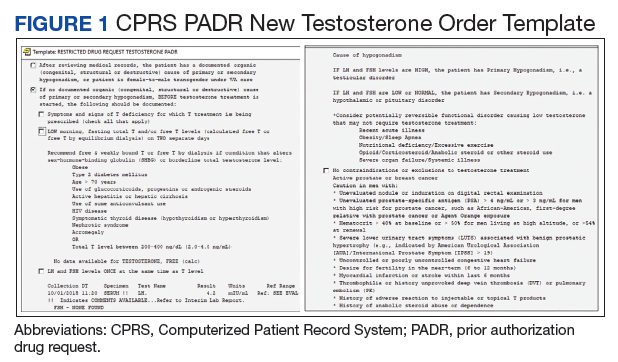
Testosterone Order Template
The testosterone order template had 2 components. Completion of the template for new testosterone orders was required to initiate treatment unless the patient had known organic hypogonadism or was a transgender male. The template ensured documentation of defined symptoms and signs of testosterone deficiency; low serum testosterone levels on at least 2 occasions and LH and FSH concentrations; no contraindications to testosterone treatment; discussion of risks and benefits of therapy; and baseline hematocrit (Figure 1). Relevant educational content (eg, risks and benefits of testosterone) was incorporated in the template. The second template was required for the first renewal of testosterone to document adherence to or reason for discontinuation of testosterone; improvement of symptoms and signs; and confirm monitoring hematocrit and testosterone levels during treatment.
Prior to implementation, the PADR template was introduced to HCPs at 2 chief-of-medicine rounds on the diagnosis and evaluation of hypogonadism by a pharmacist and endocrinologist. These educational sessions used case examples and discussions to teach the appropriate use of testosterone therapy in men with hypogonadism. The target audience was PCPs, residents, and other specialists who might prescribe testosterone.
Retrospective Chart Review
To assess the impact of the new testosterone order template on adherence to OIG recommendations, a retrospective chart review was completed comparing the appropriateness of initiating testosterone replacement therapy pretemplate period (July 1 to December 31, 2018) vs posttemplate period (July 1 to December 31, 2019). Inclusion and exclusion criteria were modeled after the 2018 OIG report to allow for comparison with the OIG study population. Eligible veterans in each time period included males who received a new testosterone prescription without having been prescribed testosterone in the previous 12 months. Exclusion criteria included community care network prescriptions (CCNRx); current testosterone prescription from a different VA site; clinic administration of testosterone in the previous 12 months; an organic hypogonadism (ie, Klinefelter syndrome) or gender dysphoria diagnosis; and whether the testosterone prescription was never dispensed (PADR was denied or veteran never had the prescription filled). Veterans who met the inclusion criteria in CPRS were identified by an algorithm developed by the VAPSHCS pharmacoeconomist.
Determining the appropriateness of testosterone prescribing, such as symptoms and laboratory measurements to confirm the diagnosis of hypogonadism, was based on the OIG report and Endocrine Society guidelines. A chart review of the 12 months before testosterone prescribing was completed for each veteran, assessing for documentation of symptoms of testosterone deficiency and laboratory measurements of serum testosterone, LH, and FSH. Also, documentation of a discussion of risks and benefits of testosterone therapy in the 3 months before prescribing was assessed, which matched the timeframe in the VA OIG report.
Interim Analysis
After initial template implementation, the multidisciplinary workgroup reconvened for a preplanned interim analysis in November 2019. The evaluation at this meeting revealed multiple order pathways in CPRS that were not linked to the PADR testosterone order template. Testosterone could be ordered in the generic order dialog, medications by drug class, and medications by alphabet, and endocrinology specialty menus without prompting to complete the testosterone order template or redirection to the restricted drug menu (Figure 2). These alternative testosterone ordering pathways were removed in early December 2019 and additional data collection was conducted for 3 months after discontinuation of alternative order pathways, the posttemplate/no alternative ordering pathways period, from December 7, 2019 to February 29, 2020.
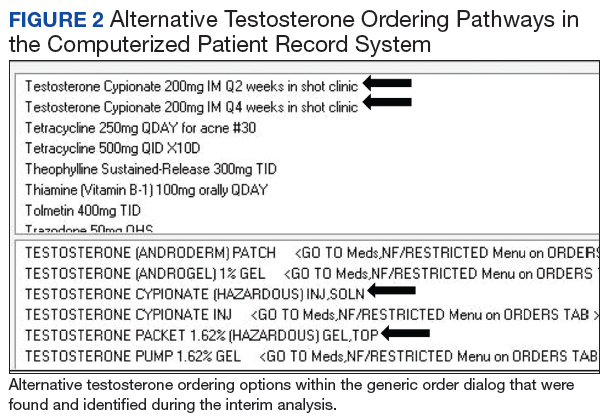
Exclusion of Previous Testosterone Prescriptions Predating Chart Review Period, Subgroup Analysis
In the OIG report and the initial retrospective chart review, only veterans without a testosterone prescription in the previous 12 months were evaluated. To assess whether a previous testosterone prescription influenced completion of the PADR and order template, a further subgroup analysis was conducted that excluded veterans who had a previous testosterone prescription at any time before the chart review periods. Therefore, “new testosterone prescription” refers to a veteran who never had a history of being on testosterone vs “former testosterone prescription,” meaning a patient could have had a previous testosterone prescription > 1 year prior to a new VA testosterone prescription.
Results
One hundred seventy-five veterans with a new testosterone prescription were identified in the pretemplate period; of these 80 (46%) met eligibility criteria; only 20 eligible veterans (25%) had a completed PADR (Figure 3). Ninety-one veterans with a new testosterone prescription were identified in the posttemplate period of which 41 (46%) veterans were eligible; 18 eligible veterans (44%) had a completed PADR, but only 7 (17%) had a completed testosterone order template.
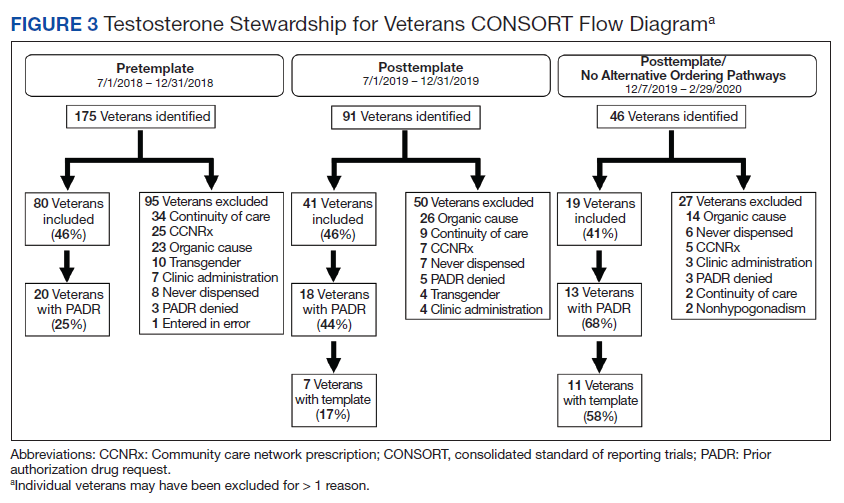
After excluding veterans who had alternative ordering pathways for testosterone, 46 veterans were identified in the posttemplate/no alternative ordering pathways period of which 19 (41%) veterans were eligible. Compared with the posttemplate period, a higher proportion of eligible veterans, 68% (13) had a completed PADR, and 58% (11) had a testosterone order template during the posttemplate/no alternative ordering pathways period.
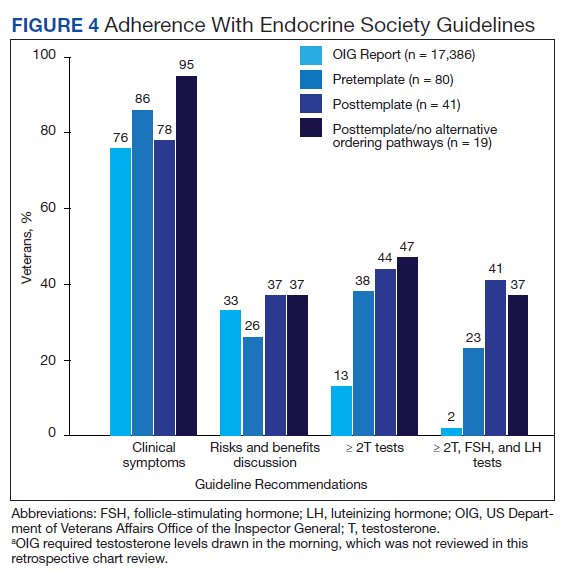
Compared with the OIG report findings, a similar percentage of veterans at VAPSHCS in the pretemplate period had documented clinical symptoms of testosterone deficiency and documented discussion of risks and benefits of testosterone therapy (Figure 4). However, a higher percentage of veterans had biochemical confirmation of testosterone deficiency with ≥ 2 low testosterone levels and evaluation of LH and FSH levels in the pretemplate period (23%) vs that in the OIG report (2%).
Compared with the pretemplate period, activation of the testosterone ordering template in the posttemplate period (Figure 4) had little effect on documented clinical symptoms and discussion of risks and benefits of testosterone treatment. However, the percentage of veterans who had ≥ 2 low testosterone levels and gonadotropins tested was higher in the posttemplate period (41%) vs both the pretemplate period and OIG report.
After removing alternative ordering pathways of testosterone, the percentages of veterans who had documented clinical symptoms, discussion of risks and benefits of testosterone, and ≥ 2 low testosterone levels and gonadotropin tests performed were similar in the posttemplate/no alternative ordering pathways vs posttemplate period.
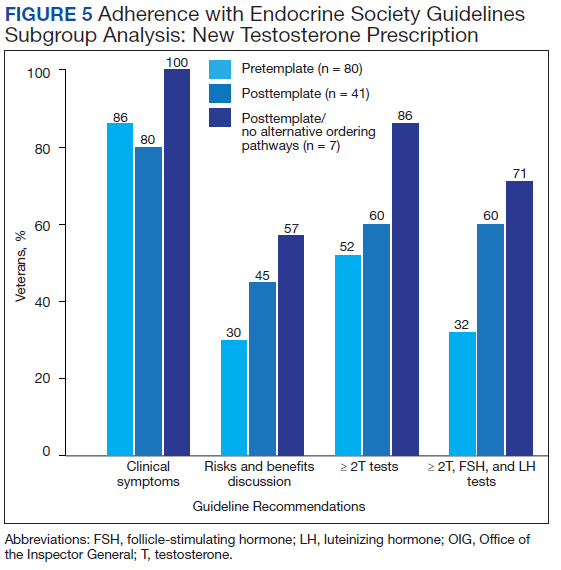
Excluding veterans who had previously received a former testosterone prescription at any time prior to chart review periods, this subgroup analysis resulted in greater adherence to Endocrine Society guidelines for testosterone treatment with introduction of the testosterone order template, particularly after removal of alternative ordering pathway (Figure 5). With the exclusion of veterans who formerly received testosterone prescriptions, the percentages of veterans who had documented clinical symptoms, discussion of risks and benefits, and ≥ 2 low testosterone levels with gonadotropin tests were higher (100%, 57%, and 71%, respectively) in the posttemplate/no alternative ordering pathways period, compared with the pretemplate period (86%, 30%, and 32%, respectively).
Discussion
The 2018 OIG report found that VA practitioners demonstrated poor adherence to evidence-based clinical practice guidelines for testosterone treatment in men with hypogonadism. Based on OIG recommendations, we developed a PADR testosterone ordering template to help HCPs improve practice by better adherence to guidelines for the diagnosis and treatment of hypogonadism in veterans. Before implementation of the PADR template, the percentage of veterans at VAPSHCS who had biochemical confirmation of hypogonadism was higher than that in the OIG report. Activation of the PADR testosterone ordering template (with or without removal of options for alternative ordering pathways of testosterone) resulted only in an improvement of laboratory confirmation and evaluation of etiology of hypogonadism. This is when we reasoned that clinicians may have access to prior records and laboratory testing beyond just the past year, and this information may have influenced their use of the PADR template. Subsequently, with exclusion of veterans who were previously prescribed testosterone, implementation of the PADR testosterone order template improved documentation of symptoms of testosterone deficiency, discussion of risks and benefits of testosterone therapy, and biochemical diagnosis and evaluation of hypogonadism relative to the period before implementation.
The lack of effects of implementing the testosterone order template on documentation of symptoms of testosterone deficiency and discussion of risks and benefits of testosterone therapy may be due to local expertise resulting in the relatively high adherence to these guideline recommendations at VAPSHCS before activation of the template vs that in the OIG report. The template improved documentation of the diagnosis and evaluation of hypogonadism for genuinely new testosterone prescriptions in veterans without a history of testosterone prescriptions; while those with a previous prescription had limited improvement. It is possible that in veterans who had testosterone prescribed previously, HCPs may have assumed or had bias that the diagnosis and evaluation of hypogonadism originally made was adequate. This finding underscores the need to develop strategies for reviewing PADR requests where there is historical testosterone use. Perhaps a clinical team member, such as a clinical pharmacist, with the background and training in guidelines for the evaluation of hypogonadism could review PADR requests in veterans with previous testosterone use.
Removal of alternative ordering pathways for testosterone increased the completion rate of PADR requests and the testosterone ordering template, although the latter was not completed in one-third of veterans. Possible reasons for HCPs’ suboptimal completion of the testosterone template despite the PADR initiation include clinicians’ lack of willingness to read the PADR completely and familiarize themselves with the clinical guidelines due to workload demands of PCPs. In addition there maybe pressure from patients to receive testosterone for age-related symptoms due to heavy marketing. In addition, there may have been pharmacists who reviewed the PADR and approved the incomplete testosterone template. At VAPSHCS there were up to 40 pharmacists during different periods reviewing the testosterone PADRs. Likely, not everyone was completely familiar with this implementation process, and a possible future consideration would be further education to staff pharmacists who are verifying these prescriptions. There were several advantages to using this new testosterone order template when HCPs attempted to order a prescription. First, they were prompted to complete the PADR. Subsequently, a pharmacist reviewed the template and approved or rejected the prescription if the template was incomplete. The completed template served as documentation in the electronic health record for the prescribing HCP. The template was constructed to populate the required laboratory tests for ease of use and documentation. In addition, educational information regarding the symptoms and signs of testosterone deficiency, laboratory tests needed to confirm and evaluate hypogonadism, contraindications to testosterone treatment, and risks and benefits of therapy were incorporated into the template to assist HCPs in understanding the requirements for a complete diagnosis and evaluation. Finally, on completion of the template, HCPs were able to order testosterone via link to various testosterone formulations.
Before its implementation, the PADR testosterone order template was introduced to PCPs and internal medicine residents at 2 case-based conferences aimed at the diagnosis and treatment of male hypogonadism. These conferences were well received and helped launch the testosterone PADR template at VAPSHCS. Similar outreach to HCPs who prescribe testosterone is highly recommended in other VA facilities before implementation of the testosterone ordering template. It is possible that more targeted education to other HCPs would have resulted in greater use of the testosterone ordering template and adherence to clinical practice guidelines.
The VAPSHCS multidisciplinary workgroup was essential for the development, implementation, evaluation, and revision of the PADR and testosterone ordering template. The workgroup met routinely to follow up on the ease of installation in CPRS and discuss technical corrections that were needed. This was an essential for quality improvement, as loopholes in CPRS were identified where the HCP could order testosterone without being prompted to use the new PADR testosterone order template (alternative ordering pathways). The workgroup swiftly informed the IT specialist and HPS team to remove alternative ordering pathways of testosterone. Continuous quality improvement evaluations are highly recommended during implementation of the template in other facilities to accommodate specific local modifications that might be needed.
After February 2020 due to the COVID-19 pandemic, the National VA Pharmacy and Medication Board halted PADR requirements. As a result, further evaluation of the New Testosterone Order template and planned initial assessment of First Renewal Testosterone Order template could not be performed. In addition, due to the COVID-19 pandemic, there was restricted in-person outpatient visits and reduced adjustments to prescribing practices. To address recommendations made in the OIG report, the VAPSHCS testosterone order template was modified into a clinical reminder dialog format by a VA National IT Specialist and HPS team, tested for usability at several VA test sites and approved by the National Clinical Template Workgroup for implementation nationally across all VAs. The National Endocrinology Ambulatory Council Workgroup will ensure that this template is adopted in a similar format when the new electronic health record system Cerner is introduced to the VA.
Conclusions
The creation and implementation of a PADR testosterone order template may be a beneficial approach to improve the diagnosis of hypogonadism and facilitate appropriate use of testosterone therapy in veterans in accordance with established clinical practice guidelines, particularly in veterans without any prior testosterone use. Key future strategies to improve testosterone prescribing should focus on identifying clinical team members, such as a local clinical pharmacist, to review and steward PADR requests to ensure that testosterone is indicated, and treatment is appropriately monitored.
1. Bhasin S, Cunningham GR, Hayes FJ, Matsumoto AM, Snyder PJ, Swerdloff RS, Montori VM; Task Force, Endocrine Society. Testosterone therapy in men with androgen deficiency syndromes: an Endocrine Society clinical practice guideline. J Clin Endocrinol Metab. 2010;95(6):2536-2559. doi:10.1210/jc.2009-2354
2. Grossmann M, Matsumoto AM. A perspective on middle-aged and older men with functional hypogonadism: focus on holistic management. J Clin Endocrinol Metab. 2017;102(3):1067-1075. doi:10.1210/jc.2016-3580
3. Baillargeon J, Urban RJ, Kuo YF, et al. Screening and monitoring in men prescribed testosterone therapy in the US, 2001-2010. Public Health Rep. 2015;130(2):143-152. doi:10.1177/003335491513000207
4. Baillargeon J, Kuo Y, Westra JR, Urban RJ, Goodwin JS. Testosterone prescribing in the United States, 2002-2016. JAMA. 2018;320(2):200-202. doi:10.1001/jama.2018.7999
5. Jasuja GK, Bhasin S, Reisman JI, Berlowitz DR, Rose AJ. Ascertainment of testosterone prescribing practices in the VA. Med Care. 2015;53(9):746-52. doi:10.1097/MLR.0000000000000398
6. Jasuja GK, Bhasin S, Rose AJ. Patterns of testosterone prescription overuse. Curr Opin Endocrinol Diabetes Obes. 2017;24(3):240-245. doi:10.1097/MED.0000000000000336
7. US Department of Veterans Affairs, Office of Inspector General. Office of Healthcare Inspections. Report No. 15-03215-154. Published April 11, 2018. Accessed February 24, 2021. https://www.va.gov/oig/pubs/VAOIG-15-03215-154.pdf
Testosterone treatment is clinically indicated when a patient presents with symptoms and signs and biochemical evidence of testosterone deficiency, ie, male hypogonadism. Laboratory confirmation of hypogonadism requires repeatedly low serum testosterone concentrations; between 8
Recent studies have reported an increase in testosterone prescriptions and raised concerns regarding health care provider (HCP) prescribing practices despite current clinical practice guidelines from major societies, such as the Endocrine Society. In the US from 2001 to 2011, testosterone use among men aged ≥ 40 years increased more than 3-fold in all age groups.3 Subsequently in the years from 2013 to 2016, prescription rates declined perhaps due to the cardiovascular and stroke concerns.4
In the US Department of Veterans Affairs (VA), new testosterone prescriptions across VA medical centers increased from 20,437 in fiscal year (FY) 2009 to 36,394 in FY 2012. Yet only 3.1% of men who received testosterone therapy had 2 or more low morning total or free testosterone concentrations measured; LH and/or FSH levels assessed; and presence of contraindications to therapy documented. Remarkably, 16.5% of these veterans did not have a testosterone level tested prior to being prescribed testosterone. Among veterans who were prescribed testosterone, 1.4% had a diagnosis of prostate cancer, 7.6% had a diagnosis of obstructive sleep apnea (OSA), and 3.5% had elevated hematocrit at baseline.5 These findings raised concerns of whether the diagnosis and etiology of hypogonadism were appropriately established and risks were considered before testosterone treatment was initiated.5,6
To further understand VA prescribing practices of testosterone therapy, a 2018 VA Office of the Inspector General (OIG) report evaluated the initiation and follow-up of testosterone replacement therapy. The OIG randomly sampled and reviewed 1,091 male patients who filled at least 1 outpatient testosterone prescription from VA in FY 2014 and who did not have a prior testosterone prescription in FY 2013. Patients were followed through September 30, 2015. Within 1 year prior to initiating testosterone, only 1.5% had clinical signs and symptoms of testosterone deficiency documented prior to testosterone testing (76% within 18 months of starting testosterone); only 9.1% of veterans had the recommended measurements of 2 low morning testosterone levels; and only 12% had LH and FSH levels measured. Within 3 to 6 months after starting testosterone therapy, only 24% of veterans were assessed for symptom improvement, and 29% to 33% were evaluated for adverse effects, hematocrit levels and adherence to the therapy. The OIG report concluded that VA HCPs were not adhering to guidelines (referencing the Endocrine Society guidelines) when evaluating and treating veterans with testosterone deficiency.7
Considering the OIG recommendations and need to improve current practices among providers, VA Puget Sound Health Care System (VAPSHCS) in Washington established a multidisciplinary workgroup consisting of an endocrinologist, geriatrician, primary care provider (PCP), pharmacists, VA information technology (IT) specialist, and health products support (HPS) clinical team in the spring of 2019 to assess and improve testosterone prescribing practices.
Methods
A testosterone order template was developed, approved by VAPSHCS Pharmacy and Therapeutics Committee, and implemented on July 1, 2019, at VAPSHCS, a 1a medical facility caring for more than 112,000 veterans. Given its potential risks and the propensity for varied prescribing practices, testosterone was designated as a restricted drug requiring a prior authorization drug request (PADR) and required completion of the testosterone order template in the Computerized Patient Record System (CPRS).
Testosterone Order Template
The testosterone order template had 2 components. Completion of the template for new testosterone orders was required to initiate treatment unless the patient had known organic hypogonadism or was a transgender male. The template ensured documentation of defined symptoms and signs of testosterone deficiency; low serum testosterone levels on at least 2 occasions and LH and FSH concentrations; no contraindications to testosterone treatment; discussion of risks and benefits of therapy; and baseline hematocrit (Figure 1). Relevant educational content (eg, risks and benefits of testosterone) was incorporated in the template. The second template was required for the first renewal of testosterone to document adherence to or reason for discontinuation of testosterone; improvement of symptoms and signs; and confirm monitoring hematocrit and testosterone levels during treatment.
Prior to implementation, the PADR template was introduced to HCPs at 2 chief-of-medicine rounds on the diagnosis and evaluation of hypogonadism by a pharmacist and endocrinologist. These educational sessions used case examples and discussions to teach the appropriate use of testosterone therapy in men with hypogonadism. The target audience was PCPs, residents, and other specialists who might prescribe testosterone.
Retrospective Chart Review
To assess the impact of the new testosterone order template on adherence to OIG recommendations, a retrospective chart review was completed comparing the appropriateness of initiating testosterone replacement therapy pretemplate period (July 1 to December 31, 2018) vs posttemplate period (July 1 to December 31, 2019). Inclusion and exclusion criteria were modeled after the 2018 OIG report to allow for comparison with the OIG study population. Eligible veterans in each time period included males who received a new testosterone prescription without having been prescribed testosterone in the previous 12 months. Exclusion criteria included community care network prescriptions (CCNRx); current testosterone prescription from a different VA site; clinic administration of testosterone in the previous 12 months; an organic hypogonadism (ie, Klinefelter syndrome) or gender dysphoria diagnosis; and whether the testosterone prescription was never dispensed (PADR was denied or veteran never had the prescription filled). Veterans who met the inclusion criteria in CPRS were identified by an algorithm developed by the VAPSHCS pharmacoeconomist.
Determining the appropriateness of testosterone prescribing, such as symptoms and laboratory measurements to confirm the diagnosis of hypogonadism, was based on the OIG report and Endocrine Society guidelines. A chart review of the 12 months before testosterone prescribing was completed for each veteran, assessing for documentation of symptoms of testosterone deficiency and laboratory measurements of serum testosterone, LH, and FSH. Also, documentation of a discussion of risks and benefits of testosterone therapy in the 3 months before prescribing was assessed, which matched the timeframe in the VA OIG report.
Interim Analysis
After initial template implementation, the multidisciplinary workgroup reconvened for a preplanned interim analysis in November 2019. The evaluation at this meeting revealed multiple order pathways in CPRS that were not linked to the PADR testosterone order template. Testosterone could be ordered in the generic order dialog, medications by drug class, and medications by alphabet, and endocrinology specialty menus without prompting to complete the testosterone order template or redirection to the restricted drug menu (Figure 2). These alternative testosterone ordering pathways were removed in early December 2019 and additional data collection was conducted for 3 months after discontinuation of alternative order pathways, the posttemplate/no alternative ordering pathways period, from December 7, 2019 to February 29, 2020.
Exclusion of Previous Testosterone Prescriptions Predating Chart Review Period, Subgroup Analysis
In the OIG report and the initial retrospective chart review, only veterans without a testosterone prescription in the previous 12 months were evaluated. To assess whether a previous testosterone prescription influenced completion of the PADR and order template, a further subgroup analysis was conducted that excluded veterans who had a previous testosterone prescription at any time before the chart review periods. Therefore, “new testosterone prescription” refers to a veteran who never had a history of being on testosterone vs “former testosterone prescription,” meaning a patient could have had a previous testosterone prescription > 1 year prior to a new VA testosterone prescription.
Results
One hundred seventy-five veterans with a new testosterone prescription were identified in the pretemplate period; of these 80 (46%) met eligibility criteria; only 20 eligible veterans (25%) had a completed PADR (Figure 3). Ninety-one veterans with a new testosterone prescription were identified in the posttemplate period of which 41 (46%) veterans were eligible; 18 eligible veterans (44%) had a completed PADR, but only 7 (17%) had a completed testosterone order template.
After excluding veterans who had alternative ordering pathways for testosterone, 46 veterans were identified in the posttemplate/no alternative ordering pathways period of which 19 (41%) veterans were eligible. Compared with the posttemplate period, a higher proportion of eligible veterans, 68% (13) had a completed PADR, and 58% (11) had a testosterone order template during the posttemplate/no alternative ordering pathways period.
Compared with the OIG report findings, a similar percentage of veterans at VAPSHCS in the pretemplate period had documented clinical symptoms of testosterone deficiency and documented discussion of risks and benefits of testosterone therapy (Figure 4). However, a higher percentage of veterans had biochemical confirmation of testosterone deficiency with ≥ 2 low testosterone levels and evaluation of LH and FSH levels in the pretemplate period (23%) vs that in the OIG report (2%).
Compared with the pretemplate period, activation of the testosterone ordering template in the posttemplate period (Figure 4) had little effect on documented clinical symptoms and discussion of risks and benefits of testosterone treatment. However, the percentage of veterans who had ≥ 2 low testosterone levels and gonadotropins tested was higher in the posttemplate period (41%) vs both the pretemplate period and OIG report.
After removing alternative ordering pathways of testosterone, the percentages of veterans who had documented clinical symptoms, discussion of risks and benefits of testosterone, and ≥ 2 low testosterone levels and gonadotropin tests performed were similar in the posttemplate/no alternative ordering pathways vs posttemplate period.
Excluding veterans who had previously received a former testosterone prescription at any time prior to chart review periods, this subgroup analysis resulted in greater adherence to Endocrine Society guidelines for testosterone treatment with introduction of the testosterone order template, particularly after removal of alternative ordering pathway (Figure 5). With the exclusion of veterans who formerly received testosterone prescriptions, the percentages of veterans who had documented clinical symptoms, discussion of risks and benefits, and ≥ 2 low testosterone levels with gonadotropin tests were higher (100%, 57%, and 71%, respectively) in the posttemplate/no alternative ordering pathways period, compared with the pretemplate period (86%, 30%, and 32%, respectively).
Discussion
The 2018 OIG report found that VA practitioners demonstrated poor adherence to evidence-based clinical practice guidelines for testosterone treatment in men with hypogonadism. Based on OIG recommendations, we developed a PADR testosterone ordering template to help HCPs improve practice by better adherence to guidelines for the diagnosis and treatment of hypogonadism in veterans. Before implementation of the PADR template, the percentage of veterans at VAPSHCS who had biochemical confirmation of hypogonadism was higher than that in the OIG report. Activation of the PADR testosterone ordering template (with or without removal of options for alternative ordering pathways of testosterone) resulted only in an improvement of laboratory confirmation and evaluation of etiology of hypogonadism. This is when we reasoned that clinicians may have access to prior records and laboratory testing beyond just the past year, and this information may have influenced their use of the PADR template. Subsequently, with exclusion of veterans who were previously prescribed testosterone, implementation of the PADR testosterone order template improved documentation of symptoms of testosterone deficiency, discussion of risks and benefits of testosterone therapy, and biochemical diagnosis and evaluation of hypogonadism relative to the period before implementation.
The lack of effects of implementing the testosterone order template on documentation of symptoms of testosterone deficiency and discussion of risks and benefits of testosterone therapy may be due to local expertise resulting in the relatively high adherence to these guideline recommendations at VAPSHCS before activation of the template vs that in the OIG report. The template improved documentation of the diagnosis and evaluation of hypogonadism for genuinely new testosterone prescriptions in veterans without a history of testosterone prescriptions; while those with a previous prescription had limited improvement. It is possible that in veterans who had testosterone prescribed previously, HCPs may have assumed or had bias that the diagnosis and evaluation of hypogonadism originally made was adequate. This finding underscores the need to develop strategies for reviewing PADR requests where there is historical testosterone use. Perhaps a clinical team member, such as a clinical pharmacist, with the background and training in guidelines for the evaluation of hypogonadism could review PADR requests in veterans with previous testosterone use.
Removal of alternative ordering pathways for testosterone increased the completion rate of PADR requests and the testosterone ordering template, although the latter was not completed in one-third of veterans. Possible reasons for HCPs’ suboptimal completion of the testosterone template despite the PADR initiation include clinicians’ lack of willingness to read the PADR completely and familiarize themselves with the clinical guidelines due to workload demands of PCPs. In addition there maybe pressure from patients to receive testosterone for age-related symptoms due to heavy marketing. In addition, there may have been pharmacists who reviewed the PADR and approved the incomplete testosterone template. At VAPSHCS there were up to 40 pharmacists during different periods reviewing the testosterone PADRs. Likely, not everyone was completely familiar with this implementation process, and a possible future consideration would be further education to staff pharmacists who are verifying these prescriptions. There were several advantages to using this new testosterone order template when HCPs attempted to order a prescription. First, they were prompted to complete the PADR. Subsequently, a pharmacist reviewed the template and approved or rejected the prescription if the template was incomplete. The completed template served as documentation in the electronic health record for the prescribing HCP. The template was constructed to populate the required laboratory tests for ease of use and documentation. In addition, educational information regarding the symptoms and signs of testosterone deficiency, laboratory tests needed to confirm and evaluate hypogonadism, contraindications to testosterone treatment, and risks and benefits of therapy were incorporated into the template to assist HCPs in understanding the requirements for a complete diagnosis and evaluation. Finally, on completion of the template, HCPs were able to order testosterone via link to various testosterone formulations.
Before its implementation, the PADR testosterone order template was introduced to PCPs and internal medicine residents at 2 case-based conferences aimed at the diagnosis and treatment of male hypogonadism. These conferences were well received and helped launch the testosterone PADR template at VAPSHCS. Similar outreach to HCPs who prescribe testosterone is highly recommended in other VA facilities before implementation of the testosterone ordering template. It is possible that more targeted education to other HCPs would have resulted in greater use of the testosterone ordering template and adherence to clinical practice guidelines.
The VAPSHCS multidisciplinary workgroup was essential for the development, implementation, evaluation, and revision of the PADR and testosterone ordering template. The workgroup met routinely to follow up on the ease of installation in CPRS and discuss technical corrections that were needed. This was an essential for quality improvement, as loopholes in CPRS were identified where the HCP could order testosterone without being prompted to use the new PADR testosterone order template (alternative ordering pathways). The workgroup swiftly informed the IT specialist and HPS team to remove alternative ordering pathways of testosterone. Continuous quality improvement evaluations are highly recommended during implementation of the template in other facilities to accommodate specific local modifications that might be needed.
After February 2020 due to the COVID-19 pandemic, the National VA Pharmacy and Medication Board halted PADR requirements. As a result, further evaluation of the New Testosterone Order template and planned initial assessment of First Renewal Testosterone Order template could not be performed. In addition, due to the COVID-19 pandemic, there was restricted in-person outpatient visits and reduced adjustments to prescribing practices. To address recommendations made in the OIG report, the VAPSHCS testosterone order template was modified into a clinical reminder dialog format by a VA National IT Specialist and HPS team, tested for usability at several VA test sites and approved by the National Clinical Template Workgroup for implementation nationally across all VAs. The National Endocrinology Ambulatory Council Workgroup will ensure that this template is adopted in a similar format when the new electronic health record system Cerner is introduced to the VA.
Conclusions
The creation and implementation of a PADR testosterone order template may be a beneficial approach to improve the diagnosis of hypogonadism and facilitate appropriate use of testosterone therapy in veterans in accordance with established clinical practice guidelines, particularly in veterans without any prior testosterone use. Key future strategies to improve testosterone prescribing should focus on identifying clinical team members, such as a local clinical pharmacist, to review and steward PADR requests to ensure that testosterone is indicated, and treatment is appropriately monitored.
1. Bhasin S, Cunningham GR, Hayes FJ, Matsumoto AM, Snyder PJ, Swerdloff RS, Montori VM; Task Force, Endocrine Society. Testosterone therapy in men with androgen deficiency syndromes: an Endocrine Society clinical practice guideline. J Clin Endocrinol Metab. 2010;95(6):2536-2559. doi:10.1210/jc.2009-2354
2. Grossmann M, Matsumoto AM. A perspective on middle-aged and older men with functional hypogonadism: focus on holistic management. J Clin Endocrinol Metab. 2017;102(3):1067-1075. doi:10.1210/jc.2016-3580
3. Baillargeon J, Urban RJ, Kuo YF, et al. Screening and monitoring in men prescribed testosterone therapy in the US, 2001-2010. Public Health Rep. 2015;130(2):143-152. doi:10.1177/003335491513000207
4. Baillargeon J, Kuo Y, Westra JR, Urban RJ, Goodwin JS. Testosterone prescribing in the United States, 2002-2016. JAMA. 2018;320(2):200-202. doi:10.1001/jama.2018.7999
5. Jasuja GK, Bhasin S, Reisman JI, Berlowitz DR, Rose AJ. Ascertainment of testosterone prescribing practices in the VA. Med Care. 2015;53(9):746-52. doi:10.1097/MLR.0000000000000398
6. Jasuja GK, Bhasin S, Rose AJ. Patterns of testosterone prescription overuse. Curr Opin Endocrinol Diabetes Obes. 2017;24(3):240-245. doi:10.1097/MED.0000000000000336
7. US Department of Veterans Affairs, Office of Inspector General. Office of Healthcare Inspections. Report No. 15-03215-154. Published April 11, 2018. Accessed February 24, 2021. https://www.va.gov/oig/pubs/VAOIG-15-03215-154.pdf
Automated software accurately generates ERCP quality reports
Modified endoscopy documentation software can automatically generate endoscopic retrograde cholangiopancreatography (ERCP) quality metrics, based on a trial at two referral centers.
Providers were prompted during procedures, and inputting any missed data took providers less than 30 additional seconds per patient. The approach led to highly accurate quality reports, lead author Gregory A. Coté, MD, MS, of the Medical University of South Carolina, Charleston, and colleagues wrote in Techniques and Innovations in Gastrointestinal Endoscopy.
The investigators suggested that these findings may lead to the kind of quality reports already used for colonoscopy, which are easier to produce. Such reports are important, they wrote, as the U.S. health care system shifts to value-based reimbursement models, which in turn puts greater scrutiny on the quality of endoscopic procedures. However, doing so with ERCP isn’t entirely straightforward.
“Measuring adherence to ERCP quality indicators is especially challenging given: variance in indications, intraprocedural maneuvers, potential outcomes of a complex procedure, and variability in physician report documentation,” Dr. Coté and colleagues wrote. “In order to operationalize robust tracking of clinically relevant adherence to ERCP quality indicators in clinical practice – that is, to provide real-time feedback to providers, health systems, payors, and patients – an automated system of measurement must be developed.”
The quality indicators used in the study were largely drawn from an American Society for Gastrointestinal Endoscopy/American College of Gastroenterology task force document, with exclusion of those that were subjective or required systematic follow-up. The investigators modified existing endoscopy documentation software at two referral centers to include mandatory, structured data fields, principally with inclusion of quality improvements deemed high priority by the society consensus document, study authors, or both. For instance, providers were obligated to select a specific indication instead of various, synonymous terms (for example, “biliary stricture” vs. “common bile duct stricture”). Examples of quality indicators included successful cannulation of the desired duct, successful retrieval of stone less than 10 mm, or successful placement of a bile duct stent when indicated. Endoscopists were also required to note the presence of postoperative foregut anatomy or presence of existing sphincterotomy, variables which serve to stratefy the quality indicator outcome for degree of difficulty and allow appropriate comparisons of data. In addition, the study authors included inquiries about use of rectal indomethacin, use of prophylactic pancreatic duct stent, and documentation of need for repeat ERCP, follow-up x-ray, or both.
After 9 months, the system recorded 1,376 ERCP procedures conducted by eight providers, with a median annualized volume of 237 procedures (range, 37-336). Almost one-third (29%) of the patients had not had prior sphincterotomy.
Automated reporting of ERCP was compared with manual record review, which confirmed high (98%-100%) accuracy. This high level of accuracy “obviates the need for manual adjudication of medical records,” the investigators wrote.
They used data from one provider to create a template report card, and while exact comparisons across providers and institutions were not published, an example report card that was published with the study showed how such comparisons could be generated in the real world.
“The tool presented in this study allows for an objective assessment of ERCP performance which can provide explicit feedback to providers and allow transparent assessment of quality outcomes; it has the potential to improve the quality of ERCP akin to what has been demonstrated using colonoscopy report cards,” the investigators wrote. “Importantly, this can be achieved with minimal alteration to providers’ routine procedure documentation.”
Dr. Coté and colleagues also noted that the software modifications “can be implemented in other endoscopy units using the same or similar software.”
Taking the project to the next level would require widespread collaboration, according to the investigators.
“A key next step is to operationalize the transfer of data across multiple institutions, allowing for the creation of interim, standard-quality indicator reports that could be disseminated to providers, health systems, and payors,” they wrote. “If applied to a national cohort, this tool could accurately assess the current landscape of ERCP quality and provide tremendous opportunities for systematic improvement.”
One author disclosed a relationship with Provation Medical, but the remaining authors declared no relevant conflicts.
FROM TECHNIQUES AND INNOVATIONS IN GASTROINTESTINAL ENDOSCOPY
Clinical Impact of Initiation of U-500 Insulin vs Continuation of U-100 Insulin in Subjects With Diabetes
More than 70% of Americans are overweight or obese and 1 in 10 has type 2 diabetes mellitus (T2DM). In the last 20 years, the prevalence of obesity and DM has each increased drastically according to the Centers for Disease Control and Prevention.1,2 Thus, an increase in severe insulin-resistant DM is predicted. Severe insulin resistance occurs when insulin doses exceed 200 units per day or 2 units/kg per day.3-5 Treating this condition demands large volumes of U-100 insulin and a high frequency of injections (usually 4-7 per day), which can lead to reduced patient adherence.8-10 Likewise, large injected volumes are more painful and can lead to altered absorption.3,9-11
U-500 insulin (500 units/mL) is 5 times more concentrated than U-100 insulin and has advantages in the management of severe insulin-resistant DM.11-13 Its pharmacokinetic profile is unique, for the clinical effect can last for up to 24 hours.4-6 U-500 can replace basal-bolus and other complex insulin regimens, offering convenient, effective glycemic control with 2 or 3 injections per day.11,14-20 U-500 can also improve the quality of life and adherence compared with formulations that require more frequent injections.7,14,21 Historically, only exceptional or “special” cases were treated with U-500, but demand for concentrated insulins has increased in the last decade as clinicians adjust their care for this growing patient population.17
The purpose of this study was to determine whether a population of subjects with severe insulin-resistant T2DM would benefit from the use of U-500 vs U-100 insulin regimens. The hypothesis was that this population would obtain equal or better glycemic control while achieving improved adherence. Other studies have demonstrated that U-500 yields improvements in glycemic control but also potentially increases hypoglycemic episodes.15-18,22-24 To our knowledge, this study is the first to evaluate the clinical outcomes of subjects with severe insulin-resistant T2DM who changed from U-100 to U-500 vs subjects who remained on high-dose U-100 insulin.
Methods
This was a single-site, retrospective chart review of subjects with T2DM who attended the endocrinology specialty clinic at the James A. Haley Veterans’ Hospital (JAHVA) in Tampa, Florida, between July 2002 and June 2011. The study included a group of subjects using U-500 insulin and a comparison group using U-100 insulin. The study was approved by the JAHVA Research & Development Committee and by the University of South Florida Institutional Review Board.
Inclusion criteria included diagnosis of T2DM, body mass index (BMI) of more than 30, use of U-500 insulin, or > 200 units daily of U-100 insulin. Exclusion criteria included hypoglycemia unawareness, type 1 DM, and use of an insulin pump. A total of 142 subjects met the inclusion criteria (68 in the U-500 group and 74 in the U-100 group).
All study subjects had at least 1 DM education session. U-500 subjects used insulin vials and 1-mL volumetric hypodermal syringes. All U-500 prescriptions were issued electronically in units and volume (U-500 insulin was available exclusively in vials during the time frame from which data were collected). Subjects in the U-100 group used insulin vials or pen devices. Laboratory studies were processed in house by the institution using high-pressure liquid chromatography to determine hemoglobin A1C (Hb A1C) levels. All study subjects required at least 2 Hb A1C measurements over the observed 12 months for inclusion.
Transition to U-500 Insulin
U-500 transition was considered routinely and presented as an option for patients requiring > 200 units of insulin daily. The transition criteria included adherence to medications, follow-up appointments, and glucose monitoring recommendations, and ability to learn and apply insulin self-adjustment instructions. All subjects were given an additional U-500 insulin education session before transition. The endocrinologist calculated all starting doses by reducing the total daily dose by 20%.
Data Collection
Data were collected using the automatic data mining tools within the JAHVA Computerized Patient Record System and confirmed individually by clinical staff. Demographic data included age, race, and sex. Other parameters were weight; BMI; Hb A1C; estimated glomerular filtration rate (eGFR); duration of DM; use of metformin and other oral agents; total daily insulin dose; number of daily injections; prior history of atherosclerotic cardiovascular disease (ASCVD), including coronary artery disease (CAD), cerebrovascular accident (CVA), or peripheral vascular disease (PVD); occurrence of severe hypoglycemia (symptomatic hypoglycemia requiring treatment assistance from another individual) and of new cardiovascular events, classified as CAD, CVA, or PVD.
For the U-500 group, data were collected and analyzed for the 3 months before (baseline) and the 12 months after the initiation of concentrated insulin. For the U-100 group, data were collected and analyzed for the comparable 3 months before (baseline) and the 12 months after the first clinic visit in which the subject started using more than 200 units per day of U-100. Frequency of follow-up visits was individualized according to clinical needs.
Clinical Endpoints
Primary outcomes included changes in Hb A1C from baseline to the following 12 months, and the occurrence of severe hypoglycemia. Secondary outcomes included the occurrence of new ASCVD events during the study, and changes in weight, BMI, and number of injections.
Statistical Analysis
The primary and secondary outcomes were assessed through univariate and multivariate general linear models. Multivariate models were used to compare differences in the variation of Hb A1C over time. Data were incomplete for the Hb A1C in 27 subjects, 6% of the dataset (Each subject had more than one variable or observation). Therefore, a multiple imputation was used to account for the incompleteness on Hb A1C (value substitutions by the mean and by the prior Hb A1C and models were balanced against the unaltered data). A P value of ≤ .05 was used to determine statistical significance. The statistical analyses were performed using IBM SPSS Statistics 21.
Results
Most patients were male (94%) of white race (86%), with a mean age of 57 years and comparable duration of DM (Table 1). Demographics were balanced between the groups, except for weight and BMI, both higher in the U-500 group (P < .001). Use of oral antidiabetic agents was not significantly different between groups, nor were comorbid conditions, with nearly 50% of subjects in each group affected by CKD and ASCVD, of which CAD was the most common (approximately 40% of both groups). Only about one-third of subjects used metformin and/or other oral agents, likely due to the high prevalence of CKD (contraindicating metformin) and high insulin requirements (due to correlation with β cell failure). A subgroup analysis of subjects on metformin did not demonstrate significant differences in risk of severe hypoglycemia or in Hb A1C levels (data not shown).
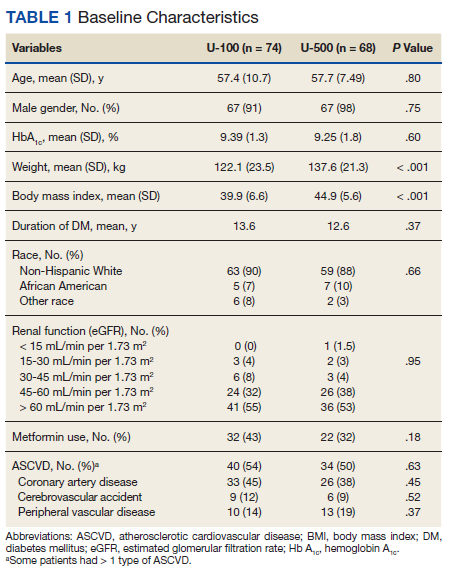
Both groups had similar initial Hb A1C baselines (> 9%) and both improved glycemic control during the study period. However, the Hb A1C reduction was greater in the U-500 group (P= .034), 0.84% vs 0.56% for U-100 and the between-groups difference was 0.4%. (Figure 1, Tables 2 and 3).
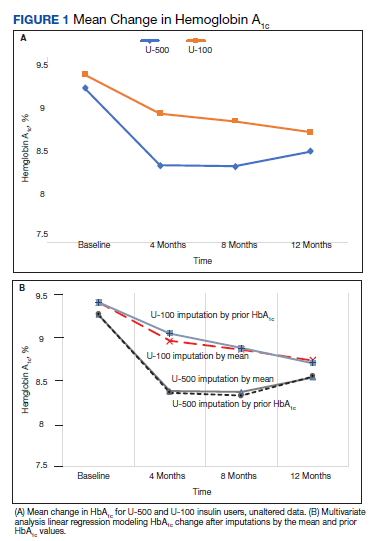
The univariate general linear model shows a statistically significant difference in the levels of Hb A1C within each treatment group, regardless of the imputation strategy. However, the differences were not significant when comparing postintervention Hb A1C means between groups with unaltered data (P = .23), because the U-500 group Hb A1C improvement gap narrowed at the end of study. In the multivariate analysis, irrespective of imputation method, the differences in Hb A1C between group treated with U-100 and U-500 were statistically significant (Table 3).
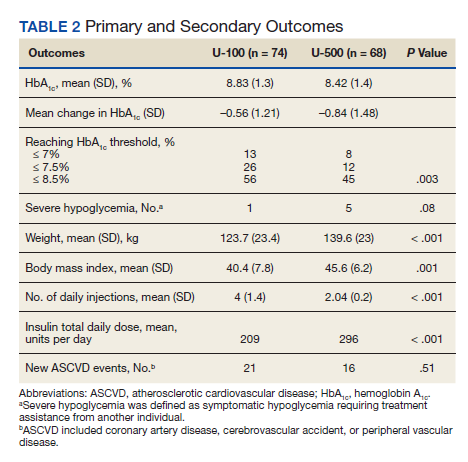
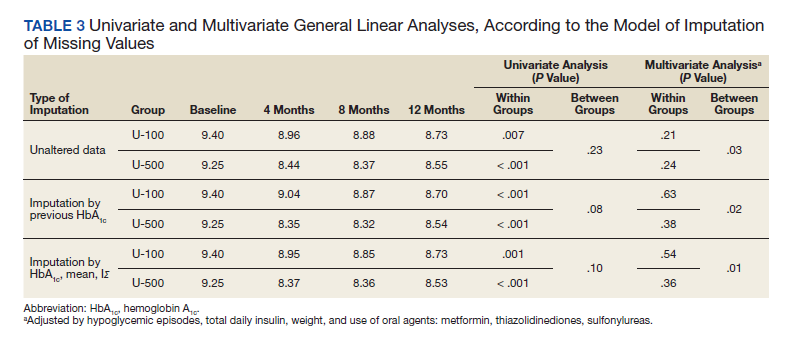
Overall, more subjects in the U-500 group than in the U-100 group achieved Hb A1C levels < 8.5% (56% vs 46%, respectively, P = .003) and the proportion of subjects achieving Hb A1C levels < 7.5% doubled that of the U-100 group (26% vs 12%; Figure 2). Five subjects in the U-500 group experienced severe hypoglycemia, compared with 1 in the U-100 group (P = .08). The total daily insulin dose was significantly higher in the U-500 group (296 units daily) than in the U-100 group (209 units daily) (P < .001) (Table 2). Baseline weight and BMI differences were also significant for the U-500 and U-100 groups (P < .001). Weight gain of approximately 2 kg occurred in both groups, a change that was not statistically significant (P = .79)
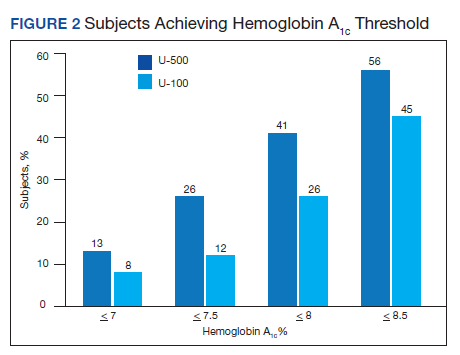
There were 21 new ASCVD events in the U-100 and 16 in the U-500 group (P = .51) and there were no statistically significant differences in the incidence of new CAD, PVD or CVA events. The U-500 group required significantly fewer injections than U-100 insulin users (2 vs 4; P < .001).
Discussion
The purpose of the study was to compare subjects with obesity and T2DM using U-500 concentrated insulin with similarly matched subjects using U-100 insulin. Available studies using U-500 insulin, including prospective trials, have reported the experience after transitioning patients who “failed” U-100 regimens.13-16,18,21-24 This failure is a relative and transient condition that, in theory, could be improved with medical intervention and lifestyle changes. Such changes cannot be easily quantified in a clinical trial or retrospective study without a control group. This study was an attempt to fill this knowledge gap.
The U-500 intervention resulted in a 0.8% overall reduction in Hb A1C and a significant 0.4% reduction compared to subjects using U-100. While both groups had improvement in Hb A1C , U-500 was associated with superior reductions in Hb A1C . This finding confirms prior assertions that U-500, compared with U-100, is associated with larger Hb A1C improvement.14-16
The preintervention and postintervention Hb A1C means were > 8% in both groups. This finding suggests that lowering Hb A1C is challenging, similar to published results demonstrating that Hb A1C levels < 7% are achieved by fewer than one-third of U-500 users.16-18 The explanation for this finding remains elusive, due to the methodologic limitations of a retrospective analysis. A possible explanation is the high prevalence of CKD and ASCVD among the study population, conditions which, according to guidelines justify less aggressive glycemic control efforts.25 Multiple prior studies using retrospective data8,13-16 and 2 prospective trials18,22 demonstrated similar Hb A1C reductions after failure of U-100 regimens.
In this study, U-500 resulted in a nominal increase in the risk of severe hypoglycemic episodes. A detailed review of the events found that most of these patients had preestablished CKD and ASCVD, and half of the subjects with sever hypoglycemic episodes had new vascular events during the study (Appendix). These findings suggest a possible correlation between CKD and ASCVD complications and the risk of severe hypoglycemic events. Pharmacokinetic profiles for U-500 have not been studied in subjects with CKD, but the clinical effect of CKD is likely prolonged by the expected reduction in insulin clearance. Similarly, the frailty associated with preexisting ASCVD, or the related polypharmacy, could be factors increasing the risk of hypoglycemia and deserve further study.
Most of the U-500 subjects used it twice daily in this study, which could have contributed to the higher hypoglycemia rate. In a prospective randomized trial Hood and colleagues reported a rate of symptomatic hypoglycemia exceeding 90% in the 2 study groups, and 8 subjects (of 325 total) had severe hypoglycemia during the 6-month observation. The group assigned to 2 daily injections had a significantly higher rate of hypoglycemic events compared with a group that had 3 injections per day.18 Additional studies are required to ascertain whether U-500, compared with specific U-100 regimens (basal-bolus vs premixed; human vs insulin analogs), results in a higher risk of severe hypoglycemia.
This study also investigated the incidence of new cardiovascular events, and no difference was found between the 2 groups. A longer observation would be required to better assess whether U-500 therapy can reduce the incidence of microvascular and macrovascular complications. The similar incidence of complications is further evidence of the similarity between the 2 studied groups. It was also reassuring to find that weight gains were small and nearly identical in both insulin groups.
Strengths and Limitations
This study has several limitations. Data about hospitalizations for congestive heart failure, amputations, progression of diabetic retinopathy, neuropathy, and nephropathy were not collected for this analysis. As both groups of subjects were relatively small, statistical power to assess outcomes is a concern. Retrospective chart reviews may also be affected by incomplete data collections and multiple biases. No data were available for other hypoglycemic episodes, especially to calculate the rate of the more common forms of hypoglycemia. The period of data analyzed spanned only about 15 months. A longer, longitudinal assessment of the differences between these 2 groups may yield more differences, and clearer results and conclusions. Moreover, the data set had aged before publication of this report; however, the authors think that the analysis and information remain highly clinically relevant. The uncommon use of U-500, and prominence as a “special case” insulin may also lead to a detection bias for severe hypoglycemia in the U-500 group. In contrast, lapses in documentation of hypoglycemia in subjects using U-100 could have occurred. Finally, the differences in total daily dose and body weight among groups were significant and may reflect on important physiologic differences between the 2 groups that may affect the reproducibility of our results.
Nevertheless, this study had notable strengths. Comparing U-500 insulin users with similar subjects using U-100 over a period of time provides head-to-head data with potentially important clinical utility. Also, we collected and analyzed a sizable number of clinically important variables, including cardiovascular risk factors, the occurrence of new cardiovascular events, and prevalence of renal disease. The use of linear regression and multivariate analysis using multiple models also strengthened the results. Previous studies compared the outcomes in subjects using U-500 insulin with only their historical selves.8,13-16,18,19,22-25 Therefore, these studies analyzed the data for preconversion and postconversion of U-500 only and consistently favored U-500. This design in a retrospective study cannot eliminate the selection and/or intervention biases, as the subjects of study had inevitably “failed” prior therapies. Similarly, there is no prospective clinical trial data comparing patients on U-500 with patients on high doses of U-100 insulin. Finally, the patients in our study had high rates of comorbidities, which may have increased the applicability of our results to those of “real-life” patients in the community. To our knowledge, no other study has attempted a similar study design approach either prospectively or retrospectively.
Conclusions
In this population of elderly veterans with severely insulin-resistant T2DM, with a high incidence of CKD and ASCVD, U-500 insulin was associated with significantly greater reductions in Hb A1C than U-100 insulin-based regimens, while requiring fewer injections. No difference was noted in the incidence of new ASCVD events. More studies are needed to assess whether U-500 may increase the risk of severe hypoglycemic episodes.
Acknowledgments
The authors recognize the invaluable help provided by the editorial staff of University of South Florida IMpact, the Intramural Review to Support Research and Scientific Publication, and especially to Richard F. Lockey, MD, who has mentored us in this beautiful journey of scientific writing and for his editorial assistance. A portion of this study preliminary data was presented as an abstract at ENDO 2013, The Endocrine Society Annual meeting in San Francisco, CA, June 15-18, 2013.
Appendix. Severe Hypoglycemic Events
Subject 1: U-500 user, 61-year-old African American male. Hypoglycemia occurred during fasting and was associated with a seizure-like event 9 months after transition to concentrated insulin. He was taken by ambulance to a local hospital. No additional data were obtained. Hb A1C was 8.2% in the month before the episode (lowest of the studied period) and increased to 9.1% in the last segment of the study.
Subject 2: U-500 user, 57-year-old white male. The severe hypoglycemic episode occurred approximately 8 months after transition. His Hb A1C was 5.6% around the time of the event, the lowest of the studied period, and increased to 6.8% over the next 4 months. No other data were available.
Subject 3: U-500 user, 67-year-old white male. The event occurred at home in the morning while fasting, 3 months after transition. He was assisted by his family. Hb A1C was 7.1% 10 weeks after the event and was 7% at the end of the studied period. He had a history of CKD and PVD.
Subject 4: U-500 user, 68-year-old white male. He presented with altered consciousness, hypoglycemia, and elevated troponin levels, which was later confirmed as a non-ST elevation myocardial infarction (NSTEMI), 7 months after transition. Hb A1C during the events was 7.1% and was followed by a 9.3% level 9 weeks later. He had history of CKD and PVD.
Subject 5: U-500 user, 67-year-old white man. Hypoglycemia occurred 6 months after transition to U-500. Hb A1C was 8.4% 2 months prior, and was followed by a 7% during the admission for severe hypoglycemia. 3 months later, his HbA1c rose to 8.2%. He had an extensive history of CAD and had a NSTEMI during the study period.
Subject 6: U-100 user, 65-year-old white man. He was found unconscious in the morning while fasting, 6 months after his first clinic visit. He had CKD and advanced ASCVD with prior CAD, PVD, and CVA. He had also had a recent CVA that had affected his movement and cognition.
1. Hales CM, Carroll MD, Fryar CD, Ogden CL. Prevalence of obesity among adults and youth: United States, 2015–2016. NCHS data brief no. 288. Published October 2017. Accessed January 29, 2021. https://www.cdc.gov/nchs/products/databriefs/db288.htm
2. Centers for Disease Control and Prevention. Diabetes and prediabetes: CDC works to prevent type 2 diabetes and improve the health of all people with diabetes. Updated November 30, 2020. Accessed February 17, 2021. https://www.cdc.gov/chronicdisease/resources/publications/factsheets/diabetes-prediabetes.htm
3. Cochran E, Gorden P. Use of U-500 insulin in the treatment of severe insulin resistance. Insulin. 2008;3(4):211-218 [Published correction appears in Insulin. 2009;4(1):81]. doi:10.1016/S1557-0843(08)80049-8
4. Shrestha RT, Kumar AF, Taddese A, et al. Duration and onset of action of high dose U-500 regular insulin in severely insulin resistant subjects with type 2 diabetes. Endocrinol Diabetes Metab. 2018;1(4):e00041. Published 2018 Sep 10. doi:10.1002/edm2.41
5. Dailey AM, Tannock LR. Extreme insulin resistance: indications and approaches to the use of U-500 insulin in type 2 diabetes mellitus. Curr Diab Rep. 2011;11(2):77-82. doi:10.1007/s11892-010-0167-6
6. de la Peña A, Riddle M, Morrow LA, et al. Pharmacokinetics and pharmacodynamics of high-dose human regular U-500 insulin versus human regular U-100 insulin in healthy obese subjects [published correction appears in Diabetes Care. 2014 Aug;37(8):2414]. Diabetes Care. 2011;34(12):2496-2501. doi:10.2337/dc11-0721
7. Brusko C, Jackson JA, de la Peña A. Comparative properties of U-500 and U-100 regular human insulin. Am J Health Syst Pharm. 2013;70(15):1283-1284. doi:10.2146/130117
8. Dailey AM, Williams S, Taneja D, Tannock LR. Clinical efficacy and patient satisfaction with U-500 insulin use. Diabetes Res Clin Pract. 2010;88(3):259-264. doi:10.1016/j.diabres.2010.02.012
9. Wysham C, Hood RC, Warren ML, Wang T, Morwick TM, Jackson JA. Effect of total daily dose on efficacy, dosing, and safety of 2 dose titration regimens of human regular U-500 insulin in severely insulin-resistant patients with type 2 diabetes. Endocr Pract. 2010;22(6):653-665. doi:10.4158/EP15959.OR
10. Gagnon-Auger M, du Souich P, Baillargeon JP, et al. Dose-dependent delay of the hypoglycemic effect of short-acting insulin analogs in obese subjects with type 2 diabetes: a pharmacokinetic and pharmacodynamic study. Diabetes Care. 2010;33(12):2502-2507. doi:10.2337/dc10-1126
11. Schloot NC, Hood RC, Corrigan SM, Panek RL, Heise T. Concentrated insulins in current clinical practice. Diabetes Res Clin Pract. 2019;148:93-101. doi:10.1016/j.diabres.2018.12.007
12. Lane WS, Cochran EK, Jackson JA, et al. High-dose insulin therapy: is it time for U-500 insulin?. Endocr Pract. 2009;15(1):71-79. doi:10.4158/EP.15.1.71
13. Boldo A, Comi RJ. Clinical experience with U500 insulin: risks and benefits. Endocr Pract. 2012;18(1):56-61. doi:10.4158/EP11163.OR
14. Granata JA, Nawarskas AD, Resch ND, Vigil JM. Evaluating the effect of u-500 insulin therapy on glycemic control in veterans with type 2 diabetes. Clin Diabetes. 2015;33(1):14-19. doi:10.2337/diaclin.33.1.14
15. Eby EL, Zagar AJ, Wang P, et al. Healthcare costs and adherence associated with human regular U-500 versus high-dose U-100 insulin in patients with diabetes. Endocr Pract. 2014;20(7):663-670. doi:10.4158/EP13407.OR
16. Eby EL, Curtis BH, Gelwicks SC, et al. Initiation of human regular U-500 insulin use is associated with improved glycemic control: a real-world US cohort study. BMJ Open Diabetes Res Care. 2015;3(1):e000074. Published 2015 Apr 30. doi:10.1136/bmjdrc-2014-000074
17. Jones P, Idris I. The use of U-500 regular insulin in the management of patients with obesity and insulin resistance. Diabetes Obes Metab. 2013;15(10):882-887. doi:10.1111/dom.12094
18. Hood RC, Arakaki RF, Wysham C, Li YG, Settles JA, Jackson JA. Two treatment approaches for human regular U-500 insulin in patients with type 2 diabetes not achieving adequate glycemic control on high-dose U-100 insulin therapy with or without oral agents: a randomized, titration-to-target clinical trial. Endocr Pract. 2015;21(7):782-793. doi: 10.4158/EP15612.OR
19. Ballani P, Tran MT, Navar MD, Davidson MB. Clinical experience with U-500 regular insulin in obese, markedly insulin-resistant type 2 diabetic patients [published correction appears in Diabetes Care. 2007 Feb;30(2):455]. Diabetes Care. 2006;29(11):2504-2505. doi:10.2337/dc06-1478
20. Davidson MB, Navar MD, Echeverry D, Duran P. U-500 regular insulin: clinical experience and pharmacokinetics in obese, severely insulin-resistant type 2 diabetic patients. Diabetes Care. 2010;33(2):281-283. doi:10.2337/dc09-1490
21. Bulchandani DG, Konrady T, Hamburg MS. Clinical efficacy and patient satisfaction with U-500 insulin pump therapy in patients with type 2 diabetes. Endocr Pract. 2007;13(7):721-725. doi:10.4158/EP.13.7.721
22. Lane WS, Weinrib SL, Rappaport JM, Przestrzelski T. A prospective trial of U500 insulin delivered by Omnipod in patients with type 2 diabetes mellitus and severe insulin resistance [published correction appears in Endocr Pract. 2010 Nov-Dec;16(6):1082]. Endocr Pract. 2010;16(5):778-784. doi:10.4158/EP10014.OR
23. Martin C, Perez-Molinar D, Shah M, Billington C. U500 Disposable Patch Insulin Pump: Results and Discussion of a Veterans Affairs Pilot Study. J Endocr Soc. 2018;2(11):1275-1283. Published 2018 Sep 17. doi:10.1210/js.2018-00198
24. Ziesmer AE, Kelly KC, Guerra PA, George KG, Dunn FL. U500 regular insulin use in insulin-resistant type 2 diabetic veteran patients. Endocr Pract. 2012;18(1):34-38. doi:10.4158/EP11043.OR
25. American Diabetes Association. 6. Glycemic Targets: Standards of Medical Care in Diabetes-2019. Diabetes Care. 2019;42(Suppl 1):S61-S70. doi:10.2337/dc19-S006
More than 70% of Americans are overweight or obese and 1 in 10 has type 2 diabetes mellitus (T2DM). In the last 20 years, the prevalence of obesity and DM has each increased drastically according to the Centers for Disease Control and Prevention.1,2 Thus, an increase in severe insulin-resistant DM is predicted. Severe insulin resistance occurs when insulin doses exceed 200 units per day or 2 units/kg per day.3-5 Treating this condition demands large volumes of U-100 insulin and a high frequency of injections (usually 4-7 per day), which can lead to reduced patient adherence.8-10 Likewise, large injected volumes are more painful and can lead to altered absorption.3,9-11
U-500 insulin (500 units/mL) is 5 times more concentrated than U-100 insulin and has advantages in the management of severe insulin-resistant DM.11-13 Its pharmacokinetic profile is unique, for the clinical effect can last for up to 24 hours.4-6 U-500 can replace basal-bolus and other complex insulin regimens, offering convenient, effective glycemic control with 2 or 3 injections per day.11,14-20 U-500 can also improve the quality of life and adherence compared with formulations that require more frequent injections.7,14,21 Historically, only exceptional or “special” cases were treated with U-500, but demand for concentrated insulins has increased in the last decade as clinicians adjust their care for this growing patient population.17
The purpose of this study was to determine whether a population of subjects with severe insulin-resistant T2DM would benefit from the use of U-500 vs U-100 insulin regimens. The hypothesis was that this population would obtain equal or better glycemic control while achieving improved adherence. Other studies have demonstrated that U-500 yields improvements in glycemic control but also potentially increases hypoglycemic episodes.15-18,22-24 To our knowledge, this study is the first to evaluate the clinical outcomes of subjects with severe insulin-resistant T2DM who changed from U-100 to U-500 vs subjects who remained on high-dose U-100 insulin.
Methods
This was a single-site, retrospective chart review of subjects with T2DM who attended the endocrinology specialty clinic at the James A. Haley Veterans’ Hospital (JAHVA) in Tampa, Florida, between July 2002 and June 2011. The study included a group of subjects using U-500 insulin and a comparison group using U-100 insulin. The study was approved by the JAHVA Research & Development Committee and by the University of South Florida Institutional Review Board.
Inclusion criteria included diagnosis of T2DM, body mass index (BMI) of more than 30, use of U-500 insulin, or > 200 units daily of U-100 insulin. Exclusion criteria included hypoglycemia unawareness, type 1 DM, and use of an insulin pump. A total of 142 subjects met the inclusion criteria (68 in the U-500 group and 74 in the U-100 group).
All study subjects had at least 1 DM education session. U-500 subjects used insulin vials and 1-mL volumetric hypodermal syringes. All U-500 prescriptions were issued electronically in units and volume (U-500 insulin was available exclusively in vials during the time frame from which data were collected). Subjects in the U-100 group used insulin vials or pen devices. Laboratory studies were processed in house by the institution using high-pressure liquid chromatography to determine hemoglobin A1C (Hb A1C) levels. All study subjects required at least 2 Hb A1C measurements over the observed 12 months for inclusion.
Transition to U-500 Insulin
U-500 transition was considered routinely and presented as an option for patients requiring > 200 units of insulin daily. The transition criteria included adherence to medications, follow-up appointments, and glucose monitoring recommendations, and ability to learn and apply insulin self-adjustment instructions. All subjects were given an additional U-500 insulin education session before transition. The endocrinologist calculated all starting doses by reducing the total daily dose by 20%.
Data Collection
Data were collected using the automatic data mining tools within the JAHVA Computerized Patient Record System and confirmed individually by clinical staff. Demographic data included age, race, and sex. Other parameters were weight; BMI; Hb A1C; estimated glomerular filtration rate (eGFR); duration of DM; use of metformin and other oral agents; total daily insulin dose; number of daily injections; prior history of atherosclerotic cardiovascular disease (ASCVD), including coronary artery disease (CAD), cerebrovascular accident (CVA), or peripheral vascular disease (PVD); occurrence of severe hypoglycemia (symptomatic hypoglycemia requiring treatment assistance from another individual) and of new cardiovascular events, classified as CAD, CVA, or PVD.
For the U-500 group, data were collected and analyzed for the 3 months before (baseline) and the 12 months after the initiation of concentrated insulin. For the U-100 group, data were collected and analyzed for the comparable 3 months before (baseline) and the 12 months after the first clinic visit in which the subject started using more than 200 units per day of U-100. Frequency of follow-up visits was individualized according to clinical needs.
Clinical Endpoints
Primary outcomes included changes in Hb A1C from baseline to the following 12 months, and the occurrence of severe hypoglycemia. Secondary outcomes included the occurrence of new ASCVD events during the study, and changes in weight, BMI, and number of injections.
Statistical Analysis
The primary and secondary outcomes were assessed through univariate and multivariate general linear models. Multivariate models were used to compare differences in the variation of Hb A1C over time. Data were incomplete for the Hb A1C in 27 subjects, 6% of the dataset (Each subject had more than one variable or observation). Therefore, a multiple imputation was used to account for the incompleteness on Hb A1C (value substitutions by the mean and by the prior Hb A1C and models were balanced against the unaltered data). A P value of ≤ .05 was used to determine statistical significance. The statistical analyses were performed using IBM SPSS Statistics 21.
Results
Most patients were male (94%) of white race (86%), with a mean age of 57 years and comparable duration of DM (Table 1). Demographics were balanced between the groups, except for weight and BMI, both higher in the U-500 group (P < .001). Use of oral antidiabetic agents was not significantly different between groups, nor were comorbid conditions, with nearly 50% of subjects in each group affected by CKD and ASCVD, of which CAD was the most common (approximately 40% of both groups). Only about one-third of subjects used metformin and/or other oral agents, likely due to the high prevalence of CKD (contraindicating metformin) and high insulin requirements (due to correlation with β cell failure). A subgroup analysis of subjects on metformin did not demonstrate significant differences in risk of severe hypoglycemia or in Hb A1C levels (data not shown).
Both groups had similar initial Hb A1C baselines (> 9%) and both improved glycemic control during the study period. However, the Hb A1C reduction was greater in the U-500 group (P= .034), 0.84% vs 0.56% for U-100 and the between-groups difference was 0.4%. (Figure 1, Tables 2 and 3).
The univariate general linear model shows a statistically significant difference in the levels of Hb A1C within each treatment group, regardless of the imputation strategy. However, the differences were not significant when comparing postintervention Hb A1C means between groups with unaltered data (P = .23), because the U-500 group Hb A1C improvement gap narrowed at the end of study. In the multivariate analysis, irrespective of imputation method, the differences in Hb A1C between group treated with U-100 and U-500 were statistically significant (Table 3).
Overall, more subjects in the U-500 group than in the U-100 group achieved Hb A1C levels < 8.5% (56% vs 46%, respectively, P = .003) and the proportion of subjects achieving Hb A1C levels < 7.5% doubled that of the U-100 group (26% vs 12%; Figure 2). Five subjects in the U-500 group experienced severe hypoglycemia, compared with 1 in the U-100 group (P = .08). The total daily insulin dose was significantly higher in the U-500 group (296 units daily) than in the U-100 group (209 units daily) (P < .001) (Table 2). Baseline weight and BMI differences were also significant for the U-500 and U-100 groups (P < .001). Weight gain of approximately 2 kg occurred in both groups, a change that was not statistically significant (P = .79)
There were 21 new ASCVD events in the U-100 and 16 in the U-500 group (P = .51) and there were no statistically significant differences in the incidence of new CAD, PVD or CVA events. The U-500 group required significantly fewer injections than U-100 insulin users (2 vs 4; P < .001).
Discussion
The purpose of the study was to compare subjects with obesity and T2DM using U-500 concentrated insulin with similarly matched subjects using U-100 insulin. Available studies using U-500 insulin, including prospective trials, have reported the experience after transitioning patients who “failed” U-100 regimens.13-16,18,21-24 This failure is a relative and transient condition that, in theory, could be improved with medical intervention and lifestyle changes. Such changes cannot be easily quantified in a clinical trial or retrospective study without a control group. This study was an attempt to fill this knowledge gap.
The U-500 intervention resulted in a 0.8% overall reduction in Hb A1C and a significant 0.4% reduction compared to subjects using U-100. While both groups had improvement in Hb A1C , U-500 was associated with superior reductions in Hb A1C . This finding confirms prior assertions that U-500, compared with U-100, is associated with larger Hb A1C improvement.14-16
The preintervention and postintervention Hb A1C means were > 8% in both groups. This finding suggests that lowering Hb A1C is challenging, similar to published results demonstrating that Hb A1C levels < 7% are achieved by fewer than one-third of U-500 users.16-18 The explanation for this finding remains elusive, due to the methodologic limitations of a retrospective analysis. A possible explanation is the high prevalence of CKD and ASCVD among the study population, conditions which, according to guidelines justify less aggressive glycemic control efforts.25 Multiple prior studies using retrospective data8,13-16 and 2 prospective trials18,22 demonstrated similar Hb A1C reductions after failure of U-100 regimens.
In this study, U-500 resulted in a nominal increase in the risk of severe hypoglycemic episodes. A detailed review of the events found that most of these patients had preestablished CKD and ASCVD, and half of the subjects with sever hypoglycemic episodes had new vascular events during the study (Appendix). These findings suggest a possible correlation between CKD and ASCVD complications and the risk of severe hypoglycemic events. Pharmacokinetic profiles for U-500 have not been studied in subjects with CKD, but the clinical effect of CKD is likely prolonged by the expected reduction in insulin clearance. Similarly, the frailty associated with preexisting ASCVD, or the related polypharmacy, could be factors increasing the risk of hypoglycemia and deserve further study.
Most of the U-500 subjects used it twice daily in this study, which could have contributed to the higher hypoglycemia rate. In a prospective randomized trial Hood and colleagues reported a rate of symptomatic hypoglycemia exceeding 90% in the 2 study groups, and 8 subjects (of 325 total) had severe hypoglycemia during the 6-month observation. The group assigned to 2 daily injections had a significantly higher rate of hypoglycemic events compared with a group that had 3 injections per day.18 Additional studies are required to ascertain whether U-500, compared with specific U-100 regimens (basal-bolus vs premixed; human vs insulin analogs), results in a higher risk of severe hypoglycemia.
This study also investigated the incidence of new cardiovascular events, and no difference was found between the 2 groups. A longer observation would be required to better assess whether U-500 therapy can reduce the incidence of microvascular and macrovascular complications. The similar incidence of complications is further evidence of the similarity between the 2 studied groups. It was also reassuring to find that weight gains were small and nearly identical in both insulin groups.
Strengths and Limitations
This study has several limitations. Data about hospitalizations for congestive heart failure, amputations, progression of diabetic retinopathy, neuropathy, and nephropathy were not collected for this analysis. As both groups of subjects were relatively small, statistical power to assess outcomes is a concern. Retrospective chart reviews may also be affected by incomplete data collections and multiple biases. No data were available for other hypoglycemic episodes, especially to calculate the rate of the more common forms of hypoglycemia. The period of data analyzed spanned only about 15 months. A longer, longitudinal assessment of the differences between these 2 groups may yield more differences, and clearer results and conclusions. Moreover, the data set had aged before publication of this report; however, the authors think that the analysis and information remain highly clinically relevant. The uncommon use of U-500, and prominence as a “special case” insulin may also lead to a detection bias for severe hypoglycemia in the U-500 group. In contrast, lapses in documentation of hypoglycemia in subjects using U-100 could have occurred. Finally, the differences in total daily dose and body weight among groups were significant and may reflect on important physiologic differences between the 2 groups that may affect the reproducibility of our results.
Nevertheless, this study had notable strengths. Comparing U-500 insulin users with similar subjects using U-100 over a period of time provides head-to-head data with potentially important clinical utility. Also, we collected and analyzed a sizable number of clinically important variables, including cardiovascular risk factors, the occurrence of new cardiovascular events, and prevalence of renal disease. The use of linear regression and multivariate analysis using multiple models also strengthened the results. Previous studies compared the outcomes in subjects using U-500 insulin with only their historical selves.8,13-16,18,19,22-25 Therefore, these studies analyzed the data for preconversion and postconversion of U-500 only and consistently favored U-500. This design in a retrospective study cannot eliminate the selection and/or intervention biases, as the subjects of study had inevitably “failed” prior therapies. Similarly, there is no prospective clinical trial data comparing patients on U-500 with patients on high doses of U-100 insulin. Finally, the patients in our study had high rates of comorbidities, which may have increased the applicability of our results to those of “real-life” patients in the community. To our knowledge, no other study has attempted a similar study design approach either prospectively or retrospectively.
Conclusions
In this population of elderly veterans with severely insulin-resistant T2DM, with a high incidence of CKD and ASCVD, U-500 insulin was associated with significantly greater reductions in Hb A1C than U-100 insulin-based regimens, while requiring fewer injections. No difference was noted in the incidence of new ASCVD events. More studies are needed to assess whether U-500 may increase the risk of severe hypoglycemic episodes.
Acknowledgments
The authors recognize the invaluable help provided by the editorial staff of University of South Florida IMpact, the Intramural Review to Support Research and Scientific Publication, and especially to Richard F. Lockey, MD, who has mentored us in this beautiful journey of scientific writing and for his editorial assistance. A portion of this study preliminary data was presented as an abstract at ENDO 2013, The Endocrine Society Annual meeting in San Francisco, CA, June 15-18, 2013.
Appendix. Severe Hypoglycemic Events
Subject 1: U-500 user, 61-year-old African American male. Hypoglycemia occurred during fasting and was associated with a seizure-like event 9 months after transition to concentrated insulin. He was taken by ambulance to a local hospital. No additional data were obtained. Hb A1C was 8.2% in the month before the episode (lowest of the studied period) and increased to 9.1% in the last segment of the study.
Subject 2: U-500 user, 57-year-old white male. The severe hypoglycemic episode occurred approximately 8 months after transition. His Hb A1C was 5.6% around the time of the event, the lowest of the studied period, and increased to 6.8% over the next 4 months. No other data were available.
Subject 3: U-500 user, 67-year-old white male. The event occurred at home in the morning while fasting, 3 months after transition. He was assisted by his family. Hb A1C was 7.1% 10 weeks after the event and was 7% at the end of the studied period. He had a history of CKD and PVD.
Subject 4: U-500 user, 68-year-old white male. He presented with altered consciousness, hypoglycemia, and elevated troponin levels, which was later confirmed as a non-ST elevation myocardial infarction (NSTEMI), 7 months after transition. Hb A1C during the events was 7.1% and was followed by a 9.3% level 9 weeks later. He had history of CKD and PVD.
Subject 5: U-500 user, 67-year-old white man. Hypoglycemia occurred 6 months after transition to U-500. Hb A1C was 8.4% 2 months prior, and was followed by a 7% during the admission for severe hypoglycemia. 3 months later, his HbA1c rose to 8.2%. He had an extensive history of CAD and had a NSTEMI during the study period.
Subject 6: U-100 user, 65-year-old white man. He was found unconscious in the morning while fasting, 6 months after his first clinic visit. He had CKD and advanced ASCVD with prior CAD, PVD, and CVA. He had also had a recent CVA that had affected his movement and cognition.
1. Hales CM, Carroll MD, Fryar CD, Ogden CL. Prevalence of obesity among adults and youth: United States, 2015–2016. NCHS data brief no. 288. Published October 2017. Accessed January 29, 2021. https://www.cdc.gov/nchs/products/databriefs/db288.htm
2. Centers for Disease Control and Prevention. Diabetes and prediabetes: CDC works to prevent type 2 diabetes and improve the health of all people with diabetes. Updated November 30, 2020. Accessed February 17, 2021. https://www.cdc.gov/chronicdisease/resources/publications/factsheets/diabetes-prediabetes.htm
3. Cochran E, Gorden P. Use of U-500 insulin in the treatment of severe insulin resistance. Insulin. 2008;3(4):211-218 [Published correction appears in Insulin. 2009;4(1):81]. doi:10.1016/S1557-0843(08)80049-8
4. Shrestha RT, Kumar AF, Taddese A, et al. Duration and onset of action of high dose U-500 regular insulin in severely insulin resistant subjects with type 2 diabetes. Endocrinol Diabetes Metab. 2018;1(4):e00041. Published 2018 Sep 10. doi:10.1002/edm2.41
5. Dailey AM, Tannock LR. Extreme insulin resistance: indications and approaches to the use of U-500 insulin in type 2 diabetes mellitus. Curr Diab Rep. 2011;11(2):77-82. doi:10.1007/s11892-010-0167-6
6. de la Peña A, Riddle M, Morrow LA, et al. Pharmacokinetics and pharmacodynamics of high-dose human regular U-500 insulin versus human regular U-100 insulin in healthy obese subjects [published correction appears in Diabetes Care. 2014 Aug;37(8):2414]. Diabetes Care. 2011;34(12):2496-2501. doi:10.2337/dc11-0721
7. Brusko C, Jackson JA, de la Peña A. Comparative properties of U-500 and U-100 regular human insulin. Am J Health Syst Pharm. 2013;70(15):1283-1284. doi:10.2146/130117
8. Dailey AM, Williams S, Taneja D, Tannock LR. Clinical efficacy and patient satisfaction with U-500 insulin use. Diabetes Res Clin Pract. 2010;88(3):259-264. doi:10.1016/j.diabres.2010.02.012
9. Wysham C, Hood RC, Warren ML, Wang T, Morwick TM, Jackson JA. Effect of total daily dose on efficacy, dosing, and safety of 2 dose titration regimens of human regular U-500 insulin in severely insulin-resistant patients with type 2 diabetes. Endocr Pract. 2010;22(6):653-665. doi:10.4158/EP15959.OR
10. Gagnon-Auger M, du Souich P, Baillargeon JP, et al. Dose-dependent delay of the hypoglycemic effect of short-acting insulin analogs in obese subjects with type 2 diabetes: a pharmacokinetic and pharmacodynamic study. Diabetes Care. 2010;33(12):2502-2507. doi:10.2337/dc10-1126
11. Schloot NC, Hood RC, Corrigan SM, Panek RL, Heise T. Concentrated insulins in current clinical practice. Diabetes Res Clin Pract. 2019;148:93-101. doi:10.1016/j.diabres.2018.12.007
12. Lane WS, Cochran EK, Jackson JA, et al. High-dose insulin therapy: is it time for U-500 insulin?. Endocr Pract. 2009;15(1):71-79. doi:10.4158/EP.15.1.71
13. Boldo A, Comi RJ. Clinical experience with U500 insulin: risks and benefits. Endocr Pract. 2012;18(1):56-61. doi:10.4158/EP11163.OR
14. Granata JA, Nawarskas AD, Resch ND, Vigil JM. Evaluating the effect of u-500 insulin therapy on glycemic control in veterans with type 2 diabetes. Clin Diabetes. 2015;33(1):14-19. doi:10.2337/diaclin.33.1.14
15. Eby EL, Zagar AJ, Wang P, et al. Healthcare costs and adherence associated with human regular U-500 versus high-dose U-100 insulin in patients with diabetes. Endocr Pract. 2014;20(7):663-670. doi:10.4158/EP13407.OR
16. Eby EL, Curtis BH, Gelwicks SC, et al. Initiation of human regular U-500 insulin use is associated with improved glycemic control: a real-world US cohort study. BMJ Open Diabetes Res Care. 2015;3(1):e000074. Published 2015 Apr 30. doi:10.1136/bmjdrc-2014-000074
17. Jones P, Idris I. The use of U-500 regular insulin in the management of patients with obesity and insulin resistance. Diabetes Obes Metab. 2013;15(10):882-887. doi:10.1111/dom.12094
18. Hood RC, Arakaki RF, Wysham C, Li YG, Settles JA, Jackson JA. Two treatment approaches for human regular U-500 insulin in patients with type 2 diabetes not achieving adequate glycemic control on high-dose U-100 insulin therapy with or without oral agents: a randomized, titration-to-target clinical trial. Endocr Pract. 2015;21(7):782-793. doi: 10.4158/EP15612.OR
19. Ballani P, Tran MT, Navar MD, Davidson MB. Clinical experience with U-500 regular insulin in obese, markedly insulin-resistant type 2 diabetic patients [published correction appears in Diabetes Care. 2007 Feb;30(2):455]. Diabetes Care. 2006;29(11):2504-2505. doi:10.2337/dc06-1478
20. Davidson MB, Navar MD, Echeverry D, Duran P. U-500 regular insulin: clinical experience and pharmacokinetics in obese, severely insulin-resistant type 2 diabetic patients. Diabetes Care. 2010;33(2):281-283. doi:10.2337/dc09-1490
21. Bulchandani DG, Konrady T, Hamburg MS. Clinical efficacy and patient satisfaction with U-500 insulin pump therapy in patients with type 2 diabetes. Endocr Pract. 2007;13(7):721-725. doi:10.4158/EP.13.7.721
22. Lane WS, Weinrib SL, Rappaport JM, Przestrzelski T. A prospective trial of U500 insulin delivered by Omnipod in patients with type 2 diabetes mellitus and severe insulin resistance [published correction appears in Endocr Pract. 2010 Nov-Dec;16(6):1082]. Endocr Pract. 2010;16(5):778-784. doi:10.4158/EP10014.OR
23. Martin C, Perez-Molinar D, Shah M, Billington C. U500 Disposable Patch Insulin Pump: Results and Discussion of a Veterans Affairs Pilot Study. J Endocr Soc. 2018;2(11):1275-1283. Published 2018 Sep 17. doi:10.1210/js.2018-00198
24. Ziesmer AE, Kelly KC, Guerra PA, George KG, Dunn FL. U500 regular insulin use in insulin-resistant type 2 diabetic veteran patients. Endocr Pract. 2012;18(1):34-38. doi:10.4158/EP11043.OR
25. American Diabetes Association. 6. Glycemic Targets: Standards of Medical Care in Diabetes-2019. Diabetes Care. 2019;42(Suppl 1):S61-S70. doi:10.2337/dc19-S006