User login
Divine Calling and Human Rank: The Locus of Authority for Military Chaplains
Divine Calling and Human Rank: The Locus of Authority for Military Chaplains
Render unto Caesar the things that are Caesar’s, and to God the things that are God’s.
Matthew 22:21
While in my 20s, I taught religious education at a church on the Army base where I was born and had the honor of working with military chaplains. During my US Department of Veterans Affairs career, I closely collaborated with chaplains—many of whom were veterans—on patient care and ethics consultations. Some were quite proud of their rank and interested in climbing the ladder of promotion. A few made sure you knew what they wore or had worn on their uniform, while most were incredibly humble and sheepish when soldiers saluted them. Those visible responses to rank may be hidden if chaplains will no longer be permitted to wear insignia indicating their grade.
Department of War Secretary Peter Hegseth, a combat veteran who has championed a “combative” form of Christianity, announced in April 2026 that chaplains would no longer wear their rank on their uniform.1 Details of how this shift will be translated into regulation, policy, and actions were not provided. Secretary Hegseth did not remove the actual rank of members of the chaplain corps and they would retain their rank, attendant pay, benefits, responsibilities, and privileges. However, instead of bearing the insignia of their military station, under this new policy only the symbol of their religious profession would identify them. Currently, both a military officer’s rank and religious symbol are displayed.2
Useful insight can be gained from an historical perspective, which demonstrates that the concerns and contention about the issue of chaplain’s wearing rank are not new. There have been chaplains in the US Army since 1775.3 Army chaplains initially wore only a religious symbol on their clothing. In April 1914, chaplain leaders successful argued that chaplains deserved the privileges, respect, and prospect for promotion that rank symbolized and where authorized to display their position. Four years later, General Jack Pershing cabled the then Secretary of War opposing the new policy: “Believe the work of chaplains would be facilitated if they were not given military rank ... Many of our principal ministers believe that their relations would be closer if they did not have military titles and did not wear insignia.”4 Interestingly, Secretary Hegseth articulated the same concern: “A chaplain is first and foremost a chaplain and an officer second. This change is a visual representation of that fact.”5
Hegseth has stated that in recent years the military chaplain corps had drifted too far in the direction of providing spiritual counseling and psychological support. This contravenes the current competencies especially for company-grade military chaplains who primarily minister to the moral distress and spiritual needs of service members.4 The removal of rank is thus best understood as part of Secretary Hegseth’s broader plan to remake the chaplain corps into his vision of religious ministry in the military.5
Secretary Hegseth proffered several arguments for the necessity of removing rank in part to reorient the chaplain corps to what he calls a more fundamental mission. The first was theological: chaplains need to prioritize their “divine calling” rather than any human distinction. Chaplain theologians and ethicists have expressed similar concerns that in wearing rank, military chaplains become servants of the state and not of God. Adam Tietje articulates the corruptive influence this shift in the source of legitimacy has on the military chaplain’s spiritual mission:
This undermines the ability of chaplains to provide care and counsel to both soldiers and leaders that is not muddied with the interests of the military. Chaplains without rank are better positioned to hear and advocate for their soldier’s matters of conscience as well as bear witness to the moral claims of their respective religious communities especially about war itself.3
The second argument is pastoral. Hegseth contends that service members of lower rank would feel more comfortable and secure approaching chaplains with no outward sign of their higher position. Chaplain interactions with military personnel carry a degree of confidentiality higher than that of either doctors or lawyers. Chaplains, as they were in the past, remain divided on this important consideration.4,5
The third argument is ethical in nature. Secretary Hegseth contends that excluding any manifestation of military rank, “speaks to the difficult balance of the duality” of the role.6 It seems he is proposing that chaplains displaying only the image of their faith commitment symbolically resolves the inherent moral conflict between serving human masters as a military officer, and the divine as a minister.7 Military chaplains and health care professionals are all too familiar with the dilemma of having 2 masters and the challenge of negotiating legally and ethically overlapping roles.8-10
This may seem to some like a minor change in chaplain etiquette to some, but to others it signals a significant ethical and political change with potential import beyond chaplaincy. One military commentator has suggested the move sets a dangerous precedent that could eventually be applied to both health care professionals and the judge advocate corps.11 At this point this is only speculation and its slippery slope arguments are logically suspect without evidence. Yet at least 1 study suggests that the influence of military physician’s rank on patient care may lead to inequities in the care delivered to patients with lower grade.12
It is commanders who are the decision-makers in the military. Chaplains who are field grade officers serve as trusted staff advisors in moral, ethical, and spiritual matters.4 Some chaplains fear that without rank leaders at all levels will not have adequate trust and sufficient respect to heed their crucial counsel especially regarding high-stakes strategic decisions in wartime.8 The more serious concern is with a major shift in the locus of authority to determine the professional identity of chaplains, that could in theory be expanded to impact military health care practitioners, and attorneys. The independent expert judgment of these professionals regarding what is necessary to fulfil their respective roles in providing spiritual ministry, medical care, and legal is critical to uphold the highest values of the US military.11 Chaplains have long struggled with what they owe to the Caesar and to God: how the Secretary’s recent decision will shape that rendering is uncertain. What is certain is that military chaplains of all faiths and in every branch of the armed services will continue to minister to their brothers and sisters in arms with courage and compassion.
- Baker R, Graham R. Pete Hegseth and his ‘battle cry’ for a new christian crusade. The New York Times. December 6, 2024. Accessed April 24, 2026. https://www.nytimes.com/2024/12/05/us/hegseth-church-crusades.html
- Sampson E. Hegseth removes rank insignia from military chaplains. Military Times. March 25, 2026. Accessed April 24, 2026. https://www.militarytimes.com/news/pentagon-congress/2026/03/25/hegseth-removes-rank-insignia-from-military-chaplains/
- Tietje A. A seductive confusion of authority: military chaplains and the wearing of rank. J Church State. 2020;62:506-524.
- Morris JT. Military chaplaincy in the USA: an unfolding of roles and functions. In: Weiss H, Federschmidt KH, Louw DJ, et al, eds. Care, Healing, and Human Well-Being Within Interreligious Discourses. African Sun Media; 2021:319-333.
- Cox M. Hegseth’s push for chaplain’s to shed remove rank sparks debate. Air and Space Forces Magazine. March 27, 2026. Accessed April 29, 2026. https://www.airandspaceforces.com/chaplains-ordered-to-shed-rank-ret-af-leaders-question-move/
- Mitchell E. Hegseth: Military chaplains will no longer display rank. The Hill. March 25, 2026. Accessed April 24, 2026. https://thehill.com/policy/defense/5800026-pete-hegseth-military-chaplains-faith-insignia/
- Banks AM. Hegseth’s removal of the top Army chaplain raises ‘troubling questions’ from Black denomination. Religious News Service. April 9, 2026. Accessed April 24, 2026. https://religionnews.com/2026/04/09/army-chaplains-chiefs-firing-prompts-serious-concern-from-black-baptist-denomination/
- Burchard WW. Role conflicts of military chaplains. Amer Sociolog Rev. 1954;19:528-535 https://www.jstor.org/stable/2087790
- Sturtz DL. Commitment. Mil Med. 2001;166:741-744.
- Carver D. New Department of War policy: military chaplains no longer wear rank insignia. North American Mission Board. April 8, 2026. Accessed April 24, 2026. https://www.namb.net/resource/new-department-of-war-policy-military-chaplains-no-longer-wear-rank-insignia/
- Petri D. If chaplains are ‘officers second,’ which staff corps officers are next? Military Times. April 1, 2026. Accessed April 24, 2026. https://www.militarytimes.com/opinion/2026/04/01/if-chaplains-are-officers-second-which-staff-corps-officers-are-next/
- Schwab SD, Singh M. How power shapes behavior: evidence from physicians. Science. 2024; 384:802-807.
Render unto Caesar the things that are Caesar’s, and to God the things that are God’s.
Matthew 22:21
While in my 20s, I taught religious education at a church on the Army base where I was born and had the honor of working with military chaplains. During my US Department of Veterans Affairs career, I closely collaborated with chaplains—many of whom were veterans—on patient care and ethics consultations. Some were quite proud of their rank and interested in climbing the ladder of promotion. A few made sure you knew what they wore or had worn on their uniform, while most were incredibly humble and sheepish when soldiers saluted them. Those visible responses to rank may be hidden if chaplains will no longer be permitted to wear insignia indicating their grade.
Department of War Secretary Peter Hegseth, a combat veteran who has championed a “combative” form of Christianity, announced in April 2026 that chaplains would no longer wear their rank on their uniform.1 Details of how this shift will be translated into regulation, policy, and actions were not provided. Secretary Hegseth did not remove the actual rank of members of the chaplain corps and they would retain their rank, attendant pay, benefits, responsibilities, and privileges. However, instead of bearing the insignia of their military station, under this new policy only the symbol of their religious profession would identify them. Currently, both a military officer’s rank and religious symbol are displayed.2
Useful insight can be gained from an historical perspective, which demonstrates that the concerns and contention about the issue of chaplain’s wearing rank are not new. There have been chaplains in the US Army since 1775.3 Army chaplains initially wore only a religious symbol on their clothing. In April 1914, chaplain leaders successful argued that chaplains deserved the privileges, respect, and prospect for promotion that rank symbolized and where authorized to display their position. Four years later, General Jack Pershing cabled the then Secretary of War opposing the new policy: “Believe the work of chaplains would be facilitated if they were not given military rank ... Many of our principal ministers believe that their relations would be closer if they did not have military titles and did not wear insignia.”4 Interestingly, Secretary Hegseth articulated the same concern: “A chaplain is first and foremost a chaplain and an officer second. This change is a visual representation of that fact.”5
Hegseth has stated that in recent years the military chaplain corps had drifted too far in the direction of providing spiritual counseling and psychological support. This contravenes the current competencies especially for company-grade military chaplains who primarily minister to the moral distress and spiritual needs of service members.4 The removal of rank is thus best understood as part of Secretary Hegseth’s broader plan to remake the chaplain corps into his vision of religious ministry in the military.5
Secretary Hegseth proffered several arguments for the necessity of removing rank in part to reorient the chaplain corps to what he calls a more fundamental mission. The first was theological: chaplains need to prioritize their “divine calling” rather than any human distinction. Chaplain theologians and ethicists have expressed similar concerns that in wearing rank, military chaplains become servants of the state and not of God. Adam Tietje articulates the corruptive influence this shift in the source of legitimacy has on the military chaplain’s spiritual mission:
This undermines the ability of chaplains to provide care and counsel to both soldiers and leaders that is not muddied with the interests of the military. Chaplains without rank are better positioned to hear and advocate for their soldier’s matters of conscience as well as bear witness to the moral claims of their respective religious communities especially about war itself.3
The second argument is pastoral. Hegseth contends that service members of lower rank would feel more comfortable and secure approaching chaplains with no outward sign of their higher position. Chaplain interactions with military personnel carry a degree of confidentiality higher than that of either doctors or lawyers. Chaplains, as they were in the past, remain divided on this important consideration.4,5
The third argument is ethical in nature. Secretary Hegseth contends that excluding any manifestation of military rank, “speaks to the difficult balance of the duality” of the role.6 It seems he is proposing that chaplains displaying only the image of their faith commitment symbolically resolves the inherent moral conflict between serving human masters as a military officer, and the divine as a minister.7 Military chaplains and health care professionals are all too familiar with the dilemma of having 2 masters and the challenge of negotiating legally and ethically overlapping roles.8-10
This may seem to some like a minor change in chaplain etiquette to some, but to others it signals a significant ethical and political change with potential import beyond chaplaincy. One military commentator has suggested the move sets a dangerous precedent that could eventually be applied to both health care professionals and the judge advocate corps.11 At this point this is only speculation and its slippery slope arguments are logically suspect without evidence. Yet at least 1 study suggests that the influence of military physician’s rank on patient care may lead to inequities in the care delivered to patients with lower grade.12
It is commanders who are the decision-makers in the military. Chaplains who are field grade officers serve as trusted staff advisors in moral, ethical, and spiritual matters.4 Some chaplains fear that without rank leaders at all levels will not have adequate trust and sufficient respect to heed their crucial counsel especially regarding high-stakes strategic decisions in wartime.8 The more serious concern is with a major shift in the locus of authority to determine the professional identity of chaplains, that could in theory be expanded to impact military health care practitioners, and attorneys. The independent expert judgment of these professionals regarding what is necessary to fulfil their respective roles in providing spiritual ministry, medical care, and legal is critical to uphold the highest values of the US military.11 Chaplains have long struggled with what they owe to the Caesar and to God: how the Secretary’s recent decision will shape that rendering is uncertain. What is certain is that military chaplains of all faiths and in every branch of the armed services will continue to minister to their brothers and sisters in arms with courage and compassion.
- Baker R, Graham R. Pete Hegseth and his ‘battle cry’ for a new christian crusade. The New York Times. December 6, 2024. Accessed April 24, 2026. https://www.nytimes.com/2024/12/05/us/hegseth-church-crusades.html
- Sampson E. Hegseth removes rank insignia from military chaplains. Military Times. March 25, 2026. Accessed April 24, 2026. https://www.militarytimes.com/news/pentagon-congress/2026/03/25/hegseth-removes-rank-insignia-from-military-chaplains/
- Tietje A. A seductive confusion of authority: military chaplains and the wearing of rank. J Church State. 2020;62:506-524.
- Morris JT. Military chaplaincy in the USA: an unfolding of roles and functions. In: Weiss H, Federschmidt KH, Louw DJ, et al, eds. Care, Healing, and Human Well-Being Within Interreligious Discourses. African Sun Media; 2021:319-333.
- Cox M. Hegseth’s push for chaplain’s to shed remove rank sparks debate. Air and Space Forces Magazine. March 27, 2026. Accessed April 29, 2026. https://www.airandspaceforces.com/chaplains-ordered-to-shed-rank-ret-af-leaders-question-move/
- Mitchell E. Hegseth: Military chaplains will no longer display rank. The Hill. March 25, 2026. Accessed April 24, 2026. https://thehill.com/policy/defense/5800026-pete-hegseth-military-chaplains-faith-insignia/
- Banks AM. Hegseth’s removal of the top Army chaplain raises ‘troubling questions’ from Black denomination. Religious News Service. April 9, 2026. Accessed April 24, 2026. https://religionnews.com/2026/04/09/army-chaplains-chiefs-firing-prompts-serious-concern-from-black-baptist-denomination/
- Burchard WW. Role conflicts of military chaplains. Amer Sociolog Rev. 1954;19:528-535 https://www.jstor.org/stable/2087790
- Sturtz DL. Commitment. Mil Med. 2001;166:741-744.
- Carver D. New Department of War policy: military chaplains no longer wear rank insignia. North American Mission Board. April 8, 2026. Accessed April 24, 2026. https://www.namb.net/resource/new-department-of-war-policy-military-chaplains-no-longer-wear-rank-insignia/
- Petri D. If chaplains are ‘officers second,’ which staff corps officers are next? Military Times. April 1, 2026. Accessed April 24, 2026. https://www.militarytimes.com/opinion/2026/04/01/if-chaplains-are-officers-second-which-staff-corps-officers-are-next/
- Schwab SD, Singh M. How power shapes behavior: evidence from physicians. Science. 2024; 384:802-807.
Divine Calling and Human Rank: The Locus of Authority for Military Chaplains
Divine Calling and Human Rank: The Locus of Authority for Military Chaplains

Cannabis Use by Veterans and Potential Interactions With Antineoplastic Agents: Analysis and Literature Review
Cannabis Use by Veterans and Potential Interactions With Antineoplastic Agents: Analysis and Literature Review
Cannabis has a long history of use for medicinal and recreational purposes. Research illustrates the potential benefits and increased prevalence of cannabis use in patients with cancer.1 Cannabis products have been shown to possess antineoplastic and palliative activity, improving nociceptive and neuropathic pain in addition to chemotherapy-related nausea and vomiting.2-5 Despite these developments and changing social attitudes toward cannabis, there remains a lack of comprehensive data on patient perspectives regarding its use, especially in regions where cannabis remains illegal. This knowledge gap is notable among veterans undergoing cancer treatment in states where cannabis is prohibited. Up to 57% of veterans report lifetime marijuana use, making it crucial to understand this population’s cannabis use patterns and potential interactions with cancer treatments.6
This observational study sought to determine the prevalence of cannabis use among patients undergoing cancer treatment at the US Department of Veterans Affairs (VA) Memphis Healthcare System and evaluate the potential risks associated with combining cannabis products with anticancer therapies.
METHODS
This prospective observational study identified cannabis use among veterans receiving antineoplastic therapy at the Lt. Col. Luke Weathers Jr. VA Medical Center (WJVAMC) and analyzed potential interactions between cannabis products and their cancer treatments. Participants included adults aged > 18 years undergoing antineoplastic therapy at WJVAMC who consented to the study. Data collection involved a written survey approved by the WJVAMC Institutional Review Board and verbal consent from participants. The survey asked participants about their cannabis use in the previous 90 days, including details on quantity, frequency, and method of consumption (eg, inhalation, oral, topical). No incentives were offered for participation.
Surveys from 50 patients who used cannabis were analyzed and their electronic health records were reviewed for sex, age, diagnosis, and antineoplastic regimen. This information was securely stored. A literature review was conducted using PubMed and the Cochrane Library to explore potential interactions between cannabis and the antineoplastic agents that were prescribed to patients in the study, focusing on toxicity, efficacy, or synergistic effects.
Patients were categorized into 4 groups based on treatment: cytotoxic chemotherapy, immunotherapy, endocrine therapy, and targeted therapy. Patients undergoing multiple types of therapies were included in each applicable category.
RESULTS
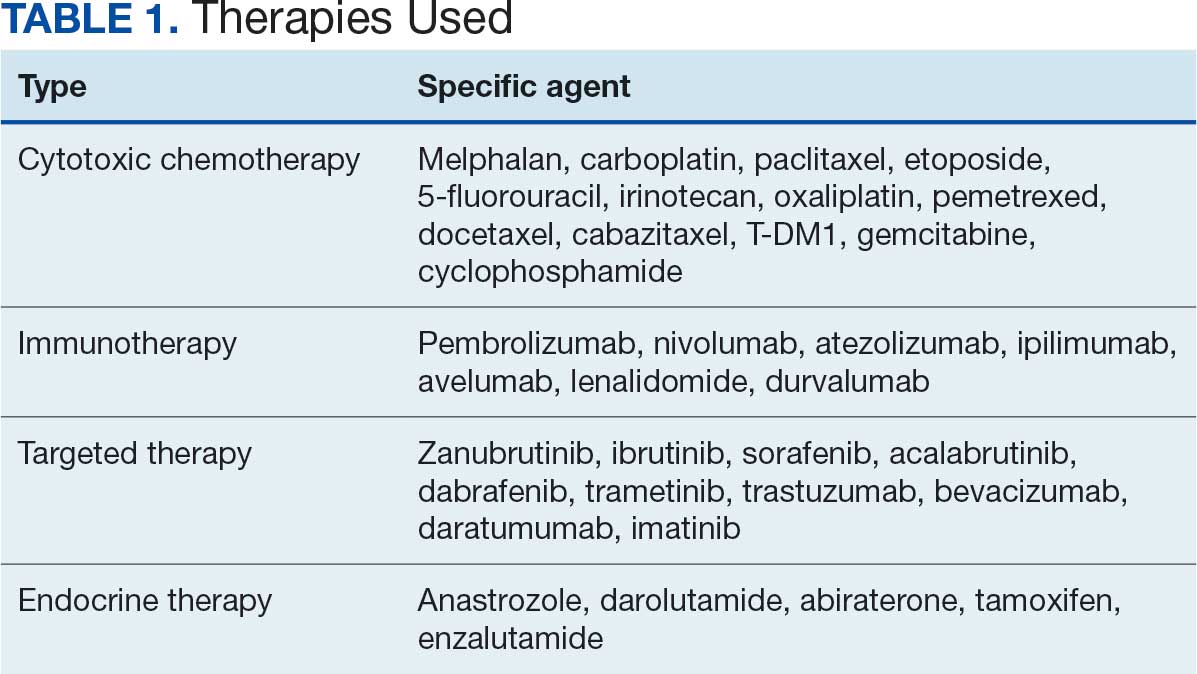
A total of 132 patients agreed to participate. Fifty patients (38%) acknowledged using cannabis products within 90 days. The patients that used cannabis products within 90 days of the survey reported the following malignancies: 8 patients (16%) had prostate cancer, 3 patients (6%) had hepatocellular carcinoma, 7 patients (14%) had pancreatic carcinoma, 5 patients (10%) had multiple myeloma, 3 patients (6%) had chronic lymphocytic leukemia, 9 patients (18%) had non-small cell lung cancer, 3 patients (6%) had breast cancer, 3 (6%) patients had bladder cancer, 2 patients (4%) had renal cell carcinoma, 1 (2%) patient had chronic myeloid leukemia, 1 (2%) patient had renal amyloid, 1 patient (2%) had supraglottic squamous cell carcinoma, 1 patient (2%) had esophageal carcinoma, 1 (2%) patient had small cell lung cancer, 1 (2%) patient had gastric cancer, and 1 patient (2%) had follicular lymphoma.
Five (10%) of the cannabis users were female, and 45 (90%) were male. Twenty-nine patients (58%) were aged 66 to 75 years, 16 (32%) were aged 56 to 65 years, 3 (6%) were aged 46 to 55 years, and 2 (4%) were aged 76 to 85 years.
Thirty-five patients (70%) inhaled cannabis as opposed to using it via other formulations or a combination (eg, inhalation and topical). Thirty-eight percent of patients used cannabis once daily, 24% used < 1 daily, and 28% used it ≥ 2 times daily. Five patients (10%) did not report the frequency of their cannabis use. Among the patients who reported cannabis use, 21 (42%) were undergoing cytotoxic chemotherapy, 19 (38%) were undergoing immunotherapy, 12 (24%) were undergoing targeted therapy, and 10 (20%) were undergoing endocrine therapy. Some patients were treated with multiple types of antineoplastic agents and were counted in multiple categories (Table 1).
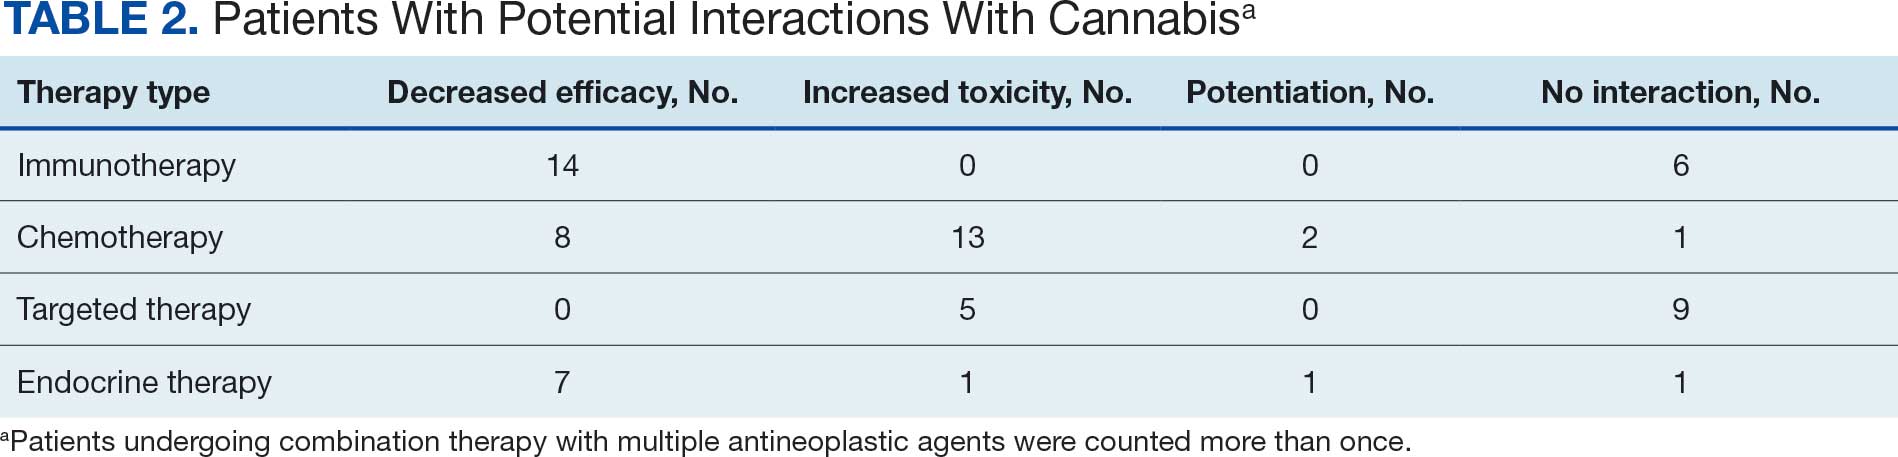
Following a literature review of cannabis and antineoplastic agents, patients were evaluated for the potential effects of cannabis on their treatment. The literature review revealed that 31% of cytotoxic chemotherapy agents received by patients in this study might have increased toxicity, and 19% could have reduced efficacy when combined with cannabis. Among immunotherapy agents received by patients in this study, 70% might have decreased efficacy when combined with cannabis use. For targeted therapies, 35% could have increased toxicity, and 70% of endocrine agents could potentially have decreased efficacy (Table 2).
DISCUSSION
This prospective study corroborates previous research by demonstrating that more than one-third of patients receiving oncology care at WJVAMC use cannabis, most often inhaled. Cannabis use was observed among patients undergoing various cancer therapies, including cytotoxic chemotherapy, immunotherapy, targeted therapy, and endocrine therapy. The most common malignancies among cannabis users at WJVAMC include patients with lung cancer, prostate cancer, pancreatic cancer, and multiple myeloma. Cannabis use in patients with pancreatic cancer and multiple myeloma was significantly out of proportion to their prevalence at WJVAMC. This could potentially be due to their drastic effect on quality of life.
Cannabis use increased the risk of toxicity in patients treated with cytotoxic chemotherapy and targeted therapy. Cannabis use potentially decreased efficacy for patients treated with cytotoxic chemotherapy and/or immunotherapy. Cannabis use did not increase the risk of toxicity or efficacy in patients treated with endocrine therapy.
Antineoplastics/Cannabis Interactions
The potential interactions between cannabis and antineoplastic therapies administered at WJVAMC are worth exploring. While this review aims to shed light on possible interactions, it is important to acknowledge that much of the data is preliminary and derived from in vitro studies. The interactions should be interpreted as potential risks rather than established facts. Additional research is needed to confirm these interactions and effectively guide clinical practices. Understanding these dynamics is essential to optimize patient care and manage the complex interplay between cannabis use and cancer treatment.
Originating from Central Asia, the cannabis plant contains > 400 medicinally relevant compounds, of which about 100 are cannabinoids (CBs). Key CBs are cannabidiol (CBD), a nonpsychoactive compound, and ?-9-tetrahydrocannabinol (THC), a psychoactive compound. THC can make up 20% to 30% of the dry weight of female cannabis flowers.7
CBs act through the endocannabinoid system, involving CB1 and CB2 receptors, endogenous CBs like anandamide (AEA) and 2-arachidonoylglycerol, and various enzymes. These endogenous CBs, derived from arachidonic acid, play roles in cell growth and proliferation.8 In some studies, AEA has induced apoptosis in neuroblastoma cells and inhibited proliferation in breast cancer cells. However, other research suggests AEA may block apoptosis under certain conditions.9
CB receptors are transmembrane proteins that interact with CBs differently depending on tissue type and CB structure. Synthetic CBs are designed to target specific receptors, while natural CBs may act as both agonists and antagonists.10
Cytochrome P450 Metabolism
The human cytochrome P450 (CYP) 3A subfamily affects the metabolism of many therapeutic drugs, including cancer therapeutics.11 The various compositions of cannabis are primarily metabolized by the CYP450 pathway, the same as many cancer-directed pharmacologic treatments. CBs act as both CYP inducers and inhibitors. THC, for example, is a CYP inducer whereas CBD is a CYP inhibitor; both are found in the various compounds available for consumption.12,13 Pharmacology research has suggested potential interactions and effects on established adverse symptoms, but clinical data are lacking, and current research revealing interactions are only recognized in vitro.14
The Antineoplastic Activity of Cannabis
CBs can affect various cancer-related pathways such as PKB, AMPK, CAMKK-ß, mTOR, PDHK, HIF-1 a, and PPAR-γ. Δ-9-THC can selectively induce apoptosis in tumor cells without harming normal cells, though the exact mechanism remains unclear. Promising results from early mouse studies led to a 2006 human study where intracranial Δ-9-THC in patients with recurrent glioma yielded a median survival of 24 weeks, with 2 patients surviving > 1 year.15
In a 2022 review article, Cherkasova et al highlighted potential clinical benefits of cannabis across various cancers. They found that upregulated CB1 receptors in colon cancer might enhance the effect of 5-fluorouracil. However, many studies are preliminary and therefore not definitive.10
Additional research is needed to refine these findings. Challenges include variability in cannabis formulations, the complex tumor microenvironment, and the legal and psychoactive issues surrounding cannabis use. These factors complicate the design of multicenter randomized studies and may deter patients from disclosing cannabis use, thereby hindering efforts to fully understand its therapeutic potential.
Cannabis/Cytotoxic Chemotherapy Interactions
The chemotherapy agents used in this study included carboplatin, paclitaxel, 5-fluorouracil, etoposide, irinotecan, oxaliplatin, pemetrexed, docetaxel, cabazitaxel, T-DM1, gemcitabine, and cyclophosphamide. There is a paucity of research regarding the interactions between cytotoxic chemotherapy and cannabis. Most studies focused on CBD due to its inhibition of the CYP450 pathway, which is used for metabolizing cytotoxic chemotherapies. Through this mechanism, CBD could potentially increase the concentrations of chemotherapeutic agents, enhancing their toxicity.
When combined with irinotecan, cannabis can pose risks. Δ-9-THC undergoes first-pass metabolism in the liver, mediated by the CYP450 system and CYP3A4. The glucuronidation of irinotecan is mediated by uridine diphosphate glycosyltransferase, leading to its recirculation within the hepatic system and potentially increased toxicity due to prolonged drug presence. Cannabis may also compete with drug binding to albumin, altering the plasma concentrations of irinotecan and its conversion to the metabolite SN38.16
Cannabis products can affect chemotherapy levels by interacting with cellular transporters. The MRP1 transporter family, encoded by the ABCC gene family, is expressed mainly in the lung, kidney, skeletal muscle, and hematopoietic stem cells. A 2018 study investigating the effects of THC, CBD, and CBN on MRP1 transporters found that the presence of a cannabis component increased the concentration of vincristine 3-fold. Additional studies suggest the interaction with the CB1 receptor may lead to changes in the expression of MRP1 transporters.17
CBD inhibits the BCRP transporter, which functions as an efflux pump for methotrexate. Consequently, CBD can increase methotrexate levels, potentially enhancing efficacy but also worsening adverse effects.18
In pancreatic cancer, CBD specifically interacts with gemcitabine. CB1 and CB2 receptors are upregulated, and CBD inhibits the GPR55 receptor. These interactions may enhance the antineoplastic effect of gemcitabine, reducing cell cycle progression and growth.19
CBD also interacts with temozolomide (TMZ) by affecting extracellular vesicles used by cells for pro-oncogenic signaling and immune system evasion. Experiments on patient-derived glioblastoma cells, both chemotherapy-resistant and chemotherapy-sensitive, found that CBD increases the formation of extracellular vesicles with reduced levels of miR21 (pro-oncogenic) and elevated levels of miR126 (antioncogenic).20 CBD has also been found to decrease prohibitin levels, a protein associated with TMZ resistance.
In patients with glioblastoma, CBD combined with chemotherapeutic agents like TMZ, carmustine, doxorubicin, and cisplatin has shown increased sensitivity and improved tumor response. CBD is also known to inhibit NF-kB, a pathway that sustains tumor viability despite chemotherapy.21 Additionally, CBD inhibits the P-glycoprotein system, affecting chemotherapy efflux from neoplastic cells.14 In vitro studies have found that CBD is synergistic with bortezomib in inhibiting cancer cell viability. In another glioblastoma model, CBD enhanced the antiproliferative effects of both TMZ and carmustine.14
Different cannabis formulations may vary in how they interact with various cytotoxic chemotherapeutic agents. Some may potentiate the effects of chemotherapy and act synergistically to inhibit tumor growth, while others may lead to increased toxicity.10 More research is needed to determine which formulations, in combination with specific agents and doses, may have significant interactions that warrant adjustments in chemotherapy dosing.
Cannabis/Immunotherapy Interactions
Cannabis is an immunosuppressant. Data suggest the use of cannabis during immunotherapy worsens treatment outcomes in patients with cancer.22 Exogenous (THC) and endogenous (AEA) CBs negatively affect antitumor immunity by impairing the function of tumor-specific T cells via CB2 and by inhibiting the Jak1-STATs signaling in T cells through CNR2. Xiong et al found that THC reduces the therapeutic effect of anti-PD-1 therapy.22
In a prospective observational clinical study, Bar-Sela et al analyzed 102 patients with advanced cancer—of which 68 were cannabis users—that were started on immune checkpoint inhibitor therapy. The study found that cannabis users on anti-PD-1 (nivolumab, pembrolizumab), anti-CTLA-4 (ipilimumab), and anti-PD-L1 (durvalumab, atezolizumab) had a significant decrease in time to treatment progression and overall survival vs cannabis non-users.23 However, a 2023 study by Waissengrin et al found that concomitant use of medical cannabis with pembrolizumab had no harmful effect in advanced non-small cell lung cancer.24 Time to treatment progression of cannabis users did not differ from cannabis nonusers.25
Cannabis/Endocrine Therapy Interactions
In addition to having direct antineoplastic activity on tumor cells, data exist that show how cannabis affects the endocrine system. In animal models, cannabis has been found to suppress the whole hypothalamic-pituitary-adrenal axis as well as other hormones like thyroid, prolactin, and growth hormone. In breast cancer, cannabis competes with estrogen for the estrogen receptor and suppresses growth.26
The endocrine agents used by patients with cancer in this study were antiandrogens like abiraterone, enzalutamide, tamoxifen and anastrozole. Abiraterone is metabolized by CYP450 isoenzymes and uridine diphosphate glycosyltransferases. Cannabis inhibits both processes and therefore may lead to increased toxicities.27 Conversely, enzalutamide is a strong CYP3A inducer, and cannabis use during enzalutamide therapy may significantly increase the toxic effects of cannabis.
There is evidence that molecular pathways involving CB receptors and estrogens overlap, which may lead to interactions when antiestrogens are used in cannabis users with hormone receptor-positive breast cancer.26 In preclinical studies, tamoxifen has been shown to act as an inverse agonist on CB1 and CB2 receptors, though the significance of this finding is unclear. There is no research evaluating the effects of CBs on tamoxifen treatment. However, CBD has been found to potentiate the effectiveness of anastrozole or exemestane in breast cancer cell lines.28 Dobovišek et al demonstrated no inhibitory effect of CBD on the activity of tamoxifen, fulvestrant, or palbociclib in breast cancer cell lines.29 The interactions between hormone receptor-positive breast cancer and cannabinoids are complex, and the clinical significance of these interactions remains difficult to identify.
Cannabis/Targeted Therapy Interactions
The targeted therapies used by patients in this study included zanubrutinib, ibrutinib, sorafenib, acalabrutinib, dabrafenib, trametinib, trastuzumab, bevacizumab, daratumumab, and imatinib. Compared to other classes of cancer treatments, most studies have not demonstrated decreased efficacy or increased toxicity of targeted anticancer drugs when used concomitantly with CBD.29
Trastuzumab is a recombinant humanized monoclonal antibody that targets the proto-oncogene HER2/neu. It is used to treat select patients with metastatic breast cancer. Studies have shown that cannabis use does not attenuate the effectiveness of trastuzumab in HER2-positive and triple-negative breast cancer subtypes.29 One study found that CBD, in combination with chemotherapeutics and Bruton tyrosine kinase inhibitors, such as ibrutinib and zanubrutinib, has synergistic potential for treating diffuse large B-cell lymphoma and mantle cell lymphoma cell lines. This synergy is attributed to the CB1 antagonist activity of cannabis against diffuse large B-cell lymphoma and mantle cell lymphoma cell lines.30,31
Moreover, combining cannabinoids with bevacizumab (a monoclonal anti-VEGF antibody) has been shown to decrease tumor growth and intratumoral hypoxia in clinically relevant human glioblastoma models. This effect is mediated through the downregulation of HIF-1α.32 Long-term studies evaluating the potential harmful or synergistic potential of CBD on targeted anticancer therapy are needed.
CONCLUSIONS
This exploratory study of patients receiving cancer therapy at WJVAMC found a significant prevalence of concurrent cannabis use among patients undergoing antineoplastic treatments. Given that many antineoplastic agents are metabolized by the CYP450 enzyme system, the findings of this study suggest that concurrent cannabis use may pose risks of suboptimal therapeutic outcomes due to potential interactions affecting drug metabolism. These interactions could impact the efficacy and toxicity of the antineoplastic therapies, potentially leading to diminished therapeutic effects or exacerbated adverse reactions.
Patients should be informed regarding the potential decreased efficacy of immunotherapy with concurrent use of cannabis products. They should also be aware of the possibility of increased toxicity with other treatment modalities, though the exact impact on efficacy remains unclear. This highlights the necessity of caution when combining cannabis with prescribed cancer treatments.
While this study identified possible interactions, its data are preliminary and highlight the need for more rigorous research. Future studies should include larger, well-designed cohorts to compare outcomes between cannabis users and nonusers. Such research is essential to fully elucidate the clinical implications of cannabis use during cancer treatment, address the high prevalence of cannabis use among patients with cancer, and mitigate potential risks associated with combining cannabis products with antineoplastic therapies. This will ensure that treatment strategies are optimized for safety and efficacy in this complex patient population.
- Steele G, Arneson T, Zylla D. A comprehensive review of cannabis in patients with cancer: availability in the USA, general efficacy, and safety. Curr Oncol Rep. 2019;21:1-10. doi:10.1007/s11912-019-0757-7
- Brown D, Watson M, Schloss J. Pharmacological evidence of medicinal cannabis in oncology: a systematic review. Support Care Cancer. 2019;27:3195-320. doi:10.1007/s00520-019-04774-5
- Abrams DI. Integrating cannabis into clinical cancer care. Curr Oncol. 2016;23:S8-S14. doi:10.37.47/co.23.3099
- Serafimovska T, Darkovska-Serafimovska M, Stefkov G, Arsova-Sarafinovska Z, Balkanov T. Pharmacotherapeutic considerations for use of cannabinoids to relieve symptoms of nausea and vomiting induced by chemotherapy. Folia Medica (Plovdiv). 2020;62:668-678. doi:10.3897/folmed.62e51478
- Bar-Sela G, Zalman D, Semenysty V, Ballan E. The effects of dosage-controlled cannabis capsules on cancer-related cachexia and anorexia syndrome in advanced cancer patients: pilot study. Integr Cancer Ther. 2019;18:1534735419881498. doi:10.1177/1534735419881498
- Pederson ER, Villarosa-Hurlocker MC, Prince MA. Use of protective behavioral strategies among young adult veteran marijuana users. Cannabis. 2018;1:14-27.
- Schilling S, Melzer R, McCabe PF. Cannabis sativa. Curr Biol. 2020;30:R8-R9. doi:10.1016/j.cub.2019.10.039
- McDougle DR, Kambalyal A, Meling DD, Das A. Endocannabinoids anandamide and 2-arachidonoylglycerol are substrates for human CYP2J2 epoxygenase. J Pharmacol Exp Ther. 2014;351:616-627. doi:10.1124/jpet.114216598
- Movsesyan VA, Stoica BA, Yakovlev AG, et al. Anandamide-induced cell death in primary neuronal cultures: role of calpain and caspase pathways. Cell Death Differ. 2004;11:1121-1132. doi:10.1038/sj.cdd.4401442
- Cherkasova V, Wang B, Gerasymchuk M, Fiselier A, Kovalchuk O, Kovalchuk I. Use of cannabis and cannabinoids for treatment of cancer. Cancers (Basel). 2022;14:5142. doi:10.3390/cancers14205142
- Engels FK, Ten Tije AJ, Baker SD, et al. Effect of cytochrome P450 3A4 inhibition on the pharmacokinetics of docetaxel. Clin Pharmacol Ther. 2004;75:448-454. doi:10.1016/j.clpt.2004.01.001
- Alsherbiny MA, Li CG. Medicinal cannabis-potential drug interactions. Medicines (Basel). 2018;6:3. doi:10.3390/medicines6010003
- Stout SM, Cimino NM. Exogenous cannabinoids as substrates, inhibitors, and inducers of human drug metabolizing enzymes: a systematic review. Drug Metab Rev. 2014;46:86-95. doi:10.3109/03602532.2013.849268
- Opitz BJ, Ostroff ML, Whitman AC. The potential clinical implications and importance of drug interactions between anticancer agents and cannabidiol in patients with cancer. J Pharm Pract. 2020;33:506-512. doi:10.1177/0897190019828920
- Guzmán M, Duarte MJ, Blázquez C, et al. A pilot clinical study of D9-tetrahydrocannabinol in patients with recurrent glioblastoma multiforme. Br J Cancer. 2006;95:197-203. doi:10.1038/sj.bjc.6603236
- Kopjar N, Fuchs N, Brcic Karaconji I, et al. High doses of ?9-tetrahydrocannabinol might impair irinotecan chemotherapy: a review of potentially harmful interactions. Clin Drug Investig. 2020;40:775-787. doi:10.1007/s40261-020-00954-y
- Bouquié R, Deslandes G, Mazaré H, et al. Cannabis and anticancer drugs: societal usage and expected pharmacological interactions - a review. Fundam Clin Pharmacol. 2018;32:462-484. doi:10.1111/fcp.12373
- Buchtova T, Lukac D, Skrott Z, Chroma K, Bartek J, Mistrik M. Drug-drug interactions of cannabidiol with standard-of-care chemotherapeutics. Int J Mol Sci. 2023;24:2885. doi:10.3390/ijms24032885
- Sharafi G, He H, Nikfarjam M. Potential use of cannabinoids for the treatment of pancreatic cancer. J Pancreat Cancer. 2019;5:1-7. doi:10.1089/pancan.2018.0019
- Kosgodage US, Uysal-Onganer P, MacLatchy A, et al. Cannabidiol affects extracellular vesicle release, miR21 and miR126, and reduces prohibitin protein in glioblastoma multiforme cells. Transl Oncol. 2019;12:513-522. doi:10.1016/j.tranon.2018.12.004
- Elbaz M, Nasser MW, Ravi J, et al. Modulation of the tumor microenvironment and inhibition of EGF/EGFR pathway: novel anti-tumor mechanisms of cannabidiol in breast cancer. Mol Oncol. 2015;9:906-919. doi:10.1016/j.molonc.2014.12.010
- Xiong X, Chen S, Shen J, et al. Cannabis suppresses anti-tumor immunity by inhibiting JAK/STAT signaling in T cells through CNR2. Signal Transduct Target Ther. 2022;7:99. doi:10.1038/s41392-022-00918-y
- Bar-Sela G, Cohen I, Campisi-Pinto S, et al. Cannabis consumption used by cancer patients during immunotherapy correlates with poor clinical outcome. Cancers (Basel). 2020;12:2447. doi:10.3390/cancers12092447
- Waissengrin B, Leshem Y, Taya M, et al. The use of medical cannabis concomitantly with immune checkpoint inhibitors in non-small cell lung cancer: a sigh of relief? Eur J Cancer. 2023;180:52-61. doi:10.1016/j.ejca.2022.11.022
- Sarsembayeva A, Schicho R. Cannabinoids and the endocannabinoid system in immunotherapy: helpful or harmful? Front Oncol. 2023;13:1296906. doi:10.3389/fonc.2023.1296906
- Kisková T, Mungenast F, Suváková M, Jäger W, Thalhammer T. Future aspects for cannabinoids in breast cancer therapy. Int J Mol Sci. 2019;20:1673. doi:10.3390/ijms20071673
- Woerdenbag HJ, Olinga P, Kok EA, et al. Potential, limitations and risks of cannabis-derived products in cancer treatment. Cancers (Basel). 2023;15:2119. doi:10.3390/cancers15072119
- Almeida CF, Teixeira N, Valente MJ, Vinggaard AM, Correia-da-Silva G, Amaral C. Cannabidiol as a promising adjuvant therapy for estrogen receptor-positive breast tumors: unveiling its benefits with aromatase inhibitors. Cancers (Basel). 2023;15:2517. doi:10.3390/cancers15092517
- Dobovišek L, Novak M, Krstanovic F, Borštnar S, Turnšek TL, Debeljak N. Effect of combining CBD with standard breast cancer therapeutics. Adv Cancer Biol Metastasis. 2022;4:100038. doi:10.1016/j.adcanc.2022.100038
- Strong T, Rauvolfova J, Jackson E, Pham LV, Bryant J. Synergistic effect of cannabidiol with conventional chemotherapy treatment. Blood. 2018;132:5382. doi:10.1182/blood-2018-99-116749
- Maggi F, Morelli MB, Tomassoni D, et al. The effects of cannabidiol via TRPV2 channel in chronic myeloid leukemia cells and its combination with imatinib. Cancer Sci. 2022;113:1235-1249. doi:10.1111/cas.15257
- Obad N, Janji B, Prestegarden L, et al. ATPS-59 improving efficacy of bevacizumab treatment in glioblastoma by targeting hif1 alpha. Neuro Oncol. 2015;17:v31. doi:10.1093/neuonc/nov204.59
Cannabis has a long history of use for medicinal and recreational purposes. Research illustrates the potential benefits and increased prevalence of cannabis use in patients with cancer.1 Cannabis products have been shown to possess antineoplastic and palliative activity, improving nociceptive and neuropathic pain in addition to chemotherapy-related nausea and vomiting.2-5 Despite these developments and changing social attitudes toward cannabis, there remains a lack of comprehensive data on patient perspectives regarding its use, especially in regions where cannabis remains illegal. This knowledge gap is notable among veterans undergoing cancer treatment in states where cannabis is prohibited. Up to 57% of veterans report lifetime marijuana use, making it crucial to understand this population’s cannabis use patterns and potential interactions with cancer treatments.6
This observational study sought to determine the prevalence of cannabis use among patients undergoing cancer treatment at the US Department of Veterans Affairs (VA) Memphis Healthcare System and evaluate the potential risks associated with combining cannabis products with anticancer therapies.
METHODS
This prospective observational study identified cannabis use among veterans receiving antineoplastic therapy at the Lt. Col. Luke Weathers Jr. VA Medical Center (WJVAMC) and analyzed potential interactions between cannabis products and their cancer treatments. Participants included adults aged > 18 years undergoing antineoplastic therapy at WJVAMC who consented to the study. Data collection involved a written survey approved by the WJVAMC Institutional Review Board and verbal consent from participants. The survey asked participants about their cannabis use in the previous 90 days, including details on quantity, frequency, and method of consumption (eg, inhalation, oral, topical). No incentives were offered for participation.
Surveys from 50 patients who used cannabis were analyzed and their electronic health records were reviewed for sex, age, diagnosis, and antineoplastic regimen. This information was securely stored. A literature review was conducted using PubMed and the Cochrane Library to explore potential interactions between cannabis and the antineoplastic agents that were prescribed to patients in the study, focusing on toxicity, efficacy, or synergistic effects.
Patients were categorized into 4 groups based on treatment: cytotoxic chemotherapy, immunotherapy, endocrine therapy, and targeted therapy. Patients undergoing multiple types of therapies were included in each applicable category.
RESULTS
A total of 132 patients agreed to participate. Fifty patients (38%) acknowledged using cannabis products within 90 days. The patients that used cannabis products within 90 days of the survey reported the following malignancies: 8 patients (16%) had prostate cancer, 3 patients (6%) had hepatocellular carcinoma, 7 patients (14%) had pancreatic carcinoma, 5 patients (10%) had multiple myeloma, 3 patients (6%) had chronic lymphocytic leukemia, 9 patients (18%) had non-small cell lung cancer, 3 patients (6%) had breast cancer, 3 (6%) patients had bladder cancer, 2 patients (4%) had renal cell carcinoma, 1 (2%) patient had chronic myeloid leukemia, 1 (2%) patient had renal amyloid, 1 patient (2%) had supraglottic squamous cell carcinoma, 1 patient (2%) had esophageal carcinoma, 1 (2%) patient had small cell lung cancer, 1 (2%) patient had gastric cancer, and 1 patient (2%) had follicular lymphoma.
Five (10%) of the cannabis users were female, and 45 (90%) were male. Twenty-nine patients (58%) were aged 66 to 75 years, 16 (32%) were aged 56 to 65 years, 3 (6%) were aged 46 to 55 years, and 2 (4%) were aged 76 to 85 years.
Thirty-five patients (70%) inhaled cannabis as opposed to using it via other formulations or a combination (eg, inhalation and topical). Thirty-eight percent of patients used cannabis once daily, 24% used < 1 daily, and 28% used it ≥ 2 times daily. Five patients (10%) did not report the frequency of their cannabis use. Among the patients who reported cannabis use, 21 (42%) were undergoing cytotoxic chemotherapy, 19 (38%) were undergoing immunotherapy, 12 (24%) were undergoing targeted therapy, and 10 (20%) were undergoing endocrine therapy. Some patients were treated with multiple types of antineoplastic agents and were counted in multiple categories (Table 1).
Following a literature review of cannabis and antineoplastic agents, patients were evaluated for the potential effects of cannabis on their treatment. The literature review revealed that 31% of cytotoxic chemotherapy agents received by patients in this study might have increased toxicity, and 19% could have reduced efficacy when combined with cannabis. Among immunotherapy agents received by patients in this study, 70% might have decreased efficacy when combined with cannabis use. For targeted therapies, 35% could have increased toxicity, and 70% of endocrine agents could potentially have decreased efficacy (Table 2).
DISCUSSION
This prospective study corroborates previous research by demonstrating that more than one-third of patients receiving oncology care at WJVAMC use cannabis, most often inhaled. Cannabis use was observed among patients undergoing various cancer therapies, including cytotoxic chemotherapy, immunotherapy, targeted therapy, and endocrine therapy. The most common malignancies among cannabis users at WJVAMC include patients with lung cancer, prostate cancer, pancreatic cancer, and multiple myeloma. Cannabis use in patients with pancreatic cancer and multiple myeloma was significantly out of proportion to their prevalence at WJVAMC. This could potentially be due to their drastic effect on quality of life.
Cannabis use increased the risk of toxicity in patients treated with cytotoxic chemotherapy and targeted therapy. Cannabis use potentially decreased efficacy for patients treated with cytotoxic chemotherapy and/or immunotherapy. Cannabis use did not increase the risk of toxicity or efficacy in patients treated with endocrine therapy.
Antineoplastics/Cannabis Interactions
The potential interactions between cannabis and antineoplastic therapies administered at WJVAMC are worth exploring. While this review aims to shed light on possible interactions, it is important to acknowledge that much of the data is preliminary and derived from in vitro studies. The interactions should be interpreted as potential risks rather than established facts. Additional research is needed to confirm these interactions and effectively guide clinical practices. Understanding these dynamics is essential to optimize patient care and manage the complex interplay between cannabis use and cancer treatment.
Originating from Central Asia, the cannabis plant contains > 400 medicinally relevant compounds, of which about 100 are cannabinoids (CBs). Key CBs are cannabidiol (CBD), a nonpsychoactive compound, and ?-9-tetrahydrocannabinol (THC), a psychoactive compound. THC can make up 20% to 30% of the dry weight of female cannabis flowers.7
CBs act through the endocannabinoid system, involving CB1 and CB2 receptors, endogenous CBs like anandamide (AEA) and 2-arachidonoylglycerol, and various enzymes. These endogenous CBs, derived from arachidonic acid, play roles in cell growth and proliferation.8 In some studies, AEA has induced apoptosis in neuroblastoma cells and inhibited proliferation in breast cancer cells. However, other research suggests AEA may block apoptosis under certain conditions.9
CB receptors are transmembrane proteins that interact with CBs differently depending on tissue type and CB structure. Synthetic CBs are designed to target specific receptors, while natural CBs may act as both agonists and antagonists.10
Cytochrome P450 Metabolism
The human cytochrome P450 (CYP) 3A subfamily affects the metabolism of many therapeutic drugs, including cancer therapeutics.11 The various compositions of cannabis are primarily metabolized by the CYP450 pathway, the same as many cancer-directed pharmacologic treatments. CBs act as both CYP inducers and inhibitors. THC, for example, is a CYP inducer whereas CBD is a CYP inhibitor; both are found in the various compounds available for consumption.12,13 Pharmacology research has suggested potential interactions and effects on established adverse symptoms, but clinical data are lacking, and current research revealing interactions are only recognized in vitro.14
The Antineoplastic Activity of Cannabis
CBs can affect various cancer-related pathways such as PKB, AMPK, CAMKK-ß, mTOR, PDHK, HIF-1 a, and PPAR-γ. Δ-9-THC can selectively induce apoptosis in tumor cells without harming normal cells, though the exact mechanism remains unclear. Promising results from early mouse studies led to a 2006 human study where intracranial Δ-9-THC in patients with recurrent glioma yielded a median survival of 24 weeks, with 2 patients surviving > 1 year.15
In a 2022 review article, Cherkasova et al highlighted potential clinical benefits of cannabis across various cancers. They found that upregulated CB1 receptors in colon cancer might enhance the effect of 5-fluorouracil. However, many studies are preliminary and therefore not definitive.10
Additional research is needed to refine these findings. Challenges include variability in cannabis formulations, the complex tumor microenvironment, and the legal and psychoactive issues surrounding cannabis use. These factors complicate the design of multicenter randomized studies and may deter patients from disclosing cannabis use, thereby hindering efforts to fully understand its therapeutic potential.
Cannabis/Cytotoxic Chemotherapy Interactions
The chemotherapy agents used in this study included carboplatin, paclitaxel, 5-fluorouracil, etoposide, irinotecan, oxaliplatin, pemetrexed, docetaxel, cabazitaxel, T-DM1, gemcitabine, and cyclophosphamide. There is a paucity of research regarding the interactions between cytotoxic chemotherapy and cannabis. Most studies focused on CBD due to its inhibition of the CYP450 pathway, which is used for metabolizing cytotoxic chemotherapies. Through this mechanism, CBD could potentially increase the concentrations of chemotherapeutic agents, enhancing their toxicity.
When combined with irinotecan, cannabis can pose risks. Δ-9-THC undergoes first-pass metabolism in the liver, mediated by the CYP450 system and CYP3A4. The glucuronidation of irinotecan is mediated by uridine diphosphate glycosyltransferase, leading to its recirculation within the hepatic system and potentially increased toxicity due to prolonged drug presence. Cannabis may also compete with drug binding to albumin, altering the plasma concentrations of irinotecan and its conversion to the metabolite SN38.16
Cannabis products can affect chemotherapy levels by interacting with cellular transporters. The MRP1 transporter family, encoded by the ABCC gene family, is expressed mainly in the lung, kidney, skeletal muscle, and hematopoietic stem cells. A 2018 study investigating the effects of THC, CBD, and CBN on MRP1 transporters found that the presence of a cannabis component increased the concentration of vincristine 3-fold. Additional studies suggest the interaction with the CB1 receptor may lead to changes in the expression of MRP1 transporters.17
CBD inhibits the BCRP transporter, which functions as an efflux pump for methotrexate. Consequently, CBD can increase methotrexate levels, potentially enhancing efficacy but also worsening adverse effects.18
In pancreatic cancer, CBD specifically interacts with gemcitabine. CB1 and CB2 receptors are upregulated, and CBD inhibits the GPR55 receptor. These interactions may enhance the antineoplastic effect of gemcitabine, reducing cell cycle progression and growth.19
CBD also interacts with temozolomide (TMZ) by affecting extracellular vesicles used by cells for pro-oncogenic signaling and immune system evasion. Experiments on patient-derived glioblastoma cells, both chemotherapy-resistant and chemotherapy-sensitive, found that CBD increases the formation of extracellular vesicles with reduced levels of miR21 (pro-oncogenic) and elevated levels of miR126 (antioncogenic).20 CBD has also been found to decrease prohibitin levels, a protein associated with TMZ resistance.
In patients with glioblastoma, CBD combined with chemotherapeutic agents like TMZ, carmustine, doxorubicin, and cisplatin has shown increased sensitivity and improved tumor response. CBD is also known to inhibit NF-kB, a pathway that sustains tumor viability despite chemotherapy.21 Additionally, CBD inhibits the P-glycoprotein system, affecting chemotherapy efflux from neoplastic cells.14 In vitro studies have found that CBD is synergistic with bortezomib in inhibiting cancer cell viability. In another glioblastoma model, CBD enhanced the antiproliferative effects of both TMZ and carmustine.14
Different cannabis formulations may vary in how they interact with various cytotoxic chemotherapeutic agents. Some may potentiate the effects of chemotherapy and act synergistically to inhibit tumor growth, while others may lead to increased toxicity.10 More research is needed to determine which formulations, in combination with specific agents and doses, may have significant interactions that warrant adjustments in chemotherapy dosing.
Cannabis/Immunotherapy Interactions
Cannabis is an immunosuppressant. Data suggest the use of cannabis during immunotherapy worsens treatment outcomes in patients with cancer.22 Exogenous (THC) and endogenous (AEA) CBs negatively affect antitumor immunity by impairing the function of tumor-specific T cells via CB2 and by inhibiting the Jak1-STATs signaling in T cells through CNR2. Xiong et al found that THC reduces the therapeutic effect of anti-PD-1 therapy.22
In a prospective observational clinical study, Bar-Sela et al analyzed 102 patients with advanced cancer—of which 68 were cannabis users—that were started on immune checkpoint inhibitor therapy. The study found that cannabis users on anti-PD-1 (nivolumab, pembrolizumab), anti-CTLA-4 (ipilimumab), and anti-PD-L1 (durvalumab, atezolizumab) had a significant decrease in time to treatment progression and overall survival vs cannabis non-users.23 However, a 2023 study by Waissengrin et al found that concomitant use of medical cannabis with pembrolizumab had no harmful effect in advanced non-small cell lung cancer.24 Time to treatment progression of cannabis users did not differ from cannabis nonusers.25
Cannabis/Endocrine Therapy Interactions
In addition to having direct antineoplastic activity on tumor cells, data exist that show how cannabis affects the endocrine system. In animal models, cannabis has been found to suppress the whole hypothalamic-pituitary-adrenal axis as well as other hormones like thyroid, prolactin, and growth hormone. In breast cancer, cannabis competes with estrogen for the estrogen receptor and suppresses growth.26
The endocrine agents used by patients with cancer in this study were antiandrogens like abiraterone, enzalutamide, tamoxifen and anastrozole. Abiraterone is metabolized by CYP450 isoenzymes and uridine diphosphate glycosyltransferases. Cannabis inhibits both processes and therefore may lead to increased toxicities.27 Conversely, enzalutamide is a strong CYP3A inducer, and cannabis use during enzalutamide therapy may significantly increase the toxic effects of cannabis.
There is evidence that molecular pathways involving CB receptors and estrogens overlap, which may lead to interactions when antiestrogens are used in cannabis users with hormone receptor-positive breast cancer.26 In preclinical studies, tamoxifen has been shown to act as an inverse agonist on CB1 and CB2 receptors, though the significance of this finding is unclear. There is no research evaluating the effects of CBs on tamoxifen treatment. However, CBD has been found to potentiate the effectiveness of anastrozole or exemestane in breast cancer cell lines.28 Dobovišek et al demonstrated no inhibitory effect of CBD on the activity of tamoxifen, fulvestrant, or palbociclib in breast cancer cell lines.29 The interactions between hormone receptor-positive breast cancer and cannabinoids are complex, and the clinical significance of these interactions remains difficult to identify.
Cannabis/Targeted Therapy Interactions
The targeted therapies used by patients in this study included zanubrutinib, ibrutinib, sorafenib, acalabrutinib, dabrafenib, trametinib, trastuzumab, bevacizumab, daratumumab, and imatinib. Compared to other classes of cancer treatments, most studies have not demonstrated decreased efficacy or increased toxicity of targeted anticancer drugs when used concomitantly with CBD.29
Trastuzumab is a recombinant humanized monoclonal antibody that targets the proto-oncogene HER2/neu. It is used to treat select patients with metastatic breast cancer. Studies have shown that cannabis use does not attenuate the effectiveness of trastuzumab in HER2-positive and triple-negative breast cancer subtypes.29 One study found that CBD, in combination with chemotherapeutics and Bruton tyrosine kinase inhibitors, such as ibrutinib and zanubrutinib, has synergistic potential for treating diffuse large B-cell lymphoma and mantle cell lymphoma cell lines. This synergy is attributed to the CB1 antagonist activity of cannabis against diffuse large B-cell lymphoma and mantle cell lymphoma cell lines.30,31
Moreover, combining cannabinoids with bevacizumab (a monoclonal anti-VEGF antibody) has been shown to decrease tumor growth and intratumoral hypoxia in clinically relevant human glioblastoma models. This effect is mediated through the downregulation of HIF-1α.32 Long-term studies evaluating the potential harmful or synergistic potential of CBD on targeted anticancer therapy are needed.
CONCLUSIONS
This exploratory study of patients receiving cancer therapy at WJVAMC found a significant prevalence of concurrent cannabis use among patients undergoing antineoplastic treatments. Given that many antineoplastic agents are metabolized by the CYP450 enzyme system, the findings of this study suggest that concurrent cannabis use may pose risks of suboptimal therapeutic outcomes due to potential interactions affecting drug metabolism. These interactions could impact the efficacy and toxicity of the antineoplastic therapies, potentially leading to diminished therapeutic effects or exacerbated adverse reactions.
Patients should be informed regarding the potential decreased efficacy of immunotherapy with concurrent use of cannabis products. They should also be aware of the possibility of increased toxicity with other treatment modalities, though the exact impact on efficacy remains unclear. This highlights the necessity of caution when combining cannabis with prescribed cancer treatments.
While this study identified possible interactions, its data are preliminary and highlight the need for more rigorous research. Future studies should include larger, well-designed cohorts to compare outcomes between cannabis users and nonusers. Such research is essential to fully elucidate the clinical implications of cannabis use during cancer treatment, address the high prevalence of cannabis use among patients with cancer, and mitigate potential risks associated with combining cannabis products with antineoplastic therapies. This will ensure that treatment strategies are optimized for safety and efficacy in this complex patient population.
- Steele G, Arneson T, Zylla D. A comprehensive review of cannabis in patients with cancer: availability in the USA, general efficacy, and safety. Curr Oncol Rep. 2019;21:1-10. doi:10.1007/s11912-019-0757-7
- Brown D, Watson M, Schloss J. Pharmacological evidence of medicinal cannabis in oncology: a systematic review. Support Care Cancer. 2019;27:3195-320. doi:10.1007/s00520-019-04774-5
- Abrams DI. Integrating cannabis into clinical cancer care. Curr Oncol. 2016;23:S8-S14. doi:10.37.47/co.23.3099
- Serafimovska T, Darkovska-Serafimovska M, Stefkov G, Arsova-Sarafinovska Z, Balkanov T. Pharmacotherapeutic considerations for use of cannabinoids to relieve symptoms of nausea and vomiting induced by chemotherapy. Folia Medica (Plovdiv). 2020;62:668-678. doi:10.3897/folmed.62e51478
- Bar-Sela G, Zalman D, Semenysty V, Ballan E. The effects of dosage-controlled cannabis capsules on cancer-related cachexia and anorexia syndrome in advanced cancer patients: pilot study. Integr Cancer Ther. 2019;18:1534735419881498. doi:10.1177/1534735419881498
- Pederson ER, Villarosa-Hurlocker MC, Prince MA. Use of protective behavioral strategies among young adult veteran marijuana users. Cannabis. 2018;1:14-27.
- Schilling S, Melzer R, McCabe PF. Cannabis sativa. Curr Biol. 2020;30:R8-R9. doi:10.1016/j.cub.2019.10.039
- McDougle DR, Kambalyal A, Meling DD, Das A. Endocannabinoids anandamide and 2-arachidonoylglycerol are substrates for human CYP2J2 epoxygenase. J Pharmacol Exp Ther. 2014;351:616-627. doi:10.1124/jpet.114216598
- Movsesyan VA, Stoica BA, Yakovlev AG, et al. Anandamide-induced cell death in primary neuronal cultures: role of calpain and caspase pathways. Cell Death Differ. 2004;11:1121-1132. doi:10.1038/sj.cdd.4401442
- Cherkasova V, Wang B, Gerasymchuk M, Fiselier A, Kovalchuk O, Kovalchuk I. Use of cannabis and cannabinoids for treatment of cancer. Cancers (Basel). 2022;14:5142. doi:10.3390/cancers14205142
- Engels FK, Ten Tije AJ, Baker SD, et al. Effect of cytochrome P450 3A4 inhibition on the pharmacokinetics of docetaxel. Clin Pharmacol Ther. 2004;75:448-454. doi:10.1016/j.clpt.2004.01.001
- Alsherbiny MA, Li CG. Medicinal cannabis-potential drug interactions. Medicines (Basel). 2018;6:3. doi:10.3390/medicines6010003
- Stout SM, Cimino NM. Exogenous cannabinoids as substrates, inhibitors, and inducers of human drug metabolizing enzymes: a systematic review. Drug Metab Rev. 2014;46:86-95. doi:10.3109/03602532.2013.849268
- Opitz BJ, Ostroff ML, Whitman AC. The potential clinical implications and importance of drug interactions between anticancer agents and cannabidiol in patients with cancer. J Pharm Pract. 2020;33:506-512. doi:10.1177/0897190019828920
- Guzmán M, Duarte MJ, Blázquez C, et al. A pilot clinical study of D9-tetrahydrocannabinol in patients with recurrent glioblastoma multiforme. Br J Cancer. 2006;95:197-203. doi:10.1038/sj.bjc.6603236
- Kopjar N, Fuchs N, Brcic Karaconji I, et al. High doses of ?9-tetrahydrocannabinol might impair irinotecan chemotherapy: a review of potentially harmful interactions. Clin Drug Investig. 2020;40:775-787. doi:10.1007/s40261-020-00954-y
- Bouquié R, Deslandes G, Mazaré H, et al. Cannabis and anticancer drugs: societal usage and expected pharmacological interactions - a review. Fundam Clin Pharmacol. 2018;32:462-484. doi:10.1111/fcp.12373
- Buchtova T, Lukac D, Skrott Z, Chroma K, Bartek J, Mistrik M. Drug-drug interactions of cannabidiol with standard-of-care chemotherapeutics. Int J Mol Sci. 2023;24:2885. doi:10.3390/ijms24032885
- Sharafi G, He H, Nikfarjam M. Potential use of cannabinoids for the treatment of pancreatic cancer. J Pancreat Cancer. 2019;5:1-7. doi:10.1089/pancan.2018.0019
- Kosgodage US, Uysal-Onganer P, MacLatchy A, et al. Cannabidiol affects extracellular vesicle release, miR21 and miR126, and reduces prohibitin protein in glioblastoma multiforme cells. Transl Oncol. 2019;12:513-522. doi:10.1016/j.tranon.2018.12.004
- Elbaz M, Nasser MW, Ravi J, et al. Modulation of the tumor microenvironment and inhibition of EGF/EGFR pathway: novel anti-tumor mechanisms of cannabidiol in breast cancer. Mol Oncol. 2015;9:906-919. doi:10.1016/j.molonc.2014.12.010
- Xiong X, Chen S, Shen J, et al. Cannabis suppresses anti-tumor immunity by inhibiting JAK/STAT signaling in T cells through CNR2. Signal Transduct Target Ther. 2022;7:99. doi:10.1038/s41392-022-00918-y
- Bar-Sela G, Cohen I, Campisi-Pinto S, et al. Cannabis consumption used by cancer patients during immunotherapy correlates with poor clinical outcome. Cancers (Basel). 2020;12:2447. doi:10.3390/cancers12092447
- Waissengrin B, Leshem Y, Taya M, et al. The use of medical cannabis concomitantly with immune checkpoint inhibitors in non-small cell lung cancer: a sigh of relief? Eur J Cancer. 2023;180:52-61. doi:10.1016/j.ejca.2022.11.022
- Sarsembayeva A, Schicho R. Cannabinoids and the endocannabinoid system in immunotherapy: helpful or harmful? Front Oncol. 2023;13:1296906. doi:10.3389/fonc.2023.1296906
- Kisková T, Mungenast F, Suváková M, Jäger W, Thalhammer T. Future aspects for cannabinoids in breast cancer therapy. Int J Mol Sci. 2019;20:1673. doi:10.3390/ijms20071673
- Woerdenbag HJ, Olinga P, Kok EA, et al. Potential, limitations and risks of cannabis-derived products in cancer treatment. Cancers (Basel). 2023;15:2119. doi:10.3390/cancers15072119
- Almeida CF, Teixeira N, Valente MJ, Vinggaard AM, Correia-da-Silva G, Amaral C. Cannabidiol as a promising adjuvant therapy for estrogen receptor-positive breast tumors: unveiling its benefits with aromatase inhibitors. Cancers (Basel). 2023;15:2517. doi:10.3390/cancers15092517
- Dobovišek L, Novak M, Krstanovic F, Borštnar S, Turnšek TL, Debeljak N. Effect of combining CBD with standard breast cancer therapeutics. Adv Cancer Biol Metastasis. 2022;4:100038. doi:10.1016/j.adcanc.2022.100038
- Strong T, Rauvolfova J, Jackson E, Pham LV, Bryant J. Synergistic effect of cannabidiol with conventional chemotherapy treatment. Blood. 2018;132:5382. doi:10.1182/blood-2018-99-116749
- Maggi F, Morelli MB, Tomassoni D, et al. The effects of cannabidiol via TRPV2 channel in chronic myeloid leukemia cells and its combination with imatinib. Cancer Sci. 2022;113:1235-1249. doi:10.1111/cas.15257
- Obad N, Janji B, Prestegarden L, et al. ATPS-59 improving efficacy of bevacizumab treatment in glioblastoma by targeting hif1 alpha. Neuro Oncol. 2015;17:v31. doi:10.1093/neuonc/nov204.59
Cannabis Use by Veterans and Potential Interactions With Antineoplastic Agents: Analysis and Literature Review
Cannabis Use by Veterans and Potential Interactions With Antineoplastic Agents: Analysis and Literature Review

Early Outcomes of Stereotactic Body Radiotherapy for Localized Prostate Cancer: A Retrospective Analysis
Early Outcomes of Stereotactic Body Radiotherapy for Localized Prostate Cancer: A Retrospective Analysis
Prostate cancer is the most common cancer in US males, with an estimated 313,780 new cases and 35,770 deaths in 2025.1 Several treatment options are available for localized prostate cancer that have similar outcomes, including active surveillance for low-risk cancers, surgery, or radiotherapy.2,3 Conventional fractionation radiotherapy (CFRT) with 40 to 45 fractions over 8 to 9 weeks has been used for decades. Over the past 2 decades, moderate hypofractionation schedules with 2.4 to 3.4 Gy per fraction over 20 to 28 fractions have become standard, as many noninferiority randomized clinical trials (RCTs) such as CHHiP (UK),4 PROFIT (Canada and Europe),5 NRG Oncology RTOG 0415 (US),6 HYPRO (Netherlands),7,8 and HYPO-RT-PC (Sweden and Denmark),9 have shown the noninferiority of moderately hypofractionated radiotherapy compared with CFRT. Notably, most of these noninferiority studies primarily included patients with low- or intermediate-risk prostate cancer, except for the HYPO-RT-PC trial,9 which also included patients with intermediate- and high-risk prostate cancer.
These noninferiority studies, along with technological advances in radiotherapy, such as intensity-modulated radiotherapy (IMRT), volumetric modulated arc therapy (VMAT), and image-guided radiotherapy (IGRT), paved the path to ultrahypofractionated stereotactic body radiotherapy (SBRT) that is delivered in 5 fractions of ≥ 6 Gy. This high dose per fraction may have a radiobiologic advantage over conventional fractionation. The relatively low a/ß ratio of prostate cancer, estimated to be between 1 and 2, suggests that tumor cells may be particularly sensitive to the high doses per fraction delivered in SBRT.10-13 Compared with CFRT, SBRT-induced tumor cell death may also be mediated through different pathways; this pathway appears to be generated in a dose-dependent manner, particularly with doses > 8 Gy per fraction.14,15 Additionally, the higher a/ß ratio for the surrounding organs at risk, such as the bladder and rectum, theoretically allows for an improved therapeutic ratio window that maximizes tumor control while minimizing damage to healthy tissues.
A substantial body of evidence from prospective studies and meta-analyses supports the use of SBRT for localized prostate cancer. HYPO-RT-PC, a significant phase 3 noninferiority study, enrolled 1200 patients with intermediate (89%) and high-risk (11%) prostate cancer randomized between 2 arms, including CFRT to 78 Gy in 39 fractions and SBRT to 42.7 Gy in 7 fractions, treated 3 days weekly. After a median follow-up of 60 months, the estimated 5-year biochemical relapse-free survival rate was 84% in both groups.9 This trial was notable because it was the first randomized study to demonstrate that SBRT was noninferior to CFRT in intermediate- and high-risk prostate cancer patients. Another pivotal phase 3 trial, the PACE-B study, enrolled 874 patients to compare SBRT (36.25 Gy to the prostate gland, with a secondary dose of 40 Gy to the gross tumor volume where applicable, in 5 fractions) with CFRT (78 Gy in 39 fractions) and moderately hypofractionated radiotherapy (HFRT) (62 Gy in 20 fractions) in patients with low- or intermediate-risk prostate cancer. With a 74-month median follow-up, the study reported 5-year biochemical free rates of 94.6% for CFRT and 95.8% for SBRT, confirming the noninferiority of SBRT to CFRT.15
SBRT offers short, effective, and convenient treatment to many patients with localized prostate cancer. While previous guidelines were more restrictive, the March 2026 National Comprehensive Cancer Network (NCCN) guidelines now list SBRT as a preferred treatment modality for high-risk prostate cancer.16
Given the growing body of evidence supporting the efficacy and safety of SBRT, we implemented an SBRT program in 2014 at a tertiary care center for veterans. This retrospective study was undertaken to evaluate the early efficacy and toxicity of SBRT in patients with localized prostate cancer treated at our institution, including patients across all risk stratifications.
METHODS
We identified 242 patients diagnosed with prostate cancer who underwent SBRT treatment between November 2014 and October 2024 at Overland Park Veterans Affairs Radiation Oncology Clinic. For the final analysis, 46 patients with < 2 years of follow-up and 22 patients who died from causes other than prostate cancer were excluded, resulting in a cohort of 174 patients with ≥ 24-month follow-up.
Treatment
Patients eligible for staging underwent imaging according to NCCN guidelines, including computed tomography (CT) of the abdomen and pelvis, bone scintigraphy, or, in recent years, prostate-specific membrane antigen positron emission tomography, primarily used for unfavorable intermediate-risk (UIR) and high-risk (HR) cancers. Patients with a negative staging work-up for nodal or skeletal disease were included. Prior to planning the CT simulation, patients were given bowel preparation instructions, including a low-fiber and low-gas-producing diet, simethicone, and enemas, the night before and morning of the simulation. Patients were instructed to arrive with a comfortably full bladder, having not voided for 2 to 3 hours prior to the procedure. At Kansas City Veterans Affairs Medical Center (KCVAMC), SBRT treatment was generally restricted to patients with a baseline American Urological Association symptom score of 15 to 20 out of 35 and a prostate gland size < 80 mL to minimize the risk of acute urinary toxicity. We did not use intraprostatic fiducials, hydrogel rectal spacers, or intravenous contrast agents for planning CT simulation.
Patients were placed in a supine position, and a vacuum bag was used for immobilization. Following the CT simulation, the images were transferred to the Eclipse treatment planning system. The clinical target volume (CTV) encompassed the prostate and the proximal 1.0 cm of the seminal vesicles for Gleason score (GS) 1 to 2, and the entire seminal vesicle was included for GS 3 to 5, which is consistent with KCVAMC practice and established safety protocols. The planning target volume (PTV) was created by uniformly expanding the CTV by 5 to 7 mm, except for the posterior margin, which was limited to 3 to 5 mm. When elective nodal radiotherapy was planned for HR prostate cancer, the pelvic field for CT simulation started at the L-2 upper border, with the lower border extending to the lesser trochanter. The pelvic nodes were delineated per Radiation Therapy Oncology Group (RTOG) guidelines.17 The CTV nodes (CTVn), including common iliac, external and internal iliac nodes, obturator, and presacral nodes, were created by uniformly expanding the CTVn by 2 to 3 mm. Slice-by-slice corrections were made to avoid bowel overlap in these patients.
The use of androgen deprivation therapy (ADT) for a duration of 6 to 24 months was prescribed for patients with UIR or HR prostate cancer per NCCN guidelines.16 The prescribed dose to the PTV was 36.25 to 40 Gy (40 Gy was mostly used as a boost to the dominant lesion) in 5 fractions, with each fraction ranging from 7.25 to 8 Gy. For elective nodal radiotherapy in patients at HR, the prescribed dose was 25 Gy in 5 fractions. All patients were planned for VMAT, which aims to deliver ≥ 95% of the prescription dose to 95% of the PTV. Once the physician approved the treatment plan and physics quality assessment was completed, treatments commenced on an every-other-day schedule. Patients received the same bowel preparation instructions for each treatment as for the planning CT simulation. Daily treatment accuracy was confirmed via daily 3-dimensional cone-beam CT (CBCT) for IGRT. No fiducials or hydrogel rectal spacers were used.
Follow-up Schedule and Toxicity Assessment
Follow-up assessments were conducted 4 to 6 weeks after radiation therapy and then repeated every 6 months for 2 to 5 years, and annually thereafter. At each follow-up visit, patients were evaluated for genitourinary (GU) and gastrointestinal (GI) toxicity, according to RTOG toxicity criteria. Prostate-specific antigen (PSA) levels were monitored; in patients receiving ADT, testosterone levels were also checked.
Statistical Analysis
Biochemical failure was defined using the Phoenix definition (nadir PSA + 2 ng/mL). Differences between dose cohorts were assessed using the log-rank test for survival outcomes and X2 testing for categorical variables. GU and GI toxicities were summarized as cumulative incidences of RTOG grade ≥ II events. Statistical significance was set at P < .05.
RESULTS
One hundred seventy-four patients were included in the retrospective review. Patients had a median follow-up of 45 months (range, 24-111) (Figure). The median age at treatment was 74 years (range, 51-88), and the median pretreatment PSA level was 11.9 ng/mL (range, 0.6-69.5). Twenty-six patients (14.9%) had a GS 1, 77 (44.3%) had GS 2, 41 (23.6%) had GS 3, 18 (10.3%) had GS 4, and 12 (6.9%) had GS 5. Fifty-one patients (29.3%) received elective pelvic nodal radiotherapy, and 93 patients (53.4%) received ADT (Table 1).
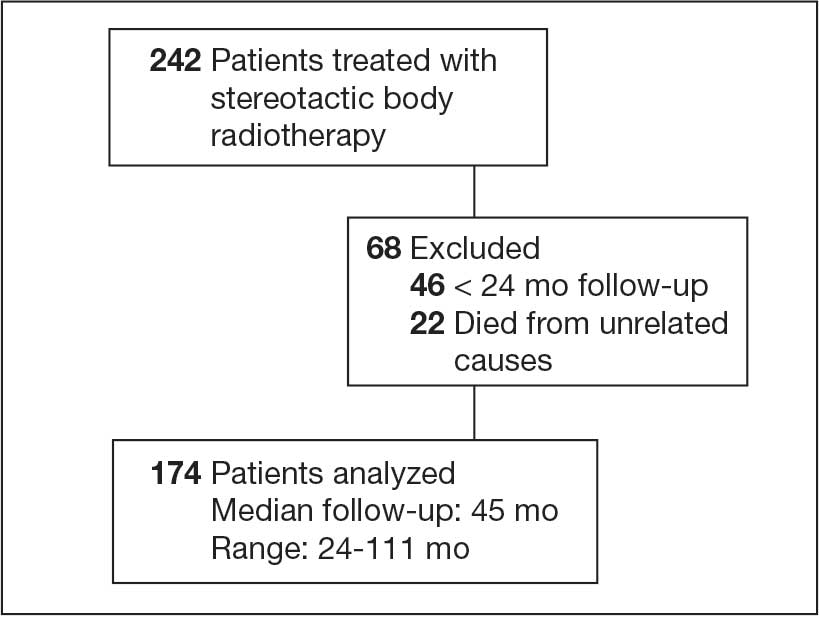
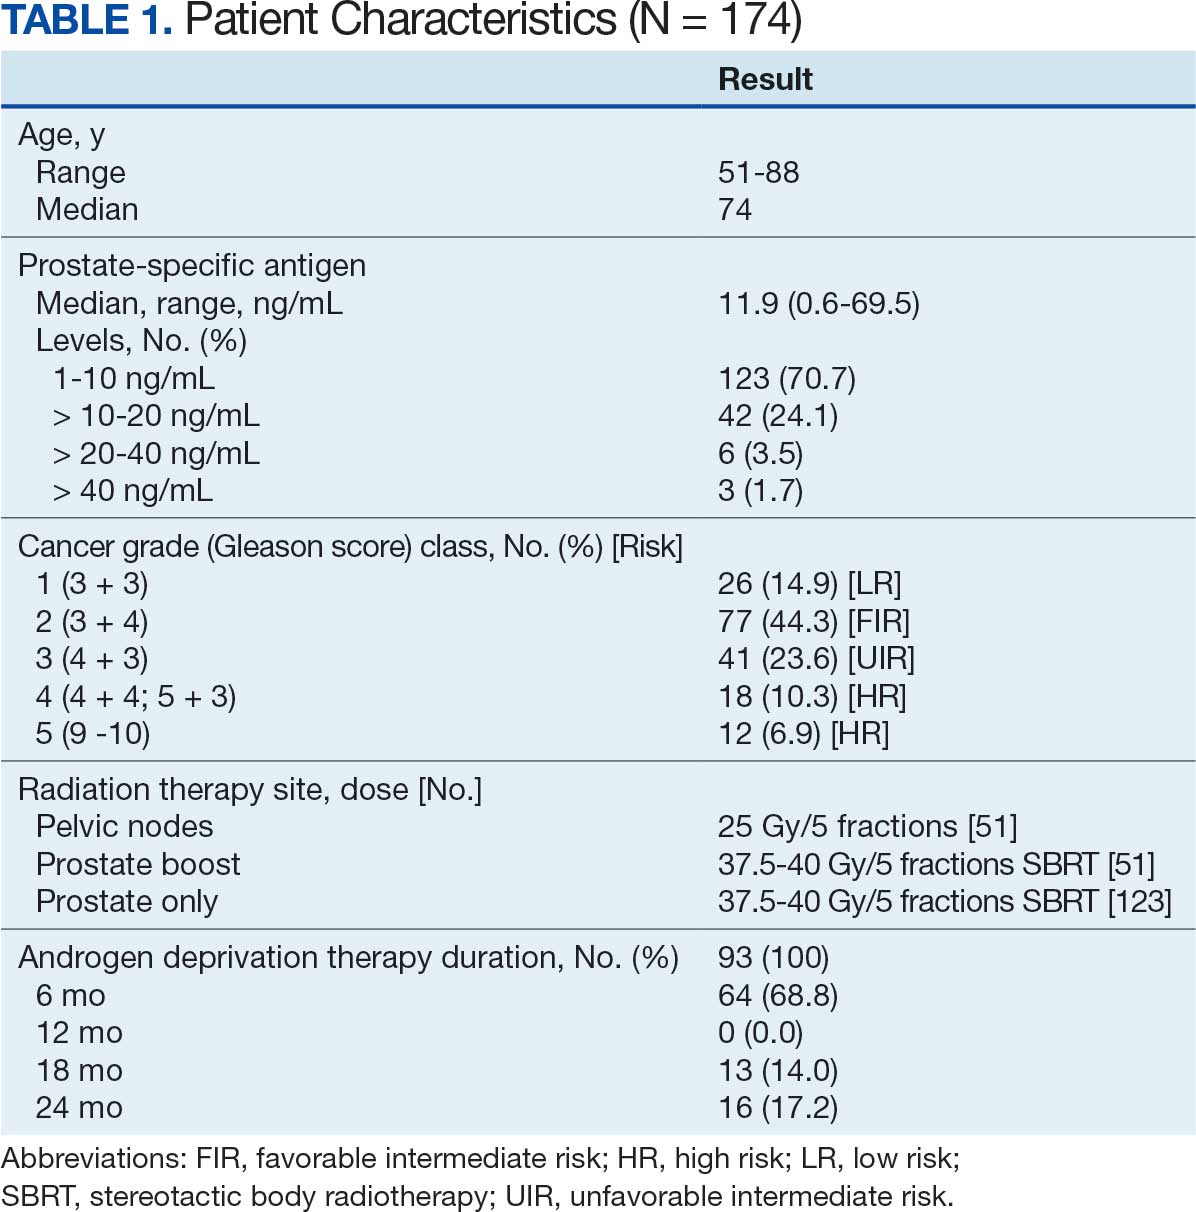
At 24 months follow-up, 6 patients (3.4%) had biochemical failures. One patient died from metastatic prostate cancer, and 5 patients are living with biochemical failure (Table 2). The actuarial 5-year overall survival (OS) rate was 99.4%, and the 5-year disease-free survival (DFS) rate was 96.6%. We performed a subanalysis comparing outcomes of the 36.25 Gy vs 40 Gy SBRT cohorts. There was no statistically significant difference in DFS, OS, or the cumulative incidence of grade II/III toxicity between patients treated with 40 Gy vs 36.25 Gy. Outcomes stratified by NCCN risk groups (low, intermediate, high/very high) are detailed in Table 3. As expected, DFS was slightly lower in the high-risk group, but overall disease control remained high across all stratifications.
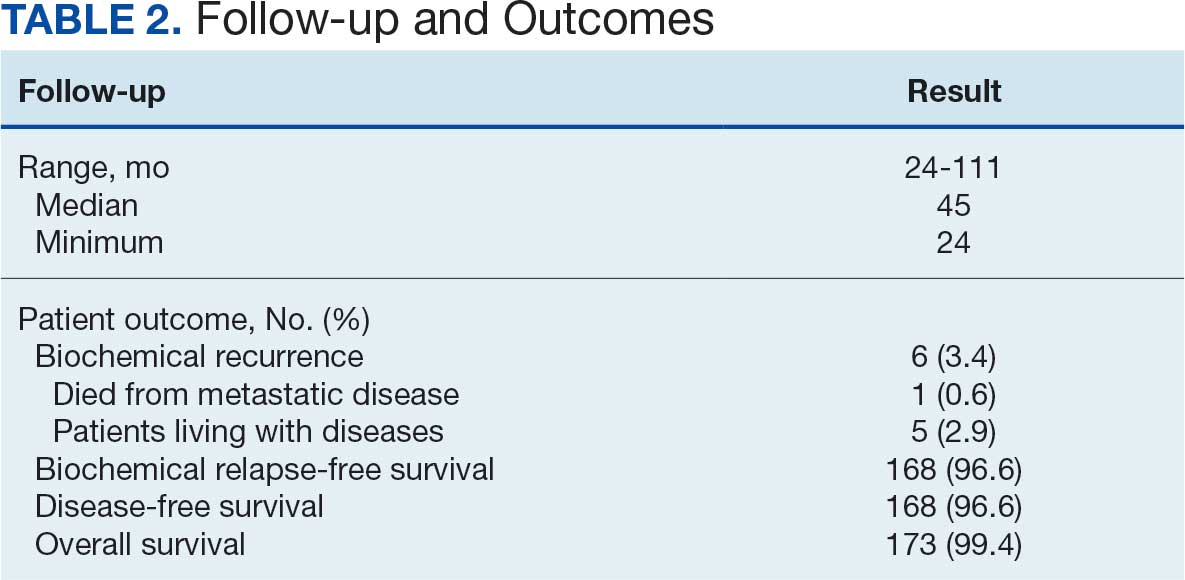
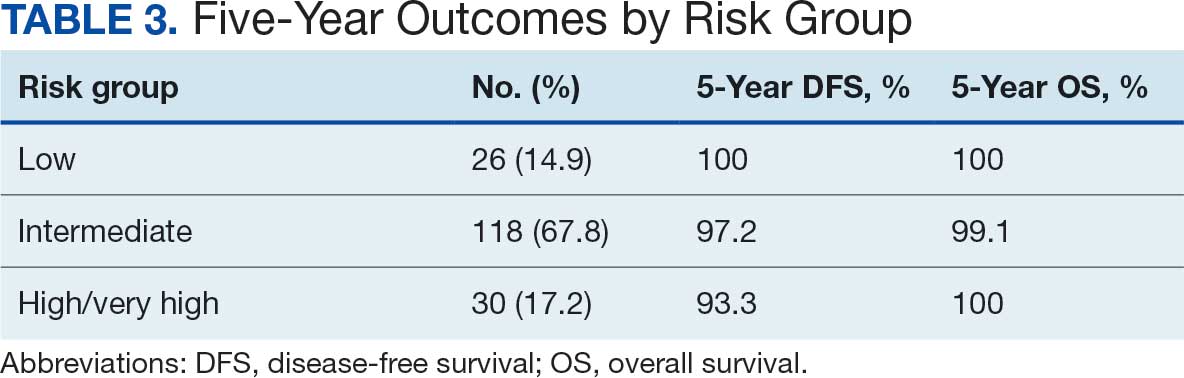
The cumulative incidence of RTOG grade II and higher GU toxicity was 28.2% (Table 4). This included 46 patients (26.4%) with grade II GU toxicity and 2 patients (1.2%) who developed grade III GU complications (1 requiring self-catheterization and another a suprapubic catheter for urinary retention). One patient (0.6%) treated with a 40 Gy dose regimen experienced a grade IV GU complication in the form of a rectovesical fistula necessitating surgical intervention.
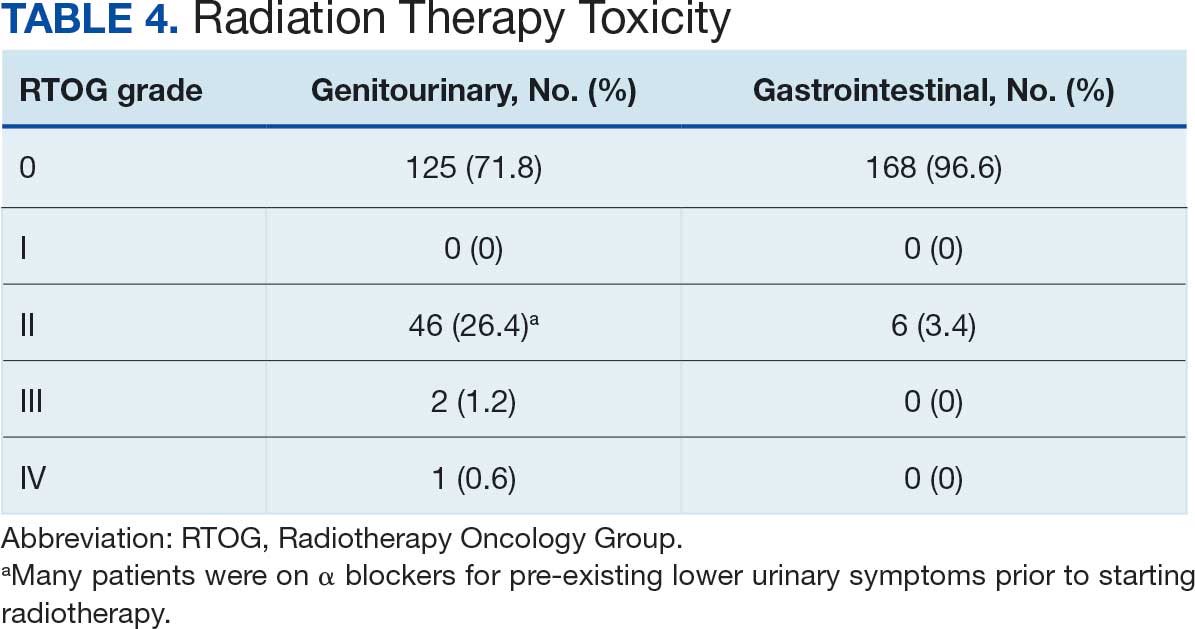
The cumulative incidence of RTOG grade II or higher GI toxicity was 3.4%, and no grade III or IV gastrointestinal toxicities were observed during the follow-up period. Importantly, intraprostatic fiducials, hydrogel rectal spacers, or intravenous contrast were not routinely used in this cohort of patients.
The high rates of actuarial 5-year DFS and OS observed suggest a favorable initial response to the SBRT regimen employed at KCVAMC. However, given the potential for late recurrence in patients with prostate cancer, longer follow-up is essential to determine the durability of these outcomes. The observed GU toxicity rate of 28.2% for grade II and higher events warrants careful consideration and compares with other published data on SBRT for prostate cancer.15 The occurrence of a grade IV rectovesical fistula, although rare, is a notable adverse event that warrants discussion in the context of the treatment approach. The low incidence of grade II or higher GI toxicity is an encouraging finding, particularly given that hydrogel rectal spacers are not routinely used to minimize rectal exposure.
DISCUSSION
The primary objective of this retrospective study was to evaluate the outcomes of SBRT for patients with localized prostate cancer treated at KCVAMC and to compare these results with those reported in the literature. Our findings demonstrate promising intermediate-term efficacy, with an estimated 5-year DFS of 96.6% and OS of 99.4% at a median follow-up of 45 months. Furthermore, the observed toxicity profile appears acceptable, with a cumulative grade II and higher GU toxicity rate of 28.2% and a grade II or higher GI toxicity rate of 3.4%. Notably, these outcomes were achieved without the routine use of intraprostatic fiducials or hydrogel rectal spacers.
Two pivotal randomized phase 3 trials have established the noninferiority of ultrahypofractionated radiotherapy (UHRT) with SBRT over conventional fractionation. The HYPO-RT-PC trial compared SBRT (42.7 Gy in 7 fractions) with conventional fractionation (78 Gy in 39 fractions) in intermediate- and high-risk patients with prostate cancer and reported a 5-year biochemical relapse-free survival of 84% in both arms.9 The PACE-B trial, which included patients at low- and intermediate-risk, compared SBRT (36.25 Gy in 5 fractions) with conventional or moderate HFRT and reported a 5-year biochemical control rate of 95.8% in the SBRT arm and 94.6% in the control arm.15
A comprehensive review and meta-analysis of 7 phase 3 studies involving 6795 patients compared different radiotherapy regimens, namely, UHRT, HFRT, and CFRT, and reported that after 5 years, the DFS rates were 85.1% for CFRT, 86% for HFRT, and 85% for UHRT, with no significant difference in toxicity among the 3 different treatment approaches.18 This suggests that shorter, more intense radiotherapy schedules (UHRT and HFRT) may be as effective and safe as traditional, longer courses of radiation.
There are multiple published nonrandomized prospective trials in which thousands of patients with extreme hypofractionation have been treated with different doses, fractions, and techniques. While heterogeneity and limited long-term follow-up in the existing evidence are acknowledged, these data suggest that prostate SBRT provides appropriate biochemical control with few high-grade toxicities, supporting its ongoing global use and justifying further prospective investigations. Comparative data are shown in Table 5. Several ongoing studies are evaluating noninferiority, superiority, and cost-effectiveness using different methodologies (Table 6).9,15,19-24
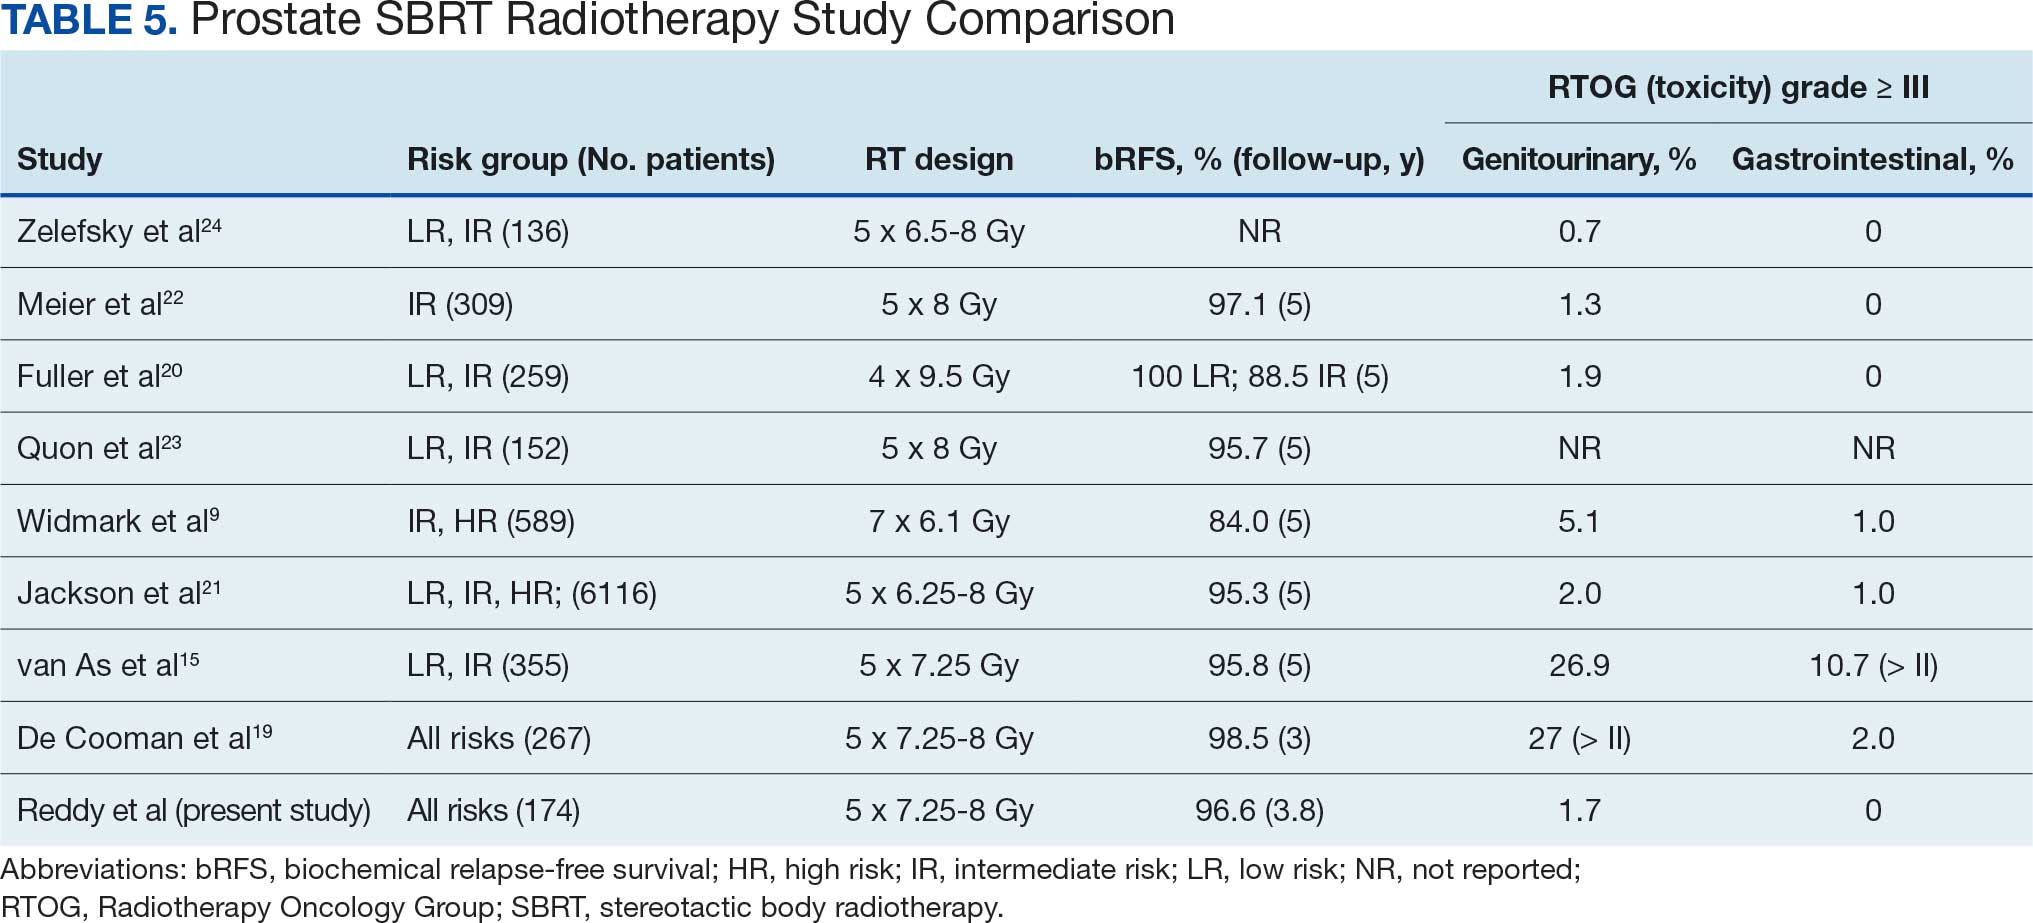
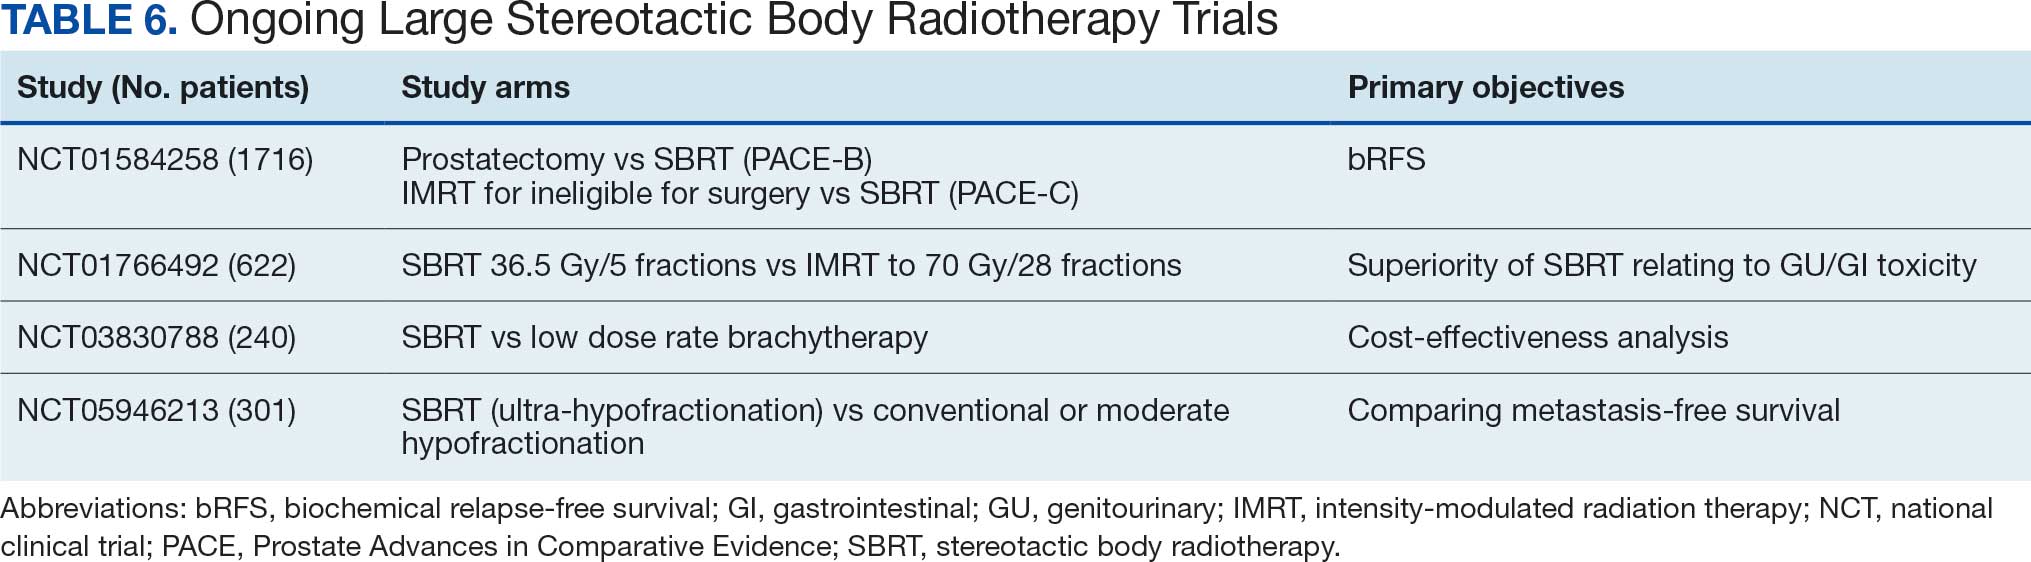
This study’s efficacy outcomes, particularly the high DFS rate, are consistent with the findings from these landmark trials, suggesting that the SBRT regimen used at KCVAMC is effective in achieving early disease control despite 17.2% of patients having high-risk disease. The GU toxicity observed in this study, with a 28.2% rate of grade II or higher events, is also comparable with the 26.9% reported in the 5-fraction SBRT arm of the PACE-B trial, which had a longer median follow-up of 74 months.15 It is important to note that a portion of these grade II events occurred in patients who were already on a blockers for pre-existing lower urinary tract symptoms before starting radiotherapy, which may inflate the observed cumulative acute toxicity score.
A critical comparison is how SBRT toxicity aligns with moderate hypofractionation (eg, 60 Gy in 20 fractions or 70 Gy in 28 fractions as reported by others).4,6 Our observed grade III and higher GU toxicity rate (1.7%) and grade III and higher GI toxicity rate (0%) are highly favorable when compared with historical moderate hypofractionation data, which typically report grade III GU toxicity in the range of 2% to 3% and grade III GI toxicity around 1% to 2%. This suggests that despite the higher dose per fraction, SBRT does not necessarily lead to increased severe acute toxicity, potentially offering a superior therapeutic ratio for GI and GU sparing.
However, the occurrence of a grade IV rectovesical fistula in 1 patient (0.6%)—who received the 40 Gy dose—was a serious complication that warrants careful consideration. This rare, but severe, complication in the higher dose cohort underscores the potential for increased organ-at-risk toxicity, particularly in the absence of a hydrogel rectal spacer, which is designed to mitigate high-dose rectal exposure. While the overall rate of significant GU toxicity remains low, this event highlights the potential risks associated with SBRT. Hydrogel rectal spacers are designed to increase the distance between the prostate and the rectum, which can reduce the rectal radiation dose and potentially mitigate the risk of such fistulas. The low rate of grade II or worse GI toxicity (3.4%) in our study is noteworthy, especially considering that hydrogel spacers were not routinely used. This finding aligns with the 2.5% GI toxicity rate reported in the SBRT arm of the PACE-B trial, suggesting that careful treatment planning and delivery techniques, such as VMAT-IMRT and daily CBCT for IGRT, may contribute to minimizing GI toxicity even without the use of rectal spacers.15 The exclusive use of 3-dimensional CBCT for IGRT in our study, without the use of fiducial markers, suggests that accurate target localization can be achieved with this approach, contributing to the observed efficacy and reduced toxicity.
Strengths and Limitations
This study’s retrospective, single-center design may have introduced selection bias. The median follow-up of 45 months, while substantial, is still relatively short for assessing very late toxicities and long-term oncologic outcomes in prostate cancer, which is known for late recurrences. Additionally, the lack of a direct comparison group within KCVAMC limits the ability to definitively attribute the observed outcomes solely to SBRT treatment. However, the strengths of this study include the inclusion of a consecutive series of veteran patients with localized prostate cancer across all risk categories, providing a real-world perspective on SBRT outcomes in a diverse patient population. Furthermore, the detailed assessment of efficacy and toxicity via standardized RTOG criteria enhances the comparability of our findings with those of other published prospective studies, despite the retrospective nature of the data.
CONCLUSIONS
This single-institution retrospective analysis revealed that short-term SBRT (36.25 to 40 Gy in 5 fractions), with a minimum follow-up of 24 months and a median follow-up of 45 months, for localized prostate cancer, including patients at HR, is associated with promising early efficacy and acceptable toxicity, even in the absence of routine fiducial or hydrogel spacer use. The favorable actuarial 5-year DFS and OS rates, coupled with a manageable toxicity profile, suggest that SBRT is a safe and convenient treatment option for many patients with localized prostate cancer. However, a longer follow-up is necessary to confirm these findings and fully characterize the long-term efficacy and toxicity of this SBRT regimen. Nevertheless, the results contribute to the growing body of evidence suggesting that SBRT is a safe and convenient treatment option for many patients with localized prostate cancer.
- Siegel RL, Kratzer TB, Giaquinto AN, et al. Cancer statistics, 2025. CA Cancer J Clin. 2025;75:10-45. doi:10.3322/caac.21871
- Donovan JL, Hamdy FC, Lane JA, et al. Patient-reported outcomes after monitoring, surgery, or radiotherapy for prostate cancer. N Engl J Med. 2016;375:1425-1437. doi:10.1056/NEJMoa1606221
- Hamdy FC, Donovan JL, Lane JA, et al. 10-year outcomes after monitoring, surgery, or radiotherapy for localized prostate cancer. N Engl J Med. 2016;375:1415-1424. doi:10.1056/NEJMoa1606220
- Dearnaley D, Syndikus I, Mossop H, et al. Conventional versus hypofractionated high-dose intensity-modulated radiotherapy for prostate cancer: 5-year outcomes of the randomised, non-inferiority, phase 3 CHHiP trial. Lancet Oncol. 2016;17:1047-1060. doi:10.1016/S1470-2045(16)30102-4
- Catton CN, Lukka H, Gu CS, et al. Randomized trial of a hypofractionated radiation regimen for the treatment of localized prostate cancer. J Clin Oncol. 2017;35:1884-1890. doi:10.1200/JCO.2016.71.7397
- Lee WR, Dignam JJ, Amin MB, et al. Long-term analysis of NRG Oncology RTOG 0415: a randomized phase III noninferiority study comparing two fractionation schedules in patients with low-risk prostate cancer. J Clin Oncol. 2024;42:2377-2381. doi:10.1200/JCO.23.02445
- de Vries KC, Wortel RC, Oomen-de Hoop E, et al. Hypofractionated versus conventionally fractionated radiation therapy for patients with intermediate- or high-risk, localized, prostate cancer: 7-year outcomes from the randomized, multicenter, open-label, phase 3 HYPRO trial. Int J Radiat Oncol Biol Phys. 2020;106:108-115. doi:10.1016/j.ijrobp.2019.09.007
- Incrocci L, Wortel RC, Alemayehu WG, et al. Hypofractionated versus conventionally fractionated radiotherapy for patients with localised prostate cancer (HYPRO): final efficacy results from a randomised, multicentre, open-label, phase 3 trial. Lancet Oncol. 2016;17:1061-1069. doi:10.1016/S1470-2045(16)30070-5
- Widmark A, Gunnlaugsson A, Beckman L, et al. Ultra-hypofractionated versus conventionally fractionated radiotherapy for prostate cancer: 5-year outcomes of the HYPO-RT-PC randomised, non-inferiority, phase 3 trial. Lancet. 2019;394:385-395. doi:10.1016/S0140-6736(19)31131-6
- Brenner DJ, Hall EJ. Fractionation and protraction for radiotherapy of prostate carcinoma. Int J Radiat Oncol Biol Phys. 1999;43:1095-101. doi:10.1016/s0360-3016(98)00438-6
- Dasu A. Is the alpha/beta value for prostate tumours low enough to be safely used in clinical trials? Clin Oncol (R Coll Radiol). 2007;19:289-301. doi:10.1016/j.clon.2007.02.007
- Garcia-Barros M, Paris F, Cordon-Cardo C, et al. Tumor response to radiotherapy regulated by endothelial cell apoptosis. Science. 2003;300:1155-1159. doi:10.1126/science.1082504
- Gulliford S, Hall E, Dearnaley D. Hypofractionation trials and radiobiology of prostate cancer. Oncoscience. 2017;4:27-28. doi:10.18632/oncoscience.347
- Fuks Z, Kolesnick R. Engaging the vascular component of the tumor response. Cancer Cell. 2005;8:89-91. doi:10.1016/j.ccr.2005.07.014
- van As N, Griffin C, Tree A, et al. Phase 3 Trial of stereotactic body radiotherapy in localized prostate cancer. N Engl J Med. Oct 17 2024;391:1413-1425. doi:10.1056/NEJMoa2403365
- National Comprehensive Cancer Network. NCCN Guidelines Version 5. 2026 Prostate Cancer. Accessed March 24, 2026. https://www.nccn.org/professionals/physician_gls/pdf/prostate.pdf
- Lawton CA, Michalski J, El-Naqa I, et al. RTOG GU radiation oncology specialists reach consensus on pelvic lymph node volumes for high-risk prostate cancer. Int J Radiat Oncol Biol Phys. 2009;74:383-387. doi:10.1016/j.ijrobp.2008.08.002
- Lehrer EJ, Kishan AU, Yu JB, et al. Ultrahypofractionated versus hypofractionated and conventionally fractionated radiation therapy for localized prostate cancer: a systematic review and meta-analysis of phase III randomized trials. Radiother Oncol. 2020;148:235-242. doi:10.1016/j.radonc.2020.04.037
- De Cooman B, Debacker T, Adams T, et al. Stereotactic body radiotherapy (SBRT) as a treatment for localized prostate cancer: a retrospective analysis. Radiat Oncol. 2025;20:25. doi:10.1186/s13014-025-02598-8
- Fuller DB, Falchook AD, Crabtree T, et al. Phase 2 multicenter trial of heterogeneous-dosing stereotactic body radiotherapy for low- and intermediate-risk prostate cancer: 5-year outcomes. Eur Urol Oncol. 2018;1:540-547. doi:10.1016/j.euo.2018.06.013
- Jackson WC, Silva J, Hartman HE, et al. Stereotactic body radiation therapy for localized prostate cancer: a systematic review and meta-analysis of over 6,000 patients treated on prospective studies. Int J Radiat Oncol Biol Phys. 2019;104:778-789. doi:10.1016/j.ijrobp.2019.03.051
- Meier RM, Bloch DA, Cotrutz C, et al. Multicenter trial of stereotactic body radiation therapy for low- and intermediate-risk prostate cancer: survival and toxicity endpoints. nt J Radiat Oncol Biol Phys. 2018;102:296-303. doi:10.1016/j.ijrobp.2018.05.040
- Quon HC, Ong A, Cheung P, et al. Once-weekly versus every-other-day stereotactic body radiotherapy in patients with prostate cancer (PATRIOT): a phase 2 randomized trial. Radiother Oncol. 2018;127:206-212. doi:10.1016/j.radonc.2018.02.029
- Zelefsky MJ, Kollmeier M, McBride S, et al. Five-year outcomes of a phase 1 dose-escalation study using stereotactic body radiosurgery for patients with low-risk and intermediate-risk prostate cancer. Int J Radiat Oncol Biol Phys. 2019;104:42-49. doi:10.1016/j.ijrobp.2018.12.045
Prostate cancer is the most common cancer in US males, with an estimated 313,780 new cases and 35,770 deaths in 2025.1 Several treatment options are available for localized prostate cancer that have similar outcomes, including active surveillance for low-risk cancers, surgery, or radiotherapy.2,3 Conventional fractionation radiotherapy (CFRT) with 40 to 45 fractions over 8 to 9 weeks has been used for decades. Over the past 2 decades, moderate hypofractionation schedules with 2.4 to 3.4 Gy per fraction over 20 to 28 fractions have become standard, as many noninferiority randomized clinical trials (RCTs) such as CHHiP (UK),4 PROFIT (Canada and Europe),5 NRG Oncology RTOG 0415 (US),6 HYPRO (Netherlands),7,8 and HYPO-RT-PC (Sweden and Denmark),9 have shown the noninferiority of moderately hypofractionated radiotherapy compared with CFRT. Notably, most of these noninferiority studies primarily included patients with low- or intermediate-risk prostate cancer, except for the HYPO-RT-PC trial,9 which also included patients with intermediate- and high-risk prostate cancer.
These noninferiority studies, along with technological advances in radiotherapy, such as intensity-modulated radiotherapy (IMRT), volumetric modulated arc therapy (VMAT), and image-guided radiotherapy (IGRT), paved the path to ultrahypofractionated stereotactic body radiotherapy (SBRT) that is delivered in 5 fractions of ≥ 6 Gy. This high dose per fraction may have a radiobiologic advantage over conventional fractionation. The relatively low a/ß ratio of prostate cancer, estimated to be between 1 and 2, suggests that tumor cells may be particularly sensitive to the high doses per fraction delivered in SBRT.10-13 Compared with CFRT, SBRT-induced tumor cell death may also be mediated through different pathways; this pathway appears to be generated in a dose-dependent manner, particularly with doses > 8 Gy per fraction.14,15 Additionally, the higher a/ß ratio for the surrounding organs at risk, such as the bladder and rectum, theoretically allows for an improved therapeutic ratio window that maximizes tumor control while minimizing damage to healthy tissues.
A substantial body of evidence from prospective studies and meta-analyses supports the use of SBRT for localized prostate cancer. HYPO-RT-PC, a significant phase 3 noninferiority study, enrolled 1200 patients with intermediate (89%) and high-risk (11%) prostate cancer randomized between 2 arms, including CFRT to 78 Gy in 39 fractions and SBRT to 42.7 Gy in 7 fractions, treated 3 days weekly. After a median follow-up of 60 months, the estimated 5-year biochemical relapse-free survival rate was 84% in both groups.9 This trial was notable because it was the first randomized study to demonstrate that SBRT was noninferior to CFRT in intermediate- and high-risk prostate cancer patients. Another pivotal phase 3 trial, the PACE-B study, enrolled 874 patients to compare SBRT (36.25 Gy to the prostate gland, with a secondary dose of 40 Gy to the gross tumor volume where applicable, in 5 fractions) with CFRT (78 Gy in 39 fractions) and moderately hypofractionated radiotherapy (HFRT) (62 Gy in 20 fractions) in patients with low- or intermediate-risk prostate cancer. With a 74-month median follow-up, the study reported 5-year biochemical free rates of 94.6% for CFRT and 95.8% for SBRT, confirming the noninferiority of SBRT to CFRT.15
SBRT offers short, effective, and convenient treatment to many patients with localized prostate cancer. While previous guidelines were more restrictive, the March 2026 National Comprehensive Cancer Network (NCCN) guidelines now list SBRT as a preferred treatment modality for high-risk prostate cancer.16
Given the growing body of evidence supporting the efficacy and safety of SBRT, we implemented an SBRT program in 2014 at a tertiary care center for veterans. This retrospective study was undertaken to evaluate the early efficacy and toxicity of SBRT in patients with localized prostate cancer treated at our institution, including patients across all risk stratifications.
METHODS
We identified 242 patients diagnosed with prostate cancer who underwent SBRT treatment between November 2014 and October 2024 at Overland Park Veterans Affairs Radiation Oncology Clinic. For the final analysis, 46 patients with < 2 years of follow-up and 22 patients who died from causes other than prostate cancer were excluded, resulting in a cohort of 174 patients with ≥ 24-month follow-up.
Treatment
Patients eligible for staging underwent imaging according to NCCN guidelines, including computed tomography (CT) of the abdomen and pelvis, bone scintigraphy, or, in recent years, prostate-specific membrane antigen positron emission tomography, primarily used for unfavorable intermediate-risk (UIR) and high-risk (HR) cancers. Patients with a negative staging work-up for nodal or skeletal disease were included. Prior to planning the CT simulation, patients were given bowel preparation instructions, including a low-fiber and low-gas-producing diet, simethicone, and enemas, the night before and morning of the simulation. Patients were instructed to arrive with a comfortably full bladder, having not voided for 2 to 3 hours prior to the procedure. At Kansas City Veterans Affairs Medical Center (KCVAMC), SBRT treatment was generally restricted to patients with a baseline American Urological Association symptom score of 15 to 20 out of 35 and a prostate gland size < 80 mL to minimize the risk of acute urinary toxicity. We did not use intraprostatic fiducials, hydrogel rectal spacers, or intravenous contrast agents for planning CT simulation.
Patients were placed in a supine position, and a vacuum bag was used for immobilization. Following the CT simulation, the images were transferred to the Eclipse treatment planning system. The clinical target volume (CTV) encompassed the prostate and the proximal 1.0 cm of the seminal vesicles for Gleason score (GS) 1 to 2, and the entire seminal vesicle was included for GS 3 to 5, which is consistent with KCVAMC practice and established safety protocols. The planning target volume (PTV) was created by uniformly expanding the CTV by 5 to 7 mm, except for the posterior margin, which was limited to 3 to 5 mm. When elective nodal radiotherapy was planned for HR prostate cancer, the pelvic field for CT simulation started at the L-2 upper border, with the lower border extending to the lesser trochanter. The pelvic nodes were delineated per Radiation Therapy Oncology Group (RTOG) guidelines.17 The CTV nodes (CTVn), including common iliac, external and internal iliac nodes, obturator, and presacral nodes, were created by uniformly expanding the CTVn by 2 to 3 mm. Slice-by-slice corrections were made to avoid bowel overlap in these patients.
The use of androgen deprivation therapy (ADT) for a duration of 6 to 24 months was prescribed for patients with UIR or HR prostate cancer per NCCN guidelines.16 The prescribed dose to the PTV was 36.25 to 40 Gy (40 Gy was mostly used as a boost to the dominant lesion) in 5 fractions, with each fraction ranging from 7.25 to 8 Gy. For elective nodal radiotherapy in patients at HR, the prescribed dose was 25 Gy in 5 fractions. All patients were planned for VMAT, which aims to deliver ≥ 95% of the prescription dose to 95% of the PTV. Once the physician approved the treatment plan and physics quality assessment was completed, treatments commenced on an every-other-day schedule. Patients received the same bowel preparation instructions for each treatment as for the planning CT simulation. Daily treatment accuracy was confirmed via daily 3-dimensional cone-beam CT (CBCT) for IGRT. No fiducials or hydrogel rectal spacers were used.
Follow-up Schedule and Toxicity Assessment
Follow-up assessments were conducted 4 to 6 weeks after radiation therapy and then repeated every 6 months for 2 to 5 years, and annually thereafter. At each follow-up visit, patients were evaluated for genitourinary (GU) and gastrointestinal (GI) toxicity, according to RTOG toxicity criteria. Prostate-specific antigen (PSA) levels were monitored; in patients receiving ADT, testosterone levels were also checked.
Statistical Analysis
Biochemical failure was defined using the Phoenix definition (nadir PSA + 2 ng/mL). Differences between dose cohorts were assessed using the log-rank test for survival outcomes and X2 testing for categorical variables. GU and GI toxicities were summarized as cumulative incidences of RTOG grade ≥ II events. Statistical significance was set at P < .05.
RESULTS
One hundred seventy-four patients were included in the retrospective review. Patients had a median follow-up of 45 months (range, 24-111) (Figure). The median age at treatment was 74 years (range, 51-88), and the median pretreatment PSA level was 11.9 ng/mL (range, 0.6-69.5). Twenty-six patients (14.9%) had a GS 1, 77 (44.3%) had GS 2, 41 (23.6%) had GS 3, 18 (10.3%) had GS 4, and 12 (6.9%) had GS 5. Fifty-one patients (29.3%) received elective pelvic nodal radiotherapy, and 93 patients (53.4%) received ADT (Table 1).
At 24 months follow-up, 6 patients (3.4%) had biochemical failures. One patient died from metastatic prostate cancer, and 5 patients are living with biochemical failure (Table 2). The actuarial 5-year overall survival (OS) rate was 99.4%, and the 5-year disease-free survival (DFS) rate was 96.6%. We performed a subanalysis comparing outcomes of the 36.25 Gy vs 40 Gy SBRT cohorts. There was no statistically significant difference in DFS, OS, or the cumulative incidence of grade II/III toxicity between patients treated with 40 Gy vs 36.25 Gy. Outcomes stratified by NCCN risk groups (low, intermediate, high/very high) are detailed in Table 3. As expected, DFS was slightly lower in the high-risk group, but overall disease control remained high across all stratifications.
The cumulative incidence of RTOG grade II and higher GU toxicity was 28.2% (Table 4). This included 46 patients (26.4%) with grade II GU toxicity and 2 patients (1.2%) who developed grade III GU complications (1 requiring self-catheterization and another a suprapubic catheter for urinary retention). One patient (0.6%) treated with a 40 Gy dose regimen experienced a grade IV GU complication in the form of a rectovesical fistula necessitating surgical intervention.
The cumulative incidence of RTOG grade II or higher GI toxicity was 3.4%, and no grade III or IV gastrointestinal toxicities were observed during the follow-up period. Importantly, intraprostatic fiducials, hydrogel rectal spacers, or intravenous contrast were not routinely used in this cohort of patients.
The high rates of actuarial 5-year DFS and OS observed suggest a favorable initial response to the SBRT regimen employed at KCVAMC. However, given the potential for late recurrence in patients with prostate cancer, longer follow-up is essential to determine the durability of these outcomes. The observed GU toxicity rate of 28.2% for grade II and higher events warrants careful consideration and compares with other published data on SBRT for prostate cancer.15 The occurrence of a grade IV rectovesical fistula, although rare, is a notable adverse event that warrants discussion in the context of the treatment approach. The low incidence of grade II or higher GI toxicity is an encouraging finding, particularly given that hydrogel rectal spacers are not routinely used to minimize rectal exposure.
DISCUSSION
The primary objective of this retrospective study was to evaluate the outcomes of SBRT for patients with localized prostate cancer treated at KCVAMC and to compare these results with those reported in the literature. Our findings demonstrate promising intermediate-term efficacy, with an estimated 5-year DFS of 96.6% and OS of 99.4% at a median follow-up of 45 months. Furthermore, the observed toxicity profile appears acceptable, with a cumulative grade II and higher GU toxicity rate of 28.2% and a grade II or higher GI toxicity rate of 3.4%. Notably, these outcomes were achieved without the routine use of intraprostatic fiducials or hydrogel rectal spacers.
Two pivotal randomized phase 3 trials have established the noninferiority of ultrahypofractionated radiotherapy (UHRT) with SBRT over conventional fractionation. The HYPO-RT-PC trial compared SBRT (42.7 Gy in 7 fractions) with conventional fractionation (78 Gy in 39 fractions) in intermediate- and high-risk patients with prostate cancer and reported a 5-year biochemical relapse-free survival of 84% in both arms.9 The PACE-B trial, which included patients at low- and intermediate-risk, compared SBRT (36.25 Gy in 5 fractions) with conventional or moderate HFRT and reported a 5-year biochemical control rate of 95.8% in the SBRT arm and 94.6% in the control arm.15
A comprehensive review and meta-analysis of 7 phase 3 studies involving 6795 patients compared different radiotherapy regimens, namely, UHRT, HFRT, and CFRT, and reported that after 5 years, the DFS rates were 85.1% for CFRT, 86% for HFRT, and 85% for UHRT, with no significant difference in toxicity among the 3 different treatment approaches.18 This suggests that shorter, more intense radiotherapy schedules (UHRT and HFRT) may be as effective and safe as traditional, longer courses of radiation.
There are multiple published nonrandomized prospective trials in which thousands of patients with extreme hypofractionation have been treated with different doses, fractions, and techniques. While heterogeneity and limited long-term follow-up in the existing evidence are acknowledged, these data suggest that prostate SBRT provides appropriate biochemical control with few high-grade toxicities, supporting its ongoing global use and justifying further prospective investigations. Comparative data are shown in Table 5. Several ongoing studies are evaluating noninferiority, superiority, and cost-effectiveness using different methodologies (Table 6).9,15,19-24
This study’s efficacy outcomes, particularly the high DFS rate, are consistent with the findings from these landmark trials, suggesting that the SBRT regimen used at KCVAMC is effective in achieving early disease control despite 17.2% of patients having high-risk disease. The GU toxicity observed in this study, with a 28.2% rate of grade II or higher events, is also comparable with the 26.9% reported in the 5-fraction SBRT arm of the PACE-B trial, which had a longer median follow-up of 74 months.15 It is important to note that a portion of these grade II events occurred in patients who were already on a blockers for pre-existing lower urinary tract symptoms before starting radiotherapy, which may inflate the observed cumulative acute toxicity score.
A critical comparison is how SBRT toxicity aligns with moderate hypofractionation (eg, 60 Gy in 20 fractions or 70 Gy in 28 fractions as reported by others).4,6 Our observed grade III and higher GU toxicity rate (1.7%) and grade III and higher GI toxicity rate (0%) are highly favorable when compared with historical moderate hypofractionation data, which typically report grade III GU toxicity in the range of 2% to 3% and grade III GI toxicity around 1% to 2%. This suggests that despite the higher dose per fraction, SBRT does not necessarily lead to increased severe acute toxicity, potentially offering a superior therapeutic ratio for GI and GU sparing.
However, the occurrence of a grade IV rectovesical fistula in 1 patient (0.6%)—who received the 40 Gy dose—was a serious complication that warrants careful consideration. This rare, but severe, complication in the higher dose cohort underscores the potential for increased organ-at-risk toxicity, particularly in the absence of a hydrogel rectal spacer, which is designed to mitigate high-dose rectal exposure. While the overall rate of significant GU toxicity remains low, this event highlights the potential risks associated with SBRT. Hydrogel rectal spacers are designed to increase the distance between the prostate and the rectum, which can reduce the rectal radiation dose and potentially mitigate the risk of such fistulas. The low rate of grade II or worse GI toxicity (3.4%) in our study is noteworthy, especially considering that hydrogel spacers were not routinely used. This finding aligns with the 2.5% GI toxicity rate reported in the SBRT arm of the PACE-B trial, suggesting that careful treatment planning and delivery techniques, such as VMAT-IMRT and daily CBCT for IGRT, may contribute to minimizing GI toxicity even without the use of rectal spacers.15 The exclusive use of 3-dimensional CBCT for IGRT in our study, without the use of fiducial markers, suggests that accurate target localization can be achieved with this approach, contributing to the observed efficacy and reduced toxicity.
Strengths and Limitations
This study’s retrospective, single-center design may have introduced selection bias. The median follow-up of 45 months, while substantial, is still relatively short for assessing very late toxicities and long-term oncologic outcomes in prostate cancer, which is known for late recurrences. Additionally, the lack of a direct comparison group within KCVAMC limits the ability to definitively attribute the observed outcomes solely to SBRT treatment. However, the strengths of this study include the inclusion of a consecutive series of veteran patients with localized prostate cancer across all risk categories, providing a real-world perspective on SBRT outcomes in a diverse patient population. Furthermore, the detailed assessment of efficacy and toxicity via standardized RTOG criteria enhances the comparability of our findings with those of other published prospective studies, despite the retrospective nature of the data.
CONCLUSIONS
This single-institution retrospective analysis revealed that short-term SBRT (36.25 to 40 Gy in 5 fractions), with a minimum follow-up of 24 months and a median follow-up of 45 months, for localized prostate cancer, including patients at HR, is associated with promising early efficacy and acceptable toxicity, even in the absence of routine fiducial or hydrogel spacer use. The favorable actuarial 5-year DFS and OS rates, coupled with a manageable toxicity profile, suggest that SBRT is a safe and convenient treatment option for many patients with localized prostate cancer. However, a longer follow-up is necessary to confirm these findings and fully characterize the long-term efficacy and toxicity of this SBRT regimen. Nevertheless, the results contribute to the growing body of evidence suggesting that SBRT is a safe and convenient treatment option for many patients with localized prostate cancer.
- Siegel RL, Kratzer TB, Giaquinto AN, et al. Cancer statistics, 2025. CA Cancer J Clin. 2025;75:10-45. doi:10.3322/caac.21871
- Donovan JL, Hamdy FC, Lane JA, et al. Patient-reported outcomes after monitoring, surgery, or radiotherapy for prostate cancer. N Engl J Med. 2016;375:1425-1437. doi:10.1056/NEJMoa1606221
- Hamdy FC, Donovan JL, Lane JA, et al. 10-year outcomes after monitoring, surgery, or radiotherapy for localized prostate cancer. N Engl J Med. 2016;375:1415-1424. doi:10.1056/NEJMoa1606220
- Dearnaley D, Syndikus I, Mossop H, et al. Conventional versus hypofractionated high-dose intensity-modulated radiotherapy for prostate cancer: 5-year outcomes of the randomised, non-inferiority, phase 3 CHHiP trial. Lancet Oncol. 2016;17:1047-1060. doi:10.1016/S1470-2045(16)30102-4
- Catton CN, Lukka H, Gu CS, et al. Randomized trial of a hypofractionated radiation regimen for the treatment of localized prostate cancer. J Clin Oncol. 2017;35:1884-1890. doi:10.1200/JCO.2016.71.7397
- Lee WR, Dignam JJ, Amin MB, et al. Long-term analysis of NRG Oncology RTOG 0415: a randomized phase III noninferiority study comparing two fractionation schedules in patients with low-risk prostate cancer. J Clin Oncol. 2024;42:2377-2381. doi:10.1200/JCO.23.02445
- de Vries KC, Wortel RC, Oomen-de Hoop E, et al. Hypofractionated versus conventionally fractionated radiation therapy for patients with intermediate- or high-risk, localized, prostate cancer: 7-year outcomes from the randomized, multicenter, open-label, phase 3 HYPRO trial. Int J Radiat Oncol Biol Phys. 2020;106:108-115. doi:10.1016/j.ijrobp.2019.09.007
- Incrocci L, Wortel RC, Alemayehu WG, et al. Hypofractionated versus conventionally fractionated radiotherapy for patients with localised prostate cancer (HYPRO): final efficacy results from a randomised, multicentre, open-label, phase 3 trial. Lancet Oncol. 2016;17:1061-1069. doi:10.1016/S1470-2045(16)30070-5
- Widmark A, Gunnlaugsson A, Beckman L, et al. Ultra-hypofractionated versus conventionally fractionated radiotherapy for prostate cancer: 5-year outcomes of the HYPO-RT-PC randomised, non-inferiority, phase 3 trial. Lancet. 2019;394:385-395. doi:10.1016/S0140-6736(19)31131-6
- Brenner DJ, Hall EJ. Fractionation and protraction for radiotherapy of prostate carcinoma. Int J Radiat Oncol Biol Phys. 1999;43:1095-101. doi:10.1016/s0360-3016(98)00438-6
- Dasu A. Is the alpha/beta value for prostate tumours low enough to be safely used in clinical trials? Clin Oncol (R Coll Radiol). 2007;19:289-301. doi:10.1016/j.clon.2007.02.007
- Garcia-Barros M, Paris F, Cordon-Cardo C, et al. Tumor response to radiotherapy regulated by endothelial cell apoptosis. Science. 2003;300:1155-1159. doi:10.1126/science.1082504
- Gulliford S, Hall E, Dearnaley D. Hypofractionation trials and radiobiology of prostate cancer. Oncoscience. 2017;4:27-28. doi:10.18632/oncoscience.347
- Fuks Z, Kolesnick R. Engaging the vascular component of the tumor response. Cancer Cell. 2005;8:89-91. doi:10.1016/j.ccr.2005.07.014
- van As N, Griffin C, Tree A, et al. Phase 3 Trial of stereotactic body radiotherapy in localized prostate cancer. N Engl J Med. Oct 17 2024;391:1413-1425. doi:10.1056/NEJMoa2403365
- National Comprehensive Cancer Network. NCCN Guidelines Version 5. 2026 Prostate Cancer. Accessed March 24, 2026. https://www.nccn.org/professionals/physician_gls/pdf/prostate.pdf
- Lawton CA, Michalski J, El-Naqa I, et al. RTOG GU radiation oncology specialists reach consensus on pelvic lymph node volumes for high-risk prostate cancer. Int J Radiat Oncol Biol Phys. 2009;74:383-387. doi:10.1016/j.ijrobp.2008.08.002
- Lehrer EJ, Kishan AU, Yu JB, et al. Ultrahypofractionated versus hypofractionated and conventionally fractionated radiation therapy for localized prostate cancer: a systematic review and meta-analysis of phase III randomized trials. Radiother Oncol. 2020;148:235-242. doi:10.1016/j.radonc.2020.04.037
- De Cooman B, Debacker T, Adams T, et al. Stereotactic body radiotherapy (SBRT) as a treatment for localized prostate cancer: a retrospective analysis. Radiat Oncol. 2025;20:25. doi:10.1186/s13014-025-02598-8
- Fuller DB, Falchook AD, Crabtree T, et al. Phase 2 multicenter trial of heterogeneous-dosing stereotactic body radiotherapy for low- and intermediate-risk prostate cancer: 5-year outcomes. Eur Urol Oncol. 2018;1:540-547. doi:10.1016/j.euo.2018.06.013
- Jackson WC, Silva J, Hartman HE, et al. Stereotactic body radiation therapy for localized prostate cancer: a systematic review and meta-analysis of over 6,000 patients treated on prospective studies. Int J Radiat Oncol Biol Phys. 2019;104:778-789. doi:10.1016/j.ijrobp.2019.03.051
- Meier RM, Bloch DA, Cotrutz C, et al. Multicenter trial of stereotactic body radiation therapy for low- and intermediate-risk prostate cancer: survival and toxicity endpoints. nt J Radiat Oncol Biol Phys. 2018;102:296-303. doi:10.1016/j.ijrobp.2018.05.040
- Quon HC, Ong A, Cheung P, et al. Once-weekly versus every-other-day stereotactic body radiotherapy in patients with prostate cancer (PATRIOT): a phase 2 randomized trial. Radiother Oncol. 2018;127:206-212. doi:10.1016/j.radonc.2018.02.029
- Zelefsky MJ, Kollmeier M, McBride S, et al. Five-year outcomes of a phase 1 dose-escalation study using stereotactic body radiosurgery for patients with low-risk and intermediate-risk prostate cancer. Int J Radiat Oncol Biol Phys. 2019;104:42-49. doi:10.1016/j.ijrobp.2018.12.045
Early Outcomes of Stereotactic Body Radiotherapy for Localized Prostate Cancer: A Retrospective Analysis
Early Outcomes of Stereotactic Body Radiotherapy for Localized Prostate Cancer: A Retrospective Analysis
A Case of Birt-Hogg-Dubé Syndrome: A Rare but Essential Diagnosis to Consider
A Case of Birt-Hogg-Dubé Syndrome: A Rare but Essential Diagnosis to Consider
Birt-Hogg-Dubé syndrome (BHD) is an autosomal dominant disease that arises from loss-of-function mutations in the FLCN gene. FLCN encodes folliculin, which is presumed to function as a tumor suppressor, though its precise role is incompletely understood.1,2 BHD is characterized by multiple pulmonary cysts leading to recurrent spontaneous pneumothoraces, cutaneous lesions—specifically fibrofolliculomas—and an increased risk of renal malignancies. Diagnosing BHD is challenging due to the variable presentation of the disease. Some patients may only have cystic lung diseases, while others may not have characteristic skin lesions.3-5 It is important to maintain awareness of BHD, especially when the diagnosis dictates the need for genetic counseling.
Case Presentation
A male veteran in his 60s, who was a lifelong nonsmoker with a history of extensive bullous emphysema and recurrent pneumothoraces, presented to the Veterans Affairs Greater Los Angeles Healthcare System pulmonary clinic while transferring care from a separate institution.
According to the patient, the first pneumothorax episode occurred about 20 years before presentation, followed by a recurrence a few years later after he was diagnosed with emphysema. He underwent pleurodesis of the right lung during his service abroad. Another episode nearly a decade after the first pneumothorax necessitated pleurodesis of the left lung (Figure 1). The patient's family history revealed pulmonary cysts in 1 immediate family member but no history of renal tumors. Notably, his mother passed away at a young age due to tuberculosis.
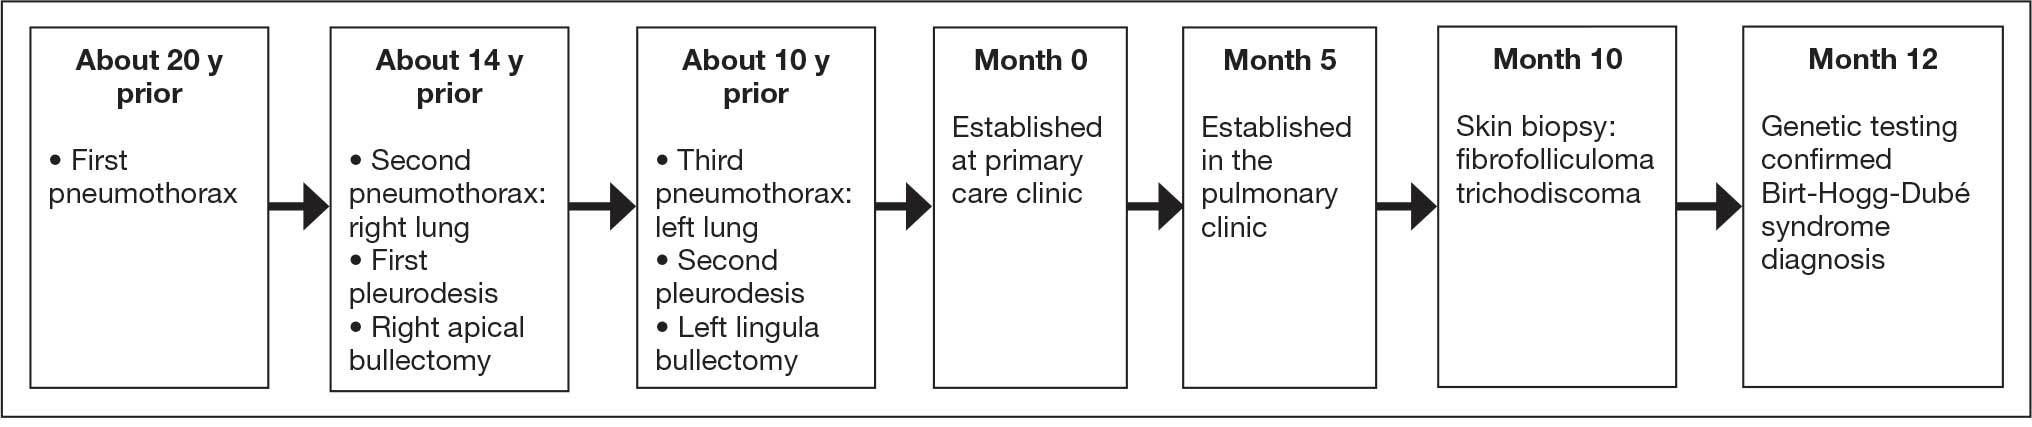
On physical examination, numerous skin tags and acrochordons on the face were observed, which had been stable for > 30 years. Despite a slow decline in exercise capacity following pleurodesis, the patient could still walk multiple miles daily and climb 3 flights of stairs before needing to rest. Pulmonary function testing (PFT) showed a forced expiratory volume in 1 second (FEV1)/forced vital capacity ratio of 0.84 with reduced FEV1, total lung capacity (TLC), and diffusion capacity for carbon monoxide (DLCO), indicating a mild restrictive ventilatory defect and reduced diffusing capacity.
Laboratory results revealed a normal α-1 antitrypsin level: 133 mg/dL (reference, 83-199 mg/dL), with a Pi*MS phenotype and undetectable antinuclear antibodies. The most recent chest computed tomography (CT) in 2019, displayed paraseptal and centrilobular emphysema, scattered blebs, and scarring consistent with prior pleurodesis procedures (Figure 2).
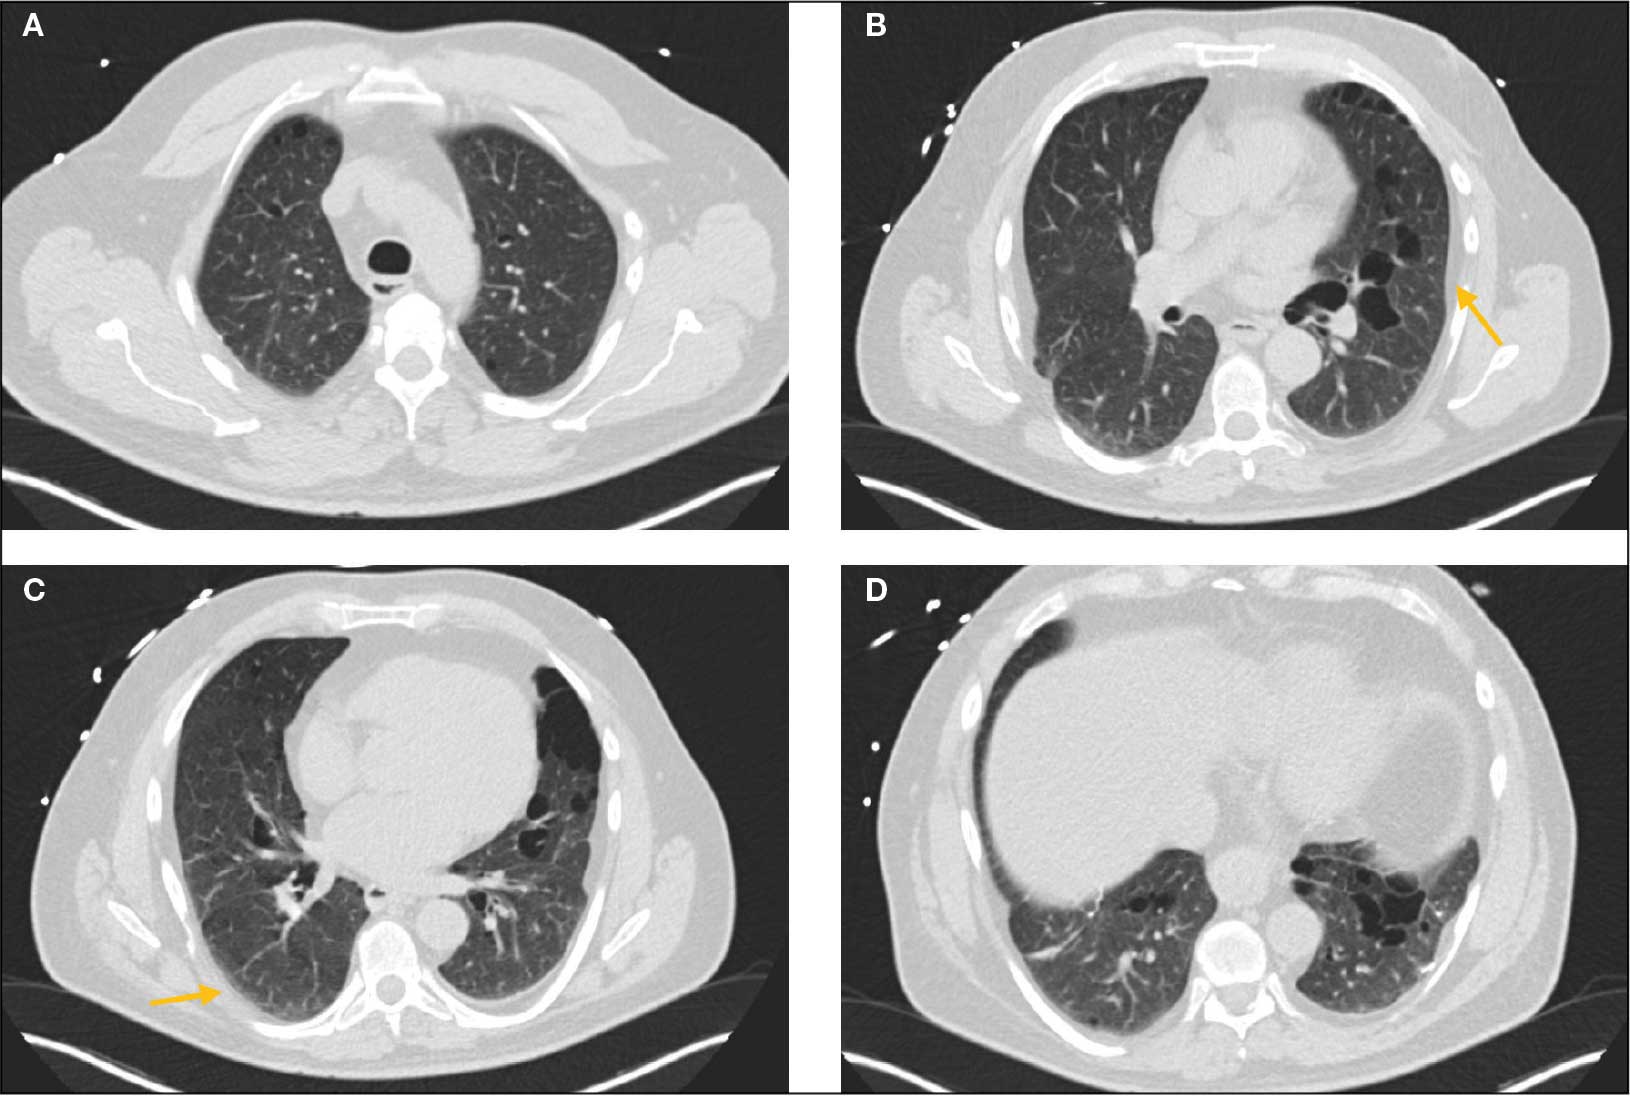
Genetic testing for the FLCN gene revealed heterozygous pathogenic mutation: c.1285del and p.His429Thrfs*39, which confirmed the diagnosis of BHD. A shave biopsy of a postauricular papular lesion confirmed a histologic pattern of fibrofolliculoma/trichodiscoma.
Follow-up and Outcomes
After confirmation of the BHD diagnosis, the patient was referred to genetic counseling and scheduled for annual magnetic resonance imaging (MRI) of the abdomen and pelvis to screen for renal malignancies. As the patient was able to establish care with a new long-term primary care practitioner in the outpatient setting, he continues regular follow-up visits in the pulmonary clinic with stable respiratory symptoms and no recurrent pneumothoraces thus far.
Discussion
Differential Diagnoses of Cystic Pulmonary Lesions
BHD is an important differential diagnosis to consider in the presentation of diffuse cystic lung diseases. Still, 2 other crucial considerations are pulmonary Langerhans cell histiocytosis (PLCH) and lymphangioleiomyomatosis (LAM), which occur at slightly higher frequencies than BHD.6
One of the first steps in radiographically evaluating cystic lung diseases is to characterize the cysts. The Fleischner Society defines true cysts as a “round parenchymal lucency or low-attenuating area with a well-defined interface with normal lung.”7 Mimics of cystic lesions may include cavitary lung lesions, thick-walled spaces within another area of mass, nodule, or consolidation. Another mimic is a pneumatocele, a pseudocyst that lacks epithelial lining and may be secondary to bacterial pneumonia, pneumocystis infections, trauma, or prior mechanical ventilation.8After characterizing true cysts, different patterns of cystic lesions can also be associated with specific diseases. Cysts in PLCH are commonly more uniform and round, whereas the cysts in LAM may be more irregularly shaped. 9 Cysts in BHD may be larger and predominantly located in basal and paramediastinal areas.4LAM is associated with tuberous sclerosis, which can also present with skin lesions (angiofibromas) and renal tumors (angiomyolipomas), thus creating a very similar picture to BHD. Therefore, tissue biopsies of skin lesions are essential as histopathology can identify characteristic fibrofolliculomas specific to BHD. While genetic testing would also strongly support the diagnosis of BHD, it is essential to note that negative genetic testing does not rule out BHD.4Lastly, lymphoid interstitial pneumonia (LIP) is another important consideration in the differential diagnosis of cystic lung diseases. LIP presents with not only perivascular cysts and centrilobular nodules but also diffuse ground-glass attenuation.10 In contrast to BHD, LIP is associated with autoimmune diseases such as Sjögren syndrome and infectious diseases such as HIV; thus, it may be differentiated from BHD by the presence of underlying disease processes and may warrant serologic testing for potential rheumatologic disorders.
Characteristics and Diagnostic Criteria
Cystic lung disease is the most common presentation of BHD. It presents in > 80% of cases and confers a 50-fold increase in the risk of spontaneous pneumothorax compared with the general population.4,11 Recurrent pneumothoraces are observed in about 25% to 30% of patients with BHD, typically occurring between the third and fifth decades of life and at significantly decreased rates after 50 years of age.12 A spontaneous pneumothorax might serve as the initial and perhaps the sole clinical presentation for some patients with BHD, but others may present with other respiratory symptoms such as cough and exertional dyspnea. PFT results may be normal or reveal a mild restrictive ventilatory defect and reduced DLCO, as reported in a few cases.6 The management of pulmonary complications primarily revolves around reducing the risk of pneumothoraces, which includes precautions such as avoiding positive pressure ventilation and air travel. Early pleurodesis with the first occurrence of a spontaneous pneumothorax is considered in some cases.13
The distinctive dermatologic features associated with BHD include multiple white papules primarily found on the nose and face. Pathologically, these manifestations have a range of histologic distinctions, from fibrofolliculomas to benign hamartomas of the hair follicles and trichodiscomas.5 The diagnostic criteria outlined by Menko et al note that confirmation of BHD requires the presence of either ≥ 5 pathologically confirmed fibrofolliculomas or trichodiscomas, a documented pathogenic FLCN gene mutation, or the fulfillment of 2 minor criteria. These minor criteria include the presence of multiple lung cysts, early-onset renal cancer, or a first-degree relative with BHD.5
Recurrent Pneumothoraces Management
After the first episode of spontaneous pneumothorax, early pleurodesis is indicated as the risk of recurrence can be as high as 75%.4,14 Specific pleurodesis modalities have shown promising results, such as total pleural covering with cellulose mesh. In a small retrospective review, cellulose mesh demonstrated a significant reduction in the recurrence rate of pneumothorax at 7.5 years for patients with BHD compared with partial covering.15 Apart from preventing further pneumothorax episodes in the affected lung, it is also important to highlight patient education and monitoring after initial pleurodesis, as the contralateral lung is also at risk. As demonstrated in this case, the patient had received pleurodesis of his right lung but experienced another pneumothorax of his contralateral lung a few years later.
Lastly, the patient was advised to avoid air travel altogether; however, current data may suggest that air travel may not be an absolute contraindication for patients with BHD. Although the literature on this topic is limited, a retrospective study by Johannesma et al involving 158 patients with BHD surveyed on pneumothorax occurrence after air travel indicated a calculated risk of 0.63% per flight. Notably, only 3 of 13 patients with BHD and recurrent pneumothoraces after travel had undergone pleurodesis in the past.16 Therefore, counseling patients on the potential risks of air travel and allowing essential flights while diligently monitoring for symptoms during and after travel may be a reasonable, patient-centered approach in contrast to a complete restriction on air travel.
Timing to Diagnosis
Diagnosing BHD is challenging and often delayed. In a 2022 study by Steinlein et al, the average delay in BHD diagnoses in their cohort was 9.3 years, with 4 patients also diagnosed with renal malignancy during the study period.17 The difficulty in diagnosis can be attributed to the heterogeneous presentation among affected family members, some of whom may exclusively exhibit pulmonary cystic lesions without dermatologic findings.
A lack of longitudinal care for this patient may have contributed to the diagnostic delay. The patient had pneumothorax events across separate care settings and locations, and due to employment-related relocations, he often re-established care at various health care systems. This case highlights the importance of continuity of care, especially in BHD, where monitoring for renal tumors is also essential to long-term management.17,18
Renal Tumor Monitoring
Finally, once BHD is diagnosed, one of the most important considerations is to begin routine monitoring for renal malignancies. Current recommendations advise starting lifelong renal cancer screening, even as early as age 20 years, with annual MRIs, as renal ultrasound may not be sufficiently sensitive to detect smaller lesions.19 The screening interval can be extended to every 2 years for patients without a family history of renal tumors or suspicious renal lesions. If tumors are found, then nephron-sparing surgery is recommended, given the potential for the development of chronic renal insufficiency in patients with BHD.20
Conclusions
BHD is a rare and complex syndrome in which early recognition and diagnosis play a pivotal role in preventing potentially severe complications such as renal malignancies. Suspicion of a genetic disorder, such as BHD, LAM, or PLCH, should arise in patients who experience spontaneous pneumothorax, especially in the presence of multiple cystic lesions or a family history of pneumothoraces. Early consideration of pleurodesis after the first spontaneous pneumothorax is advisable. The complex presentation of BHD contributes to the difficulty of diagnosis and may delay recognition, which can be exacerbated by variable continuity of care.
- Schmidt LS, Linehan WM. Molecular genetics and clinical features of Birt-Hogg-Dubé-Syndrome. Nat Rev Urol. 2015;12:558-569. doi:10.1038/nrurol.2015.206
- Lim DHK, Rehal PK, Nahorski MS, et al. A new locus-specific database (LSDB) for mutations in the folliculin (FLCN) gene. Hum Mutat. 2010;31:E1043-1051. doi:10.1002/humu.21130
- Aivaz O, Berkman S, Middelton L, et al. Comedonal and cystic fibrofolliculomas in Birt-Hogg-Dube syndrome. JAMA Dermatology. 2015;151:770-774. doi:10.1001/jamadermatol.2015.0215
- Daccord C, Good JM, Morren MA, et al. Birt–Hogg–Dubé syndrome. Eur Respir Rev. 2020;29:200042. doi:10.1183/16000617.0042-2020
- Menko FH, van Steensel MA, Giraud S, et al. Birt-Hogg-Dubé syndrome: diagnosis and management. The Lancet Oncology. 2009;10:1199-1206. doi:10.1016/S1470-2045(09)70188-3
- Daccord C, Cottin V, Prévot G, et al. Lung function in Birt-Hogg-Dubé syndrome: a retrospective analysis of 96 patients. Orphanet J Rare Dis. 2020;15:120. doi:10.1186/s13023-020-01402-y
- Hansell DM, Bankier AA, MacMahon H, et al. Fleischner Society: glossary of terms for thoracic imaging. Radiology. 2008;246:697-722. doi:10.1148/radiol.2462070712
- Jamil A, Kasi A. Pneumatocele. In: StatPearls. StatPearls Publishing; 2024. Accessed March 2, 2026. http://www.ncbi.nlm.nih.gov/books/NBK556146/
- Bhardwaj H, Bhardwaj B. Differentiating pulmonary lymphangioleiomyomatosis from pulmonary langerhans cell histiocytosis and Birt-Hogg-Dube syndrome. Lung India. 2013;30:372-373. doi:10.4103/0970-2113.120611
- Swigris JJ, Berry GJ, Raffin TA, et al. Lymphoid interstitial pneumonia: a narrative review. Chest. 2002;122:2150-2164. doi:10.1378/chest.122.6.2150
- Zbar B, Alvord WG, Glenn G, et al. Risk of renal and colonic neoplasms and spontaneous pneumothorax in the Birt-Hogg-Dubé syndrome. Cancer Epidemiol Biomarkers Prev. 2002;11:393-400.
- Sattler EC, Steinlein OK. Delayed diagnosis of Birt-Hogg-Dubé syndrome due to marked intrafamilial clinical variability: a case report. BMC Med Genet. 2018;19:45. doi:10.1186/s12881-018-0558-0
- Gupta N, Seyama K, McCormack FX. Pulmonary manifestations of Birt-Hogg-Dubé syndrome. Fam Cancer. 2013;12:387-396. doi:10.1007/s10689-013-9660-9
- Gupta N, Kopras EJ, Henske EP, et al. Spontaneous pneumothoraces in patients with Birt–Hogg–Dubé syndrome. Ann Am Thorac Soc. 2017;14:706-713. doi:10.1513/AnnalsATS.201611-886OC
- Mizobuchi T, Kurihara M, Ebana H, et al. A total pleural covering of absorbable cellulose mesh prevents pneumothorax recurrence in patients with Birt-Hogg-Dubé syndrome. Orphanet J Rare Dis. 2018;13:78. doi:10.1186/s13023-018-0790-x
- Johannesma PC, van de Beek I, van der Wel JWT, et al. Risk of spontaneous pneumothorax due to air travel and diving in patients with Birt–Hogg–Dubé syndrome. Springerplus. 2016;5:1506. doi:10.1186/s40064-016-3009-4
- Steinlein OK, Reithmair M, Syunyaeva Z, et al. Delayed diagnosis of Birt-Hogg-Dubé syndrome might be aggravated by gender bias. eClinicalMedicine. 2022;51:101572. doi:10.1016/j.eclinm.2022.101572
- Pereira Gray DJ, Sidaway-Lee K, White E, et al. Continuity of care with doctors—a matter of life and death? A systematic review of continuity of care and mortality. BMJ Open. 2018;8:e021161. doi:10.1136/bmjopen-2017-021161
- Sattler EC, Steinlein OK. GeneReviews Birt-Hogg-Dubé syndrome. January 30, 2020. Accessed March 2, 2026. https://www.ncbi.nlm.nih.gov/books/NBK1522/table
- Stamatakis L, Metwalli AR, Middelton LA, et al. Diagnosis and management of BHD-associated kidney cancer. Fam Cancer. 2013;12:397-402. doi:10.1007/s10689-013-9657-4
Birt-Hogg-Dubé syndrome (BHD) is an autosomal dominant disease that arises from loss-of-function mutations in the FLCN gene. FLCN encodes folliculin, which is presumed to function as a tumor suppressor, though its precise role is incompletely understood.1,2 BHD is characterized by multiple pulmonary cysts leading to recurrent spontaneous pneumothoraces, cutaneous lesions—specifically fibrofolliculomas—and an increased risk of renal malignancies. Diagnosing BHD is challenging due to the variable presentation of the disease. Some patients may only have cystic lung diseases, while others may not have characteristic skin lesions.3-5 It is important to maintain awareness of BHD, especially when the diagnosis dictates the need for genetic counseling.
Case Presentation
A male veteran in his 60s, who was a lifelong nonsmoker with a history of extensive bullous emphysema and recurrent pneumothoraces, presented to the Veterans Affairs Greater Los Angeles Healthcare System pulmonary clinic while transferring care from a separate institution.
According to the patient, the first pneumothorax episode occurred about 20 years before presentation, followed by a recurrence a few years later after he was diagnosed with emphysema. He underwent pleurodesis of the right lung during his service abroad. Another episode nearly a decade after the first pneumothorax necessitated pleurodesis of the left lung (Figure 1). The patient's family history revealed pulmonary cysts in 1 immediate family member but no history of renal tumors. Notably, his mother passed away at a young age due to tuberculosis.
On physical examination, numerous skin tags and acrochordons on the face were observed, which had been stable for > 30 years. Despite a slow decline in exercise capacity following pleurodesis, the patient could still walk multiple miles daily and climb 3 flights of stairs before needing to rest. Pulmonary function testing (PFT) showed a forced expiratory volume in 1 second (FEV1)/forced vital capacity ratio of 0.84 with reduced FEV1, total lung capacity (TLC), and diffusion capacity for carbon monoxide (DLCO), indicating a mild restrictive ventilatory defect and reduced diffusing capacity.
Laboratory results revealed a normal α-1 antitrypsin level: 133 mg/dL (reference, 83-199 mg/dL), with a Pi*MS phenotype and undetectable antinuclear antibodies. The most recent chest computed tomography (CT) in 2019, displayed paraseptal and centrilobular emphysema, scattered blebs, and scarring consistent with prior pleurodesis procedures (Figure 2).
Genetic testing for the FLCN gene revealed heterozygous pathogenic mutation: c.1285del and p.His429Thrfs*39, which confirmed the diagnosis of BHD. A shave biopsy of a postauricular papular lesion confirmed a histologic pattern of fibrofolliculoma/trichodiscoma.
Follow-up and Outcomes
After confirmation of the BHD diagnosis, the patient was referred to genetic counseling and scheduled for annual magnetic resonance imaging (MRI) of the abdomen and pelvis to screen for renal malignancies. As the patient was able to establish care with a new long-term primary care practitioner in the outpatient setting, he continues regular follow-up visits in the pulmonary clinic with stable respiratory symptoms and no recurrent pneumothoraces thus far.
Discussion
Differential Diagnoses of Cystic Pulmonary Lesions
BHD is an important differential diagnosis to consider in the presentation of diffuse cystic lung diseases. Still, 2 other crucial considerations are pulmonary Langerhans cell histiocytosis (PLCH) and lymphangioleiomyomatosis (LAM), which occur at slightly higher frequencies than BHD.6
One of the first steps in radiographically evaluating cystic lung diseases is to characterize the cysts. The Fleischner Society defines true cysts as a “round parenchymal lucency or low-attenuating area with a well-defined interface with normal lung.”7 Mimics of cystic lesions may include cavitary lung lesions, thick-walled spaces within another area of mass, nodule, or consolidation. Another mimic is a pneumatocele, a pseudocyst that lacks epithelial lining and may be secondary to bacterial pneumonia, pneumocystis infections, trauma, or prior mechanical ventilation.8After characterizing true cysts, different patterns of cystic lesions can also be associated with specific diseases. Cysts in PLCH are commonly more uniform and round, whereas the cysts in LAM may be more irregularly shaped. 9 Cysts in BHD may be larger and predominantly located in basal and paramediastinal areas.4LAM is associated with tuberous sclerosis, which can also present with skin lesions (angiofibromas) and renal tumors (angiomyolipomas), thus creating a very similar picture to BHD. Therefore, tissue biopsies of skin lesions are essential as histopathology can identify characteristic fibrofolliculomas specific to BHD. While genetic testing would also strongly support the diagnosis of BHD, it is essential to note that negative genetic testing does not rule out BHD.4Lastly, lymphoid interstitial pneumonia (LIP) is another important consideration in the differential diagnosis of cystic lung diseases. LIP presents with not only perivascular cysts and centrilobular nodules but also diffuse ground-glass attenuation.10 In contrast to BHD, LIP is associated with autoimmune diseases such as Sjögren syndrome and infectious diseases such as HIV; thus, it may be differentiated from BHD by the presence of underlying disease processes and may warrant serologic testing for potential rheumatologic disorders.
Characteristics and Diagnostic Criteria
Cystic lung disease is the most common presentation of BHD. It presents in > 80% of cases and confers a 50-fold increase in the risk of spontaneous pneumothorax compared with the general population.4,11 Recurrent pneumothoraces are observed in about 25% to 30% of patients with BHD, typically occurring between the third and fifth decades of life and at significantly decreased rates after 50 years of age.12 A spontaneous pneumothorax might serve as the initial and perhaps the sole clinical presentation for some patients with BHD, but others may present with other respiratory symptoms such as cough and exertional dyspnea. PFT results may be normal or reveal a mild restrictive ventilatory defect and reduced DLCO, as reported in a few cases.6 The management of pulmonary complications primarily revolves around reducing the risk of pneumothoraces, which includes precautions such as avoiding positive pressure ventilation and air travel. Early pleurodesis with the first occurrence of a spontaneous pneumothorax is considered in some cases.13
The distinctive dermatologic features associated with BHD include multiple white papules primarily found on the nose and face. Pathologically, these manifestations have a range of histologic distinctions, from fibrofolliculomas to benign hamartomas of the hair follicles and trichodiscomas.5 The diagnostic criteria outlined by Menko et al note that confirmation of BHD requires the presence of either ≥ 5 pathologically confirmed fibrofolliculomas or trichodiscomas, a documented pathogenic FLCN gene mutation, or the fulfillment of 2 minor criteria. These minor criteria include the presence of multiple lung cysts, early-onset renal cancer, or a first-degree relative with BHD.5
Recurrent Pneumothoraces Management
After the first episode of spontaneous pneumothorax, early pleurodesis is indicated as the risk of recurrence can be as high as 75%.4,14 Specific pleurodesis modalities have shown promising results, such as total pleural covering with cellulose mesh. In a small retrospective review, cellulose mesh demonstrated a significant reduction in the recurrence rate of pneumothorax at 7.5 years for patients with BHD compared with partial covering.15 Apart from preventing further pneumothorax episodes in the affected lung, it is also important to highlight patient education and monitoring after initial pleurodesis, as the contralateral lung is also at risk. As demonstrated in this case, the patient had received pleurodesis of his right lung but experienced another pneumothorax of his contralateral lung a few years later.
Lastly, the patient was advised to avoid air travel altogether; however, current data may suggest that air travel may not be an absolute contraindication for patients with BHD. Although the literature on this topic is limited, a retrospective study by Johannesma et al involving 158 patients with BHD surveyed on pneumothorax occurrence after air travel indicated a calculated risk of 0.63% per flight. Notably, only 3 of 13 patients with BHD and recurrent pneumothoraces after travel had undergone pleurodesis in the past.16 Therefore, counseling patients on the potential risks of air travel and allowing essential flights while diligently monitoring for symptoms during and after travel may be a reasonable, patient-centered approach in contrast to a complete restriction on air travel.
Timing to Diagnosis
Diagnosing BHD is challenging and often delayed. In a 2022 study by Steinlein et al, the average delay in BHD diagnoses in their cohort was 9.3 years, with 4 patients also diagnosed with renal malignancy during the study period.17 The difficulty in diagnosis can be attributed to the heterogeneous presentation among affected family members, some of whom may exclusively exhibit pulmonary cystic lesions without dermatologic findings.
A lack of longitudinal care for this patient may have contributed to the diagnostic delay. The patient had pneumothorax events across separate care settings and locations, and due to employment-related relocations, he often re-established care at various health care systems. This case highlights the importance of continuity of care, especially in BHD, where monitoring for renal tumors is also essential to long-term management.17,18
Renal Tumor Monitoring
Finally, once BHD is diagnosed, one of the most important considerations is to begin routine monitoring for renal malignancies. Current recommendations advise starting lifelong renal cancer screening, even as early as age 20 years, with annual MRIs, as renal ultrasound may not be sufficiently sensitive to detect smaller lesions.19 The screening interval can be extended to every 2 years for patients without a family history of renal tumors or suspicious renal lesions. If tumors are found, then nephron-sparing surgery is recommended, given the potential for the development of chronic renal insufficiency in patients with BHD.20
Conclusions
BHD is a rare and complex syndrome in which early recognition and diagnosis play a pivotal role in preventing potentially severe complications such as renal malignancies. Suspicion of a genetic disorder, such as BHD, LAM, or PLCH, should arise in patients who experience spontaneous pneumothorax, especially in the presence of multiple cystic lesions or a family history of pneumothoraces. Early consideration of pleurodesis after the first spontaneous pneumothorax is advisable. The complex presentation of BHD contributes to the difficulty of diagnosis and may delay recognition, which can be exacerbated by variable continuity of care.
- Schmidt LS, Linehan WM. Molecular genetics and clinical features of Birt-Hogg-Dubé-Syndrome. Nat Rev Urol. 2015;12:558-569. doi:10.1038/nrurol.2015.206
- Lim DHK, Rehal PK, Nahorski MS, et al. A new locus-specific database (LSDB) for mutations in the folliculin (FLCN) gene. Hum Mutat. 2010;31:E1043-1051. doi:10.1002/humu.21130
- Aivaz O, Berkman S, Middelton L, et al. Comedonal and cystic fibrofolliculomas in Birt-Hogg-Dube syndrome. JAMA Dermatology. 2015;151:770-774. doi:10.1001/jamadermatol.2015.0215
- Daccord C, Good JM, Morren MA, et al. Birt–Hogg–Dubé syndrome. Eur Respir Rev. 2020;29:200042. doi:10.1183/16000617.0042-2020
- Menko FH, van Steensel MA, Giraud S, et al. Birt-Hogg-Dubé syndrome: diagnosis and management. The Lancet Oncology. 2009;10:1199-1206. doi:10.1016/S1470-2045(09)70188-3
- Daccord C, Cottin V, Prévot G, et al. Lung function in Birt-Hogg-Dubé syndrome: a retrospective analysis of 96 patients. Orphanet J Rare Dis. 2020;15:120. doi:10.1186/s13023-020-01402-y
- Hansell DM, Bankier AA, MacMahon H, et al. Fleischner Society: glossary of terms for thoracic imaging. Radiology. 2008;246:697-722. doi:10.1148/radiol.2462070712
- Jamil A, Kasi A. Pneumatocele. In: StatPearls. StatPearls Publishing; 2024. Accessed March 2, 2026. http://www.ncbi.nlm.nih.gov/books/NBK556146/
- Bhardwaj H, Bhardwaj B. Differentiating pulmonary lymphangioleiomyomatosis from pulmonary langerhans cell histiocytosis and Birt-Hogg-Dube syndrome. Lung India. 2013;30:372-373. doi:10.4103/0970-2113.120611
- Swigris JJ, Berry GJ, Raffin TA, et al. Lymphoid interstitial pneumonia: a narrative review. Chest. 2002;122:2150-2164. doi:10.1378/chest.122.6.2150
- Zbar B, Alvord WG, Glenn G, et al. Risk of renal and colonic neoplasms and spontaneous pneumothorax in the Birt-Hogg-Dubé syndrome. Cancer Epidemiol Biomarkers Prev. 2002;11:393-400.
- Sattler EC, Steinlein OK. Delayed diagnosis of Birt-Hogg-Dubé syndrome due to marked intrafamilial clinical variability: a case report. BMC Med Genet. 2018;19:45. doi:10.1186/s12881-018-0558-0
- Gupta N, Seyama K, McCormack FX. Pulmonary manifestations of Birt-Hogg-Dubé syndrome. Fam Cancer. 2013;12:387-396. doi:10.1007/s10689-013-9660-9
- Gupta N, Kopras EJ, Henske EP, et al. Spontaneous pneumothoraces in patients with Birt–Hogg–Dubé syndrome. Ann Am Thorac Soc. 2017;14:706-713. doi:10.1513/AnnalsATS.201611-886OC
- Mizobuchi T, Kurihara M, Ebana H, et al. A total pleural covering of absorbable cellulose mesh prevents pneumothorax recurrence in patients with Birt-Hogg-Dubé syndrome. Orphanet J Rare Dis. 2018;13:78. doi:10.1186/s13023-018-0790-x
- Johannesma PC, van de Beek I, van der Wel JWT, et al. Risk of spontaneous pneumothorax due to air travel and diving in patients with Birt–Hogg–Dubé syndrome. Springerplus. 2016;5:1506. doi:10.1186/s40064-016-3009-4
- Steinlein OK, Reithmair M, Syunyaeva Z, et al. Delayed diagnosis of Birt-Hogg-Dubé syndrome might be aggravated by gender bias. eClinicalMedicine. 2022;51:101572. doi:10.1016/j.eclinm.2022.101572
- Pereira Gray DJ, Sidaway-Lee K, White E, et al. Continuity of care with doctors—a matter of life and death? A systematic review of continuity of care and mortality. BMJ Open. 2018;8:e021161. doi:10.1136/bmjopen-2017-021161
- Sattler EC, Steinlein OK. GeneReviews Birt-Hogg-Dubé syndrome. January 30, 2020. Accessed March 2, 2026. https://www.ncbi.nlm.nih.gov/books/NBK1522/table
- Stamatakis L, Metwalli AR, Middelton LA, et al. Diagnosis and management of BHD-associated kidney cancer. Fam Cancer. 2013;12:397-402. doi:10.1007/s10689-013-9657-4
A Case of Birt-Hogg-Dubé Syndrome: A Rare but Essential Diagnosis to Consider
A Case of Birt-Hogg-Dubé Syndrome: A Rare but Essential Diagnosis to Consider

Predictors of Unplanned Postoperative Visits in a Veterans Affairs Hand Surgery Practice
Predictors of Unplanned Postoperative Visits in a Veterans Affairs Hand Surgery Practice
Patients make unplanned appointments after elective soft tissue hand surgery for real or perceived complications when they experience pain, anxiety, or fear. Unplanned appointments can create travel and financial burdens for patients and families. These appointments take time away from scheduled appointments and can contribute to late arrivals and delays in other clinics. Unscheduled appointments contribute to poor access when staff are diverted from scheduled appointments. If predictive factors can be identified, unplanned appointments may either be ameliorated or avoided with better perioperative risk management or education.
Methods
The US Department of Veterans Affairs (VA) North Florida/South Georgia Veterans Health System (NFSGVAHS) and University of Florida Institutional Review Board approved a retrospective chart review of all plastic surgery cases performed at the Malcom Randall VA Medical Center (MRVAMC) and Lake City VAMC operating rooms from July 1, 2018, through December 31, 2019, and January 1, 2021, through June 30, 2022 (nonurgent surgeries were discouraged during the COVID-19 pandemic). Elective soft tissue hand surgery cases were identified based on the operative description found in the Surgical Service Surgeon Staffing Report reviewed monthly by the Service Chief. Potential indicators of unplanned visits were recorded, including age; sex; diagnosis of diabetes, depression, anxiety, or posttraumatic stress disorder (PTSD); current smoking status; and residential zip code. We used the first 3 digits of the patients’ zip codes, which indicate region, as an estimate of proximity to the MRVAMC, which has a 50-county catchment area across North Florida and South Georgia. Diagnoses were found on the “problem list” from the electronic health record documented in the history and physical examinations before surgery. Clinic notes were examined for 3 months postsurgery to identify unplanned postoperative visits and the reason for the appointment. A χ2 analysis was conducted using Excel Version 2402. P < .05 was used to determine whether age (> 60 years), sex, proximity to MRVAMC, diabetes, smoking, depression, anxiety, or PTSD were statistically significant independent risk factors for these appointments.
Results
A total of 1009 elective soft tissue hand surgeries at MRVAMC were reviewed. The patients median age was 61 years. Patients included 173 women (17.1%) and 836 men (82.9%). Eighty-one patients (8.0%) returned for unplanned visits. Age (P = .82); proximity to MRVAMC (P = .34); and diabetes (P = .60), smoking (P = .55), anxiety (P = .33), or PTSD (P = .37) were not statistically significant predictors of unplanned appointments. Depression diagnosis (P = .04) and female sex (P = .03) were found to be independent risk factors for an unplanned appointment (Table 1). The most common indication for the requested appointment was pain-related, followed closely by noninfectious wound concerns and persistent symptoms (Table 2).
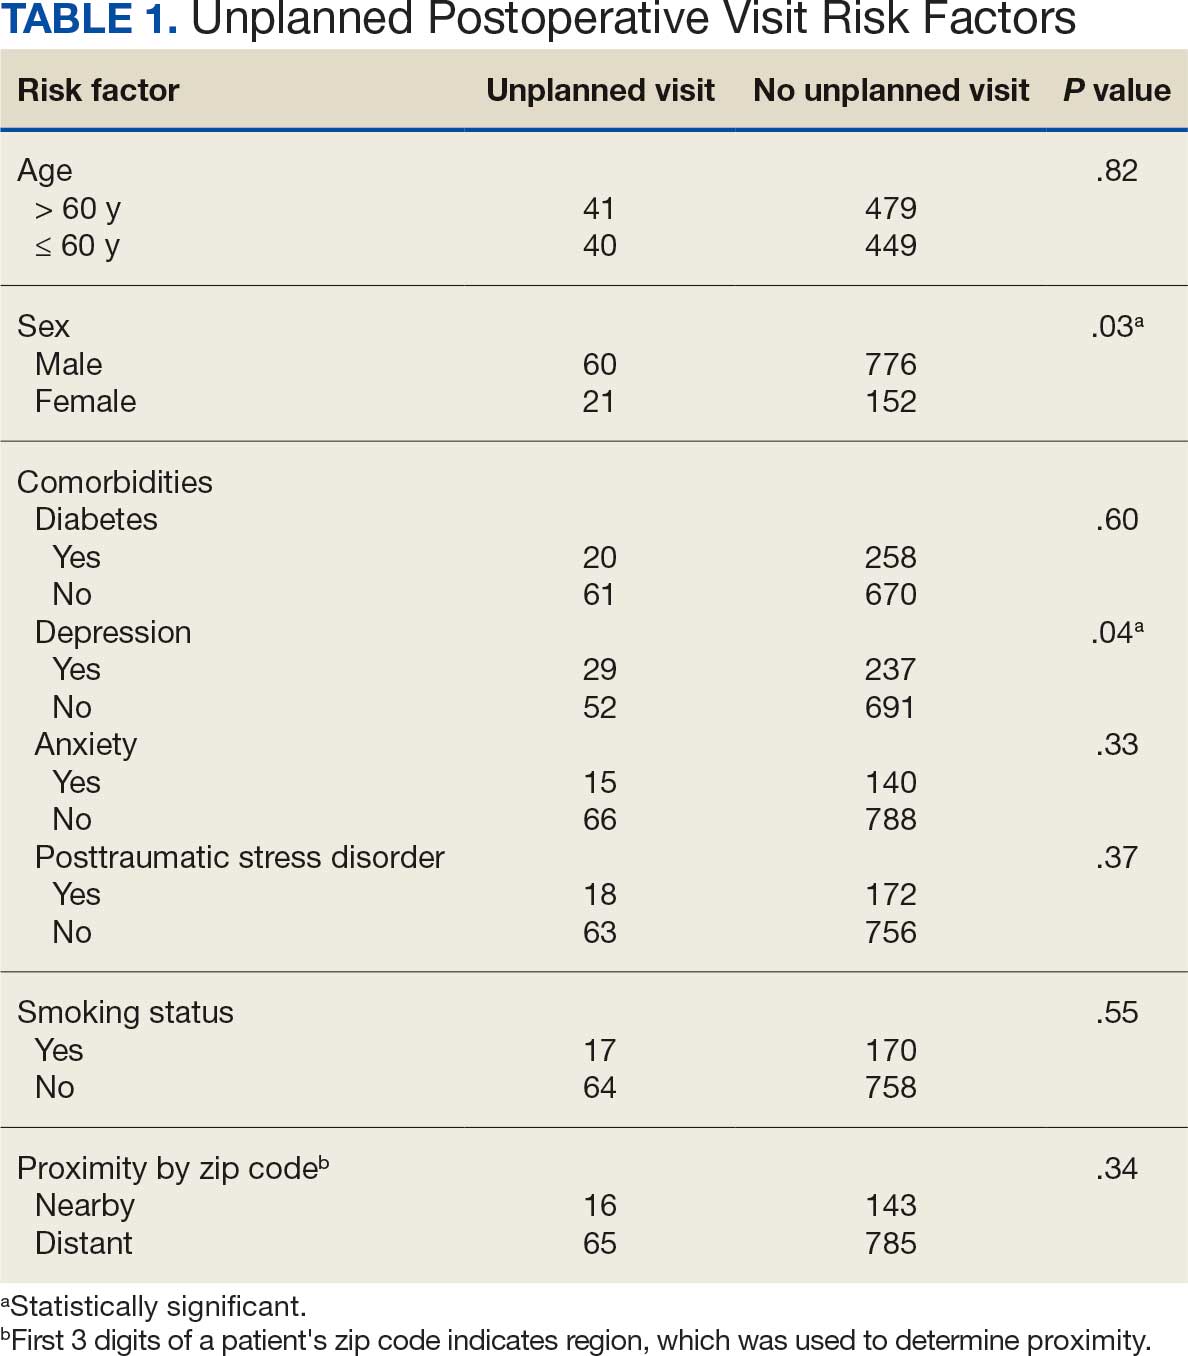
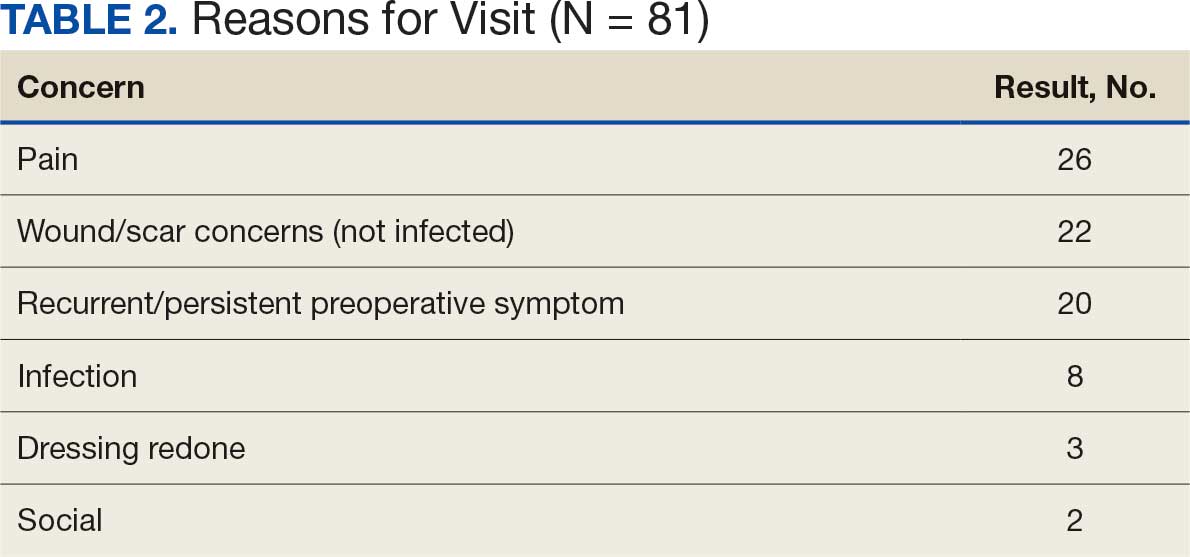
Discussion
Improved access, quality, and efficiency for patients are goals for the VA.1-3 The MRVAMC Plastic and Hand Surgery service provides care for the NFSGVAHS and receives an average of 15 to 20 consultation requests daily. The Veterans Health Administration is frequently challenged by staff shortages, and surgical services struggle to respond to consultation requests and treat patients within reasonable time frames.4,5
The objective of this study was to identify risk factors for unplanned postoperative appointments following elective hand surgery. Unplanned appointments prevent scheduled patients from being seen on time and contribute to backlogs and delays. When patients schedule multiple appointments on the same day, delays in the first clinic’s scheduled appointments create delays for the second and third clinics. Hand surgery clinics can provide a better experience for patients and staff by identifying and mitigating factors prompting unplanned visits.
We anticipated that wound complications would prompt unscheduled visits. Diabetes is a known risk factor for wound healing complications after plastic and hand surgery.6,7 A hemoglobin A1c (HbA1c) screening protocol used by the NFSGVAHS plastic surgery service since 2015 to identify poorly controlled patients with diabetes before surgery may partially explain this finding.8 We did not find a statistically significant difference between patients with diabetes and patients without diabetes for scheduling unplanned appointments. The plastic surgery service does not perform elective hand surgery unless the patient’s HbA1c level is < 9%, or violate the flexor sheath unless HbA1c level is < 8%. However, Zhuang et al found an increase in soft tissue infections after hand surgery with HbA1c levels ≥ 7%.9
Smoking is a potential factor in postoperative hand surgery complications.10,11 Lans et al found an increased incidence of 30-day emergency room visits in current and former smokers after outpatient upper extremity fracture surgery.12 The MRVAMC Plastic Surgery Service counsels patients about the risk of skin necrosis and delayed wound healing, but does not cancel cases or obtain laboratory values to verify abstinence in patients undergoing hand surgery. The VA has multiple resources available for patients interested in smoking cessation through mental health services.13
MRVAMC patients have been known to resist returning for scheduled appointments due to the costs or availability of transportation. We suspected that patients who lived further from MRVAMC would be less likely to return for unscheduled visits. We used the first 3 digits of the patients’ mailing zip code to estimate residential proximity to MRVAMC. An acknowledged limitation to this approach is that some veterans have primary addresses in other regions but still spend significant time in the MRVAMC catchment area and use the facility for their health care during the winter months. These “snowbirds” might reside near the facility despite having official addresses that are more distant. Additionally, there was no increased risk of unplanned visits after hand surgery in patients aged > 61 years (the median age of study participants) (P = .82). Dependence on a third party for transportation in older veterans could impact this finding.
Based on the observation that most patients needed reassurance rather than an intervention when they returned for unscheduled appointments, diagnoses of depression, anxiety, and PTSD were evaluated as separate predictive factors. In previous research, anxiety was found to be a risk factor for problematic recovery following carpal tunnel surgery.14 In the current study, depression was found to be a statistically significant predictor of unscheduled postoperative appointments (P = .04), while anxiety (P = .33) and PTSD (P = .37) were not statistically significant predictors. This is consistent with other studies that have found preexisting depression can predict complications after hand surgery.15,16 Vranceanu et al found that depression predicted pain intensity and disability after elective hand surgery.16 Similarly, Oflazoglu et al found a 12% incidence of depression based on the Patient Health Questionnaire-9 in new and returning hand patients who presented to an academic practice.17 They suggest patients should be assessed at all levels of care and that those with poor responses to surgical or nonsurgical management should be evaluated for depression. MRVAMC has a large mental health service consisting of psychiatrists, psychologists, addiction specialists, social workers, and homeless outreach, and patients tend to already have a diagnosis and mental health practitioner when they present to the clinic.
Recent studies found that wound problems, pain, and stiffness were the most common reasons for return visits.18,19 Shetty et al identified younger age, worse preoperative pain scores, and poor access to transportation as predictors of preventable emergency room visits, which generate higher health care expenditures than an office visit.19 Our study’s top reasons for appointments (pain, wound/scar concerns, persistent symptoms) can be addressed with additional presurgery patient and family education. Additionally, clinicians encourage nonnarcotic pain management strategies including anti-inflammatories, acetaminophen, elevation, splinting, and hand therapy, and the hospital employs experienced, fellowship-trained anesthesia block faculty who help limit perioperative narcotic use. Patients are advised that pain can be used to guide them through the postoperative recovery by preventing overuse and alerting them to a problem that would be masked with narcotics, and long-standing problems such as chronic nerve compressions may continue to cause pain after surgery.
Patients and families can be given consistent and repetitive verbal and written information, instructions, and expectations at the initial consultation, preoperative appointment, and on the day of surgery. Postoperatively, outside their scheduled appointments, patients are encouraged to use the My HealtheVet secure messaging system or call the clinic to access an experienced registered nurse before making a long drive. Access to virtual or phone visits can reduce emergent in-person visits in a VA population.20
Ozdag et al found that 42% of patients who had elective carpal tunnel surgery made unplanned electronic messages or phone contact within 2 weeks postsurgery. The authors point out the uncompensated administrative burden on the staff answering these messages and suggest pre-empting the contacts with more up-front education regarding postoperative pain expectations and management strategies.21
Fisher et al found that attending hand therapy reduced the number of emergency department visits in postoperative infection cases.22 At MRVAMC, a postoperative emergency department visit for a patient prompts an urgent unplanned appointment to the plastic surgery clinic, often on the same day. The MRVAMC occupational therapy clinic employed 3 on-site certified hand therapists during the study period. Because all hand surgery patients at the clinic receive hand therapy on the same day as their first postoperative appointment, attendance at hand therapy was not evaluated as a predictor of unplanned visits. Scheduled hand therapy is another point of contact where the clinic can provide reassurance and patient education.
While females made up 17.1% of the patients in this study, they constituted 12.5% of all veterans in Florida in fiscal year 2023.23 This study found that women were more likely to present for unplanned postoperative appointments (P = .03). This is consistent with existing literature which has found that women are higher users of health care and office-based appointments.24,25 This finding suggests the need for further study into whether our methods of communicating instructions to female patients undergoing plastic surgery may not be optimal.
Strengths and Limitations
As a retrospective review, the authors used information documented by multiple different health care practitioners, including trainees. The electronic medical record problem lists and templates provide consistency of information; however, less seasoned clinicians may interpret what they see and hear differently from more experienced clinicians in the postoperative setting. This study occurred in one part of the country with demographics that may not mirror other VA systems or the general population. The authors hope this study can be a starting point for other health care facilities to investigate ways to minimize the burden of unscheduled appointments. A strength of the study is that it was conducted within a closed system, as patients tend to stay within the VA system and documentation and communication among clinicians, even outside the immediate facility, are easily accessed through the electronic health record.
Conclusions
This study found that depression diagnosis and female sex are statistically significant predictors of unplanned postoperative visits after elective soft tissue hand surgery. More effective patient education during the preoperative period, particularly in patients with depression, may be warranted.
- Apaydin EA, Paige NM, Begashaw MM, et al. Veterans Health Administration (VA) vs. non-VA healthcare quality: a systematic review. J Gen Intern Med. 2023;38:2179-2188. doi:10.1007/s11606-023-08207-2
- Blegen M, Ko J, Salzman G, et al. Comparing quality of surgical care between the US Department of Veterans Affairs and non-Veterans Affairs settings: a systematic review. J Am Coll Surg. 2023;237:352-361. doi:10.1097/XCS.0000000000000720
- Valsangkar NP, Eppstein AC, Lawson RA, et al. Effect of lean processes on surgical wait times and efficiency in a tertiary care veterans affairs medical center. JAMA Surg. 2017;152:42-47. doi:10.1001/jamasurg.2016.2808
- National Association of Veterans Affairs Physicians and Dentists. Physicians remain at top of staffing shortage in VA. NAVAPD. December 20, 2023. Accessed March 16, 2026. https://www.navapd.org/news/physicians-remain-at-top-of-staffing-shortage-in-va
- OIG Determination of Veterans Health Administration’s severe occupational staffing shortages fiscal year 2024. Veterans Affairs Office of Inspector General. August 7, 2024. Accessed February 4, 2026. https://www.vaoig.gov/reports/national-healthcare-review/oig-determination-veterans-health-administrations-severe-0
- Goltsman D, Morrison KA, Ascherman JA. Defining the association between diabetes and plastic surgery outcomes: an analysis of nearly 40,000 patients. Plast Reconstr Surg Glob Open. 2017;5:e1461. doi:10.1097/GOX.0000000000001461 7.
- Cox CT, Sierra S, Egan A, et al. Elevated hemoglobin A1c and the risk of postoperative complications in elective hand and upper extremity surgery. Cureus. 2023;15:e48373. doi:10.7759/cureus.48373
- Coady-Fariborzian L, Anstead C. HbA1c and infection in diabetic elective hand surgery: a Veterans Affair Medical Center experience 2012-2018. Hand (NY). 2023;18:994-998. doi:10.1177/1558944720937363<
- Zhuang T, Shapiro LM, Fogel N, et al. Perioperative laboratory markers as risk factors for surgical site infection after elective hand surgery. J Hand Surg Am. 2021;46:675-684. doi:10.1016/j.jhsa.2021.04.001
- Cho BH, Aziz KT, Giladi AM. The impact of smoking on early postoperative complications in hand surgery. J Hand Surg Am. 2021;46:336.e1-336.e11. doi:10.1016/j.jhsa.2020.07.01411.
- Del Core MA, Ahn J, Golden AS, et al. Effect of smoking on short-term postoperative complications after elective upper extremity surgery. Hand (N Y). 2022;17:231-238. doi:10.1177/1558944720926638
- Lans J, Beagles CB, Watkins IT, et al. Unplanned postoperative emergency department visits after upper extremity fracture surgery. J Orthop Trauma. 2025;39:22-27. doi:10.1097/BOT.0000000000002925
- Tobacco and health - how to quit. US Dept of Veterans Affairs. Updated October 29, 2025. Accessed February 4, 2026. https://www.mentalhealth.va.gov/quit-tobacco/how-to-quit.asp
- Ryan C, Miner H, Ramachandran S, et al. General anxiety is associated with problematic initial recovery after carpal tunnel release. Clin Orthop Relat Res. 2022;480:1576-1581. doi:10.1097/CORR.0000000000002115
- Crijns TJ, Bernstein DN, Ring D, et al. Depression and pain interference correlate with physical function in patients recovering from hand surgery. Hand (N Y). 2019;14:830-835. doi:10.1177/1558944718777814
- Vranceanu AM, Jupiter JB, Mudgal CS, et al. Predictors of pain intensity and disability after minor hand surgery. J Hand Surg Am. 2010;35:956-960. doi:10.1016/j.jhsa.2010.02.00117.
- Oflazoglu K, Mellema JJ, Menendez ME, et al. Prevalence of and factors associated with major depression in patients with upper extremity conditions. J Hand Surg Am. 2016;41:263-269. doi:10.1016/j.jhsa.2015.11.019
- Townsend CB, Henry TW, Lutsky KF, et al. Unplanned office visits following outpatient hand surgery. Hand (N Y). 2022;17:1264-1268. doi:10.1177/15589447211028932
- Shetty PN, Guarino GM, Zhang G, et al. Risk factors for preventable emergency department use after outpatient hand surgery. J Hand Surg Am. 2022;47:855-864. doi:10.1016/j.jhsa.2022.05.012
- Sommers-Olson B, Christianson J, Neumann T, et al. Reducing nonemergent visits to the emergency department in a Veterans Affairs multistate system. J Emerg Nurs. 2023;49:539-545. doi:10.1016/j.jen.2023.02.010
- Ozdag Y, Manzar S, El Koussaify J, et al. Unplanned postoperative phone calls and electronic messages for patients with and without opioid prescriptions after carpal tunnel release. J Hand Surg Glob Online. 2024;6:363-368. doi:10.1016/j.jhsg.2024.02.006
- Fisher AH, Gandhi J, Nelson Z, et al. Immediate interventions after surgery to reduce readmission for upper extremity infections. Ann Plast Surg. 2022;88:S163-S169. doi:10.1097/SAP.0000000000003141
- Florida Department of Veterans Affairs Fast Facts. Florida Department of Veterans Affairs. Accessed February 4, 2026. https://floridavets.org/our-veterans/profilefast-facts/
- Bertakis KD, Azari R, Helms LJ, et al. Gender differences in the utilization of health care services. J Fam Pract. 2000;49:147-152.
- Ashman JJ, Santo L, Okeyode T. Characteristics of office-based physician visits, 2018. NCHS Data Brief. 2021;408:1-8.
Patients make unplanned appointments after elective soft tissue hand surgery for real or perceived complications when they experience pain, anxiety, or fear. Unplanned appointments can create travel and financial burdens for patients and families. These appointments take time away from scheduled appointments and can contribute to late arrivals and delays in other clinics. Unscheduled appointments contribute to poor access when staff are diverted from scheduled appointments. If predictive factors can be identified, unplanned appointments may either be ameliorated or avoided with better perioperative risk management or education.
Methods
The US Department of Veterans Affairs (VA) North Florida/South Georgia Veterans Health System (NFSGVAHS) and University of Florida Institutional Review Board approved a retrospective chart review of all plastic surgery cases performed at the Malcom Randall VA Medical Center (MRVAMC) and Lake City VAMC operating rooms from July 1, 2018, through December 31, 2019, and January 1, 2021, through June 30, 2022 (nonurgent surgeries were discouraged during the COVID-19 pandemic). Elective soft tissue hand surgery cases were identified based on the operative description found in the Surgical Service Surgeon Staffing Report reviewed monthly by the Service Chief. Potential indicators of unplanned visits were recorded, including age; sex; diagnosis of diabetes, depression, anxiety, or posttraumatic stress disorder (PTSD); current smoking status; and residential zip code. We used the first 3 digits of the patients’ zip codes, which indicate region, as an estimate of proximity to the MRVAMC, which has a 50-county catchment area across North Florida and South Georgia. Diagnoses were found on the “problem list” from the electronic health record documented in the history and physical examinations before surgery. Clinic notes were examined for 3 months postsurgery to identify unplanned postoperative visits and the reason for the appointment. A χ2 analysis was conducted using Excel Version 2402. P < .05 was used to determine whether age (> 60 years), sex, proximity to MRVAMC, diabetes, smoking, depression, anxiety, or PTSD were statistically significant independent risk factors for these appointments.
Results
A total of 1009 elective soft tissue hand surgeries at MRVAMC were reviewed. The patients median age was 61 years. Patients included 173 women (17.1%) and 836 men (82.9%). Eighty-one patients (8.0%) returned for unplanned visits. Age (P = .82); proximity to MRVAMC (P = .34); and diabetes (P = .60), smoking (P = .55), anxiety (P = .33), or PTSD (P = .37) were not statistically significant predictors of unplanned appointments. Depression diagnosis (P = .04) and female sex (P = .03) were found to be independent risk factors for an unplanned appointment (Table 1). The most common indication for the requested appointment was pain-related, followed closely by noninfectious wound concerns and persistent symptoms (Table 2).
Discussion
Improved access, quality, and efficiency for patients are goals for the VA.1-3 The MRVAMC Plastic and Hand Surgery service provides care for the NFSGVAHS and receives an average of 15 to 20 consultation requests daily. The Veterans Health Administration is frequently challenged by staff shortages, and surgical services struggle to respond to consultation requests and treat patients within reasonable time frames.4,5
The objective of this study was to identify risk factors for unplanned postoperative appointments following elective hand surgery. Unplanned appointments prevent scheduled patients from being seen on time and contribute to backlogs and delays. When patients schedule multiple appointments on the same day, delays in the first clinic’s scheduled appointments create delays for the second and third clinics. Hand surgery clinics can provide a better experience for patients and staff by identifying and mitigating factors prompting unplanned visits.
We anticipated that wound complications would prompt unscheduled visits. Diabetes is a known risk factor for wound healing complications after plastic and hand surgery.6,7 A hemoglobin A1c (HbA1c) screening protocol used by the NFSGVAHS plastic surgery service since 2015 to identify poorly controlled patients with diabetes before surgery may partially explain this finding.8 We did not find a statistically significant difference between patients with diabetes and patients without diabetes for scheduling unplanned appointments. The plastic surgery service does not perform elective hand surgery unless the patient’s HbA1c level is < 9%, or violate the flexor sheath unless HbA1c level is < 8%. However, Zhuang et al found an increase in soft tissue infections after hand surgery with HbA1c levels ≥ 7%.9
Smoking is a potential factor in postoperative hand surgery complications.10,11 Lans et al found an increased incidence of 30-day emergency room visits in current and former smokers after outpatient upper extremity fracture surgery.12 The MRVAMC Plastic Surgery Service counsels patients about the risk of skin necrosis and delayed wound healing, but does not cancel cases or obtain laboratory values to verify abstinence in patients undergoing hand surgery. The VA has multiple resources available for patients interested in smoking cessation through mental health services.13
MRVAMC patients have been known to resist returning for scheduled appointments due to the costs or availability of transportation. We suspected that patients who lived further from MRVAMC would be less likely to return for unscheduled visits. We used the first 3 digits of the patients’ mailing zip code to estimate residential proximity to MRVAMC. An acknowledged limitation to this approach is that some veterans have primary addresses in other regions but still spend significant time in the MRVAMC catchment area and use the facility for their health care during the winter months. These “snowbirds” might reside near the facility despite having official addresses that are more distant. Additionally, there was no increased risk of unplanned visits after hand surgery in patients aged > 61 years (the median age of study participants) (P = .82). Dependence on a third party for transportation in older veterans could impact this finding.
Based on the observation that most patients needed reassurance rather than an intervention when they returned for unscheduled appointments, diagnoses of depression, anxiety, and PTSD were evaluated as separate predictive factors. In previous research, anxiety was found to be a risk factor for problematic recovery following carpal tunnel surgery.14 In the current study, depression was found to be a statistically significant predictor of unscheduled postoperative appointments (P = .04), while anxiety (P = .33) and PTSD (P = .37) were not statistically significant predictors. This is consistent with other studies that have found preexisting depression can predict complications after hand surgery.15,16 Vranceanu et al found that depression predicted pain intensity and disability after elective hand surgery.16 Similarly, Oflazoglu et al found a 12% incidence of depression based on the Patient Health Questionnaire-9 in new and returning hand patients who presented to an academic practice.17 They suggest patients should be assessed at all levels of care and that those with poor responses to surgical or nonsurgical management should be evaluated for depression. MRVAMC has a large mental health service consisting of psychiatrists, psychologists, addiction specialists, social workers, and homeless outreach, and patients tend to already have a diagnosis and mental health practitioner when they present to the clinic.
Recent studies found that wound problems, pain, and stiffness were the most common reasons for return visits.18,19 Shetty et al identified younger age, worse preoperative pain scores, and poor access to transportation as predictors of preventable emergency room visits, which generate higher health care expenditures than an office visit.19 Our study’s top reasons for appointments (pain, wound/scar concerns, persistent symptoms) can be addressed with additional presurgery patient and family education. Additionally, clinicians encourage nonnarcotic pain management strategies including anti-inflammatories, acetaminophen, elevation, splinting, and hand therapy, and the hospital employs experienced, fellowship-trained anesthesia block faculty who help limit perioperative narcotic use. Patients are advised that pain can be used to guide them through the postoperative recovery by preventing overuse and alerting them to a problem that would be masked with narcotics, and long-standing problems such as chronic nerve compressions may continue to cause pain after surgery.
Patients and families can be given consistent and repetitive verbal and written information, instructions, and expectations at the initial consultation, preoperative appointment, and on the day of surgery. Postoperatively, outside their scheduled appointments, patients are encouraged to use the My HealtheVet secure messaging system or call the clinic to access an experienced registered nurse before making a long drive. Access to virtual or phone visits can reduce emergent in-person visits in a VA population.20
Ozdag et al found that 42% of patients who had elective carpal tunnel surgery made unplanned electronic messages or phone contact within 2 weeks postsurgery. The authors point out the uncompensated administrative burden on the staff answering these messages and suggest pre-empting the contacts with more up-front education regarding postoperative pain expectations and management strategies.21
Fisher et al found that attending hand therapy reduced the number of emergency department visits in postoperative infection cases.22 At MRVAMC, a postoperative emergency department visit for a patient prompts an urgent unplanned appointment to the plastic surgery clinic, often on the same day. The MRVAMC occupational therapy clinic employed 3 on-site certified hand therapists during the study period. Because all hand surgery patients at the clinic receive hand therapy on the same day as their first postoperative appointment, attendance at hand therapy was not evaluated as a predictor of unplanned visits. Scheduled hand therapy is another point of contact where the clinic can provide reassurance and patient education.
While females made up 17.1% of the patients in this study, they constituted 12.5% of all veterans in Florida in fiscal year 2023.23 This study found that women were more likely to present for unplanned postoperative appointments (P = .03). This is consistent with existing literature which has found that women are higher users of health care and office-based appointments.24,25 This finding suggests the need for further study into whether our methods of communicating instructions to female patients undergoing plastic surgery may not be optimal.
Strengths and Limitations
As a retrospective review, the authors used information documented by multiple different health care practitioners, including trainees. The electronic medical record problem lists and templates provide consistency of information; however, less seasoned clinicians may interpret what they see and hear differently from more experienced clinicians in the postoperative setting. This study occurred in one part of the country with demographics that may not mirror other VA systems or the general population. The authors hope this study can be a starting point for other health care facilities to investigate ways to minimize the burden of unscheduled appointments. A strength of the study is that it was conducted within a closed system, as patients tend to stay within the VA system and documentation and communication among clinicians, even outside the immediate facility, are easily accessed through the electronic health record.
Conclusions
This study found that depression diagnosis and female sex are statistically significant predictors of unplanned postoperative visits after elective soft tissue hand surgery. More effective patient education during the preoperative period, particularly in patients with depression, may be warranted.
- Apaydin EA, Paige NM, Begashaw MM, et al. Veterans Health Administration (VA) vs. non-VA healthcare quality: a systematic review. J Gen Intern Med. 2023;38:2179-2188. doi:10.1007/s11606-023-08207-2
- Blegen M, Ko J, Salzman G, et al. Comparing quality of surgical care between the US Department of Veterans Affairs and non-Veterans Affairs settings: a systematic review. J Am Coll Surg. 2023;237:352-361. doi:10.1097/XCS.0000000000000720
- Valsangkar NP, Eppstein AC, Lawson RA, et al. Effect of lean processes on surgical wait times and efficiency in a tertiary care veterans affairs medical center. JAMA Surg. 2017;152:42-47. doi:10.1001/jamasurg.2016.2808
- National Association of Veterans Affairs Physicians and Dentists. Physicians remain at top of staffing shortage in VA. NAVAPD. December 20, 2023. Accessed March 16, 2026. https://www.navapd.org/news/physicians-remain-at-top-of-staffing-shortage-in-va
- OIG Determination of Veterans Health Administration’s severe occupational staffing shortages fiscal year 2024. Veterans Affairs Office of Inspector General. August 7, 2024. Accessed February 4, 2026. https://www.vaoig.gov/reports/national-healthcare-review/oig-determination-veterans-health-administrations-severe-0
- Goltsman D, Morrison KA, Ascherman JA. Defining the association between diabetes and plastic surgery outcomes: an analysis of nearly 40,000 patients. Plast Reconstr Surg Glob Open. 2017;5:e1461. doi:10.1097/GOX.0000000000001461 7.
- Cox CT, Sierra S, Egan A, et al. Elevated hemoglobin A1c and the risk of postoperative complications in elective hand and upper extremity surgery. Cureus. 2023;15:e48373. doi:10.7759/cureus.48373
- Coady-Fariborzian L, Anstead C. HbA1c and infection in diabetic elective hand surgery: a Veterans Affair Medical Center experience 2012-2018. Hand (NY). 2023;18:994-998. doi:10.1177/1558944720937363<
- Zhuang T, Shapiro LM, Fogel N, et al. Perioperative laboratory markers as risk factors for surgical site infection after elective hand surgery. J Hand Surg Am. 2021;46:675-684. doi:10.1016/j.jhsa.2021.04.001
- Cho BH, Aziz KT, Giladi AM. The impact of smoking on early postoperative complications in hand surgery. J Hand Surg Am. 2021;46:336.e1-336.e11. doi:10.1016/j.jhsa.2020.07.01411.
- Del Core MA, Ahn J, Golden AS, et al. Effect of smoking on short-term postoperative complications after elective upper extremity surgery. Hand (N Y). 2022;17:231-238. doi:10.1177/1558944720926638
- Lans J, Beagles CB, Watkins IT, et al. Unplanned postoperative emergency department visits after upper extremity fracture surgery. J Orthop Trauma. 2025;39:22-27. doi:10.1097/BOT.0000000000002925
- Tobacco and health - how to quit. US Dept of Veterans Affairs. Updated October 29, 2025. Accessed February 4, 2026. https://www.mentalhealth.va.gov/quit-tobacco/how-to-quit.asp
- Ryan C, Miner H, Ramachandran S, et al. General anxiety is associated with problematic initial recovery after carpal tunnel release. Clin Orthop Relat Res. 2022;480:1576-1581. doi:10.1097/CORR.0000000000002115
- Crijns TJ, Bernstein DN, Ring D, et al. Depression and pain interference correlate with physical function in patients recovering from hand surgery. Hand (N Y). 2019;14:830-835. doi:10.1177/1558944718777814
- Vranceanu AM, Jupiter JB, Mudgal CS, et al. Predictors of pain intensity and disability after minor hand surgery. J Hand Surg Am. 2010;35:956-960. doi:10.1016/j.jhsa.2010.02.00117.
- Oflazoglu K, Mellema JJ, Menendez ME, et al. Prevalence of and factors associated with major depression in patients with upper extremity conditions. J Hand Surg Am. 2016;41:263-269. doi:10.1016/j.jhsa.2015.11.019
- Townsend CB, Henry TW, Lutsky KF, et al. Unplanned office visits following outpatient hand surgery. Hand (N Y). 2022;17:1264-1268. doi:10.1177/15589447211028932
- Shetty PN, Guarino GM, Zhang G, et al. Risk factors for preventable emergency department use after outpatient hand surgery. J Hand Surg Am. 2022;47:855-864. doi:10.1016/j.jhsa.2022.05.012
- Sommers-Olson B, Christianson J, Neumann T, et al. Reducing nonemergent visits to the emergency department in a Veterans Affairs multistate system. J Emerg Nurs. 2023;49:539-545. doi:10.1016/j.jen.2023.02.010
- Ozdag Y, Manzar S, El Koussaify J, et al. Unplanned postoperative phone calls and electronic messages for patients with and without opioid prescriptions after carpal tunnel release. J Hand Surg Glob Online. 2024;6:363-368. doi:10.1016/j.jhsg.2024.02.006
- Fisher AH, Gandhi J, Nelson Z, et al. Immediate interventions after surgery to reduce readmission for upper extremity infections. Ann Plast Surg. 2022;88:S163-S169. doi:10.1097/SAP.0000000000003141
- Florida Department of Veterans Affairs Fast Facts. Florida Department of Veterans Affairs. Accessed February 4, 2026. https://floridavets.org/our-veterans/profilefast-facts/
- Bertakis KD, Azari R, Helms LJ, et al. Gender differences in the utilization of health care services. J Fam Pract. 2000;49:147-152.
- Ashman JJ, Santo L, Okeyode T. Characteristics of office-based physician visits, 2018. NCHS Data Brief. 2021;408:1-8.
Predictors of Unplanned Postoperative Visits in a Veterans Affairs Hand Surgery Practice
Predictors of Unplanned Postoperative Visits in a Veterans Affairs Hand Surgery Practice

Hidradenitis Suppurativa Associated With Elevated Risks for Multiple Cancer Types
Hidradenitis Suppurativa Associated With Elevated Risks for Multiple Cancer Types
TOPLINE:
In a meta-analysis, patients with hidradenitis suppurativa (HS) faced a more than 80% higher risk for cancer overall than the general population, with particularly elevated risks for gastrointestinal, head and neck, hematologic, and respiratory system cancers.
METHODOLOGY:
- Researchers conducted a meta-analysis including 11 studies from PubMed, Embase, and Web of Science databases published between 2001 and 2024; these studies examined the risk for cancer in patients with HS compared with that in the general population.
- These studies included 624,721 patients diagnosed with HS (mean age, 33.6-43.8 years) and 393,691,636 control individuals from the general population.
- Researchers performed an inverse variance-weighted random-effects analysis to calculate pooled odds ratios (ORs) for cancer overall and specific cancer subtypes.
- Cancer types were categorized into 11 groups for subgroup analysis: bone and soft tissue cancers, breast cancer, central nervous system cancers, endocrine-related cancers, gastrointestinal cancers, head and neck cancers, hematologic cancers, respiratory system cancers, skin cancers, urogenital cancers, and unspecified cancers.
TAKEAWAY:
- Patients with HS demonstrated a significantly higher risk for cancer overall than control individuals (crude OR, 1.82; P = .018).
- Patients with HS showed an increased risk for gastrointestinal cancers (crude OR, 1.61; P = .0002), head and neck cancers (crude OR, 2.41; P = .00001), hematologic cancers (crude OR, 1.71; P = .00005), and respiratory system cancers (crude OR, 1.81; P = .04).
- Patients with HS demonstrated significantly elevated risks for both Hodgkin lymphoma (OR, 2.44; P = .0001) and non-Hodgkin lymphoma (OR, 1.15; P = .012).
- A non-significant increased risk for skin cancer was observed in patients with HS (crude OR, 1.48; P = .08). No increased risks for bone and soft tissue cancers, central nervous system cancers, breast cancer, or urogenital cancers were observed in patients with HS.
IN PRACTICE:
"HS was associated with an increased overall risk of cancer, including several specific subtypes, compared with controls," the authors wrote, suggesting that "studies are adjusting for confounders and assess long-term associations between HS and cancer risk are highly needed to investigate which factors contribute to this cancer risk."
SOURCE:
This study was led by Daniel Isufi, Department of Dermatology and Allergy, Copenhagen University Hospital-Herlev and Gentofte Hospital, University of Copenhagen, Copenhagen, Denmark. It was published online on March 11, 2026, in Dermatology and Therapy.
LIMITATIONS:
Limited data on cancer subtypes hindered meta-analyses of rare cancers, and the lack of reporting on anti‑inflammatory treatment and disease severity prevented subgroup analyses. Most studies originated from North America, introducing potential geographic bias. No study reported BMI, and ethnicity was poorly documented. Only few studies adjusted for key confounders (smoking, obesity, and alcohol intake), limiting the determination of whether the increased risk for cancer was due to HS itself or shared lifestyle and metabolic factors.
DISCLOSURES:
This study did not receive any funding or sponsorship. Two authors reported receiving research grant funding from the LEO Foundation and having other ties with various other sources.
This article was created using several editorial tools, including AI, as part of the process. Human editors reviewed this content before publication.
A version of this article first appeared on Medscape.com.
Hidradenitis Suppurativa Associated With Elevated Risks for Multiple Cancer Types
Hidradenitis Suppurativa Associated With Elevated Risks for Multiple Cancer Types