User login
FDA still concerned about biotin affecting troponin tests
The

However, not all troponin tests are affected, according to the update. “Since the FDA’s safety communication on this topic in 2017, some lab test developers have been successful at mitigating the biotin interference of their assays, but others have not yet addressed it,” according to the new communication, issued in early November.
Also known as vitamin B7 and appearing in many dietary supplements, including prenatal multivitamins and supplements for hair, skin, and nail growth, biotin can lead to falsely low results on some troponin tests, especially at high levels. The worry is that biotin interference could therefore lead to missed diagnoses. The FDA has provided a list of those tests that have not taken biotin’s effects into account, titled “Biotin Interference with Troponin Lab Tests – Assays Subject to Biotin Interference.”
The daily recommended allowance for biotin, according to the communication, is about 0.3 mg, but it isn’t always clear how much is actually included in supplements – some can contain 20 mg or even as much as 100 mg per pill of biotin. The communication includes recommendations for patients, health care professionals, laboratory personnel, and lab test manufacturers and developers.
The full safety communication can be found on the FDA website, and problems with tests can be reported via the FDA’s MedWatch Voluntary Reporting Form.
The
However, not all troponin tests are affected, according to the update. “Since the FDA’s safety communication on this topic in 2017, some lab test developers have been successful at mitigating the biotin interference of their assays, but others have not yet addressed it,” according to the new communication, issued in early November.
Also known as vitamin B7 and appearing in many dietary supplements, including prenatal multivitamins and supplements for hair, skin, and nail growth, biotin can lead to falsely low results on some troponin tests, especially at high levels. The worry is that biotin interference could therefore lead to missed diagnoses. The FDA has provided a list of those tests that have not taken biotin’s effects into account, titled “Biotin Interference with Troponin Lab Tests – Assays Subject to Biotin Interference.”
The daily recommended allowance for biotin, according to the communication, is about 0.3 mg, but it isn’t always clear how much is actually included in supplements – some can contain 20 mg or even as much as 100 mg per pill of biotin. The communication includes recommendations for patients, health care professionals, laboratory personnel, and lab test manufacturers and developers.
The full safety communication can be found on the FDA website, and problems with tests can be reported via the FDA’s MedWatch Voluntary Reporting Form.
EHR treat-to-target prompts spur RA medication management decisions
ATLANTA – Opportunities to escalate or deescalate medications for patients with rheumatoid arthritis via an electronic health record at the point of care led rheumatologists at the Geisinger Medical Center in Danville, Pa., to increase the number of such decisions in their practice.
“Opportunities for escalation and de-escalation of therapy are common, even in a well-managed RA population,” Eric D. Newman, MD, director of the department of rheumatology at Geisinger, said in a presentation at the annual meeting of the American College of Rheumatology. “In our hands, over a third of the time, there was an opportunity to change therapy.”
Dr. Newman and colleagues developed a new treat-to-target tab for their (Patient Centric Electronic Redesign) PACER project, an EHR-adjacent system that captures patient and provider data and presents the information in different views, based on desired action items. The target in the study was low disease activity or remission, which was assessed using Clinical Disease Activity Index (CDAI) scores.
The treat-to-target tab offered three options to rheumatologists in real time when meeting with a patient: an escalation opportunity, which was defined as the patient’s two most recent CDAI scores showing moderate to high disease activity; and a deescalation opportunity, defined as a look-back up to 1 year during which at least two CDAI measures were within low to-moderate disease range. There was also a third “leave-alone” option to neither escalate nor deescalate therapy, but the rheumatologist was prompted to explain why if that option is selected, Dr. Newman noted.
In the first phase of releasing the treat-to-target tab, there was low adoption among the 17 rheumatologists at Geisinger: 82% of rheumatologists did not use the tab for escalation therapy, and 64% did not use the tab for deescalation therapy.
That prompted Dr. Newman and colleagues to develop a new version of the treat-to-target tab for phase 2 of the program. “Once they complete their CDAI, if there’s an opportunity, there would be a bright orange button that would glow right in front of them,” Dr. Newman said. “It was really hard to miss, and all they would have to do is click it and it would bring them right to the treat-to-target tab.”
To increase rheumatologists’ use of the new treat-to-target tab, the amount of time spent using the tab and making decisions is presented to them, he said. “It’s actually now part of our quality measure bundle, so every month, they get a leaderboard to see how they compare with their partners,” he noted. “It’s a great way to drive down variability and get everybody approaching the same sort of mean.”
Overall, between July 2018 and May 2019, there were 1,428 treat-to-target opportunities, consisting of 34.2% of RA office visits. Of these, 11.3% were escalation opportunities and 22.9% were deescalation opportunities, Dr. Newman said.
Between phase 1 and phase 2, the rheumatologists’ nonuse of the treat-to-target tab decreased from 82% to 36% for escalation opportunities, and decisions to escalate therapy increased from 10% to 46%. Similarly, nonuse of the treat-to-target tab for deescalation therapy decreased from 64% to 34%, and decisions to deescalate therapy increased from 5% to 17%.
In 49% of escalation opportunities and 80% of deescalation opportunities in phase 2 of the program, rheumatologists made the decision to leave the patient alone. The reasons for not escalating therapy for a patient included an inaccurate CDAI (34%), patient decision (15%), risks outweighing the benefits (15%), and other (37%). “This is interesting, because if you take 49% times 34%, that means that only 17% of the time they felt it didn’t represent what was going on in our department, which is not what we heard from them verbally before this project,” he said. For deescalation opportunities in which the rheumatologist left the patient alone, the most common reasons were hard-to-control disease (46%), patient preference (29%), and poor prognostic factors (25%).
“Keep in mind, some of these patients may have actually already been deescalated prior to this,” Dr. Newman noted. “We’ve actually done some previous work 3 years ago – we provided a visual signal to our physicians that there was a deescalation opportunity, so we may have already accounted for that portion of the population to some extent.”
Dr. Newman said a future goal of the treat-to-target system is to developed more specific treat-to-target strategies to improve the “signal-to-noise” ratio in the system. “Now [that] it’s fully embedded into our routine RA care delivery across our system, our next steps are going to be to use this tool to proactively drive value-concordant decision making and monitor the effect this has on both disease control as well as cost of care,” he said.
Dr. Newman reported no relevant financial disclosures.
SOURCE: Newman ED et al. Arthritis Rheumatol. 2019;71(suppl 10). Abstract 1862.
REPORTING FROM ACR 2019
Cilofexor passes phase 2 for primary biliary cholangitis
BOSTON – Cilofexor, a nonsteroidal farnesoid X receptor (FXR) agonist, can improve disease biomarkers in patients with primary biliary cholangitis (PBC), based on results of a phase 2 trial.
Compared with placebo, patients treated with cilofexor had significant reductions in serum alkaline phosphatase (ALP), gamma-glutamyltransferase (GGT), C-reactive protein (CRP), and primary bile acids, reported lead author Kris V. Kowdley, MD, of Swedish Medical Center in Seattle, and colleagues.
Dr. Kowdley, who presented findings at the annual meeting of the American Association for the Study of Liver Diseases, began by offering some context for the trial.
“There’s a strong rationale for FXR agonist therapy in PBC,” he said. “FXR is the key regulator of bile acid homeostasis, and FXR agonists have shown favorable effects on fibrosis, inflammatory activity, bile acid export and synthesis, as well as possibly effects on the microbiome and downstream in the gut.” He went on to explain that cilofexor may benefit patients with PBC, primary sclerosing cholangitis, or nonalcoholic steatohepatitis (NASH), noting preclinical data that have demonstrated reductions in bile acids, inflammation, fibrosis, and portal pressure.
The present trial involved 71 patients with PBC who lacked cirrhosis and had a serum ALP level that was at least 1.67 times greater than the upper limit of normal, and an elevated serum total bilirubin that was less than 2 times the upper limit of normal. Patients were randomized to receive either cilofexor 30 mg, cilofexor 100 mg, or placebo, once daily for 12 weeks. Stratification was based on use of ursodeoxycholic acid, which was stable for at least the preceding year. Safety and efficacy were evaluated, with the latter based on liver biochemistry, serum C4, bile acids, and serum fibrosis markers.
Across the entire population, baseline median serum bilirubin was 0.6 mg/dL and median serum ALP was 286 U/L. After 12 weeks, compared with placebo, patients treated with cilofexor, particularly those who received the 100-mg dose, showed significant improvements across multiple measures of liver health. Specifically, patients in the 100-mg group achieved median reductions in ALP (–13.8%; P = .005), GGT (–47.7%; P less than .001), CRP (–33.6%; P = .03), and primary bile acids (–30.5%; P = .008). These patients also exhibited trends toward reduced aspartate aminotransferase and aminoterminal propeptide of type III procollagen; Dr. Kowdley attributed the lack of statistical significance to insufficient population size.
Highlighting magnitude of ALP improvement, Dr. Kowdley noted that reductions in ALP greater than 25% were observed in 17% and 18% of patients in the 100-mg and 30-mg cilofexor groups, respectively, versus 0% of patients in the placebo group.
Although the 100-mg dose of cilofexor appeared more effective, the higher dose did come with some trade-offs in tolerability; grade 2 or 3 pruritus was more common in patients treated with the higher dose than in those who received the 30-mg dose (39% vs. 10%). As such, 7% of patients in the 100-mg group discontinued therapy because of the pruritus, compared with no patients in the 30-mg or placebo group.
Responding to a question from a conference attendee, Dr. Kowdley said that ALP reductions to below the 1.67-fold threshold were achieved by 9% and 14% of patients who received the 30-mg dose and 100-mg dose of cilofexor, respectively.
“We believe these data support further evaluation of cilofexor for the treatment of cholestatic liver disorders,” Dr. Kowdley concluded.
The study was funded by Gilead. The investigators disclosed additional relationships with Allergan, Novartis, GlaxoSmithKline, and others.
SOURCE: Kowdley KV et al. The Liver Meeting 2019. Abstract 45.
REPORTING FROM THE LIVER MEETING 2019
Machine-learning model predicts NASH based on common clinical and lab values
BOSTON – A machine-learning model based on standard clinical and laboratory values is able to predict nonalcoholic steatohepatitis (NASH) with a sensitivity of 72%-81%, an investigator reported at the annual meeting of the American Association for the Study of Liver Diseases.

The tool, dubbed NASHmap, could serve as an initial screening tool to reveal more potential undiagnosed patients with NASH, according to Jörn M. Schattenberg, MD, with the metabolic liver research program in the department of medicine at University Medical Centre Mainz (Germany).
While not intended to replace current scoring systems, NASHmap potentially could be applied as a clinical decision support tool within electronic medical record systems, allowing greater numbers of patients with suspected NASH to be evaluated and referred to specialists for further testing, according to Dr. Schattenberg.
“To me, this is an at-risk population,” Dr. Schattenberg said in an interview. “There’s a lot of talk of increasing numbers of end-stage liver disease, and these are the cases that are waiting to happen. I think if we identify them, we can manage them better.”
“I’m not saying they should all get drugs – I’m saying they have to be informed about their condition because they may not have a clue they have liver disease,” he continued.
The machine-learning approach described here by Dr. Schattenberg included an exploratory analysis based on 704 patients with NASH or non-NASH nonalcoholic fatty liver disease (NAFLD) in the NAFLD Adult Database from the National Institute of Diabetes, Digestive, and Kidney Diseases.
The best-performing model they identified included 14 variables. Ranked by contribution to predictive power, those variables included hemoglobin A1c, aspartate aminotransferase, alanine aminotransferase, total protein, AST/ALT ratio, body mass index, triglycerides, height, platelets, white blood cells, hematocrit, albumin, hypertension, and sex.
That 14-variable model had good performance when tested on the Optum Humedica electronic medical record database, according to Dr. Schattenberg and colleagues.
In the analysis for final evaluation, including 1,016 patients with histologically confirmed NASH, the area under the curve was 0.76, they reported.
A simplified, five-variable model including just hemoglobin A1c, AST, ALT, total protein, and AST/ALT ratio also had good performance, with an area under the curve of 0.74, they said in their report.
Dr. Schattenberg provided disclosures related to AbbVie, Novartis, MSD, Pfizer, Boehringer Ingelheim, BMS, Intercept Pharmaceuticals, Genfit, Gilead, and Echosens. Several study coauthors reported employment with Novartis and stock ownership.
BOSTON – A machine-learning model based on standard clinical and laboratory values is able to predict nonalcoholic steatohepatitis (NASH) with a sensitivity of 72%-81%, an investigator reported at the annual meeting of the American Association for the Study of Liver Diseases.
The tool, dubbed NASHmap, could serve as an initial screening tool to reveal more potential undiagnosed patients with NASH, according to Jörn M. Schattenberg, MD, with the metabolic liver research program in the department of medicine at University Medical Centre Mainz (Germany).
While not intended to replace current scoring systems, NASHmap potentially could be applied as a clinical decision support tool within electronic medical record systems, allowing greater numbers of patients with suspected NASH to be evaluated and referred to specialists for further testing, according to Dr. Schattenberg.
“To me, this is an at-risk population,” Dr. Schattenberg said in an interview. “There’s a lot of talk of increasing numbers of end-stage liver disease, and these are the cases that are waiting to happen. I think if we identify them, we can manage them better.”
“I’m not saying they should all get drugs – I’m saying they have to be informed about their condition because they may not have a clue they have liver disease,” he continued.
The machine-learning approach described here by Dr. Schattenberg included an exploratory analysis based on 704 patients with NASH or non-NASH nonalcoholic fatty liver disease (NAFLD) in the NAFLD Adult Database from the National Institute of Diabetes, Digestive, and Kidney Diseases.
The best-performing model they identified included 14 variables. Ranked by contribution to predictive power, those variables included hemoglobin A1c, aspartate aminotransferase, alanine aminotransferase, total protein, AST/ALT ratio, body mass index, triglycerides, height, platelets, white blood cells, hematocrit, albumin, hypertension, and sex.
That 14-variable model had good performance when tested on the Optum Humedica electronic medical record database, according to Dr. Schattenberg and colleagues.
In the analysis for final evaluation, including 1,016 patients with histologically confirmed NASH, the area under the curve was 0.76, they reported.
A simplified, five-variable model including just hemoglobin A1c, AST, ALT, total protein, and AST/ALT ratio also had good performance, with an area under the curve of 0.74, they said in their report.
Dr. Schattenberg provided disclosures related to AbbVie, Novartis, MSD, Pfizer, Boehringer Ingelheim, BMS, Intercept Pharmaceuticals, Genfit, Gilead, and Echosens. Several study coauthors reported employment with Novartis and stock ownership.
REPORTING FROM THE LIVER MEETING 2019
Storytelling tool can assist elderly in the ICU
SAN FRANCISCO – A “Best Case/Worst Case” (BCWC) framework tool has been adapted for use with geriatric trauma patients in the ICU, where it can help track a patient’s progress and enable better communication with patients and loved ones. The tool relies on a combination of graphics and text that surgeons update daily during rounds, and creates a longitudinal view of a patient’s trajectory during their stay in the ICU.
– for example, after a complication has arisen.
“Each day during rounds, the ICU team records important events on the graphic aid that change the patient’s course. The team draws a star to represent the best case, and a line to represent prognostic uncertainty. The attending trauma surgeon then uses the geriatric trauma outcome score, their knowledge of the health state of the patient, and their own clinical experience to tell a story about treatments, recovery, and outcomes if everything goes as well as we might hope. This story is written down in the best-case scenario box,” Christopher Zimmerman, MD, a general surgery resident at the University of Wisconsin–Madison, said during a presentation about the BCWC tool at the annual clinical congress of the American College of Surgeons
“We often like to talk to patients and their families [about best- and worst-case scenarios] anyway, but [the research team] have tried to formalize it,” said Tam Pham, MD, professor of surgery at the University of Washington, in an interview. Dr. Pham comoderated the session where the research was presented.
“When we’re able to communicate where the uncertainty is and where the boundaries are around the course of care and possible outcomes, we can build an alliance with patients and families that will be helpful when there is a big decision to make, say about a laparotomy for a perforated viscus,” said Dr. Zimmerman.
Dr. Zimmerman gave an example of a patient who came into the ICU after suffering multiple fractures from falling down a set of stairs. The team created an initial BCWC with a hoped-for best-case scenario. Later, the patient developed hypoxemic respiratory failure and had to be intubated overnight. “This event is recorded on the graphic, and her star representing the best case has changed position, the line representing uncertainty has shortened, and the contents of her best-case scenario has changed. Each day in rounds, this process is repeated,” said Dr. Zimmerman.
Palliative care physicians, education experts, and surgeons at the University of Wisconsin–Madison developed the tool in an effort to reduce unwanted care at the end of life, in the context of high-risk surgeries. The researchers adapted the tool to the trauma setting by gathering six focus groups of trauma practitioners at the University of Wisconsin; University of Texas, Dallas; and Oregon Health & Science University, Portland. They modified the tool after incorporating comments, and then iteratively modified it through tasks carried out in the ICU as part of a qualitative improvement initiative at the University of Wisconsin–Madison. They generated a change to the tool, implemented it in the ICU during subsequent rounds, then collected observations and field notes, then revised and repeated the process, streamlining it to fit into the ICU environment, according to Dr. Zimmerman.
The back side of the tool is available for family members to write important details about their loved ones, leading insight into the patient’s personality and desires, such as favorite music or affection for a family pet.
The work was supported by the National Institutes of Health. Dr. Zimmerman and Dr. Pham have no relevant financial disclosures.
SOURCE: Zimmerman C et al. Clinical Congress 2019, Abstract.
REPORTING FROM CLINICAL CONGRESS 2019
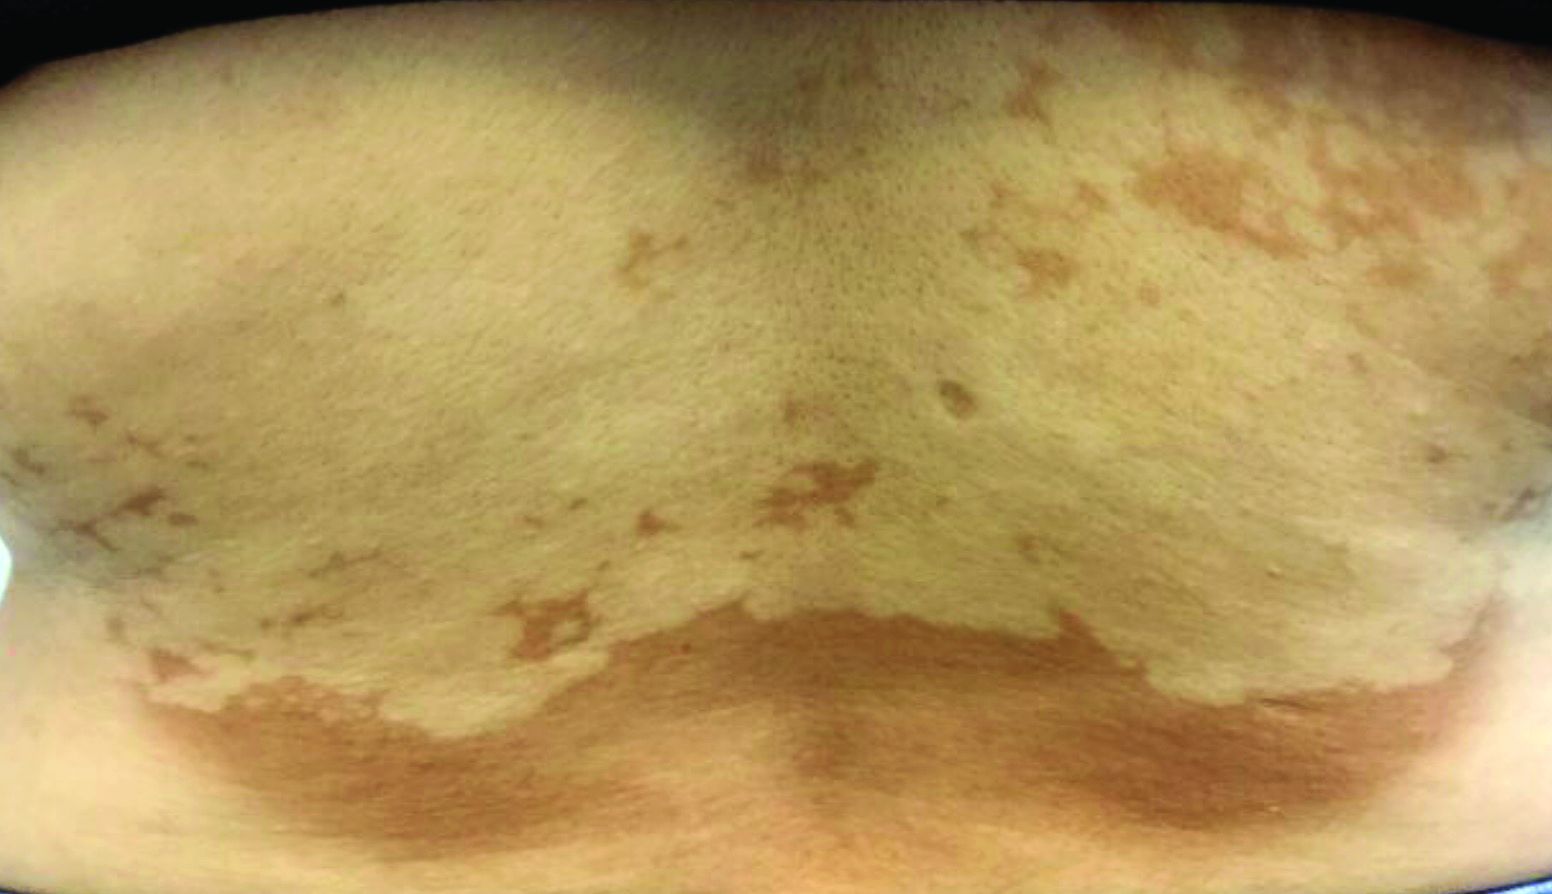
Asymptomatic hypopigmented macules and patches
, also known as Pityrosporum orbiculare or P. ovale. In its hyphal form, it produces skin lesions that appear as scaly, round or oval, hypopigmented, hyperpigmented, or pink macules or patches. Lesions are asymptomatic. The condition is more commonly seen in warm climates or during the summer months. Malassezia requires an oily environment for growth. Typically, TV appears in sebum-producing areas on the trunk. However, other sites may be affected such as the scalp, groin, and flexural areas. Infants may have facial lesions. Hypopigmentation may persist for months, even after lesions are treated, and takes time to resolve.
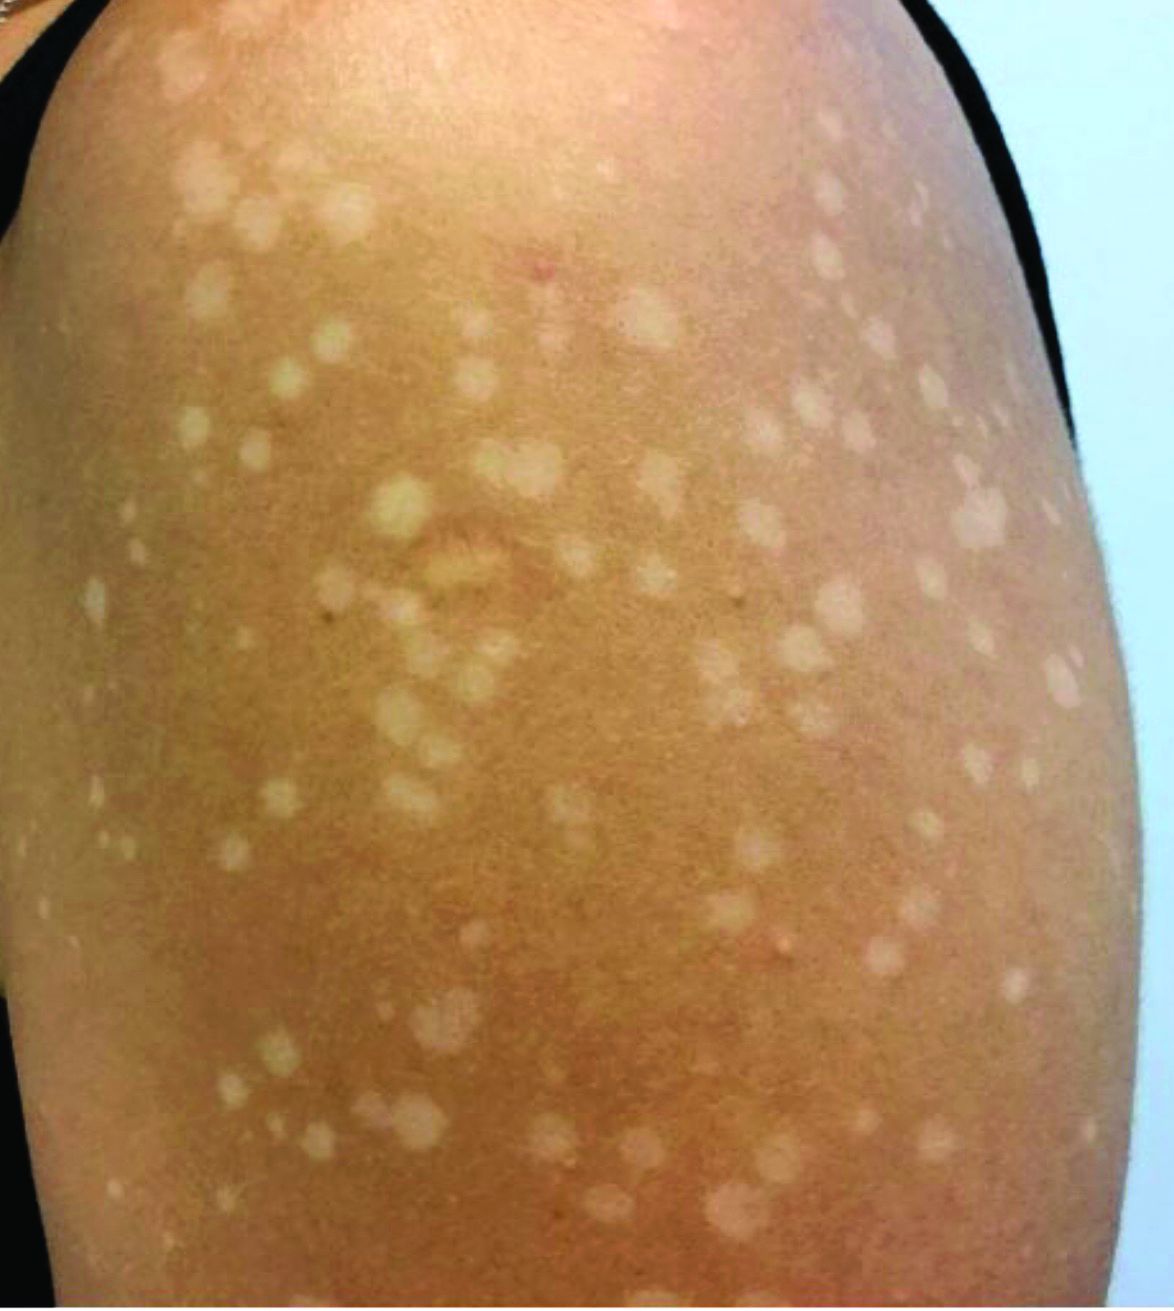
The differential diagnosis of hypopigmented lesions of tinea versicolor includes vitiligo, hypopigmented mycosis fungoides, progressive macular hypomelanosis (PMH), secondary syphilis, and pityriasis alba. Potassium hydroxide (KOH) preparations can be performed in the office for TV to reveal short, thick fungal hyphae with multiple spores, often referred to as “spaghetti and meatballs.” Use of a Wood’s light may aid in diagnosis. In TV, lesions may fluoresce yellow-green in adjacent follicles, unlike PMH, which characteristically show orange-red follicular fluorescence. A skin biopsy is necessary to rule out hypopgimented mycosis fungoides or syphilis. Histologically in TV, hyphae and spores will be present in the stratum corneum or in hair follicles. These are readily seen with PAS or GMS (Grocott methenamine silver) stains. There is usually no inflammation and skin appears “normal.” A biopsy was performed in this patient that revealed PAS positive hyphae.
Treatment for TV can be topical or systemic. Antifungal azole shampoo or creams, selenium sulfide shampoo, sulfur preparations, and allylamine creams have all been reported as useful treatments. Oral itraconazole or fluconazole are often given as systemic treatments. Monthly or weekly topical therapy may help prevent relapse.

This case and the photos were provided by Dr. Bilu Martin.
Dr. Bilu Martin is a board-certified dermatologist in private practice at Premier Dermatology, MD, in Aventura, Fla. More diagnostic cases are available at mdedge.com/dermatology. To submit a case for possible publication, send an email to [email protected].
, also known as Pityrosporum orbiculare or P. ovale. In its hyphal form, it produces skin lesions that appear as scaly, round or oval, hypopigmented, hyperpigmented, or pink macules or patches. Lesions are asymptomatic. The condition is more commonly seen in warm climates or during the summer months. Malassezia requires an oily environment for growth. Typically, TV appears in sebum-producing areas on the trunk. However, other sites may be affected such as the scalp, groin, and flexural areas. Infants may have facial lesions. Hypopigmentation may persist for months, even after lesions are treated, and takes time to resolve.
The differential diagnosis of hypopigmented lesions of tinea versicolor includes vitiligo, hypopigmented mycosis fungoides, progressive macular hypomelanosis (PMH), secondary syphilis, and pityriasis alba. Potassium hydroxide (KOH) preparations can be performed in the office for TV to reveal short, thick fungal hyphae with multiple spores, often referred to as “spaghetti and meatballs.” Use of a Wood’s light may aid in diagnosis. In TV, lesions may fluoresce yellow-green in adjacent follicles, unlike PMH, which characteristically show orange-red follicular fluorescence. A skin biopsy is necessary to rule out hypopgimented mycosis fungoides or syphilis. Histologically in TV, hyphae and spores will be present in the stratum corneum or in hair follicles. These are readily seen with PAS or GMS (Grocott methenamine silver) stains. There is usually no inflammation and skin appears “normal.” A biopsy was performed in this patient that revealed PAS positive hyphae.
Treatment for TV can be topical or systemic. Antifungal azole shampoo or creams, selenium sulfide shampoo, sulfur preparations, and allylamine creams have all been reported as useful treatments. Oral itraconazole or fluconazole are often given as systemic treatments. Monthly or weekly topical therapy may help prevent relapse.
This case and the photos were provided by Dr. Bilu Martin.
Dr. Bilu Martin is a board-certified dermatologist in private practice at Premier Dermatology, MD, in Aventura, Fla. More diagnostic cases are available at mdedge.com/dermatology. To submit a case for possible publication, send an email to [email protected].
Risk stratification of syncope patients can help determine duration of telemetry monitoring
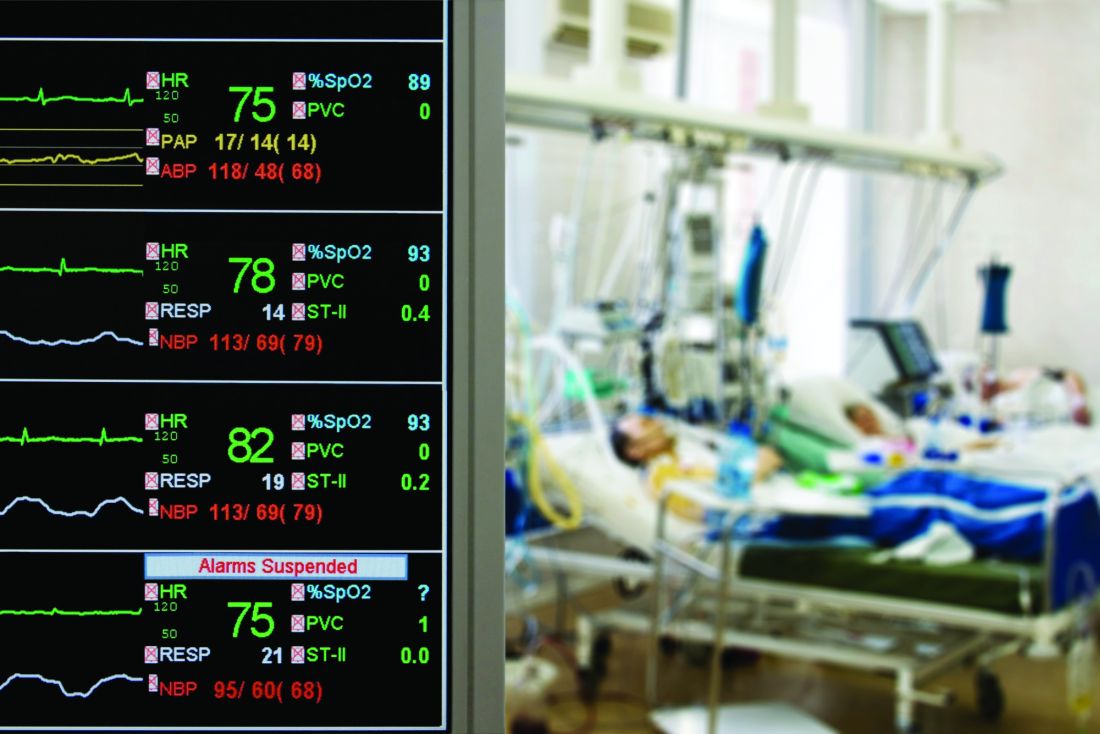
Background: About half of ED patients with syncope of unknown etiology are admitted for telemetry monitoring. No consensus exists regarding the optimal duration of telemetry monitoring in these patients to detect underlying arrhythmia.

Study design: Prospective cohort study.
Setting: Six EDs in Canada during September 2010–March 2015.
Synopsis: Using the Canadian Syncope Risk Score, 5,581 adults who presented to the ED within 24 hours of a syncopal event were risk stratified as low, medium, or high risk for serious adverse events (arrhythmic vs. nonarrhythmic) and then followed for 30 days. Approximately half of arrhythmias were identified among low-risk patients within 2 hours of telemetry monitoring and within 6 hours of monitoring among medium- and high-risk patients. In the low-risk group, none experienced death or ventricular arrhythmia within 30 days. In the medium- and high-risk group, 91.7% of underlying arrhythmias were identified within 15 days. The study was limited by the lack of standardized approach in the use of outpatient cardiac rhythm monitoring, which may have resulted in arrhythmia underdetection.
Bottom line: Among ED patients with syncope of unknown etiology, approximately 47% of arrhythmias were detected after 2-6 hours of telemetry monitoring. Among medium- and high-risk patients, the majority of serious arrhythmias were identified within 15 days. Based on these results, the authors recommend the use of 15-day outpatient cardiac monitoring for medium- and high-risk patients.
Citation: Thiruganasambandamoorthy V et al. Duration of electrocardiographic monitoring of emergency department patients with syncope. Circulation. 2019 Mar 12;139(11):1396-406.
Dr. Roy is a hospitalist at Beth Israel Deaconess Medical Center and instructor in medicine at Harvard Medical School.
Background: About half of ED patients with syncope of unknown etiology are admitted for telemetry monitoring. No consensus exists regarding the optimal duration of telemetry monitoring in these patients to detect underlying arrhythmia.
Study design: Prospective cohort study.
Setting: Six EDs in Canada during September 2010–March 2015.
Synopsis: Using the Canadian Syncope Risk Score, 5,581 adults who presented to the ED within 24 hours of a syncopal event were risk stratified as low, medium, or high risk for serious adverse events (arrhythmic vs. nonarrhythmic) and then followed for 30 days. Approximately half of arrhythmias were identified among low-risk patients within 2 hours of telemetry monitoring and within 6 hours of monitoring among medium- and high-risk patients. In the low-risk group, none experienced death or ventricular arrhythmia within 30 days. In the medium- and high-risk group, 91.7% of underlying arrhythmias were identified within 15 days. The study was limited by the lack of standardized approach in the use of outpatient cardiac rhythm monitoring, which may have resulted in arrhythmia underdetection.
Bottom line: Among ED patients with syncope of unknown etiology, approximately 47% of arrhythmias were detected after 2-6 hours of telemetry monitoring. Among medium- and high-risk patients, the majority of serious arrhythmias were identified within 15 days. Based on these results, the authors recommend the use of 15-day outpatient cardiac monitoring for medium- and high-risk patients.
Citation: Thiruganasambandamoorthy V et al. Duration of electrocardiographic monitoring of emergency department patients with syncope. Circulation. 2019 Mar 12;139(11):1396-406.
Dr. Roy is a hospitalist at Beth Israel Deaconess Medical Center and instructor in medicine at Harvard Medical School.
Direct-acting antiviral treatment linked to lower mortality in patients with HCC history
BOSTON – For patients with a complete response following treatment for hepatitis C virus (HCV)–related hepatocellular carcinoma (HCC), treatment with direct-acting antiviral therapy was linked to significantly reduced mortality compared with no such treatment, according to results of a large cohort study.

The mortality benefit associated with direct-acting antiviral (DAA) therapy was consistent across most subgroups, suggesting that the association was driven by achieving sustained virological response (SVR), according to Amit G. Singal, MD, associate professor of medicine at UT Southwestern Medical Center, Dallas.
Those results suggest that DAA therapy in patients with a history of HCC is not only safe, but is also beneficial, Dr. Singal said at the annual meeting of the American Association for the Study of Liver Diseases.
“To be slightly controversial, I think that this changes the paradigm in this subgroup of patients from ‘can be treated’ for their hepatitis C to ‘should be treated,’ ” he concluded in an oral presentation of the results.
While DAA treatment is proven to reduce risk of incident HCC in patients with cirrhosis, the risk-benefit ratio is “less clear” in patients with a history of HCC following complete response, according to Dr. Singal.
Moreover, concerns were raised about the safety of DAA therapy in patients with an HCC history, after early data suggested a potentially higher recurrence risk, he added.
In the current multicenter, retrospective North American cohort study, Dr. Singal and colleagues reviewed data for 797 patients with HCV–related HCC who achieved complete response following ablation, resection, radiotherapy, transarterial chemoembolization, or transarterial radioembolization.
Treatment with DAA therapy was associated with improved overall survival, according to results of multivariable analysis, with a hazard ratio of 0.54 (95% confidence interval, 0.33-0.90). Median time from HCC complete response to death was 25.7 months for the DAA treatment group, versus 11.5 months for the untreated group.
The association between DAA treatment and death was apparently driven by SVR, as reduced mortality was seen in the DAA-treated patients who did achieve SVR, but not in those without SVR, Dr. Singal reported.
While these findings together suggest that DAA treatment is linked to reduced mortality after HCC complete response, prospective studies are needed to confirm this association, Dr. Singal said.
Dr. Singal reported disclosures related to AbbVie, Bayer, BMS, Eisai, Exact Sciences, Exelixis, Genentech, Gilead FOCUS, Glycotest, GRAIL, Merck, Roche, TARGET Pharmasolutions, and Wako Diagnostics.
SOURCE: Singal AG et al. The Liver Meeting 2019, Abstract 199.
BOSTON – For patients with a complete response following treatment for hepatitis C virus (HCV)–related hepatocellular carcinoma (HCC), treatment with direct-acting antiviral therapy was linked to significantly reduced mortality compared with no such treatment, according to results of a large cohort study.
The mortality benefit associated with direct-acting antiviral (DAA) therapy was consistent across most subgroups, suggesting that the association was driven by achieving sustained virological response (SVR), according to Amit G. Singal, MD, associate professor of medicine at UT Southwestern Medical Center, Dallas.
Those results suggest that DAA therapy in patients with a history of HCC is not only safe, but is also beneficial, Dr. Singal said at the annual meeting of the American Association for the Study of Liver Diseases.
“To be slightly controversial, I think that this changes the paradigm in this subgroup of patients from ‘can be treated’ for their hepatitis C to ‘should be treated,’ ” he concluded in an oral presentation of the results.
While DAA treatment is proven to reduce risk of incident HCC in patients with cirrhosis, the risk-benefit ratio is “less clear” in patients with a history of HCC following complete response, according to Dr. Singal.
Moreover, concerns were raised about the safety of DAA therapy in patients with an HCC history, after early data suggested a potentially higher recurrence risk, he added.
In the current multicenter, retrospective North American cohort study, Dr. Singal and colleagues reviewed data for 797 patients with HCV–related HCC who achieved complete response following ablation, resection, radiotherapy, transarterial chemoembolization, or transarterial radioembolization.
Treatment with DAA therapy was associated with improved overall survival, according to results of multivariable analysis, with a hazard ratio of 0.54 (95% confidence interval, 0.33-0.90). Median time from HCC complete response to death was 25.7 months for the DAA treatment group, versus 11.5 months for the untreated group.
The association between DAA treatment and death was apparently driven by SVR, as reduced mortality was seen in the DAA-treated patients who did achieve SVR, but not in those without SVR, Dr. Singal reported.
While these findings together suggest that DAA treatment is linked to reduced mortality after HCC complete response, prospective studies are needed to confirm this association, Dr. Singal said.
Dr. Singal reported disclosures related to AbbVie, Bayer, BMS, Eisai, Exact Sciences, Exelixis, Genentech, Gilead FOCUS, Glycotest, GRAIL, Merck, Roche, TARGET Pharmasolutions, and Wako Diagnostics.
SOURCE: Singal AG et al. The Liver Meeting 2019, Abstract 199.
REPORTING FROM THE LIVER MEETING 2019
Kratom: Botanical with opiate-like effects increasingly blamed for liver injury
BOSTON – Kratom, a botanical product with opioid-like activity, is increasingly responsible for cases of liver injury in the United States, according to investigators.
Kratom-associated liver damage involves a mixed pattern of hepatocellular and cholestatic injury that typically occurs after about 2-6 weeks of use, reported lead author Victor J. Navarro, MD, division head of gastroenterology at Einstein Healthcare Network in Philadelphia, and colleagues.
“I think it’s important for clinicians to have heightened awareness of the abuse potential [of kratom], because it is an opioid agonist and [because of] its capacity to cause liver injury,” Dr. Navarro said.
Kratom acts as a stimulant at low doses, while higher doses have sedating and narcotic properties. These effects are attributed to several alkaloids found in kratom’s source plant, Mitragyna speciose, of which mitragynine, a suspected opioid agonist, is most common.
Presenting at the annual meeting of the American Association for the Study of Liver Diseases, Dr. Navarro cited figures from the National Poison Data System that suggest an upward trend in kratom usage in the United States, from very little use in 2011 to 1 exposure per million people in 2014 and more recently to slightly more than 2.5 exposures per million people in 2017, predominantly among individuals aged 20 years and older. According to the Centers for Disease Control and Prevention, more than 90 kratom-associated deaths occurred between July 2016 and December 2017. Because of growing concerns, the Food and Drug Administration has issued multiple public warnings about kratom, ranging from products contaminated with Salmonella and heavy metals, to adverse effects such as seizures and liver toxicity.
The present study aimed to characterize kratom-associated liver injury through a case series analysis. First, the investigators reviewed 404 cases of herbal and dietary supplement-associated liver injury from the Drug-Induced Liver Injury Network prospective study. They found 11 suspected cases of kratom-related liver injury, with an upward trend in recent years. At this time, seven of the cases have been adjudicated by an expert panel and confirmed to be highly likely or probably associated with kratom.
Of these seven cases, all patients were hospitalized, although all recovered without need for liver transplant. Patients presented after a median of 15 days of kratom use, with a 28-day symptom latency period. However, Dr. Navarro noted that some cases presented after just 5 days of use. The most common presenting symptom was itching (86%), followed by jaundice (71%), abdominal pain (71%), nausea (57%), and fever (43%). Blood work revealed a mixed hepatocellular and cholestatic pattern. Median peak ALT was 362 U/L, peak alkaline phosphatase was 294 U/L, and peak total bilirubin was 20.1 mg/dL. Despite these changes, patients did not have significant liver dysfunction, such as coagulopathy.
Following this clinical characterization, Dr. Navarro reviewed existing toxicity data. Rat studies suggest that kratom is safe at doses between 1-10 mg/kg, while toxicity occurs after prolonged exposure to more than 100 mg/kg. A cross-sectional human study reported that kratom was safe at doses up to 75 mg/day. However, in the present case series, some patients presented after ingesting as little as 0.66 mg/day, and Dr. Navarro pointed out wide variations in product concentrations of mitragynine.
“Certainly, we need more human toxicity studies to determine what a safe dose really is, because this product is not going away,” Dr. Navarro said.
The investigators disclosed relationships with Gilead, Bristol-Myers Squibb, Sanofi, and others.
SOURCE: Navarro VJ et al. The Liver Meeting 2019, Abstract 212.
REPORTING FROM THE LIVER MEETING 2019
Fentanyl-related deaths show strong regional pattern
Fentanyl was involved in more overdose deaths than any other drug in 2017, and the death rate in New England was 15 times higher than in regions of the Midwest and West, according to the National Center for Health Statistics.
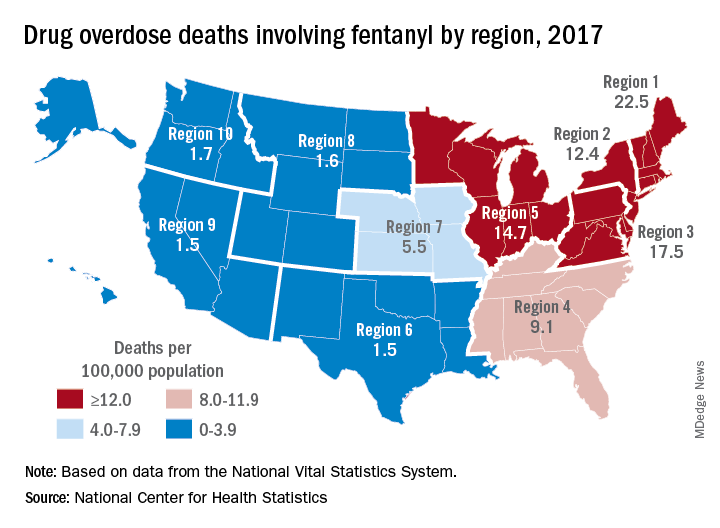
Nationally, fentanyl was involved in 39% of all drug overdose deaths and had an age-adjusted death rate of 8.7/100,000 standard population in 2017. In 2016, when fentanyl also was the most involved drug in the United States, the corresponding figures were 29% and 5.9/100,000, the agency said in a recent report.
Fentanyl was the most involved drug in overdose deaths for 6 of the country’s 10 public health regions in 2017, with a clear pattern of decreasing use from east to west. The highest death rate (22.5/100,000) occurred in Region 1 (New England) and the lowest rates (1.5/100,000) came in Region 6 (Arkansas, Louisiana, New Mexico, Oklahoma, and Texas) and Region 9 (Arizona, California, Hawaii, and Nevada), the researchers said.
A somewhat similar pattern was seen for heroin, which was second nationally on the list of drugs most frequently involved in overdose deaths (23%), except that New England was somewhat below three other regions in the East and upper Midwest. The highest heroin death rate (8.6/100,000) was seen in Region 2 (New Jersey and New York) and the lowest (2.2) occurred in Region 9, they said, based on data from the National Vital Statistics System’s mortality files.
The fentanyl pattern was even more closely repeated with cocaine, third in involvement nationally at 21% of overdose deaths in 2017. The high in overdose deaths (9.5/100,000) came in Region 1 again, and the low in Region 9 (1.3), along with Region 7 (Iowa, Kansas, Missouri, and Nebraska) and Region 10 (Alaska, Idaho, Oregon, and Washington), the report showed.
The regional pattern of overdose deaths for methamphetamine, which was fourth nationally in involvement (13.3%), basically reversed the other three drugs: highest in the West and lowest in the Northeast. Region 9 had the highest death rate (5.2/100,000) and Region 2 the lowest (0.4), with Region 1 just ahead at 0.6.
Fentanyl was involved in more overdose deaths than any other drug in 2017, and the death rate in New England was 15 times higher than in regions of the Midwest and West, according to the National Center for Health Statistics.
Nationally, fentanyl was involved in 39% of all drug overdose deaths and had an age-adjusted death rate of 8.7/100,000 standard population in 2017. In 2016, when fentanyl also was the most involved drug in the United States, the corresponding figures were 29% and 5.9/100,000, the agency said in a recent report.
Fentanyl was the most involved drug in overdose deaths for 6 of the country’s 10 public health regions in 2017, with a clear pattern of decreasing use from east to west. The highest death rate (22.5/100,000) occurred in Region 1 (New England) and the lowest rates (1.5/100,000) came in Region 6 (Arkansas, Louisiana, New Mexico, Oklahoma, and Texas) and Region 9 (Arizona, California, Hawaii, and Nevada), the researchers said.
A somewhat similar pattern was seen for heroin, which was second nationally on the list of drugs most frequently involved in overdose deaths (23%), except that New England was somewhat below three other regions in the East and upper Midwest. The highest heroin death rate (8.6/100,000) was seen in Region 2 (New Jersey and New York) and the lowest (2.2) occurred in Region 9, they said, based on data from the National Vital Statistics System’s mortality files.
The fentanyl pattern was even more closely repeated with cocaine, third in involvement nationally at 21% of overdose deaths in 2017. The high in overdose deaths (9.5/100,000) came in Region 1 again, and the low in Region 9 (1.3), along with Region 7 (Iowa, Kansas, Missouri, and Nebraska) and Region 10 (Alaska, Idaho, Oregon, and Washington), the report showed.
The regional pattern of overdose deaths for methamphetamine, which was fourth nationally in involvement (13.3%), basically reversed the other three drugs: highest in the West and lowest in the Northeast. Region 9 had the highest death rate (5.2/100,000) and Region 2 the lowest (0.4), with Region 1 just ahead at 0.6.