User login
ICYMI: MRI-based treat-to-target approach offers no benefit for RA patients
Patients with RA in clinical remission who received an MRI-based treat-to-target strategy did not achieve superior disease activity remission rates (85% vs. 88%) or reduced radiographic progression (66% vs. 62%), compared with a conventional treat-to-target strategy, according to results of the Danish, 2-year, investigator-initiated, randomized, multicenter IMAGINE-RA trial published in JAMA (2019 Feb 5. doi: 10.1001/jama.2018.21362).
We covered this study at the 2018 European Congress of Rheumatology before it was published in the journal. Read the story at the link above.
FROM JAMA
Locally Destructive Metastatic Basal Cell Carcinoma
To the Editor:
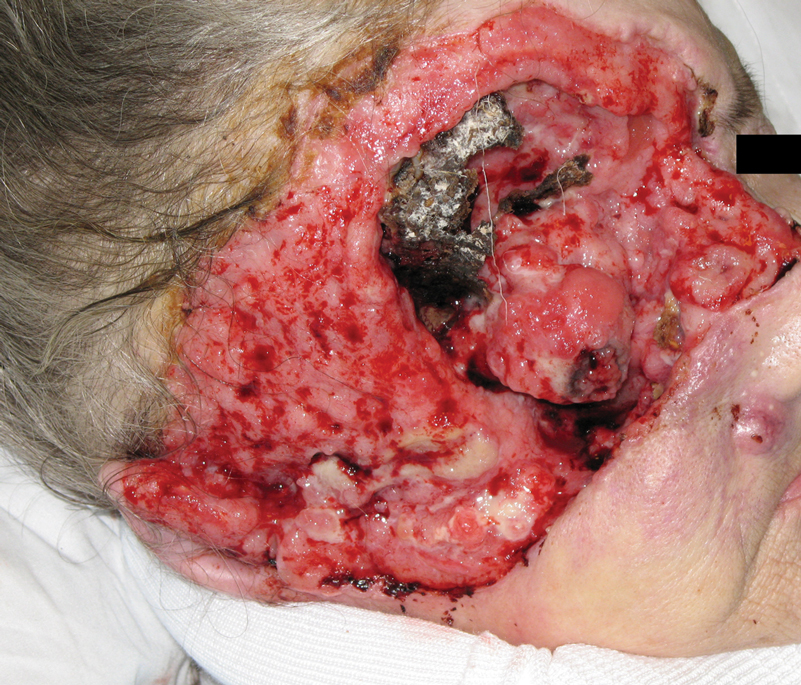
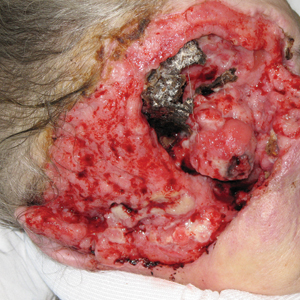
A 60-year-old woman with a history of lymphoma presented to the emergency department for evaluation of intermittent diarrhea and vomiting of 2 weeks’ duration. On presentation, a rather large dressing covering the entire right half of the face was noted. Removal of the bandage revealed a necrotic, extensively destructive, right-sided facial lesion with a fully exposed ocular globe (Figure 1). The patient lived alone and was accompanied by a neighbor, who disclosed that the lesion had been neglected and enlarged over the last 15 years. Moreover, the neighbor reported that the patient had recently experienced several episodes of vertigo and frequent falls.
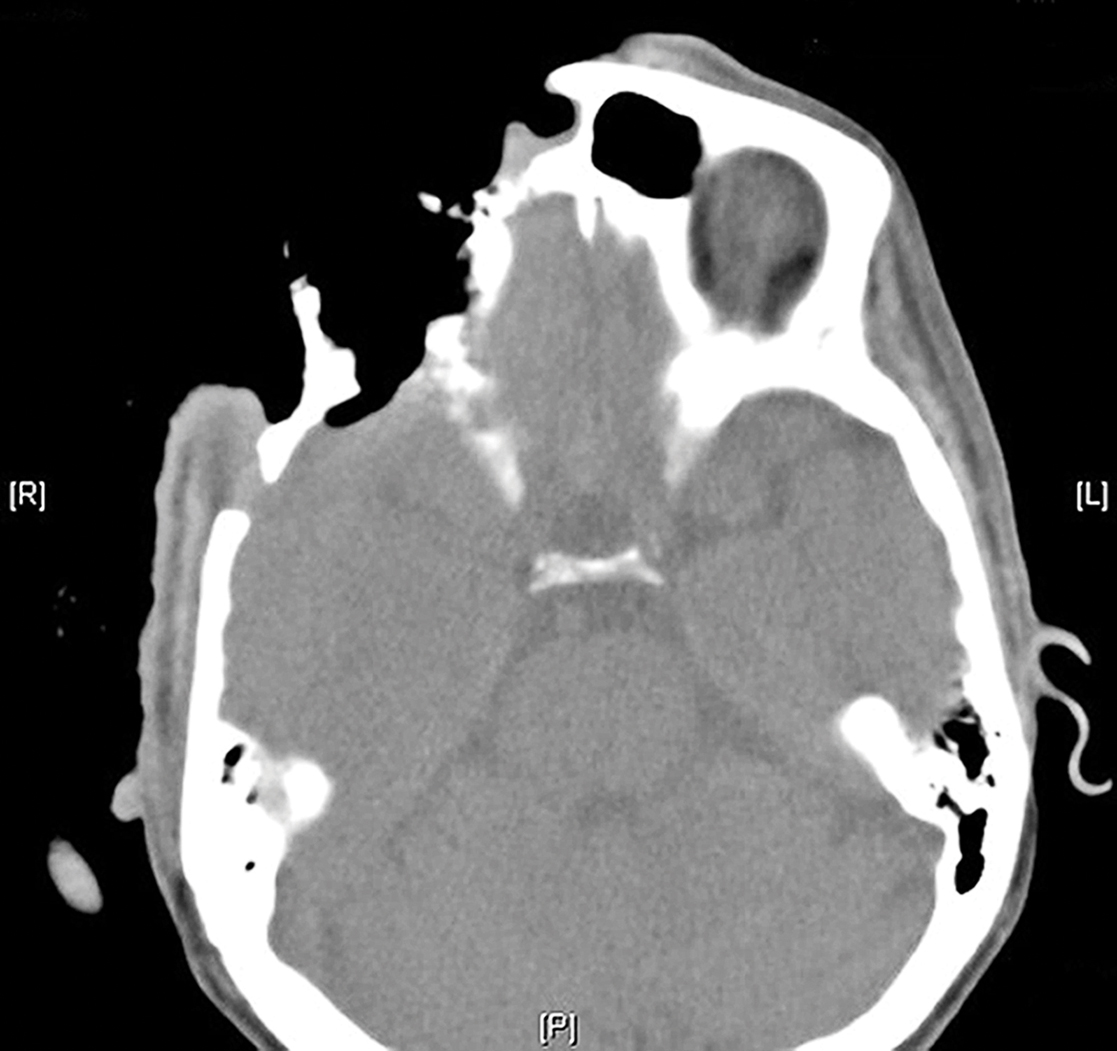
On admission to the hospital, dermatology was consulted and initial workup included computed tomography (CT) scan of the head and maxillofacial region, which showed a destructive process involving the right frontotemporal bone, maxillofacial region, sphenoid, and skull base with exposure of intracranial contents (Figure 2). An aggressive wound care regimen was instituted. Biopsy of the wound margin revealed nodular and focally infiltrative basal cell carcinoma (BCC) (Figure 3).
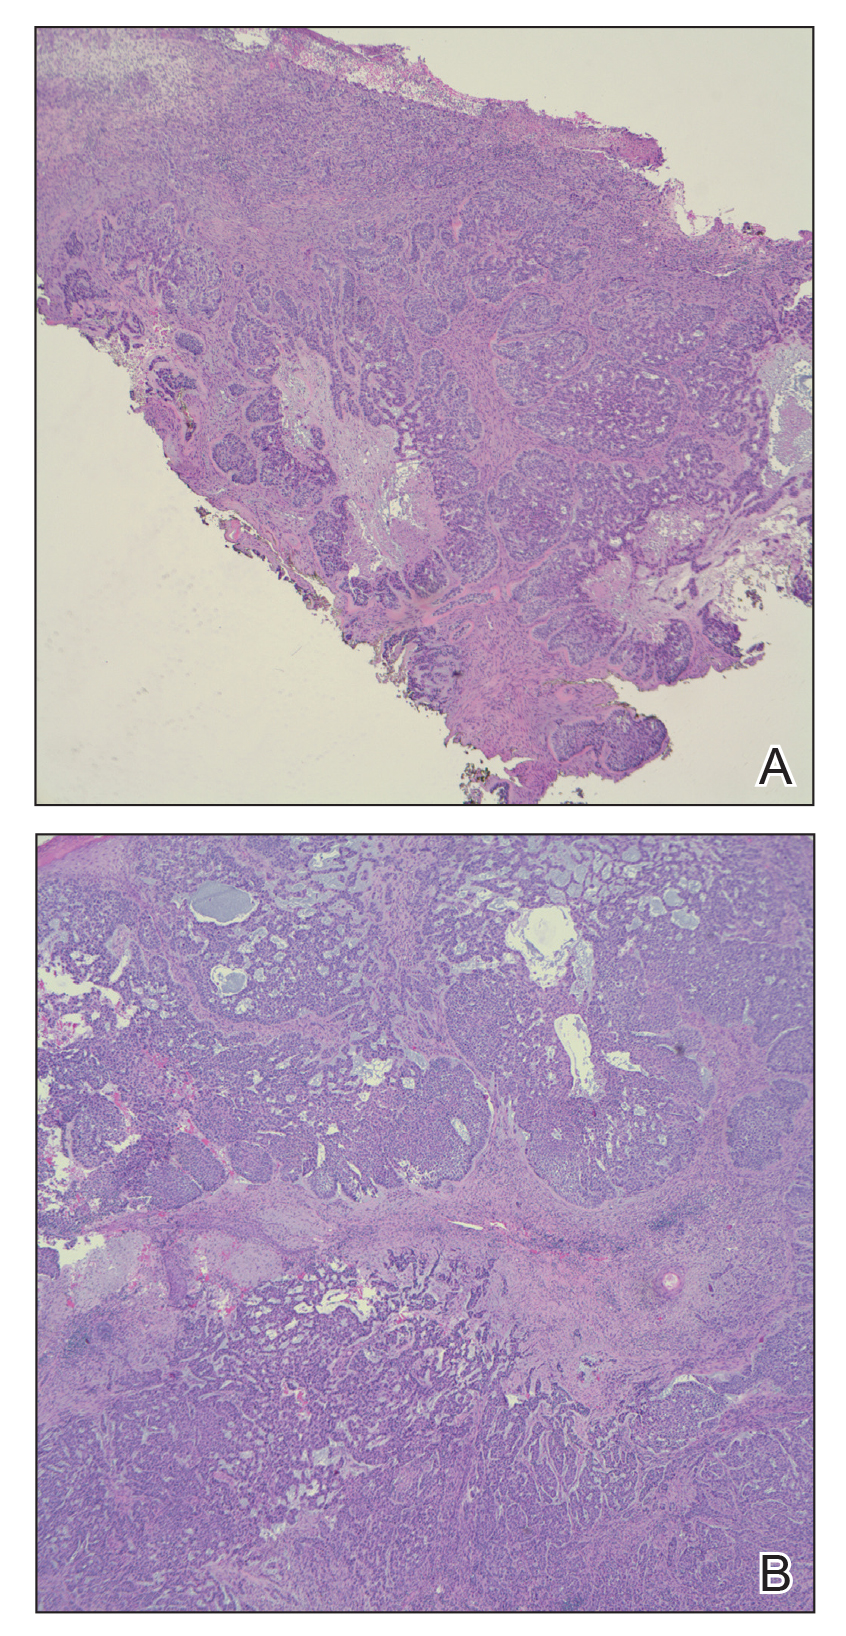
and focally infiltrative basal cell carcinoma (H&E, original magnifications×4 and ×10).
Several days into her hospitalization, the patient developed radicular pain in both arms and weakness in all 4 extremities. A CT scan of the neck revealed a pathologic fracture of the C7 vertebrae. Several medical and surgical services as well as psychiatry were consulted. Given the extensive nature of the disease involvement with limited treatment options, the patient sought to forego further interventions and was discharged to hospice care.
Basal cell carcinomas rarely metastasize, with a reported incidence of 0.0028% to 0.5%.1 The likelihood of metastasis is most closely related to tumor size and depth of invasion. Tumors greater than 3 cm in diameter have a 2% incidence of metastatic spread and/or death. The incidence of metastatic spread and/or death is estimated to be 25% for tumors with a diameter of 5 cm and 50% for tumors with a diameter of 10 cm or greater.2 Other risk factors for metastatic spread include long duration of disease, failure to respond to conventional treatment, and prior radiation treatment in the affected area.1 In one review, the median interval between onset of BCC and metastasis was 9 years.3 In our case, 15 years of neglect most likely led to the aggressiveness of the tumor. Although the workup in our patient was limited per her request, there was no evidence that her lymphoma had recurred or that she was in any other way immunocompromised. Unfortunately, in this patient’s case, the local destructiveness of the carcinoma with subsequent bony invasion and necrosis was complicated with secondary Rhizopus infection. A PubMed search of articles indexed for MEDLINE using the terms basal cell carcinoma and mucormycosis revealed no other reported cases of BCC associated with mucormycosis; therefore, our case represents a rare presentation of this association. Rhinocerebral mucormycosis is the most common manifestation of mucormycosis and more commonly occurs in diabetics with ketoacidosis and in severely debilitated or immunosuppressed individuals.4 The extensive bony destruction, especially of the nasal region, of our patient’s tumor likely led to secondary infection with Rhizopus.
Approximately 85% of all metastatic BCCs originate in the head and neck region, with lymph nodes being the first site of metastasis and involved in approximately half of all cases.1,4 Metastases to the lungs, bone, liver, and other viscera can occur with advanced disease. Metastasis generally portends a poor prognosis, with survival rarely exceeding 1.5 years. Until recently, therapeutic options for metastatic disease were limited, with marginal response to chemotherapy with methotrexate, fluorouracil, bleomycin, and cisplatin.4 Vismodegib, a novel smoothened receptor inhibitor that blocks the sonic hedgehog pathway implicated in BCC carcinogenesis, offers a new promising treatment for management and control of advanced disease.5
- Junior W, Ribeiro SC, Vieira SC, et al. Metastatic basal cell carcinoma: a case report. Dermatol Online J. 2003;9:18.
- Snow SN, Sahl WJ, Lo J, et al. Metastatic basal cell carcinoma: report of 5 cases. Cancer. 1994;73:328-335.
- Von Domarus H, Stevens PJ. Metastatic basal cell carcinoma: report of five cases and review of 170 cases in the literature. J Am Acad Dermatol. 1984;10:1043-1060.
- Kolekar JS. Rhinocerebral mucormycosis: a retrospective study. Indian J Otolaryngol Head Neck Surg. 2015;67:93-96.
- Koehlblinger P, Lang R. New developments in the treatment of basal cell carcinoma: update on current and emerging treatment options with a focus on vismodegib. Onc Targets Ther. 2018;11:8327-8340.
To the Editor:
A 60-year-old woman with a history of lymphoma presented to the emergency department for evaluation of intermittent diarrhea and vomiting of 2 weeks’ duration. On presentation, a rather large dressing covering the entire right half of the face was noted. Removal of the bandage revealed a necrotic, extensively destructive, right-sided facial lesion with a fully exposed ocular globe (Figure 1). The patient lived alone and was accompanied by a neighbor, who disclosed that the lesion had been neglected and enlarged over the last 15 years. Moreover, the neighbor reported that the patient had recently experienced several episodes of vertigo and frequent falls.
On admission to the hospital, dermatology was consulted and initial workup included computed tomography (CT) scan of the head and maxillofacial region, which showed a destructive process involving the right frontotemporal bone, maxillofacial region, sphenoid, and skull base with exposure of intracranial contents (Figure 2). An aggressive wound care regimen was instituted. Biopsy of the wound margin revealed nodular and focally infiltrative basal cell carcinoma (BCC) (Figure 3).
and focally infiltrative basal cell carcinoma (H&E, original magnifications×4 and ×10).
Several days into her hospitalization, the patient developed radicular pain in both arms and weakness in all 4 extremities. A CT scan of the neck revealed a pathologic fracture of the C7 vertebrae. Several medical and surgical services as well as psychiatry were consulted. Given the extensive nature of the disease involvement with limited treatment options, the patient sought to forego further interventions and was discharged to hospice care.
Basal cell carcinomas rarely metastasize, with a reported incidence of 0.0028% to 0.5%.1 The likelihood of metastasis is most closely related to tumor size and depth of invasion. Tumors greater than 3 cm in diameter have a 2% incidence of metastatic spread and/or death. The incidence of metastatic spread and/or death is estimated to be 25% for tumors with a diameter of 5 cm and 50% for tumors with a diameter of 10 cm or greater.2 Other risk factors for metastatic spread include long duration of disease, failure to respond to conventional treatment, and prior radiation treatment in the affected area.1 In one review, the median interval between onset of BCC and metastasis was 9 years.3 In our case, 15 years of neglect most likely led to the aggressiveness of the tumor. Although the workup in our patient was limited per her request, there was no evidence that her lymphoma had recurred or that she was in any other way immunocompromised. Unfortunately, in this patient’s case, the local destructiveness of the carcinoma with subsequent bony invasion and necrosis was complicated with secondary Rhizopus infection. A PubMed search of articles indexed for MEDLINE using the terms basal cell carcinoma and mucormycosis revealed no other reported cases of BCC associated with mucormycosis; therefore, our case represents a rare presentation of this association. Rhinocerebral mucormycosis is the most common manifestation of mucormycosis and more commonly occurs in diabetics with ketoacidosis and in severely debilitated or immunosuppressed individuals.4 The extensive bony destruction, especially of the nasal region, of our patient’s tumor likely led to secondary infection with Rhizopus.
Approximately 85% of all metastatic BCCs originate in the head and neck region, with lymph nodes being the first site of metastasis and involved in approximately half of all cases.1,4 Metastases to the lungs, bone, liver, and other viscera can occur with advanced disease. Metastasis generally portends a poor prognosis, with survival rarely exceeding 1.5 years. Until recently, therapeutic options for metastatic disease were limited, with marginal response to chemotherapy with methotrexate, fluorouracil, bleomycin, and cisplatin.4 Vismodegib, a novel smoothened receptor inhibitor that blocks the sonic hedgehog pathway implicated in BCC carcinogenesis, offers a new promising treatment for management and control of advanced disease.5
- Junior W, Ribeiro SC, Vieira SC, et al. Metastatic basal cell carcinoma: a case report. Dermatol Online J. 2003;9:18.
- Snow SN, Sahl WJ, Lo J, et al. Metastatic basal cell carcinoma: report of 5 cases. Cancer. 1994;73:328-335.
- Von Domarus H, Stevens PJ. Metastatic basal cell carcinoma: report of five cases and review of 170 cases in the literature. J Am Acad Dermatol. 1984;10:1043-1060.
- Kolekar JS. Rhinocerebral mucormycosis: a retrospective study. Indian J Otolaryngol Head Neck Surg. 2015;67:93-96.
- Koehlblinger P, Lang R. New developments in the treatment of basal cell carcinoma: update on current and emerging treatment options with a focus on vismodegib. Onc Targets Ther. 2018;11:8327-8340.
Practice Points
- Risk factors associated with metastatic spread of basal cell carcinoma (BCC) include larger tumor size, greater depth of invasion, long duration of disease, failure to respond to conventional treatment, and prior radiation treatment in the affected area.
- The median interval between onset of BCC and metastasis has been shown to be approximately 9 years.
- Vismodegib can be an effective oral therapy for patients with metastatic BCC, locally advanced BCC, recurrence following surgery, or those who are not candidates for surgery or radiation.
Legal marijuana may complicate SUD treatment in adolescents
BROOKLYN, N.Y. – The legalization of marijuana almost certainly will complicate the treatment of substance use disorder in adolescents, particularly when SUD occurs as a comorbidity of bipolar disorder or other psychiatric diseases, according to an expert review at a pediatric psychopharmacology update held by the American Academy of Child and Adolescent Psychiatry.

The full effects of marijuana legalization on SUD have not yet been comprehensively studied in children or adults, but the consequences of easier access, diminished stigma, and potential for a diminished sense of harm are widely considered to be an important obstacle to successful therapy in children, said Timothy E. Wilens, MD, chief of the division of child and adolescent psychiatry at Massachusetts General Hospital, Boston.
Comorbid substance use in children with mood disorders or ADHD has long been understood as a form of self-medication. However, use of marijuana, alcohol, or other mood-altering drugs also are known to interfere with treatment, Dr. Wilens said.
The problem is common among adults as well, but adolescents pose a greater challenge.
“Youths are more vulnerable to developing a substance use disorder because reward pathways develop before control pathways,” Dr. Wilens said. He cited data showing that about half of individuals who develop SUD, many of whom have other psychiatric diagnoses, do so by age 18 years, and 80% do so by age 26 years.
“Substance use disorder is a pediatric issue,” he emphasized.
The problem with legalization of marijuana is that adolescents are likely to conclude that what is safe for adults is safe for children. Citing a study that associated increased use of marijuana with reduced perception of harm (and the opposite), Dr. Wilens predicted that adolescents with comorbid SUD would resist treatment.
Because of those concerns, Massachusetts General Hospital, which is based in a state where recreational marijuana use is permitted, has issued a position statement. The statement endorses the study of marijuana for benefit and for harm but expresses specific concern about “the recreational use of marijuana at any age because of the potential downstream effects on children.”
Dr. Wilens expressed particular concern about parental use of marijuana in front of children because of the implication that it is safe and acceptable. For children at risk of comorbid substance use because of a mood disorder, he cautioned parents against even concealed use of marijuana because of the low likelihood that it will go unnoticed.
“Substance use disorders are associated with a more pernicious and longer course in adolescents than children,” said Dr. Wilens, paraphrasing one of the bullet points from the Massachusetts General position statement, which outlines the potential harms for children. Another of the bullet points maintains, “there are known structural and functional brain changes” that have been documented when marijuana use begins in childhood.
Citing a correlation between parental and adolescent marijuana use, He noted that a very high proportion of adolescents with or without mood disorders experiment with marijuana at some point in high school, so there already is resistance to a characterization that it is harmful.
A realistic approach is therefore required in helping adolescents with comorbid substance use to curb this form of self-medication. It is essential to set priorities, he said, when treating adolescents with SUD and comorbid psychiatric disorders. “Don’t even think about treating substance use disorder until you treat the bipolar disease,” he said.
As the symptoms are relieved, the need for self-medication is likely to diminish, but Dr. Wilens cautioned against being too rigid when helping adolescents move away from marijuana and alcohol. He believes a zero tolerance approach can be counterproductive. Rather, he advocates a “harm reduction” approach in which adolescents agree to reasonable reductions, like avoiding marijuana during the week, while they eliminate dependence.
In an overview of pharmacotherapy to reduce cravings for drugs, he cited evidence, as well as personal experience, that over-the-counter N-acetylcysteine can be a useful tool. However, adolescents in particular should be warned about the pungent smell, which has been a barrier to adherence. He also suggested that psychotherapy, with or without pharmacotherapy, is helpful.
Treatment of comorbid SUD is a critical part of achieving control of accompanying psychiatric diseases, but this task might be complicated by legalized recreational marijuana, Dr. Wilens concluded. He encouraged clinicians to recognize that challenge.
Dr. Wilens reported financial relationships with Ironshore Pharmaceuticals, Janssen, KemPharm, and Otsuka Pharmaceutical.
BROOKLYN, N.Y. – The legalization of marijuana almost certainly will complicate the treatment of substance use disorder in adolescents, particularly when SUD occurs as a comorbidity of bipolar disorder or other psychiatric diseases, according to an expert review at a pediatric psychopharmacology update held by the American Academy of Child and Adolescent Psychiatry.
The full effects of marijuana legalization on SUD have not yet been comprehensively studied in children or adults, but the consequences of easier access, diminished stigma, and potential for a diminished sense of harm are widely considered to be an important obstacle to successful therapy in children, said Timothy E. Wilens, MD, chief of the division of child and adolescent psychiatry at Massachusetts General Hospital, Boston.
Comorbid substance use in children with mood disorders or ADHD has long been understood as a form of self-medication. However, use of marijuana, alcohol, or other mood-altering drugs also are known to interfere with treatment, Dr. Wilens said.
The problem is common among adults as well, but adolescents pose a greater challenge.
“Youths are more vulnerable to developing a substance use disorder because reward pathways develop before control pathways,” Dr. Wilens said. He cited data showing that about half of individuals who develop SUD, many of whom have other psychiatric diagnoses, do so by age 18 years, and 80% do so by age 26 years.
“Substance use disorder is a pediatric issue,” he emphasized.
The problem with legalization of marijuana is that adolescents are likely to conclude that what is safe for adults is safe for children. Citing a study that associated increased use of marijuana with reduced perception of harm (and the opposite), Dr. Wilens predicted that adolescents with comorbid SUD would resist treatment.
Because of those concerns, Massachusetts General Hospital, which is based in a state where recreational marijuana use is permitted, has issued a position statement. The statement endorses the study of marijuana for benefit and for harm but expresses specific concern about “the recreational use of marijuana at any age because of the potential downstream effects on children.”
Dr. Wilens expressed particular concern about parental use of marijuana in front of children because of the implication that it is safe and acceptable. For children at risk of comorbid substance use because of a mood disorder, he cautioned parents against even concealed use of marijuana because of the low likelihood that it will go unnoticed.
“Substance use disorders are associated with a more pernicious and longer course in adolescents than children,” said Dr. Wilens, paraphrasing one of the bullet points from the Massachusetts General position statement, which outlines the potential harms for children. Another of the bullet points maintains, “there are known structural and functional brain changes” that have been documented when marijuana use begins in childhood.
Citing a correlation between parental and adolescent marijuana use, He noted that a very high proportion of adolescents with or without mood disorders experiment with marijuana at some point in high school, so there already is resistance to a characterization that it is harmful.
A realistic approach is therefore required in helping adolescents with comorbid substance use to curb this form of self-medication. It is essential to set priorities, he said, when treating adolescents with SUD and comorbid psychiatric disorders. “Don’t even think about treating substance use disorder until you treat the bipolar disease,” he said.
As the symptoms are relieved, the need for self-medication is likely to diminish, but Dr. Wilens cautioned against being too rigid when helping adolescents move away from marijuana and alcohol. He believes a zero tolerance approach can be counterproductive. Rather, he advocates a “harm reduction” approach in which adolescents agree to reasonable reductions, like avoiding marijuana during the week, while they eliminate dependence.
In an overview of pharmacotherapy to reduce cravings for drugs, he cited evidence, as well as personal experience, that over-the-counter N-acetylcysteine can be a useful tool. However, adolescents in particular should be warned about the pungent smell, which has been a barrier to adherence. He also suggested that psychotherapy, with or without pharmacotherapy, is helpful.
Treatment of comorbid SUD is a critical part of achieving control of accompanying psychiatric diseases, but this task might be complicated by legalized recreational marijuana, Dr. Wilens concluded. He encouraged clinicians to recognize that challenge.
Dr. Wilens reported financial relationships with Ironshore Pharmaceuticals, Janssen, KemPharm, and Otsuka Pharmaceutical.
EXPERT ANALYSIS FROM THE PSYCHOPHARMACOLOGY UPDATE INSTITUTE
What’s New in Topical Treatments for Psoriasis
In an era when we have access to a dizzying array of biologics for psoriasis treatment, it is easy to forget that topical therapies are still the bread and butter of treatment. For the majority of patients living with psoriasis, topical treatment is the only therapy they receive; indeed, a recent study examining a large national payer database found that 86% of psoriasis patients were managed with topical medications only.1 Thus, it is extremely important to understand how to optimize topical treatments, recognize pitfalls in management, and utilize newer agents that can been added to our treatment armamentarium for psoriasis.
In general, steroids have been the mainstay of topical treatment of psoriasis. Their broad anti-inflammatory activity works well against both the visible signs and symptoms of psoriasis as well as the underlying inflammatory milieu of the disease; however, these treatments are not without their downsides. Hypothalamic-pituitary-adrenal (HPA) axis suppression, especially in higher-potency topical steroids, is a serious concern that limits their use. In one study comparing lotion and cream formulations of clobetasol propionate, HPA axis suppression was seen in 80% (8/10) of adults in the lotion group and 30% (3/10) in the cream group after 4 weeks of treatment.2 These findings are not new; a 1987 study found that patients using less than 50 g of topical clobetasol per week, which is considered a low dose, could still exhibit HPA axis suppression.3 Severe HPA axis suppression may occur; one study of various topical steroids found some degree of HPA axis suppression in 38% (19/50) of patients, with a direct correlation with topical steroid potency.4 Additionally, cutaneous side effects such as striae formation, atrophy, and the possibility of tachyphylaxis must be considered. Various treatment regimens have been developed to limit topical steroid use, including steroid-sparing medications (eg, calcipotriene) used in conjunction with topical steroids, systemic treatments (eg, phototherapy) added on, or higher-potency topical steroids rotated with lower-potency steroids. Implementing other agents, such as topical retinoids or keratolytics, into the treatment regimen also is an important consideration in the overall approach to topical psoriasis therapy.
Notably, a number of newly approved topical treatments for psoriasis have emerged, and more are in the pipeline. When evaluating these agents, important considerations include safety, length of treatment course, and efficacy. Several of these agents hold promise for patients with psoriasis.
An alcohol-free, fixed-combination aerosol foam formulation of calcipotriene 0.005% and betamethasone dipropionate 0.064% was approved by the US Food and Drug Administration for plaque psoriasis in 2015. This agent was shown to be more efficacious than the same combination of active ingredients in an ointment formulation as well as either agent alone, with psoriasis area and severity index 75 response achieved in more than 50% of patients at week 4 of treatment.5 Notably, this product offers once-daily application with positive patient satisfaction scores.6 The novelty of this foam is in its ability to supersaturate the active ingredients on the surface of the skin with improved penetration and drug delivery.
A novel spray formulation of betamethasone dipropionate 0.05% also has been developed and has been compared to augmented betamethasone dipropionate lotion. One benefit of this spray is that, based on the vasoconstriction test, the potency is similar to a mid-potency steroid while the efficacy is not significantly different from betamethasone dipropionate lotion, a class I steroid.7 Hypothalamic-pituitary-adrenal axis suppression was similar following a 4-week treatment course compared to a 2-week course of the lotion formulation.8
The newest agent, halobetasol propionate lotion 0.01%, was approved for treatment of psoriasis in October 2018. Compared to halobetasol 0.05% cream or ointment, halobetasol propionate lotion 0.01% has one-fifth the concentration of the active ingredient with the same degree of success in efficacy scores.9 This reduction in drug concentration is possible because the proprietary lotion base allows for better drug delivery of the active ingredient. Importantly, HPA axis suppression was assessed over an 8-week period of use and no suppression was noted.9 Generic class I steroids should only be used for 2 weeks, which is the standard treatment period used in comparator trials; however, many patients will still have active lesions on their body after 2 weeks of treatment, and if using generic clobetasol or betamethasone dipropionate, the choice becomes whether to keep applying the medication and risk HPA axis suppression and cutaneous side effects or switch to a less effective treatment. However, some of the newer agents are indicated for 4 to 8 weeks of treatment.
Utilizing other classes of agents such as retinoids and keratolytics in our treatment armamentarium for psoriasis often is helpful. It has long been known that tazarotene can be combined with topical steroids for increased efficacy and limitation of the irritating effects of the retinoid.10 Similarly, keratolytics play a role in allowing a topically applied medication to penetrate deep enough to affect the underlying inflammation of psoriasis. Medications that include salicylic acid or urea may help to remove ostraceous scales from thick psoriasis lesions that would otherwise prevent delivery of topical steroids to achieve clinically meaningful results. For scalp psoriasis, there are salicylic acid solutions as well as newer agents such as a dimethicone-based topical product.11
Nonsteroidal topical anti-inflammatories also have been used off label for psoriasis treatment. These agents are especially useful in patients who were not successfully treated with calcipotriene or need adjunctive therapy. Although not extremely effective against plaque psoriasis, topical tacrolimus in particular seems to have a place in the treatment of inverse psoriasis where it can be utilized without concern for long-term side effects.12 Crisaborole ointment, a topical medication approved for treatment of atopic dermatitis, was studied in phase 2 trials, but development has not progressed for a psoriasis indication.13 It is reasonable to consider this medication in the same way that tacrolimus has been used, however, considering that the mechanism of action—phosphodiesterase type 4 inhibition—has successfully been implemented in an oral medication to treat psoriasis, apremilast.
There are numerous topical medications in the pipeline that are being developed to treat psoriasis. Of them, the most relevant is a fixed-dose combination of halobetasol propionate 0.01% and tazarotene 0.045% in a proprietary lotion vehicle. A decision from the US Food and Drug Administration is expected in the first quarter of 2019. This medication capitalizes on the aforementioned synergistic effects of tazarotene and a superpotent topical steroid to achieve improved efficacy. Similar to halobetasol lotion 0.01%, this product was evaluated over an 8-week period, and no HPA axis suppression was observed. Efficacy was significantly improved versus both placebo and either halobetasol or tazarotene alone.14
Overall, it is promising that after a long period of relative stagnancy, we have numerous new agents available and upcoming for the topical treatment of psoriasis. For the vast majority of patients, topical medications still represent the mainstay of treatment, and it is important that we have access to better, safer medications in this category.
- Murage MJ, Kern DM, Chang L, et al. Treatment patterns among patients with psoriasis using a large national payer database in the United States: a retrospective study [published online October 25, 2018]. J Med Econ. doi:10.1080/13696998.2018.1540424.
- Clobex [package insert]. Fort Worth, TX: Galderma Laboratories, LP; 2005.
- Ohman EM, Rogers S, Meenan FO, et al. Adrenal suppression following low-dose topical clobetasol propionate. J R Soc Med. 1987;80:422-424.
- Kerner M, Ishay A, Ziv M, et al. Evaluation of the pituitary-adrenal axis function in patients on topical steroid therapy. J Am Acad Dermatol. 2011;65:215-216.
- Stein Gold L, Lebwohl M, Menter A, et al. Aerosol foam formulation of fixed combination calcipotriene plus betamethasone dipropionate is highly efficacious in patients with psoriasis vulgaris: pooled data from three randomized controlled studies. J Drugs Dermatol. 2016;15:951-957.
- Paul C, Bang B, Lebwohl M. Fixed combination calcipotriol plus betamethasone dipropionate aerosol foam in the treatment of psoriasis vulgaris: rationale for development and clinical profile. Expert Opin Pharmacother. 2017;18:115-121.
- Fowler JF Jr, Hebert AA, Sugarman J. DFD-01, a novel medium potency betamethasone dipropionate 0.05% emollient spray, demonstrates similar efficacy to augmented betamethasone dipropionate 0.05% lotion for the treatment of moderate plaque psoriasis. J Drugs Dermatol. 2016;15:154-162.
- Sidgiddi S, Pakunlu RI, Allenby K. Efficacy, safety, and potency of betamethasone dipropionate spray 0.05%: a treatment for adults with mildto-moderate plaque psoriasis. J Clin Aesthet Dermatol. 2018;11:14-22.
- Kerdel FA, Draelos ZD, Tyring SK, et al. A phase 2, multicenter, doubleblind, randomized, vehicle-controlled clinical study to compare the safety and efficacy of a halobetasol propionate 0.01% lotion and halobetasol propionate 0.05% cream in the treatment of plaque psoriasis [published online November 5, 2018]. J Dermatolog Treat. doi:10.1080/09 546634.2018.1523362.
- Lebwohl M, Poulin Y. Tazarotene in combination with topical corticosteroids. J Am Acad Dermatol. 1998;39(4 pt 2):S139-S143.
- Hengge UR, Roschmann K, Candler H. Single-center, noninterventional clinical trial to assess the safety, efficacy, and tolerability of a dimeticone-based medical device in facilitating the removal of scales after topical application in patients with psoriasis corporis or psoriasis capitis. Psoriasis (Auckl). 2017;7:41-49.
- Malecic N, Young H. Tacrolimus for the management of psoriasis: clinical utility and place in therapy. Psoriasis (Auckl). 2016;6:153-163.
- Nazarian R, Weinberg JM. AN-2728, a PDE4 inhibitor for the potential topical treatment of psoriasis and atopic dermatitis. Curr Opin Investig Drugs. 2009;10:1236-1242.
- Gold LS, Lebwohl MG, Sugarman JL, et al. Safety and efficacy of a fixed combination of halobetasol and tazarotene in the treatment of moderate-to-severe plaque psoriasis: results of 2 phase 3 randomized controlled trials. J Am Acad Dermatol. 2018;79:287-293.
In an era when we have access to a dizzying array of biologics for psoriasis treatment, it is easy to forget that topical therapies are still the bread and butter of treatment. For the majority of patients living with psoriasis, topical treatment is the only therapy they receive; indeed, a recent study examining a large national payer database found that 86% of psoriasis patients were managed with topical medications only.1 Thus, it is extremely important to understand how to optimize topical treatments, recognize pitfalls in management, and utilize newer agents that can been added to our treatment armamentarium for psoriasis.
In general, steroids have been the mainstay of topical treatment of psoriasis. Their broad anti-inflammatory activity works well against both the visible signs and symptoms of psoriasis as well as the underlying inflammatory milieu of the disease; however, these treatments are not without their downsides. Hypothalamic-pituitary-adrenal (HPA) axis suppression, especially in higher-potency topical steroids, is a serious concern that limits their use. In one study comparing lotion and cream formulations of clobetasol propionate, HPA axis suppression was seen in 80% (8/10) of adults in the lotion group and 30% (3/10) in the cream group after 4 weeks of treatment.2 These findings are not new; a 1987 study found that patients using less than 50 g of topical clobetasol per week, which is considered a low dose, could still exhibit HPA axis suppression.3 Severe HPA axis suppression may occur; one study of various topical steroids found some degree of HPA axis suppression in 38% (19/50) of patients, with a direct correlation with topical steroid potency.4 Additionally, cutaneous side effects such as striae formation, atrophy, and the possibility of tachyphylaxis must be considered. Various treatment regimens have been developed to limit topical steroid use, including steroid-sparing medications (eg, calcipotriene) used in conjunction with topical steroids, systemic treatments (eg, phototherapy) added on, or higher-potency topical steroids rotated with lower-potency steroids. Implementing other agents, such as topical retinoids or keratolytics, into the treatment regimen also is an important consideration in the overall approach to topical psoriasis therapy.
Notably, a number of newly approved topical treatments for psoriasis have emerged, and more are in the pipeline. When evaluating these agents, important considerations include safety, length of treatment course, and efficacy. Several of these agents hold promise for patients with psoriasis.
An alcohol-free, fixed-combination aerosol foam formulation of calcipotriene 0.005% and betamethasone dipropionate 0.064% was approved by the US Food and Drug Administration for plaque psoriasis in 2015. This agent was shown to be more efficacious than the same combination of active ingredients in an ointment formulation as well as either agent alone, with psoriasis area and severity index 75 response achieved in more than 50% of patients at week 4 of treatment.5 Notably, this product offers once-daily application with positive patient satisfaction scores.6 The novelty of this foam is in its ability to supersaturate the active ingredients on the surface of the skin with improved penetration and drug delivery.
A novel spray formulation of betamethasone dipropionate 0.05% also has been developed and has been compared to augmented betamethasone dipropionate lotion. One benefit of this spray is that, based on the vasoconstriction test, the potency is similar to a mid-potency steroid while the efficacy is not significantly different from betamethasone dipropionate lotion, a class I steroid.7 Hypothalamic-pituitary-adrenal axis suppression was similar following a 4-week treatment course compared to a 2-week course of the lotion formulation.8
The newest agent, halobetasol propionate lotion 0.01%, was approved for treatment of psoriasis in October 2018. Compared to halobetasol 0.05% cream or ointment, halobetasol propionate lotion 0.01% has one-fifth the concentration of the active ingredient with the same degree of success in efficacy scores.9 This reduction in drug concentration is possible because the proprietary lotion base allows for better drug delivery of the active ingredient. Importantly, HPA axis suppression was assessed over an 8-week period of use and no suppression was noted.9 Generic class I steroids should only be used for 2 weeks, which is the standard treatment period used in comparator trials; however, many patients will still have active lesions on their body after 2 weeks of treatment, and if using generic clobetasol or betamethasone dipropionate, the choice becomes whether to keep applying the medication and risk HPA axis suppression and cutaneous side effects or switch to a less effective treatment. However, some of the newer agents are indicated for 4 to 8 weeks of treatment.
Utilizing other classes of agents such as retinoids and keratolytics in our treatment armamentarium for psoriasis often is helpful. It has long been known that tazarotene can be combined with topical steroids for increased efficacy and limitation of the irritating effects of the retinoid.10 Similarly, keratolytics play a role in allowing a topically applied medication to penetrate deep enough to affect the underlying inflammation of psoriasis. Medications that include salicylic acid or urea may help to remove ostraceous scales from thick psoriasis lesions that would otherwise prevent delivery of topical steroids to achieve clinically meaningful results. For scalp psoriasis, there are salicylic acid solutions as well as newer agents such as a dimethicone-based topical product.11
Nonsteroidal topical anti-inflammatories also have been used off label for psoriasis treatment. These agents are especially useful in patients who were not successfully treated with calcipotriene or need adjunctive therapy. Although not extremely effective against plaque psoriasis, topical tacrolimus in particular seems to have a place in the treatment of inverse psoriasis where it can be utilized without concern for long-term side effects.12 Crisaborole ointment, a topical medication approved for treatment of atopic dermatitis, was studied in phase 2 trials, but development has not progressed for a psoriasis indication.13 It is reasonable to consider this medication in the same way that tacrolimus has been used, however, considering that the mechanism of action—phosphodiesterase type 4 inhibition—has successfully been implemented in an oral medication to treat psoriasis, apremilast.
There are numerous topical medications in the pipeline that are being developed to treat psoriasis. Of them, the most relevant is a fixed-dose combination of halobetasol propionate 0.01% and tazarotene 0.045% in a proprietary lotion vehicle. A decision from the US Food and Drug Administration is expected in the first quarter of 2019. This medication capitalizes on the aforementioned synergistic effects of tazarotene and a superpotent topical steroid to achieve improved efficacy. Similar to halobetasol lotion 0.01%, this product was evaluated over an 8-week period, and no HPA axis suppression was observed. Efficacy was significantly improved versus both placebo and either halobetasol or tazarotene alone.14
Overall, it is promising that after a long period of relative stagnancy, we have numerous new agents available and upcoming for the topical treatment of psoriasis. For the vast majority of patients, topical medications still represent the mainstay of treatment, and it is important that we have access to better, safer medications in this category.
- Murage MJ, Kern DM, Chang L, et al. Treatment patterns among patients with psoriasis using a large national payer database in the United States: a retrospective study [published online October 25, 2018]. J Med Econ. doi:10.1080/13696998.2018.1540424.
- Clobex [package insert]. Fort Worth, TX: Galderma Laboratories, LP; 2005.
- Ohman EM, Rogers S, Meenan FO, et al. Adrenal suppression following low-dose topical clobetasol propionate. J R Soc Med. 1987;80:422-424.
- Kerner M, Ishay A, Ziv M, et al. Evaluation of the pituitary-adrenal axis function in patients on topical steroid therapy. J Am Acad Dermatol. 2011;65:215-216.
- Stein Gold L, Lebwohl M, Menter A, et al. Aerosol foam formulation of fixed combination calcipotriene plus betamethasone dipropionate is highly efficacious in patients with psoriasis vulgaris: pooled data from three randomized controlled studies. J Drugs Dermatol. 2016;15:951-957.
- Paul C, Bang B, Lebwohl M. Fixed combination calcipotriol plus betamethasone dipropionate aerosol foam in the treatment of psoriasis vulgaris: rationale for development and clinical profile. Expert Opin Pharmacother. 2017;18:115-121.
- Fowler JF Jr, Hebert AA, Sugarman J. DFD-01, a novel medium potency betamethasone dipropionate 0.05% emollient spray, demonstrates similar efficacy to augmented betamethasone dipropionate 0.05% lotion for the treatment of moderate plaque psoriasis. J Drugs Dermatol. 2016;15:154-162.
- Sidgiddi S, Pakunlu RI, Allenby K. Efficacy, safety, and potency of betamethasone dipropionate spray 0.05%: a treatment for adults with mildto-moderate plaque psoriasis. J Clin Aesthet Dermatol. 2018;11:14-22.
- Kerdel FA, Draelos ZD, Tyring SK, et al. A phase 2, multicenter, doubleblind, randomized, vehicle-controlled clinical study to compare the safety and efficacy of a halobetasol propionate 0.01% lotion and halobetasol propionate 0.05% cream in the treatment of plaque psoriasis [published online November 5, 2018]. J Dermatolog Treat. doi:10.1080/09 546634.2018.1523362.
- Lebwohl M, Poulin Y. Tazarotene in combination with topical corticosteroids. J Am Acad Dermatol. 1998;39(4 pt 2):S139-S143.
- Hengge UR, Roschmann K, Candler H. Single-center, noninterventional clinical trial to assess the safety, efficacy, and tolerability of a dimeticone-based medical device in facilitating the removal of scales after topical application in patients with psoriasis corporis or psoriasis capitis. Psoriasis (Auckl). 2017;7:41-49.
- Malecic N, Young H. Tacrolimus for the management of psoriasis: clinical utility and place in therapy. Psoriasis (Auckl). 2016;6:153-163.
- Nazarian R, Weinberg JM. AN-2728, a PDE4 inhibitor for the potential topical treatment of psoriasis and atopic dermatitis. Curr Opin Investig Drugs. 2009;10:1236-1242.
- Gold LS, Lebwohl MG, Sugarman JL, et al. Safety and efficacy of a fixed combination of halobetasol and tazarotene in the treatment of moderate-to-severe plaque psoriasis: results of 2 phase 3 randomized controlled trials. J Am Acad Dermatol. 2018;79:287-293.

NASH: Fastest-growing cause of liver cancer in transplant candidates
Nonalcoholic steatohepatitis may soon supplant chronic hepatitis C as the leading cause of hepatocellular carcinoma among patients awaiting liver transplantation, according to the findings of a national longitudinal registry study.

The proportion of affected patients with nonalcoholic steatohepatitis (NASH) rose nearly 700% between 2002 and 2017 (P less than .0001), making NASH the only etiology to significantly rise in prevalence, reported Zobair Younossi, MD, MPH, of Inova Health System in Falls Church, Va., and his associates. Chronic hepatitis C remained the most common cause of liver cancer during the study period, but its prevalence fell by more than 10% in the last 3 years (2014-2017). These trends reflect the advent of “new, highly effective antiviral regimens” for hepatitis C, the global epidemic of obesity and metabolic syndrome, and the urgent need for effective, safe treatments for NASH, they wrote in Clinical Gastroenterology and Hepatology.
Historically, hepatocellular carcinoma is usually caused by chronic hepatitis C or B infection, but the global rise of obesity and type 2 diabetes mellitus has led to epidemic levels of NASH, a progressive form of nonalcoholic fatty liver disease that lacks useful predictive noninvasive biomarkers or safe treatments. This phenomenon, coupled with the advent of new, often-curative treatments for viral hepatitis, is making NASH a leading driver of both fibrosis and liver transplantation in the United States. To compare trends in liver cancer etiologies among transplant candidates, Dr. Younossi and his associates analyzed data on 158,347 adults who were wait-listed between 2002 and 2017 and captured by the national Scientific Registry of Transplant Recipients.
A total of 26,121 (16.5%) patients awaiting liver transplant had hepatocellular carcinoma. This proportion nearly quadrupled over the study period, from 6% to 23% (P less than .0001) and rose significantly (P less than .0001) for all liver cancer etiologies (hepatitis C and B, alcoholic liver disease, and NASH). However, the absolute rise in prevalence was far greater for NASH (1050%) than for chronic hepatitis C (more than 500%) or any other etiology.
Furthermore, while most (65%) liver cancer cases involved chronic hepatitis C, the proportion of cases involving NASH rose from 2% in 2002 to 18% in 2017 (P less than .0001). By 2017, NASH topped alcoholic liver disease, comorbid hepatitis C with alcoholic liver disease, and chronic hepatitis B as an etiology of hepatocellular carcinoma among patients listed for transplant. Conversely, by 2017, less than 50% of liver cancers were caused by hepatitis C – a more than 10% drop from 2014. Over the study period, NASH was the only etiology whose prevalence significantly increased among transplant-listed patients with hepatocellular carcinoma.
In this study, etiology of liver cancer did not seem to affect the likelihood of either death or transplantation. However, serious cardiovascular disease or late-stage cancer diagnosis might exclude many NASH patients from transplantation, the researchers wrote. “Thus, the population reported here actually may underestimate the true proportion of hepatocellular carcinoma cases related to nonalcoholic fatty liver disease and NASH in the United States. Because NASH is on a trajectory to become the most common cause of hepatocellular carcinoma in the United States, effective prevention strategies and treatment options are urgently needed for this currently underserved patient population.”
Minneapolis Medical Research Foundation is the contractor for the registry and supplied the data. Dr. Younossi reported ties to Bristol-Myers Squibb, Gilead Sciences, AbbVie, Intercept Pharmaceuticals, and GlaxoSmithKline.
SOURCE: Younossi Z et al. Clin Gastroenterol Hepatol. 2018 Jun 14. doi: 10.1016/j.cgh.2018.05.057.
Nonalcoholic steatohepatitis may soon supplant chronic hepatitis C as the leading cause of hepatocellular carcinoma among patients awaiting liver transplantation, according to the findings of a national longitudinal registry study.
The proportion of affected patients with nonalcoholic steatohepatitis (NASH) rose nearly 700% between 2002 and 2017 (P less than .0001), making NASH the only etiology to significantly rise in prevalence, reported Zobair Younossi, MD, MPH, of Inova Health System in Falls Church, Va., and his associates. Chronic hepatitis C remained the most common cause of liver cancer during the study period, but its prevalence fell by more than 10% in the last 3 years (2014-2017). These trends reflect the advent of “new, highly effective antiviral regimens” for hepatitis C, the global epidemic of obesity and metabolic syndrome, and the urgent need for effective, safe treatments for NASH, they wrote in Clinical Gastroenterology and Hepatology.
Historically, hepatocellular carcinoma is usually caused by chronic hepatitis C or B infection, but the global rise of obesity and type 2 diabetes mellitus has led to epidemic levels of NASH, a progressive form of nonalcoholic fatty liver disease that lacks useful predictive noninvasive biomarkers or safe treatments. This phenomenon, coupled with the advent of new, often-curative treatments for viral hepatitis, is making NASH a leading driver of both fibrosis and liver transplantation in the United States. To compare trends in liver cancer etiologies among transplant candidates, Dr. Younossi and his associates analyzed data on 158,347 adults who were wait-listed between 2002 and 2017 and captured by the national Scientific Registry of Transplant Recipients.
A total of 26,121 (16.5%) patients awaiting liver transplant had hepatocellular carcinoma. This proportion nearly quadrupled over the study period, from 6% to 23% (P less than .0001) and rose significantly (P less than .0001) for all liver cancer etiologies (hepatitis C and B, alcoholic liver disease, and NASH). However, the absolute rise in prevalence was far greater for NASH (1050%) than for chronic hepatitis C (more than 500%) or any other etiology.
Furthermore, while most (65%) liver cancer cases involved chronic hepatitis C, the proportion of cases involving NASH rose from 2% in 2002 to 18% in 2017 (P less than .0001). By 2017, NASH topped alcoholic liver disease, comorbid hepatitis C with alcoholic liver disease, and chronic hepatitis B as an etiology of hepatocellular carcinoma among patients listed for transplant. Conversely, by 2017, less than 50% of liver cancers were caused by hepatitis C – a more than 10% drop from 2014. Over the study period, NASH was the only etiology whose prevalence significantly increased among transplant-listed patients with hepatocellular carcinoma.
In this study, etiology of liver cancer did not seem to affect the likelihood of either death or transplantation. However, serious cardiovascular disease or late-stage cancer diagnosis might exclude many NASH patients from transplantation, the researchers wrote. “Thus, the population reported here actually may underestimate the true proportion of hepatocellular carcinoma cases related to nonalcoholic fatty liver disease and NASH in the United States. Because NASH is on a trajectory to become the most common cause of hepatocellular carcinoma in the United States, effective prevention strategies and treatment options are urgently needed for this currently underserved patient population.”
Minneapolis Medical Research Foundation is the contractor for the registry and supplied the data. Dr. Younossi reported ties to Bristol-Myers Squibb, Gilead Sciences, AbbVie, Intercept Pharmaceuticals, and GlaxoSmithKline.
SOURCE: Younossi Z et al. Clin Gastroenterol Hepatol. 2018 Jun 14. doi: 10.1016/j.cgh.2018.05.057.
FROM CLINICAL GASTROENTEROLOGY AND HEPATOLOGY
Key clinical point: Nonalcoholic steatohepatitis may soon become the leading cause of hepatocellular carcinoma among patients awaiting liver transplantation.
Major finding: The proportion of these patients with NASH rose nearly 700% between 2002 and 2017 (P less than .0001).
Study details: A longitudinal registry study of 26,121 patients listed for liver transplantation in the United States.
Disclosures: Minneapolis Medical Research Foundation is the contractor for the registry and supplied the data. Dr. Younossi reported ties to Bristol-Myers Squibb, Gilead Sciences, AbbVie, Intercept Pharmaceuticals, and GlaxoSmithKline.
Source: Younossi Z et al. Clin Gastroenterol Hepatol. 2018 Jun 14. doi: 10.1016/j.cgh.2018.05.057.
Making Veteran Homelessness “Rare and Brief”
All across the nation, community by community, states are doing better at making sure veterans have homes. According to the latest VA tally, 3 states (Connecticut, Delaware, and Virginia) and 66 communities have “effectively ended” veteran homelessness. The latest to join the list is Little Rock, Arkansas.
Since 2010, homelessness has been nearly halved; between years 2017 and 2018, it declined by 5%. The progress is due in large part to Home, Together, a program run by the VA with the Department of Housing and Urban Development, and other federal, state and local partners. Using HUD’s “targeted” housing vouchers and the VA’s homelessness programs (www.va.gov/homeless/for_homeless_veterans.asp), nearly 700,000 veterans and their family members have been permanently housed, rapidly rehoused, or prevented from falling into homelessness.
VA medical centers are key to helping drive down the homeless numbers, the VA says. For instance, the Central Arkansas Veterans Healthcare System collaborates with state and local government, nonprofits, corporate partners, and community members to find homes, jobs, transportation, and services for veterans. The VA health care resources form a “band of care,” the VA says, which provides a holistic support system, including for those experiencing homelessness.
“No American veteran should be without a safe and stable place to call home,” said VA Secretary Robert Wilkie. “We will continue this important work until we achieve a day when homelessness among veterans is rare and brief in every community across our country.”
Shifting Part B to D: Who saves?
Also today, there’s no single treatment for fibromyalgia, obesity-related cancers are increasing in younger adults, and pregnancy problems predict cardiovascular future.
Amazon Alexa
Apple Podcasts
Google Podcasts
Spotify
Also today, there’s no single treatment for fibromyalgia, obesity-related cancers are increasing in younger adults, and pregnancy problems predict cardiovascular future.
Amazon Alexa
Apple Podcasts
Google Podcasts
Spotify
Also today, there’s no single treatment for fibromyalgia, obesity-related cancers are increasing in younger adults, and pregnancy problems predict cardiovascular future.
Amazon Alexa
Apple Podcasts
Google Podcasts
Spotify

EVAR insights from the GREAT registry
CHICAGO – The Global Registry for Endovascular Aortic Treatment is a unique resource that, although still early in its planned 10-year follow-up period, has already yielded important insights into one of the hottest topics in endovascular repair of abdominal aortic aneurysms: that is, the impact of the proximal aortic neck, Clayton J. Brinster, MD, said at a symposium on vascular surgery sponsored by Northwestern University.

The Global Registry for Endovascular Aortic Treatment (GREAT) is a prospective, observational, real-world registry that enrolled more than 5,000 consecutive patients undergoing endovascular aortic repair (EVAR) in the United States, Europe, Australia, New Zealand, and Brazil before enrollment closed in October 2016.
GREAT is the largest stent graft registry in the world. One of its special features is that it has essentially no exclusion criteria. This enables researchers to compare outcomes in patients undergoing on-label EVAR using devices deployed within the official instructions for use (IFU) to results in real-world practice, which not infrequently entails treatment for nonstandard indications using devices outside the narrowly defined IFU generated via pivotal clinical trials, explained Dr. Brinster, a vascular surgeon at the Ochsner Clinic Foundation in New Orleans.
The biggest limitation of GREAT is that it’s sponsored by Gore and restricted to recipients of GORE thoracic and abdominal stent grafts. However, the registry has an oversight and safety monitoring board that is independent of the company, Dr. Brinster continued.
He highlighted three recently published studies that have utilized early GREAT data to examine the impact on EVAR outcomes of various features of the proximal aortic neck.
Noncylindrical neck anatomy
An international team of investigators analyzed the incidence and impact of noncylindrical neck anatomy, defined as a 2-mm or greater change in diameter over the first 15 mm of proximal aortic neck length. Of 3,077 GREAT participants treated with the Gore Excluder endograft, 1,312, or 43%, had an hourglass, tapered, or conical neck shape that qualified as noncylindrical. Noncylindrical necks were more common in women. Fifteen percent of patients with a noncylindrical neck received the device outside the Excluder IFU, as did 11% with a cylindrical neck.
After an average follow-up of about 20 months, the noncylindrical neck group had a 3.1% rate of device-related intervention, significantly better than the 4.9% rate in patients with a cylindrical neck. In a multivariate regression analysis, female gender and maximum abdominal aortic aneurysm diameter were significant risk factors for device-related or endoleak-specific reintervention; noncylindrical neck morphology was not. Indeed, women were 2.2-fold more likely to require device-related reintervention than men (J Vasc Surg. 2018; 68[6]:1714-24).
Large proximal aortic neck
Of 3,166 consecutive patients in GREAT, 37.6% had a large aortic neck diameter, defined as 25 mm or wider. The rate of 5-year freedom from type Ia endoleak was 96.8% in the large-neck group, significantly less than the 98.6% rate in patients with a normal aortic neck diameter. Of note, rates didn’t diverge until after 2 years of follow-up, emphasizing the need for careful long-term surveillance despite initial technical success.
The 5-year rate of freedom from the primary composite endpoint of type Ia endoleak, reintervention, aortic rupture, or isolated aortic-related mortality was also significantly worse in the large-neck group: 81.3% versus 87%. Moreover, the 5-year survival rate was only 64.6% in the large–aortic neck group, compared with 76.5% in the comparator arm, even though aortic-related mortality didn’t differ between the two groups. “The findings raise the question of whether young patients, with predicted life expectancies exceeding 10 years, should receive standard endovascular intervention if they have large aortic neck diameters at baseline (Eur J Vasc Endovasc Surg. 2018;56[2]:189-99).
Severe neck angulation
Australian investigators wondered if the IFU for the Gore C3 Excluder was overly restrictive in defining abdominal aortic aneurysms with necks greater than 60 degrees as off-label for the device. In the first 1,394 patients enrolled in GREAT, the researchers identified 127 (9.2%) who exhibited more than 60 and less than 140 degrees of neck angulation and didn’t require endoanchors for proximal fixation. Their mean neck angle was 78 degrees, with a mean neck length of 29 mm. Mean graft oversizing was 23.5%, which was also outside the Excluder IFU.
During a median follow-up of 236 days there were 7 type Ia endoleaks, for an incidence of 5.6%. The degree of neck angulation, neck length, and the amount of oversizing were not associated with endoleak (Ann Vasc Surg. 2018;49:152-57). However, Dr. Brinster wants to see longer follow-up data before he is prepared to accept that a mean 23.5% graft oversizing is a benign intervention.
“One must remember that, with that percentage of oversizing in an already abnormal neck, aortic neck dilation could be a significant problem longer term,” the vascular surgeon said.
Dr. Brinster reported having no conflicts regarding his presentation.
[email protected]
CHICAGO – The Global Registry for Endovascular Aortic Treatment is a unique resource that, although still early in its planned 10-year follow-up period, has already yielded important insights into one of the hottest topics in endovascular repair of abdominal aortic aneurysms: that is, the impact of the proximal aortic neck, Clayton J. Brinster, MD, said at a symposium on vascular surgery sponsored by Northwestern University.
The Global Registry for Endovascular Aortic Treatment (GREAT) is a prospective, observational, real-world registry that enrolled more than 5,000 consecutive patients undergoing endovascular aortic repair (EVAR) in the United States, Europe, Australia, New Zealand, and Brazil before enrollment closed in October 2016.
GREAT is the largest stent graft registry in the world. One of its special features is that it has essentially no exclusion criteria. This enables researchers to compare outcomes in patients undergoing on-label EVAR using devices deployed within the official instructions for use (IFU) to results in real-world practice, which not infrequently entails treatment for nonstandard indications using devices outside the narrowly defined IFU generated via pivotal clinical trials, explained Dr. Brinster, a vascular surgeon at the Ochsner Clinic Foundation in New Orleans.
The biggest limitation of GREAT is that it’s sponsored by Gore and restricted to recipients of GORE thoracic and abdominal stent grafts. However, the registry has an oversight and safety monitoring board that is independent of the company, Dr. Brinster continued.
He highlighted three recently published studies that have utilized early GREAT data to examine the impact on EVAR outcomes of various features of the proximal aortic neck.
Noncylindrical neck anatomy
An international team of investigators analyzed the incidence and impact of noncylindrical neck anatomy, defined as a 2-mm or greater change in diameter over the first 15 mm of proximal aortic neck length. Of 3,077 GREAT participants treated with the Gore Excluder endograft, 1,312, or 43%, had an hourglass, tapered, or conical neck shape that qualified as noncylindrical. Noncylindrical necks were more common in women. Fifteen percent of patients with a noncylindrical neck received the device outside the Excluder IFU, as did 11% with a cylindrical neck.
After an average follow-up of about 20 months, the noncylindrical neck group had a 3.1% rate of device-related intervention, significantly better than the 4.9% rate in patients with a cylindrical neck. In a multivariate regression analysis, female gender and maximum abdominal aortic aneurysm diameter were significant risk factors for device-related or endoleak-specific reintervention; noncylindrical neck morphology was not. Indeed, women were 2.2-fold more likely to require device-related reintervention than men (J Vasc Surg. 2018; 68[6]:1714-24).
Large proximal aortic neck
Of 3,166 consecutive patients in GREAT, 37.6% had a large aortic neck diameter, defined as 25 mm or wider. The rate of 5-year freedom from type Ia endoleak was 96.8% in the large-neck group, significantly less than the 98.6% rate in patients with a normal aortic neck diameter. Of note, rates didn’t diverge until after 2 years of follow-up, emphasizing the need for careful long-term surveillance despite initial technical success.
The 5-year rate of freedom from the primary composite endpoint of type Ia endoleak, reintervention, aortic rupture, or isolated aortic-related mortality was also significantly worse in the large-neck group: 81.3% versus 87%. Moreover, the 5-year survival rate was only 64.6% in the large–aortic neck group, compared with 76.5% in the comparator arm, even though aortic-related mortality didn’t differ between the two groups. “The findings raise the question of whether young patients, with predicted life expectancies exceeding 10 years, should receive standard endovascular intervention if they have large aortic neck diameters at baseline (Eur J Vasc Endovasc Surg. 2018;56[2]:189-99).
Severe neck angulation
Australian investigators wondered if the IFU for the Gore C3 Excluder was overly restrictive in defining abdominal aortic aneurysms with necks greater than 60 degrees as off-label for the device. In the first 1,394 patients enrolled in GREAT, the researchers identified 127 (9.2%) who exhibited more than 60 and less than 140 degrees of neck angulation and didn’t require endoanchors for proximal fixation. Their mean neck angle was 78 degrees, with a mean neck length of 29 mm. Mean graft oversizing was 23.5%, which was also outside the Excluder IFU.
During a median follow-up of 236 days there were 7 type Ia endoleaks, for an incidence of 5.6%. The degree of neck angulation, neck length, and the amount of oversizing were not associated with endoleak (Ann Vasc Surg. 2018;49:152-57). However, Dr. Brinster wants to see longer follow-up data before he is prepared to accept that a mean 23.5% graft oversizing is a benign intervention.
“One must remember that, with that percentage of oversizing in an already abnormal neck, aortic neck dilation could be a significant problem longer term,” the vascular surgeon said.
Dr. Brinster reported having no conflicts regarding his presentation.
[email protected]
EXPERT ANALYSIS FROM THE NORTHWESTERN VASCULAR SYMPOSIUM
Long-term budesonide oral suspension well tolerated in EoE
Treatment with budesonide oral suspension (BOS) was generally well tolerated and maintained a histologic response in some patients with eosinophilic esophagitis (EoE), according to the results of the 24-week, open-label extension phase of a multicenter, randomized, placebo-controlled, industry-sponsored trial.
Rates of histologic response (up to 6 eosinophils per high-power field) were “modest” – 23% among patients who stayed on BOS throughout the study and 48.5% among patients who initiated BOS after 12 weeks on placebo, reported Evan S. Dellon, MD, MPH, of the University of North Carolina in Chapel Hill and his associates. However, these rates “need to be viewed in the context of a highly symptomatic and histologically severe population with eosinophilic esophagitis,” they contended. A total of 11% of budesonide initiators developed esophageal candidiasis, they reported in Clinical Gastroenterology and Hepatology.
Budesonide oral suspension is a mucoadherent formulation of topical corticosteroid that has recently been developed to treat EoE. Previously, during the randomized, double-blind component of this phase 2 trial, 93 patients aged 11-40 years with active EoE and dysphagia received either BOS (2 mg) or placebo twice daily (Gastroenterology. 2017 Mar;157[4]:776-86). After 12 weeks, rates of histologic response were 39% for BOS versus 3% for placebo, and BOS significantly improved patients’ mean peak eosinophil count and scores on the Dysphagia Symptom Questionnaire, compared with baseline and compared with the response in the placebo group. During the open-label extension phase, 45 BOS continuers and 37 BOS initiators received 2 mg once daily for 12 weeks and then had the option to increase the BOS dose to 1.5-2.0 mg twice daily.
The rate of drug-related adverse events was 19% among BOS initiators and 4% among BOS continuers. One patient in each group developed oral candidiasis, while four BOS initiators (11%) developed esophageal candidiasis. Three BOS continuers had subnormal morning cortisol levels; while these were subclinical cases, they merit attention since long-term corticosteroids for EoE have been linked with possible hypothalamic–pituitary–adrenal axis suppression, the researchers noted.
In addition, while BOS initiators tended to maintain their endoscopic response, only 42% of those with an initial histologic response maintained a histologic response after 36 weeks of treatment or when leaving the study. Post hoc analyses confirmed that prolonged BOS treatment does not increase the chances of histologic or endoscopic response. Prior studies have suggested that EoE can become steroid-refractory over time and that certain molecular and histologic markers might predict resistance, the investigators noted.
Meritage Pharma (now part of Shire) was involved in the study design and conduct, data collection and management, and manuscript review. Dr. Dellon disclosed research funding from Meritage and Shire and a consulting relationship with Shire, along with ties to several other pharmaceutical companies. All six coinvestigators also disclosed ties to Meritage, Shire, or both, and two are Shire employees and stockholders.
*This story was updated on Feb. 7, 2019.
SOURCE: Dellon ES et al. Clin Gastroenterol Hepatol. 2018 Jun 11. doi: 10.1016/j.cgh.2018.05.051.
Guidelines regarding the management of eosinophilic esophagitis (EoE) with topical steroids are still unclear with regard to dosing and duration. Here, Dellon et al. present evidence that long-term budesonide oral suspension (BOS) therapy is safe and efficacious. Both the BOS and placebo cohorts of the initial, 12-week trial demonstrated clinical and histologic improvement on BOS over this 24-week period, with few adverse events. Maintenance of histologic response was only seen in 42% in initial BOS responders, suggesting steroid tolerance or resistance may develop. Another important observation was that peak eosinphil count decreased steroid dosing.

Finally, these data support the notion that initial responders are unlikely to gain response with continued therapy and may be better served with early transition to alternatives. Further research is needed to clarify these issues and which patients may be predisposed to nonresponse or loss of response.
Reena V. Chokshi, MD , is assistant professor of medicine in the department of gastroenterology at Baylor College of Medicine, Houston.
Guidelines regarding the management of eosinophilic esophagitis (EoE) with topical steroids are still unclear with regard to dosing and duration. Here, Dellon et al. present evidence that long-term budesonide oral suspension (BOS) therapy is safe and efficacious. Both the BOS and placebo cohorts of the initial, 12-week trial demonstrated clinical and histologic improvement on BOS over this 24-week period, with few adverse events. Maintenance of histologic response was only seen in 42% in initial BOS responders, suggesting steroid tolerance or resistance may develop. Another important observation was that peak eosinphil count decreased steroid dosing.
Finally, these data support the notion that initial responders are unlikely to gain response with continued therapy and may be better served with early transition to alternatives. Further research is needed to clarify these issues and which patients may be predisposed to nonresponse or loss of response.
Reena V. Chokshi, MD , is assistant professor of medicine in the department of gastroenterology at Baylor College of Medicine, Houston.
Treatment with budesonide oral suspension (BOS) was generally well tolerated and maintained a histologic response in some patients with eosinophilic esophagitis (EoE), according to the results of the 24-week, open-label extension phase of a multicenter, randomized, placebo-controlled, industry-sponsored trial.
Rates of histologic response (up to 6 eosinophils per high-power field) were “modest” – 23% among patients who stayed on BOS throughout the study and 48.5% among patients who initiated BOS after 12 weeks on placebo, reported Evan S. Dellon, MD, MPH, of the University of North Carolina in Chapel Hill and his associates. However, these rates “need to be viewed in the context of a highly symptomatic and histologically severe population with eosinophilic esophagitis,” they contended. A total of 11% of budesonide initiators developed esophageal candidiasis, they reported in Clinical Gastroenterology and Hepatology.
Budesonide oral suspension is a mucoadherent formulation of topical corticosteroid that has recently been developed to treat EoE. Previously, during the randomized, double-blind component of this phase 2 trial, 93 patients aged 11-40 years with active EoE and dysphagia received either BOS (2 mg) or placebo twice daily (Gastroenterology. 2017 Mar;157[4]:776-86). After 12 weeks, rates of histologic response were 39% for BOS versus 3% for placebo, and BOS significantly improved patients’ mean peak eosinophil count and scores on the Dysphagia Symptom Questionnaire, compared with baseline and compared with the response in the placebo group. During the open-label extension phase, 45 BOS continuers and 37 BOS initiators received 2 mg once daily for 12 weeks and then had the option to increase the BOS dose to 1.5-2.0 mg twice daily.
The rate of drug-related adverse events was 19% among BOS initiators and 4% among BOS continuers. One patient in each group developed oral candidiasis, while four BOS initiators (11%) developed esophageal candidiasis. Three BOS continuers had subnormal morning cortisol levels; while these were subclinical cases, they merit attention since long-term corticosteroids for EoE have been linked with possible hypothalamic–pituitary–adrenal axis suppression, the researchers noted.
In addition, while BOS initiators tended to maintain their endoscopic response, only 42% of those with an initial histologic response maintained a histologic response after 36 weeks of treatment or when leaving the study. Post hoc analyses confirmed that prolonged BOS treatment does not increase the chances of histologic or endoscopic response. Prior studies have suggested that EoE can become steroid-refractory over time and that certain molecular and histologic markers might predict resistance, the investigators noted.
Meritage Pharma (now part of Shire) was involved in the study design and conduct, data collection and management, and manuscript review. Dr. Dellon disclosed research funding from Meritage and Shire and a consulting relationship with Shire, along with ties to several other pharmaceutical companies. All six coinvestigators also disclosed ties to Meritage, Shire, or both, and two are Shire employees and stockholders.
*This story was updated on Feb. 7, 2019.
SOURCE: Dellon ES et al. Clin Gastroenterol Hepatol. 2018 Jun 11. doi: 10.1016/j.cgh.2018.05.051.
FROM CLINICAL GASTROENTEROLOGY AND HEPATOLOGY
Key clinical point: Budesonide oral suspension was well tolerated and maintained a histologic response in some patients with eosinophilic esophagitis.
Major finding: A total of 42% of initial histologic responders maintained a histologic response (less than 6 eosinophils per high-power field) after 24 weeks. Treatment was generally well tolerated, but 11% of initiators developed esophageal candidiasis.
Study details: Open-label extension study of a 12-week, multicenter, randomized, double-blind, placebo-controlled trial.
Disclosures: Meritage Pharma (now part of Shire) was involved in the study design and conduct, data collection and management, and manuscript review. Dr. Dellon disclosed research funding from Meritage and Shire and a consulting relationship with Shire, along with ties to several other pharmaceutical companies. All six coinvestigators also disclosed ties to Meritage, Shire, or both, and two are Shire employees and stockholders.
Source: Dellon ES et al. Clin Gastroenterol Hepatol. 2018 Jun 11. https://doi.org/10.1016/j.cgh.2018.05.051
Compounded pain creams no better than placebo creams in localized chronic pain
Specially formulated topical pain creams are no better than placebo creams for relieving localized chronic pain, according to results from a double-blind, randomized, placebo-controlled trial.

Study authors led by Robert E. Brutcher, PharmD, PhD, of Walter Reed National Military Medical Center in Bethesda, Md., said their findings published Feb. 4 in Annals of Internal Medicine suggest compounded pain creams should not be routinely used for chronic pain conditions.
The researchers noted that the use of compounded topical pain creams has increased dramatically despite “weak evidence” supporting their efficacy to treat localized pain, and this is particularly the case in military personnel, where the authors said treatments without central effect may be particularly beneficial because “opioid therapy may render a service member nondeployable and medications that affect the central nervous system may have a negative effect on judgment and motor skills.”
They noted a report from the U.S. Government Accountability Office that showed Tricare’s pharmacy benefits program paid $259 million for compounded medications in the 2013 fiscal year, a figure that increased to $746 million in 2014.
“The soaring costs, coupled with sparse efficacy data prompted the Defense Health Agency to evaluate this issue,” they wrote.
The objectives of the current study were to assess the efficacy of compounded pain creams for chronic pain conditions and determine whether efficacy differed for the various pain classifications.
“We hypothesized that, compared with placebo, compounded topical pain creams would provide greater pain relief and functional improvement,” they said.
The randomized trial involved 133 patients diagnosed with neuropathic pain, 133 with nociceptive pain, and 133 with mixed pain who had attended pain clinics at Walter Reed. Patients were aged between 18 and 90 years and had localized pain in the face, back or buttocks, neck, abdomen, chest, groin, or in up to two extremities. To be included in the study, they were also required to have an average pain score of 4 or greater on a 0- to 10-point numerical rating scale during the preceding week and have symptoms lasting longer than 6 weeks.
Patients in all three pain subgroups were randomized in a 1:1 ratio to receive either a compounded pain cream or a placebo cream. The authors noted that their “pain cream formulations were selected on the basis of accepted systemic indications for neuropathic and nociceptive pain.”
The formulation given to participants with neuropathic pain (n = 68) contained 10% ketamine, 6% gabapentin, 0.2% clonidine, and 2% lidocaine. The patients with nociceptive pain (n = 66) received a cream with 10% ketoprofen, 2% baclofen, 2% cyclobenzaprine, and 2% lidocaine. Those with mixed pain (n = 68) were given a cream containing 10% ketamine, 6% gabapentin, 3% diclofenac, 2% baclofen, 2% cyclobenzaprine, and 2% lidocaine. The authors said the concentrations of individual medications were based on previous trials that evaluated topical use.
The patients, who had a mean age across the groups that ranged from 48 to 57 years, applied cream to affected areas three times per day, with the amount dispensed determined by the size of the area experiencing pain. About half of the patients were women.
The primary outcome measures were an average pain score 1 month after treatment. A positive categorical response was a reduction in pain score of 2 or more points coupled with a score above 3 on a 5-point satisfaction scale. Secondary outcomes included Short Form-36 Health Survey scores, satisfaction, and categorical response. Participants with a positive outcome were followed to 3 months.
Change in the primary outcome of average pain score at 1 month did not differ between the active cream and placebo groups for any type of pain classification. The change was only –0.1 points (95% confidence interval, –0.8 to 0.5 points) for neuropathic pain, –0.3 points (95% CI, –0.9 to 0.2 points) for nociceptive pain, and –0.3 points (95% CI, –0.9 to 0.2 points) for mixed pain.
Among all patients combined, an overall change in average pain scores of –0.3 points (95% CI, –0.6 to 0.1 points) that favored the active-ingredient cream also did not differ between the treatment and placebo groups.
“The lower 95% confidence bounds for the 1-month between-group differences were all 0.9 points or less and excluded clinically meaningful benefits with the compounded topical pain cream,” the authors wrote.
Secondary outcomes also did not differ between the two study groups for any type of pain classification or for the entire cohort.
“Although participants in both treatment and control groups had improvement in their pain throughout the study, no significant differences were observed in pain scores, functional improvement, or satisfaction in the cohort or in any subgroup,” the authors concluded.
They noted that their findings were consistent with previous studies that also showed a lack of efficacy for most topical pain creams.
While some randomized trials have suggested positive findings for capsaicin, lidocaine, and NSAIDs, the authors noted that they did not find a similar benefit in their study population.
“Administered as stand-alone agents, lidocaine and NSAIDs may alleviate pain, although the effect size is small and the number needed to treat is large,” they wrote.
“Considering the increased costs of using a non–FDA-approved and regulated compounded cream rather than a single agent, we caution against routine use of compounded creams for chronic pain,” they wrote.
They noted that their study had several limitations, including that conventional treatments had failed in some of the participants before they enrolled in the study, increasing the likelihood that subsequent therapy would not be effective.
The authors suggested that future studies should aim to establish whether targeting specific types of pain or adding other agents like dimethyl sulfoxide would result in better outcomes.
The Centers for Rehabilitation Sciences Research in the U.S. Department of Defense’s Defense Health Agency funded the study. Two authors reported receiving grants and personal fees from several pharmaceutical companies.
SOURCE: Brutcher RE et al. Ann Intern Med. 2019 Feb 4. doi: 10.7326/M18-2736.
Specially formulated topical pain creams are no better than placebo creams for relieving localized chronic pain, according to results from a double-blind, randomized, placebo-controlled trial.
Study authors led by Robert E. Brutcher, PharmD, PhD, of Walter Reed National Military Medical Center in Bethesda, Md., said their findings published Feb. 4 in Annals of Internal Medicine suggest compounded pain creams should not be routinely used for chronic pain conditions.
The researchers noted that the use of compounded topical pain creams has increased dramatically despite “weak evidence” supporting their efficacy to treat localized pain, and this is particularly the case in military personnel, where the authors said treatments without central effect may be particularly beneficial because “opioid therapy may render a service member nondeployable and medications that affect the central nervous system may have a negative effect on judgment and motor skills.”
They noted a report from the U.S. Government Accountability Office that showed Tricare’s pharmacy benefits program paid $259 million for compounded medications in the 2013 fiscal year, a figure that increased to $746 million in 2014.
“The soaring costs, coupled with sparse efficacy data prompted the Defense Health Agency to evaluate this issue,” they wrote.
The objectives of the current study were to assess the efficacy of compounded pain creams for chronic pain conditions and determine whether efficacy differed for the various pain classifications.
“We hypothesized that, compared with placebo, compounded topical pain creams would provide greater pain relief and functional improvement,” they said.
The randomized trial involved 133 patients diagnosed with neuropathic pain, 133 with nociceptive pain, and 133 with mixed pain who had attended pain clinics at Walter Reed. Patients were aged between 18 and 90 years and had localized pain in the face, back or buttocks, neck, abdomen, chest, groin, or in up to two extremities. To be included in the study, they were also required to have an average pain score of 4 or greater on a 0- to 10-point numerical rating scale during the preceding week and have symptoms lasting longer than 6 weeks.
Patients in all three pain subgroups were randomized in a 1:1 ratio to receive either a compounded pain cream or a placebo cream. The authors noted that their “pain cream formulations were selected on the basis of accepted systemic indications for neuropathic and nociceptive pain.”
The formulation given to participants with neuropathic pain (n = 68) contained 10% ketamine, 6% gabapentin, 0.2% clonidine, and 2% lidocaine. The patients with nociceptive pain (n = 66) received a cream with 10% ketoprofen, 2% baclofen, 2% cyclobenzaprine, and 2% lidocaine. Those with mixed pain (n = 68) were given a cream containing 10% ketamine, 6% gabapentin, 3% diclofenac, 2% baclofen, 2% cyclobenzaprine, and 2% lidocaine. The authors said the concentrations of individual medications were based on previous trials that evaluated topical use.
The patients, who had a mean age across the groups that ranged from 48 to 57 years, applied cream to affected areas three times per day, with the amount dispensed determined by the size of the area experiencing pain. About half of the patients were women.
The primary outcome measures were an average pain score 1 month after treatment. A positive categorical response was a reduction in pain score of 2 or more points coupled with a score above 3 on a 5-point satisfaction scale. Secondary outcomes included Short Form-36 Health Survey scores, satisfaction, and categorical response. Participants with a positive outcome were followed to 3 months.
Change in the primary outcome of average pain score at 1 month did not differ between the active cream and placebo groups for any type of pain classification. The change was only –0.1 points (95% confidence interval, –0.8 to 0.5 points) for neuropathic pain, –0.3 points (95% CI, –0.9 to 0.2 points) for nociceptive pain, and –0.3 points (95% CI, –0.9 to 0.2 points) for mixed pain.
Among all patients combined, an overall change in average pain scores of –0.3 points (95% CI, –0.6 to 0.1 points) that favored the active-ingredient cream also did not differ between the treatment and placebo groups.
“The lower 95% confidence bounds for the 1-month between-group differences were all 0.9 points or less and excluded clinically meaningful benefits with the compounded topical pain cream,” the authors wrote.
Secondary outcomes also did not differ between the two study groups for any type of pain classification or for the entire cohort.
“Although participants in both treatment and control groups had improvement in their pain throughout the study, no significant differences were observed in pain scores, functional improvement, or satisfaction in the cohort or in any subgroup,” the authors concluded.
They noted that their findings were consistent with previous studies that also showed a lack of efficacy for most topical pain creams.
While some randomized trials have suggested positive findings for capsaicin, lidocaine, and NSAIDs, the authors noted that they did not find a similar benefit in their study population.
“Administered as stand-alone agents, lidocaine and NSAIDs may alleviate pain, although the effect size is small and the number needed to treat is large,” they wrote.
“Considering the increased costs of using a non–FDA-approved and regulated compounded cream rather than a single agent, we caution against routine use of compounded creams for chronic pain,” they wrote.
They noted that their study had several limitations, including that conventional treatments had failed in some of the participants before they enrolled in the study, increasing the likelihood that subsequent therapy would not be effective.
The authors suggested that future studies should aim to establish whether targeting specific types of pain or adding other agents like dimethyl sulfoxide would result in better outcomes.
The Centers for Rehabilitation Sciences Research in the U.S. Department of Defense’s Defense Health Agency funded the study. Two authors reported receiving grants and personal fees from several pharmaceutical companies.
SOURCE: Brutcher RE et al. Ann Intern Med. 2019 Feb 4. doi: 10.7326/M18-2736.
FROM ANNALS OF INTERNAL MEDICINE
Key clinical point: Compounded pain creams should not be routinely used to treat chronic localized pain.
Major finding: At 1 month, the researchers found no significant differences in pain scores, functional improvement, or satisfaction between study participants with localized pain who had received specifically formulated pain creams and those who had received a placebo cream.
Study details: This double-blind, randomized, controlled trial involved 399 patients with localized pain who received either a pain cream specifically compounded for their type of pain – neuropathic, nociceptive, or mixed – or a placebo cream.
Disclosures: The Centers for Rehabilitation Sciences Research in the U.S. Department of Defense’s Defense Health Agency funded the study. Two authors reported receiving grants and personal fees from several pharmaceutical companies.
Source: Brutcher RE et al. Ann Intern Med. 2019 Feb 4. doi: 10.7326/M18-2736.