User login
Does reduced degradation of insulin by the liver cause type 2 diabetes?
LOS ANGELES –
That’s a hypothesis that Richard N. Bergman, PhD, and his colleagues are testing in his lab at the Sports Spectacular Diabetes and Obesity Wellness and Research Center at Cedars-Sinai Medical Center, Los Angeles.
“More than 50% of insulin secreted into the portal vein is degraded by the liver and never enters the systemic circulation,” Dr. Bergman said at the World Congress on Insulin Resistance, Diabetes & Cardiovascular Disease. “We have found that if you make an animal insulin resistant with a high fat diet, they degrade less of the insulin. Why is that? They deliver a higher fraction of the insulin into the systemic circulation. One of the answers is that the liver is a gateway for insulin delivery to the systemic circulation.” In fact, when he and his colleagues tested a population of normal dogs, they found wide variability in the ability of the liver to take up and degrade insulin (Diabetes. 2018 67[8]:1495-503).
“It ranged from 20% to 70%; I didn’t believe these data,” said Dr. Bergman, who is also chair in diabetes research at Cedars-Sinai. “We had to redo the study and the same thing was true. There’s a wide variation in what fraction of insulin that enters the liver is degraded. That led to the idea that this could be true in humans.”
To follow up on this concept, he and his colleagues used data from 100 African immigrants without diabetes to develop a model to estimate hepatic versus extrahepatic insulin clearance in humans (Diabetes. 2016;65[6]:1556-64). “This population was chosen because previous studies have suggested that individuals of African descent have reduced hepatic insulin clearance compared with Western subjects,” the authors wrote in the article. “Similarly, FSIGT [frequently sampled intravenous glucose tolerance test] data from two groups showed that African American women had much higher plasma insulin concentrations than European American women during periods of elevated endogenous secretion but not after intravenous insulin infusion, also suggesting reduced hepatic, but not extrahepatic, insulin clearance in African American subjects. Thus, this population was of special interest for applying a model that could quantify both hepatic and extrahepatic insulin clearance.”
The model was able to reproduce accurately the full plasma insulin profiles observed during the FSIGT and identify clear differences in parameter values among individuals. “The ability of the liver to degrade insulin is very variable across a normal human population,” Dr. Bergman said. “That means this may be a controlled variable.”
In a separate analysis of 23 African American and 23 European American women, Dr. Bergman, Francesca Piccinini, PhD, Barbara A. Gower, PhD, and colleagues found that hepatic but not extrahepatic insulin clearance is lower in the African American women, compared with their European American counterparts (Diabetes. 2017;66[10]:2564-70). Data from a cohort of children found the same thing (Diabetes Obes & Metab. 2018 Jul 18. doi: 10.1111/dom.13471).
“What does this mean that different ethnic groups have different clearance of insulin?” he asked. “It means that African Americans deliver a higher fraction of secreted insulin into the systemic circulation. We know that African Americans tend to be hyperinsulinemic. That isn’t necessarily due to oversecretion of insulin; it’s likely due primarily to reduced degradation of insulin. The question then is, can the reduced insulin clearance play a causal role in the pathogenesis of type 2 diabetes?”
He hypothesized that, in normal individuals, half of insulin secreted by the pancreas is exported into the systemic circulation and half is degraded. “We propose that in people at risk for diabetes, insulin is secreted by the pancreas but much less of it is degraded,” Dr. Bergman continued. “Insulin gets into the systemic circulation, so then you can get hyperinsulinemia, and insulin resistance. The resistance stresses the beta cells of the pancreas. Thus, the idea is that differences in clearance of insulin by the liver in some individuals may be pathogenic in the cause of diabetes.”
Dr. Bergman reported that he has done consulting/collaboration with Janssen, January, Novo Nordisk, and Zafgen. He has also received research grants from Astra Zeneca, Janssen, and the National Institutes of Health.
EXPERT ANALYSIS FROM WCIRDC 2018
BMI changes in adolescence linked to later cancer risk
Adiposity changes during adolescence are more strongly associated with ovarian cancer risk than changes in adiposity during adulthood, according to data from the Nurses’ Health Study.
Among the 133,526 women followed prospectively in the observational study, investigators documented 562 incident ovarian cancers in the first cohort (1980-2012) and 226 in the second cohort (1989-2013) during 32 years of follow-up. Body mass index (BMI) changes that occurred between age 10 and 18 years was strongly positively associated with ovarian cancer risk (hazard Ratio, 1.24; 95% confidence interval, 1.11-1.39; P = .0002), compared with a slight association with risk for BMI change after age 18 years (HR, 1.06; 95% CI, 0.99-1.14; P = .10), Tianyi Huang, ScD, of Harvard Medical School, Boston, and his associates reported in Annals of Oncology.
The association between adolescent BMI changes and ovarian cancer risk was stronger for premenopausal cases (HR, 2.41; 95% CI, 1.38-4.19; P = .002), compared with postmenopausal cases (HR, 1.31; 95% CI, 0.90-1.92; P = .16), and suggestively stronger for nonserous tumors versus serous ovarian tumors.
For BMI change between age 10 and 18 years, the HR for every 5 kg/m2 increase was 1.35 (1.10, 1.65) for nonserous cancer and 1.08 (0.90, 1.28) for serous cancer (P = .10).
“This study provides additional evidence to support that maintaining a healthy weight throughout the life course may have moderate benefits on ovarian cancer prevention, particularly nonserous subtypes diagnosed during premenopausal years,” the authors wrote. “Further studies are needed to understand the specific mechanisms linking peripubertal adiposity and adult ovarian cancer risk.”
SOURCE: Huang T et al. Ann Oncol. 2018 Dec 21. doi: 10.1093/annonc/mdy546.
FROM ANNALS OF ONCOLOGY
Key clinical point:
Major finding: The pooled hazard ratio associated with a body mass index increase between age 10 and 18 years was 1.24 (95% CI: 1.11-1.39; P = .0002), compared with 1.06 (95% CI: 0.99-1.14; P = .10) for BMI change after age 18 years.
Study details: A prospective observational study of 133,526 women in the Nurses’ Health Study.
Disclosures: The study was supported by a grant from the National Institute of Health. The authors reported having no conflicts of interest.
Source: Huang T et al. Ann Oncol. 2018 Dec 21. doi: 10.1093/annonc/mdy546.
Growing lesion

The FP recognized this as squamous cell carcinoma (SCC) of the penis.
The FP knew that a biopsy would be needed to confirm his clinical impression and obtained informed consent for a shave biopsy of a portion of the lesion. While the FP was taught in medical school to never use epinephrine on the penis, he realized that this was merely a myth (see “Biopsies for skin cancer detection: Dispelling the myths”). He injected 1% lidocaine with epinephrine into the lesion for anesthesia and to minimize bleeding during the shave biopsy. (See the Watch & Learn video on “Shave biopsy.”) The FP performed a shave biopsy of a small portion of the lesion farthest from the urethra.
Aluminum chloride was used to stop most of the bleeding, but since the penis is very vascular, some electrocoagulation was needed to stop all of the bleeding. The pathology came back as an invasive SCC. Due to the location of the lesion on the glans and around the urethra, the patient was referred to Urology.
A partial penectomy was performed and clear surgical margins were achieved. If the lesion had been on the shaft of the penis (rather than the glans penis), a Mohs surgeon would have attempted to save the whole penis with tissue sparing surgery.
Photo courtesy of Jeff Meffert, MD, and text courtesy of Richard P. Usatine, MD. This case was adapted from: Karnes J, Usatine R. Squamous cell carcinoma. In: Usatine R, Smith M, Mayeaux EJ, et al. Color Atlas of Family Medicine. 2nd ed. New York, NY: McGraw-Hill; 2013:999-1007.
To learn more about the newest 3rd edition of the Color Atlas and Synopsis of Family Medicine, see: https://www.amazon.com/Color-Atlas-Synopsis-Family-Medicine/dp/1259862046/
You can get the Color Atlas of Family Medicine app by clicking on this link: usatinemedia.com

Think outside lower body for pelvic pain
Also today, treating obstructive sleep apnea with positive airway pressure decreased amyloid levels, spending on medical marketing increased by more than $12 billion over that past two decades, and one expert has advice on how you can get your work published.
Amazon Alexa
Apple Podcasts
Google Podcasts
Spotify

Most oral HRT linked to increased VTE risk
Transdermal hormone replacement therapy is associated with the lowest risk of venous thromboembolism, yet still is relatively underused compared to oral preparations, researchers say.
Writing in the BMJ, Yana Vinogradova, PhD, of the University of Nottingham (England) and her associates reported the results of two nested case-control studies of hormone replacement therapy (HRT) and venous thromboembolism (VTE) from Jan. 1998 to Feb. 2017 that altogether included 80,396 women aged 40-79 years with a primary diagnosis of VTE matched to 391,494 female controls.
Overall, 7% of the women with VTE had been exposed to HRT in the 90 days before the index date versus 5.5% of controls.
The greatest increase in risk of VTE, compared with no exposure, was seen with oral conjugated equine estrogen with medroxyprogesterone acetate, which was associated with a more than twofold increase in risk (odds ratio, 2.10; 95% confidence interval, 1.92-2.31; P less than .01).
However transdermal HRT use was not associated with any increase in risk, compared with no HRT exposure. The data even pointed to a slight decrease in risk, which the authors suggested may be the result of some residual confounding or indication bias.
Oral HRT generally was associated with a 58% increased risk of VTE, which amounted to a number needed to harm of 1,076 and nine extra cases of VTE per 10,000 women taking oral HRT.
Dr. Vinogradova and her colleagues noted that the vast majority of women in the study were being prescribed oral HRT for menopausal symptoms despite previous studies showing transdermal HRT has much lower risk.
“When women with menopausal symptoms already have an increased VTE risk because of comorbidities or obesity, these women and their doctors should give greater consideration to transdermal HRT,” they wrote.
Lubna Pal, MBBS, director of the menopause program and professor of obstetrics, gynecology, and reproductive sciences at Yale University, New Haven, Conn., commented in an interview, “These data are tremendously reassuring. The reported findings are: 1) reaffirm what we have already known , i.e. that advancing age, higher body mass index, and higher doses of exogenous systemic estrogen therapy are associated with increased risk for VTE; 2) offer greater granularity in risk for VTE with different formulations of estrogens and progestins and different regimens than understood thus far, 3) reaffirm that, unlike oral estrogen, transdermal estrogen formulations in doses commonly utilized in clinical practice are not associated with VTE risk, and 4) provide reassurance that the absolute risk, while exaggerated with oral estrogen or combination estrogen and progestin use, is nonetheless small as reflected in the number needed to harm with oral hormone therapy being 1,076, and the number of extra VTE cases attributable to oral HT being 9 per 10,000 woman years.
“The authors are to be commended on this massive analytic undertaking that allows an improved understanding of HRT-related risk for VTE and offers meaningful guidance to the practitioner,” said Dr. Pal, who was not involved in the study.*
Estrogen-only preparations had a 40% higher risk and combined preparations had a 73% higher risk, compared with no exposure.
In estrogen-only preparations, the lowest risk was seen with estradiol, compared with conjugated equine estrogens or combined preparations.
The lowest risk of VTE among oral preparations was seen with estradiol plus dydrogesterone, which only showed a nonsignificant 18% increase in risk.
In an attempt to account for possible increased risk of VTE, the authors conducted a sensitivity analysis in a subgroup of women who had not previously used anticoagulants, but they found similar results to the main analysis.
“This sensitivity analysis indicates that most of the excluded women had probably used anticoagulants because of atrial fibrillation or hip replacement operations rather than an earlier unrecorded VTE,” they wrote.
One author declared directorship of a clinical software company, but no other conflicts of interest were declared. There was no external funding. Dr. Pal reported that she was a coinvestigator in the Kronos Early Estrogen Prevention Study and on an AMAG Pharmaceuticals advisory board and member of their speaker’s bureau.
SOURCE: Vinogradova Y et al. BMJ. 2019 Jan 9. doi: 10.1136/bmj.k4810.
*This article was updated 1/11/19.
FROM THE BMJ
Key clinical point: Transdermal HRT is not associated with any increase in VTE risk.
Major finding: Conjugated equine estrogen with medroxyprogesterone shows a twofold increase in VTE risk.
Study details: Nested case-control study in 80,396 women and 391,494 female controls.
Disclosures: One author declared directorship of a clinical software company, but no other conflicts of interest were declared. There was no external funding. Dr. Pal reported that she was a coinvestigator in the Kronos Early Estrogen Prevention Study and on an AMAG Pharmaceuticals advisory board and member of their speaker’s bureau.
Source: Vinogradova Y et al. BMJ. 2019 Jan 9. doi: 10.1136/bmj.k4810

Torrent Pharmaceuticals expands losartan recall
Torrent Pharmaceuticals is expanding its recall of losartan potassium tablets from 2 lots to 12 lots, according to a Safety Alert from the Food and Drug Administration.

The recall was based on the discovery of N-nitrosodiethylamine (NDEA) above recommended levels in seven 100-mg lots of losartan, four 50-mg lots, and one 25-mg lot. NDEA is a naturally occurring substance that has been classified as a probable human carcinogen by the International Agency for Research on Cancer. Torrent Pharmaceuticals has not reported any adverse events related to the recall.
Losartan currently is indicated to treat hypertension, hypertensive patients with left ventricular hypertrophy, and nephropathy in type 2 diabetic patients. Patients who are taking losartan should continue to do so, as stopping treatment without an alternative could represent a greater health risk.
“Patients should contact their pharmacist or physician who can advise them about an alternative treatment prior to returning their medication,” the FDA said in the press release.
Find the full press release on the FDA website.
Torrent Pharmaceuticals is expanding its recall of losartan potassium tablets from 2 lots to 12 lots, according to a Safety Alert from the Food and Drug Administration.
The recall was based on the discovery of N-nitrosodiethylamine (NDEA) above recommended levels in seven 100-mg lots of losartan, four 50-mg lots, and one 25-mg lot. NDEA is a naturally occurring substance that has been classified as a probable human carcinogen by the International Agency for Research on Cancer. Torrent Pharmaceuticals has not reported any adverse events related to the recall.
Losartan currently is indicated to treat hypertension, hypertensive patients with left ventricular hypertrophy, and nephropathy in type 2 diabetic patients. Patients who are taking losartan should continue to do so, as stopping treatment without an alternative could represent a greater health risk.
“Patients should contact their pharmacist or physician who can advise them about an alternative treatment prior to returning their medication,” the FDA said in the press release.
Find the full press release on the FDA website.
Mismanaged labor is top legal claim against ob.gyns
Negligent management of labor is the top cause of lawsuits against ob.gyns, a study of legal claims shows.
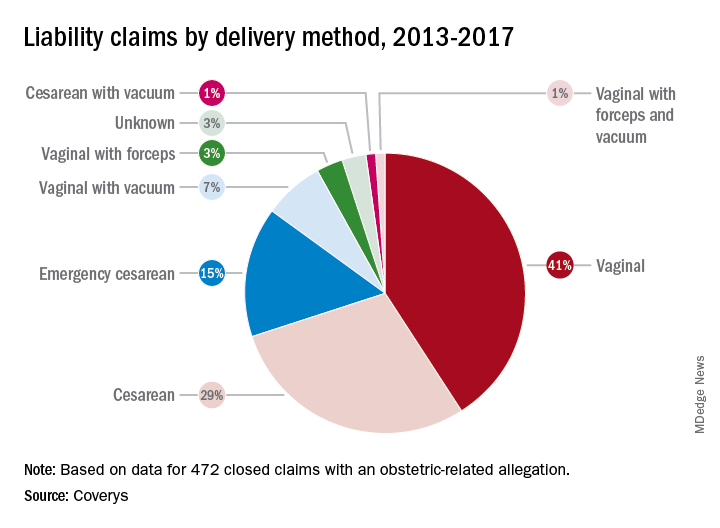
Researchers with national medical liability insurer, Coverys, analyzed 472 ob.gyn.–related claims from their database that closed between 2013 and 2017. Of the claims, 37% stemmed from alleged negligence during labor management, while 14% resulted from inappropriate management of pregnancy, and 12% were associated with negligent patient monitoring. And 11% resulted from an alleged delay in performing cesarean section, according to the report.
More than half of the obstetric-related claims involved patients with at least one known comorbidity (58%), most commonly diabetes and obesity. Hypertension was the third most frequent risk factor associated with patient claims, followed by post-40 week gestation and macrosomia. Vaginal births were responsible for more claims than cesarean sections (52% vs. 45%); vaginal births also resulted in more than three times as many claims as did emergency cesareans.
Nearly all obstetrics claims resulted in injuries or death to babies (90%), with 41% of claims associated with neurologic injuries, 37% related to shoulder dystocia/brachial plexus injuries, and 34% ending in fetal demise, including stillbirth. Other claims included congenital injuries, chorioamnionitis, and lacerations/contusions.
Of 60 claims that included communication breakdowns as a key factor, 28% were associated with communication failures between physicians, while 28% were associated with communication breakdowns between doctors and nurses. Of the communication mishap cases, 17% were associated with communication failures among physicians and mid-level providers and 10% were associated with breakdowns in communication between physicians and patients.
The Coverys report includes guidance for ob.gyns. on reducing their legal risk when caring for patients in labor. Some primary tips include:
- Require fetal heart rate (FHR) interpretation training. All obstetric providers and staff should undergo training on the interpretation of FHR patterns before treating obstetric patients.
- Strengthen communication. Health professionals should use the same language when describing electronic fetal-monitoring patterns. Such terminology should be used consistently through all medical record entries and communications regarding patient cases.
- Craft and maintain fetal-monitoring policies. Develop evidence-based policies and procedures around fetal monitoring during labor that outline when each type of monitoring should be used based on each patient case and circumstance.
- Keep doctors informed. Develop protocols that ensure physicians remain in the loop regarding the condition of the patient and which includes communication strategies for contacting doctors when the patient’s condition changes or requires oversight.
Negligent management of labor is the top cause of lawsuits against ob.gyns, a study of legal claims shows.
Researchers with national medical liability insurer, Coverys, analyzed 472 ob.gyn.–related claims from their database that closed between 2013 and 2017. Of the claims, 37% stemmed from alleged negligence during labor management, while 14% resulted from inappropriate management of pregnancy, and 12% were associated with negligent patient monitoring. And 11% resulted from an alleged delay in performing cesarean section, according to the report.
More than half of the obstetric-related claims involved patients with at least one known comorbidity (58%), most commonly diabetes and obesity. Hypertension was the third most frequent risk factor associated with patient claims, followed by post-40 week gestation and macrosomia. Vaginal births were responsible for more claims than cesarean sections (52% vs. 45%); vaginal births also resulted in more than three times as many claims as did emergency cesareans.
Nearly all obstetrics claims resulted in injuries or death to babies (90%), with 41% of claims associated with neurologic injuries, 37% related to shoulder dystocia/brachial plexus injuries, and 34% ending in fetal demise, including stillbirth. Other claims included congenital injuries, chorioamnionitis, and lacerations/contusions.
Of 60 claims that included communication breakdowns as a key factor, 28% were associated with communication failures between physicians, while 28% were associated with communication breakdowns between doctors and nurses. Of the communication mishap cases, 17% were associated with communication failures among physicians and mid-level providers and 10% were associated with breakdowns in communication between physicians and patients.
The Coverys report includes guidance for ob.gyns. on reducing their legal risk when caring for patients in labor. Some primary tips include:
- Require fetal heart rate (FHR) interpretation training. All obstetric providers and staff should undergo training on the interpretation of FHR patterns before treating obstetric patients.
- Strengthen communication. Health professionals should use the same language when describing electronic fetal-monitoring patterns. Such terminology should be used consistently through all medical record entries and communications regarding patient cases.
- Craft and maintain fetal-monitoring policies. Develop evidence-based policies and procedures around fetal monitoring during labor that outline when each type of monitoring should be used based on each patient case and circumstance.
- Keep doctors informed. Develop protocols that ensure physicians remain in the loop regarding the condition of the patient and which includes communication strategies for contacting doctors when the patient’s condition changes or requires oversight.
Key clinical point: Consistent use of fetal-monitoring protocols is recommended to reduce potential legal risks.
Major finding Of 472 claims, 37% stemmed from alleged negligence during labor management.
Study details: Analysis of 472 ob.gyn.–related claims closed between 2013 and 2017.
Disclosures: Coverys is a national medical professional liability insurer.
Plerixafor produced dramatic responses in severe WHIM syndrome
Low-dose treatment with plerixafor, a CXC chemokine receptor 4 antagonist, was well tolerated and markedly improved severe presentations of warts, hypogammaglobulinemia, infections, and myelokathexis (WHIM) syndrome in three patients who could not receive granulocyte colony-stimulating factor therapy, investigators reported.
“Myelofibrosis, panleukopenia, anemia, and thrombocytopenia were ameliorated, the wart burden and frequency of infection declined, human papillomavirus–associated oropharyngeal squamous-cell carcinoma stabilized, and quality of life improved markedly,” David H. McDermott, MD, of the National Institute of Allergy and Infectious Diseases and his colleagues wrote in the New England Journal of Medicine.
WHIM syndrome is a primary immunodeficiency disorder characterized by panleukopenia and caused by autosomal dominant gain-of-function mutations in CXC chemokine receptor 4 (CXCR4). Granulocyte colony-stimulating factor (G-CSF) therapy improves neutropenia in these patients, but not other cytopenias.
Previously, the investigators treated three WHIM syndrome patients with plerixafor (Mozobil), which was well tolerated and led to sustained increases in circulating neutrophils, lymphocytes, and monocytes. The current report is of three patients with advanced WHIM syndrome who received open-label plerixafor because they were ineligible for a randomized trial of this drug.
After treatment initiation, infection frequency dropped by 85% in one patient and declined markedly in all three patients. Lymphocyte counts improved the most in two patients while neutrophils were most responsive in the third patient. Warts partially resolved in two patients, of which one patient also experienced partial resolution of head and neck squamous cell carcinoma. This patient later died of a multidrug-resistant Pseudomonas aeruginosa infection after undergoing a 9-hour surgery.
In the third patient, plerixafor therapy led to clearance of TSPyV and 17 human papillomavirus (HPV) infections, with consequent resolution of chronic, progressive, multifocal eczematoid and follicular lesions, the researchers reported. The study dose was relatively low – about 10% of the stem-cell mobilization dose – and did not cause bone pain or other treatment-emergent adverse events, despite the relatively long treatment course (19-52 months).
A separate, phase 3 trial (NCT02231879) has enrolled 19 patients. Primary results are expected in 2020.
The National Institutes of Health funded the work. Dr. McDermott reported a pending patent to reduce CXCR4 expression and/or function to enhance engraftment of hematopoietic stem cells.
SOURCE: McDermott DH et al. N Engl J Med. 2019;380:163-70.
FROM THE NEW ENGLAND JOURNAL OF MEDICINE
Key clinical point:
Major finding: Infection frequency dropped by 85% in one patient and showed marked declines in all three patients.
Study details: Open-label study of three patients who were ineligible to receive G-CSF therapy.
Disclosures: The National Institutes of Health funded the work. Dr. McDermott reported a pending patent on reducing CXCR4 expression and/or function to enhance engraftment of hematopoietic stem cells.
Source: McDermott DH et al. N Engl J Med. 2019;380:163-70.
RE-SPECT ESUS: Dabigatran matched aspirin for second stroke prevention
MONTREAL – For the second time in the past year, an anticoagulant failed to show superiority when it was compared with aspirin for preventing a second stroke in patients who had had an index embolic stroke of undetermined source (ESUS). But the most recent results gave a tantalizing suggestion that the anticoagulant approach might be effective for older patients, those at least 75 years old, possibly because these patients have the highest incidence of atrial fibrillation.

“The fact that we saw a treatment benefit in patients 75 and older [in a post hoc, subgroup analysis] means that development of atrial fibrillation (AF) is probably the most important factor,” Hans-Christoph Diener, MD, said at the World Stroke Congress. Another clue that incident AF drove a treatment benefit hidden in the new trial’s overall neutral result was that a post hoc, landmark analysis showed that, while the rate of second strokes was identical during the first year of follow-up in patients on either aspirin or the anticoagulant dabigatran (Pradaxa) after an index ESUS, patients on dabigatran had significantly fewer second strokes during subsequent follow-up.
More follow-up time was needed to see a benefit from anticoagulation because “it takes time for AF to develop, and then once a patient has AF, it takes time for a stroke to occur,” explained Dr. Diener, professor of neurology at the University of Duisburg-Essen in Essen, Germany.
The RE-SPECT ESUS (Dabigatran Etexilate for Secondary Stroke Prevention in Patients With Embolic Stroke of Undetermined Source) trial randomized 5,390 patients at more than 500 sites in 41 countries, including the United States, within 6 months of an index ESUS who had no history of AF and no severe renal impairment. All enrollees had to have less than 6 minutes of AF episodes during at least 20 hours of cardiac monitoring, and they had to be free of flow-limiting stenoses (50% or more) in arteries supplying their stroke region. Patients received either 150 mg or 110 mg of dabigatran twice daily depending on their age and renal function or 100 mg of aspirin daily. About a quarter of patients randomized to dabigatran received the lower dosage. The enrolled patients averaged 66 years old, almost two-thirds were men, and they started treatment a median of 44 days after their index stroke.
During a median 19 months’ follow-up, the incidence of a second stroke of any type was 4.1%/year among the patients on dabigatran and 4.8%/year among those on aspirin, a difference that was not statistically significant. However, the post hoc landmark analysis showed a significant reduction in second strokes with dabigatran treatment after the first year. In addition, a post hoc subgroup analysis showed that, among patients aged at least 75 years old, treatment with dabigatran linked with a statistically significant 37% reduction in second strokes, compared with treatment with aspirin, Dr. Diener reported.
The primary safety endpoint was major bleeds, as defined by the International Society on Thrombosis and Haemostasis, which occurred in 1.7%/year of patients on dabigatran and 1.4%/year of those on aspirin, a difference that was not statistically significant. Patients on dabigatran had a significant excess of major bleeds combined with clinically significant nonmajor bleeds: 3.3%/year versus 2.3%/year among those on aspirin.
A little over 4 months before Dr. Diener’s report, a separate research group published primary results from the NAVIGATE ESUS (Rivaroxaban Versus Aspirin in Secondary Prevention of Stroke and Prevention of Systemic Embolism in Patients With Recent Embolic Stroke of Undetermined Source) trial, which compared the anticoagulant rivaroxaban (Xarelto) with aspirin for prevention of a second stroke in 7,213 ESUS patients. The results showed no significant efficacy difference between rivaroxaban and aspirin (N Engl J Med. 2018 June 7;378[23]:2191-2201).
RE-SPECT ESUS was funded by Boehringer Ingelheim, the company that markets dabigatran (Pradaxa). Dr. Diener has been a consultant to and has received research funding from Boehringer Ingelheim, as well as several other companies.
SOURCE: Diener H-C et al. Int J Stroke. 2018;13(2_suppl):27. Abstract 100.
MONTREAL – For the second time in the past year, an anticoagulant failed to show superiority when it was compared with aspirin for preventing a second stroke in patients who had had an index embolic stroke of undetermined source (ESUS). But the most recent results gave a tantalizing suggestion that the anticoagulant approach might be effective for older patients, those at least 75 years old, possibly because these patients have the highest incidence of atrial fibrillation.
“The fact that we saw a treatment benefit in patients 75 and older [in a post hoc, subgroup analysis] means that development of atrial fibrillation (AF) is probably the most important factor,” Hans-Christoph Diener, MD, said at the World Stroke Congress. Another clue that incident AF drove a treatment benefit hidden in the new trial’s overall neutral result was that a post hoc, landmark analysis showed that, while the rate of second strokes was identical during the first year of follow-up in patients on either aspirin or the anticoagulant dabigatran (Pradaxa) after an index ESUS, patients on dabigatran had significantly fewer second strokes during subsequent follow-up.
More follow-up time was needed to see a benefit from anticoagulation because “it takes time for AF to develop, and then once a patient has AF, it takes time for a stroke to occur,” explained Dr. Diener, professor of neurology at the University of Duisburg-Essen in Essen, Germany.
The RE-SPECT ESUS (Dabigatran Etexilate for Secondary Stroke Prevention in Patients With Embolic Stroke of Undetermined Source) trial randomized 5,390 patients at more than 500 sites in 41 countries, including the United States, within 6 months of an index ESUS who had no history of AF and no severe renal impairment. All enrollees had to have less than 6 minutes of AF episodes during at least 20 hours of cardiac monitoring, and they had to be free of flow-limiting stenoses (50% or more) in arteries supplying their stroke region. Patients received either 150 mg or 110 mg of dabigatran twice daily depending on their age and renal function or 100 mg of aspirin daily. About a quarter of patients randomized to dabigatran received the lower dosage. The enrolled patients averaged 66 years old, almost two-thirds were men, and they started treatment a median of 44 days after their index stroke.
During a median 19 months’ follow-up, the incidence of a second stroke of any type was 4.1%/year among the patients on dabigatran and 4.8%/year among those on aspirin, a difference that was not statistically significant. However, the post hoc landmark analysis showed a significant reduction in second strokes with dabigatran treatment after the first year. In addition, a post hoc subgroup analysis showed that, among patients aged at least 75 years old, treatment with dabigatran linked with a statistically significant 37% reduction in second strokes, compared with treatment with aspirin, Dr. Diener reported.
The primary safety endpoint was major bleeds, as defined by the International Society on Thrombosis and Haemostasis, which occurred in 1.7%/year of patients on dabigatran and 1.4%/year of those on aspirin, a difference that was not statistically significant. Patients on dabigatran had a significant excess of major bleeds combined with clinically significant nonmajor bleeds: 3.3%/year versus 2.3%/year among those on aspirin.
A little over 4 months before Dr. Diener’s report, a separate research group published primary results from the NAVIGATE ESUS (Rivaroxaban Versus Aspirin in Secondary Prevention of Stroke and Prevention of Systemic Embolism in Patients With Recent Embolic Stroke of Undetermined Source) trial, which compared the anticoagulant rivaroxaban (Xarelto) with aspirin for prevention of a second stroke in 7,213 ESUS patients. The results showed no significant efficacy difference between rivaroxaban and aspirin (N Engl J Med. 2018 June 7;378[23]:2191-2201).
RE-SPECT ESUS was funded by Boehringer Ingelheim, the company that markets dabigatran (Pradaxa). Dr. Diener has been a consultant to and has received research funding from Boehringer Ingelheim, as well as several other companies.
SOURCE: Diener H-C et al. Int J Stroke. 2018;13(2_suppl):27. Abstract 100.
REPORTING FROM THE WORLD STROKE CONGRESS
Key clinical point:
Major finding: A second stroke occurred at 4.1%/year with dabigatran and 4.8%/year with aspirin, not a statistically significant difference.
Study details: RE-SPECT ESUS, an international randomized trial with 5,390 ESUS patients.
Disclosures: RE-SPECT ESUS was funded by Boehringer Ingelheim, the company that markets dabigatran (Pradaxa). Dr. Diener has been a consultant to and has received research funding from Boehringer Ingelheim, as well as several other companies.
Source: Diener H-C et al. Int J Stroke. 2018;13(2_suppl):27. Abstract 100.
Combat Dermatology: The Role of the Deployed Army Dermatologist
Military dermatologists complete their residency training at 1 of 3 large military medical centers across the country: Walter Reed National Military Medical Center (Bethesda, Maryland), San Antonio Military Health System (San Antonio, Texas), or Naval Medical Center San Diego (San Diego, California). While in training, army dermatology residents in particular fall under the US Army Medical Command, or MEDCOM, which provides command and control of the army’s medical, dental, and veterinary treatment facilities. Upon graduating from residency, army dermatologists often are stationed with MEDCOM units but become eligible for deployment with US Army Forces Command (FORSCOM) units to both combat and noncombat zones depending on each individual FORSCOM unit’s mission.
The process by which dermatologists and other army physicians are tasked to a deploying FORSCOM unit is referred to as the Professional Filler System, or PROFIS, which was designed to help alleviate the financial cost and specialty skill degradation of having a physician assigned to a FORSCOM unit while not deployed.1 In general, the greater the amount of time that an army medical officer has not been deployed, the more likely they are to be selected for deployment with a FORSCOM unit. For the army dermatologist, deployment often comes shortly after completing residency or fellowship.
In this article, we review the various functions of the deployed dermatologist and also highlight the importance of maintaining basic emergency medical skills that could be generalized to the civilian population in case of local or national emergencies.
THE FIELD SURGEON
With rare exceptions, the US Army does not deploy dermatologists for their expertise in diagnosing and managing cutaneous diseases. Typically, a dermatologist will be assigned to a FORSCOM unit in the role of field surgeon. Other medical specialties including emergency medicine, family practice, internal medicine, pediatrics, and obstetrics and gynecology also are eligible for deployment as field surgeons.2 Field surgeons typically are assigned to a battalion-sized element of 300 to 1000 soldiers and are responsible for all medical care rendered under their supervision. Duties include combat resuscitation, primary care services, preventive medicine, medical training of battalion medical personnel, and serving as the medical adviser to the battalion commander.1 In some instances, a field surgeon will be stationed at a higher level of care co-located with a trauma surgeon; in those cases, the field surgeon also may be expected to assist in trauma surgery cases.
ARMY DEPLOYMENT MEDICAL SYSTEM
To better understand the responsibilities of a field surgeon, it is important to discuss the structure of the army’s deployment medical system. The US Military, including the army, has adopted a system of “roles” that have specific requirements regarding their associated medical capabilities.3 There are 4 roles designated within the army. Role 1 facilities are known as battalion aid stations (BASs).

Role of the Field Surgeon
Within the broader structure of the army, approximately 5 battalions (each composed of 300 to 1000 soldiers) comprise a single brigade combat team. Role 1 medical facilities typically have a single battalion surgeon assigned to them. Field surgeons most commonly serve in this battalion surgeon position. Additionally, Role 2 facilities may have slots for up to 2 battalion surgeons; however, field surgeons are less commonly tasked with this assignment.1 Occasionally, in one author’s (N.R.M.) personal experience, these roles are more fluid than one might expect. A field surgeon tasked initially with a Role 1 position may be shifted to a Role 2 assignment on an as-needed basis. This ability for rapid change in roles and responsibilities underscores the need for a fluid mind-set and thorough predeployment training for the field surgeon.
PREDEPLOYMENT TRAINING
As one might expect, dermatologists who have just graduated residency or fellowship are unlikely to have honed their trauma support skills to the degree needed to support a deployed battalion actively engaging in combat. Fortunately, there are many opportunities for military dermatologists to practice these skills prior to joining their FORSCOM colleagues. The initial exposure to trauma support comes during medical internship at the mandatory Combat Casualty Care Course (C4), an 8-day program designed to enhance the operational medical readiness and predeployment trauma training skills of medical officers.4 The C4 program includes 3 days of classroom training and 5 days of intensive field training. During C4, medical officers become certified in Advanced Trauma Life Support, a 3-day course organized by the American College of Surgeons.5 This course teaches medical officers how to quickly and judiciously triage, treat, and transport patients who have sustained potentially life-threatening traumas.
The next components of predeployment training, Tactical Combat Casualty Care and Tactical Combat Medical Care, occur in the months to weeks immediately preceding deployment.1,6 Tactical Combat Casualty Care prepares participants in the initial stabilization of trauma to occur at the point of injury.6 Tactical Combat Casualty Care principles generally are employed by medics (enlisted personnel trained in point-of-care medical support) rather than physicians; however, these principles are still critical for medical officers to be aware of when encountering severe traumas.6 In addition, the physician is responsible for ensuring his/her medics are fully trained in Tactical Combat Casualty Care. Tactical Combat Medical Care is geared more toward the direct preparation of medical officers. During the 5-day course, medical officers learn the gold standard for trauma care in both the classroom and in hands-on scenarios.1 This training not only allows medical officers to be self-sufficient in providing trauma support, but it also enables them to better maintain quality control of the performance of their medics continuously throughout the deployment.1
DEPLOYMENT RESPONSIBILITIES
Dermatologists who have completed the above training typically are subsequently deployed as field surgeons to a Role 1 facility. Field surgeons are designated as the officer in charge of the BAS and assume the position of medical platoon leader. A field surgeon usually will have both a physician assistant and a field medical assistant/medical plans officer (MEDO) to assist in running the BAS. The overarching goal of the field surgeon is to maintain the health and readiness of the battalion. In addition to addressing the day-to-day health care needs of individual soldiers, a field surgeon is expected to attend all staff meetings, advise the commander on preventative health and epidemiological trends, identify the scope of practice of the medics, ensure the BAS is prepared for mass casualties, and take responsibility for all controlled substances.
To illustrate the value that the properly trained dermatologist can provide in the deployed setting, we will outline field surgeon responsibilities and provide case examples of the first-hand experiences of one of the authors (N.R.M.) as a Role 2 officer in charge and field surgeon. The information presented in the case examples may have been altered to ensure continued operational security and out of respect to US servicemembers and coalition forces while still conveying important learning points.
Sick Call
In the deployed environment, military sick call functions as an urgent care center that is open continuously and serves the active-duty population, US government civilians and contractors, and coalition forces. In general, the physician assistant should treat approximately two-thirds of sick call patients under the supervision of the field surgeon, allowing the field surgeon to focus on his/her ancillary duties and ensure overall medical supervision of the unit. As a safeguard, patients with more than 2 visits for the same concern must be evaluated by the field surgeon. Sick call concerns range from minor traumas and illnesses to much more serious disease processes and injuries (as outlined in Medical Emergencies). As a field surgeon, it is critical to track disease nonbattle illnesses to ensure medical readiness of the unit. In the deployed environment, close quarters and austere environments commonly lend themselves to gastrointestinal illnesses, respiratory diseases, heat injuries, vector-borne diseases, and sexually transmitted infections.
Case Examples
During an 8-month deployment in Afghanistan, one of the authors (N.R.M.) provided or assisted in the care of more than 2300 routine sick call appointments, or approximately 10 patients per day. Epidemiology of disease was tracked, and the condition of the unit was presented daily to the battalion commander for consideration in upcoming operations. The top 5 most common categories of diagnoses included musculoskeletal injuries, gastrointestinal diseases, dermatologic concerns (eg, dermatitis, bacterial infections [cellulitis/abscess], fungal infections, arthropod assault, abrasions, lacerations, verruca vulgaris), respiratory illnesses, and mental health care, respectively. Maintaining a familiarity with general medicine is critical for the military dermatologist, and an adequate medical library or access to online medical review sources is critical for day-to-day sick call.
Medical Emergencies
In the event of a more serious injury or illness, a Role 1 BAS has very little capability in performing anything beyond the most basic interventions. Part of the art of being an effective field surgeon lies in stabilization, triage, and transport of these sometimes very ill patients. Both the decision to transport to a higher level of care (eg, Role 2 or 3 facility) as well as selection of the means of transportation falls on the field surgeon. The MEDO plays an essential role in assisting in the coordination of the transfer; however, the responsibility ultimately falls on the field surgeon.1,6 The field surgeon at the Role 2 BAS may be expected to perform more advanced medical and surgical interventions. More advanced pharmacotherapies include thrombolytics, antivenin, and vasopressors. Some procedural interventions include intubations, central lines, and laceration repairs. The Role 2 BAS has the capability to hold patients for up to 72 hours.
Case Examples
Specific conditions one of the authors (N.R.M.) treated include heat injury, myocardial infarction, disseminated tuberculosis, appendicitis, testicular torsion, malaria, suicidal ideation, burns, and status epilepticus. Over 8 months, the Role 2 BAS received 91 medical emergencies, with 53 necessitating evacuation to a higher level of care. Often, the more serious or rare conditions presented in the foreign contractor and coalition force populations working alongside US troops.
In one particular case, a 35-year-old man with an electrocardiogram-confirmed acute ST-segment elevation myocardial infarction was administered standard therapy consisting of intravenous morphine, oxygen, sublingual nitroglycerin, an angiotensin-converting enzyme inhibitor, and a beta-blocker. Given the lack of a cardiac catheterization laboratory at the next highest level of care as well as a low suspicion for aortic dissection (based on the patient’s history, physical examination, and chest radiograph), fibrinolysis with tenecteplase was performed in the deployed environment. After a very short observation for potential hemorrhage, the patient was then evacuated to the Role 3 hospital, where he made a near-complete recovery. Preparation with advanced cardiac life support courses and a thorough algorithmic review of the 10 most common causes of presentation to the emergency department helped adequately prepare the dermatologist to succeed.
Trauma Emergencies
The same principles of triage and transport apply to trauma emergencies. Mass casualties are an inevitable reality in combat, so appropriate training translating into efficient action is essential to ensure the lowest possible mortality. This training and the actions that stem from it are an additional responsibility that the field surgeon must maintain. During deployment, continued training organized by the field surgeon could quite literally mean the difference between life and death. In addition to the organizational responsibilities, field surgeons should be prepared to perform initial stabilization in trauma patients, including application of tourniquets, establishment of central lines, reading abdominal ultrasounds for free fluid, placement of chest tubes, intubation, and ventilator management. The Joint Trauma System Clinical Practice Guidelines also offer extensive and invaluable guidance on the most up-to-date approach to common trauma conditions arising in the deployed environment.7 At the Role 2 level, the field surgeon also must be prepared to coordinate ancillary services, manage the Role 2/forward surgical team intensive care unit, and serve as first assist in the operating room, as needed (Figure 2).
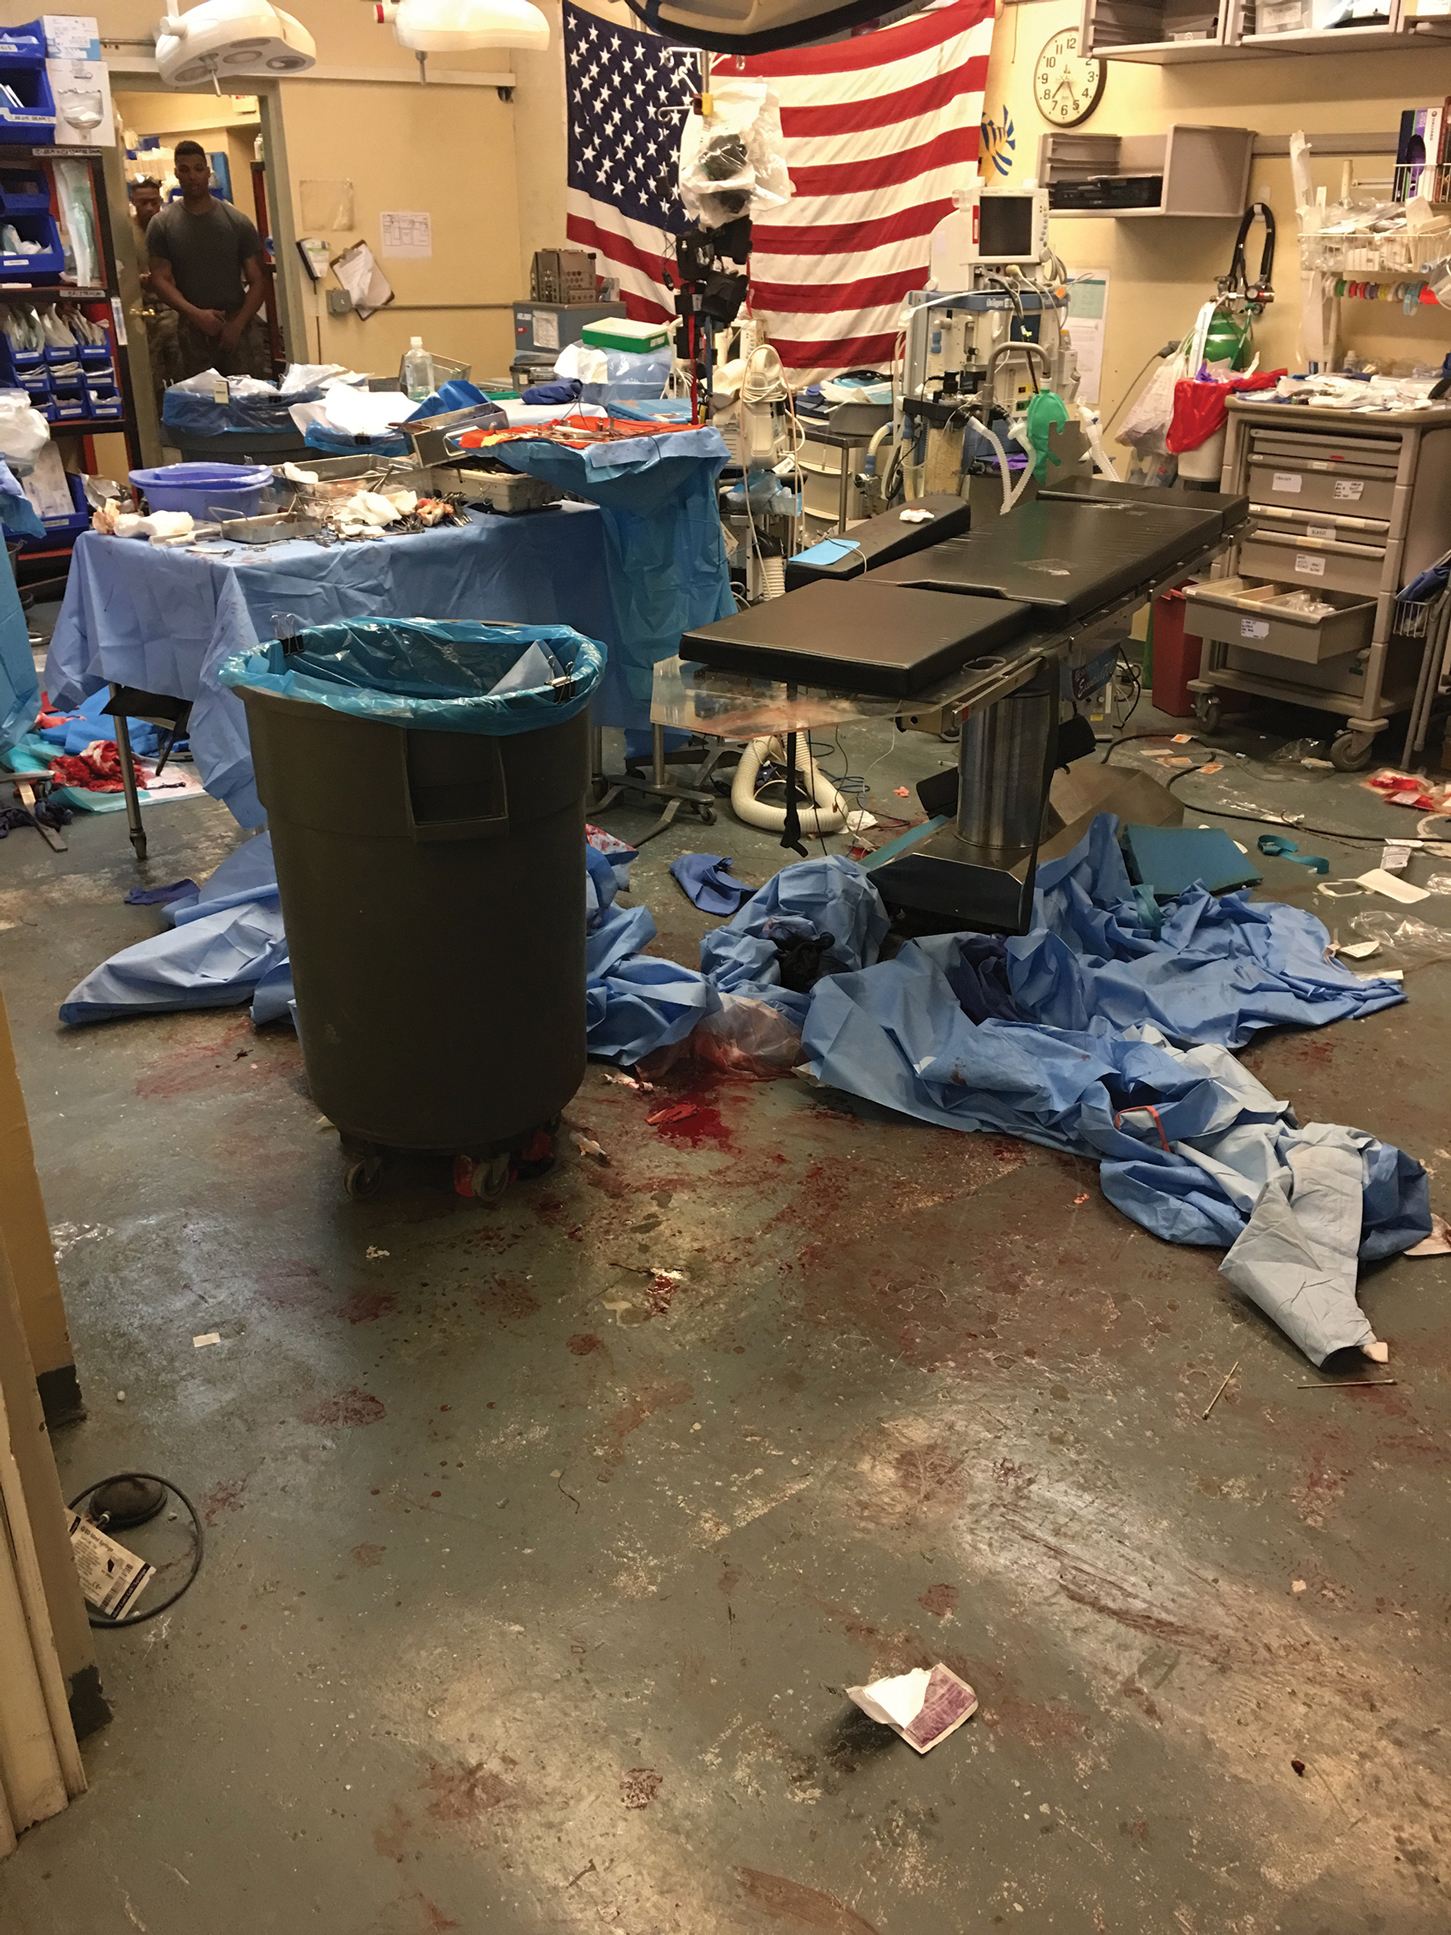
Case Examples
One of the authors (N.R.M.) assisted or provided care in approximately 225 trauma cases while deployed. A mass casualty event occurred, in which the Role 2 BAS received 34 casualties; of these casualties, 11 were immediate, 10 were delayed, 11 were minimal, and 2 were expectant. Injury patterns included mounted and dismounted improvised explosive device injuries (eg, blast, shrapnel, and traumatic brain injuries) as well as gunshot wounds. Direct care was provided for 13 casualties, including 10 abdominal ultrasound examinations for free fluid, placement of 2 chest tubes, 1 intubation, establishment of 3 central lines, and first-assisting 1 exploratory laparotomy. Of the casualties, 22 were evacuated to the Role 3 hospital, 8 were dispositioned to a coalition hospital, 2 were returned to active duty, and 2 died due to their injuries. The military trauma preparation as outlined in the predeployment training can help adequately prepare the military dermatologist to assist in these cases.
Ancillary Services
An important part of the efficacy of initial evaluation and stabilization of both medical and traumatic emergencies involves expedited laboratory tests, imaging, and the delivery of life-saving blood products to affected patients. The field surgeon is responsible for the readiness of these services and may play a critical role in streamlining these tasks for situations where a delay in care by minutes can be lethal. The MEDO assists the field surgeon to ensure the readiness of the medical equipment, and the field surgeon must ensure the readiness of the medics and technicians utilizing the equipment. In a deployed environment, only a finite amount of blood products may be stored. As a result, the design and implementation of an efficient and precise walking blood bank is critical. To help mitigate this issue, servicemembers are prescreened for their blood types and bloodborne illnesses. If a situation arises in which whole blood is needed, the prescreened individuals are screened again, and their blood is collected and transfused to the patient under the supervision of the physician. This task is critical in saving lives, and this process is the primary responsibility of the field surgeon.
Case Example
A 37-year-old man presented to the BAS with abdominal and pelvic gunshot wounds, as well as tachycardia, rapidly decreasing blood pressure, and altered consciousness. An exploratory laparotomy was performed to look for the sources of bleeding. The patient’s blood type was confirmed with a portable testing kit. Due to the injury pattern and clinical presentation, a call was immediately placed to begin screening and preparing servicemembers to donate blood for the walking blood bank. As expected, the Role 2 supply of blood products was exhausted during the exploratory laparotomy. With servicemembers in place and screened, an additional 12 units of whole blood were collected and administered in a timely fashion. The patient was stabilized and transported to the next highest level of care. Due to the process optimization performed by the laboratory team, whole-blood transfusions were ready within an average of 22 minutes, well ahead of the 45-minute standard of care.
Operating Room First Assist
If a field surgeon is stationed at a Role 2 BAS with a forward surgical team, he/she may be required to adopt the role of operating room first assist for the trauma surgeon or orthopedic surgeon on the team, which is especially true for isolated major traumas when triage and initial stabilization measures for multiple patients are of less concern. Dermatologists receive surgical training as part of the Accreditation Council for Graduate Medical Education requirements to graduate residency, making them more than capable of surgical assisting when needed.8 In particular, dermatologists’ ability to utilize instruments appropriately and think procedurally as well as their skills in suturing are helpful.
Case Example
A 22-year-old man with several shrapnel wounds to the abdomen demonstrated free fluid in the left lower quadrant. The field surgeon (N.R.M.) assisted the trauma surgeon in opening the abdomen and running the bowel for sources of bleeding. The trauma surgeon identified the bleed and performed a ligation. The patient was then packed, closed, and prepared for transfer to a higher level of care.
Preventive Medicine
As a result of the field surgeon being on the front line of medical care in an austere environment, implementation of preventive medicine practices and disease pattern recognition are his/her responsibility. Responsibilities may include stray animal euthanasia due to prevalence of rabies, enforcement of malaria prophylaxis, medical training and maintenance of snake antivenin, and assistance with other local endemic disease. The unique skill set of dermatologists in organism identification can further bolster the speed with which vector-borne diseases are recognized and prevention and treatment measures are implemented.
Case Example
As coalition forces executed a mission in Afghanistan, US servicemembers began experiencing abdominal distress, chills, fevers (temperature >40°C), debilitating headaches, myalgia, arthralgia, and tachycardia. Initially, these patients were evacuated to the Role 2 BAS, hindering the mission. Upon inspection, patients had numerous bug bites; one astute soldier collected the arthropod guilty of the assault and brought it to the aid station. Upon inspection, the offender was identified as the Phlebotomus genus of sandflies, organisms that are well known to dermatologists as a cause of leishmaniasis. Clinical correlation resulted in the presumed diagnosis of Pappataci fever, and vector-borne disease prevention measures were then able to be further emphasized and implemented in at-risk areas, allowing the mission to continue.9 Subsequent infectious disease laboratory testing confirmed the Phlebovirus transmitted by the sandfly as the underlying cause of the illness.
CONCLUSION
The diverse role of the field surgeon in the deployed setting makes any one specialist underprepared to completely take on the role from the outset; however, with appropriate and rigorous trauma training prior to deployment, dermatologists will continue to perform as invaluable assets to the US military in conflicts now and in the future.
1. Moawad FJ, Wilson R, Kunar MT, et al. Role of the battalion surgeon in the Iraq and Afghanistan War. Mil Med. 2012;177:412-416.
2. AR 601-142: Army Medical Department Professional Filler System. Washington, DC: US Department of the Army; 2015. http://cdm16635.contentdm.oclc.org/cdm/ref/collection/p16635coll11/id/4592. Accessed December 19, 2018.
3. Roles of medical care (United States). Emergency War Surgery. 4th ed. Fort Sam Houston, Texas: Office of the Surgeon General; 2013:17-28.
4. Combat Casualty Care Course (C4). Military Health System website. https://health.mil/Training-Center/Defense-Medical-Readiness-Training-Institute/Combat-Casualty-Care-Course. Accessed December 7, 2018.
5. Advanced Trauma Life Support. American College of Surgeons website. https://www.facs.org/quality-programs/trauma/atls. Accessed December 7, 2018.
6. Tactical Combat Casualty Care Course. Military Health System website. https://health.mil/Training-Center/Defense-Medical-Readiness-Training-Institute/Tactical-Combat-Casualty-Care-Course. Accessed December 18, 2018.
7. Joint Trauma System: The Department of Defense Center of Excellence for Trauma. Clinical Practice Guidelines.
8. ACGME program requirements for graduate medical education in dermatology. Accreditation Council for Graduate Medical Education website. https://www.acgme.org/Portals/0/PFAssets/ProgramRequirements/080_dermatology_2017-07-01.pdf. Revised July 1, 2017. Accessed December 7, 2018.
9. Downs JW, Flood DT, Orr NH, et al. Sandfly fever in Afghanistan-a sometimes overlooked disease of military importance: a case series and review of the literature. US Army Med Dep J. 2017:60-66.
Military dermatologists complete their residency training at 1 of 3 large military medical centers across the country: Walter Reed National Military Medical Center (Bethesda, Maryland), San Antonio Military Health System (San Antonio, Texas), or Naval Medical Center San Diego (San Diego, California). While in training, army dermatology residents in particular fall under the US Army Medical Command, or MEDCOM, which provides command and control of the army’s medical, dental, and veterinary treatment facilities. Upon graduating from residency, army dermatologists often are stationed with MEDCOM units but become eligible for deployment with US Army Forces Command (FORSCOM) units to both combat and noncombat zones depending on each individual FORSCOM unit’s mission.
The process by which dermatologists and other army physicians are tasked to a deploying FORSCOM unit is referred to as the Professional Filler System, or PROFIS, which was designed to help alleviate the financial cost and specialty skill degradation of having a physician assigned to a FORSCOM unit while not deployed.1 In general, the greater the amount of time that an army medical officer has not been deployed, the more likely they are to be selected for deployment with a FORSCOM unit. For the army dermatologist, deployment often comes shortly after completing residency or fellowship.
In this article, we review the various functions of the deployed dermatologist and also highlight the importance of maintaining basic emergency medical skills that could be generalized to the civilian population in case of local or national emergencies.
THE FIELD SURGEON
With rare exceptions, the US Army does not deploy dermatologists for their expertise in diagnosing and managing cutaneous diseases. Typically, a dermatologist will be assigned to a FORSCOM unit in the role of field surgeon. Other medical specialties including emergency medicine, family practice, internal medicine, pediatrics, and obstetrics and gynecology also are eligible for deployment as field surgeons.2 Field surgeons typically are assigned to a battalion-sized element of 300 to 1000 soldiers and are responsible for all medical care rendered under their supervision. Duties include combat resuscitation, primary care services, preventive medicine, medical training of battalion medical personnel, and serving as the medical adviser to the battalion commander.1 In some instances, a field surgeon will be stationed at a higher level of care co-located with a trauma surgeon; in those cases, the field surgeon also may be expected to assist in trauma surgery cases.
ARMY DEPLOYMENT MEDICAL SYSTEM
To better understand the responsibilities of a field surgeon, it is important to discuss the structure of the army’s deployment medical system. The US Military, including the army, has adopted a system of “roles” that have specific requirements regarding their associated medical capabilities.3 There are 4 roles designated within the army. Role 1 facilities are known as battalion aid stations (BASs).
Role of the Field Surgeon
Within the broader structure of the army, approximately 5 battalions (each composed of 300 to 1000 soldiers) comprise a single brigade combat team. Role 1 medical facilities typically have a single battalion surgeon assigned to them. Field surgeons most commonly serve in this battalion surgeon position. Additionally, Role 2 facilities may have slots for up to 2 battalion surgeons; however, field surgeons are less commonly tasked with this assignment.1 Occasionally, in one author’s (N.R.M.) personal experience, these roles are more fluid than one might expect. A field surgeon tasked initially with a Role 1 position may be shifted to a Role 2 assignment on an as-needed basis. This ability for rapid change in roles and responsibilities underscores the need for a fluid mind-set and thorough predeployment training for the field surgeon.
PREDEPLOYMENT TRAINING
As one might expect, dermatologists who have just graduated residency or fellowship are unlikely to have honed their trauma support skills to the degree needed to support a deployed battalion actively engaging in combat. Fortunately, there are many opportunities for military dermatologists to practice these skills prior to joining their FORSCOM colleagues. The initial exposure to trauma support comes during medical internship at the mandatory Combat Casualty Care Course (C4), an 8-day program designed to enhance the operational medical readiness and predeployment trauma training skills of medical officers.4 The C4 program includes 3 days of classroom training and 5 days of intensive field training. During C4, medical officers become certified in Advanced Trauma Life Support, a 3-day course organized by the American College of Surgeons.5 This course teaches medical officers how to quickly and judiciously triage, treat, and transport patients who have sustained potentially life-threatening traumas.
The next components of predeployment training, Tactical Combat Casualty Care and Tactical Combat Medical Care, occur in the months to weeks immediately preceding deployment.1,6 Tactical Combat Casualty Care prepares participants in the initial stabilization of trauma to occur at the point of injury.6 Tactical Combat Casualty Care principles generally are employed by medics (enlisted personnel trained in point-of-care medical support) rather than physicians; however, these principles are still critical for medical officers to be aware of when encountering severe traumas.6 In addition, the physician is responsible for ensuring his/her medics are fully trained in Tactical Combat Casualty Care. Tactical Combat Medical Care is geared more toward the direct preparation of medical officers. During the 5-day course, medical officers learn the gold standard for trauma care in both the classroom and in hands-on scenarios.1 This training not only allows medical officers to be self-sufficient in providing trauma support, but it also enables them to better maintain quality control of the performance of their medics continuously throughout the deployment.1
DEPLOYMENT RESPONSIBILITIES
Dermatologists who have completed the above training typically are subsequently deployed as field surgeons to a Role 1 facility. Field surgeons are designated as the officer in charge of the BAS and assume the position of medical platoon leader. A field surgeon usually will have both a physician assistant and a field medical assistant/medical plans officer (MEDO) to assist in running the BAS. The overarching goal of the field surgeon is to maintain the health and readiness of the battalion. In addition to addressing the day-to-day health care needs of individual soldiers, a field surgeon is expected to attend all staff meetings, advise the commander on preventative health and epidemiological trends, identify the scope of practice of the medics, ensure the BAS is prepared for mass casualties, and take responsibility for all controlled substances.
To illustrate the value that the properly trained dermatologist can provide in the deployed setting, we will outline field surgeon responsibilities and provide case examples of the first-hand experiences of one of the authors (N.R.M.) as a Role 2 officer in charge and field surgeon. The information presented in the case examples may have been altered to ensure continued operational security and out of respect to US servicemembers and coalition forces while still conveying important learning points.
Sick Call
In the deployed environment, military sick call functions as an urgent care center that is open continuously and serves the active-duty population, US government civilians and contractors, and coalition forces. In general, the physician assistant should treat approximately two-thirds of sick call patients under the supervision of the field surgeon, allowing the field surgeon to focus on his/her ancillary duties and ensure overall medical supervision of the unit. As a safeguard, patients with more than 2 visits for the same concern must be evaluated by the field surgeon. Sick call concerns range from minor traumas and illnesses to much more serious disease processes and injuries (as outlined in Medical Emergencies). As a field surgeon, it is critical to track disease nonbattle illnesses to ensure medical readiness of the unit. In the deployed environment, close quarters and austere environments commonly lend themselves to gastrointestinal illnesses, respiratory diseases, heat injuries, vector-borne diseases, and sexually transmitted infections.
Case Examples
During an 8-month deployment in Afghanistan, one of the authors (N.R.M.) provided or assisted in the care of more than 2300 routine sick call appointments, or approximately 10 patients per day. Epidemiology of disease was tracked, and the condition of the unit was presented daily to the battalion commander for consideration in upcoming operations. The top 5 most common categories of diagnoses included musculoskeletal injuries, gastrointestinal diseases, dermatologic concerns (eg, dermatitis, bacterial infections [cellulitis/abscess], fungal infections, arthropod assault, abrasions, lacerations, verruca vulgaris), respiratory illnesses, and mental health care, respectively. Maintaining a familiarity with general medicine is critical for the military dermatologist, and an adequate medical library or access to online medical review sources is critical for day-to-day sick call.
Medical Emergencies
In the event of a more serious injury or illness, a Role 1 BAS has very little capability in performing anything beyond the most basic interventions. Part of the art of being an effective field surgeon lies in stabilization, triage, and transport of these sometimes very ill patients. Both the decision to transport to a higher level of care (eg, Role 2 or 3 facility) as well as selection of the means of transportation falls on the field surgeon. The MEDO plays an essential role in assisting in the coordination of the transfer; however, the responsibility ultimately falls on the field surgeon.1,6 The field surgeon at the Role 2 BAS may be expected to perform more advanced medical and surgical interventions. More advanced pharmacotherapies include thrombolytics, antivenin, and vasopressors. Some procedural interventions include intubations, central lines, and laceration repairs. The Role 2 BAS has the capability to hold patients for up to 72 hours.
Case Examples
Specific conditions one of the authors (N.R.M.) treated include heat injury, myocardial infarction, disseminated tuberculosis, appendicitis, testicular torsion, malaria, suicidal ideation, burns, and status epilepticus. Over 8 months, the Role 2 BAS received 91 medical emergencies, with 53 necessitating evacuation to a higher level of care. Often, the more serious or rare conditions presented in the foreign contractor and coalition force populations working alongside US troops.
In one particular case, a 35-year-old man with an electrocardiogram-confirmed acute ST-segment elevation myocardial infarction was administered standard therapy consisting of intravenous morphine, oxygen, sublingual nitroglycerin, an angiotensin-converting enzyme inhibitor, and a beta-blocker. Given the lack of a cardiac catheterization laboratory at the next highest level of care as well as a low suspicion for aortic dissection (based on the patient’s history, physical examination, and chest radiograph), fibrinolysis with tenecteplase was performed in the deployed environment. After a very short observation for potential hemorrhage, the patient was then evacuated to the Role 3 hospital, where he made a near-complete recovery. Preparation with advanced cardiac life support courses and a thorough algorithmic review of the 10 most common causes of presentation to the emergency department helped adequately prepare the dermatologist to succeed.
Trauma Emergencies
The same principles of triage and transport apply to trauma emergencies. Mass casualties are an inevitable reality in combat, so appropriate training translating into efficient action is essential to ensure the lowest possible mortality. This training and the actions that stem from it are an additional responsibility that the field surgeon must maintain. During deployment, continued training organized by the field surgeon could quite literally mean the difference between life and death. In addition to the organizational responsibilities, field surgeons should be prepared to perform initial stabilization in trauma patients, including application of tourniquets, establishment of central lines, reading abdominal ultrasounds for free fluid, placement of chest tubes, intubation, and ventilator management. The Joint Trauma System Clinical Practice Guidelines also offer extensive and invaluable guidance on the most up-to-date approach to common trauma conditions arising in the deployed environment.7 At the Role 2 level, the field surgeon also must be prepared to coordinate ancillary services, manage the Role 2/forward surgical team intensive care unit, and serve as first assist in the operating room, as needed (Figure 2).
Case Examples
One of the authors (N.R.M.) assisted or provided care in approximately 225 trauma cases while deployed. A mass casualty event occurred, in which the Role 2 BAS received 34 casualties; of these casualties, 11 were immediate, 10 were delayed, 11 were minimal, and 2 were expectant. Injury patterns included mounted and dismounted improvised explosive device injuries (eg, blast, shrapnel, and traumatic brain injuries) as well as gunshot wounds. Direct care was provided for 13 casualties, including 10 abdominal ultrasound examinations for free fluid, placement of 2 chest tubes, 1 intubation, establishment of 3 central lines, and first-assisting 1 exploratory laparotomy. Of the casualties, 22 were evacuated to the Role 3 hospital, 8 were dispositioned to a coalition hospital, 2 were returned to active duty, and 2 died due to their injuries. The military trauma preparation as outlined in the predeployment training can help adequately prepare the military dermatologist to assist in these cases.
Ancillary Services
An important part of the efficacy of initial evaluation and stabilization of both medical and traumatic emergencies involves expedited laboratory tests, imaging, and the delivery of life-saving blood products to affected patients. The field surgeon is responsible for the readiness of these services and may play a critical role in streamlining these tasks for situations where a delay in care by minutes can be lethal. The MEDO assists the field surgeon to ensure the readiness of the medical equipment, and the field surgeon must ensure the readiness of the medics and technicians utilizing the equipment. In a deployed environment, only a finite amount of blood products may be stored. As a result, the design and implementation of an efficient and precise walking blood bank is critical. To help mitigate this issue, servicemembers are prescreened for their blood types and bloodborne illnesses. If a situation arises in which whole blood is needed, the prescreened individuals are screened again, and their blood is collected and transfused to the patient under the supervision of the physician. This task is critical in saving lives, and this process is the primary responsibility of the field surgeon.
Case Example
A 37-year-old man presented to the BAS with abdominal and pelvic gunshot wounds, as well as tachycardia, rapidly decreasing blood pressure, and altered consciousness. An exploratory laparotomy was performed to look for the sources of bleeding. The patient’s blood type was confirmed with a portable testing kit. Due to the injury pattern and clinical presentation, a call was immediately placed to begin screening and preparing servicemembers to donate blood for the walking blood bank. As expected, the Role 2 supply of blood products was exhausted during the exploratory laparotomy. With servicemembers in place and screened, an additional 12 units of whole blood were collected and administered in a timely fashion. The patient was stabilized and transported to the next highest level of care. Due to the process optimization performed by the laboratory team, whole-blood transfusions were ready within an average of 22 minutes, well ahead of the 45-minute standard of care.
Operating Room First Assist
If a field surgeon is stationed at a Role 2 BAS with a forward surgical team, he/she may be required to adopt the role of operating room first assist for the trauma surgeon or orthopedic surgeon on the team, which is especially true for isolated major traumas when triage and initial stabilization measures for multiple patients are of less concern. Dermatologists receive surgical training as part of the Accreditation Council for Graduate Medical Education requirements to graduate residency, making them more than capable of surgical assisting when needed.8 In particular, dermatologists’ ability to utilize instruments appropriately and think procedurally as well as their skills in suturing are helpful.
Case Example
A 22-year-old man with several shrapnel wounds to the abdomen demonstrated free fluid in the left lower quadrant. The field surgeon (N.R.M.) assisted the trauma surgeon in opening the abdomen and running the bowel for sources of bleeding. The trauma surgeon identified the bleed and performed a ligation. The patient was then packed, closed, and prepared for transfer to a higher level of care.
Preventive Medicine
As a result of the field surgeon being on the front line of medical care in an austere environment, implementation of preventive medicine practices and disease pattern recognition are his/her responsibility. Responsibilities may include stray animal euthanasia due to prevalence of rabies, enforcement of malaria prophylaxis, medical training and maintenance of snake antivenin, and assistance with other local endemic disease. The unique skill set of dermatologists in organism identification can further bolster the speed with which vector-borne diseases are recognized and prevention and treatment measures are implemented.
Case Example
As coalition forces executed a mission in Afghanistan, US servicemembers began experiencing abdominal distress, chills, fevers (temperature >40°C), debilitating headaches, myalgia, arthralgia, and tachycardia. Initially, these patients were evacuated to the Role 2 BAS, hindering the mission. Upon inspection, patients had numerous bug bites; one astute soldier collected the arthropod guilty of the assault and brought it to the aid station. Upon inspection, the offender was identified as the Phlebotomus genus of sandflies, organisms that are well known to dermatologists as a cause of leishmaniasis. Clinical correlation resulted in the presumed diagnosis of Pappataci fever, and vector-borne disease prevention measures were then able to be further emphasized and implemented in at-risk areas, allowing the mission to continue.9 Subsequent infectious disease laboratory testing confirmed the Phlebovirus transmitted by the sandfly as the underlying cause of the illness.
CONCLUSION
The diverse role of the field surgeon in the deployed setting makes any one specialist underprepared to completely take on the role from the outset; however, with appropriate and rigorous trauma training prior to deployment, dermatologists will continue to perform as invaluable assets to the US military in conflicts now and in the future.
1. Moawad FJ, Wilson R, Kunar MT, et al. Role of the battalion surgeon in the Iraq and Afghanistan War. Mil Med. 2012;177:412-416.
2. AR 601-142: Army Medical Department Professional Filler System. Washington, DC: US Department of the Army; 2015. http://cdm16635.contentdm.oclc.org/cdm/ref/collection/p16635coll11/id/4592. Accessed December 19, 2018.
3. Roles of medical care (United States). Emergency War Surgery. 4th ed. Fort Sam Houston, Texas: Office of the Surgeon General; 2013:17-28.
4. Combat Casualty Care Course (C4). Military Health System website. https://health.mil/Training-Center/Defense-Medical-Readiness-Training-Institute/Combat-Casualty-Care-Course. Accessed December 7, 2018.
5. Advanced Trauma Life Support. American College of Surgeons website. https://www.facs.org/quality-programs/trauma/atls. Accessed December 7, 2018.
6. Tactical Combat Casualty Care Course. Military Health System website. https://health.mil/Training-Center/Defense-Medical-Readiness-Training-Institute/Tactical-Combat-Casualty-Care-Course. Accessed December 18, 2018.
7. Joint Trauma System: The Department of Defense Center of Excellence for Trauma. Clinical Practice Guidelines.
8. ACGME program requirements for graduate medical education in dermatology. Accreditation Council for Graduate Medical Education website. https://www.acgme.org/Portals/0/PFAssets/ProgramRequirements/080_dermatology_2017-07-01.pdf. Revised July 1, 2017. Accessed December 7, 2018.
9. Downs JW, Flood DT, Orr NH, et al. Sandfly fever in Afghanistan-a sometimes overlooked disease of military importance: a case series and review of the literature. US Army Med Dep J. 2017:60-66.
Practice Points
- Army dermatologists routinely deploy to combat zones as field surgeons. In this role, they provide routine, emergency, and trauma care for active-duty soldiers and coalition forces.
- With 5 years of general medical training, army dermatologists often are the most prepared to provide advanced care when compared to co-located physician assistants and combat medics.
- Maintaining basic medical skills would serve any dermatologist in case of local or national emergencies.