User login
Opioid use predicts longer sleep latency in chronic pain patients
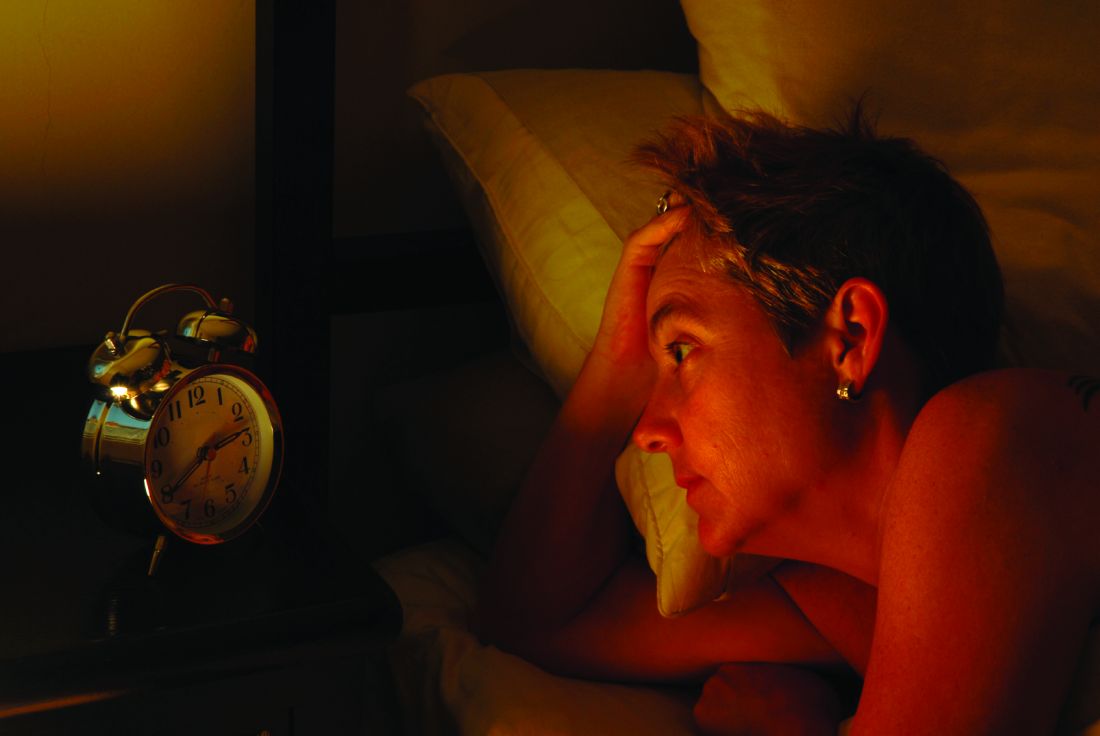
Patients with chronic pain who took opioids reported significantly more difficulty falling asleep, compared with those who didn’t use opioids, a study of 144 adults has found.
“Identification of factors that influence insomnia symptoms among adults with chronic pain may inform prevention and treatment efforts for both disorders,” wrote Mary Beth Miller, PhD, of the University of Missouri School of Medicine, Columbia, and her colleagues.
To identify the potential impact of opioid use on sleep among chronic pain patients, the researchers recruited adults reporting symptoms of both insomnia and fibromyalgia. The average age of the participants was 52 years, and 95% were women. The study findings were published in Sleep Medicine.
The participants completed sleep diaries for 14 days, during which they recorded data including when they went to bed, how long it took them to fall asleep (SOL), how often they woke up during the night and how long they stayed awake (WASO), what time they woke up, and what time they got out of bed. Patients also reported “yes” or “no” on opioid use and their dosage each day and rated their pain on a scale of 0-100 each night before retiring.
The study participants wore wrist actigraphy devices for baseline assessment and underwent 1 night of ambulatory polysomnography.
The researchers used a multiple regression model to examine how pain intensity affected the association between opioid use and insomnia.
Overall, “opioid use was not associated with improvements in insomnia symptoms across any level of pain intensity, and was associated with worse insomnia symptoms among those reporting less intense pain,” the researchers said.
Opioid use was associated with significantly longer time to sleep onset in participants with low levels of pain (P = .02) but not among those with moderate to high levels; average sleep onset latency appeared unaffected by pain level among participants who did not use opioids.
The study findings were limited by several factors including the small number of male participants, the use of paper forms for the sleep diaries, which prevented confirmation of timely reporting, and the cross-sectional nature of the analysis, the researchers noted. However, from a clinical perspective, the “findings suggest that it may be important to advise patients reporting symptoms of insomnia about the risks of extending time in bed when providing them with opioid pain medication and that the use of behavioral or cognitive-behavioral treatment for insomnia may be recommended,” they said. The researchers also recommended that future studies address the longitudinal associations between opioid use and insomnia.
The researchers had no financial conflicts to disclose.
SOURCE: Miller M et al., Sleep Med. 2018; doi: 10.1016/j.sleep.2018.08.015.
Patients with chronic pain who took opioids reported significantly more difficulty falling asleep, compared with those who didn’t use opioids, a study of 144 adults has found.
“Identification of factors that influence insomnia symptoms among adults with chronic pain may inform prevention and treatment efforts for both disorders,” wrote Mary Beth Miller, PhD, of the University of Missouri School of Medicine, Columbia, and her colleagues.
To identify the potential impact of opioid use on sleep among chronic pain patients, the researchers recruited adults reporting symptoms of both insomnia and fibromyalgia. The average age of the participants was 52 years, and 95% were women. The study findings were published in Sleep Medicine.
The participants completed sleep diaries for 14 days, during which they recorded data including when they went to bed, how long it took them to fall asleep (SOL), how often they woke up during the night and how long they stayed awake (WASO), what time they woke up, and what time they got out of bed. Patients also reported “yes” or “no” on opioid use and their dosage each day and rated their pain on a scale of 0-100 each night before retiring.
The study participants wore wrist actigraphy devices for baseline assessment and underwent 1 night of ambulatory polysomnography.
The researchers used a multiple regression model to examine how pain intensity affected the association between opioid use and insomnia.
Overall, “opioid use was not associated with improvements in insomnia symptoms across any level of pain intensity, and was associated with worse insomnia symptoms among those reporting less intense pain,” the researchers said.
Opioid use was associated with significantly longer time to sleep onset in participants with low levels of pain (P = .02) but not among those with moderate to high levels; average sleep onset latency appeared unaffected by pain level among participants who did not use opioids.
The study findings were limited by several factors including the small number of male participants, the use of paper forms for the sleep diaries, which prevented confirmation of timely reporting, and the cross-sectional nature of the analysis, the researchers noted. However, from a clinical perspective, the “findings suggest that it may be important to advise patients reporting symptoms of insomnia about the risks of extending time in bed when providing them with opioid pain medication and that the use of behavioral or cognitive-behavioral treatment for insomnia may be recommended,” they said. The researchers also recommended that future studies address the longitudinal associations between opioid use and insomnia.
The researchers had no financial conflicts to disclose.
SOURCE: Miller M et al., Sleep Med. 2018; doi: 10.1016/j.sleep.2018.08.015.
Patients with chronic pain who took opioids reported significantly more difficulty falling asleep, compared with those who didn’t use opioids, a study of 144 adults has found.
“Identification of factors that influence insomnia symptoms among adults with chronic pain may inform prevention and treatment efforts for both disorders,” wrote Mary Beth Miller, PhD, of the University of Missouri School of Medicine, Columbia, and her colleagues.
To identify the potential impact of opioid use on sleep among chronic pain patients, the researchers recruited adults reporting symptoms of both insomnia and fibromyalgia. The average age of the participants was 52 years, and 95% were women. The study findings were published in Sleep Medicine.
The participants completed sleep diaries for 14 days, during which they recorded data including when they went to bed, how long it took them to fall asleep (SOL), how often they woke up during the night and how long they stayed awake (WASO), what time they woke up, and what time they got out of bed. Patients also reported “yes” or “no” on opioid use and their dosage each day and rated their pain on a scale of 0-100 each night before retiring.
The study participants wore wrist actigraphy devices for baseline assessment and underwent 1 night of ambulatory polysomnography.
The researchers used a multiple regression model to examine how pain intensity affected the association between opioid use and insomnia.
Overall, “opioid use was not associated with improvements in insomnia symptoms across any level of pain intensity, and was associated with worse insomnia symptoms among those reporting less intense pain,” the researchers said.
Opioid use was associated with significantly longer time to sleep onset in participants with low levels of pain (P = .02) but not among those with moderate to high levels; average sleep onset latency appeared unaffected by pain level among participants who did not use opioids.
The study findings were limited by several factors including the small number of male participants, the use of paper forms for the sleep diaries, which prevented confirmation of timely reporting, and the cross-sectional nature of the analysis, the researchers noted. However, from a clinical perspective, the “findings suggest that it may be important to advise patients reporting symptoms of insomnia about the risks of extending time in bed when providing them with opioid pain medication and that the use of behavioral or cognitive-behavioral treatment for insomnia may be recommended,” they said. The researchers also recommended that future studies address the longitudinal associations between opioid use and insomnia.
The researchers had no financial conflicts to disclose.
SOURCE: Miller M et al., Sleep Med. 2018; doi: 10.1016/j.sleep.2018.08.015.
FROM SLEEP MEDICINE
Key clinical point: Adults taking opioids for chronic pain reported more difficulty falling asleep, compared with those who didn’t use opioids.
Major finding: Approximately one-third of adults with chronic pain reported using an opioid.
Study details: The data come from 144 adults who reported both insomnia and fibromyalgia.
Disclosures: The researchers had no financial conflicts to disclose.
Source: Miller M et al. Sleep Medicine. 2018. doi: 10.1016/j.sleep.2018.08.015.
Age, risk factors should guide chlamydia, gonorrhea screening of HIV-infected women
WASHINGTON – Among HIV-infected women, those aged 18-29 years had the highest rates of gonorrhea and chlamydia. These results suggest that screening for these sexually transmitted infections (STIs) should be based on age and risk in HIV-infected women, said Jodie Dionne-Odom, MD, of the University of Alabama at Birmingham.

Annual screening for gonorrhea and chlamydia is recommended for all sexually active adults with HIV, but prevalence varies by gender, age, and risk behavior, Dr. Dionne-Odom said at a conference on STD prevention sponsored by the Centers for Disease Control and Prevention.
Dr. Odom and her colleagues calculated annual testing and positivity rates during 2007-2016 for chlamydia and gonorrhea among women engaged in HIV care in eight U.S. cities as part of the Centers for AIDS Research (CFAR) Clinical Networks and Integrated Clinical Services (CNICS) longitudinal cohort.
They assessed demographic data based on the most recent year the patient was in care and used validated surveys (AUDIT-C and ASSIST) to assess risk behaviors in the past 3-6 months. They collected information from 5,084 women and 158,745 HIV primary care and women’s health visits.
The median patient age was 47 years; 62.1% of the patients were black; 70% had CD4 counts greater than 350; and 73.6% had HIV viral loads of less than 500 copies/mL. In terms of reported risk, 60.6% of the women were sexually active, (85.5% of whom reported monogamy); 13.1% had problem alcohol use, and 11.6% had active drug use.
Sampling for gonorrhea and chlamydia were mostly from urogenital sites (86.6%), 6.6% were extragenital, and 6.8% were “other.” Nearly all (98.5%) of 23,492 chlamydia tests and 95.7% of 23,324 gonorrhea tests used nucleic acid amplification, Dr. Dionne-Odom said.
During the most recent year in care, 42.7% of women were tested for gonorrhea and chlamydia, and 3.4% were positive, with the annual positivity rates over the study ranging from 1.5% to 3.2% for chlamydia and 0.9% to 1.5% for gonorrhea. However, Dr. Dionne-Odom and her colleagues found that the prevalence of STIs was inversely related to patient age, with gonorrhea and chlamydia positivity in 2016 being 16% for chlamydia and 3.9% for gonorrhea among women aged 18-24 years, compared with 1.1% and 0.7%, respectively, for women older than 50 years.
“As with national data on women, HIV-infected women aged 18-29 years had the highest rates of gonorrhea and chlamydia. Our results show that targeted screening for chlamydia and gonorrhea in women with HIV based on age and risk is warranted,” Dr. Dionne-Odom concluded.
Dr. Dionne-Odom reported that she had no relevant disclosures.
WASHINGTON – Among HIV-infected women, those aged 18-29 years had the highest rates of gonorrhea and chlamydia. These results suggest that screening for these sexually transmitted infections (STIs) should be based on age and risk in HIV-infected women, said Jodie Dionne-Odom, MD, of the University of Alabama at Birmingham.
Annual screening for gonorrhea and chlamydia is recommended for all sexually active adults with HIV, but prevalence varies by gender, age, and risk behavior, Dr. Dionne-Odom said at a conference on STD prevention sponsored by the Centers for Disease Control and Prevention.
Dr. Odom and her colleagues calculated annual testing and positivity rates during 2007-2016 for chlamydia and gonorrhea among women engaged in HIV care in eight U.S. cities as part of the Centers for AIDS Research (CFAR) Clinical Networks and Integrated Clinical Services (CNICS) longitudinal cohort.
They assessed demographic data based on the most recent year the patient was in care and used validated surveys (AUDIT-C and ASSIST) to assess risk behaviors in the past 3-6 months. They collected information from 5,084 women and 158,745 HIV primary care and women’s health visits.
The median patient age was 47 years; 62.1% of the patients were black; 70% had CD4 counts greater than 350; and 73.6% had HIV viral loads of less than 500 copies/mL. In terms of reported risk, 60.6% of the women were sexually active, (85.5% of whom reported monogamy); 13.1% had problem alcohol use, and 11.6% had active drug use.
Sampling for gonorrhea and chlamydia were mostly from urogenital sites (86.6%), 6.6% were extragenital, and 6.8% were “other.” Nearly all (98.5%) of 23,492 chlamydia tests and 95.7% of 23,324 gonorrhea tests used nucleic acid amplification, Dr. Dionne-Odom said.
During the most recent year in care, 42.7% of women were tested for gonorrhea and chlamydia, and 3.4% were positive, with the annual positivity rates over the study ranging from 1.5% to 3.2% for chlamydia and 0.9% to 1.5% for gonorrhea. However, Dr. Dionne-Odom and her colleagues found that the prevalence of STIs was inversely related to patient age, with gonorrhea and chlamydia positivity in 2016 being 16% for chlamydia and 3.9% for gonorrhea among women aged 18-24 years, compared with 1.1% and 0.7%, respectively, for women older than 50 years.
“As with national data on women, HIV-infected women aged 18-29 years had the highest rates of gonorrhea and chlamydia. Our results show that targeted screening for chlamydia and gonorrhea in women with HIV based on age and risk is warranted,” Dr. Dionne-Odom concluded.
Dr. Dionne-Odom reported that she had no relevant disclosures.
WASHINGTON – Among HIV-infected women, those aged 18-29 years had the highest rates of gonorrhea and chlamydia. These results suggest that screening for these sexually transmitted infections (STIs) should be based on age and risk in HIV-infected women, said Jodie Dionne-Odom, MD, of the University of Alabama at Birmingham.
Annual screening for gonorrhea and chlamydia is recommended for all sexually active adults with HIV, but prevalence varies by gender, age, and risk behavior, Dr. Dionne-Odom said at a conference on STD prevention sponsored by the Centers for Disease Control and Prevention.
Dr. Odom and her colleagues calculated annual testing and positivity rates during 2007-2016 for chlamydia and gonorrhea among women engaged in HIV care in eight U.S. cities as part of the Centers for AIDS Research (CFAR) Clinical Networks and Integrated Clinical Services (CNICS) longitudinal cohort.
They assessed demographic data based on the most recent year the patient was in care and used validated surveys (AUDIT-C and ASSIST) to assess risk behaviors in the past 3-6 months. They collected information from 5,084 women and 158,745 HIV primary care and women’s health visits.
The median patient age was 47 years; 62.1% of the patients were black; 70% had CD4 counts greater than 350; and 73.6% had HIV viral loads of less than 500 copies/mL. In terms of reported risk, 60.6% of the women were sexually active, (85.5% of whom reported monogamy); 13.1% had problem alcohol use, and 11.6% had active drug use.
Sampling for gonorrhea and chlamydia were mostly from urogenital sites (86.6%), 6.6% were extragenital, and 6.8% were “other.” Nearly all (98.5%) of 23,492 chlamydia tests and 95.7% of 23,324 gonorrhea tests used nucleic acid amplification, Dr. Dionne-Odom said.
During the most recent year in care, 42.7% of women were tested for gonorrhea and chlamydia, and 3.4% were positive, with the annual positivity rates over the study ranging from 1.5% to 3.2% for chlamydia and 0.9% to 1.5% for gonorrhea. However, Dr. Dionne-Odom and her colleagues found that the prevalence of STIs was inversely related to patient age, with gonorrhea and chlamydia positivity in 2016 being 16% for chlamydia and 3.9% for gonorrhea among women aged 18-24 years, compared with 1.1% and 0.7%, respectively, for women older than 50 years.
“As with national data on women, HIV-infected women aged 18-29 years had the highest rates of gonorrhea and chlamydia. Our results show that targeted screening for chlamydia and gonorrhea in women with HIV based on age and risk is warranted,” Dr. Dionne-Odom concluded.
Dr. Dionne-Odom reported that she had no relevant disclosures.
REPORTING FROM THE 2018 STD PREVENTION CONFERENCE
Key clinical point: Targeted screening for chlamydia and gonorrhea in women with HIV based on age, risk is warranted.
Major finding: Chlamydia infections were seen in 16% and gonorrhea in 3.9% of HIV-infected women aged 18-24 years and in 1.1% and 0.7%, respectively, in women over age 50.
Study details: Data analysis of 5,084 women in 8 U.S. cities during 2007-2016.
Disclosures: Dr. Dionne-Odom reported that she had no relevant disclosures.
Most in-hospital pneumonia deaths may not be preventable
Most in-hospital deaths from community-acquired pneumonia are not preventable with current medical therapy, according to an analysis of deaths at five U.S. hospitals with expertise in pneumonia care.

Adults who are hospitalized with community-acquired pneumonia (CAP) are at high risk for short-term mortality but it is unclear whether an improvement in care could lower this risk, noted the study authors led by Grant W. Waterer, MBBS, PhD, of Northwestern University, Chicago.
“Understanding the circumstances in which CAP patients die could facilitate improvements in the management of CAP by enabling future improvement efforts to focus on common preventable causes of death,” they wrote. Their report was published in CHEST®.
They therefore performed a secondary analysis of the Etiology of Pneumonia in the Community (EPIC) study involving adults hospitalized with CAP between January 2010 and June 2012 across five tertiary-care hospitals in the United States.
The clinical characteristics of patients who died in the hospital were compared with those of patients who survived to hospital discharge. Chronic heart failure, chronic obstructive pulmonary disease, coronary artery disease, chronic liver disease, cerebrovascular disease, cancer (excluding skin cancer), and diabetes were considered as severe chronic comorbidities based on their association with increased mortality and ICU admission in CAP severity scores.
Deaths caused by septic shock, respiratory failure, multisystem organ failure, cardiopulmonary arrest prior to stabilization of CAP, and endocarditis, were considered to be directly related to CAP.
Conversely, causes of death indirectly related to CAP included acute cardiovascular disease, stroke, acute renal failure, and secondary infections developed after hospitalization. Deaths caused by cancer, cirrhosis, and chronic neurologic conditions were considered unrelated to CAP.
Medical notes were assessed to determine whether the patient received management consistent with current recommendations; for example, antibiotics consistent with guidelines from the Infectious Diseases Society of America.
End-of-life limitations in care, such as patient/family decision not to proceed with full medical treatment, also were considered by the research team.
Results showed that among the 2,320 patients with radiographically confirmed CAP, 52 died during initial hospitalization, 33 of whom were aged 65 years or older, and 32 of whom had two or more chronic comorbidities.
Most of the in-hospital deaths occurred early in the hospitalization: 35 within the first 10 days of admission, and 5 after 30 days in hospital.
CAP was judged by an expert physician review panel to be the direct cause of death in 27 of the patients, 10 with CAP having an indirect role with major contribution, 9 with CAP having an indirect role with minor contribution, and 6 with CAP having no role in death.
Do-not-resuscitate orders were present at the time of death for 21 of the patients.
Forty-five of the patients were admitted to an ICU, with 37 dying in the ICU. The eight patients who died on the ward after transfer out of the ICU had end-of-life limitations of care in place.
The researchers noted that the number of patients dying in the ICU was greater in the United States, possibly because in Europe fewer patients are admitted to an ICU.
“This discrepancy likely reflects cultural differences between the U.S. and Europe in the role of intensive care for patients with advanced age and/or advanced comorbid conditions,” they noted.
Overall, the physician review panel identified nine patients who had a lapse in quality of in-hospital CAP care, with four of the deaths potentially linked to this lapse in care.
However, two of the patients had end-of-life limitations of care in place, which according to the authors meant that “only two patients undergoing full medical treatment without end-of-life limitations of care had an identified lapse in quality of in-hospital pneumonia care potentially contributing to in-hospital death, including one with a delay in antibiotics for over an hour in the presence of shock and one with initial antibiotics not consistent with IDSA/ATS guidelines.”
The research team concluded that most in-hospital deaths among adult patients admitted with CAP in their study would not have been preventable with higher quality in-hospital pneumonia care.
“Many of the in-hospital deaths among patients admitted with CAP occurred in older patients with severe comorbidities and end-of-life limitations in care,” they noted.
They said the influence of end-of-life limitations on care short of full palliation was an important finding, with all patients who died outside the ICU having end-of-life limitations in care.
“Current diagnostic related group (DRG) and international classification of diseases (ICD) coding systems do not have the necessary nuances to capture these limitations of care, yet they are clearly important factors in determining whether patients experience in-hospital death,” they added.
Dr. Waterer reported no conflicts. Two coauthors reported potential conflicts of interest in relation to consulting fees from several pharmaceutical companies.
SOURCE: Waterer G. et al. CHEST 2018;154(3):628-35. doi: 10.1016/j.chest.2018.05.021.
Most in-hospital deaths from community-acquired pneumonia are not preventable with current medical therapy, according to an analysis of deaths at five U.S. hospitals with expertise in pneumonia care.
Adults who are hospitalized with community-acquired pneumonia (CAP) are at high risk for short-term mortality but it is unclear whether an improvement in care could lower this risk, noted the study authors led by Grant W. Waterer, MBBS, PhD, of Northwestern University, Chicago.
“Understanding the circumstances in which CAP patients die could facilitate improvements in the management of CAP by enabling future improvement efforts to focus on common preventable causes of death,” they wrote. Their report was published in CHEST®.
They therefore performed a secondary analysis of the Etiology of Pneumonia in the Community (EPIC) study involving adults hospitalized with CAP between January 2010 and June 2012 across five tertiary-care hospitals in the United States.
The clinical characteristics of patients who died in the hospital were compared with those of patients who survived to hospital discharge. Chronic heart failure, chronic obstructive pulmonary disease, coronary artery disease, chronic liver disease, cerebrovascular disease, cancer (excluding skin cancer), and diabetes were considered as severe chronic comorbidities based on their association with increased mortality and ICU admission in CAP severity scores.
Deaths caused by septic shock, respiratory failure, multisystem organ failure, cardiopulmonary arrest prior to stabilization of CAP, and endocarditis, were considered to be directly related to CAP.
Conversely, causes of death indirectly related to CAP included acute cardiovascular disease, stroke, acute renal failure, and secondary infections developed after hospitalization. Deaths caused by cancer, cirrhosis, and chronic neurologic conditions were considered unrelated to CAP.
Medical notes were assessed to determine whether the patient received management consistent with current recommendations; for example, antibiotics consistent with guidelines from the Infectious Diseases Society of America.
End-of-life limitations in care, such as patient/family decision not to proceed with full medical treatment, also were considered by the research team.
Results showed that among the 2,320 patients with radiographically confirmed CAP, 52 died during initial hospitalization, 33 of whom were aged 65 years or older, and 32 of whom had two or more chronic comorbidities.
Most of the in-hospital deaths occurred early in the hospitalization: 35 within the first 10 days of admission, and 5 after 30 days in hospital.
CAP was judged by an expert physician review panel to be the direct cause of death in 27 of the patients, 10 with CAP having an indirect role with major contribution, 9 with CAP having an indirect role with minor contribution, and 6 with CAP having no role in death.
Do-not-resuscitate orders were present at the time of death for 21 of the patients.
Forty-five of the patients were admitted to an ICU, with 37 dying in the ICU. The eight patients who died on the ward after transfer out of the ICU had end-of-life limitations of care in place.
The researchers noted that the number of patients dying in the ICU was greater in the United States, possibly because in Europe fewer patients are admitted to an ICU.
“This discrepancy likely reflects cultural differences between the U.S. and Europe in the role of intensive care for patients with advanced age and/or advanced comorbid conditions,” they noted.
Overall, the physician review panel identified nine patients who had a lapse in quality of in-hospital CAP care, with four of the deaths potentially linked to this lapse in care.
However, two of the patients had end-of-life limitations of care in place, which according to the authors meant that “only two patients undergoing full medical treatment without end-of-life limitations of care had an identified lapse in quality of in-hospital pneumonia care potentially contributing to in-hospital death, including one with a delay in antibiotics for over an hour in the presence of shock and one with initial antibiotics not consistent with IDSA/ATS guidelines.”
The research team concluded that most in-hospital deaths among adult patients admitted with CAP in their study would not have been preventable with higher quality in-hospital pneumonia care.
“Many of the in-hospital deaths among patients admitted with CAP occurred in older patients with severe comorbidities and end-of-life limitations in care,” they noted.
They said the influence of end-of-life limitations on care short of full palliation was an important finding, with all patients who died outside the ICU having end-of-life limitations in care.
“Current diagnostic related group (DRG) and international classification of diseases (ICD) coding systems do not have the necessary nuances to capture these limitations of care, yet they are clearly important factors in determining whether patients experience in-hospital death,” they added.
Dr. Waterer reported no conflicts. Two coauthors reported potential conflicts of interest in relation to consulting fees from several pharmaceutical companies.
SOURCE: Waterer G. et al. CHEST 2018;154(3):628-35. doi: 10.1016/j.chest.2018.05.021.
Most in-hospital deaths from community-acquired pneumonia are not preventable with current medical therapy, according to an analysis of deaths at five U.S. hospitals with expertise in pneumonia care.
Adults who are hospitalized with community-acquired pneumonia (CAP) are at high risk for short-term mortality but it is unclear whether an improvement in care could lower this risk, noted the study authors led by Grant W. Waterer, MBBS, PhD, of Northwestern University, Chicago.
“Understanding the circumstances in which CAP patients die could facilitate improvements in the management of CAP by enabling future improvement efforts to focus on common preventable causes of death,” they wrote. Their report was published in CHEST®.
They therefore performed a secondary analysis of the Etiology of Pneumonia in the Community (EPIC) study involving adults hospitalized with CAP between January 2010 and June 2012 across five tertiary-care hospitals in the United States.
The clinical characteristics of patients who died in the hospital were compared with those of patients who survived to hospital discharge. Chronic heart failure, chronic obstructive pulmonary disease, coronary artery disease, chronic liver disease, cerebrovascular disease, cancer (excluding skin cancer), and diabetes were considered as severe chronic comorbidities based on their association with increased mortality and ICU admission in CAP severity scores.
Deaths caused by septic shock, respiratory failure, multisystem organ failure, cardiopulmonary arrest prior to stabilization of CAP, and endocarditis, were considered to be directly related to CAP.
Conversely, causes of death indirectly related to CAP included acute cardiovascular disease, stroke, acute renal failure, and secondary infections developed after hospitalization. Deaths caused by cancer, cirrhosis, and chronic neurologic conditions were considered unrelated to CAP.
Medical notes were assessed to determine whether the patient received management consistent with current recommendations; for example, antibiotics consistent with guidelines from the Infectious Diseases Society of America.
End-of-life limitations in care, such as patient/family decision not to proceed with full medical treatment, also were considered by the research team.
Results showed that among the 2,320 patients with radiographically confirmed CAP, 52 died during initial hospitalization, 33 of whom were aged 65 years or older, and 32 of whom had two or more chronic comorbidities.
Most of the in-hospital deaths occurred early in the hospitalization: 35 within the first 10 days of admission, and 5 after 30 days in hospital.
CAP was judged by an expert physician review panel to be the direct cause of death in 27 of the patients, 10 with CAP having an indirect role with major contribution, 9 with CAP having an indirect role with minor contribution, and 6 with CAP having no role in death.
Do-not-resuscitate orders were present at the time of death for 21 of the patients.
Forty-five of the patients were admitted to an ICU, with 37 dying in the ICU. The eight patients who died on the ward after transfer out of the ICU had end-of-life limitations of care in place.
The researchers noted that the number of patients dying in the ICU was greater in the United States, possibly because in Europe fewer patients are admitted to an ICU.
“This discrepancy likely reflects cultural differences between the U.S. and Europe in the role of intensive care for patients with advanced age and/or advanced comorbid conditions,” they noted.
Overall, the physician review panel identified nine patients who had a lapse in quality of in-hospital CAP care, with four of the deaths potentially linked to this lapse in care.
However, two of the patients had end-of-life limitations of care in place, which according to the authors meant that “only two patients undergoing full medical treatment without end-of-life limitations of care had an identified lapse in quality of in-hospital pneumonia care potentially contributing to in-hospital death, including one with a delay in antibiotics for over an hour in the presence of shock and one with initial antibiotics not consistent with IDSA/ATS guidelines.”
The research team concluded that most in-hospital deaths among adult patients admitted with CAP in their study would not have been preventable with higher quality in-hospital pneumonia care.
“Many of the in-hospital deaths among patients admitted with CAP occurred in older patients with severe comorbidities and end-of-life limitations in care,” they noted.
They said the influence of end-of-life limitations on care short of full palliation was an important finding, with all patients who died outside the ICU having end-of-life limitations in care.
“Current diagnostic related group (DRG) and international classification of diseases (ICD) coding systems do not have the necessary nuances to capture these limitations of care, yet they are clearly important factors in determining whether patients experience in-hospital death,” they added.
Dr. Waterer reported no conflicts. Two coauthors reported potential conflicts of interest in relation to consulting fees from several pharmaceutical companies.
SOURCE: Waterer G. et al. CHEST 2018;154(3):628-35. doi: 10.1016/j.chest.2018.05.021.
FROM CHEST
Key clinical point: Most in-hospital deaths from community-acquired pneumonia are not preventable with current medical therapy.
Major finding: Two out of 52 patients who died in-hospital from community-acquired pneumonia (CAP) who were undergoing full medical treatment without end-of-life limitations of care had an identified lapse in quality of in-hospital pneumonia care that potentially contributed to their death.
Study details: A secondary analysis of the prospective multicenter Etiology of Pneumonia in the Community (EPIC) study involving 2,320 adults with radiographically confirmed CAP.
Disclosures: Dr. Waterer reported no conflicts. Two coauthors reported potential conflicts of interest in relation to consulting fees from several pharmaceutical companies.
Source: Waterer G. et al. CHEST 2018;154(3):628-35.
Short sleep linked to elevated blood pressure
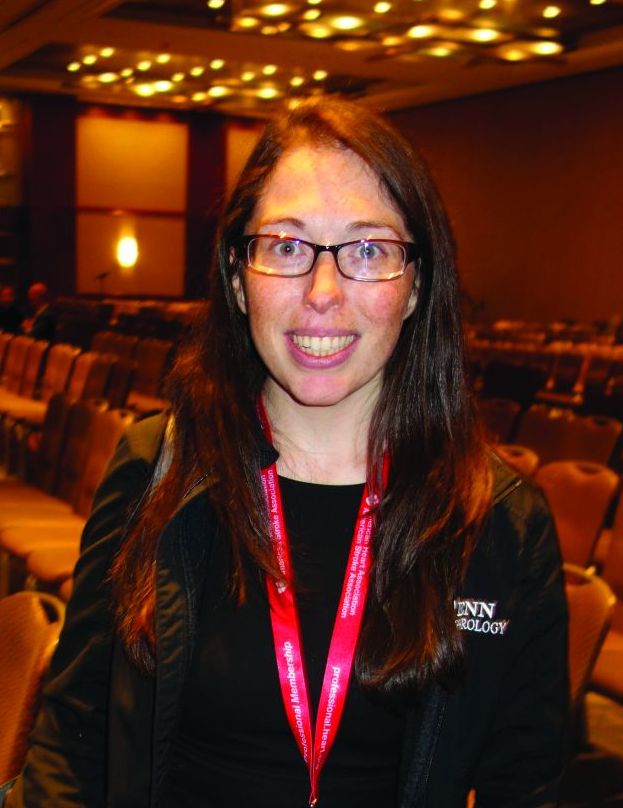
CHICAGO – Consider 24-hour ambulatory blood pressure monitoring when patients complain about not getting enough sleep. You might catch hypertension early, according to researchers from the University of Pennsylvania, Philadelphia, and elsewhere.
They found a less than 7 hours a night and a mean in the study of 5.5 hours. Every 2-2.5 minutes of lost sleep was associated with an increase of 1 mm Hg in 24-hour mean systolic blood pressure and a increase of 1 beat per minute in heart rate.
The relationship was independent of office BP, nocturnal dipping status, and BP variability. It held in both the obese and nonobese, and in patients with and without obstructive sleep apnea (OSA). However, the relationship was found only among subjects who were not on antihypertensive medications.
“Adults with shorter sleep duration may benefit from screening with 24-hour ambulatory BP monitoring to promote earlier detection of hypertension and potentially mitigate the” the risk of cardiovascular disease. “This may be particularly important in screening for masked hypertension,” meaning normal pressures in the office, but elevated pressures at home, said investigators led by Jordana Cohen, MD, of the department of medicine at the University of Pennsylvania in a presentation at the joint scientific sessions of AHA Council on Hypertension, AHA Council on Kidney in Cardiovascular Disease, and American Society of Hypertension.
Dr. Cohen suggested that perhaps the sympathetic and endothelial derangements that drive hypertension in OSA also affect people with insufficient sleep. It may be that the normal morning surge in blood pressure persists longer into the day, she suggested. The investigative team analyzed data from two studies. The first, LIMBS (Lifestyle Modification in BP Lowering Study), was a phase 2 trial assessing yoga for blood pressure lowering. It was conducted in West Philadelphia and excluded people with diabetes, hypertension, OSA, and kidney or cardiovascular disease. The new analysis included 66 LIMBS subjects who had 24-hour blood pressure monitoring and kept sleep diaries to record their sleep duration (J Clin Hypertens (Greenwich). 2016 Aug;18[8]:809-16).
The team also analyzed 153 subjects from the PISA (Penn Icelandic Sleep Apnea) cohort, an ongoing project assessing continuous positive airway pressure for OSA, among other things. PISA includes patients with OSA, diabetes, hypertension, and kidney or cardiovascular disease. Sleep duration in the 153 subjects was again self-reported, but corroborated by actigraphy (J Sleep Res. 2015 Jun;24[3]:328-38).
The new findings were driven mostly by higher daytime systolic BP among short sleepers in LIMBS, and higher systolic pressures during both day and night among short sleepers in PISA, compared with subjects who slept at least 7 hours, and a mean of 8.5 hours, with napping included in overall sleep duration assessment.
In LIMBS, the mean 24-hour systolic BP was 12.7 mm Hg higher and the average heart rate 8 bpm faster among short sleepers; in PISA, the mean 24-hour systolic BP was 4.7 mm Hg higher and the heart rate 2 bpm faster.
Every 2.57 minutes of sleep lost in LIMBS and every 1.99 minute of lost sleep in PISA was associated with a 1–mm Hg gain in mean systolic BP and about a 1-bpm increase in heart rate. The findings were statistically significant and adjusted for age, race, body mass index, nocturnal dipping status, and office systolic blood pressure.
Baseline characteristics were generally well matched between short and long sleepers in both studies. However, while mean office systolic BP in LIMBS was the same in both sleep groups at about 139 mm Hg, the mean office systolic BP among long sleepers in PISA was 130 mm Hg versus 136 mm Hg among short sleepers, a significant difference.
It’s unclear why some people slept less, Dr. Cohen said, and the use of sleeping pills wasn’t considered in the analysis. Patients were an average of about 50 years old, with a body mass index of about 30 mg/m2. The same model of 24-hour blood pressure monitor was used in both studies.
The work was funded by the National Institutes of Health. The investigators had no disclosures.
CHICAGO – Consider 24-hour ambulatory blood pressure monitoring when patients complain about not getting enough sleep. You might catch hypertension early, according to researchers from the University of Pennsylvania, Philadelphia, and elsewhere.
They found a less than 7 hours a night and a mean in the study of 5.5 hours. Every 2-2.5 minutes of lost sleep was associated with an increase of 1 mm Hg in 24-hour mean systolic blood pressure and a increase of 1 beat per minute in heart rate.
The relationship was independent of office BP, nocturnal dipping status, and BP variability. It held in both the obese and nonobese, and in patients with and without obstructive sleep apnea (OSA). However, the relationship was found only among subjects who were not on antihypertensive medications.
“Adults with shorter sleep duration may benefit from screening with 24-hour ambulatory BP monitoring to promote earlier detection of hypertension and potentially mitigate the” the risk of cardiovascular disease. “This may be particularly important in screening for masked hypertension,” meaning normal pressures in the office, but elevated pressures at home, said investigators led by Jordana Cohen, MD, of the department of medicine at the University of Pennsylvania in a presentation at the joint scientific sessions of AHA Council on Hypertension, AHA Council on Kidney in Cardiovascular Disease, and American Society of Hypertension.
Dr. Cohen suggested that perhaps the sympathetic and endothelial derangements that drive hypertension in OSA also affect people with insufficient sleep. It may be that the normal morning surge in blood pressure persists longer into the day, she suggested. The investigative team analyzed data from two studies. The first, LIMBS (Lifestyle Modification in BP Lowering Study), was a phase 2 trial assessing yoga for blood pressure lowering. It was conducted in West Philadelphia and excluded people with diabetes, hypertension, OSA, and kidney or cardiovascular disease. The new analysis included 66 LIMBS subjects who had 24-hour blood pressure monitoring and kept sleep diaries to record their sleep duration (J Clin Hypertens (Greenwich). 2016 Aug;18[8]:809-16).
The team also analyzed 153 subjects from the PISA (Penn Icelandic Sleep Apnea) cohort, an ongoing project assessing continuous positive airway pressure for OSA, among other things. PISA includes patients with OSA, diabetes, hypertension, and kidney or cardiovascular disease. Sleep duration in the 153 subjects was again self-reported, but corroborated by actigraphy (J Sleep Res. 2015 Jun;24[3]:328-38).
The new findings were driven mostly by higher daytime systolic BP among short sleepers in LIMBS, and higher systolic pressures during both day and night among short sleepers in PISA, compared with subjects who slept at least 7 hours, and a mean of 8.5 hours, with napping included in overall sleep duration assessment.
In LIMBS, the mean 24-hour systolic BP was 12.7 mm Hg higher and the average heart rate 8 bpm faster among short sleepers; in PISA, the mean 24-hour systolic BP was 4.7 mm Hg higher and the heart rate 2 bpm faster.
Every 2.57 minutes of sleep lost in LIMBS and every 1.99 minute of lost sleep in PISA was associated with a 1–mm Hg gain in mean systolic BP and about a 1-bpm increase in heart rate. The findings were statistically significant and adjusted for age, race, body mass index, nocturnal dipping status, and office systolic blood pressure.
Baseline characteristics were generally well matched between short and long sleepers in both studies. However, while mean office systolic BP in LIMBS was the same in both sleep groups at about 139 mm Hg, the mean office systolic BP among long sleepers in PISA was 130 mm Hg versus 136 mm Hg among short sleepers, a significant difference.
It’s unclear why some people slept less, Dr. Cohen said, and the use of sleeping pills wasn’t considered in the analysis. Patients were an average of about 50 years old, with a body mass index of about 30 mg/m2. The same model of 24-hour blood pressure monitor was used in both studies.
The work was funded by the National Institutes of Health. The investigators had no disclosures.
CHICAGO – Consider 24-hour ambulatory blood pressure monitoring when patients complain about not getting enough sleep. You might catch hypertension early, according to researchers from the University of Pennsylvania, Philadelphia, and elsewhere.
They found a less than 7 hours a night and a mean in the study of 5.5 hours. Every 2-2.5 minutes of lost sleep was associated with an increase of 1 mm Hg in 24-hour mean systolic blood pressure and a increase of 1 beat per minute in heart rate.
The relationship was independent of office BP, nocturnal dipping status, and BP variability. It held in both the obese and nonobese, and in patients with and without obstructive sleep apnea (OSA). However, the relationship was found only among subjects who were not on antihypertensive medications.
“Adults with shorter sleep duration may benefit from screening with 24-hour ambulatory BP monitoring to promote earlier detection of hypertension and potentially mitigate the” the risk of cardiovascular disease. “This may be particularly important in screening for masked hypertension,” meaning normal pressures in the office, but elevated pressures at home, said investigators led by Jordana Cohen, MD, of the department of medicine at the University of Pennsylvania in a presentation at the joint scientific sessions of AHA Council on Hypertension, AHA Council on Kidney in Cardiovascular Disease, and American Society of Hypertension.
Dr. Cohen suggested that perhaps the sympathetic and endothelial derangements that drive hypertension in OSA also affect people with insufficient sleep. It may be that the normal morning surge in blood pressure persists longer into the day, she suggested. The investigative team analyzed data from two studies. The first, LIMBS (Lifestyle Modification in BP Lowering Study), was a phase 2 trial assessing yoga for blood pressure lowering. It was conducted in West Philadelphia and excluded people with diabetes, hypertension, OSA, and kidney or cardiovascular disease. The new analysis included 66 LIMBS subjects who had 24-hour blood pressure monitoring and kept sleep diaries to record their sleep duration (J Clin Hypertens (Greenwich). 2016 Aug;18[8]:809-16).
The team also analyzed 153 subjects from the PISA (Penn Icelandic Sleep Apnea) cohort, an ongoing project assessing continuous positive airway pressure for OSA, among other things. PISA includes patients with OSA, diabetes, hypertension, and kidney or cardiovascular disease. Sleep duration in the 153 subjects was again self-reported, but corroborated by actigraphy (J Sleep Res. 2015 Jun;24[3]:328-38).
The new findings were driven mostly by higher daytime systolic BP among short sleepers in LIMBS, and higher systolic pressures during both day and night among short sleepers in PISA, compared with subjects who slept at least 7 hours, and a mean of 8.5 hours, with napping included in overall sleep duration assessment.
In LIMBS, the mean 24-hour systolic BP was 12.7 mm Hg higher and the average heart rate 8 bpm faster among short sleepers; in PISA, the mean 24-hour systolic BP was 4.7 mm Hg higher and the heart rate 2 bpm faster.
Every 2.57 minutes of sleep lost in LIMBS and every 1.99 minute of lost sleep in PISA was associated with a 1–mm Hg gain in mean systolic BP and about a 1-bpm increase in heart rate. The findings were statistically significant and adjusted for age, race, body mass index, nocturnal dipping status, and office systolic blood pressure.
Baseline characteristics were generally well matched between short and long sleepers in both studies. However, while mean office systolic BP in LIMBS was the same in both sleep groups at about 139 mm Hg, the mean office systolic BP among long sleepers in PISA was 130 mm Hg versus 136 mm Hg among short sleepers, a significant difference.
It’s unclear why some people slept less, Dr. Cohen said, and the use of sleeping pills wasn’t considered in the analysis. Patients were an average of about 50 years old, with a body mass index of about 30 mg/m2. The same model of 24-hour blood pressure monitor was used in both studies.
The work was funded by the National Institutes of Health. The investigators had no disclosures.
REPORTING FROM JOINT HYPERTENSION 2018
Key clinical point: Ambulatory blood pressure monitoring in patients complaining about lack of sleep could detect hypertension.
Major finding: Every 2-2.5 minutes of lost sleep was associated with a 1–mm Hg increase in 24-hour mean systolic blood pressure and a 1-bpm increase in heart rate.
Study details: Post-hoc review of 219 patients in two trials
Disclosures: The work was funded by the National Institutes of Health. The investigators didn’t have any disclosures.
Confirmed: Growth in overdose deaths is exponential
Overdose death rates for individual drugs show no particular patterns since the turn of the century, but the exponential growth of overall drug mortality actually started before the opioid epidemic, according to an analysis of almost 600,000 unintentional overdose deaths since 1979.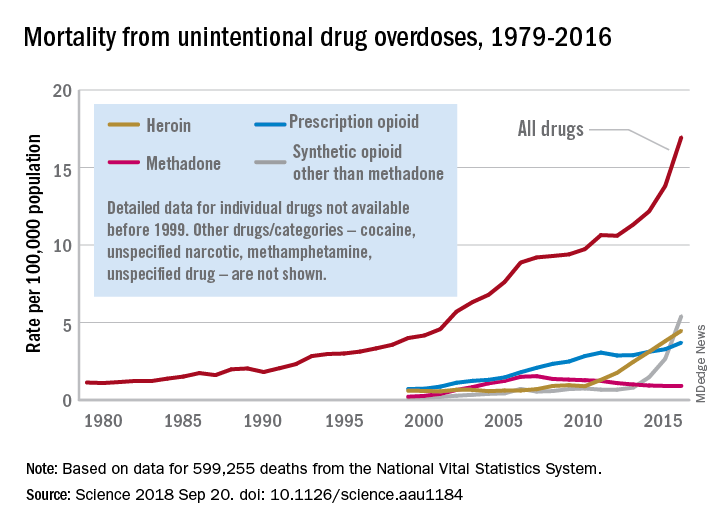
“The current epidemic of overdose deaths due to prescription opioids, heroin, and fentanyl appears to be the most recent manifestation of a more fundamental, longer-term process,” senior author Donald S. Burke, MD, of the University of Pittsburgh, said in a written statement.
Overdose mortality from all types of drugs rose from 1.13 per 100,000 population in 1979 to 16.96 per 100,000 in 2016, based on data for 599,255 deaths from unintentional drug overdoses in the National Vital Statistics System, they reported in Science.
When the investigators plotted annual drug overdose mortality over that 38-year period, they saw a smooth upward exponential curve with a doubling time of about 9 years. “This remarkably smooth, long-term epidemic growth pattern really caught our attention,” Dr. Burke said. “If we can figure it out, we should be able to bend that curve downward.”
The individual drug types that make up the whole, however, are a different story. “There is no regular or predictable pattern to the overdose rates for any of these drugs. Cocaine overdose death rates curved down and up and down and back up over the past 20 years. Methadone deaths have been on a downturn since the mid-2000s. Prescription opioids have been on a fairly steady, steep climb. Heroin deaths shot up in 2010, followed in 2013 by synthetic opioids, such as fentanyl,” lead author Hawre Jalal, MD, PhD, also of the university, said in the statement.
Geographic and demographic analyses produced the same absence of patterns. the researchers wrote.
The study was supported by grants from the Centers for Disease Control and Prevention and the Robert Wood Johnson Foundation. The investigators said they have no competing interests.
SOURCE: Jalal H et al. Science 2018 Sep 20. doi: 10.1126/science.aau1184.
Overdose death rates for individual drugs show no particular patterns since the turn of the century, but the exponential growth of overall drug mortality actually started before the opioid epidemic, according to an analysis of almost 600,000 unintentional overdose deaths since 1979.
“The current epidemic of overdose deaths due to prescription opioids, heroin, and fentanyl appears to be the most recent manifestation of a more fundamental, longer-term process,” senior author Donald S. Burke, MD, of the University of Pittsburgh, said in a written statement.
Overdose mortality from all types of drugs rose from 1.13 per 100,000 population in 1979 to 16.96 per 100,000 in 2016, based on data for 599,255 deaths from unintentional drug overdoses in the National Vital Statistics System, they reported in Science.
When the investigators plotted annual drug overdose mortality over that 38-year period, they saw a smooth upward exponential curve with a doubling time of about 9 years. “This remarkably smooth, long-term epidemic growth pattern really caught our attention,” Dr. Burke said. “If we can figure it out, we should be able to bend that curve downward.”
The individual drug types that make up the whole, however, are a different story. “There is no regular or predictable pattern to the overdose rates for any of these drugs. Cocaine overdose death rates curved down and up and down and back up over the past 20 years. Methadone deaths have been on a downturn since the mid-2000s. Prescription opioids have been on a fairly steady, steep climb. Heroin deaths shot up in 2010, followed in 2013 by synthetic opioids, such as fentanyl,” lead author Hawre Jalal, MD, PhD, also of the university, said in the statement.
Geographic and demographic analyses produced the same absence of patterns. the researchers wrote.
The study was supported by grants from the Centers for Disease Control and Prevention and the Robert Wood Johnson Foundation. The investigators said they have no competing interests.
SOURCE: Jalal H et al. Science 2018 Sep 20. doi: 10.1126/science.aau1184.
Overdose death rates for individual drugs show no particular patterns since the turn of the century, but the exponential growth of overall drug mortality actually started before the opioid epidemic, according to an analysis of almost 600,000 unintentional overdose deaths since 1979.
“The current epidemic of overdose deaths due to prescription opioids, heroin, and fentanyl appears to be the most recent manifestation of a more fundamental, longer-term process,” senior author Donald S. Burke, MD, of the University of Pittsburgh, said in a written statement.
Overdose mortality from all types of drugs rose from 1.13 per 100,000 population in 1979 to 16.96 per 100,000 in 2016, based on data for 599,255 deaths from unintentional drug overdoses in the National Vital Statistics System, they reported in Science.
When the investigators plotted annual drug overdose mortality over that 38-year period, they saw a smooth upward exponential curve with a doubling time of about 9 years. “This remarkably smooth, long-term epidemic growth pattern really caught our attention,” Dr. Burke said. “If we can figure it out, we should be able to bend that curve downward.”
The individual drug types that make up the whole, however, are a different story. “There is no regular or predictable pattern to the overdose rates for any of these drugs. Cocaine overdose death rates curved down and up and down and back up over the past 20 years. Methadone deaths have been on a downturn since the mid-2000s. Prescription opioids have been on a fairly steady, steep climb. Heroin deaths shot up in 2010, followed in 2013 by synthetic opioids, such as fentanyl,” lead author Hawre Jalal, MD, PhD, also of the university, said in the statement.
Geographic and demographic analyses produced the same absence of patterns. the researchers wrote.
The study was supported by grants from the Centers for Disease Control and Prevention and the Robert Wood Johnson Foundation. The investigators said they have no competing interests.
SOURCE: Jalal H et al. Science 2018 Sep 20. doi: 10.1126/science.aau1184.
FROM SCIENCE
HIV patients getting younger ... and older
Men who have sex with men (MSM) were younger at HIV diagnosis in 2016 than in 2008, but those living with the disease were older, according to the Centers for Disease Control and Prevention.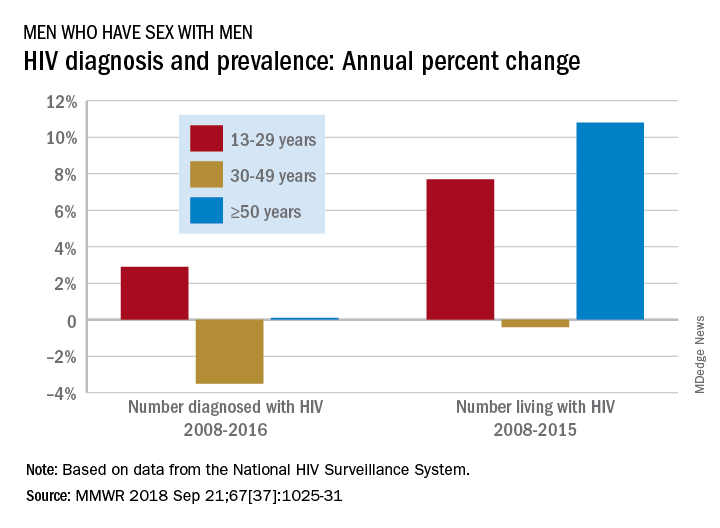
Among MSM aged 13-29 years, the number diagnosed with HIV increased by 2.9% per year from 2008 to 2016 but dropped 3.5% per year for those aged 30-49 and rose just 0.1% annually among those aged 50 and older. Over the period from 2008 to 2015, the number of MSM aged 50 and older who were living with HIV increased by 10.8% per year, compared with an annual percent change of 7.7% for those aged 13-29 and –0.4% for those aged 30-49, Andrew Mitsch, MPH, and his associates at the CDC’s National Center for HIV/AIDS, Viral Hepatitis, STD, and TB Prevention reported in Morbidity and Mortality Weekly Report.
The size of the population of MSM living with HIV went from 384,000 in 2008 to 523,000 in 2016, with 13- to 29-year-olds going from 10.7% of the population to 13.3%, 30- to 49-year-olds dropping from 61% to 44%, and the 50-and-older group increasing from 28.3% to 42.7%, they said.
“The increase in annual diagnosis of HIV infections among younger MSM might reflect increased HIV testing, in addition to ongoing transmission,” they suggested, and increased prevalence among older men is probably the “result of increased survival associated with widespread use of antiretroviral therapy, surviving middle age, and advancing to the older group.”
The investigators also noted the persistence of racial/ethnic disparities over the course of the study. Among the three largest groups, whites had the smallest increase in new diagnoses for 13- to 29-year-olds and the largest decrease for 30- to 49-year-olds, and they were second to blacks in the less-than-or-equal-to-50-years-of-age group, according to data from the National HIV Surveillance System.
“Promotion of care and treatment by public health agencies and private sector partners to achieve viral suppression among MSM with diagnosed HIV infection will improve health outcomes and reduce transmission to others, particularly if prevention efforts are tailored to specific age groups,” the researchers wrote.
SOURCE: Mitsch A et al. MMWR 2018 Sep 21;67(37):1025-31.
Men who have sex with men (MSM) were younger at HIV diagnosis in 2016 than in 2008, but those living with the disease were older, according to the Centers for Disease Control and Prevention.
Among MSM aged 13-29 years, the number diagnosed with HIV increased by 2.9% per year from 2008 to 2016 but dropped 3.5% per year for those aged 30-49 and rose just 0.1% annually among those aged 50 and older. Over the period from 2008 to 2015, the number of MSM aged 50 and older who were living with HIV increased by 10.8% per year, compared with an annual percent change of 7.7% for those aged 13-29 and –0.4% for those aged 30-49, Andrew Mitsch, MPH, and his associates at the CDC’s National Center for HIV/AIDS, Viral Hepatitis, STD, and TB Prevention reported in Morbidity and Mortality Weekly Report.
The size of the population of MSM living with HIV went from 384,000 in 2008 to 523,000 in 2016, with 13- to 29-year-olds going from 10.7% of the population to 13.3%, 30- to 49-year-olds dropping from 61% to 44%, and the 50-and-older group increasing from 28.3% to 42.7%, they said.
“The increase in annual diagnosis of HIV infections among younger MSM might reflect increased HIV testing, in addition to ongoing transmission,” they suggested, and increased prevalence among older men is probably the “result of increased survival associated with widespread use of antiretroviral therapy, surviving middle age, and advancing to the older group.”
The investigators also noted the persistence of racial/ethnic disparities over the course of the study. Among the three largest groups, whites had the smallest increase in new diagnoses for 13- to 29-year-olds and the largest decrease for 30- to 49-year-olds, and they were second to blacks in the less-than-or-equal-to-50-years-of-age group, according to data from the National HIV Surveillance System.
“Promotion of care and treatment by public health agencies and private sector partners to achieve viral suppression among MSM with diagnosed HIV infection will improve health outcomes and reduce transmission to others, particularly if prevention efforts are tailored to specific age groups,” the researchers wrote.
SOURCE: Mitsch A et al. MMWR 2018 Sep 21;67(37):1025-31.
Men who have sex with men (MSM) were younger at HIV diagnosis in 2016 than in 2008, but those living with the disease were older, according to the Centers for Disease Control and Prevention.
Among MSM aged 13-29 years, the number diagnosed with HIV increased by 2.9% per year from 2008 to 2016 but dropped 3.5% per year for those aged 30-49 and rose just 0.1% annually among those aged 50 and older. Over the period from 2008 to 2015, the number of MSM aged 50 and older who were living with HIV increased by 10.8% per year, compared with an annual percent change of 7.7% for those aged 13-29 and –0.4% for those aged 30-49, Andrew Mitsch, MPH, and his associates at the CDC’s National Center for HIV/AIDS, Viral Hepatitis, STD, and TB Prevention reported in Morbidity and Mortality Weekly Report.
The size of the population of MSM living with HIV went from 384,000 in 2008 to 523,000 in 2016, with 13- to 29-year-olds going from 10.7% of the population to 13.3%, 30- to 49-year-olds dropping from 61% to 44%, and the 50-and-older group increasing from 28.3% to 42.7%, they said.
“The increase in annual diagnosis of HIV infections among younger MSM might reflect increased HIV testing, in addition to ongoing transmission,” they suggested, and increased prevalence among older men is probably the “result of increased survival associated with widespread use of antiretroviral therapy, surviving middle age, and advancing to the older group.”
The investigators also noted the persistence of racial/ethnic disparities over the course of the study. Among the three largest groups, whites had the smallest increase in new diagnoses for 13- to 29-year-olds and the largest decrease for 30- to 49-year-olds, and they were second to blacks in the less-than-or-equal-to-50-years-of-age group, according to data from the National HIV Surveillance System.
“Promotion of care and treatment by public health agencies and private sector partners to achieve viral suppression among MSM with diagnosed HIV infection will improve health outcomes and reduce transmission to others, particularly if prevention efforts are tailored to specific age groups,” the researchers wrote.
SOURCE: Mitsch A et al. MMWR 2018 Sep 21;67(37):1025-31.
FROM MMWR
Full disclosure
I have nothing to disclose.
That is the first line on my second slide in just about every talk I give. I have no financial conflicts of interest. I no longer accept meals from pharmaceutical companies, I no longer conduct pharmaceutical company sponsored research, and I no longer give talks that include honoraria from pharmaceutical companies. I turn down payments from pharmaceutical companies when I participate in drug-monitoring safety boards and advisory committees. I do not have a financial conflict of interest.
Or do I?
In preparing to write this essay, I searched the Open Payments website (www.cms.gov/OpenPayments/index.html) for my name. Open Payments is the product of the Physician Payments Sunshine Act passed in 2010 as part of the Affordable Care Act. The website went live in September 2014 with the intention of making public all payments made to physicians from device and drug makers. I was happy to confirm that I have received no “General Payments,” which are payments for meals, travel, honoraria, consulting, and the like. However, I was surprised to learn that I did receive “Associated Research” payments. According to the website, an Associated Research payment is “funding for a research project or study where the physician is named as a principal investigator.”
I still have a few trials open under my name, but none have accrued a patient in more than 7 years. Nonetheless, I am on record, and publicly so, for accepting an Associated payment for research to the tune of $1,308,360.06.
Upon learning this, my thoughts turned to the New York Times. The Times recently published an expose in cooperation with ProPublica. In it, a prominent cancer researcher at Memorial Sloan Kettering was accused of repeatedly failing to disclose his substantial financial conflicts of interest. The payments creating the conflict were listed on the Open Payments website. Since financial disclosure is almost always required for a manuscript listed in PubMed, a simple comparison of two public websites provided the journalists with nearly all the information they needed to conclude malfeasance in disclosure.
In response, the accused admitted the failure to disclose, but attributed it to an unintentional error. In the frenzy that followed, a man of towering stature, a paragon of cancer research, submitted his resignation. The sequence of events was tragic. Had the payments been for research instead of services rendered would the consequences have been the same?
Most of us believe corporate payments for research are less likely to influence our prescribing and consulting habits than are general payments for entertainment and speaking engagements. I remember receiving my first research grant from the now defunct pharma company Immunex. It was for $10,000 – a paltry sum – but enough for me to set up a clinical trial using Immunex’s drugs. I was flattered, indebted, and conflicted from that point forward. Funded research propels our careers forward. Thinking research payments bias our decision making less than direct payments is naive. Money corrupts, and that is why research dollars need to be disclosed whenever we discuss research at the podium or in print.
With appropriate indignation, I explored the Open Payments website to learn more of my hitherto unknown payment. It was attached to a multicenter, randomized clinical trial for which I served as local principal investigator. The payment was made in January 2017 and our research team cannot verify such a payment was ever received. According to the website, the payment was not disputed. I sought to dispute it.
Our friends at the Centers for Medicare and Medicaid Services do not make filing a dispute easy. I first had to register with my home address and create a new password that, of course, needs to be changed every 60 days. I duly registered and logged into the website as instructed. I followed instructions and filled in data fields for about an additional 10 pages before being informed that I needed to logout, then log back in, to access the Open Payments application. When I did that, I was greeted with instructions to register in the Open Payments system. I then realized that all I had done to that point was register with the CMS.gov portal, not Open Payments. In for a dime, in for a dollar, I registered with Open Payments.
I almost gave up when they asked me to provide a Physician Taxonomy Code. It took me a long time to find it. For those interested, the code for Hematology is 207RH0000X. With that code entered in the right box, I was only two pages away from being registered and ready to open the dispute. Failure hit me like a lake effect snow storm. Despite my diligence, I was not “vetted” and could not file a dispute. I must have done something wrong and cannot seem to investigate the payment further, but I’m sure the New York Times could.
Now, I don’t know if I have anything to disclose or not. I do know that I have to investigate my payment the best I can, that I have to disclose it if it is real, and that I have to check Open Payments every so often to make sure I am not surprised by an investigative journalist’s report in the future. Add these to the pantheon of onerous requirements for a successful academic career.
Many wear their entanglements as a badge of honor on slides highlighting a long list of conflicts. One speaker joked that she had so many conflicts that she had no conflicts. Clearly, much like alarm fatigue, the constant display of financial conflict of interest disclosures rarely raises red flags in an audience of peers. To an audience of interested lay persons, though, those conflicts may be very important and relevant.
It is our duty to accurately account for and report them no matter the difficulty in doing so. Failure to do so can carry tragic consequences.
Dr. Kalaycio is editor in chief of Hematology News. He chairs the department of hematologic oncology and blood disorders at Cleveland Clinic Taussig Cancer Institute. Contact him at [email protected].
I have nothing to disclose.
That is the first line on my second slide in just about every talk I give. I have no financial conflicts of interest. I no longer accept meals from pharmaceutical companies, I no longer conduct pharmaceutical company sponsored research, and I no longer give talks that include honoraria from pharmaceutical companies. I turn down payments from pharmaceutical companies when I participate in drug-monitoring safety boards and advisory committees. I do not have a financial conflict of interest.
Or do I?
In preparing to write this essay, I searched the Open Payments website (www.cms.gov/OpenPayments/index.html) for my name. Open Payments is the product of the Physician Payments Sunshine Act passed in 2010 as part of the Affordable Care Act. The website went live in September 2014 with the intention of making public all payments made to physicians from device and drug makers. I was happy to confirm that I have received no “General Payments,” which are payments for meals, travel, honoraria, consulting, and the like. However, I was surprised to learn that I did receive “Associated Research” payments. According to the website, an Associated Research payment is “funding for a research project or study where the physician is named as a principal investigator.”
I still have a few trials open under my name, but none have accrued a patient in more than 7 years. Nonetheless, I am on record, and publicly so, for accepting an Associated payment for research to the tune of $1,308,360.06.
Upon learning this, my thoughts turned to the New York Times. The Times recently published an expose in cooperation with ProPublica. In it, a prominent cancer researcher at Memorial Sloan Kettering was accused of repeatedly failing to disclose his substantial financial conflicts of interest. The payments creating the conflict were listed on the Open Payments website. Since financial disclosure is almost always required for a manuscript listed in PubMed, a simple comparison of two public websites provided the journalists with nearly all the information they needed to conclude malfeasance in disclosure.
In response, the accused admitted the failure to disclose, but attributed it to an unintentional error. In the frenzy that followed, a man of towering stature, a paragon of cancer research, submitted his resignation. The sequence of events was tragic. Had the payments been for research instead of services rendered would the consequences have been the same?
Most of us believe corporate payments for research are less likely to influence our prescribing and consulting habits than are general payments for entertainment and speaking engagements. I remember receiving my first research grant from the now defunct pharma company Immunex. It was for $10,000 – a paltry sum – but enough for me to set up a clinical trial using Immunex’s drugs. I was flattered, indebted, and conflicted from that point forward. Funded research propels our careers forward. Thinking research payments bias our decision making less than direct payments is naive. Money corrupts, and that is why research dollars need to be disclosed whenever we discuss research at the podium or in print.
With appropriate indignation, I explored the Open Payments website to learn more of my hitherto unknown payment. It was attached to a multicenter, randomized clinical trial for which I served as local principal investigator. The payment was made in January 2017 and our research team cannot verify such a payment was ever received. According to the website, the payment was not disputed. I sought to dispute it.
Our friends at the Centers for Medicare and Medicaid Services do not make filing a dispute easy. I first had to register with my home address and create a new password that, of course, needs to be changed every 60 days. I duly registered and logged into the website as instructed. I followed instructions and filled in data fields for about an additional 10 pages before being informed that I needed to logout, then log back in, to access the Open Payments application. When I did that, I was greeted with instructions to register in the Open Payments system. I then realized that all I had done to that point was register with the CMS.gov portal, not Open Payments. In for a dime, in for a dollar, I registered with Open Payments.
I almost gave up when they asked me to provide a Physician Taxonomy Code. It took me a long time to find it. For those interested, the code for Hematology is 207RH0000X. With that code entered in the right box, I was only two pages away from being registered and ready to open the dispute. Failure hit me like a lake effect snow storm. Despite my diligence, I was not “vetted” and could not file a dispute. I must have done something wrong and cannot seem to investigate the payment further, but I’m sure the New York Times could.
Now, I don’t know if I have anything to disclose or not. I do know that I have to investigate my payment the best I can, that I have to disclose it if it is real, and that I have to check Open Payments every so often to make sure I am not surprised by an investigative journalist’s report in the future. Add these to the pantheon of onerous requirements for a successful academic career.
Many wear their entanglements as a badge of honor on slides highlighting a long list of conflicts. One speaker joked that she had so many conflicts that she had no conflicts. Clearly, much like alarm fatigue, the constant display of financial conflict of interest disclosures rarely raises red flags in an audience of peers. To an audience of interested lay persons, though, those conflicts may be very important and relevant.
It is our duty to accurately account for and report them no matter the difficulty in doing so. Failure to do so can carry tragic consequences.
Dr. Kalaycio is editor in chief of Hematology News. He chairs the department of hematologic oncology and blood disorders at Cleveland Clinic Taussig Cancer Institute. Contact him at [email protected].
I have nothing to disclose.
That is the first line on my second slide in just about every talk I give. I have no financial conflicts of interest. I no longer accept meals from pharmaceutical companies, I no longer conduct pharmaceutical company sponsored research, and I no longer give talks that include honoraria from pharmaceutical companies. I turn down payments from pharmaceutical companies when I participate in drug-monitoring safety boards and advisory committees. I do not have a financial conflict of interest.
Or do I?
In preparing to write this essay, I searched the Open Payments website (www.cms.gov/OpenPayments/index.html) for my name. Open Payments is the product of the Physician Payments Sunshine Act passed in 2010 as part of the Affordable Care Act. The website went live in September 2014 with the intention of making public all payments made to physicians from device and drug makers. I was happy to confirm that I have received no “General Payments,” which are payments for meals, travel, honoraria, consulting, and the like. However, I was surprised to learn that I did receive “Associated Research” payments. According to the website, an Associated Research payment is “funding for a research project or study where the physician is named as a principal investigator.”
I still have a few trials open under my name, but none have accrued a patient in more than 7 years. Nonetheless, I am on record, and publicly so, for accepting an Associated payment for research to the tune of $1,308,360.06.
Upon learning this, my thoughts turned to the New York Times. The Times recently published an expose in cooperation with ProPublica. In it, a prominent cancer researcher at Memorial Sloan Kettering was accused of repeatedly failing to disclose his substantial financial conflicts of interest. The payments creating the conflict were listed on the Open Payments website. Since financial disclosure is almost always required for a manuscript listed in PubMed, a simple comparison of two public websites provided the journalists with nearly all the information they needed to conclude malfeasance in disclosure.
In response, the accused admitted the failure to disclose, but attributed it to an unintentional error. In the frenzy that followed, a man of towering stature, a paragon of cancer research, submitted his resignation. The sequence of events was tragic. Had the payments been for research instead of services rendered would the consequences have been the same?
Most of us believe corporate payments for research are less likely to influence our prescribing and consulting habits than are general payments for entertainment and speaking engagements. I remember receiving my first research grant from the now defunct pharma company Immunex. It was for $10,000 – a paltry sum – but enough for me to set up a clinical trial using Immunex’s drugs. I was flattered, indebted, and conflicted from that point forward. Funded research propels our careers forward. Thinking research payments bias our decision making less than direct payments is naive. Money corrupts, and that is why research dollars need to be disclosed whenever we discuss research at the podium or in print.
With appropriate indignation, I explored the Open Payments website to learn more of my hitherto unknown payment. It was attached to a multicenter, randomized clinical trial for which I served as local principal investigator. The payment was made in January 2017 and our research team cannot verify such a payment was ever received. According to the website, the payment was not disputed. I sought to dispute it.
Our friends at the Centers for Medicare and Medicaid Services do not make filing a dispute easy. I first had to register with my home address and create a new password that, of course, needs to be changed every 60 days. I duly registered and logged into the website as instructed. I followed instructions and filled in data fields for about an additional 10 pages before being informed that I needed to logout, then log back in, to access the Open Payments application. When I did that, I was greeted with instructions to register in the Open Payments system. I then realized that all I had done to that point was register with the CMS.gov portal, not Open Payments. In for a dime, in for a dollar, I registered with Open Payments.
I almost gave up when they asked me to provide a Physician Taxonomy Code. It took me a long time to find it. For those interested, the code for Hematology is 207RH0000X. With that code entered in the right box, I was only two pages away from being registered and ready to open the dispute. Failure hit me like a lake effect snow storm. Despite my diligence, I was not “vetted” and could not file a dispute. I must have done something wrong and cannot seem to investigate the payment further, but I’m sure the New York Times could.
Now, I don’t know if I have anything to disclose or not. I do know that I have to investigate my payment the best I can, that I have to disclose it if it is real, and that I have to check Open Payments every so often to make sure I am not surprised by an investigative journalist’s report in the future. Add these to the pantheon of onerous requirements for a successful academic career.
Many wear their entanglements as a badge of honor on slides highlighting a long list of conflicts. One speaker joked that she had so many conflicts that she had no conflicts. Clearly, much like alarm fatigue, the constant display of financial conflict of interest disclosures rarely raises red flags in an audience of peers. To an audience of interested lay persons, though, those conflicts may be very important and relevant.
It is our duty to accurately account for and report them no matter the difficulty in doing so. Failure to do so can carry tragic consequences.
Dr. Kalaycio is editor in chief of Hematology News. He chairs the department of hematologic oncology and blood disorders at Cleveland Clinic Taussig Cancer Institute. Contact him at [email protected].
Transgender health survey provides data on nearly 28,000 individuals
WASHINGTON – Respondents to the 2015 United States Transgender Survey (USTS) reported living with HIV at nearly five times the rate in the U.S. population. Reported HIV rates were even higher among transgender women, especially transgender women of color, according to Sandy James, JD, PhD, the lead author of the USTS and its former research director (2014-2017).
In addition, the survey results detailed high rates of physical and mental health issues, difficulties accessing health care, and negative experiences when receiving medical care.
“There [had been] a dearth of data available about trans people,” said Dr. James, and hard data are required to make any meaningful changes to health care systems, but “now we have numbers.”
The nationwide USTS was the largest survey ever to document the experiences of transgender adults in the United States, comprising 27,715 respondents from all 50 states, the District of Columbia, American Samoa, Guam, Puerto Rico, and U.S. military bases overseas.
The USTS provided a comprehensive examination of a wide range of life outcomes, including those related to health, employment, income, and education. This survey of transgender adults (18 years of age and older) was anonymous, was available in both English and Spanish, and was conducted in the summer of 2015 by the National Center for Transgender Equality.
The document details the stresses and dangers that transgender people face in their daily lives, including attempted suicide rates higher than the norm (40% having attempted suicide in their lifetime, nearly nine times the 4.6% rate in the U.S. population). Nearly 1 in 10 respondents were physically attacked in the past year because of being transgender, and nearly half (47%) of respondents reported having been sexually assaulted during their lifetime.
Respondents reported living with HIV (1.4%) at nearly five times the rate in the U.S. population (0.3%), with HIV rates higher among transgender women (3.4%), especially transgender women of color. Nearly one in five black transgender women were living with HIV, and Native American Indian and Latina women also reported higher rates of infection: 4.6% and 4.4%, respectively.
A total of 25% of respondents experienced a problem in the past year with their insurance related to being transgender, such as being denied coverage for care related to gender transition or being denied coverage for routine care because they were transgender.
In terms of the health care environment, 33% of those who saw a health care provider in the past year reported having at least one negative experience related to being transgender, with higher rates for people of color and people with disabilities. This included being refused treatment, being verbally harassed or physically or sexually assaulted, or having to teach the provider about transgender people to get appropriate care, according to the survey.
In addition, 23% of respondents reported that they did not see a doctor when they needed to in the past year because of fear of being mistreated as a transgender person, and 33% did not see a doctor when needed because they could not afford care.
“I urge you to go and find the survey and look at all of the results, it is really important,” Dr. James stated. He stressed the fact that the breakout reports, including the report on black respondents, the Latino/a response report (in both English and Spanish), and the other minority and individual state reports, can all provide a more detailed view of what is going on in the transgender community than anything previously available.
Dr. James reported having no disclosures.
SOURCE: James S. Sexually Transmitted Diseases 2018. 45 [Supplement 2] Session 5D. S289.
WASHINGTON – Respondents to the 2015 United States Transgender Survey (USTS) reported living with HIV at nearly five times the rate in the U.S. population. Reported HIV rates were even higher among transgender women, especially transgender women of color, according to Sandy James, JD, PhD, the lead author of the USTS and its former research director (2014-2017).
In addition, the survey results detailed high rates of physical and mental health issues, difficulties accessing health care, and negative experiences when receiving medical care.
“There [had been] a dearth of data available about trans people,” said Dr. James, and hard data are required to make any meaningful changes to health care systems, but “now we have numbers.”
The nationwide USTS was the largest survey ever to document the experiences of transgender adults in the United States, comprising 27,715 respondents from all 50 states, the District of Columbia, American Samoa, Guam, Puerto Rico, and U.S. military bases overseas.
The USTS provided a comprehensive examination of a wide range of life outcomes, including those related to health, employment, income, and education. This survey of transgender adults (18 years of age and older) was anonymous, was available in both English and Spanish, and was conducted in the summer of 2015 by the National Center for Transgender Equality.
The document details the stresses and dangers that transgender people face in their daily lives, including attempted suicide rates higher than the norm (40% having attempted suicide in their lifetime, nearly nine times the 4.6% rate in the U.S. population). Nearly 1 in 10 respondents were physically attacked in the past year because of being transgender, and nearly half (47%) of respondents reported having been sexually assaulted during their lifetime.
Respondents reported living with HIV (1.4%) at nearly five times the rate in the U.S. population (0.3%), with HIV rates higher among transgender women (3.4%), especially transgender women of color. Nearly one in five black transgender women were living with HIV, and Native American Indian and Latina women also reported higher rates of infection: 4.6% and 4.4%, respectively.
A total of 25% of respondents experienced a problem in the past year with their insurance related to being transgender, such as being denied coverage for care related to gender transition or being denied coverage for routine care because they were transgender.
In terms of the health care environment, 33% of those who saw a health care provider in the past year reported having at least one negative experience related to being transgender, with higher rates for people of color and people with disabilities. This included being refused treatment, being verbally harassed or physically or sexually assaulted, or having to teach the provider about transgender people to get appropriate care, according to the survey.
In addition, 23% of respondents reported that they did not see a doctor when they needed to in the past year because of fear of being mistreated as a transgender person, and 33% did not see a doctor when needed because they could not afford care.
“I urge you to go and find the survey and look at all of the results, it is really important,” Dr. James stated. He stressed the fact that the breakout reports, including the report on black respondents, the Latino/a response report (in both English and Spanish), and the other minority and individual state reports, can all provide a more detailed view of what is going on in the transgender community than anything previously available.
Dr. James reported having no disclosures.
SOURCE: James S. Sexually Transmitted Diseases 2018. 45 [Supplement 2] Session 5D. S289.
WASHINGTON – Respondents to the 2015 United States Transgender Survey (USTS) reported living with HIV at nearly five times the rate in the U.S. population. Reported HIV rates were even higher among transgender women, especially transgender women of color, according to Sandy James, JD, PhD, the lead author of the USTS and its former research director (2014-2017).
In addition, the survey results detailed high rates of physical and mental health issues, difficulties accessing health care, and negative experiences when receiving medical care.
“There [had been] a dearth of data available about trans people,” said Dr. James, and hard data are required to make any meaningful changes to health care systems, but “now we have numbers.”
The nationwide USTS was the largest survey ever to document the experiences of transgender adults in the United States, comprising 27,715 respondents from all 50 states, the District of Columbia, American Samoa, Guam, Puerto Rico, and U.S. military bases overseas.
The USTS provided a comprehensive examination of a wide range of life outcomes, including those related to health, employment, income, and education. This survey of transgender adults (18 years of age and older) was anonymous, was available in both English and Spanish, and was conducted in the summer of 2015 by the National Center for Transgender Equality.
The document details the stresses and dangers that transgender people face in their daily lives, including attempted suicide rates higher than the norm (40% having attempted suicide in their lifetime, nearly nine times the 4.6% rate in the U.S. population). Nearly 1 in 10 respondents were physically attacked in the past year because of being transgender, and nearly half (47%) of respondents reported having been sexually assaulted during their lifetime.
Respondents reported living with HIV (1.4%) at nearly five times the rate in the U.S. population (0.3%), with HIV rates higher among transgender women (3.4%), especially transgender women of color. Nearly one in five black transgender women were living with HIV, and Native American Indian and Latina women also reported higher rates of infection: 4.6% and 4.4%, respectively.
A total of 25% of respondents experienced a problem in the past year with their insurance related to being transgender, such as being denied coverage for care related to gender transition or being denied coverage for routine care because they were transgender.
In terms of the health care environment, 33% of those who saw a health care provider in the past year reported having at least one negative experience related to being transgender, with higher rates for people of color and people with disabilities. This included being refused treatment, being verbally harassed or physically or sexually assaulted, or having to teach the provider about transgender people to get appropriate care, according to the survey.
In addition, 23% of respondents reported that they did not see a doctor when they needed to in the past year because of fear of being mistreated as a transgender person, and 33% did not see a doctor when needed because they could not afford care.
“I urge you to go and find the survey and look at all of the results, it is really important,” Dr. James stated. He stressed the fact that the breakout reports, including the report on black respondents, the Latino/a response report (in both English and Spanish), and the other minority and individual state reports, can all provide a more detailed view of what is going on in the transgender community than anything previously available.
Dr. James reported having no disclosures.
SOURCE: James S. Sexually Transmitted Diseases 2018. 45 [Supplement 2] Session 5D. S289.
FROM THE STD PREVENTION CONFERENCE 2018
Key clinical point: The 2015 U.S. Transgender Survey provides more data on transgender life and health than ever previously available.
Major finding: Transgender respondents reported living with HIV at nearly five times the rate in the U.S. population.
Study details: Results from an anonymous, online survey of nearly 28,000 transgender individuals in the United States and its territories.
Disclosures: Dr. James reported having no disclosures.
Source: James S. Sexually Transmitted Diseases 2018. 45 [Supplement 2] Session 5D. S28.
New perspectives keep SHM relevant
Atashi Mandal, MD, finds committee work illuminating and gratifying
Editor’s note: SHM occasionally puts the spotlight on some of our most active members who are making substantial contributions to hospital medicine. Visit www.hospitalmedicine.org for more information on how you can lend your expertise to help improve the care of hospitalized patients.
This month, The Hospitalist spotlights Atashi Mandal, MD , a Med-Peds hospitalist in Huntington Beach, Calif. Dr. Mandal has been a member of SHM since for more than a decade, has served on the Public Policy Committee, and is currently serving on the Patient Experience Committee.

How did you initially hear about SHM, and why did you become a member?
I was a newly minted hospitalist and eagerly searching for a way to use my CME allowance, when I discovered SHM’s annual conference, which happened to be nearby in San Diego that year. I also was intrigued by, and excited to learn more about, an organization that dedicated itself only to hospital medicine. After attending the conference, I was hooked!
As a member of more than a decade, what aspects of your membership have you found to be most valuable?
I’ve always been very impressed by the quality and variety of the educational offerings. As a Med-Peds hospitalist, I can happily attest to greater inclusion of pediatric-specific content and a more robust presence of pediatric hospitalists over the years. Moreover, I am very appreciative of SHM’s progressive attitude as demonstrated by incorporating topics such as gender disparities, LGBTQ health, and the opioid crisis into our curriculum. I also have greatly enjoyed the networking opportunities with fellow hospitalists, some of whom I am happy to say have also become good friends over the years. More recently over the past few years, I’ve participated on committees, which has been an illuminating and gratifying way to help shape SHM’s current and future directives.
Describe your role on the Public Policy Committee. What did the committee accomplish during your term?
I was very honored to serve as a member of this committee for three terms. The staff is truly superhuman and amazing, considering how well they stay abreast of the swiftly changing administrative and legislative currents in health care. Just during my tenure as an SHM member, we’ve witnessed paramount shifts in our practice and culture, from the passage of MACRA, [the Medicare Access and CHIP Reauthorization Act] to the opioid epidemic. The Public Policy Committee identifies issues that affect our practice as hospitalists and advocates on our behalf through various means, from submitting comments and letters as well as personally meeting with our regulatory agencies such as CMS [Centers for Medicare & Medicaid Services], and our federal legislators. Some major victories were the acquisition of our specialty billing code and approval of an advanced care billing code. Additionally, the committee has been tirelessly advocating for reform with observation status. We have submitted comments to legislative committees regarding the opioid crisis and continue to work with MACRA as it affects our membership. While I served, I took a special interest in mental health and pediatric issues, including CHIP [Children’s Health Insurance Program] reauthorization and the 21st Century Cures Act.
What is Hill Day, and what can Hospital Medicine 2019 attendees expect to gain from participating?
Hill Day is a truly educational, exciting – and most important – fun opportunity to hone our advocacy skills and gain some real-world experience interacting with legislators and their staffs. On the last day of the annual conference attendees can travel to D.C., where we will spend about a half-day meeting with our respective state’s legislators or their staff. We typically discuss two or three preselected bills that can directly impact our practice as hospitalists. The legislators and their staffers generally are not aware of how certain legislative items can greatly benefit or adversely affect our patients, and they therefore rely on front-line clinicians like us to provide this narrative, much to their gratitude. I learn a lot and have even more fun each time I go to Capitol Hill, so I strongly encourage everyone to participate in this unique opportunity.
Do you have any advice for early-career hospitalists looking to gain experience and get involved with SHM?
I would encourage you to find your voice and participate! Whether by joining a committee or a Special Interest Group or just chatting on one of the many stimulating forums, we each have something to bring to the table, irrespective of our tenure as hospitalists. The new perspectives mingling with those that are well established is what keeps our organization relevant, so I look forward to new ideas and fresh faces!
Ms. Steele is a marketing communications specialist at the Society of Hospital Medicine.
Atashi Mandal, MD, finds committee work illuminating and gratifying
Atashi Mandal, MD, finds committee work illuminating and gratifying
Editor’s note: SHM occasionally puts the spotlight on some of our most active members who are making substantial contributions to hospital medicine. Visit www.hospitalmedicine.org for more information on how you can lend your expertise to help improve the care of hospitalized patients.
This month, The Hospitalist spotlights Atashi Mandal, MD , a Med-Peds hospitalist in Huntington Beach, Calif. Dr. Mandal has been a member of SHM since for more than a decade, has served on the Public Policy Committee, and is currently serving on the Patient Experience Committee.
How did you initially hear about SHM, and why did you become a member?
I was a newly minted hospitalist and eagerly searching for a way to use my CME allowance, when I discovered SHM’s annual conference, which happened to be nearby in San Diego that year. I also was intrigued by, and excited to learn more about, an organization that dedicated itself only to hospital medicine. After attending the conference, I was hooked!
As a member of more than a decade, what aspects of your membership have you found to be most valuable?
I’ve always been very impressed by the quality and variety of the educational offerings. As a Med-Peds hospitalist, I can happily attest to greater inclusion of pediatric-specific content and a more robust presence of pediatric hospitalists over the years. Moreover, I am very appreciative of SHM’s progressive attitude as demonstrated by incorporating topics such as gender disparities, LGBTQ health, and the opioid crisis into our curriculum. I also have greatly enjoyed the networking opportunities with fellow hospitalists, some of whom I am happy to say have also become good friends over the years. More recently over the past few years, I’ve participated on committees, which has been an illuminating and gratifying way to help shape SHM’s current and future directives.
Describe your role on the Public Policy Committee. What did the committee accomplish during your term?
I was very honored to serve as a member of this committee for three terms. The staff is truly superhuman and amazing, considering how well they stay abreast of the swiftly changing administrative and legislative currents in health care. Just during my tenure as an SHM member, we’ve witnessed paramount shifts in our practice and culture, from the passage of MACRA, [the Medicare Access and CHIP Reauthorization Act] to the opioid epidemic. The Public Policy Committee identifies issues that affect our practice as hospitalists and advocates on our behalf through various means, from submitting comments and letters as well as personally meeting with our regulatory agencies such as CMS [Centers for Medicare & Medicaid Services], and our federal legislators. Some major victories were the acquisition of our specialty billing code and approval of an advanced care billing code. Additionally, the committee has been tirelessly advocating for reform with observation status. We have submitted comments to legislative committees regarding the opioid crisis and continue to work with MACRA as it affects our membership. While I served, I took a special interest in mental health and pediatric issues, including CHIP [Children’s Health Insurance Program] reauthorization and the 21st Century Cures Act.
What is Hill Day, and what can Hospital Medicine 2019 attendees expect to gain from participating?
Hill Day is a truly educational, exciting – and most important – fun opportunity to hone our advocacy skills and gain some real-world experience interacting with legislators and their staffs. On the last day of the annual conference attendees can travel to D.C., where we will spend about a half-day meeting with our respective state’s legislators or their staff. We typically discuss two or three preselected bills that can directly impact our practice as hospitalists. The legislators and their staffers generally are not aware of how certain legislative items can greatly benefit or adversely affect our patients, and they therefore rely on front-line clinicians like us to provide this narrative, much to their gratitude. I learn a lot and have even more fun each time I go to Capitol Hill, so I strongly encourage everyone to participate in this unique opportunity.
Do you have any advice for early-career hospitalists looking to gain experience and get involved with SHM?
I would encourage you to find your voice and participate! Whether by joining a committee or a Special Interest Group or just chatting on one of the many stimulating forums, we each have something to bring to the table, irrespective of our tenure as hospitalists. The new perspectives mingling with those that are well established is what keeps our organization relevant, so I look forward to new ideas and fresh faces!
Ms. Steele is a marketing communications specialist at the Society of Hospital Medicine.
Editor’s note: SHM occasionally puts the spotlight on some of our most active members who are making substantial contributions to hospital medicine. Visit www.hospitalmedicine.org for more information on how you can lend your expertise to help improve the care of hospitalized patients.
This month, The Hospitalist spotlights Atashi Mandal, MD , a Med-Peds hospitalist in Huntington Beach, Calif. Dr. Mandal has been a member of SHM since for more than a decade, has served on the Public Policy Committee, and is currently serving on the Patient Experience Committee.
How did you initially hear about SHM, and why did you become a member?
I was a newly minted hospitalist and eagerly searching for a way to use my CME allowance, when I discovered SHM’s annual conference, which happened to be nearby in San Diego that year. I also was intrigued by, and excited to learn more about, an organization that dedicated itself only to hospital medicine. After attending the conference, I was hooked!
As a member of more than a decade, what aspects of your membership have you found to be most valuable?
I’ve always been very impressed by the quality and variety of the educational offerings. As a Med-Peds hospitalist, I can happily attest to greater inclusion of pediatric-specific content and a more robust presence of pediatric hospitalists over the years. Moreover, I am very appreciative of SHM’s progressive attitude as demonstrated by incorporating topics such as gender disparities, LGBTQ health, and the opioid crisis into our curriculum. I also have greatly enjoyed the networking opportunities with fellow hospitalists, some of whom I am happy to say have also become good friends over the years. More recently over the past few years, I’ve participated on committees, which has been an illuminating and gratifying way to help shape SHM’s current and future directives.
Describe your role on the Public Policy Committee. What did the committee accomplish during your term?
I was very honored to serve as a member of this committee for three terms. The staff is truly superhuman and amazing, considering how well they stay abreast of the swiftly changing administrative and legislative currents in health care. Just during my tenure as an SHM member, we’ve witnessed paramount shifts in our practice and culture, from the passage of MACRA, [the Medicare Access and CHIP Reauthorization Act] to the opioid epidemic. The Public Policy Committee identifies issues that affect our practice as hospitalists and advocates on our behalf through various means, from submitting comments and letters as well as personally meeting with our regulatory agencies such as CMS [Centers for Medicare & Medicaid Services], and our federal legislators. Some major victories were the acquisition of our specialty billing code and approval of an advanced care billing code. Additionally, the committee has been tirelessly advocating for reform with observation status. We have submitted comments to legislative committees regarding the opioid crisis and continue to work with MACRA as it affects our membership. While I served, I took a special interest in mental health and pediatric issues, including CHIP [Children’s Health Insurance Program] reauthorization and the 21st Century Cures Act.
What is Hill Day, and what can Hospital Medicine 2019 attendees expect to gain from participating?
Hill Day is a truly educational, exciting – and most important – fun opportunity to hone our advocacy skills and gain some real-world experience interacting with legislators and their staffs. On the last day of the annual conference attendees can travel to D.C., where we will spend about a half-day meeting with our respective state’s legislators or their staff. We typically discuss two or three preselected bills that can directly impact our practice as hospitalists. The legislators and their staffers generally are not aware of how certain legislative items can greatly benefit or adversely affect our patients, and they therefore rely on front-line clinicians like us to provide this narrative, much to their gratitude. I learn a lot and have even more fun each time I go to Capitol Hill, so I strongly encourage everyone to participate in this unique opportunity.
Do you have any advice for early-career hospitalists looking to gain experience and get involved with SHM?
I would encourage you to find your voice and participate! Whether by joining a committee or a Special Interest Group or just chatting on one of the many stimulating forums, we each have something to bring to the table, irrespective of our tenure as hospitalists. The new perspectives mingling with those that are well established is what keeps our organization relevant, so I look forward to new ideas and fresh faces!
Ms. Steele is a marketing communications specialist at the Society of Hospital Medicine.
Burden of dementia will shift more to minorities by 2060
, according to a study in Alzheimer’s and Dementia.
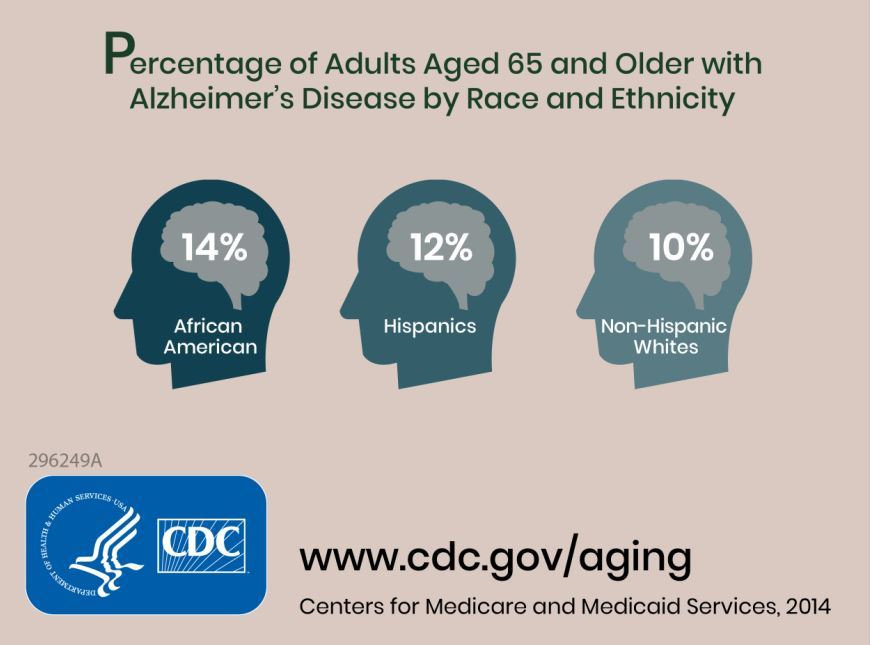
Prior to this study, no research had defined future estimates based on projected changes among demographic groups.
Researchers combined information about the prevalence of Alzheimer’s disease and related dementias (ADRD) by demographic group in 2014 Medicare-Fee-for-Service data with population projections data from the U.S. Census Bureau to assess how existing disparities by demographic group will change as those demographic groups become more or less represented in the U.S. population. They estimated the future prevalence of ADRD for 70 subgroups; these groups were defined by sex, seven racial and ethnic groups, and five age groups. The researchers estimated that in 2014 African Americans had the highest prevalence of ADRD at 13.8%, followed by Hispanics at 12.2%, non-Hispanic whites at 10.3%, American Indian and Alaska Natives at 9.1%, and Asian and Pacific Islanders at 8.4%.
The researchers estimated an overall increase from about 5.0 million people (1.9% of the U.S. population) in 2014 to about 13.9 million (3.3% of the population) in 2060. The non-Hispanic whites group will have the largest total number of cases of ADRD in 2060 because of its relative size, compared with other subgroups, going from about 3.7 million in 2014 to 7.1 million. The ADRD prevalence in non-Hispanic whites will begin to plateau around 2030, whereas the Hispanic population is expected to see the greatest increase, going from 430,000 in 2014 to 3.2 million in 2060.
Some of the limitations of the study include the assumption that the Medicare Fee-for-Service population is representative of the U.S. population and that these prevalences will remain constant over time.
“These estimates can be used for public health planning related to providing culturally competent care for the ADRD population and supporting caregivers from diverse backgrounds,” the researchers concluded.
SOURCE: Matthews KA et al. Alzheimers Dement. 2018 Sep 19. doi: 10.1016/j.jalz.2018.06.3063.
This article was updated 10/4/18.
, according to a study in Alzheimer’s and Dementia.
Prior to this study, no research had defined future estimates based on projected changes among demographic groups.
Researchers combined information about the prevalence of Alzheimer’s disease and related dementias (ADRD) by demographic group in 2014 Medicare-Fee-for-Service data with population projections data from the U.S. Census Bureau to assess how existing disparities by demographic group will change as those demographic groups become more or less represented in the U.S. population. They estimated the future prevalence of ADRD for 70 subgroups; these groups were defined by sex, seven racial and ethnic groups, and five age groups. The researchers estimated that in 2014 African Americans had the highest prevalence of ADRD at 13.8%, followed by Hispanics at 12.2%, non-Hispanic whites at 10.3%, American Indian and Alaska Natives at 9.1%, and Asian and Pacific Islanders at 8.4%.
The researchers estimated an overall increase from about 5.0 million people (1.9% of the U.S. population) in 2014 to about 13.9 million (3.3% of the population) in 2060. The non-Hispanic whites group will have the largest total number of cases of ADRD in 2060 because of its relative size, compared with other subgroups, going from about 3.7 million in 2014 to 7.1 million. The ADRD prevalence in non-Hispanic whites will begin to plateau around 2030, whereas the Hispanic population is expected to see the greatest increase, going from 430,000 in 2014 to 3.2 million in 2060.
Some of the limitations of the study include the assumption that the Medicare Fee-for-Service population is representative of the U.S. population and that these prevalences will remain constant over time.
“These estimates can be used for public health planning related to providing culturally competent care for the ADRD population and supporting caregivers from diverse backgrounds,” the researchers concluded.
SOURCE: Matthews KA et al. Alzheimers Dement. 2018 Sep 19. doi: 10.1016/j.jalz.2018.06.3063.
This article was updated 10/4/18.
, according to a study in Alzheimer’s and Dementia.
Prior to this study, no research had defined future estimates based on projected changes among demographic groups.
Researchers combined information about the prevalence of Alzheimer’s disease and related dementias (ADRD) by demographic group in 2014 Medicare-Fee-for-Service data with population projections data from the U.S. Census Bureau to assess how existing disparities by demographic group will change as those demographic groups become more or less represented in the U.S. population. They estimated the future prevalence of ADRD for 70 subgroups; these groups were defined by sex, seven racial and ethnic groups, and five age groups. The researchers estimated that in 2014 African Americans had the highest prevalence of ADRD at 13.8%, followed by Hispanics at 12.2%, non-Hispanic whites at 10.3%, American Indian and Alaska Natives at 9.1%, and Asian and Pacific Islanders at 8.4%.
The researchers estimated an overall increase from about 5.0 million people (1.9% of the U.S. population) in 2014 to about 13.9 million (3.3% of the population) in 2060. The non-Hispanic whites group will have the largest total number of cases of ADRD in 2060 because of its relative size, compared with other subgroups, going from about 3.7 million in 2014 to 7.1 million. The ADRD prevalence in non-Hispanic whites will begin to plateau around 2030, whereas the Hispanic population is expected to see the greatest increase, going from 430,000 in 2014 to 3.2 million in 2060.
Some of the limitations of the study include the assumption that the Medicare Fee-for-Service population is representative of the U.S. population and that these prevalences will remain constant over time.
“These estimates can be used for public health planning related to providing culturally competent care for the ADRD population and supporting caregivers from diverse backgrounds,” the researchers concluded.
SOURCE: Matthews KA et al. Alzheimers Dement. 2018 Sep 19. doi: 10.1016/j.jalz.2018.06.3063.
This article was updated 10/4/18.
FROM ALZHEIMER’S AND DEMENTIA