User login
New analysis improves understanding of PHACE syndrome
LAKE TAHOE, CALIF. –
In addition, children with isolated S2 or parotid hemangiomas should be recognized as having lower risk for PHACE, and specifics of evaluation should be discussed with parents on a case-by-case basis.

Those are key findings from a retrospective cohort study presented by Colleen Cotton, MD, at the annual meeting of the Society for Pediatric Dermatology.
An association between large facial hemangiomas and multiple abnormalities was described as early as 1978, but it wasn’t until 1996 that researchers first proposed the term PHACE to describe the association (Arch Dermatol. 1996;132[3]:307-11). As the National Institutes of Health explain, “PHACE is an acronym for a neurocutaneous syndrome encompassing the following features: posterior fossa brain malformations, hemangiomas of the face, arterial anomalies, cardiac anomalies, and eye abnormalities.” Official diagnostic criteria for PHACE were not established until 2009 (Pediatrics. 2009;124[5]:1447-56) and were updated in 2016 (J Pediatr. 2016;178:24-33.e2).
“A multicenter, prospective, cohort study published in 2010 estimated the incidence of PHACE to be 31% in patients with large facial hemangiomas, while a retrospective study published in 2017 estimated the incidence to be as high as 58%,” Dr. Cotton, chief dermatology resident at the University of Arizona, Tucson, said in an interview in advance of the meeting. “With the current understanding of risk for PHACE, any child with a facial hemangioma of greater than or equal to 5 cm in diameter receives a full work-up for the syndrome. However, there has been anecdotal evidence that patients with certain subtypes of hemangiomas (such as parotid hemangiomas) may not carry this same risk.”
In what is believed to be the largest study of its kind, Dr. Cotton and her associates retrospectively analyzed data from 244 patients from 13 pediatric dermatology centers who were fully evaluated for PHACE between August 2009 and December 2014. The investigators also performed subgroup analyses on different hemangioma characteristics, including parotid hemangiomas and specific facial segments of involvement. All patients underwent magnetic resonance imaging/magnetic resonance angiography of the head and neck, and the researchers collected data on age at diagnosis; gender; patterns of hemangioma presentation, including location, size, and depth; diagnostic procedures and results; and type and number of associated anomalies. An expert reviewed photographs or diagrams to confirm facial segment locations.
Of the 244 patients, 34.7% met criteria for PHACE syndrome. On multivariate analysis, the following factors were found to be independently and significantly associated with a risk for PHACE: bilateral location (positive predictive value, 54.9%), S1 involvement (PPV, 49.5%), S3 involvement (PPV, 39.5%), and area greater than 25cm2 (PPV, 44.8%), with a P value less than .05 for all associations.
Risk of PHACE also increased with the number of locations involved, with a sharp increase observed at three or more locations (PPV, 65.5%; P less than .001). In patients with one unilateral segment involved, S2 and S3 carried a significantly lower risk (P less than .03). Parotid hemangiomas had a negative predictive value of 80.4% (P = .035).
“While we found that patients with parotid hemangiomas had a lower risk of PHACE, 10 patients with parotid hemangiomas did have PHACE, and 90% of those patients had cerebral arterial anomalies,” Dr. Cotton said. “However, only one of these patients had an isolated unilateral parotid hemangioma without other facial segment involvement. Additionally, two patients with isolated involvement of the midcheek below the eye [the S2 location, which was another low risk segment] also had PHACE, both of whom would have been missed without MRI/MRA [magnetic resonance angiography].”
She acknowledged certain limitations of the study, including its retrospective design. “Additionally, many of the very large hemangiomas were not measured in size, and so, estimated sizes needed to be used in calculating relationship of hemangioma size with risk of PHACE,” she said.
The study was funded in part by a grant from the Pediatric Dermatology Research Alliance.* Dr. Cotton reported having no relevant financial disclosures.
Correction, 7/20/18: An earlier version of this article misstated the name of the Pediatric Dermatology Research Alliance.
LAKE TAHOE, CALIF. –
In addition, children with isolated S2 or parotid hemangiomas should be recognized as having lower risk for PHACE, and specifics of evaluation should be discussed with parents on a case-by-case basis.
Those are key findings from a retrospective cohort study presented by Colleen Cotton, MD, at the annual meeting of the Society for Pediatric Dermatology.
An association between large facial hemangiomas and multiple abnormalities was described as early as 1978, but it wasn’t until 1996 that researchers first proposed the term PHACE to describe the association (Arch Dermatol. 1996;132[3]:307-11). As the National Institutes of Health explain, “PHACE is an acronym for a neurocutaneous syndrome encompassing the following features: posterior fossa brain malformations, hemangiomas of the face, arterial anomalies, cardiac anomalies, and eye abnormalities.” Official diagnostic criteria for PHACE were not established until 2009 (Pediatrics. 2009;124[5]:1447-56) and were updated in 2016 (J Pediatr. 2016;178:24-33.e2).
“A multicenter, prospective, cohort study published in 2010 estimated the incidence of PHACE to be 31% in patients with large facial hemangiomas, while a retrospective study published in 2017 estimated the incidence to be as high as 58%,” Dr. Cotton, chief dermatology resident at the University of Arizona, Tucson, said in an interview in advance of the meeting. “With the current understanding of risk for PHACE, any child with a facial hemangioma of greater than or equal to 5 cm in diameter receives a full work-up for the syndrome. However, there has been anecdotal evidence that patients with certain subtypes of hemangiomas (such as parotid hemangiomas) may not carry this same risk.”
In what is believed to be the largest study of its kind, Dr. Cotton and her associates retrospectively analyzed data from 244 patients from 13 pediatric dermatology centers who were fully evaluated for PHACE between August 2009 and December 2014. The investigators also performed subgroup analyses on different hemangioma characteristics, including parotid hemangiomas and specific facial segments of involvement. All patients underwent magnetic resonance imaging/magnetic resonance angiography of the head and neck, and the researchers collected data on age at diagnosis; gender; patterns of hemangioma presentation, including location, size, and depth; diagnostic procedures and results; and type and number of associated anomalies. An expert reviewed photographs or diagrams to confirm facial segment locations.
Of the 244 patients, 34.7% met criteria for PHACE syndrome. On multivariate analysis, the following factors were found to be independently and significantly associated with a risk for PHACE: bilateral location (positive predictive value, 54.9%), S1 involvement (PPV, 49.5%), S3 involvement (PPV, 39.5%), and area greater than 25cm2 (PPV, 44.8%), with a P value less than .05 for all associations.
Risk of PHACE also increased with the number of locations involved, with a sharp increase observed at three or more locations (PPV, 65.5%; P less than .001). In patients with one unilateral segment involved, S2 and S3 carried a significantly lower risk (P less than .03). Parotid hemangiomas had a negative predictive value of 80.4% (P = .035).
“While we found that patients with parotid hemangiomas had a lower risk of PHACE, 10 patients with parotid hemangiomas did have PHACE, and 90% of those patients had cerebral arterial anomalies,” Dr. Cotton said. “However, only one of these patients had an isolated unilateral parotid hemangioma without other facial segment involvement. Additionally, two patients with isolated involvement of the midcheek below the eye [the S2 location, which was another low risk segment] also had PHACE, both of whom would have been missed without MRI/MRA [magnetic resonance angiography].”
She acknowledged certain limitations of the study, including its retrospective design. “Additionally, many of the very large hemangiomas were not measured in size, and so, estimated sizes needed to be used in calculating relationship of hemangioma size with risk of PHACE,” she said.
The study was funded in part by a grant from the Pediatric Dermatology Research Alliance.* Dr. Cotton reported having no relevant financial disclosures.
Correction, 7/20/18: An earlier version of this article misstated the name of the Pediatric Dermatology Research Alliance.
FROM SPD 2018
Key clinical point: Children with large, high-risk facial hemangiomas should be prioritized for PHACE syndrome work-up.
Major finding: On multivariate analysis, the following factors were found to be independently and significantly associated with a risk for PHACE: bilateral location (positive predictive value, 54.9%), S1 involvement (PPV, 49.5%), S3 involvement (PPV, 39.5%), and area greater than 25 cm2 (PPV, 44.8%; P less than .05 for all associations).
Study details: A retrospective evaluation of 244 patients from 13 pediatric dermatology who were fully evaluated for PHACE between August 2009 and December 2014.
Disclosures: The study was funded in part by a grant from the Pediatric Dermatology Research Association. Dr. Cotton reported having no financial disclosures.
DOACs found safer than warfarin in the real world
The safety of direct oral anticoagulants is affirmed in a real-world study; a wearable ECG boosts atrial fibrillation detection by a factor of 8; new pediatric guidelines catch more hypertension cases in children; and nontraditional cardiovascular risk factors are not ready for prime time, says a federal task force. Listen to MDedge Cardiocast for all the details on the week’s top news, and subscribe on iTunes.
The safety of direct oral anticoagulants is affirmed in a real-world study; a wearable ECG boosts atrial fibrillation detection by a factor of 8; new pediatric guidelines catch more hypertension cases in children; and nontraditional cardiovascular risk factors are not ready for prime time, says a federal task force. Listen to MDedge Cardiocast for all the details on the week’s top news, and subscribe on iTunes.
The safety of direct oral anticoagulants is affirmed in a real-world study; a wearable ECG boosts atrial fibrillation detection by a factor of 8; new pediatric guidelines catch more hypertension cases in children; and nontraditional cardiovascular risk factors are not ready for prime time, says a federal task force. Listen to MDedge Cardiocast for all the details on the week’s top news, and subscribe on iTunes.

Genentech submits sNDA for venetoclax in untreated AML
A supplemental new drug application (sNDA) for venetoclax (Venclexta) used in combination with either a hypomethylating agent or low-dose cytarabine (LDAC) for previously untreated acute myeloid leukemia has been submitted to the Food and Drug Administration by Genentech, which developed it.
Specifically, the sNDA is for these drug combinations in the treatment of AML patients ineligible for intensive chemotherapy, according to the announcement from Genentech.
The sNDA is based on results of two trials that included patients in this population. In the phase 1b M14-358 (NCT02203773), venetoclax was combined with either azacitidine or decitabine; patients treated with 400 mg of venetoclax had a complete remission rate of 73%, and the median overall survival across all doses of venetoclax was 17.5 months. Low white blood cell count with fever, low white blood cell count, anemia, low platelet count, and decreased potassium levels were the most common grade 3/4 adverse events (occurring in 10% or more of patients). In the phase 1b/2 study M14-387 (NCT02287233), venetoclax was used in combination with LDAC; patients treated with a 600-mg dose of venetoclax showed a complete response rate of 62%, and a median overall survival of 11.4 months. Low white blood cell count with fever, decreased potassium levels, pneumonia, disease progression, decreased phosphate levels, high blood pressure, and sepsis were the most common grade 3/4 adverse events seen in this study.
This sNDA follows FDA breakthrough therapy designations, based on these same trials, for these uses of venetoclax with either hypomethylating agents or LDAC. The FDA also recently approved venetoclax in combination with rituximab (Rituxan) for treatment of patients who have chronic lymphocytic leukemia or small lymphocytic lymphoma, with or without 17p depletion, and have been treated with at least one prior therapy.
“AML is an aggressive disease with the lowest survival rate of all leukemias, and we look forward to working closely with the FDA to bring this potential option to patients with this very difficult-to-treat blood cancer as soon as possible,” said Sandra Horning, MD, chief medical officer at Genentech.
More information is included in the full release.
PNPs integrate behavioral, mental health in PC practice
Concerns about mental health (MH) care delivery for children are repeatedly identified by health care providers, described in the literature, and addressed through advocacy. Unfortunately, health inequities continue to exist, including the social stigma of an MH diagnosis, lower reimbursement for MH compared with medical care, and poor access to expert pediatric behavioral health providers. This is especially true for families living below the poverty line, who are more likely to have MH problems.1

An estimated 50% of primary care (PC) pediatric visits involve an MH or behavioral problem, yet only about 20% of these patients receive services.2 According to the Centers for Disease Control and Prevention, one out of seven children aged 2-8 years has a developmental or behavioral disorder.3 In children aged 3-17 years, 7% have ADHD, 2% have depressive disorders, and 3% have anxiety.3 In the 2015 National Youth Risk Behavior Surveillance survey, more than 29% of high school respondents stated that they felt so sad or hopeless during the past 12 months that they had stopped some of their usual activities, and 18% considered suicide.4 The incidence of violent acts committed by and affecting teens adds a critical need for creative provision of pediatric MH care.
MH integration in pediatric PC, supported by the National Association of Pediatric Nurse Practitioners, American Academy of Pediatrics, American Psychological Association, and many others is an avenue to provide quality MH services for children.5,6,7 In a coordinated or colocated model, a behavioral health specialist works with a pediatric provider either in consultation with the practice (coordinated) or in the same practice site where patients are referred (colocated).7 The collaborative care model places pediatric medical providers with care managers or behavioral health specialists to deliver care in one practice setting.

The use of pediatric nurse practitioners (PNPs) with advanced training in MH care is described in the literature as a different type of collaborative care model.8,9,10 PNPs assess, diagnose, and treat using pharmacologic and nonpharmacologic therapies. PNPs may offer evidence-based psychotherapy or refer for psychotherapy or parenting skills development. Those who have added knowledge and skills in MH care may seek validation of these competencies through completion of added certification as pediatric PC MH specialists (PMHS).11 Since 2011, there are more than 400 PMHSs certified in the United States. We share examples of services provided by PNPs across the United States.
At a federally qualified health center
Dawn Garzon Maaks, PhD, CPNP-PC, the current president of the National Association of Pediatric Nurse Practitioners, is certified as a PMHS and works in a federally-qualified health center in southwest Washington State. This center provides lifespan services for patients, with separate office spaces for MH/psychiatric care and PC. Within this colocated environment, Dr. Garzon Maaks spends about 75% of her time caring for children with developmental, behavioral, and MH problems in the MH clinic and 25% in the PC office, providing health maintenance and acute episodic care. She collaborates with psychiatrists and psychiatric mental health nurse practitioners by adding pediatric developmental and medical expertise and is welcomed by providers who have limited experience caring for children. While providing PC, she educates about issues such as resiliency, screening for substance abuse, and treatment of common pediatric mood disorders and ADHD. Her expertise also allows for MH care integration into PC visits, taking away the “stigma” which still is pervasive for patients referred to MH providers.

“What my position has taught me is that when primary and mental health care providers work closely, it improves outcomes for all patients seen. Through frequent consultation, our primary care physicians have increasing skills in caring for children with mild mental health issues, thus freeing up the mental health people to deal with the more significant cases. On the other hand, our mental health providers benefit from having the primary care expertise in diagnosing and treating common conditions that mimic mental health issues. This integration also significantly reduces stigma because families see their mental health professional in the primary care setting,” Dr. Garzon Maaks said.
At an urban/suburban PC practice

Another PNP MH expert, Dr. Susan Van Cleve, is certified as a PMHS and works as a subspecialist within an urban/suburban pediatric PC practice. Her team is composed of two PNPs and one registered nurse who is designated as the full time MH coordinator. This team cares for children and teens with mild to moderate MH disorders from within the practice. The registered nurse performs intake interviews, schedules patients, and sends out screening tools before visits and is available to families and providers in the practice on a dedicated phone line. She refers complex patients to local providers for more comprehensive care and follows them to ensure that appointments and referrals are made. Scheduling with the PNPs allows for longer appointments, comprehensive treatment including medication management if warranted, and close follow-up care. Patient types seen include those with concerns about developmental delays, autism spectrum disorder, disruptive behavior, ADHD, anxiety, and depression. Children or teens with more severe disorders are referred to colleagues in psychiatry or counseling services, or to pediatric or adolescent subspecialists in the community.

“The children and families I see seem to feel comfortable because our behavioral team is embedded in the pediatric practice, and we use the same office space. Families have easy access to our full-time registered nurse who is available to answer questions, provide resources and advice, lend support, or assist navigating the health system. This type of system increases access, enables us to provide comprehensive family-centered care, and supports the child and family,” said Dr. Van Cleve, clinical professor and primary care pediatric nurse practitioner program director at the University of Iowa College of Nursing, Iowa City.
As an educator
Naomi A. Schapiro, PhD, CPNP, is a professor of nursing at the University of California, San Francisco, and a PNP at a school-based health center with an integrated behavioral health model, managed by a federally qualified health center in a medically underserved area. She is the principle investigator of an Advanced Nursing Education Health Resources Service Administration grant supporting interprofessional training and practice collaboration to improve care and reduce health inequities for disadvantaged children and adolescents coping with both behavioral health conditions and chronic physical conditions, including obesity.11
Dr. Schapiro collaborates with a multidisciplinary, multi-university team, a local children’s hospital, a social work training program, and the county health care services agency to develop and implement a training program for pediatric PC providers to increase skills and self-confidence implementing American Academy of Pediatrics guidelines assessing and treating depression, ADHD, anxiety and trauma-related symptoms; triaging patients with nonsuicidal self-injury and suicidal ideation; and recognizing and referring patients with bipolar disorder and psychosis. These training modules are currently being recorded for online posting. As part of this interprofessional collaboration, Dr. Schapiro and her colleagues developed a “warmline” for decision support, staffed by a psychiatrist and two nurse practitioners available to PC providers in a network of 29 school-based health centers and two pediatric practices for complex decision making about medications or diagnostic dilemmas. Efforts are underway to continue and expand this program.

“As a faculty teaching PNP students enhanced behavioral health assessment skills, I have been proudest when students have been able to apply and disseminate these skills,” Dr. Schapiro said. “One of our recent PNP graduates was in a community primary care practicum when an adolescent thinking about suicide walked into the clinic with her father. Her preceptor wasn’t sure how to proceed, when the student said, ‘Wait! We just practiced this in class.’ The student pulled up her course website, and she and her preceptor walked through the assessment together, developed a safety plan with the teen and her father, and connected the teen with a therapist, avoiding an unnecessary ER visit and potential fragmentation of care.”
The need and expectation that pediatric PC providers incorporate MH services is well documented.2,12,13 PNPs who have additional training and expertise in assessing, diagnosing, and managing MH care are an excellent solution for addressing this problem. The benefits of this team-based approach to the pediatric health care home include decreasing stigma, increasing access, and providing comprehensive MH care to children and their families.
Dr. Haut works at Beacon Pediatrics, a large primary care practice in Rehoboth Beach, Del. She works part-time for Pediatrix Medical Group, serving the Pediatric Intensive Care Unit medical team at the Herman & Walter Samuelson Children’s Hospital at Sinai in Baltimore, and she serves as adjunct faculty at the University of Maryland School of Nursing, also in Baltimore. Other contributors to this article were Dawn Garzon Maaks, PhD, CPNP, PMHS; Naomi Schapiro, PhD, CPNP; Susan Van Cleve, DNP, RN, CPNP-PC, PMHS; and Laura Searcy, MN, APRN, PPCNP-BC. Ms. Searcy is on the medical staff at WellStar Kennestone Regional Medical Center in Marietta, Ga., delivering care to newborns. Dr. Haut and Ms. Searcy are members of the Pediatric News Consultant Advisory Board. Email them at [email protected].
References
1. “Best principles for integration of child psychiatry into the pediatric health home,” AACAP Executive Summary,2012, pages 1-13.
2. Pediatrics. 2009 Apr;123(4):1248-51.
3. Center for Disease Control and Prevention: Children’s Mental Health Data and Statistics.
4. MMWR Surveill Summ, 2016. doi:10.15585/mmwr.ss6506a1.
5. Pediatrics. 2015;135(5):909-17.
6. JAMA Pediatr. 2015;169(10):929-37.
7. “Integrating child psychology services into primary care,” by Tynan D, Woods K, and Carpenter J. American Psychological Association, 2014.
8. J Am Psychiatr Nurses Assoc. 2005;11(5): 276-82.
9. J Nurse Pract. 2013;9(4):243-8.
10. J Pediatr Health Care. 2013; 27(3):162-3.
11. Advanced Nursing Education Health Resources Service Administration grant (#D09HP26958).
12. J Nurse Pract. 2013:9(3):142-8.
13. Pediatrics. 2018;141(3):e20174082
Concerns about mental health (MH) care delivery for children are repeatedly identified by health care providers, described in the literature, and addressed through advocacy. Unfortunately, health inequities continue to exist, including the social stigma of an MH diagnosis, lower reimbursement for MH compared with medical care, and poor access to expert pediatric behavioral health providers. This is especially true for families living below the poverty line, who are more likely to have MH problems.1
An estimated 50% of primary care (PC) pediatric visits involve an MH or behavioral problem, yet only about 20% of these patients receive services.2 According to the Centers for Disease Control and Prevention, one out of seven children aged 2-8 years has a developmental or behavioral disorder.3 In children aged 3-17 years, 7% have ADHD, 2% have depressive disorders, and 3% have anxiety.3 In the 2015 National Youth Risk Behavior Surveillance survey, more than 29% of high school respondents stated that they felt so sad or hopeless during the past 12 months that they had stopped some of their usual activities, and 18% considered suicide.4 The incidence of violent acts committed by and affecting teens adds a critical need for creative provision of pediatric MH care.
MH integration in pediatric PC, supported by the National Association of Pediatric Nurse Practitioners, American Academy of Pediatrics, American Psychological Association, and many others is an avenue to provide quality MH services for children.5,6,7 In a coordinated or colocated model, a behavioral health specialist works with a pediatric provider either in consultation with the practice (coordinated) or in the same practice site where patients are referred (colocated).7 The collaborative care model places pediatric medical providers with care managers or behavioral health specialists to deliver care in one practice setting.
The use of pediatric nurse practitioners (PNPs) with advanced training in MH care is described in the literature as a different type of collaborative care model.8,9,10 PNPs assess, diagnose, and treat using pharmacologic and nonpharmacologic therapies. PNPs may offer evidence-based psychotherapy or refer for psychotherapy or parenting skills development. Those who have added knowledge and skills in MH care may seek validation of these competencies through completion of added certification as pediatric PC MH specialists (PMHS).11 Since 2011, there are more than 400 PMHSs certified in the United States. We share examples of services provided by PNPs across the United States.
At a federally qualified health center
Dawn Garzon Maaks, PhD, CPNP-PC, the current president of the National Association of Pediatric Nurse Practitioners, is certified as a PMHS and works in a federally-qualified health center in southwest Washington State. This center provides lifespan services for patients, with separate office spaces for MH/psychiatric care and PC. Within this colocated environment, Dr. Garzon Maaks spends about 75% of her time caring for children with developmental, behavioral, and MH problems in the MH clinic and 25% in the PC office, providing health maintenance and acute episodic care. She collaborates with psychiatrists and psychiatric mental health nurse practitioners by adding pediatric developmental and medical expertise and is welcomed by providers who have limited experience caring for children. While providing PC, she educates about issues such as resiliency, screening for substance abuse, and treatment of common pediatric mood disorders and ADHD. Her expertise also allows for MH care integration into PC visits, taking away the “stigma” which still is pervasive for patients referred to MH providers.
“What my position has taught me is that when primary and mental health care providers work closely, it improves outcomes for all patients seen. Through frequent consultation, our primary care physicians have increasing skills in caring for children with mild mental health issues, thus freeing up the mental health people to deal with the more significant cases. On the other hand, our mental health providers benefit from having the primary care expertise in diagnosing and treating common conditions that mimic mental health issues. This integration also significantly reduces stigma because families see their mental health professional in the primary care setting,” Dr. Garzon Maaks said.
At an urban/suburban PC practice
Another PNP MH expert, Dr. Susan Van Cleve, is certified as a PMHS and works as a subspecialist within an urban/suburban pediatric PC practice. Her team is composed of two PNPs and one registered nurse who is designated as the full time MH coordinator. This team cares for children and teens with mild to moderate MH disorders from within the practice. The registered nurse performs intake interviews, schedules patients, and sends out screening tools before visits and is available to families and providers in the practice on a dedicated phone line. She refers complex patients to local providers for more comprehensive care and follows them to ensure that appointments and referrals are made. Scheduling with the PNPs allows for longer appointments, comprehensive treatment including medication management if warranted, and close follow-up care. Patient types seen include those with concerns about developmental delays, autism spectrum disorder, disruptive behavior, ADHD, anxiety, and depression. Children or teens with more severe disorders are referred to colleagues in psychiatry or counseling services, or to pediatric or adolescent subspecialists in the community.
“The children and families I see seem to feel comfortable because our behavioral team is embedded in the pediatric practice, and we use the same office space. Families have easy access to our full-time registered nurse who is available to answer questions, provide resources and advice, lend support, or assist navigating the health system. This type of system increases access, enables us to provide comprehensive family-centered care, and supports the child and family,” said Dr. Van Cleve, clinical professor and primary care pediatric nurse practitioner program director at the University of Iowa College of Nursing, Iowa City.
As an educator
Naomi A. Schapiro, PhD, CPNP, is a professor of nursing at the University of California, San Francisco, and a PNP at a school-based health center with an integrated behavioral health model, managed by a federally qualified health center in a medically underserved area. She is the principle investigator of an Advanced Nursing Education Health Resources Service Administration grant supporting interprofessional training and practice collaboration to improve care and reduce health inequities for disadvantaged children and adolescents coping with both behavioral health conditions and chronic physical conditions, including obesity.11
Dr. Schapiro collaborates with a multidisciplinary, multi-university team, a local children’s hospital, a social work training program, and the county health care services agency to develop and implement a training program for pediatric PC providers to increase skills and self-confidence implementing American Academy of Pediatrics guidelines assessing and treating depression, ADHD, anxiety and trauma-related symptoms; triaging patients with nonsuicidal self-injury and suicidal ideation; and recognizing and referring patients with bipolar disorder and psychosis. These training modules are currently being recorded for online posting. As part of this interprofessional collaboration, Dr. Schapiro and her colleagues developed a “warmline” for decision support, staffed by a psychiatrist and two nurse practitioners available to PC providers in a network of 29 school-based health centers and two pediatric practices for complex decision making about medications or diagnostic dilemmas. Efforts are underway to continue and expand this program.
“As a faculty teaching PNP students enhanced behavioral health assessment skills, I have been proudest when students have been able to apply and disseminate these skills,” Dr. Schapiro said. “One of our recent PNP graduates was in a community primary care practicum when an adolescent thinking about suicide walked into the clinic with her father. Her preceptor wasn’t sure how to proceed, when the student said, ‘Wait! We just practiced this in class.’ The student pulled up her course website, and she and her preceptor walked through the assessment together, developed a safety plan with the teen and her father, and connected the teen with a therapist, avoiding an unnecessary ER visit and potential fragmentation of care.”
The need and expectation that pediatric PC providers incorporate MH services is well documented.2,12,13 PNPs who have additional training and expertise in assessing, diagnosing, and managing MH care are an excellent solution for addressing this problem. The benefits of this team-based approach to the pediatric health care home include decreasing stigma, increasing access, and providing comprehensive MH care to children and their families.
Dr. Haut works at Beacon Pediatrics, a large primary care practice in Rehoboth Beach, Del. She works part-time for Pediatrix Medical Group, serving the Pediatric Intensive Care Unit medical team at the Herman & Walter Samuelson Children’s Hospital at Sinai in Baltimore, and she serves as adjunct faculty at the University of Maryland School of Nursing, also in Baltimore. Other contributors to this article were Dawn Garzon Maaks, PhD, CPNP, PMHS; Naomi Schapiro, PhD, CPNP; Susan Van Cleve, DNP, RN, CPNP-PC, PMHS; and Laura Searcy, MN, APRN, PPCNP-BC. Ms. Searcy is on the medical staff at WellStar Kennestone Regional Medical Center in Marietta, Ga., delivering care to newborns. Dr. Haut and Ms. Searcy are members of the Pediatric News Consultant Advisory Board. Email them at [email protected].
References
1. “Best principles for integration of child psychiatry into the pediatric health home,” AACAP Executive Summary,2012, pages 1-13.
2. Pediatrics. 2009 Apr;123(4):1248-51.
3. Center for Disease Control and Prevention: Children’s Mental Health Data and Statistics.
4. MMWR Surveill Summ, 2016. doi:10.15585/mmwr.ss6506a1.
5. Pediatrics. 2015;135(5):909-17.
6. JAMA Pediatr. 2015;169(10):929-37.
7. “Integrating child psychology services into primary care,” by Tynan D, Woods K, and Carpenter J. American Psychological Association, 2014.
8. J Am Psychiatr Nurses Assoc. 2005;11(5): 276-82.
9. J Nurse Pract. 2013;9(4):243-8.
10. J Pediatr Health Care. 2013; 27(3):162-3.
11. Advanced Nursing Education Health Resources Service Administration grant (#D09HP26958).
12. J Nurse Pract. 2013:9(3):142-8.
13. Pediatrics. 2018;141(3):e20174082

Sleep may mediate healthy behavior in children
BALTIMORE – a 6-year follow-up of children in the Infant Feeding Practices Study II determined.

However, improving health in these children is more than a matter of simply seeing that they get more sleep, said lead investigator Jill Landsbaugh Kaar, PhD, of Children’s Hospital Colorado, Aurora, in presenting the results at the annual meeting of the Associated Professional Sleep Societies. “Perhaps there’s a potential pathway linking healthy eaters and obesity in children that may be mediated through sleep duration.”
The relationship between sleep, diet, and activity level may be more cyclical, rather than linear, Dr. Kaar said. “Poor sleep is typically linked to a poor diet or low levels of physical activity, and then linked to some outcome or disease,” she said. But her research indicates that those three factors – sleep, diet and activity – are more interrelated than one being causative of the others.
Noting that one in three adults and one in six children in the United States are either overweight or obese (JAMA. 2014 Feb 26;311[8]:806-14), Dr. Kaar said, “Childhood obesity prevention has really not been effective in reducing weight or preventing or limiting weight gain.” Such programs typically focus on one health behavior when each child has a unique pattern of health behaviors that influence weight.
Dr. Kaar’s research used data collected by the Centers for Disease Control and Prevention as part of a 6-year follow-up study of women from the Infant Feeding Practices Study II. Some 1,542 women completed mailed questionnaires about their 6-year-olds’ diet, activity, screen time, sleep duration, height, and weight. The statistical analysis grouped the children into health behavior patterns of diet, activity, and screen time and used a three-step mediation regression model to examine their hypothesis.
The analysis characterized children into three health behavior pattern groups: poorest eaters (22%), healthy children (37%), and active supereaters with the highest screen time (41%). The poorest eaters were more likely to be female (58%) and obese (18%) than the other groups, but even 10% of the healthy children group were obese.

In the first model, the poorest eaters had the highest risk of obesity. In the second model, both the poorest eaters and active supereaters had shorter sleep duration than healthy children – 9.46 and 9.59 hours a night, respectively, versus 9.97 hours for healthy children – “thus telling me that sleep was really driving that relationship,” Dr. Kaar said.
“Future interventions should consider that improving health behavior patterns by targeting someone’s diet or physical activity, that you’re also targeting them to improve sleep, and then through increasing sleep you will be influencing obesity,” she said. “Interventions and research studies in general really need to measure all of those health behaviors because they’re all related; it’s not just one of them leading to obesity risk.”
The next step for her research is to branch out beyond a one-center study, Dr. Kaar said.
Dr. Kaar reported having no financial relationships. An American Heart Association Scientist Development Award provided funding for the study.
BALTIMORE – a 6-year follow-up of children in the Infant Feeding Practices Study II determined.
However, improving health in these children is more than a matter of simply seeing that they get more sleep, said lead investigator Jill Landsbaugh Kaar, PhD, of Children’s Hospital Colorado, Aurora, in presenting the results at the annual meeting of the Associated Professional Sleep Societies. “Perhaps there’s a potential pathway linking healthy eaters and obesity in children that may be mediated through sleep duration.”
The relationship between sleep, diet, and activity level may be more cyclical, rather than linear, Dr. Kaar said. “Poor sleep is typically linked to a poor diet or low levels of physical activity, and then linked to some outcome or disease,” she said. But her research indicates that those three factors – sleep, diet and activity – are more interrelated than one being causative of the others.
Noting that one in three adults and one in six children in the United States are either overweight or obese (JAMA. 2014 Feb 26;311[8]:806-14), Dr. Kaar said, “Childhood obesity prevention has really not been effective in reducing weight or preventing or limiting weight gain.” Such programs typically focus on one health behavior when each child has a unique pattern of health behaviors that influence weight.
Dr. Kaar’s research used data collected by the Centers for Disease Control and Prevention as part of a 6-year follow-up study of women from the Infant Feeding Practices Study II. Some 1,542 women completed mailed questionnaires about their 6-year-olds’ diet, activity, screen time, sleep duration, height, and weight. The statistical analysis grouped the children into health behavior patterns of diet, activity, and screen time and used a three-step mediation regression model to examine their hypothesis.
The analysis characterized children into three health behavior pattern groups: poorest eaters (22%), healthy children (37%), and active supereaters with the highest screen time (41%). The poorest eaters were more likely to be female (58%) and obese (18%) than the other groups, but even 10% of the healthy children group were obese.
In the first model, the poorest eaters had the highest risk of obesity. In the second model, both the poorest eaters and active supereaters had shorter sleep duration than healthy children – 9.46 and 9.59 hours a night, respectively, versus 9.97 hours for healthy children – “thus telling me that sleep was really driving that relationship,” Dr. Kaar said.
“Future interventions should consider that improving health behavior patterns by targeting someone’s diet or physical activity, that you’re also targeting them to improve sleep, and then through increasing sleep you will be influencing obesity,” she said. “Interventions and research studies in general really need to measure all of those health behaviors because they’re all related; it’s not just one of them leading to obesity risk.”
The next step for her research is to branch out beyond a one-center study, Dr. Kaar said.
Dr. Kaar reported having no financial relationships. An American Heart Association Scientist Development Award provided funding for the study.
REPORTING FROM SLEEP 2018
Key clinical point: Sleep may mediate how diet and activity influence weight in children.
Major finding: Healthy children had 9.97 hours of sleep per night versus 9.46 hours for poorest eaters.
Study details: A 6-year follow-up of 1,542 children in the Infant Feeding Practices Study II whose health behaviors were self-reported by mothers.
Disclosures: Dr. Kaar reported having no financial relationships. The study was funded through an American Heart Association Scientist Development Award.
Copresentation of Common Variable Immune Deficiency and Sweet Syndrome
To the Editor:
A 38-year-old woman was diagnosed with common variable immune deficiency (CVID) by an immunologist at an outside institution 1 year prior to the current presentation. The diagnosis was based on history of severe recurrent sinopulmonary tract, inner ear, Clostridium difficile, urinary tract, and herpes zoster infections of approximately 6 years’ duration, as well as persistently low IgG, IgA, and IgM levels of 530 mg/dL (reference range, 690–1400 mg/dL), 29 mg/dL (reference range, 88–410 mg/dL), and 30 mg/dL (reference range, 34–210 mg/dL), respectively, with failure to respond to vaccinations (ie, Haemophilus influenzae type B, Streptococcus pneumoniae, diphtheria IgG antibody, tetanus antibody). She was started on replacement intravenous immunoglobulin (IVIG) 40 g monthly (400 mg/kg) for CVID. She had a family history of CVID diagnosed in her son and sister.
One year after the CVID diagnosis, she was diagnosed with Sweet syndrome (SS) by a physician at our institution via biopsy of a lesion on the left arm (Figure 1) that showed dense dermal infiltrate of neutrophils with scattered background apoptotic nuclear debris without evidence of vasculitis (Figure 2). Gram stain and microbial biopsy cultures were negative for mycobacterial, fungal, and bacterial organisms. Cutaneous lesions failed to respond to courses of intravenous antibiotics. Sarcoidosis workup was unremarkable and was pursued to exclude the association with SS. Other negative testing included antinuclear antibody, human immunodeficiency virus, rheumatoid factor, thyroid-stimulating hormone, Ro and La autoantibodies, cytoplasmic antineutrophil cytoplasmic antibody, perinuclear antineutrophil cytoplasmic antibody, antimitochondrial antibody, and urinalysis. Occult malignancy was excluded with negative bone marrow biopsy; cerebrospinal fluid analysis; esophagogastroduodenoscopy; colonoscopy; and computed tomography of the chest, abdomen, and pelvis.


Sweet syndrome flares in this patient began with a prodromal syndrome of fever, chills, fatigue, diarrhea, and severe local neuropathic pain. Cutaneous lesions erupted 2 days later, most frequently on the arms and fingers. Preemptive treatment with prednisone 30 to 40 mg when the prodrome was present did not arrest cutaneous lesion development. Flares initially occurred every 3 to 5 weeks.
She initially was successfully treated with high-dose prednisone 100 mg daily during SS flares. Prolonged low-dose prednisone maintenance (10–20 mg) and hydroxychloroquine failed to control her frequent exacerbations. Dapsone was intolerable secondary to an adverse reaction. She continued to have frequent exacerbations of the SS requiring hospitalizations.
During SS flares, CVID was stable with infrequent systemic infections. Although a causal relationship between CVID and SS was unclear, an empiric increase in IVIG dose was made by her immunologist to test if it would decrease the frequency of the cutaneous flares. Subsequently, the IVIG dose was increased to 60 g monthly followed by 200 g monthly after approximately 4 months with a partial initial response in the beginning of therapy for the first 6 months. However, episodes resumed with increasing frequency with cutaneous lesion flares every 2 to 3 weeks. In a 3-month period, the patient had at least 4 hospitalizations for SS flares. Finally, 18 months after the diagnosis of SS was made, she was started on metronomic cyclophosphamide at a daily oral dose of 100 mg, later reduced to 50 mg daily after she developed mild neutropenia. She was continued on monthly IVIG replacement at a higher dose of 200 g divided over 2 days for CVID throughout the course of the disease and to the present time. Since then, the frequency of SS flares has notably reduced. She required 1 hospitalization after cyclophosphamide was initiated. She uses short-pulse prednisone (1 mg/kg) for 3 to 5 days when new skin lesions appear in addition to cyclophosphamide.
Common variable immune deficiency, the most common primary immunodeficiency, initially can present in adulthood.1,2 Its hallmarks include low levels of serum immunoglobulin, most notably IgG with most patients having concurrent deficiencies of IgA and IgM, and impaired antibody responses with recurrent or atypical infections. It has been associated with autoimmune diseases, granulomatous disease, and inflammatory disorders.2 Failure to mount protective levels of antibody titer after vaccination demonstrates the deficiency of antibody production.1 Lack of recognition of this clinical spectrum may lead to delayed diagnosis and more importantly stalls the initiation of immunoglobulin replacement therapy.1 The customary dose of immunoglobulin replacement is 400 mg/kg given in a single monthly infusion2; however, doses should be individualized and based on clinical response.1
Sweet syndrome is characterized by the constellation of pyrexia; leukocytosis; and eruption of painful, edematous, dermal, and neutrophil-dense plaques that occur in the setting of infection or malignancy or are drug induced.3,4 Although not fully elucidated, the pathogenesis is thought to involve the effects of cytokines that precipitate neutrophil activation and infiltration inducing a hypersensitivity reaction and escalation of the immunologic cascade.3 Because SS can represent a paraneoplastic phenomenon or a dermal manifestation of a solid neoplasm or hematologic dyscrasia, it is important to rule out occult malignancy.3 The mainstay of treatment is systemic corticosteroids to which classical SS lesions readily respond. Alternatively, topical or intralesional corticosteroids may be used as adjuvant therapy. Alternate first-line treatments include potassium iodide and colchicine. Second-line therapies include indomethacin, cyclosporine, dapsone, and other immunosuppressive agents.5 The lesions may become superinfected with bacterial pathogens requiring antimicrobials.3 Spontaneous resolution seldom occurs. The risk for relapse is lifelong following spontaneous or therapy-induced clinical remission.3 There is a growing body of literature of SS-associated conditions.
Common variable immune deficiency is a collection of disorders resulting in antibody deficiency and recurrent infections.6 Despite the humeral defects in CVID, patients paradoxically may develop various autoimmune, hematologic, and inflammatory disorders.7 Sweet syndrome, first described in 1964, is a constellation of fever, neutrophilia, and neutrophilic dermatosis of unknown pathogenesis.8 Copresentation of CVID and SS has not been commonly reported. O’Regan et al8 described a 17-year-old adolescent boy with both SS and CVID but SS preceded the diagnosis of CVID. In our case, the patient presented with CVID first and then manifested SS 1 year later.
Common variable immune deficiency is the most frequent symptomatic primary immunodeficiency in adults. Because adults with CVID have varied manifestations, CVID is thought to be late-onset antibody failure. The genetic basis of these disorders has not been identified in the majority of individuals. More than 100 genetic defects have been ascribed to primary immunodeficiencies,9 though none are consistently found to be associated with CVID. The majority of CVID cases are sporadic, but the positive family history in our patient suggests a familial form. Approximately 10% to 20% of patients have an identified heritable cause of CVID.10 Our patient’s diagnosis of CVID was confirmed by meeting the diagnostic triad set by the European Society for Immunodeficiencies11 of marked reduction of IgG and IgA or IgM plus onset after 2 years of age, recurrent infections, and defective vaccination response. Additional complications including autoimmunity, malignancy, and granulomatous inflammation were extensively ruled out.
The etiology of SS is unknown and its pathogenesis not fully elucidated, though it is presumed to be a hypersensitivity reaction.12 Sweet syndrome can be classified into 3 major subtypes: classical or idiopathic, malignancy associated, or drug induced.3 Our patient’s presentation is consistent with the classical variant, as malignancy was ruled out and the patient was not on any medication other than IVIG at the time of diagnosis. The treatment of SS consists of systemic steroids, initially high dose followed by a prolonged taper over 4 to 6 weeks.3 This treatment causes a pronounced and sustained decrease in serum IgG due to increased catabolism during drug administration and decreased synthesis during and for a variable time after drug administration.13 In refractory cases, intravenous pulse administration of methylprednisolone sodium succinate for 3 to 5 days may enhance the response to standard therapies.5
The concurrent development of neutrophilic dermatoses/SS in an individual with CVID has not been fully described. There is a credible association of SS with infections, inflammatory bowel disease, pregnancy, malignancy, and medications, as well as a possible association with Behçet disease, erythema nodosum, relapsing polychondritis, rheumatoid arthritis, sarcoidosis, and thyroid disease.5 The association between immunoglobulin deficiencies and SS is markedly unusual. Despite regular IVIG replacement, adequate treatment of CVID did not seem to modulate SS flares in our patient. A case report in a pediatric patient does not provide specific guidance regarding treatment options.8
A particularly challenging aspect of our case was tailoring a treatment regimen to suppress SS flares. We have attained partial response to the refractory cutaneous lesions (decreased frequency and amplitude of outbreaks) with IVIG replacement 200 g every 4 weeks in combination with metronomic cyclophosphamide 50 mg daily (use of a repetitive, low-dose daily chemotherapy regimen to minimize side effects). Intermittent SS flares were managed acutely with pulse high-dose steroids. We report a case of SS with CVID, raising the plausibility of correlated pathogenesis. However, the exact mechanisms remain undefined.
- Cunningham-Rundles C, Maglione PJ. Common variable immunodeficiency. J Allergy Clin Immunol. 2012;129:1425-1426.
- Sicherer SH, Winkelstein JA. Primary immunodeficiency diseases in adults. JAMA. 1998;279:58-61.
- Cohen PR. Sweet’s syndrome—a comprehensive review of an acute febrile neutrophilic dermatosis. Orphanet J Rare Dis. 2007;2:34.
- Sweet RD. Acute febrile neutrophilic dermatosis. Br J Dermatol. 1979;100:93-99.
- Cohen PR. Neutrophilic dermatoses a review of current treatment options. Am J Clin Dermatol. 2009;10:301-312.
- Yong PF, Thaventhiran JE, Grimbacher B. “A rose is a rose is a rose,” but CVID is not CVID: common variable immune deficiency (CVID), what do we know in 2011? Adv Immunol. 2011;111:48-77.
- Giannouli S, Anagnostou D, Soliotis F, et al. Autoimmune manifestations in common variable immunodeficiency. Clin Rheumatol. 2004;23:449-452.
- O’Regan GM, Ho WL, Limaye S, et al. Sweet’s syndrome in association with common variable immunodeficiency. Clin Exp Dermatol. 2008;34:192-194.
- Bergbreiter A, Salzer U. Common variable immunodeficiency: a multifaceted and puzzling disorder. Expert Rev Clin Immunol. 2009;5:167-180.
- Ameratunga R, Woon S-T, Gillis D, et al. New diagnostic criteria for common variable immune deficiency (CVID), which may assist with decisions to treat with intravenous or subcutaneous immunoglobulin. Clin Exp Immunol. 2013;174:203-211.
- Conley ME, Notarangelo LD, Etzioni A. Diagnostic criteria for primary immunodeficiencies. representing PAGID (Pan-American Group for Immunodeficiency) and ESID (European Society for Immunodeficiencies). Clin Immunol. 1999;93:190-197.
- Yi S, Bhate C, Schwartz RA. Sweet’s syndrome: an update and review. G Ital Dermatol Venereol. 2009;144:603-612.
- Butler WT, Rossen RD. Effects of corticosteroids on immunity in man. I. decreased serum IgG concentration caused by 3 or 5 days of high doses of methylprednisone. J Clin Invest. 1973;52:2629-2640.
To the Editor:
A 38-year-old woman was diagnosed with common variable immune deficiency (CVID) by an immunologist at an outside institution 1 year prior to the current presentation. The diagnosis was based on history of severe recurrent sinopulmonary tract, inner ear, Clostridium difficile, urinary tract, and herpes zoster infections of approximately 6 years’ duration, as well as persistently low IgG, IgA, and IgM levels of 530 mg/dL (reference range, 690–1400 mg/dL), 29 mg/dL (reference range, 88–410 mg/dL), and 30 mg/dL (reference range, 34–210 mg/dL), respectively, with failure to respond to vaccinations (ie, Haemophilus influenzae type B, Streptococcus pneumoniae, diphtheria IgG antibody, tetanus antibody). She was started on replacement intravenous immunoglobulin (IVIG) 40 g monthly (400 mg/kg) for CVID. She had a family history of CVID diagnosed in her son and sister.
One year after the CVID diagnosis, she was diagnosed with Sweet syndrome (SS) by a physician at our institution via biopsy of a lesion on the left arm (Figure 1) that showed dense dermal infiltrate of neutrophils with scattered background apoptotic nuclear debris without evidence of vasculitis (Figure 2). Gram stain and microbial biopsy cultures were negative for mycobacterial, fungal, and bacterial organisms. Cutaneous lesions failed to respond to courses of intravenous antibiotics. Sarcoidosis workup was unremarkable and was pursued to exclude the association with SS. Other negative testing included antinuclear antibody, human immunodeficiency virus, rheumatoid factor, thyroid-stimulating hormone, Ro and La autoantibodies, cytoplasmic antineutrophil cytoplasmic antibody, perinuclear antineutrophil cytoplasmic antibody, antimitochondrial antibody, and urinalysis. Occult malignancy was excluded with negative bone marrow biopsy; cerebrospinal fluid analysis; esophagogastroduodenoscopy; colonoscopy; and computed tomography of the chest, abdomen, and pelvis.
Sweet syndrome flares in this patient began with a prodromal syndrome of fever, chills, fatigue, diarrhea, and severe local neuropathic pain. Cutaneous lesions erupted 2 days later, most frequently on the arms and fingers. Preemptive treatment with prednisone 30 to 40 mg when the prodrome was present did not arrest cutaneous lesion development. Flares initially occurred every 3 to 5 weeks.
She initially was successfully treated with high-dose prednisone 100 mg daily during SS flares. Prolonged low-dose prednisone maintenance (10–20 mg) and hydroxychloroquine failed to control her frequent exacerbations. Dapsone was intolerable secondary to an adverse reaction. She continued to have frequent exacerbations of the SS requiring hospitalizations.
During SS flares, CVID was stable with infrequent systemic infections. Although a causal relationship between CVID and SS was unclear, an empiric increase in IVIG dose was made by her immunologist to test if it would decrease the frequency of the cutaneous flares. Subsequently, the IVIG dose was increased to 60 g monthly followed by 200 g monthly after approximately 4 months with a partial initial response in the beginning of therapy for the first 6 months. However, episodes resumed with increasing frequency with cutaneous lesion flares every 2 to 3 weeks. In a 3-month period, the patient had at least 4 hospitalizations for SS flares. Finally, 18 months after the diagnosis of SS was made, she was started on metronomic cyclophosphamide at a daily oral dose of 100 mg, later reduced to 50 mg daily after she developed mild neutropenia. She was continued on monthly IVIG replacement at a higher dose of 200 g divided over 2 days for CVID throughout the course of the disease and to the present time. Since then, the frequency of SS flares has notably reduced. She required 1 hospitalization after cyclophosphamide was initiated. She uses short-pulse prednisone (1 mg/kg) for 3 to 5 days when new skin lesions appear in addition to cyclophosphamide.
Common variable immune deficiency, the most common primary immunodeficiency, initially can present in adulthood.1,2 Its hallmarks include low levels of serum immunoglobulin, most notably IgG with most patients having concurrent deficiencies of IgA and IgM, and impaired antibody responses with recurrent or atypical infections. It has been associated with autoimmune diseases, granulomatous disease, and inflammatory disorders.2 Failure to mount protective levels of antibody titer after vaccination demonstrates the deficiency of antibody production.1 Lack of recognition of this clinical spectrum may lead to delayed diagnosis and more importantly stalls the initiation of immunoglobulin replacement therapy.1 The customary dose of immunoglobulin replacement is 400 mg/kg given in a single monthly infusion2; however, doses should be individualized and based on clinical response.1
Sweet syndrome is characterized by the constellation of pyrexia; leukocytosis; and eruption of painful, edematous, dermal, and neutrophil-dense plaques that occur in the setting of infection or malignancy or are drug induced.3,4 Although not fully elucidated, the pathogenesis is thought to involve the effects of cytokines that precipitate neutrophil activation and infiltration inducing a hypersensitivity reaction and escalation of the immunologic cascade.3 Because SS can represent a paraneoplastic phenomenon or a dermal manifestation of a solid neoplasm or hematologic dyscrasia, it is important to rule out occult malignancy.3 The mainstay of treatment is systemic corticosteroids to which classical SS lesions readily respond. Alternatively, topical or intralesional corticosteroids may be used as adjuvant therapy. Alternate first-line treatments include potassium iodide and colchicine. Second-line therapies include indomethacin, cyclosporine, dapsone, and other immunosuppressive agents.5 The lesions may become superinfected with bacterial pathogens requiring antimicrobials.3 Spontaneous resolution seldom occurs. The risk for relapse is lifelong following spontaneous or therapy-induced clinical remission.3 There is a growing body of literature of SS-associated conditions.
Common variable immune deficiency is a collection of disorders resulting in antibody deficiency and recurrent infections.6 Despite the humeral defects in CVID, patients paradoxically may develop various autoimmune, hematologic, and inflammatory disorders.7 Sweet syndrome, first described in 1964, is a constellation of fever, neutrophilia, and neutrophilic dermatosis of unknown pathogenesis.8 Copresentation of CVID and SS has not been commonly reported. O’Regan et al8 described a 17-year-old adolescent boy with both SS and CVID but SS preceded the diagnosis of CVID. In our case, the patient presented with CVID first and then manifested SS 1 year later.
Common variable immune deficiency is the most frequent symptomatic primary immunodeficiency in adults. Because adults with CVID have varied manifestations, CVID is thought to be late-onset antibody failure. The genetic basis of these disorders has not been identified in the majority of individuals. More than 100 genetic defects have been ascribed to primary immunodeficiencies,9 though none are consistently found to be associated with CVID. The majority of CVID cases are sporadic, but the positive family history in our patient suggests a familial form. Approximately 10% to 20% of patients have an identified heritable cause of CVID.10 Our patient’s diagnosis of CVID was confirmed by meeting the diagnostic triad set by the European Society for Immunodeficiencies11 of marked reduction of IgG and IgA or IgM plus onset after 2 years of age, recurrent infections, and defective vaccination response. Additional complications including autoimmunity, malignancy, and granulomatous inflammation were extensively ruled out.
The etiology of SS is unknown and its pathogenesis not fully elucidated, though it is presumed to be a hypersensitivity reaction.12 Sweet syndrome can be classified into 3 major subtypes: classical or idiopathic, malignancy associated, or drug induced.3 Our patient’s presentation is consistent with the classical variant, as malignancy was ruled out and the patient was not on any medication other than IVIG at the time of diagnosis. The treatment of SS consists of systemic steroids, initially high dose followed by a prolonged taper over 4 to 6 weeks.3 This treatment causes a pronounced and sustained decrease in serum IgG due to increased catabolism during drug administration and decreased synthesis during and for a variable time after drug administration.13 In refractory cases, intravenous pulse administration of methylprednisolone sodium succinate for 3 to 5 days may enhance the response to standard therapies.5
The concurrent development of neutrophilic dermatoses/SS in an individual with CVID has not been fully described. There is a credible association of SS with infections, inflammatory bowel disease, pregnancy, malignancy, and medications, as well as a possible association with Behçet disease, erythema nodosum, relapsing polychondritis, rheumatoid arthritis, sarcoidosis, and thyroid disease.5 The association between immunoglobulin deficiencies and SS is markedly unusual. Despite regular IVIG replacement, adequate treatment of CVID did not seem to modulate SS flares in our patient. A case report in a pediatric patient does not provide specific guidance regarding treatment options.8
A particularly challenging aspect of our case was tailoring a treatment regimen to suppress SS flares. We have attained partial response to the refractory cutaneous lesions (decreased frequency and amplitude of outbreaks) with IVIG replacement 200 g every 4 weeks in combination with metronomic cyclophosphamide 50 mg daily (use of a repetitive, low-dose daily chemotherapy regimen to minimize side effects). Intermittent SS flares were managed acutely with pulse high-dose steroids. We report a case of SS with CVID, raising the plausibility of correlated pathogenesis. However, the exact mechanisms remain undefined.
- Cunningham-Rundles C, Maglione PJ. Common variable immunodeficiency. J Allergy Clin Immunol. 2012;129:1425-1426.
- Sicherer SH, Winkelstein JA. Primary immunodeficiency diseases in adults. JAMA. 1998;279:58-61.
- Cohen PR. Sweet’s syndrome—a comprehensive review of an acute febrile neutrophilic dermatosis. Orphanet J Rare Dis. 2007;2:34.
- Sweet RD. Acute febrile neutrophilic dermatosis. Br J Dermatol. 1979;100:93-99.
- Cohen PR. Neutrophilic dermatoses a review of current treatment options. Am J Clin Dermatol. 2009;10:301-312.
- Yong PF, Thaventhiran JE, Grimbacher B. “A rose is a rose is a rose,” but CVID is not CVID: common variable immune deficiency (CVID), what do we know in 2011? Adv Immunol. 2011;111:48-77.
- Giannouli S, Anagnostou D, Soliotis F, et al. Autoimmune manifestations in common variable immunodeficiency. Clin Rheumatol. 2004;23:449-452.
- O’Regan GM, Ho WL, Limaye S, et al. Sweet’s syndrome in association with common variable immunodeficiency. Clin Exp Dermatol. 2008;34:192-194.
- Bergbreiter A, Salzer U. Common variable immunodeficiency: a multifaceted and puzzling disorder. Expert Rev Clin Immunol. 2009;5:167-180.
- Ameratunga R, Woon S-T, Gillis D, et al. New diagnostic criteria for common variable immune deficiency (CVID), which may assist with decisions to treat with intravenous or subcutaneous immunoglobulin. Clin Exp Immunol. 2013;174:203-211.
- Conley ME, Notarangelo LD, Etzioni A. Diagnostic criteria for primary immunodeficiencies. representing PAGID (Pan-American Group for Immunodeficiency) and ESID (European Society for Immunodeficiencies). Clin Immunol. 1999;93:190-197.
- Yi S, Bhate C, Schwartz RA. Sweet’s syndrome: an update and review. G Ital Dermatol Venereol. 2009;144:603-612.
- Butler WT, Rossen RD. Effects of corticosteroids on immunity in man. I. decreased serum IgG concentration caused by 3 or 5 days of high doses of methylprednisone. J Clin Invest. 1973;52:2629-2640.
Practice Points
- Suggested workup for Sweet syndrome includes ruling out connective tissue disorders and malignancies.
- Familial common variable immune deficiency is rare and can first manifest in adulthood.
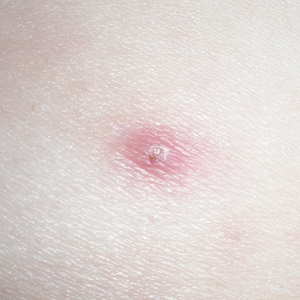
The rapidly disappearing community pediatric inpatient unit
Greed kills babies. Children’s lives matter. Children over profit.
These were the slogans proclaimed by signs carried by protesters outside of MedStar Franklin Square Medical Center in Baltimore in early May of 2018 to protest the closure of the dedicated pediatric emergency department and inpatient pediatric unit.

But administrators at Franklin Square Medical Center had made their decision long before the glue had dried on the signs, and the protests of patients and community officials fell on deaf ears. Eight doctors and 30 other staff had already lost their jobs, including the chair of pediatrics, Scott Krugman, MD.1
And this was just another drop in a slow ooze of pediatric inpatient units based in community hospitals that have seen the ax fall on what was thought to be a vital medical resource for their communities – yet not vital enough to survive its lack of profitability. From Taunton, Mass., to Chicago, Ill., to rural Tennessee, pediatric inpatient units in community hospitals have failed to even flirt with breaking even, let alone show profitability. Many community pediatric inpatient units are saddled with rock-bottom reimbursements offered by state Medicaid programs, the overwhelmingly prevalent payer for pediatric hospitalizations, which is compounded by the seasonality and unpredictability of pediatric inpatient volumes, so many have seen a glowing red bottom line lead to their demise.
What does this mean for pediatric health in underserved and rural communities? The closure of the pediatric inpatient unit at MedStar Franklin Square Medical Center meant the loss of physicians and nurses staffing the child protection team helping to assist the local district attorney in child abuse cases. Sometimes described as “secondary care,” community pediatric hospitalists also serve as a link between primary care providers and tertiary care subspecialists; they can serve as pediatric generalists throughout a hospital and provide newborn nursery care, delivery room resuscitations, ED consultations, procedural sedations, psychiatric unit support, surgical comanagement, and informal or formal outpatient consultations.2 Losing even a small inpatient pediatric unit can have a ripple effect on inpatient and outpatient pediatric services in a health system and community.
For patients and their caregivers, the loss of pediatric inpatient services in their community hospital can erect additional hurdles to appropriate health care. The need to travel longer distances to urban centers or even the other side of town can be challenging given the difficulties posed by long distances, traffic congestion, public transportation, or just parking.3 For patients suffering from longer hospitalizations caused by medical complexity or chronic illnesses, traveling long distances can exacerbate the caregiver stress from attempting to care for a family at home while participating in the care of a hospitalized child. Longer travel times can also worsen family stress by increasing a caregiver’s absence from home and increased nonmedical expenses, not to mention loss of wages.4 Comfort levels with inpatient providers can also suffer because most pediatric units in community hospitals are staffed by either community general pediatricians or very small pediatric hospitalist groups, which breeds familiarity with frequently admitted patients and their caregivers. This familiarity can be lacking in large academic centers, with confusing and ever-rotating teams of academic hospitalists, residents, and medical students.5
What is driving the slow drumbeat of pediatric inpatient unit closures? On a macroeconomic scale, pediatric hospitalizations have been dropping yearly, driven down by immunizations (despite the best efforts of certain celebrities), antibiotic stewardship, and improved access to outpatient care. In 2006, there were 6.6 million hospitalizations for children aged 17 years and younger,6 but by 2012 this had dropped to 5.9 million hospitalizations.7 In the same age group, the rate of hospitalization from the ED dropped from 4.4% in 2006 to 3.2% in 2015.8
On a hospital level, the presence of multiple small pediatric units in a region may not make sense from a cost standpoint, and a larger, merged unit may provide higher quality because of its higher volumes. On a state and local level, alternative payment models have been implemented with the best of intentions but have led administrators at community general hospitals to look at pediatric units as the lowest hanging money-losing fruit in their efforts to survive a brave new world of hospital payment.
The most extreme (or advanced, depending on your viewpoint) model is in Maryland: Since 2014, acute care hospitals have been only able to receive a fixed amount of revenue from all payers, including Medicare, Medicaid, and commercial insurers.9 Known as an all-payer global budget, it incentivizes lowering unnecessary costs of care, such as readmissions, but also encourages cauterization of cost centers hemorrhaging money – such as inpatient pediatrics. Even the venerable Johns Hopkins Children’s Center has seen its profitability pale in comparison to the expansion team Johns Hopkins All Children’s Hospital in St. Petersburg, Fla., which is the second-most profitable hospital in the Hopkins system, only edged out by Sibley Memorial Hospital – which also sports an out-of-state location in the District of Columbia.10
But all hope is not lost for your comfy local pediatric inpatient unit. In other states and regions where a more favorable (to hospitals) payer mix exists, large pediatric hospitals are still engaged in turf battles with other local competitors to grab market share. In these regions, community pediatric units have survived by partnering with large pediatric institutions, either through affiliations or wholesale transplantation of the larger pediatric institution’s providers, nurses, and EHRs into essentially what is a leased floor. In addition, large pediatric institutions that participate in capitated models such as accountable care organizations have paradoxically found it financially favorable to direct “bread-and-butter” pediatric hospitalizations to community pediatric units, which often provide the same care at a lower cost.
Utilizing community inpatient pediatric units was “initially … a means of expanding their market share and ‘downstream’ revenue from transfers, but more commonly now [is] a way of alleviating the costs associated with admitting low to moderate acuity patients to the main tertiary sites,” said Francisco Alvarez, MD, associate chief of Regional Pediatric Hospital Medicine Programs at Lucile Packard Children’s Hospital in Palo Alto, Calif. “The cost of care provided by pediatric hospitals has always been higher than the average cost for nonpediatric hospitals in regard to caring for pediatric patients due to their highly skilled specialties and services. These have become more scrutinized by private and government insurance plans and, in some cases, have led to lower reimbursements and therefore a lower or deficient net revenue for certain patient populations.”
For community pediatric hospitalists, the shifting sands of reimbursement on which pediatric inpatient care is built can be a motion illness–inducing experience. In addition to concerns over community health care, job security, and population health, care provided in community hospitals can often be subtly undercut by tertiary and quaternary care pediatric hospitals.
“The focus of pediatric residency programs in freestanding children’s hospitals has created a situation where new pediatricians have less opportunity to develop respect for community pediatric hospital medicine,” said Beth Natt, MD, director of pediatric hospital medicine in the Regional Programs at Connecticut Children’s Medical Center, Hartford. “We are the nameless ‘OSH,’ the place that gets ‘Monday-morning quarterbacked’ in resident morning reports without having a voice at the table. Add this to residents learning ‘only’ protocolized care as opposed to a spectrum of appropriate care, and we create a culture of ‘wrong and right’ with the backward nonprotocol driven community docs looking like they are practicing medicine in the Wild West.”
What’s a community pediatric hospitalist to do, faced with an uncertain future and diminishing respect? Continuing to partner with local pediatric providers, community leaders, and local health care advocacy groups will help to enmesh inpatient providers in the fabric of a community’s health care. But making the value case to hospital administrators is critical for community pediatric hospitalists, as adult hospitalists realized soon after the inception of the hospitalist field.
Goals valued by hospital administrators are pursued on a daily basis by community pediatric hospitalists, and these successes need to be brought to light. Achieving value and quality metrics, pursuing high-value care, reducing readmission rates, championing EHRs, and improving documentation are goals that community pediatric hospitalists and hospital administrators can work toward together.11 By pursuing and sharing success in meeting these shared goals, perhaps the local community pediatric inpatient unit can survive – and thrive.
As for Dr. Krugman, he has moved on and is soon to be gainfully employed again. But he continues to be focused, as always, on the health of his patients.
“What are we going to do to take care of kids in their own communities?” Dr. Krugman asked. “It’s going to be an increasing challenge over the next decade due to the consolidation of children’s hospitals and low payments, especially for hospitals that are adult-focused. Unless we find a way to pay for pediatric care as a country.”
Dr. Chang is a pediatric hospitalist at Baystate Children’s Hospital in Springfield, Mass., and is the pediatric editor of The Hospitalist.
References
1. McDaniels A. (2018). Protesters denounce reduction in pediatric services at Baltimore’s MedStar Franklin Square hospital. Baltimore Sun. Available at: http://www.baltimoresun.com/health/health-care/bs-hs-franklin-square-hospital-protest-20180508-story.html.
2. Roberts KB. Pediatric hospitalists in community hospitals: Hospital-based generalists with expanded roles. Hosp Pediatr. 2015 May;5(5):290-2.
3. Georgia Health News. (2018). A hospital crisis is killing rural communities. This state is ‘Ground Zero’. Available at: http://www.georgiahealthnews.com/2017/09/hospital-crisis-killing-rural-communities-state-ground-zero/.
4. DiFazio RL et al. Non-medical out-of-pocket expenses incurred by families during their child’s hospitalization. J Child Health Care. 2013 Sep;17(3):230-41.
5. Gunderman R. Hospitalist and the decline of comprehensive care. N Engl J Med. 2016 Sep 15; 375(11):1011-3.
6. Statistical Brief #56. (2018). Retrieved from https://www.hcup-us.ahrq.gov/reports/statbriefs/sb56.jsp.
7. Overview of Hospital Stays for Children in the United States, 2012 #187. (2018). Retrieved from https://www.hcup-us.ahrq.gov/reports/statbriefs/sb187-Hospital-Stays-Children-2012.jsp.
8. Trends in Hospital Inpatient Stays by Age and Payer, 2000-2015 #235. (2018). Retrieved from https://www.hcup-us.ahrq.gov/reports/statbriefs/sb235-Inpatient-Stays-Age-Payer-Trends.jsp.
9. Maryland All-Payer Model | Center for Medicare & Medicaid Innovation. (2018). Retrieved from https://innovation.cms.gov/initiatives/Maryland-All-Payer-Model/.
10. The effects of Maryland’s unique health care system. (2018). Retrieved from https://www.axios.com/johns-hopkins-finances-maryland-1518553853-722c2195-731e-4e02-ab1e-94e4211ba945.html.
11. The Increasing Need for Hospitalist Programs to Demonstrate Value | SCP. (2018). Retrieved from https://www.schumacherclinical.com/providers/blog/the-increasing-need-for-hospitalist-programs-to-demonstrate-value.
Greed kills babies. Children’s lives matter. Children over profit.
These were the slogans proclaimed by signs carried by protesters outside of MedStar Franklin Square Medical Center in Baltimore in early May of 2018 to protest the closure of the dedicated pediatric emergency department and inpatient pediatric unit.
But administrators at Franklin Square Medical Center had made their decision long before the glue had dried on the signs, and the protests of patients and community officials fell on deaf ears. Eight doctors and 30 other staff had already lost their jobs, including the chair of pediatrics, Scott Krugman, MD.1
And this was just another drop in a slow ooze of pediatric inpatient units based in community hospitals that have seen the ax fall on what was thought to be a vital medical resource for their communities – yet not vital enough to survive its lack of profitability. From Taunton, Mass., to Chicago, Ill., to rural Tennessee, pediatric inpatient units in community hospitals have failed to even flirt with breaking even, let alone show profitability. Many community pediatric inpatient units are saddled with rock-bottom reimbursements offered by state Medicaid programs, the overwhelmingly prevalent payer for pediatric hospitalizations, which is compounded by the seasonality and unpredictability of pediatric inpatient volumes, so many have seen a glowing red bottom line lead to their demise.
What does this mean for pediatric health in underserved and rural communities? The closure of the pediatric inpatient unit at MedStar Franklin Square Medical Center meant the loss of physicians and nurses staffing the child protection team helping to assist the local district attorney in child abuse cases. Sometimes described as “secondary care,” community pediatric hospitalists also serve as a link between primary care providers and tertiary care subspecialists; they can serve as pediatric generalists throughout a hospital and provide newborn nursery care, delivery room resuscitations, ED consultations, procedural sedations, psychiatric unit support, surgical comanagement, and informal or formal outpatient consultations.2 Losing even a small inpatient pediatric unit can have a ripple effect on inpatient and outpatient pediatric services in a health system and community.
For patients and their caregivers, the loss of pediatric inpatient services in their community hospital can erect additional hurdles to appropriate health care. The need to travel longer distances to urban centers or even the other side of town can be challenging given the difficulties posed by long distances, traffic congestion, public transportation, or just parking.3 For patients suffering from longer hospitalizations caused by medical complexity or chronic illnesses, traveling long distances can exacerbate the caregiver stress from attempting to care for a family at home while participating in the care of a hospitalized child. Longer travel times can also worsen family stress by increasing a caregiver’s absence from home and increased nonmedical expenses, not to mention loss of wages.4 Comfort levels with inpatient providers can also suffer because most pediatric units in community hospitals are staffed by either community general pediatricians or very small pediatric hospitalist groups, which breeds familiarity with frequently admitted patients and their caregivers. This familiarity can be lacking in large academic centers, with confusing and ever-rotating teams of academic hospitalists, residents, and medical students.5
What is driving the slow drumbeat of pediatric inpatient unit closures? On a macroeconomic scale, pediatric hospitalizations have been dropping yearly, driven down by immunizations (despite the best efforts of certain celebrities), antibiotic stewardship, and improved access to outpatient care. In 2006, there were 6.6 million hospitalizations for children aged 17 years and younger,6 but by 2012 this had dropped to 5.9 million hospitalizations.7 In the same age group, the rate of hospitalization from the ED dropped from 4.4% in 2006 to 3.2% in 2015.8
On a hospital level, the presence of multiple small pediatric units in a region may not make sense from a cost standpoint, and a larger, merged unit may provide higher quality because of its higher volumes. On a state and local level, alternative payment models have been implemented with the best of intentions but have led administrators at community general hospitals to look at pediatric units as the lowest hanging money-losing fruit in their efforts to survive a brave new world of hospital payment.
The most extreme (or advanced, depending on your viewpoint) model is in Maryland: Since 2014, acute care hospitals have been only able to receive a fixed amount of revenue from all payers, including Medicare, Medicaid, and commercial insurers.9 Known as an all-payer global budget, it incentivizes lowering unnecessary costs of care, such as readmissions, but also encourages cauterization of cost centers hemorrhaging money – such as inpatient pediatrics. Even the venerable Johns Hopkins Children’s Center has seen its profitability pale in comparison to the expansion team Johns Hopkins All Children’s Hospital in St. Petersburg, Fla., which is the second-most profitable hospital in the Hopkins system, only edged out by Sibley Memorial Hospital – which also sports an out-of-state location in the District of Columbia.10
But all hope is not lost for your comfy local pediatric inpatient unit. In other states and regions where a more favorable (to hospitals) payer mix exists, large pediatric hospitals are still engaged in turf battles with other local competitors to grab market share. In these regions, community pediatric units have survived by partnering with large pediatric institutions, either through affiliations or wholesale transplantation of the larger pediatric institution’s providers, nurses, and EHRs into essentially what is a leased floor. In addition, large pediatric institutions that participate in capitated models such as accountable care organizations have paradoxically found it financially favorable to direct “bread-and-butter” pediatric hospitalizations to community pediatric units, which often provide the same care at a lower cost.
Utilizing community inpatient pediatric units was “initially … a means of expanding their market share and ‘downstream’ revenue from transfers, but more commonly now [is] a way of alleviating the costs associated with admitting low to moderate acuity patients to the main tertiary sites,” said Francisco Alvarez, MD, associate chief of Regional Pediatric Hospital Medicine Programs at Lucile Packard Children’s Hospital in Palo Alto, Calif. “The cost of care provided by pediatric hospitals has always been higher than the average cost for nonpediatric hospitals in regard to caring for pediatric patients due to their highly skilled specialties and services. These have become more scrutinized by private and government insurance plans and, in some cases, have led to lower reimbursements and therefore a lower or deficient net revenue for certain patient populations.”
For community pediatric hospitalists, the shifting sands of reimbursement on which pediatric inpatient care is built can be a motion illness–inducing experience. In addition to concerns over community health care, job security, and population health, care provided in community hospitals can often be subtly undercut by tertiary and quaternary care pediatric hospitals.
“The focus of pediatric residency programs in freestanding children’s hospitals has created a situation where new pediatricians have less opportunity to develop respect for community pediatric hospital medicine,” said Beth Natt, MD, director of pediatric hospital medicine in the Regional Programs at Connecticut Children’s Medical Center, Hartford. “We are the nameless ‘OSH,’ the place that gets ‘Monday-morning quarterbacked’ in resident morning reports without having a voice at the table. Add this to residents learning ‘only’ protocolized care as opposed to a spectrum of appropriate care, and we create a culture of ‘wrong and right’ with the backward nonprotocol driven community docs looking like they are practicing medicine in the Wild West.”
What’s a community pediatric hospitalist to do, faced with an uncertain future and diminishing respect? Continuing to partner with local pediatric providers, community leaders, and local health care advocacy groups will help to enmesh inpatient providers in the fabric of a community’s health care. But making the value case to hospital administrators is critical for community pediatric hospitalists, as adult hospitalists realized soon after the inception of the hospitalist field.
Goals valued by hospital administrators are pursued on a daily basis by community pediatric hospitalists, and these successes need to be brought to light. Achieving value and quality metrics, pursuing high-value care, reducing readmission rates, championing EHRs, and improving documentation are goals that community pediatric hospitalists and hospital administrators can work toward together.11 By pursuing and sharing success in meeting these shared goals, perhaps the local community pediatric inpatient unit can survive – and thrive.
As for Dr. Krugman, he has moved on and is soon to be gainfully employed again. But he continues to be focused, as always, on the health of his patients.
“What are we going to do to take care of kids in their own communities?” Dr. Krugman asked. “It’s going to be an increasing challenge over the next decade due to the consolidation of children’s hospitals and low payments, especially for hospitals that are adult-focused. Unless we find a way to pay for pediatric care as a country.”
Dr. Chang is a pediatric hospitalist at Baystate Children’s Hospital in Springfield, Mass., and is the pediatric editor of The Hospitalist.
References
1. McDaniels A. (2018). Protesters denounce reduction in pediatric services at Baltimore’s MedStar Franklin Square hospital. Baltimore Sun. Available at: http://www.baltimoresun.com/health/health-care/bs-hs-franklin-square-hospital-protest-20180508-story.html.
2. Roberts KB. Pediatric hospitalists in community hospitals: Hospital-based generalists with expanded roles. Hosp Pediatr. 2015 May;5(5):290-2.
3. Georgia Health News. (2018). A hospital crisis is killing rural communities. This state is ‘Ground Zero’. Available at: http://www.georgiahealthnews.com/2017/09/hospital-crisis-killing-rural-communities-state-ground-zero/.
4. DiFazio RL et al. Non-medical out-of-pocket expenses incurred by families during their child’s hospitalization. J Child Health Care. 2013 Sep;17(3):230-41.
5. Gunderman R. Hospitalist and the decline of comprehensive care. N Engl J Med. 2016 Sep 15; 375(11):1011-3.
6. Statistical Brief #56. (2018). Retrieved from https://www.hcup-us.ahrq.gov/reports/statbriefs/sb56.jsp.
7. Overview of Hospital Stays for Children in the United States, 2012 #187. (2018). Retrieved from https://www.hcup-us.ahrq.gov/reports/statbriefs/sb187-Hospital-Stays-Children-2012.jsp.
8. Trends in Hospital Inpatient Stays by Age and Payer, 2000-2015 #235. (2018). Retrieved from https://www.hcup-us.ahrq.gov/reports/statbriefs/sb235-Inpatient-Stays-Age-Payer-Trends.jsp.
9. Maryland All-Payer Model | Center for Medicare & Medicaid Innovation. (2018). Retrieved from https://innovation.cms.gov/initiatives/Maryland-All-Payer-Model/.
10. The effects of Maryland’s unique health care system. (2018). Retrieved from https://www.axios.com/johns-hopkins-finances-maryland-1518553853-722c2195-731e-4e02-ab1e-94e4211ba945.html.
11. The Increasing Need for Hospitalist Programs to Demonstrate Value | SCP. (2018). Retrieved from https://www.schumacherclinical.com/providers/blog/the-increasing-need-for-hospitalist-programs-to-demonstrate-value.
Technology use by parents may worsen children’s behavior
Digital technology use by parents during family activities may exacerbate internalizing or externalizing behavior in their children, according to results published in Pediatric Research.
In a study of 183 couples with children aged 5 years or younger, mothers perceived an average of 1.65 devices as interfering in their interactions with their child at least once per day, compared with an average of 1.43 devices per day for fathers. In addition, 56% of mothers and 43% of fathers reported that two or more devices interrupted their parent-child activities on a daily basis.
Higher technology interference (“technoference”) was associated with greater externalizing and internalizing behaviors in children and higher parenting stress for both mothers and fathers. Technoference also was associated with lower coparenting quality in fathers only, and greater parent depressive symptoms in mothers only, reported Brandon T. McDaniel, PhD, of Illinois State University, Normal, and Jenny S. Radesky, MD, of the University of Michigan, Ann Arbor.

The parents observed participated in the Daily Family Life Project, a longitudinal study on family relationships from 2014 to 2016. Participants were required to be 18 years of age or older, a parent of a child 5 years of age or younger, an English speaker, and currently living with their partner and child. Participants first completed a baseline online survey via Qualtrics, followed by assessments at 1, 3, and 6 months.
Each follow-up survey included a technoference self-assessment completed by each parent, adapted from the Technology Device Interference Scale. Follow-up assessments included information on parental stress, coparenting quality, depressive symptoms, and child externalizing and internalizing behavior, using scales from the Child Behavioral Checklist. Internalizing was defined by behaviors such as whining, sulking, and easily hurt feelings, whereas externalizing included inability to sit still, restlessness, hyperactivity, being easily frustrated, and having temper tantrums, wrote Dr. McDaniel and Dr. Radesky.
Structural equation modeling was used to test models for child externalizing and internalizing in three hypotheses: more frequent technoference predicting higher ratings of child behavior problems (H1), higher ratings of child behavior problems predicting higher parenting stress (H2), and higher parenting stress predicting more frequent technoference (H3), the authors wrote.
H1 and H2 were supported in the externalizing behavior model but only partially supported in the internalizing model, with technoference predicting greater externalizing behavior at all subsequent time points (betas = 0.11, 0.16, and 0.13, P values less than .01), and child externalizing predicting greater parenting stress (betas = 0.16, 0.15, and 0.12, P values less than .01). H3 was partially supported in the externalizing and internalizing behavior models, with parenting stress predicting later technoference from baseline to month 1 (betas = 0.19 and 0.15, P values less than .01) and from month 1 to month 3 (betas= 0.17 and 0.19, P values less than .001), the authors reported.
The findings suggest that “relationships between parent technoference and child externalizing behavior are transactional and influence each other over time,” Dr. McDaniel and Dr. Radesky said.
“In other words, parents who have children with more externalizing problems become more stressed, which may lead to greater technoference (e.g., withdrawal with technology), which in turn may contribute to more child externalizing problems (and only sometimes internalized problems),” they added.
“Our results suggest that children may be more likely to act out over time in response to technoference as opposed to internalize, although when we examined internalizing subscales, child withdrawal was the most consistently associated with parent technoference over time. This may be due to (1) parents responding to child withdrawal social cues by feeling they too can disengage into their mobile device use, or (2) parent media use precipitating child withdrawal from social interaction,” the authors wrote.
The main limitation of this study was the self-reporting used by parents, which may be more subject to bias compared with observational methods, they added.
“It would be worthwhile to study whether experimental manipulation of parent mobile phone use habits – for example through unplugged family routines or less intrusive digital design – might lead to improvements in the parent-child relationship and child behavior,” Dr. McDaniel and Dr. Radesky concluded.
The study was funded by the College of Health and Human Development, Department of Human Development and Family Studies, and the Bennett Pierce Prevention Research Center at Pennsylvania State University, National Institute on Drug Abuse, and the Eunice Kennedy Shriver National Institute of Child Health and Human Development. Dr. McDaniel and Dr. Radesky had no relevant financial disclosures.
SOURCE: McDaniel B et al. Pediatr Res. 2018. doi: 10.1038/s41390-018-0052-6.
Digital technology use by parents during family activities may exacerbate internalizing or externalizing behavior in their children, according to results published in Pediatric Research.
In a study of 183 couples with children aged 5 years or younger, mothers perceived an average of 1.65 devices as interfering in their interactions with their child at least once per day, compared with an average of 1.43 devices per day for fathers. In addition, 56% of mothers and 43% of fathers reported that two or more devices interrupted their parent-child activities on a daily basis.
Higher technology interference (“technoference”) was associated with greater externalizing and internalizing behaviors in children and higher parenting stress for both mothers and fathers. Technoference also was associated with lower coparenting quality in fathers only, and greater parent depressive symptoms in mothers only, reported Brandon T. McDaniel, PhD, of Illinois State University, Normal, and Jenny S. Radesky, MD, of the University of Michigan, Ann Arbor.
The parents observed participated in the Daily Family Life Project, a longitudinal study on family relationships from 2014 to 2016. Participants were required to be 18 years of age or older, a parent of a child 5 years of age or younger, an English speaker, and currently living with their partner and child. Participants first completed a baseline online survey via Qualtrics, followed by assessments at 1, 3, and 6 months.
Each follow-up survey included a technoference self-assessment completed by each parent, adapted from the Technology Device Interference Scale. Follow-up assessments included information on parental stress, coparenting quality, depressive symptoms, and child externalizing and internalizing behavior, using scales from the Child Behavioral Checklist. Internalizing was defined by behaviors such as whining, sulking, and easily hurt feelings, whereas externalizing included inability to sit still, restlessness, hyperactivity, being easily frustrated, and having temper tantrums, wrote Dr. McDaniel and Dr. Radesky.
Structural equation modeling was used to test models for child externalizing and internalizing in three hypotheses: more frequent technoference predicting higher ratings of child behavior problems (H1), higher ratings of child behavior problems predicting higher parenting stress (H2), and higher parenting stress predicting more frequent technoference (H3), the authors wrote.
H1 and H2 were supported in the externalizing behavior model but only partially supported in the internalizing model, with technoference predicting greater externalizing behavior at all subsequent time points (betas = 0.11, 0.16, and 0.13, P values less than .01), and child externalizing predicting greater parenting stress (betas = 0.16, 0.15, and 0.12, P values less than .01). H3 was partially supported in the externalizing and internalizing behavior models, with parenting stress predicting later technoference from baseline to month 1 (betas = 0.19 and 0.15, P values less than .01) and from month 1 to month 3 (betas= 0.17 and 0.19, P values less than .001), the authors reported.
The findings suggest that “relationships between parent technoference and child externalizing behavior are transactional and influence each other over time,” Dr. McDaniel and Dr. Radesky said.
“In other words, parents who have children with more externalizing problems become more stressed, which may lead to greater technoference (e.g., withdrawal with technology), which in turn may contribute to more child externalizing problems (and only sometimes internalized problems),” they added.
“Our results suggest that children may be more likely to act out over time in response to technoference as opposed to internalize, although when we examined internalizing subscales, child withdrawal was the most consistently associated with parent technoference over time. This may be due to (1) parents responding to child withdrawal social cues by feeling they too can disengage into their mobile device use, or (2) parent media use precipitating child withdrawal from social interaction,” the authors wrote.
The main limitation of this study was the self-reporting used by parents, which may be more subject to bias compared with observational methods, they added.
“It would be worthwhile to study whether experimental manipulation of parent mobile phone use habits – for example through unplugged family routines or less intrusive digital design – might lead to improvements in the parent-child relationship and child behavior,” Dr. McDaniel and Dr. Radesky concluded.
The study was funded by the College of Health and Human Development, Department of Human Development and Family Studies, and the Bennett Pierce Prevention Research Center at Pennsylvania State University, National Institute on Drug Abuse, and the Eunice Kennedy Shriver National Institute of Child Health and Human Development. Dr. McDaniel and Dr. Radesky had no relevant financial disclosures.
SOURCE: McDaniel B et al. Pediatr Res. 2018. doi: 10.1038/s41390-018-0052-6.
FROM PEDIATRIC RESEARCH
Key clinical point:
Major finding: Technoference predicted greater externalizing behavior at all subsequent time points in the study (betas = 0.11, 0.16, and 0.13, P values less than .01).
Study details: A study of 183 couples from the Daily Family Life Project with children aged 5 years or younger.
Disclosures: The study was funded by the College of Health and Human Development, Department of Human Development and Family Studies, and the Bennett Pierce Prevention Research Center at Pennsylvania State University, National Institute on Drug Abuse, and the Eunice Kennedy Shriver National Institute of Child Health and Human Development. Dr. McDaniel and Dr. Radesky had no relevant financial disclosures.
Source: McDaniel B et al. Pediatr Res. 2018. doi: 10.1038/s41390-018-0052-6.
Examining developmental monitoring and screening in LMICs
Over the last decade, three series published in the Lancet on child development have increased global awareness of the importance of early brain development and highlighted the critical role nurturing care plays in the first 3 years of a child’s life. Yet, as practitioners and policy makers in low- and middle-income countries increasingly acknowledge the influence early development has on later developmental, educational, and socioeconomic trajectories, there has been less agreement regarding the most appropriate methods and measures for screening and monitoring child development over time.

In an article published in Developmental Medicine & Child Neurology, we and our colleagues, Emily Vargas-Barón, PhD, of RISE Institute, Washington, and Kevin P. Marks, MD, of PeaceHealth Medical Group in Eugene, Ore., countered some of the concerns raised about translating and adapting screening measures developed in HICs. In the paper, we documented the translation, cultural adaptation, and implementation of the Ages and Stages Questionnaires (ASQ) in LMICs based on a critical examination of 53 studies published in a variety of peer-reviewed journals.
We used a consensus rating procedure to classify the articles into one of four categories: feasibility study, psychometric study, prevalence study, or research study. In total, we identified 8 feasibility studies, 12 psychometric studies, and 9 prevalence studies. The main objectives of these studies varied by economy and region.
Overall, the review revealed that the ASQ is already being used broadly in a range of countries, cultures, and linguistic contexts. As of 2017, the ASQ has been used in 23 LMICs distributed across all world regions and has been translated into at least 16 languages for use in these countries. Over half of the studies reported that parents filled out the ASQ, a finding that runs contrary to recent misconceptions about the use of developmental screeners in LMICs.
Additionally, we found that adaptation and use of the ASQ in LMICs often followed one of two paths. The first path involved engagement in a systematic translation and adaptation process, collection of evidence to support reliability and validity, completion of prevalence studies, and use in research or practice. This first path resulted in higher rates of parent completion and, in general, closer adherence to the administration procedures recommended by the ASQ development team. In contrast, a second path utilized the ASQ solely for research purposes. This path tended to result in more frequent deviations from recommended procedures for adaptation and translation (for example, on-the-fly translation or administration by assessors) and may be fueling some of the misunderstandings associated with developmental screening in LMICs.

As countries begin to develop and scale up Early Childhood Development and Early Childhood Intervention systems and services worldwide, it is vitally important that properly standardized developmental screening measures with strong evidence of reliability and validity are available for parents and practitioners. Regardless of whether researchers develop these measures locally or adapt them from measures developed in HICs, it is imperative that decision makers step back, compile available psychometric and feasibility information across the studies that have been conducted for a given measure, and draw their own conclusions.
Finally, given that some LMICs may have fewer early intervention resources and may face more barriers to ensuring service follow-up, it would be ideal if evidence-based developmental promotion (for example, early literacy promotion, positive parenting tips, or resiliency counseling) is incorporated into the process of developmental screening. In theory, this would make the screening process more effective and parent-centered.
Mr. Small is with the Oregon Research Institute, Eugene. Dr. Hix-Small is with Portland (Ore.) State University. The authors have stated that they had no interests that might be perceived as posing a conflict or bias. Dr. Hix-Small has worked as a paid ASQ trainer. Email them at [email protected].
Over the last decade, three series published in the Lancet on child development have increased global awareness of the importance of early brain development and highlighted the critical role nurturing care plays in the first 3 years of a child’s life. Yet, as practitioners and policy makers in low- and middle-income countries increasingly acknowledge the influence early development has on later developmental, educational, and socioeconomic trajectories, there has been less agreement regarding the most appropriate methods and measures for screening and monitoring child development over time.
In an article published in Developmental Medicine & Child Neurology, we and our colleagues, Emily Vargas-Barón, PhD, of RISE Institute, Washington, and Kevin P. Marks, MD, of PeaceHealth Medical Group in Eugene, Ore., countered some of the concerns raised about translating and adapting screening measures developed in HICs. In the paper, we documented the translation, cultural adaptation, and implementation of the Ages and Stages Questionnaires (ASQ) in LMICs based on a critical examination of 53 studies published in a variety of peer-reviewed journals.
We used a consensus rating procedure to classify the articles into one of four categories: feasibility study, psychometric study, prevalence study, or research study. In total, we identified 8 feasibility studies, 12 psychometric studies, and 9 prevalence studies. The main objectives of these studies varied by economy and region.
Overall, the review revealed that the ASQ is already being used broadly in a range of countries, cultures, and linguistic contexts. As of 2017, the ASQ has been used in 23 LMICs distributed across all world regions and has been translated into at least 16 languages for use in these countries. Over half of the studies reported that parents filled out the ASQ, a finding that runs contrary to recent misconceptions about the use of developmental screeners in LMICs.
Additionally, we found that adaptation and use of the ASQ in LMICs often followed one of two paths. The first path involved engagement in a systematic translation and adaptation process, collection of evidence to support reliability and validity, completion of prevalence studies, and use in research or practice. This first path resulted in higher rates of parent completion and, in general, closer adherence to the administration procedures recommended by the ASQ development team. In contrast, a second path utilized the ASQ solely for research purposes. This path tended to result in more frequent deviations from recommended procedures for adaptation and translation (for example, on-the-fly translation or administration by assessors) and may be fueling some of the misunderstandings associated with developmental screening in LMICs.
As countries begin to develop and scale up Early Childhood Development and Early Childhood Intervention systems and services worldwide, it is vitally important that properly standardized developmental screening measures with strong evidence of reliability and validity are available for parents and practitioners. Regardless of whether researchers develop these measures locally or adapt them from measures developed in HICs, it is imperative that decision makers step back, compile available psychometric and feasibility information across the studies that have been conducted for a given measure, and draw their own conclusions.
Finally, given that some LMICs may have fewer early intervention resources and may face more barriers to ensuring service follow-up, it would be ideal if evidence-based developmental promotion (for example, early literacy promotion, positive parenting tips, or resiliency counseling) is incorporated into the process of developmental screening. In theory, this would make the screening process more effective and parent-centered.
Mr. Small is with the Oregon Research Institute, Eugene. Dr. Hix-Small is with Portland (Ore.) State University. The authors have stated that they had no interests that might be perceived as posing a conflict or bias. Dr. Hix-Small has worked as a paid ASQ trainer. Email them at [email protected].
Closed-loop insulin control for T2DM is feasible in hospital setting
ORLANDO – (T2DM).
The findings, released at the annual scientific sessions of the American Diabetes Association and via simultaneous publication in The New England Journal of Medicine, don’t examine cost or clinical outcomes. However, “our results suggest this new technology might be another approach to manage in-patient hypoglycemia in a safe and effective way, lead author Lia Bally, MD, PhD, of the division of endocrinology, diabetes, and clinical nutrition, Bern (Switzerland ) University Hospital, said in an interview.
The video associated with this article is no longer available on this site. Please view all of our videos on the MDedge YouTube channel
For the open-label trial, the researchers recruited 136 adults with T2DM under noncritical care at two hospitals (one in the England and the other in Switzerland). Some patients had undergone surgery, Dr. Bally said, and some others were being treated for systemic infections. Comorbidities were significantly more severe in the closed-loop group, and 43% had sepsis.
All of the subjects required subcutaneous insulin therapy.
From 2016 to 2017, patients were randomly assigned to receive normal subcutaneous insulin therapy (n = 70) or closed-loop insulin delivery (n = 66).
It took about 15 minutes to perform the procedure to implement the closed-loop insulin delivery system, Dr. Bally said. It featured a subcutaneous cannula inserted into the abdomen, a continuous glucose monitor (a device also used in the control group), and a trial insulin pump.
This was not a hybrid system, and it did not include prandial insulin boluses or input of the timing and carbohydrate content of meals. One reason behind the choice to adopt a fully automated system was to relieve the burden on both health care professionals and patients, coauthor Hood Thabit, PhD, of Wellcome Trust–MRC Institute of Metabolic Science, the Manchester Academic Health Science Center, and University of Manchester, said in an interview.
For up to 15 days or until discharge, researchers tracked how much of the time sensor glucose measurements were in a target range of 100 mg/dL to 180 mg/dL.
In the closed-loop group, glucose measurements were in the target range 66 mg/dL ± 17% of the time compared to 42 mg/dL ± 17% in the control group, a difference of 24 mg/dL ± 3% (95% confidence interval, 19-30; P less than .001).
For the closed-loop group, the average glucose level was 154 mg/dL, and it was 188 mg/dL in the control group (P less than .001).
The researchers didn’t find a statistically significant difference between the groups in duration of hypoglycemia or amount of insulin delivered.
None of the patients suffered from severe hypoglycemia or clinically significant hyperglycemia with ketonemia.
There were 18 incidents of clinically significant hyperglycemia events (capillary glucose levels of more than 360 mg/dL) in the closed-loop group, compared with 41 such events in the control group. (P = .03)
Three patients in each group had adverse trial-related device effects.
Of 62 patients in the closed-loop group who completed the trial, 87% reported being pleased by their glucose levels, and all but one reported being happy to have their levels monitored automatically. All 62 patients said they’d recommend the system to others.
Going forward, the researchers hope to launch a multicenter trial that will examine clinical outcomes such as postoperative complications, infections, mortality, and glucose control after hospital discharge, according to Dr. Bally.
The study was supported by Diabetes UK, the Swiss National Science Foundation, the European Foundation for the Study of Diabetes, the JDRF, the National Institute for Health Research Cambridge Biomedical Research Center, and a Wellcome Strategic Award. Abbott Diabetes Care supplied equipment and guidance regarding connectivity, and representatives reviewed the manuscript before submission.
Dr. Bally reported funding from the University Hospital Bern, University of Bern and the Swiss Diabetes Foundation. Dr. Thabit reported no disclosures. Other authors report no disclosures or various disclosures.
SOURCE: Bally L et al. ADA 2018 Abstract 350-OR. Published simultaneously in The New England Journal of Medicine. June 25, 2018
REPORTING FROM ADA 2018
Key clinical point: Use of an automated closed-loop insulin delivery system may be feasible in the noncritical hospital setting.
Major finding: In the closed-loop group, glucose measurements were in the target range 66 mg/dL ± 17% of the time compared with 42 mg/dL ± 17% in the control group, a difference of 24 mg/dL ± 3% (95% CI, 19-30; P less than .001).
Study details: Randomized, open-label, two-center trial of 136 inpatients with type 2 diabetes mellitus assigned to either standard subcutaneous insulin therapy or closed-loop insulin delivery for 15 days or until discharge.
Disclosures: The study was supported by Diabetes UK, the Swiss National Science Foundation, the European Foundation for the Study of Diabetes, the JDRF, the National Institute for Health Research Cambridge Biomedical Research Center, and a Wellcome Strategic Award. Abbott Diabetes Care supplied equipment and guidance regarding connectivity, and representatives reviewed the manuscript before submission. The researchers reported no disclosures or various disclosures.
Source: Bally L et al. ADA 2018 Abstract 350-OR.