User login
Resident Research Award Highlights Diet-Based Strategy to Prevent Vein Graft Disease
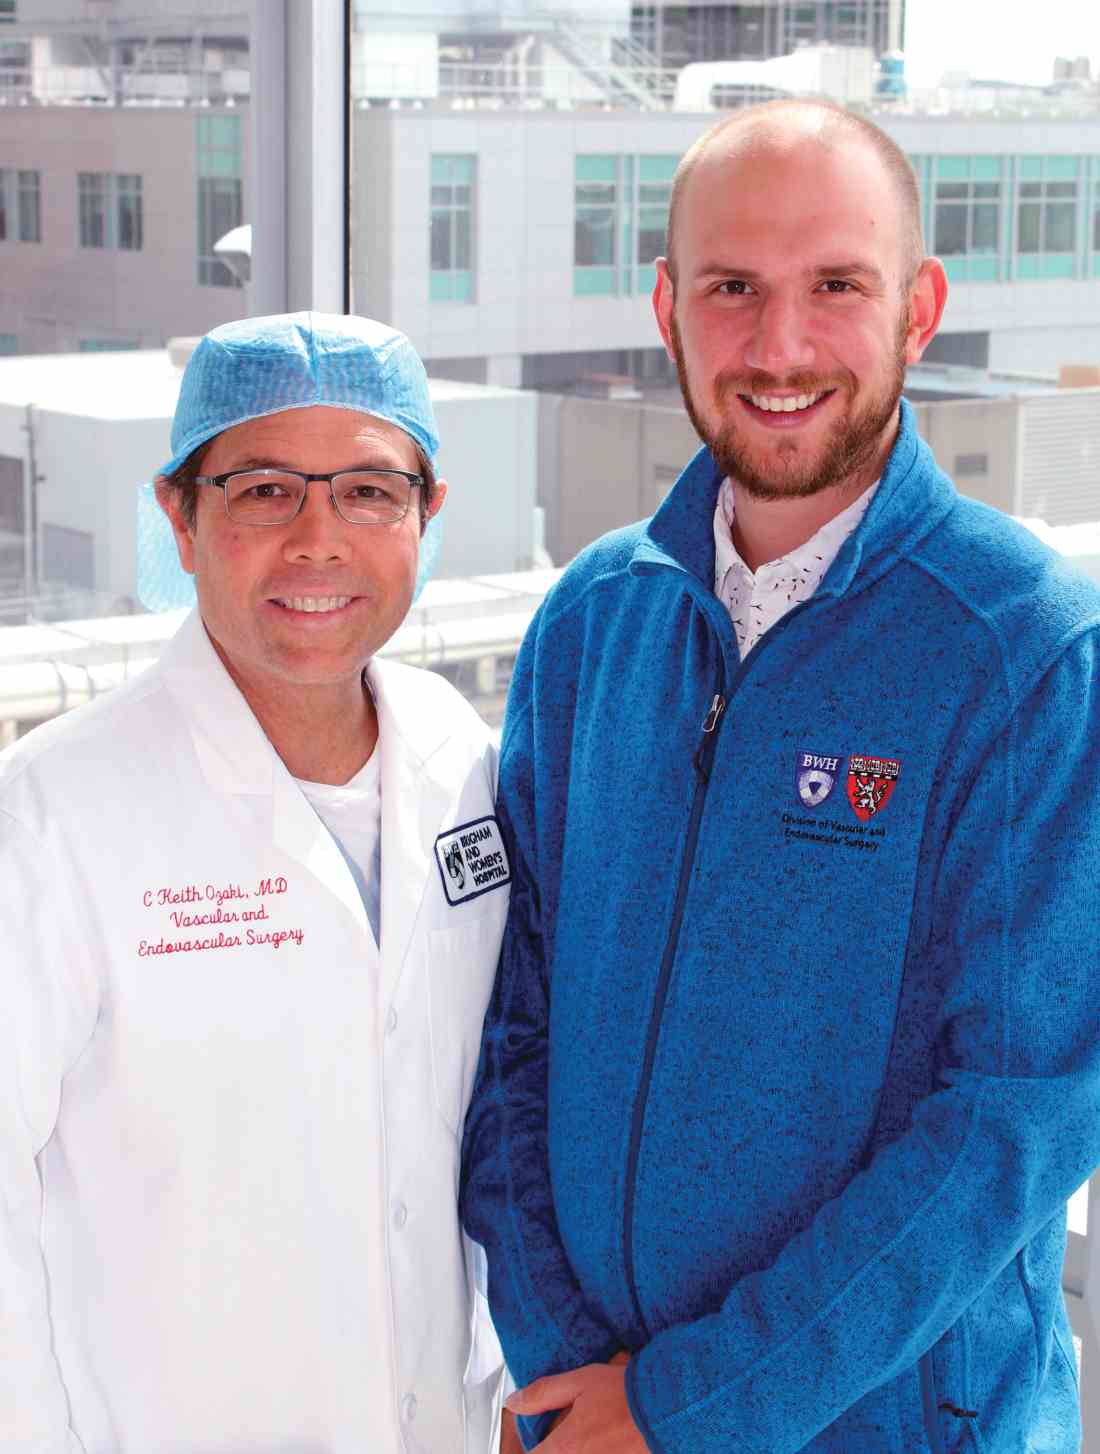
This year’s SVS Foundation’s Resident Research Award is being presented to Kaspar M. Trocha, MD, for his research on vein graft disease. As a member of the laboratories of C. Keith Ozaki, MD, and James Mitchell, MD, along with co-first author Peter Kip, MD, and microsurgeon Ming Tao, MD, the group studies the effects of food intake immediately before surgery on vascular adaptations.
Dietary restriction (reducing food intake without malnutrition) has been a topic of special interest in the science community for decades, and restricting calories in the long term has been shown to extend life and health span in a variety of species. It can also protect from overexuberant responses to trauma and ischemia-reperfusion.
Dr. Mitchell found that the benefits from long-term food restriction could be acquired as rapidly as in a few days, pointing to a potential for implementing dietary restriction recommendations prior to elective surgery.
The response to stress benefits seen following brief dietary interventions are mediated by the gaseous signaling molecule hydrogen sulfide (H2S). H2S is strongly upregulated by dietary restriction and this “rotten egg” gas seems to be protective for the cardiovascular system and has been demonstrated to be involved in vasodilation, inflammation, and atherogenesis, according to the researchers. The group’s experiments thus tested short-term protein restriction (a more feasible dietary approach for patients that observed to induce H2S) in a microsurgical mouse vein graft model.
The team discovered that cutting all protein from the animal diet for just 1 week before surgery led to increased levels of the enzyme cystathionine-gamma-lyase (CGL) that makes H2S, higher levels of the protective gaseous molecule, less early vein graft inflammation, and less eventual occlusive vein graft disease even though the animals were returned to their usual high-fat diet postop. The group also confirmed these results by constructing a new mouse strain that overexpresses CGL, and these mice were protected from vein graft disease. Conversely, blocking this enzyme negated all the beneficial effects of the dietary restriction.
According to Dr. Trocha and his colleagues, “short-term pre-operative protein restriction and manipulation of H2S stand as novel, economical approaches to enhance vein graft durability and perhaps even lessen peri-operative complications, and we are in the early stages of testing this strategy in vascular surgery patients.”
Dr. Trocha’s research was supported by the Harvard-Longwood Research Training in Vascular Surgery NIH T32 Grant and Dr. Ozaki’s NIH and American Heart Association grants. The Resident Research Award is given to one individual each year as determined by the SVS Research and Education Committee with the intent of motivating physicians early in their training to pursue their interest in research that explores the biology of vascular disease and potential translational therapies. The recognition includes plenary presentation at the Vascular Annual Meeting, a $5,000 award and a 1-year complimentary subscription to the Journal of Vascular Surgery.
This year’s SVS Foundation’s Resident Research Award is being presented to Kaspar M. Trocha, MD, for his research on vein graft disease. As a member of the laboratories of C. Keith Ozaki, MD, and James Mitchell, MD, along with co-first author Peter Kip, MD, and microsurgeon Ming Tao, MD, the group studies the effects of food intake immediately before surgery on vascular adaptations.
Dietary restriction (reducing food intake without malnutrition) has been a topic of special interest in the science community for decades, and restricting calories in the long term has been shown to extend life and health span in a variety of species. It can also protect from overexuberant responses to trauma and ischemia-reperfusion.
Dr. Mitchell found that the benefits from long-term food restriction could be acquired as rapidly as in a few days, pointing to a potential for implementing dietary restriction recommendations prior to elective surgery.
The response to stress benefits seen following brief dietary interventions are mediated by the gaseous signaling molecule hydrogen sulfide (H2S). H2S is strongly upregulated by dietary restriction and this “rotten egg” gas seems to be protective for the cardiovascular system and has been demonstrated to be involved in vasodilation, inflammation, and atherogenesis, according to the researchers. The group’s experiments thus tested short-term protein restriction (a more feasible dietary approach for patients that observed to induce H2S) in a microsurgical mouse vein graft model.
The team discovered that cutting all protein from the animal diet for just 1 week before surgery led to increased levels of the enzyme cystathionine-gamma-lyase (CGL) that makes H2S, higher levels of the protective gaseous molecule, less early vein graft inflammation, and less eventual occlusive vein graft disease even though the animals were returned to their usual high-fat diet postop. The group also confirmed these results by constructing a new mouse strain that overexpresses CGL, and these mice were protected from vein graft disease. Conversely, blocking this enzyme negated all the beneficial effects of the dietary restriction.
According to Dr. Trocha and his colleagues, “short-term pre-operative protein restriction and manipulation of H2S stand as novel, economical approaches to enhance vein graft durability and perhaps even lessen peri-operative complications, and we are in the early stages of testing this strategy in vascular surgery patients.”
Dr. Trocha’s research was supported by the Harvard-Longwood Research Training in Vascular Surgery NIH T32 Grant and Dr. Ozaki’s NIH and American Heart Association grants. The Resident Research Award is given to one individual each year as determined by the SVS Research and Education Committee with the intent of motivating physicians early in their training to pursue their interest in research that explores the biology of vascular disease and potential translational therapies. The recognition includes plenary presentation at the Vascular Annual Meeting, a $5,000 award and a 1-year complimentary subscription to the Journal of Vascular Surgery.
This year’s SVS Foundation’s Resident Research Award is being presented to Kaspar M. Trocha, MD, for his research on vein graft disease. As a member of the laboratories of C. Keith Ozaki, MD, and James Mitchell, MD, along with co-first author Peter Kip, MD, and microsurgeon Ming Tao, MD, the group studies the effects of food intake immediately before surgery on vascular adaptations.
Dietary restriction (reducing food intake without malnutrition) has been a topic of special interest in the science community for decades, and restricting calories in the long term has been shown to extend life and health span in a variety of species. It can also protect from overexuberant responses to trauma and ischemia-reperfusion.
Dr. Mitchell found that the benefits from long-term food restriction could be acquired as rapidly as in a few days, pointing to a potential for implementing dietary restriction recommendations prior to elective surgery.
The response to stress benefits seen following brief dietary interventions are mediated by the gaseous signaling molecule hydrogen sulfide (H2S). H2S is strongly upregulated by dietary restriction and this “rotten egg” gas seems to be protective for the cardiovascular system and has been demonstrated to be involved in vasodilation, inflammation, and atherogenesis, according to the researchers. The group’s experiments thus tested short-term protein restriction (a more feasible dietary approach for patients that observed to induce H2S) in a microsurgical mouse vein graft model.
The team discovered that cutting all protein from the animal diet for just 1 week before surgery led to increased levels of the enzyme cystathionine-gamma-lyase (CGL) that makes H2S, higher levels of the protective gaseous molecule, less early vein graft inflammation, and less eventual occlusive vein graft disease even though the animals were returned to their usual high-fat diet postop. The group also confirmed these results by constructing a new mouse strain that overexpresses CGL, and these mice were protected from vein graft disease. Conversely, blocking this enzyme negated all the beneficial effects of the dietary restriction.
According to Dr. Trocha and his colleagues, “short-term pre-operative protein restriction and manipulation of H2S stand as novel, economical approaches to enhance vein graft durability and perhaps even lessen peri-operative complications, and we are in the early stages of testing this strategy in vascular surgery patients.”
Dr. Trocha’s research was supported by the Harvard-Longwood Research Training in Vascular Surgery NIH T32 Grant and Dr. Ozaki’s NIH and American Heart Association grants. The Resident Research Award is given to one individual each year as determined by the SVS Research and Education Committee with the intent of motivating physicians early in their training to pursue their interest in research that explores the biology of vascular disease and potential translational therapies. The recognition includes plenary presentation at the Vascular Annual Meeting, a $5,000 award and a 1-year complimentary subscription to the Journal of Vascular Surgery.
Private Facebook chats show promise as depression, cannabis use intervention
SAN DIEGO – A pair of small studies suggest that cyber-based interventions with private online meeting areas – like those available on Facebook – could help lift depression and encourage less marijuana use in young people with cannabis use disorder.
“Even individuals who are not looking to quit their use of cannabis have some degree of ambivalence about the extent of their use of it,” said study researcher Suzette Glasner, PhD, in an interview. “When given tools to explore the consequences of their use and change if they want to, they do find reasons and effective ways to change or reduce their use – even if they don’t quit completely.”

Research shows that nearly one-third of cannabis users in 2012-2013 showed signs of cannabis use disorder (JAMA Psychiatry. 2015 Dec; 72[12]:1235-42).
For the first study, researchers recruited 26 participants who were diagnosed with major depressive disorder and cannabis use disorder (all had used marijuana on at least 40 of the previous 90 days). After a brief in-person intervention session, they received 9 therapy sessions via computer and brief weekly check-ins by clinicians over 10 weeks.
The average age of the participants was 29, and 54% were women. They reported that their average depression severity fell from 13 to 6 at 14-week follow-up, based on the Patient Health Questionnaire-9 scale. Cannabis use also declined.
For the separate Facebook study, an additional 18 participants received access to a private Facebook group that included daily posts reinforcing the program. The average age of this group was 27, and 56% were women.
The posts asked questions about topics such as “your fears about cutting back” and feelings that are “triggers” for cannabis use. One post directed users to details about mindfulness activities, and another asked users to describe on a scale of 1-10 how important it is for them to cut back.
Participants responded with praise for the private group, offering comments such as “the Facebook group is really helpful and offers a lot of support,” “it’s nice throughout the day to have uplifting Facebook notifications,” and “I like the tips, the positive feedback and the feeling that we’re in it together, not alone.”
Dr. Glasner said. “The Facebook approach enables those addicted to cannabis, for whom motivation for many things – including socializing – may be lacking, to utilize social support, without having to leave the comfort of their home or wherever they might isolate when they’re using cannabis heavily.”
She added that “this social support may be inspiring, motivating, and reassuring to them,” letting them know that they’re not alone in experiencing an addiction whose existence is sometimes doubted.
Dr. Glasner said she next plans a large randomized trial to evaluate the efficacy of the Facebook intervention and its mechanisms of action.
After her presentation at the meeting, Dr. Glasner was asked about the ongoing concerns regarding privacy on Facebook. “When I funded and started this study, it was nearly 2 years ago, and it wasn’t as large of a concern,” she said. “We may need to look to utilize a social media platform that may not be Facebook: ‘We have one to support you, but it’s not Facebook.’”
In a related presentation at the meeting, another researcher reported success using 80 interactive texts over 4 weeks to reach out to participants in an intervention programs targeting cannabis use disorder.
The National Institute on Drug Abuse funded the study. Dr. Glasner is author of The Addiction Recovery Skills Workbook: Changing Addictive Behaviors Using CBT, Mindfulness, and Motivational Interviewing Techniques (Oakland, Calif.: New Harbinger Publications, 2015). The authors reported no relevant disclosures.
SAN DIEGO – A pair of small studies suggest that cyber-based interventions with private online meeting areas – like those available on Facebook – could help lift depression and encourage less marijuana use in young people with cannabis use disorder.
“Even individuals who are not looking to quit their use of cannabis have some degree of ambivalence about the extent of their use of it,” said study researcher Suzette Glasner, PhD, in an interview. “When given tools to explore the consequences of their use and change if they want to, they do find reasons and effective ways to change or reduce their use – even if they don’t quit completely.”
Research shows that nearly one-third of cannabis users in 2012-2013 showed signs of cannabis use disorder (JAMA Psychiatry. 2015 Dec; 72[12]:1235-42).
For the first study, researchers recruited 26 participants who were diagnosed with major depressive disorder and cannabis use disorder (all had used marijuana on at least 40 of the previous 90 days). After a brief in-person intervention session, they received 9 therapy sessions via computer and brief weekly check-ins by clinicians over 10 weeks.
The average age of the participants was 29, and 54% were women. They reported that their average depression severity fell from 13 to 6 at 14-week follow-up, based on the Patient Health Questionnaire-9 scale. Cannabis use also declined.
For the separate Facebook study, an additional 18 participants received access to a private Facebook group that included daily posts reinforcing the program. The average age of this group was 27, and 56% were women.
The posts asked questions about topics such as “your fears about cutting back” and feelings that are “triggers” for cannabis use. One post directed users to details about mindfulness activities, and another asked users to describe on a scale of 1-10 how important it is for them to cut back.
Participants responded with praise for the private group, offering comments such as “the Facebook group is really helpful and offers a lot of support,” “it’s nice throughout the day to have uplifting Facebook notifications,” and “I like the tips, the positive feedback and the feeling that we’re in it together, not alone.”
Dr. Glasner said. “The Facebook approach enables those addicted to cannabis, for whom motivation for many things – including socializing – may be lacking, to utilize social support, without having to leave the comfort of their home or wherever they might isolate when they’re using cannabis heavily.”
She added that “this social support may be inspiring, motivating, and reassuring to them,” letting them know that they’re not alone in experiencing an addiction whose existence is sometimes doubted.
Dr. Glasner said she next plans a large randomized trial to evaluate the efficacy of the Facebook intervention and its mechanisms of action.
After her presentation at the meeting, Dr. Glasner was asked about the ongoing concerns regarding privacy on Facebook. “When I funded and started this study, it was nearly 2 years ago, and it wasn’t as large of a concern,” she said. “We may need to look to utilize a social media platform that may not be Facebook: ‘We have one to support you, but it’s not Facebook.’”
In a related presentation at the meeting, another researcher reported success using 80 interactive texts over 4 weeks to reach out to participants in an intervention programs targeting cannabis use disorder.
The National Institute on Drug Abuse funded the study. Dr. Glasner is author of The Addiction Recovery Skills Workbook: Changing Addictive Behaviors Using CBT, Mindfulness, and Motivational Interviewing Techniques (Oakland, Calif.: New Harbinger Publications, 2015). The authors reported no relevant disclosures.
SAN DIEGO – A pair of small studies suggest that cyber-based interventions with private online meeting areas – like those available on Facebook – could help lift depression and encourage less marijuana use in young people with cannabis use disorder.
“Even individuals who are not looking to quit their use of cannabis have some degree of ambivalence about the extent of their use of it,” said study researcher Suzette Glasner, PhD, in an interview. “When given tools to explore the consequences of their use and change if they want to, they do find reasons and effective ways to change or reduce their use – even if they don’t quit completely.”
Research shows that nearly one-third of cannabis users in 2012-2013 showed signs of cannabis use disorder (JAMA Psychiatry. 2015 Dec; 72[12]:1235-42).
For the first study, researchers recruited 26 participants who were diagnosed with major depressive disorder and cannabis use disorder (all had used marijuana on at least 40 of the previous 90 days). After a brief in-person intervention session, they received 9 therapy sessions via computer and brief weekly check-ins by clinicians over 10 weeks.
The average age of the participants was 29, and 54% were women. They reported that their average depression severity fell from 13 to 6 at 14-week follow-up, based on the Patient Health Questionnaire-9 scale. Cannabis use also declined.
For the separate Facebook study, an additional 18 participants received access to a private Facebook group that included daily posts reinforcing the program. The average age of this group was 27, and 56% were women.
The posts asked questions about topics such as “your fears about cutting back” and feelings that are “triggers” for cannabis use. One post directed users to details about mindfulness activities, and another asked users to describe on a scale of 1-10 how important it is for them to cut back.
Participants responded with praise for the private group, offering comments such as “the Facebook group is really helpful and offers a lot of support,” “it’s nice throughout the day to have uplifting Facebook notifications,” and “I like the tips, the positive feedback and the feeling that we’re in it together, not alone.”
Dr. Glasner said. “The Facebook approach enables those addicted to cannabis, for whom motivation for many things – including socializing – may be lacking, to utilize social support, without having to leave the comfort of their home or wherever they might isolate when they’re using cannabis heavily.”
She added that “this social support may be inspiring, motivating, and reassuring to them,” letting them know that they’re not alone in experiencing an addiction whose existence is sometimes doubted.
Dr. Glasner said she next plans a large randomized trial to evaluate the efficacy of the Facebook intervention and its mechanisms of action.
After her presentation at the meeting, Dr. Glasner was asked about the ongoing concerns regarding privacy on Facebook. “When I funded and started this study, it was nearly 2 years ago, and it wasn’t as large of a concern,” she said. “We may need to look to utilize a social media platform that may not be Facebook: ‘We have one to support you, but it’s not Facebook.’”
In a related presentation at the meeting, another researcher reported success using 80 interactive texts over 4 weeks to reach out to participants in an intervention programs targeting cannabis use disorder.
The National Institute on Drug Abuse funded the study. Dr. Glasner is author of The Addiction Recovery Skills Workbook: Changing Addictive Behaviors Using CBT, Mindfulness, and Motivational Interviewing Techniques (Oakland, Calif.: New Harbinger Publications, 2015). The authors reported no relevant disclosures.
REPORTING FROM CPDD 2018
Postmenopausal estrogen use down since 2006
according to a commercial database with prescription claims for more than 12 million women.
The prevalence of prescriptions for noncontraceptive oral estrogen dropped from 83 per 1,000 women in 2007 to 42 per 1,000 in 2015 for women aged 50 years and older, Joel L. Weissfeld, MD, MPH, of the Office of Surveillance and Epidemiology at the Center for Drug Evaluation and Research at the Food and Drug Administration, and his associates reported based on data from IQVIA Real World Data Adjudicated Claims – U.S. Database.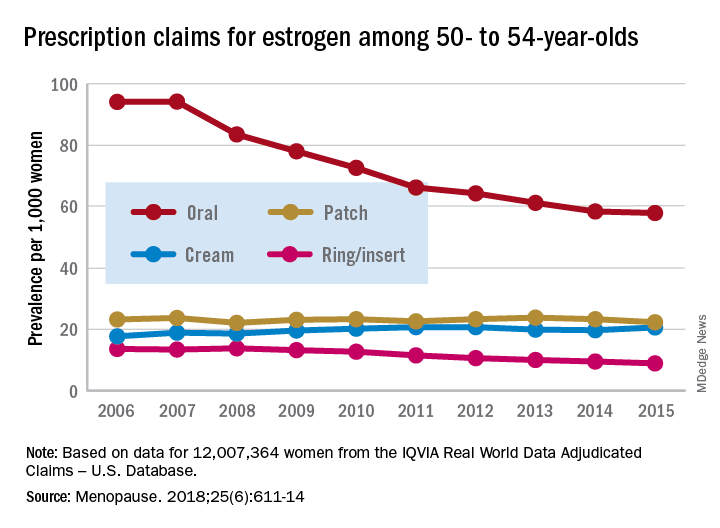
Prescriptions for vaginal forms (creams, rings, and inserts) rose from 27 per 1,000 women in 2006 to 42 per 1,000 in 2011 but declined to 35 per 1,000 by 2017, the investigators reported in Menopause.
For women aged 50-54 years, use of vaginal rings and inserts was steady for 2 years and then dropped every year after 2009, with prevalence lower in 2017 than in 2006. Vaginal ring/insert use increased for the first 2 years among those aged 55-59 years and for the first 5 years for those aged 60-64 years, but then each group started a fairly rapid and ongoing decline that had 2017 levels below those in 2006. Among women aged 65 years and older, however, prevalence of ring/insert use rose for most of the study period, and the declines left prevalences for 2015 above those for 2006, Dr. Weissfeld and his associates wrote.
The data source couldn’t provide reasons for use of vaginal rings or inserts, but the researchers noted that it’s possible that use for vasomotor symptoms “predominated in younger (aged 50-59 years) women closer in age to the onset of menopause. We presume that use for [vulvar and vaginal atrophy] predominated in women 60-65 years of age and older, women who are more distant in age from onset of menopause.”
Trends for use of transdermal patches also varied by age group but with smaller levels of difference. Use among women aged 50-54 years and 55-59 years fluctuated but showed no overall change. Those aged 60-64 years had a gradual decline over the study period, those aged 70-74 years had an initial increase in 2007 and then a decline, and those aged 75 years or older had an increase that lasted until 2011 before use started to fall, they wrote.
SOURCE: Weissfeld JL et al. Menopause. 2018;25(6):611-14.
according to a commercial database with prescription claims for more than 12 million women.
The prevalence of prescriptions for noncontraceptive oral estrogen dropped from 83 per 1,000 women in 2007 to 42 per 1,000 in 2015 for women aged 50 years and older, Joel L. Weissfeld, MD, MPH, of the Office of Surveillance and Epidemiology at the Center for Drug Evaluation and Research at the Food and Drug Administration, and his associates reported based on data from IQVIA Real World Data Adjudicated Claims – U.S. Database.
Prescriptions for vaginal forms (creams, rings, and inserts) rose from 27 per 1,000 women in 2006 to 42 per 1,000 in 2011 but declined to 35 per 1,000 by 2017, the investigators reported in Menopause.
For women aged 50-54 years, use of vaginal rings and inserts was steady for 2 years and then dropped every year after 2009, with prevalence lower in 2017 than in 2006. Vaginal ring/insert use increased for the first 2 years among those aged 55-59 years and for the first 5 years for those aged 60-64 years, but then each group started a fairly rapid and ongoing decline that had 2017 levels below those in 2006. Among women aged 65 years and older, however, prevalence of ring/insert use rose for most of the study period, and the declines left prevalences for 2015 above those for 2006, Dr. Weissfeld and his associates wrote.
The data source couldn’t provide reasons for use of vaginal rings or inserts, but the researchers noted that it’s possible that use for vasomotor symptoms “predominated in younger (aged 50-59 years) women closer in age to the onset of menopause. We presume that use for [vulvar and vaginal atrophy] predominated in women 60-65 years of age and older, women who are more distant in age from onset of menopause.”
Trends for use of transdermal patches also varied by age group but with smaller levels of difference. Use among women aged 50-54 years and 55-59 years fluctuated but showed no overall change. Those aged 60-64 years had a gradual decline over the study period, those aged 70-74 years had an initial increase in 2007 and then a decline, and those aged 75 years or older had an increase that lasted until 2011 before use started to fall, they wrote.
SOURCE: Weissfeld JL et al. Menopause. 2018;25(6):611-14.
according to a commercial database with prescription claims for more than 12 million women.
The prevalence of prescriptions for noncontraceptive oral estrogen dropped from 83 per 1,000 women in 2007 to 42 per 1,000 in 2015 for women aged 50 years and older, Joel L. Weissfeld, MD, MPH, of the Office of Surveillance and Epidemiology at the Center for Drug Evaluation and Research at the Food and Drug Administration, and his associates reported based on data from IQVIA Real World Data Adjudicated Claims – U.S. Database.
Prescriptions for vaginal forms (creams, rings, and inserts) rose from 27 per 1,000 women in 2006 to 42 per 1,000 in 2011 but declined to 35 per 1,000 by 2017, the investigators reported in Menopause.
For women aged 50-54 years, use of vaginal rings and inserts was steady for 2 years and then dropped every year after 2009, with prevalence lower in 2017 than in 2006. Vaginal ring/insert use increased for the first 2 years among those aged 55-59 years and for the first 5 years for those aged 60-64 years, but then each group started a fairly rapid and ongoing decline that had 2017 levels below those in 2006. Among women aged 65 years and older, however, prevalence of ring/insert use rose for most of the study period, and the declines left prevalences for 2015 above those for 2006, Dr. Weissfeld and his associates wrote.
The data source couldn’t provide reasons for use of vaginal rings or inserts, but the researchers noted that it’s possible that use for vasomotor symptoms “predominated in younger (aged 50-59 years) women closer in age to the onset of menopause. We presume that use for [vulvar and vaginal atrophy] predominated in women 60-65 years of age and older, women who are more distant in age from onset of menopause.”
Trends for use of transdermal patches also varied by age group but with smaller levels of difference. Use among women aged 50-54 years and 55-59 years fluctuated but showed no overall change. Those aged 60-64 years had a gradual decline over the study period, those aged 70-74 years had an initial increase in 2007 and then a decline, and those aged 75 years or older had an increase that lasted until 2011 before use started to fall, they wrote.
SOURCE: Weissfeld JL et al. Menopause. 2018;25(6):611-14.
FROM MENOPAUSE
Diabetic foot ulcer healing is predictable by WIfI stage scores
Diabetic foot ulcer healing is predictable with the Wound, Ischemia, and foot Infection (WIfI) classification system when used alone or with multivariable risk-adjustment analysis, according to a study published in the Journal of Vascular Surgery.
The research was conducted by Caitlin W. Hicks, MD, of Johns Hopkins University, Baltimore, and her colleagues as a retrospective study using prospective database information from enrolled type 1 and type 2 medication-dependent diabetic patients presenting to the multidisciplinary diabetic limb preservation service at Johns Hopkins Hospital from June 2012 to July 2017. The cohort of 310 patients with diabetic foot ulcer (DFU) in the study had a median age of 59 years and was composed of 60.3% men, with 60.0% of patients being black.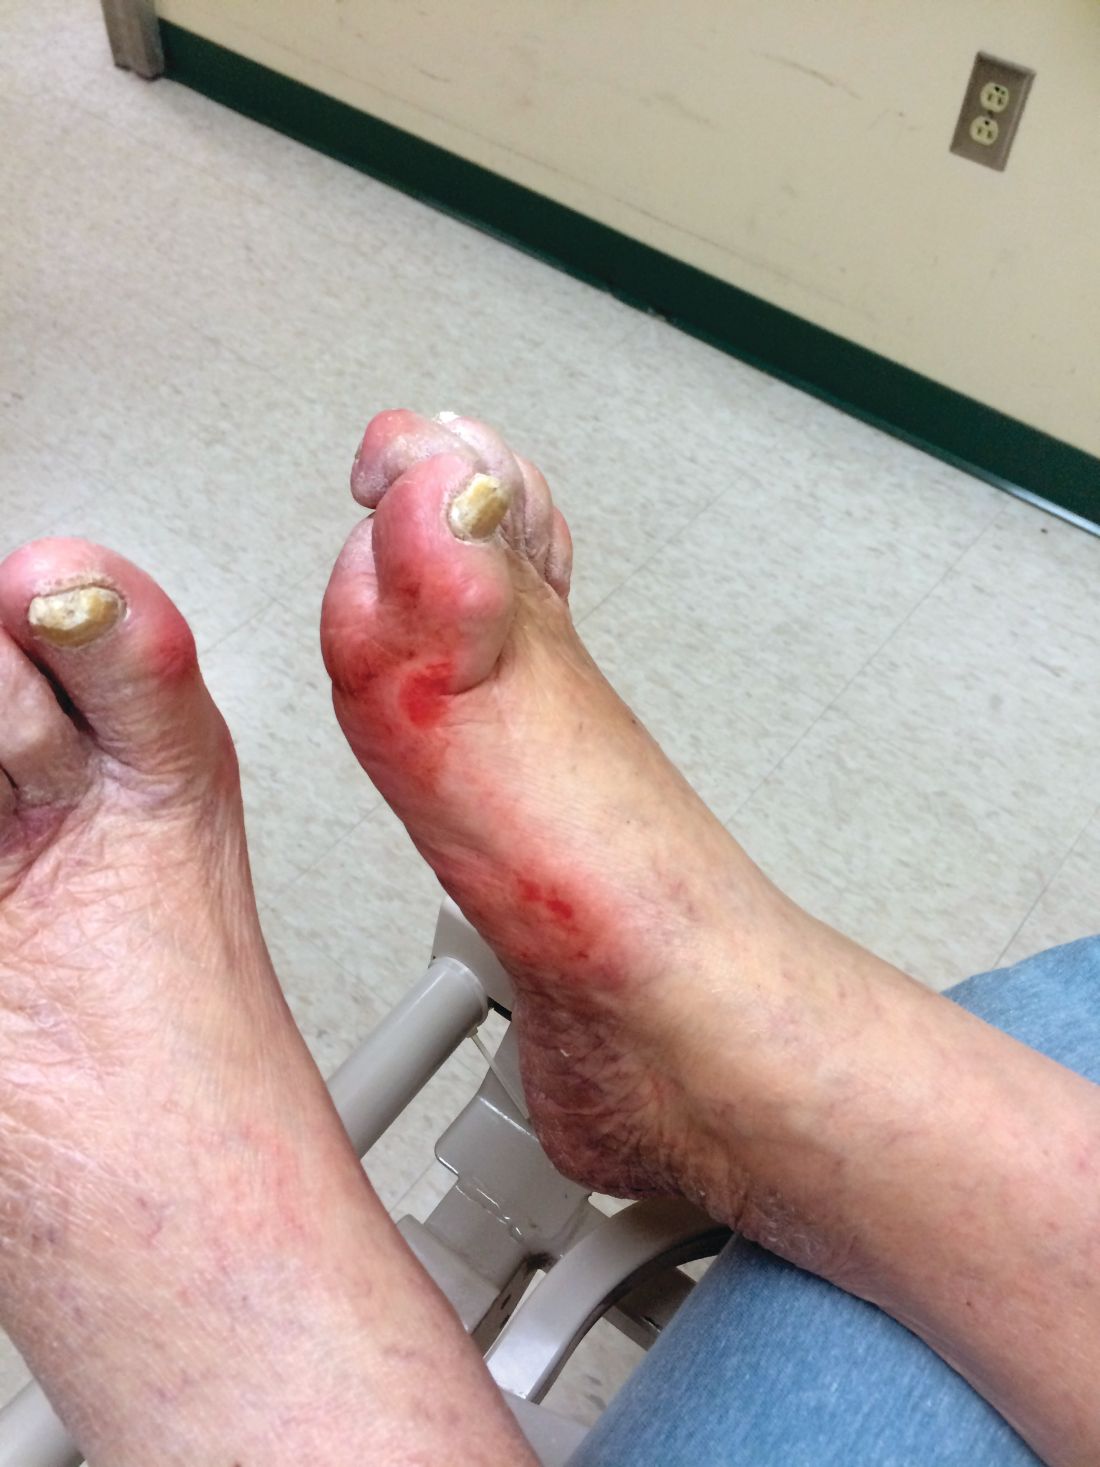
Infectious disease, plastic surgery, and orthopedic foot and ankle consultations were provided as needed. Individuals with evidence of peripheral artery disease (PAD) were provided lower extremity revascularization as determined to be appropriate by the primary vascular surgeon.
The 709 presented DFUs were assessed by x-ray imaging and follow-up MRI as needed. Wounds were debrided to clean margins and antibiotic treatments were administered as appropriate. At each visit the primary team assessed and assigned each wound a WIfI classified stage of 1-4 according to the calculation based on previously accepted Society of Vascular Surgery definitions, with PAD considered separately in final multivariable model analysis.
The association between WIfI stage and wound characteristics and healing was tested by univariable analysis. Multivariable Cox proportional hazards models that included sociodemographic, comorbidity, and wound characteristics were subsequently created to test WIfI stage as an independent predictor for wound healing after adjusting for those variables. Differences between models were related to wound location.
Most of the treated wounds occurred on toes, with the least common wound location being the leg/ankle. Of the 709 treated wounds, 32.4% (n = 230) were WIfI stage 1, 19.9% (n = 141) were stage 2, 25.2% (n = 179) were stage 3, and 22.4% (n = 329) were stage 4.
Differences between the stages included larger increases in mean wound area size, wound depth, and mean time from wound onset to initial assessment as WIfI stages increased from 1 to 4.
Healed wounds were defined as “maintained complete epithelialization with the restoration of sustained functional and anatomic continuity for 6 weeks after complete healing.”
The researchers found that wound healing time significantly increased with increasing WIfI stage, with a mean wound healing time of 96.9 days for WIfI stage 1 wounds, increasing to 195.1 days for WIfI stage 4 wounds (P less than .001). The authors found a likelihood of 94.1% for stage 1 wounds to be healed at 1 year, decreasing to a low of 67.4% for stage 4 wounds (P less than .001).
In univariable and risk-adjusting multivariable analysis, WIfI stage had an independent negative association with wound healing. With inclusion of risk adjustment, the probability of wound healing at 1 year was significantly lowered for stage 4 wounds, compared with stage 1 wounds (hazard ratio, 0.44). The three most prominent independently associated factors associated with poorer wound healing results include concomitant PAD (HR, 0.73), increasing wound area (HR, 0.99 per 1 cm2 area increase), and longer time from wound onset to initial assessment (HR, 0.97 per month). The strongest predictors for poor wound healing were increasing wound area (z score, –3.14), WIfI stage 3 (z score, –3.11), and WIfI stage 4 (z score, –5.40).
In this expanded study of previous work, the authors stated that they were the first to provide validating evidence for use of the WIfI classification system in giving “wound healing prognoses regardless of patient risk factors, comorbidities, and wound location.” Their findings also demonstrated that this classification system has broader applications than its original purpose to provide prognostic information and risk expectations for major amputation for patients presenting with foot wounds, Dr. Hicks and her colleagues concluded.
The authors reported no conflicts of interest.
SOURCE: Hicks CW et al. J Vasc Surg. 2018 Apr 2. doi: 10.1016/j.jvs.2017.12.079.
Diabetic foot ulcer healing is predictable with the Wound, Ischemia, and foot Infection (WIfI) classification system when used alone or with multivariable risk-adjustment analysis, according to a study published in the Journal of Vascular Surgery.
The research was conducted by Caitlin W. Hicks, MD, of Johns Hopkins University, Baltimore, and her colleagues as a retrospective study using prospective database information from enrolled type 1 and type 2 medication-dependent diabetic patients presenting to the multidisciplinary diabetic limb preservation service at Johns Hopkins Hospital from June 2012 to July 2017. The cohort of 310 patients with diabetic foot ulcer (DFU) in the study had a median age of 59 years and was composed of 60.3% men, with 60.0% of patients being black.
Infectious disease, plastic surgery, and orthopedic foot and ankle consultations were provided as needed. Individuals with evidence of peripheral artery disease (PAD) were provided lower extremity revascularization as determined to be appropriate by the primary vascular surgeon.
The 709 presented DFUs were assessed by x-ray imaging and follow-up MRI as needed. Wounds were debrided to clean margins and antibiotic treatments were administered as appropriate. At each visit the primary team assessed and assigned each wound a WIfI classified stage of 1-4 according to the calculation based on previously accepted Society of Vascular Surgery definitions, with PAD considered separately in final multivariable model analysis.
The association between WIfI stage and wound characteristics and healing was tested by univariable analysis. Multivariable Cox proportional hazards models that included sociodemographic, comorbidity, and wound characteristics were subsequently created to test WIfI stage as an independent predictor for wound healing after adjusting for those variables. Differences between models were related to wound location.
Most of the treated wounds occurred on toes, with the least common wound location being the leg/ankle. Of the 709 treated wounds, 32.4% (n = 230) were WIfI stage 1, 19.9% (n = 141) were stage 2, 25.2% (n = 179) were stage 3, and 22.4% (n = 329) were stage 4.
Differences between the stages included larger increases in mean wound area size, wound depth, and mean time from wound onset to initial assessment as WIfI stages increased from 1 to 4.
Healed wounds were defined as “maintained complete epithelialization with the restoration of sustained functional and anatomic continuity for 6 weeks after complete healing.”
The researchers found that wound healing time significantly increased with increasing WIfI stage, with a mean wound healing time of 96.9 days for WIfI stage 1 wounds, increasing to 195.1 days for WIfI stage 4 wounds (P less than .001). The authors found a likelihood of 94.1% for stage 1 wounds to be healed at 1 year, decreasing to a low of 67.4% for stage 4 wounds (P less than .001).
In univariable and risk-adjusting multivariable analysis, WIfI stage had an independent negative association with wound healing. With inclusion of risk adjustment, the probability of wound healing at 1 year was significantly lowered for stage 4 wounds, compared with stage 1 wounds (hazard ratio, 0.44). The three most prominent independently associated factors associated with poorer wound healing results include concomitant PAD (HR, 0.73), increasing wound area (HR, 0.99 per 1 cm2 area increase), and longer time from wound onset to initial assessment (HR, 0.97 per month). The strongest predictors for poor wound healing were increasing wound area (z score, –3.14), WIfI stage 3 (z score, –3.11), and WIfI stage 4 (z score, –5.40).
In this expanded study of previous work, the authors stated that they were the first to provide validating evidence for use of the WIfI classification system in giving “wound healing prognoses regardless of patient risk factors, comorbidities, and wound location.” Their findings also demonstrated that this classification system has broader applications than its original purpose to provide prognostic information and risk expectations for major amputation for patients presenting with foot wounds, Dr. Hicks and her colleagues concluded.
The authors reported no conflicts of interest.
SOURCE: Hicks CW et al. J Vasc Surg. 2018 Apr 2. doi: 10.1016/j.jvs.2017.12.079.
Diabetic foot ulcer healing is predictable with the Wound, Ischemia, and foot Infection (WIfI) classification system when used alone or with multivariable risk-adjustment analysis, according to a study published in the Journal of Vascular Surgery.
The research was conducted by Caitlin W. Hicks, MD, of Johns Hopkins University, Baltimore, and her colleagues as a retrospective study using prospective database information from enrolled type 1 and type 2 medication-dependent diabetic patients presenting to the multidisciplinary diabetic limb preservation service at Johns Hopkins Hospital from June 2012 to July 2017. The cohort of 310 patients with diabetic foot ulcer (DFU) in the study had a median age of 59 years and was composed of 60.3% men, with 60.0% of patients being black.
Infectious disease, plastic surgery, and orthopedic foot and ankle consultations were provided as needed. Individuals with evidence of peripheral artery disease (PAD) were provided lower extremity revascularization as determined to be appropriate by the primary vascular surgeon.
The 709 presented DFUs were assessed by x-ray imaging and follow-up MRI as needed. Wounds were debrided to clean margins and antibiotic treatments were administered as appropriate. At each visit the primary team assessed and assigned each wound a WIfI classified stage of 1-4 according to the calculation based on previously accepted Society of Vascular Surgery definitions, with PAD considered separately in final multivariable model analysis.
The association between WIfI stage and wound characteristics and healing was tested by univariable analysis. Multivariable Cox proportional hazards models that included sociodemographic, comorbidity, and wound characteristics were subsequently created to test WIfI stage as an independent predictor for wound healing after adjusting for those variables. Differences between models were related to wound location.
Most of the treated wounds occurred on toes, with the least common wound location being the leg/ankle. Of the 709 treated wounds, 32.4% (n = 230) were WIfI stage 1, 19.9% (n = 141) were stage 2, 25.2% (n = 179) were stage 3, and 22.4% (n = 329) were stage 4.
Differences between the stages included larger increases in mean wound area size, wound depth, and mean time from wound onset to initial assessment as WIfI stages increased from 1 to 4.
Healed wounds were defined as “maintained complete epithelialization with the restoration of sustained functional and anatomic continuity for 6 weeks after complete healing.”
The researchers found that wound healing time significantly increased with increasing WIfI stage, with a mean wound healing time of 96.9 days for WIfI stage 1 wounds, increasing to 195.1 days for WIfI stage 4 wounds (P less than .001). The authors found a likelihood of 94.1% for stage 1 wounds to be healed at 1 year, decreasing to a low of 67.4% for stage 4 wounds (P less than .001).
In univariable and risk-adjusting multivariable analysis, WIfI stage had an independent negative association with wound healing. With inclusion of risk adjustment, the probability of wound healing at 1 year was significantly lowered for stage 4 wounds, compared with stage 1 wounds (hazard ratio, 0.44). The three most prominent independently associated factors associated with poorer wound healing results include concomitant PAD (HR, 0.73), increasing wound area (HR, 0.99 per 1 cm2 area increase), and longer time from wound onset to initial assessment (HR, 0.97 per month). The strongest predictors for poor wound healing were increasing wound area (z score, –3.14), WIfI stage 3 (z score, –3.11), and WIfI stage 4 (z score, –5.40).
In this expanded study of previous work, the authors stated that they were the first to provide validating evidence for use of the WIfI classification system in giving “wound healing prognoses regardless of patient risk factors, comorbidities, and wound location.” Their findings also demonstrated that this classification system has broader applications than its original purpose to provide prognostic information and risk expectations for major amputation for patients presenting with foot wounds, Dr. Hicks and her colleagues concluded.
The authors reported no conflicts of interest.
SOURCE: Hicks CW et al. J Vasc Surg. 2018 Apr 2. doi: 10.1016/j.jvs.2017.12.079.
FROM THE JOURNAL OF VASCULAR SURGERY
Key clinical point: The Wound, Ischemia, and foot Infection (WIfI) classification of diabetic foot ulcers provides a predictable primary outcome for wound healing at 1 year.
Major finding: Wound healing probability at 1 year was 94.1% for WIfI stage 1 wounds and 67.4% for stage 4 wounds.
Study details: A single-location, multidisciplinary-setting, retrospective study of 709 WIfI stage 1-4 wounds presented by 310 diabetic foot ulcer patients.
Disclosures: The authors reported no conflicts of interest.
Source: Hicks CW et al. J Vasc Surg. 2018 Apr 2. doi: 10.1016/j.jvs.2017.12.079.
Are we using the right metrics to measure cesarean rates?
St. Joseph Hospital in Orange, California, like most institutions performing deliveries in 2016, started releasing metrics internally before subsequently releasing them to the public. Data for the first 9 months of 2016 were released. As I am often an outlier, I was gratified to see that I ranked 1st in the vaginal birth after cesarean delivery (VBAC) rate at 36.8% and 4th at 15.9% for my cesarean delivery (CD) rate in the low-risk nulliparous term singleton vertex (NTSV) population.
I have been an avid proponent of VBAC since 1984 when one of the fathers of modern obstetric care, Edward J. Quilligan, MD, presented the benefits and safety of VBAC at our institution.
Experiences that may alter a reported rate
I list here a few circumstances of a CD on maternal request:
- A primagravida with a 10-cm nonphysiologic, nonmalignant ovarian cyst at term elects a primary CD with ovarian cystectomy.
- A woman who is concerned about pelvic organ prolapse and urinary incontinence later in life requests a CD. After all, normal babies do not weigh 5 and 6 lb anymore.
- An elderly primagravida with an in vitro fertilization pregnancy requests a CD.
Should these experiences adversely affect a physician’s statistics? Personally, I don’t think so. Is the morbidity and mortality from a CD really all that much higher than a normal spontaneous vaginal delivery (NSVD)? Granted, the cost is more. But are we really helping all our patients by insisting on a NSVD? Thousands of people have medically indicated and elective surgery in the United States each day.
Of course, these data points depend on the denominator (the number of deliveries attributed to each ObGyn). Those with a contradictory opinion will say that this evens out over time. I dispute that claim. This might be closer to being true for the ObGyn with the highest number, say, 134 in the NTSV denominator versus someone with a low number, such as 4. For VBAC, the denominator range at our institution was 1 to 115 cases.
Rethinking my position
Two recent cases have caused me to rethink my position on using VBAC and CD rates to evaluate ObGyns.
Uterine rupture
A 31-year-old G3P1 woman at 39 6/7 weeks’ gestation was admitted in early labor for a VBAC. She had undergone a CD with her first baby because of fetal intolerance to labor. Her prenatal course was complicated by white-coat hypertension, but I monitored her blood pressure at home and it had been normal. She took aspirin 81 mg during the pregnancy. The fetus was not reactive to a nonstress test on the day of admission.
That evening, amniotomy results showed clear fluid. I placed an intrauterine pressure catheter. The patient’s labor progressed well during the night, she received an epidural anesthetic, and labor was augmented with intravenous oxytocin. She progressed to complete dilation. I was notified of severe, prolonged, variable fetal heart-rate decelerations.
The Laborist who evaluated the patient recommended an emergency CD. I came immediately to Labor and Delivery and performed a CD with delivery of a 7 lb 4 oz infant whose Apgars were 2, 5, and 8 at 1, 5, and 10 minutes, respectively. Arterial cord blood gas tests revealed: pH, 6.94; pCO2, 95 mm Hg; pO2, 19.9 mm Hg; HCO3, 19.9 mmol/L; and base excess (BE), –14.4 mmol/L. Venous cord blood gas tests revealed: pH, 7.25; pCO2, 45 mm Hg; pO2, 35 mm Hg; HCO3, 19.2 mmol/L; BE, −8.0 mmol/L. The cord blood gases revealed that the baby was becoming compromised, but was delivered in time to avoid complications.
After advocating and performing many successful VBACs for 33 years, this was my first uterine rupture.
The uterus had ruptured in the lower segment from the mid-portion extending inferolaterally on the right side and was hemorrhaging. I successfully repaired the rupture. Maternal quantitative blood loss was 1,020 mL.
The baby initially was apneic and was limp. He required continuous positive airway pressure (CPAP) and positive pressure ventilation in the operating room. The baby was transferred to the neonatal intensive care unit (NICU), recovered well, and was discharged home with the mother on the 4th day of life.
Commentary: Why should this necessary, emergency CD count against me on my core measure rate? Although I have advocated for VBACs for 33 years, perhaps they aren’t so safe. After this experience, I do not ever want to have to deal with a ruptured uterus, a compromised baby, and maternal hemorrhage again.
Read Dr. Kanofsky’s solution to using this metric.
Depressed baby
A 24-year-old G1P0 woman at 39 weeks’ gestation was admitted for induction of labor because of mild pregnancy-induced hypertension. Her prenatal course was complicated by Class A1 gestational diabetes mellitus, which was untreated due to compliance issues, Group B streptococcus, and cholelithiasis. Clinically, I suspected she was going to have a large (9 lb) baby. An ultrasound to estimate fetal weight at 37 2/7 weeks’ gestation showed the fetus at 3.937 kg. I was concerned, but, because the mother was 5 ft 5 in tall and weighed 282 lbs, I thought it was reasonable for her to attempt a NSVD.
Induction and labor progressed normally. Her labor curve decelerated at an anterior lip, but subsequently stage 2 progressed normally and lasted 2 hrs. Her temperature was elevated in stage 2 to 100.00F. The fetal heart rate tracings were reassuring.
Immediately after delivery of the fetal vertex, a turtleneck sign was seen and shoulder dystocia occurred. A Wood’s maneuver was performed in both directions, the nurse applied suprapubic pressure, and the infant was delivered. A loose nuchal cord x2 was reduced. The infant was apneic and had no tone. She was taken to the warmer, given oxygen, suctioned, and stimulated until the NICU team arrived. Her Apgar scores were 2, 5, and 9 at 1, 5, and 10 minutes, respectively. The birthweight was 9 lb 0 oz.
A depressed baby of this magnitude was certainly not expected from the FHR tracing or the shoulder dystocia. Venous cord gas evaluation revealed pH, 7.16; pCO2, 57 mm Hg; pO2, 17 mm Hg; HCO3, 20.2 mmol/L; and BE, –19.1 mmol/L.
The baby recovered quickly in the labor and delivery recovery room, went to the NICU on CPAP, subsequently transitioned to room air, and was discharged on the 4th day of life with her mother.
Commentary: Did I do the best I could for this mother and baby? In hindsight, I should have performed a CD because of my concerns for a large fetus. The “retrospectoscope” always makes cases more clear! Note that, if I had performed an elective CD for fetal macrosomia, it would have counted against me on this metric. Prior to labor, if I thought an elective CD was the right approach to this patient, and was providing the best care I could for this mother and fetus, why should it count against me?
Is there a solution?
With my newfound concerns, it is my opinion that VBAC and CD/NTSV rates may not be the correct things to use as quality metric measures without some additional qualifying information.
Better metrics of quality and safety that might be more helpful to measure include:
- Prophylactic oxytocin after delivery of the baby’s anterior shoulder
- Since “6 is the new 4,” in order to increase the NTSV rate, we could measure1:
- patients admitted before active labor
- patients receiving an epidural before active labor.
- Since NTSV is a goal, measure the number of patients in an advanced stage of labor whose labor pattern has become dysfunctional, no interventions are taken, and who subsequently deliver by primary CD.
Share your thoughts! Send your Letter to the Editor to [email protected]. Please include your name and the city and state in which you practice.
- Committee on Obstetric Practice, American College of Obstetricians and Gynecologists. Committee Opinion No. 687: Approaches to limit intervention during labor and birth. Obstet Gynecol. 2017;129(2):e20–e28.

Dr. Kanofsky is in private ObGyn practice in Orange, California. He is a member of the Perinatal Safety Work Group and the Perinatal Collaborative Committee at St. Joseph Hospital, Orange, and is Chairman, Division of Gynecology, Department of Surgery, at CHOC Children’s Hospital of Orange County.
The author reports that he is a consultant to the St. Joseph Hospital Clinical Information Systems Project.
Dr. Kanofsky is in private ObGyn practice in Orange, California. He is a member of the Perinatal Safety Work Group and the Perinatal Collaborative Committee at St. Joseph Hospital, Orange, and is Chairman, Division of Gynecology, Department of Surgery, at CHOC Children’s Hospital of Orange County.
The author reports that he is a consultant to the St. Joseph Hospital Clinical Information Systems Project.
Dr. Kanofsky is in private ObGyn practice in Orange, California. He is a member of the Perinatal Safety Work Group and the Perinatal Collaborative Committee at St. Joseph Hospital, Orange, and is Chairman, Division of Gynecology, Department of Surgery, at CHOC Children’s Hospital of Orange County.
The author reports that he is a consultant to the St. Joseph Hospital Clinical Information Systems Project.
St. Joseph Hospital in Orange, California, like most institutions performing deliveries in 2016, started releasing metrics internally before subsequently releasing them to the public. Data for the first 9 months of 2016 were released. As I am often an outlier, I was gratified to see that I ranked 1st in the vaginal birth after cesarean delivery (VBAC) rate at 36.8% and 4th at 15.9% for my cesarean delivery (CD) rate in the low-risk nulliparous term singleton vertex (NTSV) population.
I have been an avid proponent of VBAC since 1984 when one of the fathers of modern obstetric care, Edward J. Quilligan, MD, presented the benefits and safety of VBAC at our institution.
Experiences that may alter a reported rate
I list here a few circumstances of a CD on maternal request:
- A primagravida with a 10-cm nonphysiologic, nonmalignant ovarian cyst at term elects a primary CD with ovarian cystectomy.
- A woman who is concerned about pelvic organ prolapse and urinary incontinence later in life requests a CD. After all, normal babies do not weigh 5 and 6 lb anymore.
- An elderly primagravida with an in vitro fertilization pregnancy requests a CD.
Should these experiences adversely affect a physician’s statistics? Personally, I don’t think so. Is the morbidity and mortality from a CD really all that much higher than a normal spontaneous vaginal delivery (NSVD)? Granted, the cost is more. But are we really helping all our patients by insisting on a NSVD? Thousands of people have medically indicated and elective surgery in the United States each day.
Of course, these data points depend on the denominator (the number of deliveries attributed to each ObGyn). Those with a contradictory opinion will say that this evens out over time. I dispute that claim. This might be closer to being true for the ObGyn with the highest number, say, 134 in the NTSV denominator versus someone with a low number, such as 4. For VBAC, the denominator range at our institution was 1 to 115 cases.
Rethinking my position
Two recent cases have caused me to rethink my position on using VBAC and CD rates to evaluate ObGyns.
Uterine rupture
A 31-year-old G3P1 woman at 39 6/7 weeks’ gestation was admitted in early labor for a VBAC. She had undergone a CD with her first baby because of fetal intolerance to labor. Her prenatal course was complicated by white-coat hypertension, but I monitored her blood pressure at home and it had been normal. She took aspirin 81 mg during the pregnancy. The fetus was not reactive to a nonstress test on the day of admission.
That evening, amniotomy results showed clear fluid. I placed an intrauterine pressure catheter. The patient’s labor progressed well during the night, she received an epidural anesthetic, and labor was augmented with intravenous oxytocin. She progressed to complete dilation. I was notified of severe, prolonged, variable fetal heart-rate decelerations.
The Laborist who evaluated the patient recommended an emergency CD. I came immediately to Labor and Delivery and performed a CD with delivery of a 7 lb 4 oz infant whose Apgars were 2, 5, and 8 at 1, 5, and 10 minutes, respectively. Arterial cord blood gas tests revealed: pH, 6.94; pCO2, 95 mm Hg; pO2, 19.9 mm Hg; HCO3, 19.9 mmol/L; and base excess (BE), –14.4 mmol/L. Venous cord blood gas tests revealed: pH, 7.25; pCO2, 45 mm Hg; pO2, 35 mm Hg; HCO3, 19.2 mmol/L; BE, −8.0 mmol/L. The cord blood gases revealed that the baby was becoming compromised, but was delivered in time to avoid complications.
After advocating and performing many successful VBACs for 33 years, this was my first uterine rupture.
The uterus had ruptured in the lower segment from the mid-portion extending inferolaterally on the right side and was hemorrhaging. I successfully repaired the rupture. Maternal quantitative blood loss was 1,020 mL.
The baby initially was apneic and was limp. He required continuous positive airway pressure (CPAP) and positive pressure ventilation in the operating room. The baby was transferred to the neonatal intensive care unit (NICU), recovered well, and was discharged home with the mother on the 4th day of life.
Commentary: Why should this necessary, emergency CD count against me on my core measure rate? Although I have advocated for VBACs for 33 years, perhaps they aren’t so safe. After this experience, I do not ever want to have to deal with a ruptured uterus, a compromised baby, and maternal hemorrhage again.
Read Dr. Kanofsky’s solution to using this metric.
Depressed baby
A 24-year-old G1P0 woman at 39 weeks’ gestation was admitted for induction of labor because of mild pregnancy-induced hypertension. Her prenatal course was complicated by Class A1 gestational diabetes mellitus, which was untreated due to compliance issues, Group B streptococcus, and cholelithiasis. Clinically, I suspected she was going to have a large (9 lb) baby. An ultrasound to estimate fetal weight at 37 2/7 weeks’ gestation showed the fetus at 3.937 kg. I was concerned, but, because the mother was 5 ft 5 in tall and weighed 282 lbs, I thought it was reasonable for her to attempt a NSVD.
Induction and labor progressed normally. Her labor curve decelerated at an anterior lip, but subsequently stage 2 progressed normally and lasted 2 hrs. Her temperature was elevated in stage 2 to 100.00F. The fetal heart rate tracings were reassuring.
Immediately after delivery of the fetal vertex, a turtleneck sign was seen and shoulder dystocia occurred. A Wood’s maneuver was performed in both directions, the nurse applied suprapubic pressure, and the infant was delivered. A loose nuchal cord x2 was reduced. The infant was apneic and had no tone. She was taken to the warmer, given oxygen, suctioned, and stimulated until the NICU team arrived. Her Apgar scores were 2, 5, and 9 at 1, 5, and 10 minutes, respectively. The birthweight was 9 lb 0 oz.
A depressed baby of this magnitude was certainly not expected from the FHR tracing or the shoulder dystocia. Venous cord gas evaluation revealed pH, 7.16; pCO2, 57 mm Hg; pO2, 17 mm Hg; HCO3, 20.2 mmol/L; and BE, –19.1 mmol/L.
The baby recovered quickly in the labor and delivery recovery room, went to the NICU on CPAP, subsequently transitioned to room air, and was discharged on the 4th day of life with her mother.
Commentary: Did I do the best I could for this mother and baby? In hindsight, I should have performed a CD because of my concerns for a large fetus. The “retrospectoscope” always makes cases more clear! Note that, if I had performed an elective CD for fetal macrosomia, it would have counted against me on this metric. Prior to labor, if I thought an elective CD was the right approach to this patient, and was providing the best care I could for this mother and fetus, why should it count against me?
Is there a solution?
With my newfound concerns, it is my opinion that VBAC and CD/NTSV rates may not be the correct things to use as quality metric measures without some additional qualifying information.
Better metrics of quality and safety that might be more helpful to measure include:
- Prophylactic oxytocin after delivery of the baby’s anterior shoulder
- Since “6 is the new 4,” in order to increase the NTSV rate, we could measure1:
- patients admitted before active labor
- patients receiving an epidural before active labor.
- Since NTSV is a goal, measure the number of patients in an advanced stage of labor whose labor pattern has become dysfunctional, no interventions are taken, and who subsequently deliver by primary CD.
Share your thoughts! Send your Letter to the Editor to [email protected]. Please include your name and the city and state in which you practice.
St. Joseph Hospital in Orange, California, like most institutions performing deliveries in 2016, started releasing metrics internally before subsequently releasing them to the public. Data for the first 9 months of 2016 were released. As I am often an outlier, I was gratified to see that I ranked 1st in the vaginal birth after cesarean delivery (VBAC) rate at 36.8% and 4th at 15.9% for my cesarean delivery (CD) rate in the low-risk nulliparous term singleton vertex (NTSV) population.
I have been an avid proponent of VBAC since 1984 when one of the fathers of modern obstetric care, Edward J. Quilligan, MD, presented the benefits and safety of VBAC at our institution.
Experiences that may alter a reported rate
I list here a few circumstances of a CD on maternal request:
- A primagravida with a 10-cm nonphysiologic, nonmalignant ovarian cyst at term elects a primary CD with ovarian cystectomy.
- A woman who is concerned about pelvic organ prolapse and urinary incontinence later in life requests a CD. After all, normal babies do not weigh 5 and 6 lb anymore.
- An elderly primagravida with an in vitro fertilization pregnancy requests a CD.
Should these experiences adversely affect a physician’s statistics? Personally, I don’t think so. Is the morbidity and mortality from a CD really all that much higher than a normal spontaneous vaginal delivery (NSVD)? Granted, the cost is more. But are we really helping all our patients by insisting on a NSVD? Thousands of people have medically indicated and elective surgery in the United States each day.
Of course, these data points depend on the denominator (the number of deliveries attributed to each ObGyn). Those with a contradictory opinion will say that this evens out over time. I dispute that claim. This might be closer to being true for the ObGyn with the highest number, say, 134 in the NTSV denominator versus someone with a low number, such as 4. For VBAC, the denominator range at our institution was 1 to 115 cases.
Rethinking my position
Two recent cases have caused me to rethink my position on using VBAC and CD rates to evaluate ObGyns.
Uterine rupture
A 31-year-old G3P1 woman at 39 6/7 weeks’ gestation was admitted in early labor for a VBAC. She had undergone a CD with her first baby because of fetal intolerance to labor. Her prenatal course was complicated by white-coat hypertension, but I monitored her blood pressure at home and it had been normal. She took aspirin 81 mg during the pregnancy. The fetus was not reactive to a nonstress test on the day of admission.
That evening, amniotomy results showed clear fluid. I placed an intrauterine pressure catheter. The patient’s labor progressed well during the night, she received an epidural anesthetic, and labor was augmented with intravenous oxytocin. She progressed to complete dilation. I was notified of severe, prolonged, variable fetal heart-rate decelerations.
The Laborist who evaluated the patient recommended an emergency CD. I came immediately to Labor and Delivery and performed a CD with delivery of a 7 lb 4 oz infant whose Apgars were 2, 5, and 8 at 1, 5, and 10 minutes, respectively. Arterial cord blood gas tests revealed: pH, 6.94; pCO2, 95 mm Hg; pO2, 19.9 mm Hg; HCO3, 19.9 mmol/L; and base excess (BE), –14.4 mmol/L. Venous cord blood gas tests revealed: pH, 7.25; pCO2, 45 mm Hg; pO2, 35 mm Hg; HCO3, 19.2 mmol/L; BE, −8.0 mmol/L. The cord blood gases revealed that the baby was becoming compromised, but was delivered in time to avoid complications.
After advocating and performing many successful VBACs for 33 years, this was my first uterine rupture.
The uterus had ruptured in the lower segment from the mid-portion extending inferolaterally on the right side and was hemorrhaging. I successfully repaired the rupture. Maternal quantitative blood loss was 1,020 mL.
The baby initially was apneic and was limp. He required continuous positive airway pressure (CPAP) and positive pressure ventilation in the operating room. The baby was transferred to the neonatal intensive care unit (NICU), recovered well, and was discharged home with the mother on the 4th day of life.
Commentary: Why should this necessary, emergency CD count against me on my core measure rate? Although I have advocated for VBACs for 33 years, perhaps they aren’t so safe. After this experience, I do not ever want to have to deal with a ruptured uterus, a compromised baby, and maternal hemorrhage again.
Read Dr. Kanofsky’s solution to using this metric.
Depressed baby
A 24-year-old G1P0 woman at 39 weeks’ gestation was admitted for induction of labor because of mild pregnancy-induced hypertension. Her prenatal course was complicated by Class A1 gestational diabetes mellitus, which was untreated due to compliance issues, Group B streptococcus, and cholelithiasis. Clinically, I suspected she was going to have a large (9 lb) baby. An ultrasound to estimate fetal weight at 37 2/7 weeks’ gestation showed the fetus at 3.937 kg. I was concerned, but, because the mother was 5 ft 5 in tall and weighed 282 lbs, I thought it was reasonable for her to attempt a NSVD.
Induction and labor progressed normally. Her labor curve decelerated at an anterior lip, but subsequently stage 2 progressed normally and lasted 2 hrs. Her temperature was elevated in stage 2 to 100.00F. The fetal heart rate tracings were reassuring.
Immediately after delivery of the fetal vertex, a turtleneck sign was seen and shoulder dystocia occurred. A Wood’s maneuver was performed in both directions, the nurse applied suprapubic pressure, and the infant was delivered. A loose nuchal cord x2 was reduced. The infant was apneic and had no tone. She was taken to the warmer, given oxygen, suctioned, and stimulated until the NICU team arrived. Her Apgar scores were 2, 5, and 9 at 1, 5, and 10 minutes, respectively. The birthweight was 9 lb 0 oz.
A depressed baby of this magnitude was certainly not expected from the FHR tracing or the shoulder dystocia. Venous cord gas evaluation revealed pH, 7.16; pCO2, 57 mm Hg; pO2, 17 mm Hg; HCO3, 20.2 mmol/L; and BE, –19.1 mmol/L.
The baby recovered quickly in the labor and delivery recovery room, went to the NICU on CPAP, subsequently transitioned to room air, and was discharged on the 4th day of life with her mother.
Commentary: Did I do the best I could for this mother and baby? In hindsight, I should have performed a CD because of my concerns for a large fetus. The “retrospectoscope” always makes cases more clear! Note that, if I had performed an elective CD for fetal macrosomia, it would have counted against me on this metric. Prior to labor, if I thought an elective CD was the right approach to this patient, and was providing the best care I could for this mother and fetus, why should it count against me?
Is there a solution?
With my newfound concerns, it is my opinion that VBAC and CD/NTSV rates may not be the correct things to use as quality metric measures without some additional qualifying information.
Better metrics of quality and safety that might be more helpful to measure include:
- Prophylactic oxytocin after delivery of the baby’s anterior shoulder
- Since “6 is the new 4,” in order to increase the NTSV rate, we could measure1:
- patients admitted before active labor
- patients receiving an epidural before active labor.
- Since NTSV is a goal, measure the number of patients in an advanced stage of labor whose labor pattern has become dysfunctional, no interventions are taken, and who subsequently deliver by primary CD.
Share your thoughts! Send your Letter to the Editor to [email protected]. Please include your name and the city and state in which you practice.
- Committee on Obstetric Practice, American College of Obstetricians and Gynecologists. Committee Opinion No. 687: Approaches to limit intervention during labor and birth. Obstet Gynecol. 2017;129(2):e20–e28.
- Committee on Obstetric Practice, American College of Obstetricians and Gynecologists. Committee Opinion No. 687: Approaches to limit intervention during labor and birth. Obstet Gynecol. 2017;129(2):e20–e28.
Three Clinical Studies Demonstrating Safety and Efficacy of Treatment for Diarrhea-Predominant Irritable Bowel Syndrome (IBS-D) in Adults
In this supplement to Internal Medicine News, Christine Frissora, MD provides an overview of the burdens that patients with IBS-D experience. Three clinical efficacy and safety studies surrounding an FDA-approved treatment are also examined.
Topics include:
IBS-D diagnosis and treatment challenges
The role of microbial imbalance and altered gut microbiota
A treatment option for relief of IBS-D symptoms
XIFI.0273.USA.18
In this supplement to Internal Medicine News, Christine Frissora, MD provides an overview of the burdens that patients with IBS-D experience. Three clinical efficacy and safety studies surrounding an FDA-approved treatment are also examined.
Topics include:
IBS-D diagnosis and treatment challenges
The role of microbial imbalance and altered gut microbiota
A treatment option for relief of IBS-D symptoms
XIFI.0273.USA.18
In this supplement to Internal Medicine News, Christine Frissora, MD provides an overview of the burdens that patients with IBS-D experience. Three clinical efficacy and safety studies surrounding an FDA-approved treatment are also examined.
Topics include:
IBS-D diagnosis and treatment challenges
The role of microbial imbalance and altered gut microbiota
A treatment option for relief of IBS-D symptoms
XIFI.0273.USA.18

Relapsing scabies? Nails may hold a clue
cautioned Marie Chinazzo, MD, of Centre Hospitalier Régional et Universitaire Tours, France, and her associates.
Nails can harbor mites, representing a potential source for relapse, not only in children, but also in adults.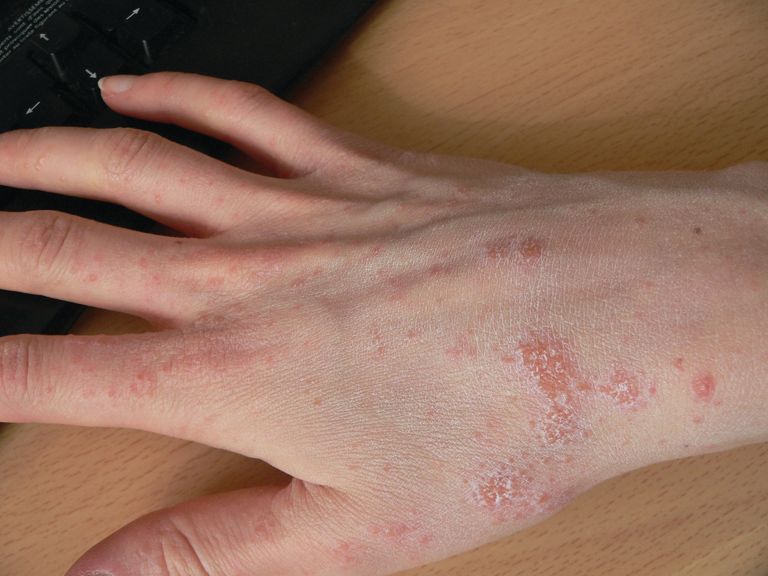
Few studies have addressed scabies on the nails, which is typically observed in immunocompromised adults with crusted scabies, but also rarely in healthy adults and children.
In an observational, multicenter, prospective study conducted between June 2015 and January 2017, 47 pediatric patients with common scabies, including 3 children under 2 years of age, presented with mites on the first toenail/thumbnail; two of them had already completed treatment and were experiencing relapse. All children with dermatologic diagnosis that was confirmed by visual inspection of “the delta sign” (presence of the mite seen as a triangle representing the head) using dermoscopy or by microscopic identification of Sarcoptes scabiei were included in the study. Dermatologists were required to complete a standardized questionnaire for each participant. Full body inspections and nail samplings also were done.
Clinical nail damage, consisting of hyperkeratosis, onycholysis, onychoschizia, and pachyonychia, appeared in 5 of the 47 patients (11%). No other cause of nail damage was determined in four of the cases, for which mites were not directly visualized, the researchers noted. The report was published in the Journal of Pediatrics.
Of the 47 confirmed cases, 26 were female; 23 were under 2 years of age; 20 were 2-12 years; and 4 were older than 12. Ten cases presented with significant medical history; none were classified as immunocompromised.
Fully 42 of the 47 children (89%) reported pruritus, and of these, 64% also had pruritus present in the family home; 60% of siblings and 45% of parents were affected.
None were diagnosed with crusted scabies. The mean delay from disease onset to diagnosis was 55 days. In 38% of cases, previous treatment for scabies had been rendered.
Treatments varied based on presentation. Ivermectin, esdepallethrin, and 40% urea were repeated after 10 days in at least one case. In another case, an entire family was treated once with topical 5% permethrin; once the child experienced relapse, oral ivermectin was employed. In the case of an 18-month-old girl with pruritus and skin lesions, topical corticosteroid was used for 10 days until such time that dermatoscopy revealed the “delta sign” and 5% topical permethrin was added.
The authors observed that nail scabies in the medical literature is more commonly seen in immunocompromised patients with crusted scabies and higher concentrations of parasites. They were able to locate only three other reports, all in adults, of nail scabies occurring with common scabies.
“Treatment of nail scabies is difficult and is not highly evidence based,” cautioned Dr. Chinazzo and her associates. The primary study limitations were the small patient population and that nail sampling was taken only from the first fingers and toes, which could mean that the number of mites present is actually underestimated, they added.
The authors had no relevant financial disclosures.
SOURCE: Chinazzo M et al. J Pediatr. 2018. doi: 10.1016/j.jpeds.2018.01.038.
cautioned Marie Chinazzo, MD, of Centre Hospitalier Régional et Universitaire Tours, France, and her associates.
Nails can harbor mites, representing a potential source for relapse, not only in children, but also in adults.
Few studies have addressed scabies on the nails, which is typically observed in immunocompromised adults with crusted scabies, but also rarely in healthy adults and children.
In an observational, multicenter, prospective study conducted between June 2015 and January 2017, 47 pediatric patients with common scabies, including 3 children under 2 years of age, presented with mites on the first toenail/thumbnail; two of them had already completed treatment and were experiencing relapse. All children with dermatologic diagnosis that was confirmed by visual inspection of “the delta sign” (presence of the mite seen as a triangle representing the head) using dermoscopy or by microscopic identification of Sarcoptes scabiei were included in the study. Dermatologists were required to complete a standardized questionnaire for each participant. Full body inspections and nail samplings also were done.
Clinical nail damage, consisting of hyperkeratosis, onycholysis, onychoschizia, and pachyonychia, appeared in 5 of the 47 patients (11%). No other cause of nail damage was determined in four of the cases, for which mites were not directly visualized, the researchers noted. The report was published in the Journal of Pediatrics.
Of the 47 confirmed cases, 26 were female; 23 were under 2 years of age; 20 were 2-12 years; and 4 were older than 12. Ten cases presented with significant medical history; none were classified as immunocompromised.
Fully 42 of the 47 children (89%) reported pruritus, and of these, 64% also had pruritus present in the family home; 60% of siblings and 45% of parents were affected.
None were diagnosed with crusted scabies. The mean delay from disease onset to diagnosis was 55 days. In 38% of cases, previous treatment for scabies had been rendered.
Treatments varied based on presentation. Ivermectin, esdepallethrin, and 40% urea were repeated after 10 days in at least one case. In another case, an entire family was treated once with topical 5% permethrin; once the child experienced relapse, oral ivermectin was employed. In the case of an 18-month-old girl with pruritus and skin lesions, topical corticosteroid was used for 10 days until such time that dermatoscopy revealed the “delta sign” and 5% topical permethrin was added.
The authors observed that nail scabies in the medical literature is more commonly seen in immunocompromised patients with crusted scabies and higher concentrations of parasites. They were able to locate only three other reports, all in adults, of nail scabies occurring with common scabies.
“Treatment of nail scabies is difficult and is not highly evidence based,” cautioned Dr. Chinazzo and her associates. The primary study limitations were the small patient population and that nail sampling was taken only from the first fingers and toes, which could mean that the number of mites present is actually underestimated, they added.
The authors had no relevant financial disclosures.
SOURCE: Chinazzo M et al. J Pediatr. 2018. doi: 10.1016/j.jpeds.2018.01.038.
cautioned Marie Chinazzo, MD, of Centre Hospitalier Régional et Universitaire Tours, France, and her associates.
Nails can harbor mites, representing a potential source for relapse, not only in children, but also in adults.
Few studies have addressed scabies on the nails, which is typically observed in immunocompromised adults with crusted scabies, but also rarely in healthy adults and children.
In an observational, multicenter, prospective study conducted between June 2015 and January 2017, 47 pediatric patients with common scabies, including 3 children under 2 years of age, presented with mites on the first toenail/thumbnail; two of them had already completed treatment and were experiencing relapse. All children with dermatologic diagnosis that was confirmed by visual inspection of “the delta sign” (presence of the mite seen as a triangle representing the head) using dermoscopy or by microscopic identification of Sarcoptes scabiei were included in the study. Dermatologists were required to complete a standardized questionnaire for each participant. Full body inspections and nail samplings also were done.
Clinical nail damage, consisting of hyperkeratosis, onycholysis, onychoschizia, and pachyonychia, appeared in 5 of the 47 patients (11%). No other cause of nail damage was determined in four of the cases, for which mites were not directly visualized, the researchers noted. The report was published in the Journal of Pediatrics.
Of the 47 confirmed cases, 26 were female; 23 were under 2 years of age; 20 were 2-12 years; and 4 were older than 12. Ten cases presented with significant medical history; none were classified as immunocompromised.
Fully 42 of the 47 children (89%) reported pruritus, and of these, 64% also had pruritus present in the family home; 60% of siblings and 45% of parents were affected.
None were diagnosed with crusted scabies. The mean delay from disease onset to diagnosis was 55 days. In 38% of cases, previous treatment for scabies had been rendered.
Treatments varied based on presentation. Ivermectin, esdepallethrin, and 40% urea were repeated after 10 days in at least one case. In another case, an entire family was treated once with topical 5% permethrin; once the child experienced relapse, oral ivermectin was employed. In the case of an 18-month-old girl with pruritus and skin lesions, topical corticosteroid was used for 10 days until such time that dermatoscopy revealed the “delta sign” and 5% topical permethrin was added.
The authors observed that nail scabies in the medical literature is more commonly seen in immunocompromised patients with crusted scabies and higher concentrations of parasites. They were able to locate only three other reports, all in adults, of nail scabies occurring with common scabies.
“Treatment of nail scabies is difficult and is not highly evidence based,” cautioned Dr. Chinazzo and her associates. The primary study limitations were the small patient population and that nail sampling was taken only from the first fingers and toes, which could mean that the number of mites present is actually underestimated, they added.
The authors had no relevant financial disclosures.
SOURCE: Chinazzo M et al. J Pediatr. 2018. doi: 10.1016/j.jpeds.2018.01.038.
FROM THE JOURNAL OF PEDIATRICS
Key clinical point: Pediatric relapse estimated as high as 66%.
Major finding: Nail scabies found in great toenail, not fingernails.
Study details: Observational multicenter prospective study of 47 pediatric patients with common scabies.
Disclosures: The authors had no relevant financial disclosures.
Source: Chinazzo M et al. J Pediatr. 2018. doi: 10.1016/j.jpeds.2018.01.038.
Additional training may be warranted for clinicians administering DTaP
Additional training may be needed for providers who administer DTaP vaccine to prevent errors in vaccination, but reported Pedro Moro, MD, MPH, of the Centers for Disease Control and Prevention’s National Center for Immunization and Respiratory Diseases and his associates in Pediatrics.
After Dr. Moro and his associates performed an automated analysis of all reports included in the Vaccine Adverse Event Reporting System (VAERS), which is coadministered by the CDC and the Food and Drug Administration, as well as a clinical review of reported deaths and a random sampling of serious reports in the database, they concluded that safety findings concerning DTaP were consistent with those from prelicensure trials and postlicensure studies.
DTaP vaccines, which included Infanrix, Daptacel, Pediarix, Kinrix, and Pentacel, were coadministered with one or more other vaccines in 43,984 (88%) of cases reported; of the reports included in the data mining, 5,627 (11%) were classified as serious, including 844 (2%) deaths. Of all reports received in the prelicensure clinical trials, injection site reactions and systemic reactions, such as fever and vomiting, were the most common reactions to DTaP vaccine.
In a 5% random sample of the 4,783 serious nondeath reports included in the study, 25% were neurologic, 23% gastrointestinal, and 20% were caused by general disorders and vaccine site conditions. Fully 80% of those flagged as neurologic were seizure related. In another 79%, for which intussusception was the most common gastrointestinal condition, all but two cases had rotavirus vaccine coadministered with DTaP. Altogether, there were 182 cases of anaphylaxis reported.
Serious events were characterized as death, life-threatening illness, hospitalization, lengthening of existing hospital stay, or permanent disability. In cases of death, reports that followed DTaP vaccine were manually reviewed by a physician, who evaluated autopsy report, death certificate, or medical records. The authors also included in their evaluation of records any reports of postvaccine anaphylaxis.
Of the 844 deaths, death certificates, autopsy reports, or medical records were obtained for 86%. Among these, sudden infant death syndrome (SIDS) was found to be the most frequent cause of death in 48%; of these, 62% were male infants, and 91% were infants under 6 months of age.
“It would not be uncommon to observe a coincidental close temporal relationship between vaccination and SIDS because this condition peaks at a time when children receive a relatively large number of recommended vaccinations,” said Dr. Moro and his associates. “There is a large body of evidence in which it is shown that vaccination is not causally associated with SIDS.”
The authors identified disproportional reporting for injection site reactions, as well as other events and conditions, to which they attribute, at least in part, administration of the wrong vaccine or formulation and administration at the wrong site. Such mistakes can be lessened or even prevented with provider education and training on appropriate recommendations and package insert specifications put forth by the CDC’s Advisory Committee on Immunization Practices, they advised.
While the authors praised VAERS for the wealth of timely data it has offered in detecting potential safety issues that may require further investigation, Dr. Moro cautioned that it is a passive surveillance system with limitations that warrant “careful interpretation of its findings.” Its purpose is to improve immunization programs.
Because it does not “meet the definition of research,” the work performed in this study was not subject to institutional review board evaluation and informed consent requirements, the authors added. VAERS generally is not able to assess whether vaccines are the direct cause of adverse events, primarily because of underreporting or overreporting, biased reporting, and inconsistency in quality and completeness of information reported. Because it does not tally number of vaccines administered, it is also unable to provide data needed to calculate incidence rates.
The authors had no relevant financial disclosures. The study was funded by the CDC and the FDA.
SOURCE: Moro P et al. Pediatrics. 2018. doi: 10.1542/peds.2017-4171.
The Vaccine Adverse Event Reporting System offers confirmation that DTaP vaccines are safe and have a reasonably low frequency of adverse events. Despite this, the U.S.-based resurgence of pertussis shortly after acellular vaccines were introduced legitimately raised concerns over the efficacy of DTaP, which is now known to have a shorter duration of protection than its predecessor, the diphtheria, tetanus toxoids, whole-cell pertussis vaccine. Consequently, older children, adolescents, and adults are left unprotected without periodic booster doses, Flor M. Muñoz, MD, wrote in an editorial accompanying the study by Moro et al.
The World Health Organization’s recommendation to countries that never made the switch to DTaP is to continue using the whole-cell vaccines “because of their consistent higher efficacy” points to “an imperative need to develop more immunogenic pertussis vaccines that are also safe,” she observed.
“Active research is ongoing for the development of novel vaccines, including live attenuated vaccines, whole-cell vaccines with reduced endotoxin content to be less reactogenic, outer membrane vesicles–based vaccines, and acellular vaccine formulations prepared with new adjuvants or additional and novel antigens.
“As we go back to the drawing board in the fight against Bordetella pertussis, much work is needed to learn more about this fascinating pathogen and its interactions with humans to improve our understanding of how immunity and long-lasting protection can be achieved, to engineer and produce novel vaccines, and to design and perform the clinical studies that will eventually lead to the control of pertussis disease and its global impact with safe and effective vaccines for all,” Dr. Muñoz added.
Dr. Muñoz is affiliated with the section of infectious diseases in the department of pediatrics at Baylor College of Medicine and Texas Children’s Hospital, both in Houston. Her comments here were summarized from her editorial accompanying the article by Moro et al (Pediatrics. 2018. doi: 10.1542/peds.2018-1036). Dr. Munoz said she had no relevant financial disclosures and received no external funding.
The Vaccine Adverse Event Reporting System offers confirmation that DTaP vaccines are safe and have a reasonably low frequency of adverse events. Despite this, the U.S.-based resurgence of pertussis shortly after acellular vaccines were introduced legitimately raised concerns over the efficacy of DTaP, which is now known to have a shorter duration of protection than its predecessor, the diphtheria, tetanus toxoids, whole-cell pertussis vaccine. Consequently, older children, adolescents, and adults are left unprotected without periodic booster doses, Flor M. Muñoz, MD, wrote in an editorial accompanying the study by Moro et al.
The World Health Organization’s recommendation to countries that never made the switch to DTaP is to continue using the whole-cell vaccines “because of their consistent higher efficacy” points to “an imperative need to develop more immunogenic pertussis vaccines that are also safe,” she observed.
“Active research is ongoing for the development of novel vaccines, including live attenuated vaccines, whole-cell vaccines with reduced endotoxin content to be less reactogenic, outer membrane vesicles–based vaccines, and acellular vaccine formulations prepared with new adjuvants or additional and novel antigens.
“As we go back to the drawing board in the fight against Bordetella pertussis, much work is needed to learn more about this fascinating pathogen and its interactions with humans to improve our understanding of how immunity and long-lasting protection can be achieved, to engineer and produce novel vaccines, and to design and perform the clinical studies that will eventually lead to the control of pertussis disease and its global impact with safe and effective vaccines for all,” Dr. Muñoz added.
Dr. Muñoz is affiliated with the section of infectious diseases in the department of pediatrics at Baylor College of Medicine and Texas Children’s Hospital, both in Houston. Her comments here were summarized from her editorial accompanying the article by Moro et al (Pediatrics. 2018. doi: 10.1542/peds.2018-1036). Dr. Munoz said she had no relevant financial disclosures and received no external funding.
The Vaccine Adverse Event Reporting System offers confirmation that DTaP vaccines are safe and have a reasonably low frequency of adverse events. Despite this, the U.S.-based resurgence of pertussis shortly after acellular vaccines were introduced legitimately raised concerns over the efficacy of DTaP, which is now known to have a shorter duration of protection than its predecessor, the diphtheria, tetanus toxoids, whole-cell pertussis vaccine. Consequently, older children, adolescents, and adults are left unprotected without periodic booster doses, Flor M. Muñoz, MD, wrote in an editorial accompanying the study by Moro et al.
The World Health Organization’s recommendation to countries that never made the switch to DTaP is to continue using the whole-cell vaccines “because of their consistent higher efficacy” points to “an imperative need to develop more immunogenic pertussis vaccines that are also safe,” she observed.
“Active research is ongoing for the development of novel vaccines, including live attenuated vaccines, whole-cell vaccines with reduced endotoxin content to be less reactogenic, outer membrane vesicles–based vaccines, and acellular vaccine formulations prepared with new adjuvants or additional and novel antigens.
“As we go back to the drawing board in the fight against Bordetella pertussis, much work is needed to learn more about this fascinating pathogen and its interactions with humans to improve our understanding of how immunity and long-lasting protection can be achieved, to engineer and produce novel vaccines, and to design and perform the clinical studies that will eventually lead to the control of pertussis disease and its global impact with safe and effective vaccines for all,” Dr. Muñoz added.
Dr. Muñoz is affiliated with the section of infectious diseases in the department of pediatrics at Baylor College of Medicine and Texas Children’s Hospital, both in Houston. Her comments here were summarized from her editorial accompanying the article by Moro et al (Pediatrics. 2018. doi: 10.1542/peds.2018-1036). Dr. Munoz said she had no relevant financial disclosures and received no external funding.
Additional training may be needed for providers who administer DTaP vaccine to prevent errors in vaccination, but reported Pedro Moro, MD, MPH, of the Centers for Disease Control and Prevention’s National Center for Immunization and Respiratory Diseases and his associates in Pediatrics.
After Dr. Moro and his associates performed an automated analysis of all reports included in the Vaccine Adverse Event Reporting System (VAERS), which is coadministered by the CDC and the Food and Drug Administration, as well as a clinical review of reported deaths and a random sampling of serious reports in the database, they concluded that safety findings concerning DTaP were consistent with those from prelicensure trials and postlicensure studies.
DTaP vaccines, which included Infanrix, Daptacel, Pediarix, Kinrix, and Pentacel, were coadministered with one or more other vaccines in 43,984 (88%) of cases reported; of the reports included in the data mining, 5,627 (11%) were classified as serious, including 844 (2%) deaths. Of all reports received in the prelicensure clinical trials, injection site reactions and systemic reactions, such as fever and vomiting, were the most common reactions to DTaP vaccine.
In a 5% random sample of the 4,783 serious nondeath reports included in the study, 25% were neurologic, 23% gastrointestinal, and 20% were caused by general disorders and vaccine site conditions. Fully 80% of those flagged as neurologic were seizure related. In another 79%, for which intussusception was the most common gastrointestinal condition, all but two cases had rotavirus vaccine coadministered with DTaP. Altogether, there were 182 cases of anaphylaxis reported.
Serious events were characterized as death, life-threatening illness, hospitalization, lengthening of existing hospital stay, or permanent disability. In cases of death, reports that followed DTaP vaccine were manually reviewed by a physician, who evaluated autopsy report, death certificate, or medical records. The authors also included in their evaluation of records any reports of postvaccine anaphylaxis.
Of the 844 deaths, death certificates, autopsy reports, or medical records were obtained for 86%. Among these, sudden infant death syndrome (SIDS) was found to be the most frequent cause of death in 48%; of these, 62% were male infants, and 91% were infants under 6 months of age.
“It would not be uncommon to observe a coincidental close temporal relationship between vaccination and SIDS because this condition peaks at a time when children receive a relatively large number of recommended vaccinations,” said Dr. Moro and his associates. “There is a large body of evidence in which it is shown that vaccination is not causally associated with SIDS.”
The authors identified disproportional reporting for injection site reactions, as well as other events and conditions, to which they attribute, at least in part, administration of the wrong vaccine or formulation and administration at the wrong site. Such mistakes can be lessened or even prevented with provider education and training on appropriate recommendations and package insert specifications put forth by the CDC’s Advisory Committee on Immunization Practices, they advised.
While the authors praised VAERS for the wealth of timely data it has offered in detecting potential safety issues that may require further investigation, Dr. Moro cautioned that it is a passive surveillance system with limitations that warrant “careful interpretation of its findings.” Its purpose is to improve immunization programs.
Because it does not “meet the definition of research,” the work performed in this study was not subject to institutional review board evaluation and informed consent requirements, the authors added. VAERS generally is not able to assess whether vaccines are the direct cause of adverse events, primarily because of underreporting or overreporting, biased reporting, and inconsistency in quality and completeness of information reported. Because it does not tally number of vaccines administered, it is also unable to provide data needed to calculate incidence rates.
The authors had no relevant financial disclosures. The study was funded by the CDC and the FDA.
SOURCE: Moro P et al. Pediatrics. 2018. doi: 10.1542/peds.2017-4171.
Additional training may be needed for providers who administer DTaP vaccine to prevent errors in vaccination, but reported Pedro Moro, MD, MPH, of the Centers for Disease Control and Prevention’s National Center for Immunization and Respiratory Diseases and his associates in Pediatrics.
After Dr. Moro and his associates performed an automated analysis of all reports included in the Vaccine Adverse Event Reporting System (VAERS), which is coadministered by the CDC and the Food and Drug Administration, as well as a clinical review of reported deaths and a random sampling of serious reports in the database, they concluded that safety findings concerning DTaP were consistent with those from prelicensure trials and postlicensure studies.
DTaP vaccines, which included Infanrix, Daptacel, Pediarix, Kinrix, and Pentacel, were coadministered with one or more other vaccines in 43,984 (88%) of cases reported; of the reports included in the data mining, 5,627 (11%) were classified as serious, including 844 (2%) deaths. Of all reports received in the prelicensure clinical trials, injection site reactions and systemic reactions, such as fever and vomiting, were the most common reactions to DTaP vaccine.
In a 5% random sample of the 4,783 serious nondeath reports included in the study, 25% were neurologic, 23% gastrointestinal, and 20% were caused by general disorders and vaccine site conditions. Fully 80% of those flagged as neurologic were seizure related. In another 79%, for which intussusception was the most common gastrointestinal condition, all but two cases had rotavirus vaccine coadministered with DTaP. Altogether, there were 182 cases of anaphylaxis reported.
Serious events were characterized as death, life-threatening illness, hospitalization, lengthening of existing hospital stay, or permanent disability. In cases of death, reports that followed DTaP vaccine were manually reviewed by a physician, who evaluated autopsy report, death certificate, or medical records. The authors also included in their evaluation of records any reports of postvaccine anaphylaxis.
Of the 844 deaths, death certificates, autopsy reports, or medical records were obtained for 86%. Among these, sudden infant death syndrome (SIDS) was found to be the most frequent cause of death in 48%; of these, 62% were male infants, and 91% were infants under 6 months of age.
“It would not be uncommon to observe a coincidental close temporal relationship between vaccination and SIDS because this condition peaks at a time when children receive a relatively large number of recommended vaccinations,” said Dr. Moro and his associates. “There is a large body of evidence in which it is shown that vaccination is not causally associated with SIDS.”
The authors identified disproportional reporting for injection site reactions, as well as other events and conditions, to which they attribute, at least in part, administration of the wrong vaccine or formulation and administration at the wrong site. Such mistakes can be lessened or even prevented with provider education and training on appropriate recommendations and package insert specifications put forth by the CDC’s Advisory Committee on Immunization Practices, they advised.
While the authors praised VAERS for the wealth of timely data it has offered in detecting potential safety issues that may require further investigation, Dr. Moro cautioned that it is a passive surveillance system with limitations that warrant “careful interpretation of its findings.” Its purpose is to improve immunization programs.
Because it does not “meet the definition of research,” the work performed in this study was not subject to institutional review board evaluation and informed consent requirements, the authors added. VAERS generally is not able to assess whether vaccines are the direct cause of adverse events, primarily because of underreporting or overreporting, biased reporting, and inconsistency in quality and completeness of information reported. Because it does not tally number of vaccines administered, it is also unable to provide data needed to calculate incidence rates.
The authors had no relevant financial disclosures. The study was funded by the CDC and the FDA.
SOURCE: Moro P et al. Pediatrics. 2018. doi: 10.1542/peds.2017-4171.
FROM PEDIATRICS
Key clinical point: No new or unexpected safety issues were found with DTaP.
Major finding: Nearly 90% of adverse events reported were not considered serious.
Study details: Large-scale data mining and records review from the Vaccine Adverse Event Reporting System.
Disclosures: The authors had no relevant financial disclosures. The study was funded by the Centers for Disease Control and Prevention and the Food and Drug Administration.
Source: Moro P et al. Pediatrics. 2018. doi: 10.1542/peds.2017-4171.
Shoulder Arthroplasty in Patients with Rheumatoid Arthritis: A Population-Based Study Examining Utilization, Adverse Events, Length of Stay, and Cost
ABSTRACT
It has been suggested that the utilization of joint arthroplasty in patients with rheumatoid arthritis (RA) is decreasing; however, this observation is largely based upon evidence pertaining to lower-extremity joint arthroplasty. It remains unknown if these observed trends also hold true for shoulder arthroplasty. The purpose of this study is to utilize a nationally representative population database in the US to identify trends in the utilization of shoulder arthroplasty among patients with RA. Secondarily, we sought to determine the rate of early adverse events, length of stay, and hospitalization costs associated with RA patients undergoing shoulder arthroplasty and to compare these outcomes to those of patients without a diagnosis of RA undergoing shoulder arthroplasty. Using a large population database in the US, we determined the annual rates of shoulder arthroplasty (overall and individual) in RA patients between 2002 and 2011. Early adverse events, length of stay, and hospitalization costs were determined and compared with those of non-RA patients undergoing shoulder arthroplasty. Overall, we identified 332,593 patients who underwent shoulder arthroplasty between 2002 and 2011, of whom 17,883 patients (5.4%) had a diagnosis of RA. Over the study period, there was a significant increase in the utilization of shoulder arthroplasty in RA patients, particularly total shoulder arthroplasty. Over the same period, there was a significant increase in the number of RA patients who underwent shoulder arthroplasty with a diagnosis of rotator cuff disease. There were no significant differences in adverse events or mean hospitalization costs between RA and non-RA patients. Non-RA patients had a significantly shorter length of stay; however, the difference did not appear to be clinically significant. In conclusion, the utilization of shoulder arthroplasty in patients with RA significantly increased from 2002 to 2011, which may partly reflect a trend toward management of rotator cuff disease with arthroplasty rather than repair.
Continue to: It has been suggested...
It has been suggested that the utilization of total joint arthroplasty (TJA) in patients with rheumatoid arthritis (RA) is decreasing over time;1 however, this observation is largely based upon evidence pertaining to lower extremity TJA.2 It remains unknown if these observed trends also hold true for shoulder arthroplasty, whereby the utilization of shoulder arthroplasty in RA patients is not limited to the management of end-stage inflammatory arthropathy. In this study, we used a nationally representative population database in the US to identify trends in the utilization of shoulder arthroplasty among patients with RA. As a secondary objective, we sought to determine the rate of early adverse events, length of stay, and hospitalization costs associated with RA patients undergoing shoulder arthroplasty and compare these outcomes to those of patients without a diagnosis of RA undergoing shoulder arthroplasty. We hypothesize that the utilization of shoulder arthroplasty in RA patients would be decreasing, but adverse events, length of stay, and hospitalization costs would not differ between patients with and without RA undergoing shoulder arthroplasty.
METHODS
We conducted a retrospective cohort study using the Healthcare Cost and Utilization Project (HCUP) Nationwide Inpatient Sample (NIS) from 2002 to 2011.3 The NIS comprises a 20% stratified sample of all hospital discharges in the US. The NIS includes information about patient characteristics (age, sex, insurance status, and medical comorbidities) and hospitalization outcomes (adverse events, costs, and length of stay). The NIS allows identification of hospitalizations according to procedures and diagnoses using International Classification of Diseases, Ninth Revision, Clinical Modification (ICD-9-CM) codes. Given the anonymity of this study, it was exempt from Institutional Review Board ethics approval.
Hospitalizations were selected for the study based on ICD-9-CM procedural codes for hemiarthroplasty (81.81), anatomic total shoulder arthroplasty (TSA) (81.80), and reverse TSA (81.88). These patients were then stratified by an ICD-9-CM diagnosis of RA (714.X). We also utilized ICD-9-CM diagnosis codes to determine the presence of rotator cuff pathology at the time of shoulder arthroplasty (726.13, 727.61, 840.4) and to exclude patients with a history of trauma (812.X, 716.11, 733.8X). In a separate analysis, all patients in the NIS database with an ICD-9-CM diagnosis of RA were identified for each calendar year of the study, and a national estimate of RA patients was generated annually to assess overall and individual utilization rates of shoulder arthroplasty in this population (the national estimate served as the denominator).
Preoperative patient data withdrawn from the NIS included age, sex, insurance status, and medical comorbidities. An Elixhauser Comorbidity Index (ECI) was generated for each patient based on the presence of 29 comorbid conditions. The ECI was chosen because of its capacity to accurately predict mortality and represent the patient burden of comorbidities in similar administrative database studies.4-6
Early adverse events were also chosen based on ICD-9-CM diagnosis codes (Appendix A), and included the following: death, acute kidney injury, cardiac arrest, thromboembolic event, myocardial infarction, peripheral nerve injury, pneumonia, sepsis, stroke, surgical site infection, urinary tract infection, and wound dehiscence. The overall adverse event rate was defined as the occurrence of ≥1 of the above adverse events in a patient.
Appendix A. ICD-9-CM Codes Corresponding to Postoperative Adverse Events
Event | ICD-9-CM |
Acute kidney injury | 584.5-584.9 |
Cardiac arrest | 427.41, 427.5 |
Thromboembolic event | 453.2-453.4, 453.82-453.86, 415.1 |
Myocardial Infarction | 410.00-410.92 |
Peripheral nerve injury | 953.0-953.9 954.0-954.9, 955.0-955.9, 956.0-956.9 |
Pneumonia | 480.0-480.9, 481, 482.0-482.9, 483.0-483.8, 484.1-484.8, 485, 486 |
Sepsis | 038.0-038.9, 112.5, 785.52, 995.91, 995.92 |
Stroke | 430, 432, 433.01-434.91, 997.02 |
Surgical site infection | 998.51, 998.59, 996.67 |
Urinary tract infection | 599 |
Wound dehiscence | 998.30-998.33 |
Abbreviation: ICD-9-CM, International Classification of Diseases, Ninth Revision, Clinical Modification
Length of stay and total hospital charges were available for each patient. Length of stay represents the number of calendar days a patient stayed in the hospital. All hospital charges were converted to hospitalization costs using the HCUP Cost-to-Charge Ratio Files. All hospitalization costs were adjusted for inflation using the US Bureau of Labor statistics yearly inflation calculator to represent charges in the year 2011, which was the final and most recent year in this study.
Continue to: Statistical analysis...
STATISTICAL ANALYSIS
Statistical analyses were conducted using Stata version 13.1 (StataCorp, LP). All analyses took into account the complex survey design of the NIS. Discharge weights, strata, and cluster variables were included to correctly estimate variance and to produce national estimates from the stratified sample. Pearson’s chi-squared test was used to compare age, sex, ECI, and insurance status between RA and non-RA patients undergoing shoulder arthroplasty.
Bivariate and multivariate logistic regressions were subsequently used to compare the rates of adverse events between RA and non-RA patients undergoing shoulder arthroplasty (non-RA cases were used as the reference). Multivariate linear regressions were used to compare hospital length of stay and hospitalization costs between RA and non-RA patients undergoing shoulder arthroplasty. The multivariate regressions were adjusted for baseline differences in age, sex, ECI, and insurance status. Cochran-Armitage tests for trend were used to assess trends over time. All tests were 2-tailed, and the statistical difference was established at a 2-sided α level of 0.05 (P < .05).
RESULTS
Overall, we identified 332,593 patients who underwent shoulder arthroplasty in the US between 2002 and 2011, of which 17,883 patients (5.4%) had a diagnosis of RA. In comparison with non-RA patients undergoing shoulder arthroplasty, patients with RA at the time of shoulder arthroplasty were significantly younger (65.2 ± 12.5 years vs 68.4 ± 11.0 years, P < .001), included a significantly greater proportion of female patients (76.7% vs 53.8%, P < .001), and included a significantly higher proportion of patients with Medicaid insurance (3.6% vs 2.3%, P < .001). There were no significant differences in the mean ECI between patients with and without a diagnosis of RA (Table 1). As depicted in Table 1, there were significant differences in the utilization of specific shoulder arthroplasty types between patients with and without RA, whereby a significantly greater proportion of RA patients underwent hemiarthroplasty (HA) (31.6% vs 29.3%, P = .002) and reverse TSA (7.7% vs 6.6%, P = .002), whereas a significantly greater proportion of non-RA patients underwent anatomic SA (64.0% vs 60.8%, P = .002).
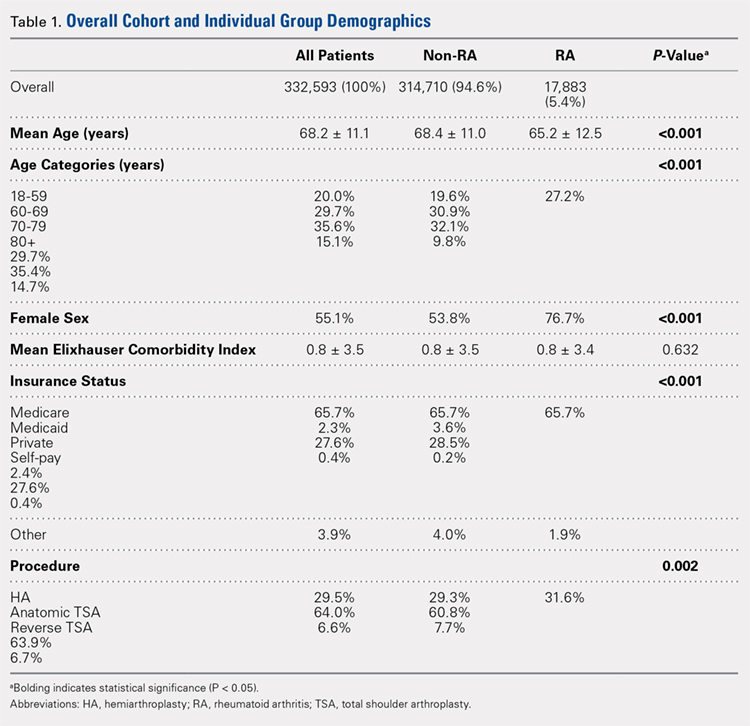
Over the study period from 2002 to 2011, there was a significant increase in the overall utilization of shoulder arthroplasty in RA patients, as indicated by both the absolute number and the proportion of patients with a diagnosis of RA (P < .001) (Table 2, Figure). More specifically, 0.39% of RA patients underwent shoulder arthroplasty in 2002, as compared with 0.58% of RA patients in 2011 (P < .001) (Table 2). With respect to specific arthroplasty types, there was an exponential rise in the utilization of reverse TSA beginning in 2010 and a corresponding decrease in the rates of both HA and anatomic TSA (Table 2, Figure). In addition to changes in shoulder arthroplasty utilization over time among RA patients, we also observed a significant increase in the number of RA patients undergoing shoulder arthroplasty with a corresponding diagnosis of rotator cuff disease (9.7% in 2002 to 15.2% in 2011, P < .001).
Table 2. The Annual Utilization of Shoulder Arthroplasty Among Patients with a Diagnosis of Rheumatoid Arthritis.
Proportion of RA patients |
| ||||
Year | Overall Rate of Shoulder Arthroplastya | HA | Anatomic TSA | Reverse TSA | |
2002 | 0.39 | 0.23 | 0.16 | 0 | |
2003 | 0.37 | 0.19 | 0.18 | 0 | |
2004 | 0.46 | 0.25 | 0.21 | 0 | |
2005 | 0.46 | 0.21 | 0.25 | 0 | |
2006 | 0.47 | 0.20 | 0.27 | 0 | |
2007 | 0.55 | 0.22 | 0.33 | 0 | |
2008 | 0.47 | 0.17 | 0.30 | 0 | |
2009 | 0.50 | 0.15 | 0.35 | 0 | |
2010 | 0.58 | 0.15 | 0.37 | 0.06 | |
2011 | 0.58 | 0.12 | 0.23 | 0.23 | |
Absolute number of RA patients |
| ||||
2002 | 1295 | 768 | 527 | 0 | |
2003 | 1247 | 650 | 597 | 0 | |
2004 | 1667 | 906 | 761 | 0 | |
2005 | 1722 | 776 | 946 | 0 | |
2006 | 1847 | 794 | 1053 | 0 | |
2007 | 2249 | 910 | 1339 | 0 | |
2008 | 2194 | 799 | 1395 | 0 | |
2009 | 2407 | 724 | 1683 | 0 | |
2010 | 2869 | 722 | 1857 | 290 | |
2011 | 3193 | 649 | 1261 | 1283 | |
aRate determined as number of RA patients undergoing shoulder arthroplasty compared to the number of patients with an RA diagnosis in the stated calendar year.
Abbreviations: HA, hemiarthroplasty; RA, rheumatoid arthritis; TSA, total shoulder arthroplasty.
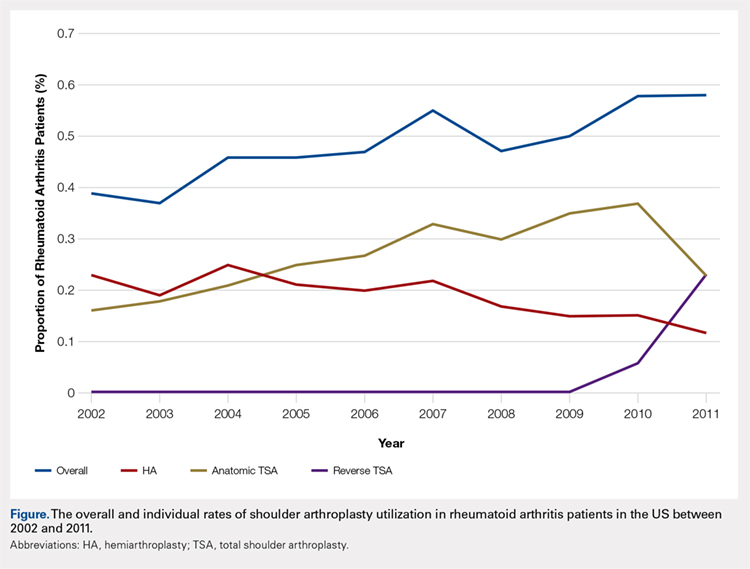
Continue to: Among patients with RA...
Among patients with RA undergoing shoulder arthroplasty, the overall rate of early adverse events was 3.12%, of which the most common early adverse events were urinary tract infections (1.8%), acute kidney injury (0.66%), and pneumonia (0.38%) (Table 3). As compared with patients without a diagnosis of RA undergoing shoulder arthroplasty, there were no significant differences in the overall and individual rates of early adverse events (Table 3).
Table 3. A Comparison of Early Adverse Events, Length of Stay, and Cost Between Patients With and Without Rheumatoid Arthritis (RA) Undergoing Shoulder Arthroplasty
Comparison of Early Adverse Event Rates |
| ||||
| Non-RA Patients | RA Patients | Multivariate Logistic Regression | ||
Odds Ratio | P-Value | ||||
Overall adverse event rate | 3.02% | 3.12% | 1.0 | 0.83 | |
Specific adverse event rate |
|
|
|
| |
Death | 0.08% | 0.05% | 0.9 | 0.91 | |
Acute kidney injury | 0.85% | 0.66% | 0.9 | 0.59 | |
Cardiac arrest | 0.05% | 0.05% | 1.3 | 0.70 | |
Thromboembolic event | 0.01% | 0.00% | - | - | |
Myocardial Infarction | 0.22% | 0.06% | 0.4 | 0.17 | |
Peripheral nerve injury | 0.08% | 0.11% | 1.5 | 0.45 | |
Pneumonia | 0.47% | 0.38% | 0.9 | 0.70 | |
Sepsis | 0.08% | 0.08% | 1.3 | 0.62 | |
Stroke | 0.07% | 0.05% | 0.9 | 0.93 | |
Surgical site infection | 0.09% | 0.13% | 1.4 | 0.52 | |
Urinary tract infection | 1.44% | 1.80% | 1.1 | 0.46 | |
Wound dehiscence | 0.01% | 0.05% | 3.6 | 0.09 | |
Comparison of Length of Stay and Hospital Charges | |||||
| Non-RA Patients (percent) | RA Patients (percent) | Multivariate Linear Regression | ||
Beta | P-Value | ||||
Length of staya | 2.3±2.0 | 2.4±1.6 | +0.1 | 0.002 | |
Hospitalization costb | 14,826±8,336 | 14,787±7,625 | +93 | 0.59 | |
aReported in days. bReported in 2011 US dollars, adjusted for inflation.
The mean length of stay following shoulder arthroplasty in RA patients was 2.4 ± 1.6 days, and the mean hospitalization cost was $14,787 ± $7625 (Table 3). As compared with non-RA patients undergoing shoulder arthroplasty, there were no significant differences in the mean hospitalization costs; however, non-RA patients had a significantly shorter length of stay by 0.1 days (P = .002) (Table 3).
DISCUSSION
In this study, we observed that the utilization of shoulder arthroplasty in patients with RA increased significantly in the decade from 2002 to 2011, largely related to a rise in TSA. Interestingly, we also observed a corresponding rise in the proportion of RA patients undergoing shoulder arthroplasty with a diagnosis of rotator cuff disease, and we believe that this may partly account for the recent increase in the use of the reverse TSA in this patient population. Additionally, we found shoulder arthroplasty in RA patients to be safe in the early postoperative period, with no significant increase in cost as compared with patients undergoing shoulder arthroplasty without a diagnosis of RA. Although we did observe a significant increase in length of stay among RA patients as compared with non-RA patients, the absolute difference was only 0.1 days, and given the aforementioned similarities in cost between RA and non-RA patients, we do not believe this difference to be clinically significant.
It has been theorized that the utilization of TJA in RA patients has been decreasing with improvements in medical management; however, this is largely based upon literature pertaining to lower extremity TJA.2 On the contrary, past research pertaining to the utilization of shoulder arthroplasty in RA patients has been highly variable. For instance, a Swedish study demonstrated a statistically significant decrease in admissions associated with RA-related upper limb surgery and a stable rate of shoulder arthroplasty between 1998 and 2004.7 Similarly, a Finnish study demonstrated that the annual incidence of primary joint arthroplasty in RA patients had declined from 1995 to 2010, with a greater decline for upper-limb arthroplasty as compared with lower-limb arthroplasty.8 Despite these European observations, Jain and colleagues9 reported an increasing rate of TSA among RA patients in the US between the years 1992 and 2005. In this study, we demonstrate a clear increase in the utilization of shoulder arthroplasty among RA patients between 2002 and 2011. What was most striking about our observation was that the rise in utilization appeared to be driven by an increase in TSA, whereas the utilization of HA decreased over time. This change in practice likely reflects several factors, including the multitude of studies that have demonstrated improved outcomes with anatomic TSA as compared with HA in RA patients.10-14
Perhaps the most interesting aspect of our data was the recent exponential rise in the utilization of the reverse TSA. Despite improved outcomes following TSA as compared with HA in RA patients, these outcomes all appear to be highly dependent upon the integrity of the rotator cuff.10 In fact, there is evidence that failure of the rotator cuff could be as high as 75% within 10 years of TSA in patients with RA,15 which ultimately could jeopardize the long-term durability of the TSA implant in this patient population.11 For this reason, interest in the reverse TSA for the RA patient population has increased since its introduction in the US in 2004;16 in fact, in RA patients with end-stage inflammatory arthropathy and a damaged rotator cuff, the reverse TSA has demonstrated excellent results.17-20 Based upon this evidence, it is not surprising that we found an exponential rise in the use of the reverse TSA since 2010, which corresponds to the introduction of an ICD-9 code for this implant.21 Prior to 2010, it is likely that many implanted reverse TSAs were coded as TSA, and for this reason, we believe that the observed rise in the utilization of TSA in RA patients prior to 2010 may have been partly fueled by an increase in the use of the reverse TSA. To further support this theory, there was a dramatic decrease in the use of anatomic TSA following 2010, and we believe this was related to increased awareness of the newly introduced reverse TSA code among surgeons.
Another consideration when examining the utilization of shoulder arthroplasty in RA patients is its versatility in managing different disease states, including rotator cuff disease. As has been documented in the literature, outcomes of rotator cuff repair in RA patients are discouraging.22 For this reason, it is reasonable for surgeons and patients with RA to consider alternatives to rotator cuff repair when nonoperative management has failed to provide adequate improvement in symptoms. One alternative may be shoulder arthroplasty, namely the reverse TSA. In this study, we observed a significant increase in the rate of diagnosis of rotator cuff disease among RA patients undergoing shoulder arthroplasty from 2002 to 2011 (9.7% in 2002 to 15.2% in 2011, P < .001), and it is our belief that the simultaneous increase in the diagnosis of rotator cuff disease and use of TSA is not coincidental. More specifically, there is likely an emerging trend among surgeons toward using the reverse TSA to manage rotator cuff tears in the RA population, rather than undertaking a rotator cuff repair that carries a high rate of failure. Going forward, there is a need to not only identify this trend more clearly but to also compare the outcomes between reverse TSA and rotator cuff repair in the management of rotator cuff tears in RA patients.
Continue to: In this study, we observed...
In this study, we observed that RA patients undergoing shoulder arthroplasty were significantly younger than non-RA patients undergoing shoulder arthroplasty. At first, this observation seems to counter recent literature suggesting that the age of patients with inflammatory arthropathy undergoing TJA is increasing over time;1 however, looking more closely at the data, it becomes clearer that the mean age we report is actually a relative increase as compared with past clinical studies pertaining to RA patients undergoing shoulder arthroplasty (mean ages of 47 years,23 55 years,24 60 years,10 and 62 years25). On the other hand, the continued existence of an age gap between RA and non-RA patients undergoing shoulder arthroplasty may be the result of several possible phenomena. First, this may reflect issues with patient access to and coverage of expensive biologic antirheumatic medication that would otherwise mitigate disease progression. For instance, the out-of-pocket expense for biologic medication through Medicaid and Medicare is substantial,26 which has direct implications on over two-thirds of our RA cohort. Second, it may be skewed by the proportion of RA patients who have previously been or continue to be poorly managed, enabling disease progression to end-stage arthropathy at a younger age. Ultimately, further investigation is needed to determine the reasons for this continued age disparity.
In comparing RA and non-RA patients undergoing shoulder arthroplasty, we did not find a significant difference in the overall nor the individual rates of early adverse events. This finding appears to be unique, as similar studies pertaining to total knee arthroplasty (TKA) demonstrated a significantly higher incidence of postoperative pneumonia and bleeding requiring transfusion among RA patients as compared with non-RA patients.27 In patients with RA being treated with biologic medication and undergoing shoulder arthroplasty, the frequent concern in the postoperative period is the integrity of the wound and the potential for infection.28 In this study, we did not find a significant difference in the rate of early infection, and although the difference in the rate of early wound dehiscence approached significance, it did not meet the threshold of 0.05 (P = .09). This finding is in keeping with the aforementioned NIS study pertaining to TKA, and we believe that it likely reflects the short duration of follow-up for patients in both studies. Given the nature of the database we utilized, we were only privy to complications that arose during the inpatient hospital stay, and it is likely that the clear majority of patients who develop a postoperative infection or wound dehiscence do so in the postoperative setting following discharge. A second concern regarding postoperative wound complications is the management of biologic medication in the perioperative period, which we cannot determine using this database. Despite all these limitations specific to this database, a past systematic review of reverse TSA in RA patients found a low rate of deep infection after reverse TSA in RA patients (3.3%),17 which was not higher than that after shoulder arthroplasty performed in non-RA patients.
A final demonstration from this study is that the hospital length of stay was significantly longer for RA patients than non-RA patients undergoing shoulder arthroplasty; however, given that the difference was only 0.1 days, and there was no significant difference in hospitalization cost, we are inclined to believe that statistical significance may not translate into clinical significance in this scenario. Ultimately, we do believe that length of stay is an important consideration in the current healthcare system, and given our finding that shoulder arthroplasty in the RA patient is safe in the early postoperative period, that a prolonged postoperative hospitalization is not warranted on the sole basis of a patient’s history of RA.
As with all studies using data from a search of an administrative database, such as the NIS database, this study has limitations. First, this type of research is limited by the reliability of both diagnosis and procedural coding. Although the NIS database has demonstrated high reliability,3 it is still possible that events may have been miscoded. Second, the tracking period for adverse events is limited to the inpatient hospital stay, which may be too short to detect certain postoperative complications. As such, the rates we report are likely underestimates of the true incidence of these complications, but this is true for both the RA and non-RA populations. Third, the comparisons we draw between RA and non-RA patients are limited to the scope of the NIS database and the available data; as such, we could not draw comparisons between preoperative disease stage, intraoperative findings, and postoperative course following hospital discharge. Lastly, our data are limited to a distinct period between 2002 and 2011 and may not reflect current practice. Ultimately, our findings may underestimate current trends in shoulder arthroplasty utilization among RA patients, particularly for the reverse TSA.
CONCLUSION
In this study, we found that the utilization of shoulder arthroplasty in patients with RA increased significantly from 2002 to 2011, largely related to a rise in the utilization of TSA. Similarly, we observed a rise in the proportion of RA patients undergoing shoulder arthroplasty with a corresponding diagnosis of rotator cuff disease, and we believe the increased utilization of shoulder arthroplasty among RA patients resulted from management of both end-stage inflammatory arthropathy and rotator cuff disease. Although we did not find a significant difference between RA and non-RA patients in the rates of early adverse events and overall hospitalization costs following shoulder arthroplasty, length of stay was significantly longer among RA patients; however, the absolute difference does not appear to be clinically significant.
- Mertelsmann-Voss C, Lyman S, Pan TJ, Goodman SM, Figgie MP, Mandl LA. US trends in rates of arthroplasty for inflammatory arthritis including rheumatoid arthritis, juvenile idiopathic arthritis, and spondyloarthritis. Arthritis Rheumatol. 2014;66(6):1432-1439. doi:10.1002/art.38384.
- Louie GH, Ward MM. Changes in the rates of joint surgery among patients with rheumatoid arthritis in California, 1983-2007. Ann Rheum Dis. 2010;69(5):868-871. doi:10.1136/ard.2009.112474.
- HCUP Nationwide Inpatient Sample (NIS) Healthcare Cost and Utilization Project (HCUP). Agency for Healthcare Research and Quality; 2002-2011.
- Elixhauser A, Steiner C, Harris DR, Coffey RM. Comorbidity measures for use with administrative data. Med Care. 1998;36(1):8-27. doi:10.1097/00005650-199801000-00004.
- Sharabiani MT, Aylin P, Bottle A. Systematic review of comorbidity indices for administrative data. Med Care. 2012;50(12):1109-1118. doi:10.1097/MLR.0b013e31825f64d0.
- van Walraven C, Austin PC, Jennings A, Quan H, Forster AJ. A modification of the Elixhauser comorbidity measures into a point system for hospital death using administrative data. Med Care. 2009;47(6):626-633. doi:10.1097/MLR.0b013e31819432e5.
- Weiss RJ, Ehlin A, Montgomery SM, Wick MC, Stark A, Wretenberg P. Decrease of RA-related orthopaedic surgery of the upper limbs between 1998 and 2004: data from 54,579 Swedish RA inpatients. Rheumatol Oxf. 2008 ;47(4):491-494. doi. 10.1093/rheumatology/ken009.
- Jämsen E, Virta LJ, Hakala M, Kauppi MJ, Malmivaara A, Lehto MU. The decline in joint replacement surgery in rheumatoid arthritis is associated with a concomitant increase in the intensity of anti-rheumatic therapy: a nationwide register-based study from 1995 through 2010. Acta Orthop. 2013;84(4):331-337. doi:10.3109/17453674.2013.810519.
- Jain A, Stein BE, Skolasky RL, Jones LC, Hungerford MW. Total joint arthroplasty in patients with rheumatoid arthritis: a United States experience from 1992 through 2005. J Arthroplasty. 2012;27(6):881-888. doi:10.1016/j.arth.2011.12.027.
- Barlow JD, Yuan BJ, Schleck CD, Harmsen WS, Cofield RH, Sperling JW. Shoulder arthroplasty for rheumatoid arthritis: 303 consecutive cases with minimum 5-year follow-up. J Shoulder Elbow Surg. 2014;23(6):791-799. doi:10.1016/j.jse.2013.09.016.
- Collins DN, Harryman DT, Wirth MA. Shoulder arthroplasty for the treatment of inflammatory arthritis. J Bone Joint Surg Am. 2004;86–A(11):2489-2496. doi:10.2106/00004623-200411000-00020.
- Rahme H, Mattsson P, Wikblad L, Larsson S. Cement and press-fit humeral stem fixation provides similar results in rheumatoid patients. Clin Orthop Relat Res. 2006;448:28-32. doi:10.1097/01.blo.0000224007.25636.85.
- Rozing PM, Nagels J, Rozing MP. Prognostic factors in arthroplasty in the rheumatoid shoulder. HSS J. 2011;7(1):29-36. doi:10.1007/s11420-010-9172-1.
- Sperling JW, Cofield RH, Schleck CD, Harmsen WS. Total shoulder arthroplasty versus hemiarthroplasty for rheumatoid arthritis of the shoulder: results of 303 consecutive cases. J Shoulder Elbow Surg. 2007;16(6):683-690. doi:10.1016/j.jse.2007.02.135.
- Khan A, Bunker TD, Kitson JB. Clinical and radiological follow-up of the Aequalis third-generation cemented total shoulder replacement: a minimum ten-year study. J Bone Joint Surg Br. 2009;91(12):1594-1600. doi:10.1302/0301-620X.91B12.22139.
- Guery J, Favard L, Sirveaux F, Oudet D, Mole D, Walch G. Reverse total shoulder arthroplasty: survivorship analysis of eighty replacements followed for five to ten years. J Bone Joint Surg Am. 2006;88(8):1742-1747. doi:10.2106/JBJS.E.00851.
- Gee ECA, Hanson EK, Saithna A. Reverse shoulder arthroplasty in rheumatoid arthritis: A systematic review. Open Orthop J. 2015;9:237-245. doi:10.2174/1874325001509010237.
- Holcomb JO, Hebert DJ, Mighell MA, et al. Reverse shoulder arthroplasty in patients with rheumatoid arthritis. J Shoulder Elbow Surg. 2010;19(7):1076-1084. doi:10.1016/j.jse.2009.11.049.
- Postacchini R, Carbone S, Canero G, Ripani M, Postacchini F. Reverse shoulder prosthesis in patients with rheumatoid arthritis: a systematic review. Int Orthop. 2016;40(5):965-973. doi:10.1007/s00264-015-2916-2.
- Rittmeister M, Kerschbaumer F. Grammont reverse total shoulder arthroplasty in patients with rheumatoid arthritis and nonreconstructible rotator cuff lesions. J Shoulder Elbow Surg. 2001;10(1):17-22. doi:10.1067/mse.2001.110515.
- American Medical Association. American Medical Association Web site. www.ama-assn.org/ama. Accessed January 15, 2016.
- Smith AM, Sperling JW, Cofield RH. Rotator cuff repair in patients with rheumatoid arthritis. J Bone Joint Surg. 2005;87(8):1782-1787. doi:10.2106/JBJS.D.02452.
- Betts HM, Abu-Rajab R, Nunn T, Brooksbank AJ. Total shoulder replacement in rheumatoid disease: a 16- to 23-year follow-up. J Bone Joint Surg Br. 2009;91(9):1197-1200. doi:10.1302/0301-620X.91B9.22035.
- Geervliet PC, Somford MP, Winia P, van den Bekerom MP. Long-term results of shoulder hemiarthroplasty in patients with rheumatoid arthritis. Orthopedics. 2015;38(1):e38-e42. doi:10.3928/01477447-20150105-58.
- Hettrich CM, Weldon E III, Boorman RS, Parsons M IV, Matsen FA III. Preoperative factors associated with improvements in shoulder function after humeral hemiarthroplasty. J Bone Joint Surg. 2004;86–A(7):1446-1451.
- Yazdany J, Dudley RA, Chen R, Lin GA, Tseng CW. Coverage for high-cost specialty drugs for rheumatoid arthritis in Medicare Part D. Arthritis Rheumatol. 2015;67(6):1474-1480. doi:10.1002/art.39079.
- Jauregui JJ, Kapadia BH, Dixit A, et al. Thirty-day complications in rheumatoid patients following total knee arthroplasty. Clin Rheumatol. 2016;35(3):595-600. doi:10.1007/s10067-015-3037-4.
- Trail IA, Nuttall D. The results of shoulder arthroplasty in patients with rheumatoid arthritis. J Bone Joint Surg Br. 2002;84(8):1121-1125. doi:10.1302/0301-620X.84B8.0841121
ABSTRACT
It has been suggested that the utilization of joint arthroplasty in patients with rheumatoid arthritis (RA) is decreasing; however, this observation is largely based upon evidence pertaining to lower-extremity joint arthroplasty. It remains unknown if these observed trends also hold true for shoulder arthroplasty. The purpose of this study is to utilize a nationally representative population database in the US to identify trends in the utilization of shoulder arthroplasty among patients with RA. Secondarily, we sought to determine the rate of early adverse events, length of stay, and hospitalization costs associated with RA patients undergoing shoulder arthroplasty and to compare these outcomes to those of patients without a diagnosis of RA undergoing shoulder arthroplasty. Using a large population database in the US, we determined the annual rates of shoulder arthroplasty (overall and individual) in RA patients between 2002 and 2011. Early adverse events, length of stay, and hospitalization costs were determined and compared with those of non-RA patients undergoing shoulder arthroplasty. Overall, we identified 332,593 patients who underwent shoulder arthroplasty between 2002 and 2011, of whom 17,883 patients (5.4%) had a diagnosis of RA. Over the study period, there was a significant increase in the utilization of shoulder arthroplasty in RA patients, particularly total shoulder arthroplasty. Over the same period, there was a significant increase in the number of RA patients who underwent shoulder arthroplasty with a diagnosis of rotator cuff disease. There were no significant differences in adverse events or mean hospitalization costs between RA and non-RA patients. Non-RA patients had a significantly shorter length of stay; however, the difference did not appear to be clinically significant. In conclusion, the utilization of shoulder arthroplasty in patients with RA significantly increased from 2002 to 2011, which may partly reflect a trend toward management of rotator cuff disease with arthroplasty rather than repair.
Continue to: It has been suggested...
It has been suggested that the utilization of total joint arthroplasty (TJA) in patients with rheumatoid arthritis (RA) is decreasing over time;1 however, this observation is largely based upon evidence pertaining to lower extremity TJA.2 It remains unknown if these observed trends also hold true for shoulder arthroplasty, whereby the utilization of shoulder arthroplasty in RA patients is not limited to the management of end-stage inflammatory arthropathy. In this study, we used a nationally representative population database in the US to identify trends in the utilization of shoulder arthroplasty among patients with RA. As a secondary objective, we sought to determine the rate of early adverse events, length of stay, and hospitalization costs associated with RA patients undergoing shoulder arthroplasty and compare these outcomes to those of patients without a diagnosis of RA undergoing shoulder arthroplasty. We hypothesize that the utilization of shoulder arthroplasty in RA patients would be decreasing, but adverse events, length of stay, and hospitalization costs would not differ between patients with and without RA undergoing shoulder arthroplasty.
METHODS
We conducted a retrospective cohort study using the Healthcare Cost and Utilization Project (HCUP) Nationwide Inpatient Sample (NIS) from 2002 to 2011.3 The NIS comprises a 20% stratified sample of all hospital discharges in the US. The NIS includes information about patient characteristics (age, sex, insurance status, and medical comorbidities) and hospitalization outcomes (adverse events, costs, and length of stay). The NIS allows identification of hospitalizations according to procedures and diagnoses using International Classification of Diseases, Ninth Revision, Clinical Modification (ICD-9-CM) codes. Given the anonymity of this study, it was exempt from Institutional Review Board ethics approval.
Hospitalizations were selected for the study based on ICD-9-CM procedural codes for hemiarthroplasty (81.81), anatomic total shoulder arthroplasty (TSA) (81.80), and reverse TSA (81.88). These patients were then stratified by an ICD-9-CM diagnosis of RA (714.X). We also utilized ICD-9-CM diagnosis codes to determine the presence of rotator cuff pathology at the time of shoulder arthroplasty (726.13, 727.61, 840.4) and to exclude patients with a history of trauma (812.X, 716.11, 733.8X). In a separate analysis, all patients in the NIS database with an ICD-9-CM diagnosis of RA were identified for each calendar year of the study, and a national estimate of RA patients was generated annually to assess overall and individual utilization rates of shoulder arthroplasty in this population (the national estimate served as the denominator).
Preoperative patient data withdrawn from the NIS included age, sex, insurance status, and medical comorbidities. An Elixhauser Comorbidity Index (ECI) was generated for each patient based on the presence of 29 comorbid conditions. The ECI was chosen because of its capacity to accurately predict mortality and represent the patient burden of comorbidities in similar administrative database studies.4-6
Early adverse events were also chosen based on ICD-9-CM diagnosis codes (Appendix A), and included the following: death, acute kidney injury, cardiac arrest, thromboembolic event, myocardial infarction, peripheral nerve injury, pneumonia, sepsis, stroke, surgical site infection, urinary tract infection, and wound dehiscence. The overall adverse event rate was defined as the occurrence of ≥1 of the above adverse events in a patient.
Appendix A. ICD-9-CM Codes Corresponding to Postoperative Adverse Events
Event | ICD-9-CM |
Acute kidney injury | 584.5-584.9 |
Cardiac arrest | 427.41, 427.5 |
Thromboembolic event | 453.2-453.4, 453.82-453.86, 415.1 |
Myocardial Infarction | 410.00-410.92 |
Peripheral nerve injury | 953.0-953.9 954.0-954.9, 955.0-955.9, 956.0-956.9 |
Pneumonia | 480.0-480.9, 481, 482.0-482.9, 483.0-483.8, 484.1-484.8, 485, 486 |
Sepsis | 038.0-038.9, 112.5, 785.52, 995.91, 995.92 |
Stroke | 430, 432, 433.01-434.91, 997.02 |
Surgical site infection | 998.51, 998.59, 996.67 |
Urinary tract infection | 599 |
Wound dehiscence | 998.30-998.33 |
Abbreviation: ICD-9-CM, International Classification of Diseases, Ninth Revision, Clinical Modification
Length of stay and total hospital charges were available for each patient. Length of stay represents the number of calendar days a patient stayed in the hospital. All hospital charges were converted to hospitalization costs using the HCUP Cost-to-Charge Ratio Files. All hospitalization costs were adjusted for inflation using the US Bureau of Labor statistics yearly inflation calculator to represent charges in the year 2011, which was the final and most recent year in this study.
Continue to: Statistical analysis...
STATISTICAL ANALYSIS
Statistical analyses were conducted using Stata version 13.1 (StataCorp, LP). All analyses took into account the complex survey design of the NIS. Discharge weights, strata, and cluster variables were included to correctly estimate variance and to produce national estimates from the stratified sample. Pearson’s chi-squared test was used to compare age, sex, ECI, and insurance status between RA and non-RA patients undergoing shoulder arthroplasty.
Bivariate and multivariate logistic regressions were subsequently used to compare the rates of adverse events between RA and non-RA patients undergoing shoulder arthroplasty (non-RA cases were used as the reference). Multivariate linear regressions were used to compare hospital length of stay and hospitalization costs between RA and non-RA patients undergoing shoulder arthroplasty. The multivariate regressions were adjusted for baseline differences in age, sex, ECI, and insurance status. Cochran-Armitage tests for trend were used to assess trends over time. All tests were 2-tailed, and the statistical difference was established at a 2-sided α level of 0.05 (P < .05).
RESULTS
Overall, we identified 332,593 patients who underwent shoulder arthroplasty in the US between 2002 and 2011, of which 17,883 patients (5.4%) had a diagnosis of RA. In comparison with non-RA patients undergoing shoulder arthroplasty, patients with RA at the time of shoulder arthroplasty were significantly younger (65.2 ± 12.5 years vs 68.4 ± 11.0 years, P < .001), included a significantly greater proportion of female patients (76.7% vs 53.8%, P < .001), and included a significantly higher proportion of patients with Medicaid insurance (3.6% vs 2.3%, P < .001). There were no significant differences in the mean ECI between patients with and without a diagnosis of RA (Table 1). As depicted in Table 1, there were significant differences in the utilization of specific shoulder arthroplasty types between patients with and without RA, whereby a significantly greater proportion of RA patients underwent hemiarthroplasty (HA) (31.6% vs 29.3%, P = .002) and reverse TSA (7.7% vs 6.6%, P = .002), whereas a significantly greater proportion of non-RA patients underwent anatomic SA (64.0% vs 60.8%, P = .002).
Over the study period from 2002 to 2011, there was a significant increase in the overall utilization of shoulder arthroplasty in RA patients, as indicated by both the absolute number and the proportion of patients with a diagnosis of RA (P < .001) (Table 2, Figure). More specifically, 0.39% of RA patients underwent shoulder arthroplasty in 2002, as compared with 0.58% of RA patients in 2011 (P < .001) (Table 2). With respect to specific arthroplasty types, there was an exponential rise in the utilization of reverse TSA beginning in 2010 and a corresponding decrease in the rates of both HA and anatomic TSA (Table 2, Figure). In addition to changes in shoulder arthroplasty utilization over time among RA patients, we also observed a significant increase in the number of RA patients undergoing shoulder arthroplasty with a corresponding diagnosis of rotator cuff disease (9.7% in 2002 to 15.2% in 2011, P < .001).
Table 2. The Annual Utilization of Shoulder Arthroplasty Among Patients with a Diagnosis of Rheumatoid Arthritis.
Proportion of RA patients |
| ||||
Year | Overall Rate of Shoulder Arthroplastya | HA | Anatomic TSA | Reverse TSA | |
2002 | 0.39 | 0.23 | 0.16 | 0 | |
2003 | 0.37 | 0.19 | 0.18 | 0 | |
2004 | 0.46 | 0.25 | 0.21 | 0 | |
2005 | 0.46 | 0.21 | 0.25 | 0 | |
2006 | 0.47 | 0.20 | 0.27 | 0 | |
2007 | 0.55 | 0.22 | 0.33 | 0 | |
2008 | 0.47 | 0.17 | 0.30 | 0 | |
2009 | 0.50 | 0.15 | 0.35 | 0 | |
2010 | 0.58 | 0.15 | 0.37 | 0.06 | |
2011 | 0.58 | 0.12 | 0.23 | 0.23 | |
Absolute number of RA patients |
| ||||
2002 | 1295 | 768 | 527 | 0 | |
2003 | 1247 | 650 | 597 | 0 | |
2004 | 1667 | 906 | 761 | 0 | |
2005 | 1722 | 776 | 946 | 0 | |
2006 | 1847 | 794 | 1053 | 0 | |
2007 | 2249 | 910 | 1339 | 0 | |
2008 | 2194 | 799 | 1395 | 0 | |
2009 | 2407 | 724 | 1683 | 0 | |
2010 | 2869 | 722 | 1857 | 290 | |
2011 | 3193 | 649 | 1261 | 1283 | |
aRate determined as number of RA patients undergoing shoulder arthroplasty compared to the number of patients with an RA diagnosis in the stated calendar year.
Abbreviations: HA, hemiarthroplasty; RA, rheumatoid arthritis; TSA, total shoulder arthroplasty.
Continue to: Among patients with RA...
Among patients with RA undergoing shoulder arthroplasty, the overall rate of early adverse events was 3.12%, of which the most common early adverse events were urinary tract infections (1.8%), acute kidney injury (0.66%), and pneumonia (0.38%) (Table 3). As compared with patients without a diagnosis of RA undergoing shoulder arthroplasty, there were no significant differences in the overall and individual rates of early adverse events (Table 3).
Table 3. A Comparison of Early Adverse Events, Length of Stay, and Cost Between Patients With and Without Rheumatoid Arthritis (RA) Undergoing Shoulder Arthroplasty
Comparison of Early Adverse Event Rates |
| ||||
| Non-RA Patients | RA Patients | Multivariate Logistic Regression | ||
Odds Ratio | P-Value | ||||
Overall adverse event rate | 3.02% | 3.12% | 1.0 | 0.83 | |
Specific adverse event rate |
|
|
|
| |
Death | 0.08% | 0.05% | 0.9 | 0.91 | |
Acute kidney injury | 0.85% | 0.66% | 0.9 | 0.59 | |
Cardiac arrest | 0.05% | 0.05% | 1.3 | 0.70 | |
Thromboembolic event | 0.01% | 0.00% | - | - | |
Myocardial Infarction | 0.22% | 0.06% | 0.4 | 0.17 | |
Peripheral nerve injury | 0.08% | 0.11% | 1.5 | 0.45 | |
Pneumonia | 0.47% | 0.38% | 0.9 | 0.70 | |
Sepsis | 0.08% | 0.08% | 1.3 | 0.62 | |
Stroke | 0.07% | 0.05% | 0.9 | 0.93 | |
Surgical site infection | 0.09% | 0.13% | 1.4 | 0.52 | |
Urinary tract infection | 1.44% | 1.80% | 1.1 | 0.46 | |
Wound dehiscence | 0.01% | 0.05% | 3.6 | 0.09 | |
Comparison of Length of Stay and Hospital Charges | |||||
| Non-RA Patients (percent) | RA Patients (percent) | Multivariate Linear Regression | ||
Beta | P-Value | ||||
Length of staya | 2.3±2.0 | 2.4±1.6 | +0.1 | 0.002 | |
Hospitalization costb | 14,826±8,336 | 14,787±7,625 | +93 | 0.59 | |
aReported in days. bReported in 2011 US dollars, adjusted for inflation.
The mean length of stay following shoulder arthroplasty in RA patients was 2.4 ± 1.6 days, and the mean hospitalization cost was $14,787 ± $7625 (Table 3). As compared with non-RA patients undergoing shoulder arthroplasty, there were no significant differences in the mean hospitalization costs; however, non-RA patients had a significantly shorter length of stay by 0.1 days (P = .002) (Table 3).
DISCUSSION
In this study, we observed that the utilization of shoulder arthroplasty in patients with RA increased significantly in the decade from 2002 to 2011, largely related to a rise in TSA. Interestingly, we also observed a corresponding rise in the proportion of RA patients undergoing shoulder arthroplasty with a diagnosis of rotator cuff disease, and we believe that this may partly account for the recent increase in the use of the reverse TSA in this patient population. Additionally, we found shoulder arthroplasty in RA patients to be safe in the early postoperative period, with no significant increase in cost as compared with patients undergoing shoulder arthroplasty without a diagnosis of RA. Although we did observe a significant increase in length of stay among RA patients as compared with non-RA patients, the absolute difference was only 0.1 days, and given the aforementioned similarities in cost between RA and non-RA patients, we do not believe this difference to be clinically significant.
It has been theorized that the utilization of TJA in RA patients has been decreasing with improvements in medical management; however, this is largely based upon literature pertaining to lower extremity TJA.2 On the contrary, past research pertaining to the utilization of shoulder arthroplasty in RA patients has been highly variable. For instance, a Swedish study demonstrated a statistically significant decrease in admissions associated with RA-related upper limb surgery and a stable rate of shoulder arthroplasty between 1998 and 2004.7 Similarly, a Finnish study demonstrated that the annual incidence of primary joint arthroplasty in RA patients had declined from 1995 to 2010, with a greater decline for upper-limb arthroplasty as compared with lower-limb arthroplasty.8 Despite these European observations, Jain and colleagues9 reported an increasing rate of TSA among RA patients in the US between the years 1992 and 2005. In this study, we demonstrate a clear increase in the utilization of shoulder arthroplasty among RA patients between 2002 and 2011. What was most striking about our observation was that the rise in utilization appeared to be driven by an increase in TSA, whereas the utilization of HA decreased over time. This change in practice likely reflects several factors, including the multitude of studies that have demonstrated improved outcomes with anatomic TSA as compared with HA in RA patients.10-14
Perhaps the most interesting aspect of our data was the recent exponential rise in the utilization of the reverse TSA. Despite improved outcomes following TSA as compared with HA in RA patients, these outcomes all appear to be highly dependent upon the integrity of the rotator cuff.10 In fact, there is evidence that failure of the rotator cuff could be as high as 75% within 10 years of TSA in patients with RA,15 which ultimately could jeopardize the long-term durability of the TSA implant in this patient population.11 For this reason, interest in the reverse TSA for the RA patient population has increased since its introduction in the US in 2004;16 in fact, in RA patients with end-stage inflammatory arthropathy and a damaged rotator cuff, the reverse TSA has demonstrated excellent results.17-20 Based upon this evidence, it is not surprising that we found an exponential rise in the use of the reverse TSA since 2010, which corresponds to the introduction of an ICD-9 code for this implant.21 Prior to 2010, it is likely that many implanted reverse TSAs were coded as TSA, and for this reason, we believe that the observed rise in the utilization of TSA in RA patients prior to 2010 may have been partly fueled by an increase in the use of the reverse TSA. To further support this theory, there was a dramatic decrease in the use of anatomic TSA following 2010, and we believe this was related to increased awareness of the newly introduced reverse TSA code among surgeons.
Another consideration when examining the utilization of shoulder arthroplasty in RA patients is its versatility in managing different disease states, including rotator cuff disease. As has been documented in the literature, outcomes of rotator cuff repair in RA patients are discouraging.22 For this reason, it is reasonable for surgeons and patients with RA to consider alternatives to rotator cuff repair when nonoperative management has failed to provide adequate improvement in symptoms. One alternative may be shoulder arthroplasty, namely the reverse TSA. In this study, we observed a significant increase in the rate of diagnosis of rotator cuff disease among RA patients undergoing shoulder arthroplasty from 2002 to 2011 (9.7% in 2002 to 15.2% in 2011, P < .001), and it is our belief that the simultaneous increase in the diagnosis of rotator cuff disease and use of TSA is not coincidental. More specifically, there is likely an emerging trend among surgeons toward using the reverse TSA to manage rotator cuff tears in the RA population, rather than undertaking a rotator cuff repair that carries a high rate of failure. Going forward, there is a need to not only identify this trend more clearly but to also compare the outcomes between reverse TSA and rotator cuff repair in the management of rotator cuff tears in RA patients.
Continue to: In this study, we observed...
In this study, we observed that RA patients undergoing shoulder arthroplasty were significantly younger than non-RA patients undergoing shoulder arthroplasty. At first, this observation seems to counter recent literature suggesting that the age of patients with inflammatory arthropathy undergoing TJA is increasing over time;1 however, looking more closely at the data, it becomes clearer that the mean age we report is actually a relative increase as compared with past clinical studies pertaining to RA patients undergoing shoulder arthroplasty (mean ages of 47 years,23 55 years,24 60 years,10 and 62 years25). On the other hand, the continued existence of an age gap between RA and non-RA patients undergoing shoulder arthroplasty may be the result of several possible phenomena. First, this may reflect issues with patient access to and coverage of expensive biologic antirheumatic medication that would otherwise mitigate disease progression. For instance, the out-of-pocket expense for biologic medication through Medicaid and Medicare is substantial,26 which has direct implications on over two-thirds of our RA cohort. Second, it may be skewed by the proportion of RA patients who have previously been or continue to be poorly managed, enabling disease progression to end-stage arthropathy at a younger age. Ultimately, further investigation is needed to determine the reasons for this continued age disparity.
In comparing RA and non-RA patients undergoing shoulder arthroplasty, we did not find a significant difference in the overall nor the individual rates of early adverse events. This finding appears to be unique, as similar studies pertaining to total knee arthroplasty (TKA) demonstrated a significantly higher incidence of postoperative pneumonia and bleeding requiring transfusion among RA patients as compared with non-RA patients.27 In patients with RA being treated with biologic medication and undergoing shoulder arthroplasty, the frequent concern in the postoperative period is the integrity of the wound and the potential for infection.28 In this study, we did not find a significant difference in the rate of early infection, and although the difference in the rate of early wound dehiscence approached significance, it did not meet the threshold of 0.05 (P = .09). This finding is in keeping with the aforementioned NIS study pertaining to TKA, and we believe that it likely reflects the short duration of follow-up for patients in both studies. Given the nature of the database we utilized, we were only privy to complications that arose during the inpatient hospital stay, and it is likely that the clear majority of patients who develop a postoperative infection or wound dehiscence do so in the postoperative setting following discharge. A second concern regarding postoperative wound complications is the management of biologic medication in the perioperative period, which we cannot determine using this database. Despite all these limitations specific to this database, a past systematic review of reverse TSA in RA patients found a low rate of deep infection after reverse TSA in RA patients (3.3%),17 which was not higher than that after shoulder arthroplasty performed in non-RA patients.
A final demonstration from this study is that the hospital length of stay was significantly longer for RA patients than non-RA patients undergoing shoulder arthroplasty; however, given that the difference was only 0.1 days, and there was no significant difference in hospitalization cost, we are inclined to believe that statistical significance may not translate into clinical significance in this scenario. Ultimately, we do believe that length of stay is an important consideration in the current healthcare system, and given our finding that shoulder arthroplasty in the RA patient is safe in the early postoperative period, that a prolonged postoperative hospitalization is not warranted on the sole basis of a patient’s history of RA.
As with all studies using data from a search of an administrative database, such as the NIS database, this study has limitations. First, this type of research is limited by the reliability of both diagnosis and procedural coding. Although the NIS database has demonstrated high reliability,3 it is still possible that events may have been miscoded. Second, the tracking period for adverse events is limited to the inpatient hospital stay, which may be too short to detect certain postoperative complications. As such, the rates we report are likely underestimates of the true incidence of these complications, but this is true for both the RA and non-RA populations. Third, the comparisons we draw between RA and non-RA patients are limited to the scope of the NIS database and the available data; as such, we could not draw comparisons between preoperative disease stage, intraoperative findings, and postoperative course following hospital discharge. Lastly, our data are limited to a distinct period between 2002 and 2011 and may not reflect current practice. Ultimately, our findings may underestimate current trends in shoulder arthroplasty utilization among RA patients, particularly for the reverse TSA.
CONCLUSION
In this study, we found that the utilization of shoulder arthroplasty in patients with RA increased significantly from 2002 to 2011, largely related to a rise in the utilization of TSA. Similarly, we observed a rise in the proportion of RA patients undergoing shoulder arthroplasty with a corresponding diagnosis of rotator cuff disease, and we believe the increased utilization of shoulder arthroplasty among RA patients resulted from management of both end-stage inflammatory arthropathy and rotator cuff disease. Although we did not find a significant difference between RA and non-RA patients in the rates of early adverse events and overall hospitalization costs following shoulder arthroplasty, length of stay was significantly longer among RA patients; however, the absolute difference does not appear to be clinically significant.
ABSTRACT
It has been suggested that the utilization of joint arthroplasty in patients with rheumatoid arthritis (RA) is decreasing; however, this observation is largely based upon evidence pertaining to lower-extremity joint arthroplasty. It remains unknown if these observed trends also hold true for shoulder arthroplasty. The purpose of this study is to utilize a nationally representative population database in the US to identify trends in the utilization of shoulder arthroplasty among patients with RA. Secondarily, we sought to determine the rate of early adverse events, length of stay, and hospitalization costs associated with RA patients undergoing shoulder arthroplasty and to compare these outcomes to those of patients without a diagnosis of RA undergoing shoulder arthroplasty. Using a large population database in the US, we determined the annual rates of shoulder arthroplasty (overall and individual) in RA patients between 2002 and 2011. Early adverse events, length of stay, and hospitalization costs were determined and compared with those of non-RA patients undergoing shoulder arthroplasty. Overall, we identified 332,593 patients who underwent shoulder arthroplasty between 2002 and 2011, of whom 17,883 patients (5.4%) had a diagnosis of RA. Over the study period, there was a significant increase in the utilization of shoulder arthroplasty in RA patients, particularly total shoulder arthroplasty. Over the same period, there was a significant increase in the number of RA patients who underwent shoulder arthroplasty with a diagnosis of rotator cuff disease. There were no significant differences in adverse events or mean hospitalization costs between RA and non-RA patients. Non-RA patients had a significantly shorter length of stay; however, the difference did not appear to be clinically significant. In conclusion, the utilization of shoulder arthroplasty in patients with RA significantly increased from 2002 to 2011, which may partly reflect a trend toward management of rotator cuff disease with arthroplasty rather than repair.
Continue to: It has been suggested...
It has been suggested that the utilization of total joint arthroplasty (TJA) in patients with rheumatoid arthritis (RA) is decreasing over time;1 however, this observation is largely based upon evidence pertaining to lower extremity TJA.2 It remains unknown if these observed trends also hold true for shoulder arthroplasty, whereby the utilization of shoulder arthroplasty in RA patients is not limited to the management of end-stage inflammatory arthropathy. In this study, we used a nationally representative population database in the US to identify trends in the utilization of shoulder arthroplasty among patients with RA. As a secondary objective, we sought to determine the rate of early adverse events, length of stay, and hospitalization costs associated with RA patients undergoing shoulder arthroplasty and compare these outcomes to those of patients without a diagnosis of RA undergoing shoulder arthroplasty. We hypothesize that the utilization of shoulder arthroplasty in RA patients would be decreasing, but adverse events, length of stay, and hospitalization costs would not differ between patients with and without RA undergoing shoulder arthroplasty.
METHODS
We conducted a retrospective cohort study using the Healthcare Cost and Utilization Project (HCUP) Nationwide Inpatient Sample (NIS) from 2002 to 2011.3 The NIS comprises a 20% stratified sample of all hospital discharges in the US. The NIS includes information about patient characteristics (age, sex, insurance status, and medical comorbidities) and hospitalization outcomes (adverse events, costs, and length of stay). The NIS allows identification of hospitalizations according to procedures and diagnoses using International Classification of Diseases, Ninth Revision, Clinical Modification (ICD-9-CM) codes. Given the anonymity of this study, it was exempt from Institutional Review Board ethics approval.
Hospitalizations were selected for the study based on ICD-9-CM procedural codes for hemiarthroplasty (81.81), anatomic total shoulder arthroplasty (TSA) (81.80), and reverse TSA (81.88). These patients were then stratified by an ICD-9-CM diagnosis of RA (714.X). We also utilized ICD-9-CM diagnosis codes to determine the presence of rotator cuff pathology at the time of shoulder arthroplasty (726.13, 727.61, 840.4) and to exclude patients with a history of trauma (812.X, 716.11, 733.8X). In a separate analysis, all patients in the NIS database with an ICD-9-CM diagnosis of RA were identified for each calendar year of the study, and a national estimate of RA patients was generated annually to assess overall and individual utilization rates of shoulder arthroplasty in this population (the national estimate served as the denominator).
Preoperative patient data withdrawn from the NIS included age, sex, insurance status, and medical comorbidities. An Elixhauser Comorbidity Index (ECI) was generated for each patient based on the presence of 29 comorbid conditions. The ECI was chosen because of its capacity to accurately predict mortality and represent the patient burden of comorbidities in similar administrative database studies.4-6
Early adverse events were also chosen based on ICD-9-CM diagnosis codes (Appendix A), and included the following: death, acute kidney injury, cardiac arrest, thromboembolic event, myocardial infarction, peripheral nerve injury, pneumonia, sepsis, stroke, surgical site infection, urinary tract infection, and wound dehiscence. The overall adverse event rate was defined as the occurrence of ≥1 of the above adverse events in a patient.
Appendix A. ICD-9-CM Codes Corresponding to Postoperative Adverse Events
Event | ICD-9-CM |
Acute kidney injury | 584.5-584.9 |
Cardiac arrest | 427.41, 427.5 |
Thromboembolic event | 453.2-453.4, 453.82-453.86, 415.1 |
Myocardial Infarction | 410.00-410.92 |
Peripheral nerve injury | 953.0-953.9 954.0-954.9, 955.0-955.9, 956.0-956.9 |
Pneumonia | 480.0-480.9, 481, 482.0-482.9, 483.0-483.8, 484.1-484.8, 485, 486 |
Sepsis | 038.0-038.9, 112.5, 785.52, 995.91, 995.92 |
Stroke | 430, 432, 433.01-434.91, 997.02 |
Surgical site infection | 998.51, 998.59, 996.67 |
Urinary tract infection | 599 |
Wound dehiscence | 998.30-998.33 |
Abbreviation: ICD-9-CM, International Classification of Diseases, Ninth Revision, Clinical Modification
Length of stay and total hospital charges were available for each patient. Length of stay represents the number of calendar days a patient stayed in the hospital. All hospital charges were converted to hospitalization costs using the HCUP Cost-to-Charge Ratio Files. All hospitalization costs were adjusted for inflation using the US Bureau of Labor statistics yearly inflation calculator to represent charges in the year 2011, which was the final and most recent year in this study.
Continue to: Statistical analysis...
STATISTICAL ANALYSIS
Statistical analyses were conducted using Stata version 13.1 (StataCorp, LP). All analyses took into account the complex survey design of the NIS. Discharge weights, strata, and cluster variables were included to correctly estimate variance and to produce national estimates from the stratified sample. Pearson’s chi-squared test was used to compare age, sex, ECI, and insurance status between RA and non-RA patients undergoing shoulder arthroplasty.
Bivariate and multivariate logistic regressions were subsequently used to compare the rates of adverse events between RA and non-RA patients undergoing shoulder arthroplasty (non-RA cases were used as the reference). Multivariate linear regressions were used to compare hospital length of stay and hospitalization costs between RA and non-RA patients undergoing shoulder arthroplasty. The multivariate regressions were adjusted for baseline differences in age, sex, ECI, and insurance status. Cochran-Armitage tests for trend were used to assess trends over time. All tests were 2-tailed, and the statistical difference was established at a 2-sided α level of 0.05 (P < .05).
RESULTS
Overall, we identified 332,593 patients who underwent shoulder arthroplasty in the US between 2002 and 2011, of which 17,883 patients (5.4%) had a diagnosis of RA. In comparison with non-RA patients undergoing shoulder arthroplasty, patients with RA at the time of shoulder arthroplasty were significantly younger (65.2 ± 12.5 years vs 68.4 ± 11.0 years, P < .001), included a significantly greater proportion of female patients (76.7% vs 53.8%, P < .001), and included a significantly higher proportion of patients with Medicaid insurance (3.6% vs 2.3%, P < .001). There were no significant differences in the mean ECI between patients with and without a diagnosis of RA (Table 1). As depicted in Table 1, there were significant differences in the utilization of specific shoulder arthroplasty types between patients with and without RA, whereby a significantly greater proportion of RA patients underwent hemiarthroplasty (HA) (31.6% vs 29.3%, P = .002) and reverse TSA (7.7% vs 6.6%, P = .002), whereas a significantly greater proportion of non-RA patients underwent anatomic SA (64.0% vs 60.8%, P = .002).
Over the study period from 2002 to 2011, there was a significant increase in the overall utilization of shoulder arthroplasty in RA patients, as indicated by both the absolute number and the proportion of patients with a diagnosis of RA (P < .001) (Table 2, Figure). More specifically, 0.39% of RA patients underwent shoulder arthroplasty in 2002, as compared with 0.58% of RA patients in 2011 (P < .001) (Table 2). With respect to specific arthroplasty types, there was an exponential rise in the utilization of reverse TSA beginning in 2010 and a corresponding decrease in the rates of both HA and anatomic TSA (Table 2, Figure). In addition to changes in shoulder arthroplasty utilization over time among RA patients, we also observed a significant increase in the number of RA patients undergoing shoulder arthroplasty with a corresponding diagnosis of rotator cuff disease (9.7% in 2002 to 15.2% in 2011, P < .001).
Table 2. The Annual Utilization of Shoulder Arthroplasty Among Patients with a Diagnosis of Rheumatoid Arthritis.
Proportion of RA patients |
| ||||
Year | Overall Rate of Shoulder Arthroplastya | HA | Anatomic TSA | Reverse TSA | |
2002 | 0.39 | 0.23 | 0.16 | 0 | |
2003 | 0.37 | 0.19 | 0.18 | 0 | |
2004 | 0.46 | 0.25 | 0.21 | 0 | |
2005 | 0.46 | 0.21 | 0.25 | 0 | |
2006 | 0.47 | 0.20 | 0.27 | 0 | |
2007 | 0.55 | 0.22 | 0.33 | 0 | |
2008 | 0.47 | 0.17 | 0.30 | 0 | |
2009 | 0.50 | 0.15 | 0.35 | 0 | |
2010 | 0.58 | 0.15 | 0.37 | 0.06 | |
2011 | 0.58 | 0.12 | 0.23 | 0.23 | |
Absolute number of RA patients |
| ||||
2002 | 1295 | 768 | 527 | 0 | |
2003 | 1247 | 650 | 597 | 0 | |
2004 | 1667 | 906 | 761 | 0 | |
2005 | 1722 | 776 | 946 | 0 | |
2006 | 1847 | 794 | 1053 | 0 | |
2007 | 2249 | 910 | 1339 | 0 | |
2008 | 2194 | 799 | 1395 | 0 | |
2009 | 2407 | 724 | 1683 | 0 | |
2010 | 2869 | 722 | 1857 | 290 | |
2011 | 3193 | 649 | 1261 | 1283 | |
aRate determined as number of RA patients undergoing shoulder arthroplasty compared to the number of patients with an RA diagnosis in the stated calendar year.
Abbreviations: HA, hemiarthroplasty; RA, rheumatoid arthritis; TSA, total shoulder arthroplasty.
Continue to: Among patients with RA...
Among patients with RA undergoing shoulder arthroplasty, the overall rate of early adverse events was 3.12%, of which the most common early adverse events were urinary tract infections (1.8%), acute kidney injury (0.66%), and pneumonia (0.38%) (Table 3). As compared with patients without a diagnosis of RA undergoing shoulder arthroplasty, there were no significant differences in the overall and individual rates of early adverse events (Table 3).
Table 3. A Comparison of Early Adverse Events, Length of Stay, and Cost Between Patients With and Without Rheumatoid Arthritis (RA) Undergoing Shoulder Arthroplasty
Comparison of Early Adverse Event Rates |
| ||||
| Non-RA Patients | RA Patients | Multivariate Logistic Regression | ||
Odds Ratio | P-Value | ||||
Overall adverse event rate | 3.02% | 3.12% | 1.0 | 0.83 | |
Specific adverse event rate |
|
|
|
| |
Death | 0.08% | 0.05% | 0.9 | 0.91 | |
Acute kidney injury | 0.85% | 0.66% | 0.9 | 0.59 | |
Cardiac arrest | 0.05% | 0.05% | 1.3 | 0.70 | |
Thromboembolic event | 0.01% | 0.00% | - | - | |
Myocardial Infarction | 0.22% | 0.06% | 0.4 | 0.17 | |
Peripheral nerve injury | 0.08% | 0.11% | 1.5 | 0.45 | |
Pneumonia | 0.47% | 0.38% | 0.9 | 0.70 | |
Sepsis | 0.08% | 0.08% | 1.3 | 0.62 | |
Stroke | 0.07% | 0.05% | 0.9 | 0.93 | |
Surgical site infection | 0.09% | 0.13% | 1.4 | 0.52 | |
Urinary tract infection | 1.44% | 1.80% | 1.1 | 0.46 | |
Wound dehiscence | 0.01% | 0.05% | 3.6 | 0.09 | |
Comparison of Length of Stay and Hospital Charges | |||||
| Non-RA Patients (percent) | RA Patients (percent) | Multivariate Linear Regression | ||
Beta | P-Value | ||||
Length of staya | 2.3±2.0 | 2.4±1.6 | +0.1 | 0.002 | |
Hospitalization costb | 14,826±8,336 | 14,787±7,625 | +93 | 0.59 | |
aReported in days. bReported in 2011 US dollars, adjusted for inflation.
The mean length of stay following shoulder arthroplasty in RA patients was 2.4 ± 1.6 days, and the mean hospitalization cost was $14,787 ± $7625 (Table 3). As compared with non-RA patients undergoing shoulder arthroplasty, there were no significant differences in the mean hospitalization costs; however, non-RA patients had a significantly shorter length of stay by 0.1 days (P = .002) (Table 3).
DISCUSSION
In this study, we observed that the utilization of shoulder arthroplasty in patients with RA increased significantly in the decade from 2002 to 2011, largely related to a rise in TSA. Interestingly, we also observed a corresponding rise in the proportion of RA patients undergoing shoulder arthroplasty with a diagnosis of rotator cuff disease, and we believe that this may partly account for the recent increase in the use of the reverse TSA in this patient population. Additionally, we found shoulder arthroplasty in RA patients to be safe in the early postoperative period, with no significant increase in cost as compared with patients undergoing shoulder arthroplasty without a diagnosis of RA. Although we did observe a significant increase in length of stay among RA patients as compared with non-RA patients, the absolute difference was only 0.1 days, and given the aforementioned similarities in cost between RA and non-RA patients, we do not believe this difference to be clinically significant.
It has been theorized that the utilization of TJA in RA patients has been decreasing with improvements in medical management; however, this is largely based upon literature pertaining to lower extremity TJA.2 On the contrary, past research pertaining to the utilization of shoulder arthroplasty in RA patients has been highly variable. For instance, a Swedish study demonstrated a statistically significant decrease in admissions associated with RA-related upper limb surgery and a stable rate of shoulder arthroplasty between 1998 and 2004.7 Similarly, a Finnish study demonstrated that the annual incidence of primary joint arthroplasty in RA patients had declined from 1995 to 2010, with a greater decline for upper-limb arthroplasty as compared with lower-limb arthroplasty.8 Despite these European observations, Jain and colleagues9 reported an increasing rate of TSA among RA patients in the US between the years 1992 and 2005. In this study, we demonstrate a clear increase in the utilization of shoulder arthroplasty among RA patients between 2002 and 2011. What was most striking about our observation was that the rise in utilization appeared to be driven by an increase in TSA, whereas the utilization of HA decreased over time. This change in practice likely reflects several factors, including the multitude of studies that have demonstrated improved outcomes with anatomic TSA as compared with HA in RA patients.10-14
Perhaps the most interesting aspect of our data was the recent exponential rise in the utilization of the reverse TSA. Despite improved outcomes following TSA as compared with HA in RA patients, these outcomes all appear to be highly dependent upon the integrity of the rotator cuff.10 In fact, there is evidence that failure of the rotator cuff could be as high as 75% within 10 years of TSA in patients with RA,15 which ultimately could jeopardize the long-term durability of the TSA implant in this patient population.11 For this reason, interest in the reverse TSA for the RA patient population has increased since its introduction in the US in 2004;16 in fact, in RA patients with end-stage inflammatory arthropathy and a damaged rotator cuff, the reverse TSA has demonstrated excellent results.17-20 Based upon this evidence, it is not surprising that we found an exponential rise in the use of the reverse TSA since 2010, which corresponds to the introduction of an ICD-9 code for this implant.21 Prior to 2010, it is likely that many implanted reverse TSAs were coded as TSA, and for this reason, we believe that the observed rise in the utilization of TSA in RA patients prior to 2010 may have been partly fueled by an increase in the use of the reverse TSA. To further support this theory, there was a dramatic decrease in the use of anatomic TSA following 2010, and we believe this was related to increased awareness of the newly introduced reverse TSA code among surgeons.
Another consideration when examining the utilization of shoulder arthroplasty in RA patients is its versatility in managing different disease states, including rotator cuff disease. As has been documented in the literature, outcomes of rotator cuff repair in RA patients are discouraging.22 For this reason, it is reasonable for surgeons and patients with RA to consider alternatives to rotator cuff repair when nonoperative management has failed to provide adequate improvement in symptoms. One alternative may be shoulder arthroplasty, namely the reverse TSA. In this study, we observed a significant increase in the rate of diagnosis of rotator cuff disease among RA patients undergoing shoulder arthroplasty from 2002 to 2011 (9.7% in 2002 to 15.2% in 2011, P < .001), and it is our belief that the simultaneous increase in the diagnosis of rotator cuff disease and use of TSA is not coincidental. More specifically, there is likely an emerging trend among surgeons toward using the reverse TSA to manage rotator cuff tears in the RA population, rather than undertaking a rotator cuff repair that carries a high rate of failure. Going forward, there is a need to not only identify this trend more clearly but to also compare the outcomes between reverse TSA and rotator cuff repair in the management of rotator cuff tears in RA patients.
Continue to: In this study, we observed...
In this study, we observed that RA patients undergoing shoulder arthroplasty were significantly younger than non-RA patients undergoing shoulder arthroplasty. At first, this observation seems to counter recent literature suggesting that the age of patients with inflammatory arthropathy undergoing TJA is increasing over time;1 however, looking more closely at the data, it becomes clearer that the mean age we report is actually a relative increase as compared with past clinical studies pertaining to RA patients undergoing shoulder arthroplasty (mean ages of 47 years,23 55 years,24 60 years,10 and 62 years25). On the other hand, the continued existence of an age gap between RA and non-RA patients undergoing shoulder arthroplasty may be the result of several possible phenomena. First, this may reflect issues with patient access to and coverage of expensive biologic antirheumatic medication that would otherwise mitigate disease progression. For instance, the out-of-pocket expense for biologic medication through Medicaid and Medicare is substantial,26 which has direct implications on over two-thirds of our RA cohort. Second, it may be skewed by the proportion of RA patients who have previously been or continue to be poorly managed, enabling disease progression to end-stage arthropathy at a younger age. Ultimately, further investigation is needed to determine the reasons for this continued age disparity.
In comparing RA and non-RA patients undergoing shoulder arthroplasty, we did not find a significant difference in the overall nor the individual rates of early adverse events. This finding appears to be unique, as similar studies pertaining to total knee arthroplasty (TKA) demonstrated a significantly higher incidence of postoperative pneumonia and bleeding requiring transfusion among RA patients as compared with non-RA patients.27 In patients with RA being treated with biologic medication and undergoing shoulder arthroplasty, the frequent concern in the postoperative period is the integrity of the wound and the potential for infection.28 In this study, we did not find a significant difference in the rate of early infection, and although the difference in the rate of early wound dehiscence approached significance, it did not meet the threshold of 0.05 (P = .09). This finding is in keeping with the aforementioned NIS study pertaining to TKA, and we believe that it likely reflects the short duration of follow-up for patients in both studies. Given the nature of the database we utilized, we were only privy to complications that arose during the inpatient hospital stay, and it is likely that the clear majority of patients who develop a postoperative infection or wound dehiscence do so in the postoperative setting following discharge. A second concern regarding postoperative wound complications is the management of biologic medication in the perioperative period, which we cannot determine using this database. Despite all these limitations specific to this database, a past systematic review of reverse TSA in RA patients found a low rate of deep infection after reverse TSA in RA patients (3.3%),17 which was not higher than that after shoulder arthroplasty performed in non-RA patients.
A final demonstration from this study is that the hospital length of stay was significantly longer for RA patients than non-RA patients undergoing shoulder arthroplasty; however, given that the difference was only 0.1 days, and there was no significant difference in hospitalization cost, we are inclined to believe that statistical significance may not translate into clinical significance in this scenario. Ultimately, we do believe that length of stay is an important consideration in the current healthcare system, and given our finding that shoulder arthroplasty in the RA patient is safe in the early postoperative period, that a prolonged postoperative hospitalization is not warranted on the sole basis of a patient’s history of RA.
As with all studies using data from a search of an administrative database, such as the NIS database, this study has limitations. First, this type of research is limited by the reliability of both diagnosis and procedural coding. Although the NIS database has demonstrated high reliability,3 it is still possible that events may have been miscoded. Second, the tracking period for adverse events is limited to the inpatient hospital stay, which may be too short to detect certain postoperative complications. As such, the rates we report are likely underestimates of the true incidence of these complications, but this is true for both the RA and non-RA populations. Third, the comparisons we draw between RA and non-RA patients are limited to the scope of the NIS database and the available data; as such, we could not draw comparisons between preoperative disease stage, intraoperative findings, and postoperative course following hospital discharge. Lastly, our data are limited to a distinct period between 2002 and 2011 and may not reflect current practice. Ultimately, our findings may underestimate current trends in shoulder arthroplasty utilization among RA patients, particularly for the reverse TSA.
CONCLUSION
In this study, we found that the utilization of shoulder arthroplasty in patients with RA increased significantly from 2002 to 2011, largely related to a rise in the utilization of TSA. Similarly, we observed a rise in the proportion of RA patients undergoing shoulder arthroplasty with a corresponding diagnosis of rotator cuff disease, and we believe the increased utilization of shoulder arthroplasty among RA patients resulted from management of both end-stage inflammatory arthropathy and rotator cuff disease. Although we did not find a significant difference between RA and non-RA patients in the rates of early adverse events and overall hospitalization costs following shoulder arthroplasty, length of stay was significantly longer among RA patients; however, the absolute difference does not appear to be clinically significant.
- Mertelsmann-Voss C, Lyman S, Pan TJ, Goodman SM, Figgie MP, Mandl LA. US trends in rates of arthroplasty for inflammatory arthritis including rheumatoid arthritis, juvenile idiopathic arthritis, and spondyloarthritis. Arthritis Rheumatol. 2014;66(6):1432-1439. doi:10.1002/art.38384.
- Louie GH, Ward MM. Changes in the rates of joint surgery among patients with rheumatoid arthritis in California, 1983-2007. Ann Rheum Dis. 2010;69(5):868-871. doi:10.1136/ard.2009.112474.
- HCUP Nationwide Inpatient Sample (NIS) Healthcare Cost and Utilization Project (HCUP). Agency for Healthcare Research and Quality; 2002-2011.
- Elixhauser A, Steiner C, Harris DR, Coffey RM. Comorbidity measures for use with administrative data. Med Care. 1998;36(1):8-27. doi:10.1097/00005650-199801000-00004.
- Sharabiani MT, Aylin P, Bottle A. Systematic review of comorbidity indices for administrative data. Med Care. 2012;50(12):1109-1118. doi:10.1097/MLR.0b013e31825f64d0.
- van Walraven C, Austin PC, Jennings A, Quan H, Forster AJ. A modification of the Elixhauser comorbidity measures into a point system for hospital death using administrative data. Med Care. 2009;47(6):626-633. doi:10.1097/MLR.0b013e31819432e5.
- Weiss RJ, Ehlin A, Montgomery SM, Wick MC, Stark A, Wretenberg P. Decrease of RA-related orthopaedic surgery of the upper limbs between 1998 and 2004: data from 54,579 Swedish RA inpatients. Rheumatol Oxf. 2008 ;47(4):491-494. doi. 10.1093/rheumatology/ken009.
- Jämsen E, Virta LJ, Hakala M, Kauppi MJ, Malmivaara A, Lehto MU. The decline in joint replacement surgery in rheumatoid arthritis is associated with a concomitant increase in the intensity of anti-rheumatic therapy: a nationwide register-based study from 1995 through 2010. Acta Orthop. 2013;84(4):331-337. doi:10.3109/17453674.2013.810519.
- Jain A, Stein BE, Skolasky RL, Jones LC, Hungerford MW. Total joint arthroplasty in patients with rheumatoid arthritis: a United States experience from 1992 through 2005. J Arthroplasty. 2012;27(6):881-888. doi:10.1016/j.arth.2011.12.027.
- Barlow JD, Yuan BJ, Schleck CD, Harmsen WS, Cofield RH, Sperling JW. Shoulder arthroplasty for rheumatoid arthritis: 303 consecutive cases with minimum 5-year follow-up. J Shoulder Elbow Surg. 2014;23(6):791-799. doi:10.1016/j.jse.2013.09.016.
- Collins DN, Harryman DT, Wirth MA. Shoulder arthroplasty for the treatment of inflammatory arthritis. J Bone Joint Surg Am. 2004;86–A(11):2489-2496. doi:10.2106/00004623-200411000-00020.
- Rahme H, Mattsson P, Wikblad L, Larsson S. Cement and press-fit humeral stem fixation provides similar results in rheumatoid patients. Clin Orthop Relat Res. 2006;448:28-32. doi:10.1097/01.blo.0000224007.25636.85.
- Rozing PM, Nagels J, Rozing MP. Prognostic factors in arthroplasty in the rheumatoid shoulder. HSS J. 2011;7(1):29-36. doi:10.1007/s11420-010-9172-1.
- Sperling JW, Cofield RH, Schleck CD, Harmsen WS. Total shoulder arthroplasty versus hemiarthroplasty for rheumatoid arthritis of the shoulder: results of 303 consecutive cases. J Shoulder Elbow Surg. 2007;16(6):683-690. doi:10.1016/j.jse.2007.02.135.
- Khan A, Bunker TD, Kitson JB. Clinical and radiological follow-up of the Aequalis third-generation cemented total shoulder replacement: a minimum ten-year study. J Bone Joint Surg Br. 2009;91(12):1594-1600. doi:10.1302/0301-620X.91B12.22139.
- Guery J, Favard L, Sirveaux F, Oudet D, Mole D, Walch G. Reverse total shoulder arthroplasty: survivorship analysis of eighty replacements followed for five to ten years. J Bone Joint Surg Am. 2006;88(8):1742-1747. doi:10.2106/JBJS.E.00851.
- Gee ECA, Hanson EK, Saithna A. Reverse shoulder arthroplasty in rheumatoid arthritis: A systematic review. Open Orthop J. 2015;9:237-245. doi:10.2174/1874325001509010237.
- Holcomb JO, Hebert DJ, Mighell MA, et al. Reverse shoulder arthroplasty in patients with rheumatoid arthritis. J Shoulder Elbow Surg. 2010;19(7):1076-1084. doi:10.1016/j.jse.2009.11.049.
- Postacchini R, Carbone S, Canero G, Ripani M, Postacchini F. Reverse shoulder prosthesis in patients with rheumatoid arthritis: a systematic review. Int Orthop. 2016;40(5):965-973. doi:10.1007/s00264-015-2916-2.
- Rittmeister M, Kerschbaumer F. Grammont reverse total shoulder arthroplasty in patients with rheumatoid arthritis and nonreconstructible rotator cuff lesions. J Shoulder Elbow Surg. 2001;10(1):17-22. doi:10.1067/mse.2001.110515.
- American Medical Association. American Medical Association Web site. www.ama-assn.org/ama. Accessed January 15, 2016.
- Smith AM, Sperling JW, Cofield RH. Rotator cuff repair in patients with rheumatoid arthritis. J Bone Joint Surg. 2005;87(8):1782-1787. doi:10.2106/JBJS.D.02452.
- Betts HM, Abu-Rajab R, Nunn T, Brooksbank AJ. Total shoulder replacement in rheumatoid disease: a 16- to 23-year follow-up. J Bone Joint Surg Br. 2009;91(9):1197-1200. doi:10.1302/0301-620X.91B9.22035.
- Geervliet PC, Somford MP, Winia P, van den Bekerom MP. Long-term results of shoulder hemiarthroplasty in patients with rheumatoid arthritis. Orthopedics. 2015;38(1):e38-e42. doi:10.3928/01477447-20150105-58.
- Hettrich CM, Weldon E III, Boorman RS, Parsons M IV, Matsen FA III. Preoperative factors associated with improvements in shoulder function after humeral hemiarthroplasty. J Bone Joint Surg. 2004;86–A(7):1446-1451.
- Yazdany J, Dudley RA, Chen R, Lin GA, Tseng CW. Coverage for high-cost specialty drugs for rheumatoid arthritis in Medicare Part D. Arthritis Rheumatol. 2015;67(6):1474-1480. doi:10.1002/art.39079.
- Jauregui JJ, Kapadia BH, Dixit A, et al. Thirty-day complications in rheumatoid patients following total knee arthroplasty. Clin Rheumatol. 2016;35(3):595-600. doi:10.1007/s10067-015-3037-4.
- Trail IA, Nuttall D. The results of shoulder arthroplasty in patients with rheumatoid arthritis. J Bone Joint Surg Br. 2002;84(8):1121-1125. doi:10.1302/0301-620X.84B8.0841121
- Mertelsmann-Voss C, Lyman S, Pan TJ, Goodman SM, Figgie MP, Mandl LA. US trends in rates of arthroplasty for inflammatory arthritis including rheumatoid arthritis, juvenile idiopathic arthritis, and spondyloarthritis. Arthritis Rheumatol. 2014;66(6):1432-1439. doi:10.1002/art.38384.
- Louie GH, Ward MM. Changes in the rates of joint surgery among patients with rheumatoid arthritis in California, 1983-2007. Ann Rheum Dis. 2010;69(5):868-871. doi:10.1136/ard.2009.112474.
- HCUP Nationwide Inpatient Sample (NIS) Healthcare Cost and Utilization Project (HCUP). Agency for Healthcare Research and Quality; 2002-2011.
- Elixhauser A, Steiner C, Harris DR, Coffey RM. Comorbidity measures for use with administrative data. Med Care. 1998;36(1):8-27. doi:10.1097/00005650-199801000-00004.
- Sharabiani MT, Aylin P, Bottle A. Systematic review of comorbidity indices for administrative data. Med Care. 2012;50(12):1109-1118. doi:10.1097/MLR.0b013e31825f64d0.
- van Walraven C, Austin PC, Jennings A, Quan H, Forster AJ. A modification of the Elixhauser comorbidity measures into a point system for hospital death using administrative data. Med Care. 2009;47(6):626-633. doi:10.1097/MLR.0b013e31819432e5.
- Weiss RJ, Ehlin A, Montgomery SM, Wick MC, Stark A, Wretenberg P. Decrease of RA-related orthopaedic surgery of the upper limbs between 1998 and 2004: data from 54,579 Swedish RA inpatients. Rheumatol Oxf. 2008 ;47(4):491-494. doi. 10.1093/rheumatology/ken009.
- Jämsen E, Virta LJ, Hakala M, Kauppi MJ, Malmivaara A, Lehto MU. The decline in joint replacement surgery in rheumatoid arthritis is associated with a concomitant increase in the intensity of anti-rheumatic therapy: a nationwide register-based study from 1995 through 2010. Acta Orthop. 2013;84(4):331-337. doi:10.3109/17453674.2013.810519.
- Jain A, Stein BE, Skolasky RL, Jones LC, Hungerford MW. Total joint arthroplasty in patients with rheumatoid arthritis: a United States experience from 1992 through 2005. J Arthroplasty. 2012;27(6):881-888. doi:10.1016/j.arth.2011.12.027.
- Barlow JD, Yuan BJ, Schleck CD, Harmsen WS, Cofield RH, Sperling JW. Shoulder arthroplasty for rheumatoid arthritis: 303 consecutive cases with minimum 5-year follow-up. J Shoulder Elbow Surg. 2014;23(6):791-799. doi:10.1016/j.jse.2013.09.016.
- Collins DN, Harryman DT, Wirth MA. Shoulder arthroplasty for the treatment of inflammatory arthritis. J Bone Joint Surg Am. 2004;86–A(11):2489-2496. doi:10.2106/00004623-200411000-00020.
- Rahme H, Mattsson P, Wikblad L, Larsson S. Cement and press-fit humeral stem fixation provides similar results in rheumatoid patients. Clin Orthop Relat Res. 2006;448:28-32. doi:10.1097/01.blo.0000224007.25636.85.
- Rozing PM, Nagels J, Rozing MP. Prognostic factors in arthroplasty in the rheumatoid shoulder. HSS J. 2011;7(1):29-36. doi:10.1007/s11420-010-9172-1.
- Sperling JW, Cofield RH, Schleck CD, Harmsen WS. Total shoulder arthroplasty versus hemiarthroplasty for rheumatoid arthritis of the shoulder: results of 303 consecutive cases. J Shoulder Elbow Surg. 2007;16(6):683-690. doi:10.1016/j.jse.2007.02.135.
- Khan A, Bunker TD, Kitson JB. Clinical and radiological follow-up of the Aequalis third-generation cemented total shoulder replacement: a minimum ten-year study. J Bone Joint Surg Br. 2009;91(12):1594-1600. doi:10.1302/0301-620X.91B12.22139.
- Guery J, Favard L, Sirveaux F, Oudet D, Mole D, Walch G. Reverse total shoulder arthroplasty: survivorship analysis of eighty replacements followed for five to ten years. J Bone Joint Surg Am. 2006;88(8):1742-1747. doi:10.2106/JBJS.E.00851.
- Gee ECA, Hanson EK, Saithna A. Reverse shoulder arthroplasty in rheumatoid arthritis: A systematic review. Open Orthop J. 2015;9:237-245. doi:10.2174/1874325001509010237.
- Holcomb JO, Hebert DJ, Mighell MA, et al. Reverse shoulder arthroplasty in patients with rheumatoid arthritis. J Shoulder Elbow Surg. 2010;19(7):1076-1084. doi:10.1016/j.jse.2009.11.049.
- Postacchini R, Carbone S, Canero G, Ripani M, Postacchini F. Reverse shoulder prosthesis in patients with rheumatoid arthritis: a systematic review. Int Orthop. 2016;40(5):965-973. doi:10.1007/s00264-015-2916-2.
- Rittmeister M, Kerschbaumer F. Grammont reverse total shoulder arthroplasty in patients with rheumatoid arthritis and nonreconstructible rotator cuff lesions. J Shoulder Elbow Surg. 2001;10(1):17-22. doi:10.1067/mse.2001.110515.
- American Medical Association. American Medical Association Web site. www.ama-assn.org/ama. Accessed January 15, 2016.
- Smith AM, Sperling JW, Cofield RH. Rotator cuff repair in patients with rheumatoid arthritis. J Bone Joint Surg. 2005;87(8):1782-1787. doi:10.2106/JBJS.D.02452.
- Betts HM, Abu-Rajab R, Nunn T, Brooksbank AJ. Total shoulder replacement in rheumatoid disease: a 16- to 23-year follow-up. J Bone Joint Surg Br. 2009;91(9):1197-1200. doi:10.1302/0301-620X.91B9.22035.
- Geervliet PC, Somford MP, Winia P, van den Bekerom MP. Long-term results of shoulder hemiarthroplasty in patients with rheumatoid arthritis. Orthopedics. 2015;38(1):e38-e42. doi:10.3928/01477447-20150105-58.
- Hettrich CM, Weldon E III, Boorman RS, Parsons M IV, Matsen FA III. Preoperative factors associated with improvements in shoulder function after humeral hemiarthroplasty. J Bone Joint Surg. 2004;86–A(7):1446-1451.
- Yazdany J, Dudley RA, Chen R, Lin GA, Tseng CW. Coverage for high-cost specialty drugs for rheumatoid arthritis in Medicare Part D. Arthritis Rheumatol. 2015;67(6):1474-1480. doi:10.1002/art.39079.
- Jauregui JJ, Kapadia BH, Dixit A, et al. Thirty-day complications in rheumatoid patients following total knee arthroplasty. Clin Rheumatol. 2016;35(3):595-600. doi:10.1007/s10067-015-3037-4.
- Trail IA, Nuttall D. The results of shoulder arthroplasty in patients with rheumatoid arthritis. J Bone Joint Surg Br. 2002;84(8):1121-1125. doi:10.1302/0301-620X.84B8.0841121
TAKE-HOME POINTS
- There was a significant increase in the utilization of shoulder arthroplasty in RA patients, particularly TSA.
- There was a significant increase in the number of RA patients who underwent shoulder arthroplasty with a diagnosis of rotator cuff disease.
- There were no significant differences in adverse events or mean hospitalization costs between RA and non-RA patients.
- Non-RA patients had a significantly shorter length of stay.
- The utilization of shoulder arthroplasty in patients with RA significantly increased from 2002 to 2011, which may partly reflect a trend toward management of rotator cuff disease with arthroplasty rather than repair.