User login
VIDEO: It’s all about improving the patient experience
BOSTON – “When I assess a new technology,” said V. Raman Muthusamy, MD, chair of the AGA Center for GI Innovation and Technology (CGIT), “I look for three things” – it should allow us to do something we couldn’t do before, give better outcomes and/or do the procedure less invasively, or provide cost savings. Ideally, he said during an interview at the AGA Tech Summit, it should do all three. Dr. Muthusamy, director of interventional endoscopy and general GI endoscopy at the University of California, Los Angeles, said one of the goals of the CGIT is to keep physicians up to date on new technologies, but he recommends all physicians assess the data on new technologies and weigh the advantages before incorporating a new device into their practice. Better diagnostic tools and novel therapeutics should improve the patient experience.
BOSTON – “When I assess a new technology,” said V. Raman Muthusamy, MD, chair of the AGA Center for GI Innovation and Technology (CGIT), “I look for three things” – it should allow us to do something we couldn’t do before, give better outcomes and/or do the procedure less invasively, or provide cost savings. Ideally, he said during an interview at the AGA Tech Summit, it should do all three. Dr. Muthusamy, director of interventional endoscopy and general GI endoscopy at the University of California, Los Angeles, said one of the goals of the CGIT is to keep physicians up to date on new technologies, but he recommends all physicians assess the data on new technologies and weigh the advantages before incorporating a new device into their practice. Better diagnostic tools and novel therapeutics should improve the patient experience.
BOSTON – “When I assess a new technology,” said V. Raman Muthusamy, MD, chair of the AGA Center for GI Innovation and Technology (CGIT), “I look for three things” – it should allow us to do something we couldn’t do before, give better outcomes and/or do the procedure less invasively, or provide cost savings. Ideally, he said during an interview at the AGA Tech Summit, it should do all three. Dr. Muthusamy, director of interventional endoscopy and general GI endoscopy at the University of California, Los Angeles, said one of the goals of the CGIT is to keep physicians up to date on new technologies, but he recommends all physicians assess the data on new technologies and weigh the advantages before incorporating a new device into their practice. Better diagnostic tools and novel therapeutics should improve the patient experience.
FROM THE 2018 AGA TECH SUMMIT

Irritability, depressive mood tied to higher suicidality risk in adolescence
Children who are particularly irritable, depressive, and anxious might be at greater risk of suicidality in adolescence, according to a population-based cohort study.
Researchers enrolled 1,430 participants from the Québec Longitudinal Study of Child Development, aged 6-12 years, and performed yearly or biyearly assessments over a follow-up of 5 months to 17 years, according to a study published online March 28 in JAMA Psychiatry (doi: 10.1001/jamapsychiatry.2018.0174).
They found that girls who rated highly for irritability and for the depressive/anxious mood profile on the Behavior Questionnaire, a measure created for Canada’s National Longitudinal Study of Children and Youth, had a threefold higher risk of suicidality (odds ratio, 3.07; 95% confidence interval, 1.54-6.12). Meanwhile, boys had a twofold higher risk (OR, 2.13; 95% CI, 0.95-4.78), compared with children with low irritability and depressive/anxious mood.
“Exploratory analyses by sex indicated that this association was more important for girls than boys, as indicated by the need to prevent the exposure among 5 girls to avoid 1 case of suicidality,” wrote Massimiliano Orri, PhD, and his associates.
The rates of suicidality in children with high irritability and high depressive/anxious mood were 16.4%, compared with 11% in the group with the lowest symptom levels.
Even in children with only moderate irritability and low depressive/anxious mood, a significant increase was found in the odds of showing suicidality, compared with the reference group (OR, 1.51; 95% CI, 1.02-2.25).
“Although previous studies reported associations between irritability during childhood and adolescence and later depression, anxiety, and suicidality, we found that even moderate levels of irritability may contribute to suicidal risk,” wrote Dr. Orri of Bordeaux Population Health Research Centre, at the Institut National de la Santé et de la Recherche Medicale in France. “Such results indicate that .”
Children with a high depressive/anxious mood profile showed the same odds of suicidality as those of the reference group.
The authors noted that there was considerably stability in developmental profiles, so children who showed the highest levels of symptoms at age 6 were likely to exhibit those same high levels at age 12.
They also commented on their study’s use of an “innovative, person-centered approach” to describe the joint course of these moods over the time course of the study.
The investigators cited several limitations. One is that the assessment of childhood symptoms were based on teachers only, so depressive/anxious mood might have been underrated compared with irritability “because internalizing symptoms may be more difficult to observe in a school setting than externalized symptoms.”
Dr. Orri and two associates reported receiving support from the Canadian Institutes of Health Research. The other researchers cited funding from the National Alliance for Research on Schizophrenia and Depression and the Fonds de Recherche du Québec. No other financial disclosures were reported. The Québec Longitudinal Study of Child Development was supported by several entities, including the Québec Government’s Ministry of Health, Ministry of Education, and Ministry of Family Affairs.
SOURCE: Orri M et al. JAMA Psychiatry. 2018 Mar 28. doi: 10.1001/jamapsychiatry.2018.0174.
FROM JAMA PSYCHIATRY
Key clinical point: Irritability in children may predict suicidality in adolescence.
Major finding: Girls with high irritability and depressive/anxious mood profile had a threefold higher risk of suicidality in adolescence.
Study details: A population-based cohort study involving 1,430 participants.
Disclosures: Dr. Orri and two associates reported receiving support from the Canadian Institutes of Health Research. The other researchers cited funding from the National Alliance for Research on Schizophrenia and Depression and the Fonds de Recherche du Québec. No other financial disclosures were reported. The Québec Longitudinal Study of Child Development was supported by several entities, including the Québec Government’s Ministry of Health, Ministry of Education, and Ministry of Family Affairs.
Source: Orri M et al. JAMA Psychiatry. 2018 Mar 28. doi: 10.1001/jamapsychiatry.2018.0174.
Brigadier General Carl Rogers Darnall: Saving Lives on a Massive Scale
The Carl R. Darnall Army Medical Center at Fort Hood, Texas, is named in honor of Brigadier General Carl Rogers Darnall, a Texas native and career Army physician whose active-duty service spanned 35 years. Darnall, the oldest of 7 siblings, could not have imagined the enormity of the contributions that he would make and the lives that would be saved as he pursued a career in medicine.
Born on the family farm north of Dallas on Christmas Day in 1867, Darnall attended college in nearby Bonham and graduated from Transylvania University in Kentucky. He attended Jefferson Medical College in Philadelphia, Pennsylvania, graduating in 1890. Darnall spent several years in private practice before he joined the Army Medical Corps in 1896. He completed the Army Medical School in 1897. Opened in 1893, the Army Medical School was a 4-to-6-month course for civilian physicians entering active duty. The courses introduced physicians to the duties of medical officers as well as military surgery, medicine, and hygiene. It is considered by many to be the first school of public health in the U.S.
Darnall’s first assignments in Texas were followed by deployment to Cuba during the Spanish American War and then the Philippines, where he served as an operating surgeon and pathologist aboard the hospital ship, USS Relief. Darnall later accompanied an international expeditionary force to China in response to the Boxer Rebellion. In 1902, Darnall received an assignment to the Army Medical School in Washington, DC, that would change his life and the lives of millions around the world. Detailed as instructor for sanitary chemistry and operative surgery, he also served as secretary of the faculty. Just as Major Walter Reed and others before him, Darnall used his position at the Army Medical School to pursue important clinical research.
The complete story of the purification of drinking water is beyond the scope of this short biography. In brief, as early as 1894 the addition of chlorine to water was shown to render it “germ free.” In the 1890s, there were at least 2 attempts at water purification on a large scale with chlorine in European cities. One of the first uses of chlorine in the U.S. occurred in 1908 in Jersey City, New Jersey. At the Army Medical School, Darnall discovered the value of using compressed liquefied chlorine gas to purify water. He invented a mechanical liquid chlorine purifier in 1910 that became known as a chlorinator. In November 1911, Major Darnall authored a 15-page article concerning water purification.1 Darnall also devised and patented a water filter, which the U.S. Army used for many years.
The principles of his chlorinator and use of anhydrous liquid chlorine were later applied to municipal water supplies throughout the world. The positive benefit of clean drinking water to improving public health is beyond measure. It has been said that more lives have been saved and more sickness prevented by Darnall’s contribution to sanitary water than by any other single achievement in medicine.
During World War I, Darnall was promoted to colonel and assigned to the Finance and Supply Division in the Office of the Surgeon General. After the war, he served as department surgeon in Hawaii. In 1925, he returned to the Office of the Surgeon General as executive officer. In November 1929, he was promoted to brigadier general and became the commanding general of the Army Medical Center and Walter Reed General Hospital, a position he held for 2 years until his retirement in 1931.Darnall died on January 18, 1941, at Walter Reed General Hospital just 6 days after his wife of 48 years had died at their home in Washington, DC. He is buried in Section 3 at Arlington National Cemetery. His 3 sons, Joseph Rogers, William Major, and Carl Robert, all served in some capacity in the Army.
Darnall Army Community Hospital opened in 1965, replacing the World War II-era hospital at Fort Hood. In 1984 a 5-year reconstruction project with additional floor space was completed. On May 1, 2006, the hospital was officially renamed the Carl R. Darnall Army Medical Center.
About this column
This column provides biographical sketches of the namesakes of military and VA health care facilities. To learn more about the individual your facility was named for or to offer a topic suggestion, contact us at [email protected] or on Facebook.
1. Darnall CR. The purification of water by anhydrous chlorine. J Am Public Health Assoc. 1911;1(11):783-797.
The Carl R. Darnall Army Medical Center at Fort Hood, Texas, is named in honor of Brigadier General Carl Rogers Darnall, a Texas native and career Army physician whose active-duty service spanned 35 years. Darnall, the oldest of 7 siblings, could not have imagined the enormity of the contributions that he would make and the lives that would be saved as he pursued a career in medicine.
Born on the family farm north of Dallas on Christmas Day in 1867, Darnall attended college in nearby Bonham and graduated from Transylvania University in Kentucky. He attended Jefferson Medical College in Philadelphia, Pennsylvania, graduating in 1890. Darnall spent several years in private practice before he joined the Army Medical Corps in 1896. He completed the Army Medical School in 1897. Opened in 1893, the Army Medical School was a 4-to-6-month course for civilian physicians entering active duty. The courses introduced physicians to the duties of medical officers as well as military surgery, medicine, and hygiene. It is considered by many to be the first school of public health in the U.S.
Darnall’s first assignments in Texas were followed by deployment to Cuba during the Spanish American War and then the Philippines, where he served as an operating surgeon and pathologist aboard the hospital ship, USS Relief. Darnall later accompanied an international expeditionary force to China in response to the Boxer Rebellion. In 1902, Darnall received an assignment to the Army Medical School in Washington, DC, that would change his life and the lives of millions around the world. Detailed as instructor for sanitary chemistry and operative surgery, he also served as secretary of the faculty. Just as Major Walter Reed and others before him, Darnall used his position at the Army Medical School to pursue important clinical research.
The complete story of the purification of drinking water is beyond the scope of this short biography. In brief, as early as 1894 the addition of chlorine to water was shown to render it “germ free.” In the 1890s, there were at least 2 attempts at water purification on a large scale with chlorine in European cities. One of the first uses of chlorine in the U.S. occurred in 1908 in Jersey City, New Jersey. At the Army Medical School, Darnall discovered the value of using compressed liquefied chlorine gas to purify water. He invented a mechanical liquid chlorine purifier in 1910 that became known as a chlorinator. In November 1911, Major Darnall authored a 15-page article concerning water purification.1 Darnall also devised and patented a water filter, which the U.S. Army used for many years.
The principles of his chlorinator and use of anhydrous liquid chlorine were later applied to municipal water supplies throughout the world. The positive benefit of clean drinking water to improving public health is beyond measure. It has been said that more lives have been saved and more sickness prevented by Darnall’s contribution to sanitary water than by any other single achievement in medicine.
During World War I, Darnall was promoted to colonel and assigned to the Finance and Supply Division in the Office of the Surgeon General. After the war, he served as department surgeon in Hawaii. In 1925, he returned to the Office of the Surgeon General as executive officer. In November 1929, he was promoted to brigadier general and became the commanding general of the Army Medical Center and Walter Reed General Hospital, a position he held for 2 years until his retirement in 1931.Darnall died on January 18, 1941, at Walter Reed General Hospital just 6 days after his wife of 48 years had died at their home in Washington, DC. He is buried in Section 3 at Arlington National Cemetery. His 3 sons, Joseph Rogers, William Major, and Carl Robert, all served in some capacity in the Army.
Darnall Army Community Hospital opened in 1965, replacing the World War II-era hospital at Fort Hood. In 1984 a 5-year reconstruction project with additional floor space was completed. On May 1, 2006, the hospital was officially renamed the Carl R. Darnall Army Medical Center.
About this column
This column provides biographical sketches of the namesakes of military and VA health care facilities. To learn more about the individual your facility was named for or to offer a topic suggestion, contact us at [email protected] or on Facebook.
1. Darnall CR. The purification of water by anhydrous chlorine. J Am Public Health Assoc. 1911;1(11):783-797.
1. Darnall CR. The purification of water by anhydrous chlorine. J Am Public Health Assoc. 1911;1(11):783-797.

MDedge Daily News: Why most heart failure may be preventable
Why most heart failure may be preventable. Statins miss the mark in familial high cholesterol. Why mumps outbreaks are on the rise. And how using epileptic drugs in pregnancy affects school test scores.
Listen to the MDedge Daily News podcast for all the details on today’s top news.
Why most heart failure may be preventable. Statins miss the mark in familial high cholesterol. Why mumps outbreaks are on the rise. And how using epileptic drugs in pregnancy affects school test scores.
Listen to the MDedge Daily News podcast for all the details on today’s top news.
Why most heart failure may be preventable. Statins miss the mark in familial high cholesterol. Why mumps outbreaks are on the rise. And how using epileptic drugs in pregnancy affects school test scores.
Listen to the MDedge Daily News podcast for all the details on today’s top news.

Phase 1 results with UCART19 in kids

LISBON—Early results from a phase 1, pediatric trial of UCART19 expand upon results observed in children who received the therapy via a compassionate use program.
Two patients with relapsed/refractory B-cell acute lymphoblastic leukemia (B-ALL) received UCART19, a “universal,” donor-derived chimeric antigen receptor (CAR) T-cell therapy, via the program.
Both achieved remission and were still alive at last follow-up, more than 2 years after proceeding to transplant.
In the phase 1 trial, 5 of 6 B-ALL patients have achieved remission and gone on to transplant.
Three of the patients are still alive, and 2 are still negative for minimal residual disease (MRD) at 10 months and 11 months after UCART19 infusion.
However, 2 patients died of progression, and 1 died of transplant-related complications.
Paul Veys, MBBS, of Great Ormond Street Hospital (GOSH) in London, UK, presented these results, from the PALL trial, at the 44th Annual Meeting of the EBMT (abstract OS18-5*).
The trial is sponsored by Servier. In 2015, Servier acquired exclusive rights from Cellectis for UCART19, which is being co-developed by Servier and Pfizer.
Prior experience
Researchers previously reported results with UCART19 in 2 infants with relapsed/refractory B-ALL who had exhausted all other treatment options and received UCART19 via a compassionate use program.
Both patients achieved remission after UCART19 and proceeded to allogeneic hematopoietic stem cell transplant (allo-HSCT).
When these results were published, in January 2017, both patients were still alive and leukemia-free at last follow-up—12 months and 18 months after UCART19 infusion.
Dr Veys provided an update, noting that these patients were still alive and in remission at 24 months and 30 months after allo-HSCT.
Phase 1 patients and treatment
Thus far, the phase 1 trial has enrolled and treated 6 patients with relapsed B-ALL. They had a median age of 3.75 (range, 0.8-16.4).
All patients had morphological disease or an MRD level of at least 1 x 10⁻³ (via flow cytometry and/or qPCR) at baseline.
One patient had received 1 prior therapy, 2 had 3 prior therapies, and 3 had 4 or more prior therapies. Two patients had prior inotuzumab ozogamicin, and 2 had prior allo-HSCT. Both had relapsed within 6 months of allo-HSCT.
Five patients had less than 10% bone marrow blasts prior to lymphodepletion, and 1 had greater than 50% blasts.
Patients underwent lymphodepletion with fludarabine, cyclophosphamide, and alemtuzumab (n=5) or fludarabine and cyclophosphamide (n=1).
The patients received UCART19 at doses of 2 x 10⁷ total cells or 1.1 to 2.3 x 10⁶ cells/kg.
Toxicity
All 6 patients developed cytokine release syndrome (CRS), including grade 1 (n=1), grade 2 (n=4), and grade 3 (n-1) CRS. However, all 6 cases resolved completely.
Three patients had neurotoxic events, 2 grade 1 and 1 grade 2. One patient had grade 3 febrile neutropenia.
Three patients had grade 4 prolonged cytopenia. This was defined as persistent neutropenia and/or thrombocytopenia beyond day 42 after UCART19 infusion, except if the patient had >5% bone marrow blasts.
One patient had grade 1 adenovirus infection, 1 had grade 3 cytomegalovirus infection, 2 had grade 3 BK virus hemorrhagic cystitis, and 1 had grade 4 metapneumovirus infection.
One patient had grade 1 acute cutaneous graft-versus-host disease.
Efficacy
All 6 patients achieved a complete response at day 28 to 42 after UCART19 infusion. Five patients achieved MRD negativity according to flow cytometry, and 3 were MRD-negative according to PCR.
The 5 flow-MRD-negative patients went on to receive an allo-HSCT between 49 days and 62 days after UCART19 infusion. Conditioning consisted of total body irradiation and fludarabine, with or without cyclophosphamide and antithymocyte globulin. All of these patients received a dose of rituximab as well, which was intended to target any remaining UCART19 cells.
Two patients relapsed 3 months after transplant and died at 7 months and 8 months after UCART19 infusion. One of these patients was CD19-, and 1 was CD19+, but both were MRD-positive by PCR prior to receiving their transplant.
A third patient died 2.5 months after allo-HSCT from transplant-related complications, including thrombotic microangiopathy, BK hemorrhagic cystitis, and nephritis.
The remaining 3 patients are still alive at 1.5 months, 10 months, and 11 months after UCART19 infusion. Two are still MRD-negative, and 1 is MRD-positive. The MRD-positive patient has not undergone allo-HSCT.
*Data in the abstract were updated in the presentation.
CHMP rejects plitidepsin again

The European Medicines Agency’s Committee for Medicinal Products for Human Use (CHMP) has recommended refusal of marketing authorization for plitidepsin (Aplidin).
PharmaMar is seeking approval for plitidepsin to treat adults with multiple myeloma (MM) who have received at least 3 prior treatments, including bortezomib and either lenalidomide or thalidomide.
Plitidepsin is intended to be used in combination with dexamethasone.
This is the second time the CHMP has recommended against authorizing plitidepsin for this indication. The first time was last December.
At that time, PharmaMar asked the CHMP to re-examine its opinion, and the CHMP obliged. The committee confirmed its negative opinion of plitidepsin last week.
The CHMP’s review
Upon its initial review, the CHMP was concerned that data from the main study of plitidepsin in MM—the phase 3 ADMYRE trial—did not demonstrate a sufficient benefit of plitidepsin plus dexamethasone, compared to dexamethasone alone, in MM patients who had received 3 to 6 prior therapies.
The CHMP noted that the data showed a modest increase in progression free-survival (PFS)—around 1 month—with plitidepsin. According to study investigators, the median PFS was 3.8 months in patients who received plitidepsin and 1.9 months in those who received dexamethasone alone. According to an independent review committee, the median PFS was 2.6 months and 1.7 months, respectively.
The CHMP also said improvement in overall survival (OS) was not sufficiently demonstrated in this trial. The median OS was 11.6 months in the plitidepsin arm and 6.4 months in the dexamethasone arm.
Finally, the CHMP noted that severe adverse events were reported more frequently in patients who received plitidepsin. The most common grade 3/4 treatment-related adverse events (in the plitidepsin and dexamethasone arms, respectively) were fatigue (10.8% vs 1.2%), myalgia (5.4% vs 0%), and nausea (3.6% vs 1.2%).
Rates of treatment discontinuation were 9% in the plitidepsin arm, 6.5% in the dexamethasone arm, and 13.5% among patients who crossed over from the dexamethasone arm to the plitidepsin arm. Patients were allowed to cross over if they progressed after at least 8 weeks of treatment.
Based on these data, the CHMP was of the opinion that the benefits of plitidepsin did not outweigh its risks, so the committee recommended refusal of marketing authorization. After re-examination, the CHMP remained of the same opinion.
The European Commission (EC) has the final say on the marketing authorization application for plitidepsin. Though it is not required to do so, the EC typically follows the CHMP’s advice. The EC makes its decision within 67 days of the CHMP’s opinion.
PharmaMar has not announced whether it plans to continue developing plitidepsin for MM patients if the EC refuses to authorize the drug, and the company did not respond to a request for comment.
About plitidepsin
Plitidepsin is an investigational anticancer agent of marine origin, originally obtained from the ascidian Aplidium albicans. The drug specifically binds to eEF1A2 and targets the non-canonical role of this protein, resulting in cancer cell death via apoptosis.
Plitidepsin is currently in clinical development for hematologic malignancies.
In a phase 1b trial (NCT02100657), researchers are evaluating plitidepsin in combination with bortezomib and dexamethasone for patients with relapsed/refractory MM.
In a phase 2 trial (NCT03117361), researchers are investigating plitidepsin in combination with bortezomib and dexamethasone for patients with MM that is refractory to both lenalidomide and bortezomib.
Plitidepsin has received orphan drug designation in the European Union and the US.
CHMP recommends approval for generic prasugrel

The European Medicines Agency’s Committee for Medicinal Products for Human Use (CHMP) has recommended granting marketing authorization to a generic version of prasugrel called Prasugrel Mylan.
Mylan S.A.S. is seeking approval for this product to be co-administered with acetylsalicylic acid for the prevention of atherothrombotic events in adults with acute coronary syndrome (ie, unstable angina, non-ST segment elevation myocardial infarction, or ST segment elevation myocardial infarction) undergoing primary or delayed percutaneous coronary intervention.
The CHMP’s opinion on Prasugrel Mylan will be reviewed by the European Commission (EC).
If the EC agrees with the CHMP, the commission will grant a centralized marketing authorization that will be valid in the European Union. Norway, Iceland, and Liechtenstein will make corresponding decisions on the basis of the EC’s decision.
The EC typically makes a decision within 67 days of the CHMP’s recommendation.
If approved, Prasugrel Mylan will be available as 5 mg and 10 mg film-coated tablets.
Prasugrel is an inhibitor of platelet activation and aggregation that acts through the irreversible binding of its active metabolite to the P2Y12 class of ADP receptors on platelets.
Since platelets participate in the initiation and/or evolution of thrombotic complications of atherosclerotic disease, inhibition of platelet function can reduce the risk of cardiovascular events such as death, myocardial infarction, or stroke.
Prasugrel Mylan is a generic of Efient, which has been authorized in the European Union since 2009.
According to the CHMP, studies have demonstrated that Prasugrel Mylan is of “satisfactory quality” and bioequivalent to Efient.
In the TRITON–TIMI 38 study, treatment with prasugrel (Efient) was associated with significantly reduced rates of ischemic events, including stent thrombosis, when compared to treatment with clopidogrel in patients with moderate- to high-risk acute coronary syndromes with scheduled percutaneous coronary intervention.
However, prasugrel was also associated with an increased risk of major bleeding, including fatal bleeding. Still, there was no significant difference in mortality between the treatment groups.
These results were published in NEJM in 2007.
Survival worse with alcohol-related HCC, compared with other types
Hepatocellular carcinoma (HCC) related to alcohol use tends to be diagnosed at a later stage than HCC from other causes, which contributes to reduced overall survival among patients with alcoholic HCC, investigators in a prospective French study said.
Among 894 patients diagnosed with HCC, the adjusted median overall survival was 5.7 months for those with alcoholic HCC, compared with 9.7 months for those with nonalcoholic HCC (P = .0002), reported Charlotte E. Costentin, MD, of the Hopital Henri Mondor in Creteil, France, and colleagues.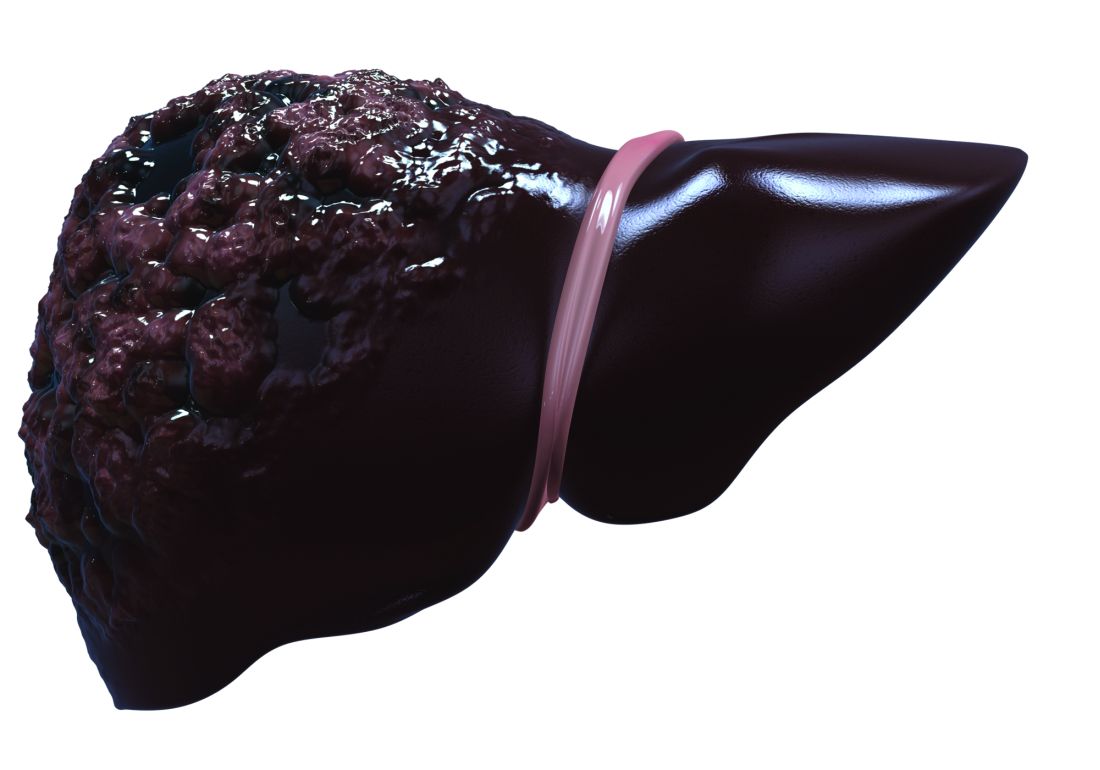
“Various assumptions can be made to explain why patients with alcohol-related HCC have reduced survival in comparison with patients with non–alcohol-related HCC: a diagnosis at a later stage due to lower rates of HCC screening, worse liver function and/or ongoing alcohol consumption preventing curative options, and discrimination against alcoholic patients leading to less aggressive treatment options,” they wrote in a study published online in Cancer.
The investigators looked at data on clinical features and treatment allocation of patients in the CHANGH cohort (cohorte de Carcinomes Hepatocelulaires de l’Association des hepato-Gastroenterologues des Hopitaux Generaux), a prospective, observational cohort study.
Of 1,207 patients with complete data, 582 had isolated alcohol-related HCC, and 312 had non–alcohol-related HCC, which was caused by either nonalcoholic fatty liver, hepatitis C infections, hepatitis B infections, hemochromatosis, or other etiologies.
As noted before, the median overall survival adjusted for lead-time bias (the length of time between the detection of a disease and its usual diagnosis) was significantly shorter for patients with alcohol-related HCC.
In univariate analysis, alcohol-related HCC, compared with non–alcohol-related HCC, was an independent risk factor for worse overall survival (hazard ratio, 1.39; P = .0002).
Among patients in the alcohol-related HCC group, median overall survival adjusted for lead-time was 5.8 months for patients who had been abstinent for a median of 1 year, compared with 5.0 months for the nonabstinent patients, a difference that was not statistically significant.
In multivariate analysis, factors significantly associated with worse overall survival included advanced HCC at diagnosis (diffuse or metastatic HCC and/or macrovascular invasion), alkaline phosphatase score, alpha-fetoprotein levels, creatinine, performance status, Child-Pugh score, age plus alcohol-related disease, and male sex plus alcohol-related disease. However, alcohol-related versus non–alcohol-related HCC was no longer statistically significant in multivariate analysis.
They noted that for 199 patients who were diagnosed with HCC as part of a cirrhosis follow-up program, the median overall survival adjusted for lead-time was 11.7 months, compared with 5.4 months for patients whose HCC was detected incidentally (P less than .0001).
The investigators noted that other studies have shown that screening rates for HCC are lower in alcohol abusers and that the most common reason for a lack of screening was failure of clinician to order surveillance in patients with known cirrhosis. In addition, alcoholic patients are less likely to be compliant with screening.
“Importantly, Bucci et al (Aliment Pharmacol Ther. 2016 Feb;43[3]:385-99) observed similar survival between alcoholic patients and patients with hepatitis C virus among patients undergoing HCC surveillance according to guidelines. The poorer prognosis of alcohol-related HCC is, therefore, very likely to be related to an advanced stage at diagnosis due to screening failure instead of greater cancer aggressiveness,” they wrote.
“To improve prognosis of liver cancer in the alcoholic population, efforts should be made to implement effective screening programs for both cirrhosis and liver cancer and to improve access to alcoholism treatment services,” Dr. Costentin said in press release. “A smaller tumor burden and a better liver function at diagnosis should translate into higher rates of patients with alcohol-related liver cancer amenable to curative treatment such as tumor resection or ablation and liver transplantation.”
Dr. Costentin did not report conflicts of interest. Several of her coauthors reported personal fees from various companies outside the submitted work.
SOURCE: Costentin CE at al. Cancer. doi: 10.1002/cncr.31215.
FROM CANCER
Key clinical point: Patients with HCC from alcohol or other causes had better survival if they were under surveillance for cirrhosis.
Major finding: Adjusted median overall survival was 5.7 months with alcohol-related HCC versus 9.7 months for nonalcoholic HCC (P = .0002).
Study details: Analysis of data from a prospective observational cohort of 1,207 patients with HCC in France.
Disclosures: The study was supported by the Association Nationale des Hepato-Gastroenterologues des Hopitaux Généraux group and Roche Pharmaceuticals. Dr. Constentin did not report conflicts of interest. Several of her coauthors reported personal fees from various companies outside the submitted work.
Source: Costentin CE at al. Cancer. doi: 10.1002/cncr.31215.
Abstract: Don't demonise prescription opioids
The video associated with this article is no longer available on this site. Please view all of our videos on the MDedge YouTube channel
Roehr, B., BMJ 359:j4727, October 19, 2017
The author, a biomedical journalist from Washington, DC, explains how a zero-tolerance policy to opioid prescribing will impede the delivery of care for patients with severe pain. He notes that he has used hydrocodone daily for nearly ten years for nerve damage due to knee replacement and spinal surgeries, and suggests that reports of the opioid epidemic “crisis” represent overblown rhetoric from persons with an interest in promoting a “war on drugs” agenda. In fact, research shows that while 38% of the US population used a prescription opioid in 2015, few of whom were being treated for cancer, only 0.8% were classified as drug abusers. The author considers himself dependent on hydrocodone in the same way that he is dependent on his blood pressure medication, and states that hydrocodone allows him to remain relatively pain-free and productive but without adverse effects. The dramatic rise in opioid-related deaths is fueled in part by fentanyl and other illicit street drugs. In fact, he contends that CDC mortality data are methodologically flawed because deaths due to street drugs including heroin are combined with deaths due to prescription opioids, while in fact prescription drug deaths have been decreasing over the past few years. Efforts to control the opioid supply with prescribing limits, prosecution of “pill mills,” and tamper-resistant formulations were all in place before the recent increases in opioid-related deaths. The author disputes the concept of opioids as gateway drugs, stating that the gateway theory has long been disproven, yet he acknowledges that patients who lose access to prescription opioids may turn to more accessible, black-market options such as street drugs containing fentanyl. He concludes that denial of opioids to everyone because some are abusers will mean that many patients with legitimate need will suffer unnecessarily. 4 references ([email protected] – no reprints)
Learn more about the Primary Care Medical Abstracts and podcasts, for which you can earn up to 9 CME credits per month.
Copyright © The Center for Medical Education
Newborn with multiple plaques
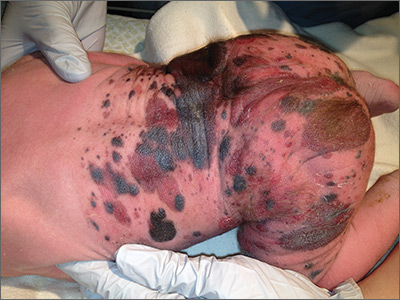
Giant congenital nevus was diagnosed in this patient. Congenital melanocytic nevi (CMN) are pigmented lesions that are present at birth and created by the abnormal migration of neural crest cells during embryogenesis. Nevi are categorized by size as small (<1.5 cm), medium (1.5-20 cm), large (>20 cm), or giant (>40 cm).
Congenital nevi tend to start out flat, with uniform pigmentation, but can become more variegated in texture and color as normal growth and development continue. Giant congenital nevi, which are rare, are likely to thicken, darken, and enlarge as the patient grows. Some nevi may develop very coarse or dark hair. CMN can cover any part of the body and occur independent of skin color and other ethnic factors.
CMN may present in almost any location and may be brown, black, pink, or purple in color. Café au lait macules, blue-gray spots, nevus of Ota, nevus spilus, and vascular malformations are part of the differential diagnosis for CMN and have individual location and color characteristics that set them apart clinically.
Patients with CMN are at increased risk for neurocutaneous melanosis (NCM; a melanocyte proliferation in the central nervous system) and melanoma. Magnetic resonance imaging (MRI) is helpful to exclude NCM. Treatment options for patients with large and giant CMN include early curettage, local excision, dermabrasion, and laser therapy. (There is, however, considerable debate about the value of surgery.) The newborn in the case underwent an MRI and the results were normal. At 4 months of age, he hadn’t developed any neurologic symptoms. The child’s nevi continue to grow and he sees his family physician for routine well-child visits and a dermatologist annually to monitor the nevi.
Adapted from: Karnes J, Griffin C. Large plaques on a baby boy. J Fam Pract. 2016;65:407-409.