User login
2017-2018 Annual Conference Committee
including topics, speakers, and learning objectives. The 2018 Annual Conference Committee is composed of the following SHM members:
Course Director
Kathleen M. Finn, MD, MPhil, SFHM
Massachusetts General Hospital
Assistant Course Director
Dustin T. Smith, MD, SFHM
Emory University School of Medicine
Committee Members
Joshua Allen-Dicker, MD, MPH, FHM
Beth Israel Deaconess Medical Center
Daniel Fang, MD
Stanford School of Medicine
Margaret C. Fang, MD, MPH, FHM
University of California, San Francisco
Leonard Feldman, MD, SFHM, FAAP, FACP
Johns Hopkins Hospital
Nick Fitterman, MD, SFHM
Northwell Health
Prateek Gandiga, MD
Georgetown University Hospital
Laura Nell Hodo, MD, FHM
Icahn School of Medicine at Mount Sinai & Kravis Children’s Hospital
Akshata Hopkins, MD, FHM
Johns Hopkins All Children’s Hospital
Michael Janjigian, MD
Bellevue Hospital Center
Benji K. Mathews, MD, SFHM
HealthPartners & University of Minnesota Medical School
Heather Nye, MD, PhD, SFHM
University of California, San Francisco
James C. Pile, MD, SFHM
Cleveland Clinic
Linda Prieto, MD, FHM
Morton Plant Hospital
Amith Skandhan, MD, FHM
Southeast Alabama Medical Center
Barbara Slawski, MD, MS, SFHM
Medical College of Wisconsin
Daniel I. Steinberg, MD, FHM
Beth Israel Medical Center
Amanda Trask, MBA, MHA, FACHE, SFHM
Catholic Health Initiatives
Rohit Uppal, MD, MBA, SFHM
TeamHealth
Christopher M. Whinney, MD, FACP, FHM
Cleveland Clinic Lerner College of Medicine
Surinder Yadav, MD, SFHM
CEP America
UCART19 can bridge to transplant in adults
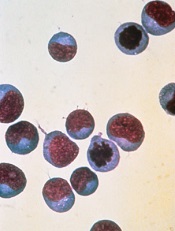
LISBON—Preliminary data from a phase 1 trial suggest UCART19 can serve as a bridge to transplant in adults with relapsed/refractory (R/R) B-cell acute lymphoblastic leukemia (B-ALL).
This “universal,” donor-derived, chimeric antigen receptor (CAR) T-cell therapy produced complete responses (CRs) in 6 of 9 patients treated.
Five of the patients who were negative for minimal residual disease (MRD) proceeded to allogeneic hematopoietic stem cell transplant (allo-HSCT).
Two of the 5 patients were still alive and in MRD-negative remission at last follow-up, but 1 had relapsed and 2 died.
A total of 4 patients died in this trial—1 from a dose-limiting toxicity (DLT), 1 from progressive disease, 1 from infection, and 1 from pulmonary hemorrhage.
“These early results for UCART19 are very encouraging, both in terms of manageable safety and the impressive complete molecular remission rate in these hard-to-treat adult patients with R/R B-ALL,” said principal investigator Reuben Benjamin, MBBS, PhD, a consultant hematologist at King’s College London in the UK.
Dr Benjamin presented these results, from the CALM trial, at the 44th Annual Meeting of the EBMT (abstract OS10-4*).
The CALM trial is sponsored by Servier. In 2015, Servier acquired exclusive rights from Cellectis for UCART19, which is being co-developed by Servier and Pfizer.
Patients and treatment
Dr Benjamin presented results in 9 patients with R/R B-ALL who had a median age of 23 (range, 18-49).
All patients had morphological disease or an MRD level of at least 1 x 10⁻³ (via flow cytometry and/or qPCR) at baseline. The median disease burden was 8% (range, 0-95).
Four patients had received 1 to 3 prior therapies, and 5 had received 4 or more prior treatments. Six patients had prior inotuzumab ozogamicin, 2 had prior blinatumomab, and 7 had prior allo-HSCT. The median time to relapse after allo-HSCT was 5.9 months (range, 4.1-11).
Patients underwent lymphodepletion with fludarabine, cyclophosphamide, and alemtuzumab (n=8) or fludarabine and cyclophosphamide (n=1).
They received UCART19 at 2 dose levels—6 x 10⁶ total cells (n=6) or 6 to 8 x 10⁷ total cells (n=3).
Toxicity
There were 2 DLTs, 1 at each dose level. At the lower dose, the DLT was grade 4 cytokine release syndrome (CRS) associated with grade 5 neutropenic sepsis. The patient with this DLT died at day 15 post-infusion.
At the higher dose level, the DLT was grade 4 prolonged cytopenia associated with infection and pulmonary hemorrhage. This patient died at day 82 post-infusion, 19 days after undergoing allo-HSCT.
In all, 8 patients had CRS. One patient had grade 1, 6 had grade 2, and 1 had grade 4 CRS. Seven patients had complete resolution of CRS.
Two patients had neurotoxic events, both grade 1.
Three patients had prolonged cytopenia, all grade 4. This was defined as persistent neutropenia and/or thrombocytopenia beyond day 42 after UCART19 infusion, except if the patient had >5% bone marrow blasts.
Two patients had neutropenic sepsis, grade 4 and grade 5.
Three patients had cytomegalovirus infection, all grade 2. Two patients had adenovirus infection, grade 1 and grade 3.
One patient had grade 1 acute cutaneous graft-versus-host disease.
Efficacy
Six of 9 patients achieved a CR, and 5 were MRD-negative by flow cytometry or qPCR. All 5 patients proceeded to allo-HSCT.
After transplant, 2 patients were still MRD-negative at 8 months, 1 patient relapsed after 6 months, and 2 patients died while MRD-negative. The deaths were due to infection and pulmonary hemorrhage.
Two other deaths were due to a DLT (neutropenic sepsis associated with CRS) and progressive disease.
Of the 5 patients who are alive, 2 are still MRD-negative after allo-HSCT. One of these patients relapsed after the first UCART19 infusion, received a second infusion, and achieved an MRD-negative CR that enabled transplant.
The remaining 3 patients who are still alive did not undergo transplant. One of these patients relapsed after achieving MRD-positive remission, and 1 relapsed after MRD-negative remission. The third patient relapsed and received a second UCART19 infusion. This patient has yet to respond to the second infusion but has minimal follow-up.
Recruitment in this study is ongoing at the higher dose level—6 to 8 x 10⁷ total cells.
*Data in the abstract were updated in the presentation.
New consensus on inpatient opioid use
SHM’s new recommendations to improve opioid prescribing for acute, noncancer pain in hospitalized adults will be the focus of Monday (April 9) morning’s session, “Opioids: What Now?”
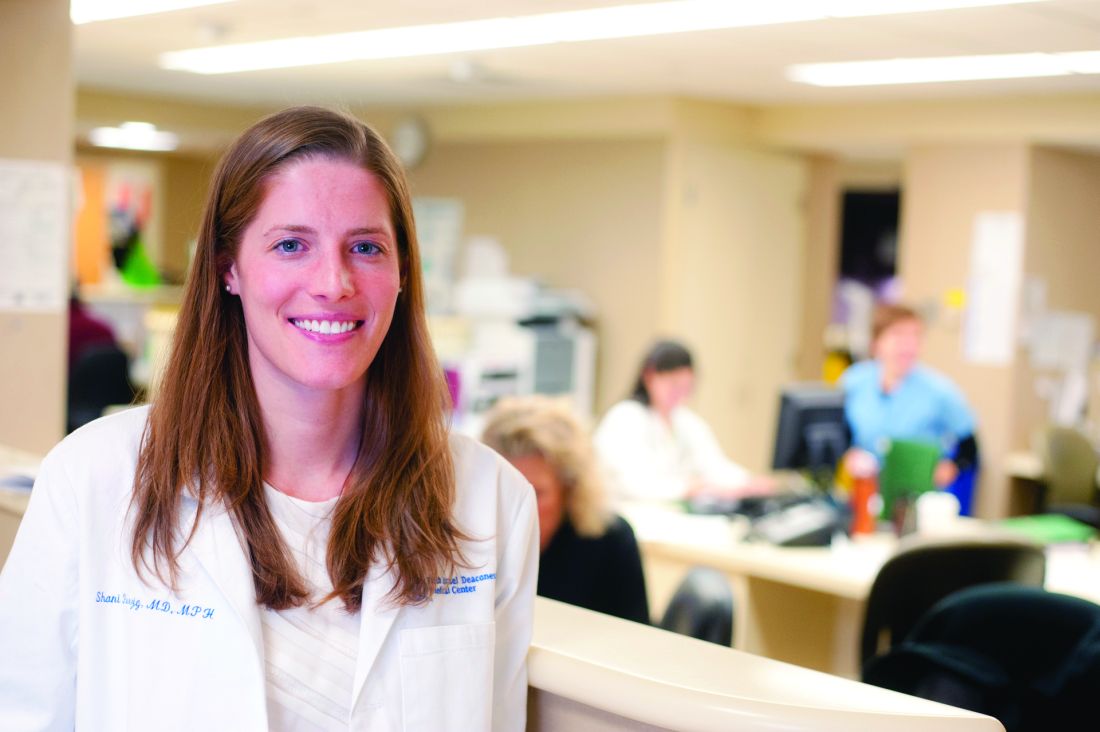
Many patients who wind up on opioids for chronic pain start on the medications in an acute pain setting, said presenter Shoshana J. Herzig, MD, MPH, director of hospital medicine research at Beth Israel Deaconess Medical Center and assistant professor of medicine at Harvard Medical School, both in Boston.
“Our prescribing patterns in the setting of acute pain meaningfully impact downstream outcomes and prescribing practices,” she said. “The degree of importance related to this topic often is underestimated by hospitalists, because we think of it as a more straightforward situation – prescribing for acute pain. In reality, there are nuances to it, and we have data to show that it’s not done well a lot of the time. It’s a big problem.”
During the session, “we’re going to do a case-based review that highlights the main points of the SHM consensus statement, just published in the Journal of Hospital Medicine [April issue],” Dr. Herzig said. She led the working group that developed the consensus statement. It features 16 suggestions to help hospital-based physicians appropriately employ opioids as part of their acute pain management strategies.
The copresenter will be Teryl K. Nuckols, MD, FHM, associate professor of medicine at the University of California, Los Angeles, and director of the division of internal medicine and associate professor of medicine at Cedars-Sinai Medical Center, Los Angeles. Dr. Nuckols was senior author of the JHM articles.
The presentation will assess the state of opioid prescribing in hospitalized patients and the challenges to acute pain management in hospitalized adults and explain how to improve prescribing practices to prevent opioid-related adverse events, opioid-use disorder, and long-term opioid use. Dr. Herzig and Dr. Nuckols will discuss how their group developed the new consensus statement by culling the key points from other physician group guidelines and present several case studies for interactive discussion to showcase the consensus statement suggestions. They also will go over topics in need of future research.
“We hope that attending the session and reading over the consensus statement will help to improve the appropriateness as well as the safety of opioid prescribing in the setting of acute pain in the hospital and help physicians recognize common pitfalls,” Dr. Herzig said. These include not remembering to combine opioids with nonopioid-based pharmacologic therapy; inappropriately continuing a patient on intravenous opioids when oral opioids, which have a lower risk of adverse outcomes, would suffice; and being able to identify patients at increased risk for opioid-related adverse events for whom a dose reduction or increased monitoring may be warranted.
Hospitalists should continue to strive to achieve a proper balance with opioids between offering adequate analgesia for their patients and the risk of adverse events, she said. “The need for judicious prescribing is our main take-home message. I hope that people leave with a better understanding of what a reasonable amount of opioids to prescribe on discharge looks like.”
Dr. Herzig receives financial compensation from SHM for her role as senior deputy editor of the Journal of Hospital Medicine (unrelated to the present work).
Opioids: What Now?
Monday, April 10:35-11:35 a.m.
Crystal Ballroom G1/A&B
SHM’s new recommendations to improve opioid prescribing for acute, noncancer pain in hospitalized adults will be the focus of Monday (April 9) morning’s session, “Opioids: What Now?”
Many patients who wind up on opioids for chronic pain start on the medications in an acute pain setting, said presenter Shoshana J. Herzig, MD, MPH, director of hospital medicine research at Beth Israel Deaconess Medical Center and assistant professor of medicine at Harvard Medical School, both in Boston.
“Our prescribing patterns in the setting of acute pain meaningfully impact downstream outcomes and prescribing practices,” she said. “The degree of importance related to this topic often is underestimated by hospitalists, because we think of it as a more straightforward situation – prescribing for acute pain. In reality, there are nuances to it, and we have data to show that it’s not done well a lot of the time. It’s a big problem.”
During the session, “we’re going to do a case-based review that highlights the main points of the SHM consensus statement, just published in the Journal of Hospital Medicine [April issue],” Dr. Herzig said. She led the working group that developed the consensus statement. It features 16 suggestions to help hospital-based physicians appropriately employ opioids as part of their acute pain management strategies.
The copresenter will be Teryl K. Nuckols, MD, FHM, associate professor of medicine at the University of California, Los Angeles, and director of the division of internal medicine and associate professor of medicine at Cedars-Sinai Medical Center, Los Angeles. Dr. Nuckols was senior author of the JHM articles.
The presentation will assess the state of opioid prescribing in hospitalized patients and the challenges to acute pain management in hospitalized adults and explain how to improve prescribing practices to prevent opioid-related adverse events, opioid-use disorder, and long-term opioid use. Dr. Herzig and Dr. Nuckols will discuss how their group developed the new consensus statement by culling the key points from other physician group guidelines and present several case studies for interactive discussion to showcase the consensus statement suggestions. They also will go over topics in need of future research.
“We hope that attending the session and reading over the consensus statement will help to improve the appropriateness as well as the safety of opioid prescribing in the setting of acute pain in the hospital and help physicians recognize common pitfalls,” Dr. Herzig said. These include not remembering to combine opioids with nonopioid-based pharmacologic therapy; inappropriately continuing a patient on intravenous opioids when oral opioids, which have a lower risk of adverse outcomes, would suffice; and being able to identify patients at increased risk for opioid-related adverse events for whom a dose reduction or increased monitoring may be warranted.
Hospitalists should continue to strive to achieve a proper balance with opioids between offering adequate analgesia for their patients and the risk of adverse events, she said. “The need for judicious prescribing is our main take-home message. I hope that people leave with a better understanding of what a reasonable amount of opioids to prescribe on discharge looks like.”
Dr. Herzig receives financial compensation from SHM for her role as senior deputy editor of the Journal of Hospital Medicine (unrelated to the present work).
Opioids: What Now?
Monday, April 10:35-11:35 a.m.
Crystal Ballroom G1/A&B
Deaths in patients on emicizumab
Two hemophilia organizations have notified the public of 5 deaths in adult patients receiving emicizumab (Hemlibra).
All 5 deaths—occurring in 2016 (n=1), 2017 (n=2), and this year (n=2)—were deemed unrelated to emicizumab by the investigator or treating physician.
The National Hemophilia Foundation and Hemophilia Federation of America reported these deaths after receiving notifications from Genentech.
The company said it has limited information about the circumstances of the deaths.
However, Genentech did say the 2016 death, 1 of the 2017 deaths, and 1 of the 2018 deaths occurred in patients receiving emicizumab via a compassionate use program.
Compassionate use of emicizumab has been available on a case-by-case basis, following a request to Roche from a patient’s treating physician, if the patient has a serious or life-threatening condition, has exhausted all other treatment options, and is unable to participate in a clinical trial.
The other death in 2017 occurred in a patient on the phase 3 HAVEN 1 trial and was reported along with the other results from that trial.
The remaining death in 2018 was in a patient receiving emicizumab via an expanded access protocol.
This protocol, which was reviewed by the US Food and Drug Administration, allowed US patients who were not participating in a clinical trial of emicizumab but who met eligibility criteria similar to key studies to have access to emicizumab prior to approval, which occurred in November 2017.
In response to the deaths, Genentech has pledged to share information on any adverse events that impact the overall benefit/risk profile of emicizumab.
“We are committed to providing timely and transparent updates on the safety profile of Hemlibra to health authorities, healthcare professionals, and the hemophilia community,” the company said.
For more information, patients and healthcare providers can call Genentech’s medical communications line at 1-800-821-8590.
CHMP supports expanded approval for fosaprepitant

The European Medicines Agency’s Committee for Medicinal Products for Human Use (CHMP) has recommended changing the terms of marketing authorization for fosaprepitant (Ivemend).
The product is already approved in the European Union (EU) for the prevention of acute and delayed nausea and vomiting associated with moderately or highly emetogenic cancer chemotherapy in adults.
Now, the CHMP is recommending that fosaprepitant be authorized for the same indication in pediatric patients age 6 months and older.
As it is in adults, fosaprepitant would be given to children as part of combination therapy.
The CHMP’s opinion on fosaprepitant will be reviewed by the European Commission (EC).
If the EC agrees with the CHMP, the commission will grant a centralized marketing authorization that will be valid in the EU. Norway, Iceland, and Liechtenstein will make corresponding decisions on the basis of the EC’s decision.
The EC typically makes a decision within 67 days of the CHMP’s recommendation.
Merck Sharp & Dohme Corp., the company developing fosaprepitant, has conducted a phase 2 trial assessing the pharmacokinetics, pharmacodynamics, safety, and tolerability of fosaprepitant for the prevention of chemotherapy-induced nausea and vomiting in children.
Patients ages 2 to 17 were randomized to receive 1 of 4 doses of fosaprepitant (0.4 mg/kg, 1.2 mg/kg, 3 mg/kg, and 5 mg/kg) or placebo in cycle 1. All patients also received ondansetron, with or without dexamethasone. Patients ages 0 to 11 were invited to participate in optional cycles 2 to 6, during which they received fosaprepitant at 3 mg/kg or 5 mg/kg.
Results from this trial have been posted on its clinicaltrials.gov page (NCT01697579).
ciTBI uncommon in minor head injuries with isolated vomiting
said Meredith L. Borland, MD, of the Princess Margaret Hospital for Children, Perth, Australia, and her associates.
Likewise, traumatic brain injury evident on computed tomography (TBI-CT) is rare in such cases.
In a study published in Pediatrics, 19,920 eligible children younger than 18 years were enrolled in the Australasian Paediatric Head Injury Rule Study (APHIRST); 3,389 had a history of any vomiting, and 1,006 had isolated vomiting without any other clinical decision rules predictors. Results found 76 of the 172 (44%) children with a ciTBI and 123 of the 285 (43%) children with TBI-CT had any history of vomiting. When the Children’s Head Injury Algorithm for the Prediction of Important Clinical Events (CHALICE) rule predictors for those with isolated vomiting – both fewer than three times (n = 662 of 1,006; 66%) and also three or more times (n = 344 of 1,006; 34%) – was applied, there was only one child with ciTBI, and there were only two children with a TBI-CT.
Within the subsample comprising 457 children younger than 2 years old with isolated vomiting out of the overall 1,006 (45%), there were none with ciTBI or TBI-CT. In the 549 (55%) children 2 years old and older with isolated vomiting, one (0.3%) had ciTBI, and two (0.6%) had TBI-CT.
In multivariate regression, signs of skull fracture, altered mental status, headache, and acting abnormally were significantly associated with ciTBI. Signs of a skull fracture, nonaccidental injury concern, headache, and acting abnormally were significantly associated with TBI-CT.
“TBI-CT is uncommon, and ciTBI is uncommon in children with minor blunt head injury when vomiting is their only sign or symptom,” Dr. Borland and her associates concluded. “In children with isolated vomiting, strategies such as observation should be considered before conducting an immediate CT scan.”
Read the full study in Pediatrics.
FROM PEDIATRICS
New tracks bring focus to HM18 program
The theme for HM18 could well be “in with the new, and in with the new.”
Conference planners have managed to pack HM18 with five new tracks: Great Debate, Nurse Practitioner/Physician Assistant (NP/PA), Palliative Care, Seasoning Your Career, and a new Career Development workshop track. And they did this while eliminating only one track that was on the schedule last year – Technology – and without adding any extra days to the meeting.
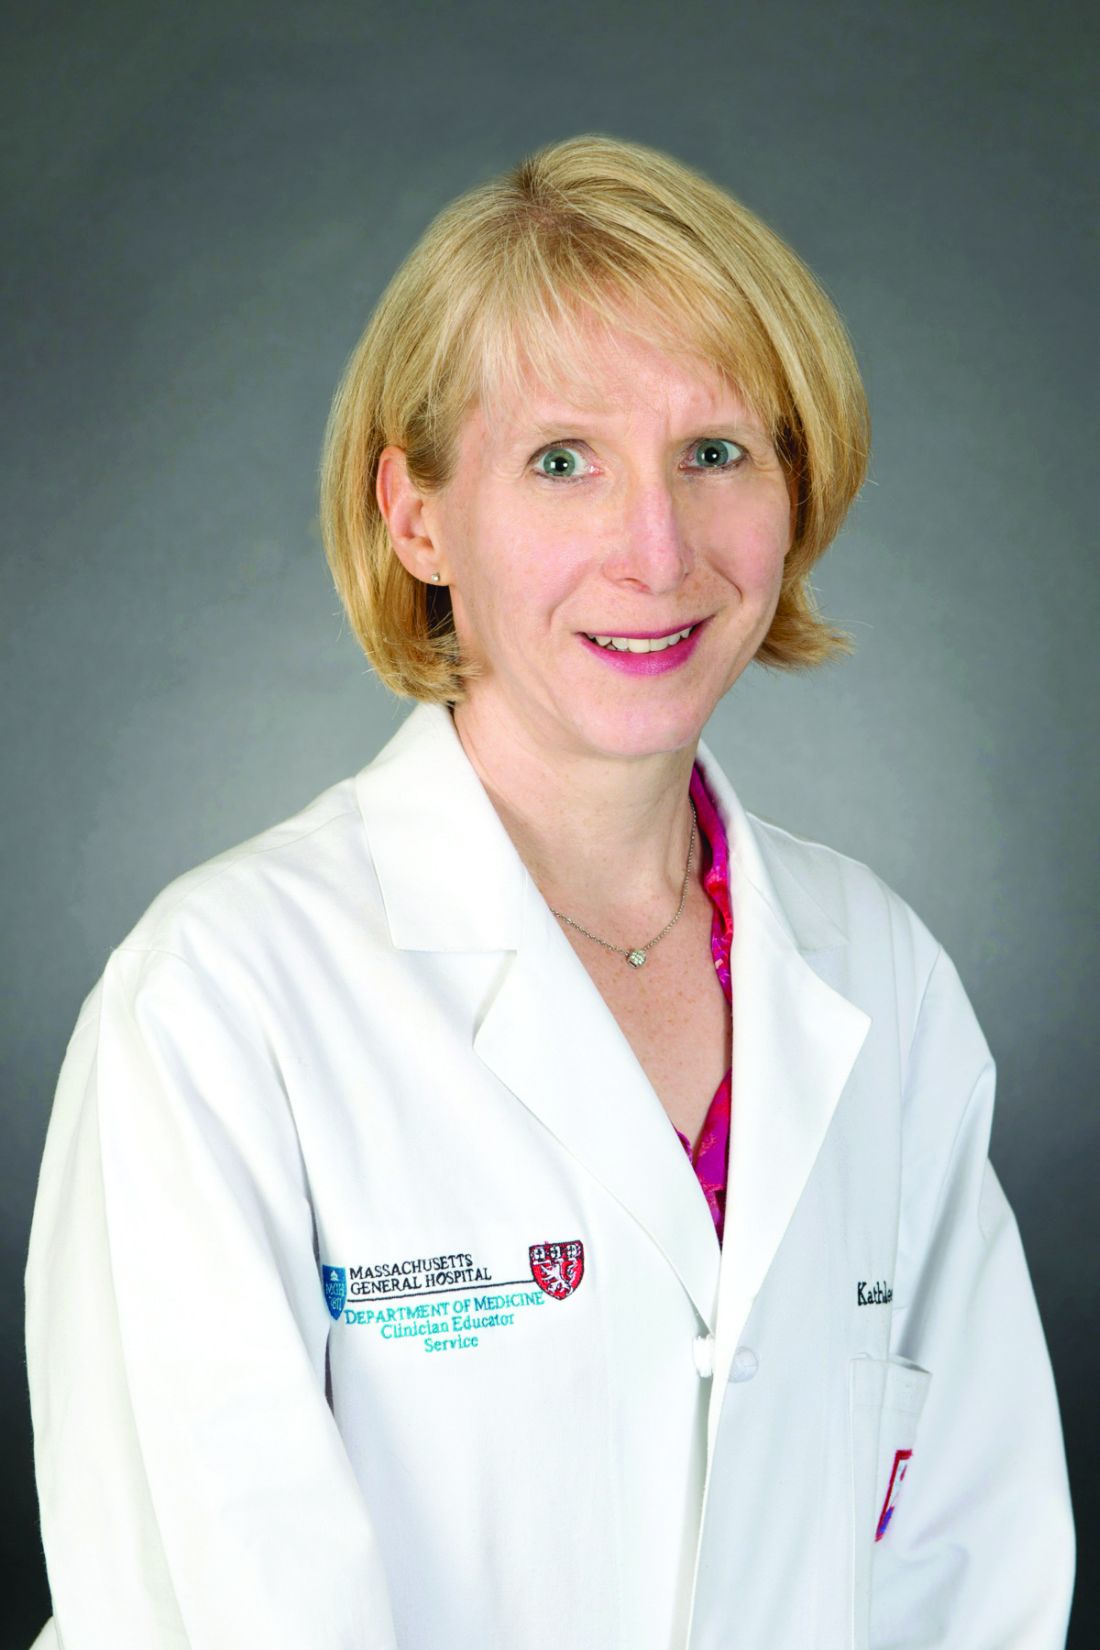
The trick was including more half-day tracks. With more tracks in smaller time chunks, the schedule provides more flexibility, and attendees have more choices to find what they’re looking for, said Kathleen Finn, MD, MPhil, SFHM, an assistant professor of medicine at Harvard Medical School, Boston, and the HM18 course director.
“We decided, since there were a bunch of themes that we really wanted to cover, we would do half-day tracks. The shorter tracks also are a way to gauge interest in a topic without making a big commitment to it,” Dr. Finn said. “The grouping of topics in smaller tracks in the Day-at-a-Glance helps people easily see a collection of lectures or a theme they might want to attend.”
While choosing themes for the conference, the planners were trying to stay true to their own theme: timeliness.
Assistant course director Dustin Smith, MD, SFHM, an associate professor of medicine at Emory University, Atlanta, said much of the information for this year’s conference came from the 2017 annual meeting, including attendance at sessions, speaker reviews, and session ratings.
“It’s building on momentum from the previous meeting,” he said. “Sometimes we choose things to offer that we know are going to go well, and sometimes we choose things that we hope go well, and all of a sudden we see [that they] go very, very well.” For instance, he said, the topic of sepsis was so popular last year that it has its own pre-course this year.
The data on which the HM18 program is built don’t stop there. The 23 members of the planning committee all bring their own thoughts and experiences, as well as input from colleagues at their own centers. Then there are the submissions for workshop topics: Any SHM member can submit an idea, and those ideas help organizers see patterns of interest that can affect the planning of the rest of the sessions.
Here are more details on the new tracks:
Great Debate
The annual meeting has traditionally had a “Great Debate” on perioperative medicine, but the format – with carefully chosen speakers who are dynamic and entertaining – will be used to cover pulmonary medicine and infectious diseases this year as well.
“It’s a hugely successful talk,” Dr. Finn said. “We can tell by our numbers that lots of people go, and it’s always funny, and it’s a very clever way of discussing the latest literature – by having two very dynamic speakers present a case and then debate the two options of the case and then use the literature to support the answer.”
NP/PA
This track includes topics that are chosen by the committee for advanced practice professionals.
“There are many hospitalist programs that include NP/PAs, and everybody is struggling with how best to incorporate NPs and PAs into the group practice and have everybody work at the top of their license and work well together,” Dr. Finn said.
“The idea, too, is to be very inclusive of all providers and offering a track that focuses on NP/PAs but also includes physicians, physician leaders, and physician administrators,” Dr. Smith said. “It’s not designed for one type of practicing professional; it should be a good educational track for all.”
Palliative Care
This was a topic that had been sprinkled throughout programs in previous years, but Dr. Finn and Dr. Smith said it was considered too important not to have its own track this year.
“I think hospitalists often are the doctors caring for patients at the end of their lives since many Americans die in the hospital,” Dr. Finn said. “As a result, this is a skill set that as hospitalists we need to be very good at.”
Seasoning Your Career
This is a track geared toward one of this year’s themes: With “hospital medicine” now a concept that’s more than 2 decades old, how do hospitalists keep up the momentum in their careers, how do they take stock, how do they make the important decisions they face as they move ahead in their jobs?
“Hospital medicine is now more than 20 years old – many hospitalists are now mid-career,” Dr. Finn said. “This track can help people reflect on and rethink their career. Do you want to expand what you’re doing? Do you want to change it? How do you make this a lifelong career?”
Career Development
There have always been workshops with a career-development focus, but this year, six of them were chosen to be placed under the heading of an official “Career Development” workshop track.
“Are there other skills you want to take on for the second half of your career?” Dr. Finn said. “Do you want to take on leadership? Do you want to learn how to better give your peers feedback? Do you want to promote women in your group? Do you want to prevent burnout or use emotional intelligence to improve your career?”
Aside from the new tracks, the course directors also drew attention to other new elements of the HM18 program.
For instance, there are new topics in the Rapid Fire sessions. In the “Managing the Patient on Your Service: Appendicitis, Bowel, and Biliary Obstruction” session, a general surgeon will talk about how to manage these surgical issues when the patient is on a medical service. In “Interventional Radiology: What Every Hospitalist Needs to Know,” an interventional radiologist will discuss when hospitalists may want to call in an interventional radiologist or refer to a hospital that has an interventional radiologist. And “Vulnerable Populations and Hospitalists” will focus on social determinants of health.
As for catchy Disney-influenced titles, such as “The Mad Hatter: Updates in Delirium” and “Waiting in Line for ‘It’s a Small World’ and Other Things We Do for No Reason,” part of the credit can go to Dr. Finn’s niece. She said she “hired” her to come up with a list of Disney, Pixar, and Harry Potter movies and catchphrases. Then the committee worked them into the session titles.
“One of the hopes for me at this meeting is that people bring their inner child and explore new ideas, new topics, and new career possibilities,” Dr. Finn said.
The theme for HM18 could well be “in with the new, and in with the new.”
Conference planners have managed to pack HM18 with five new tracks: Great Debate, Nurse Practitioner/Physician Assistant (NP/PA), Palliative Care, Seasoning Your Career, and a new Career Development workshop track. And they did this while eliminating only one track that was on the schedule last year – Technology – and without adding any extra days to the meeting.
The trick was including more half-day tracks. With more tracks in smaller time chunks, the schedule provides more flexibility, and attendees have more choices to find what they’re looking for, said Kathleen Finn, MD, MPhil, SFHM, an assistant professor of medicine at Harvard Medical School, Boston, and the HM18 course director.
“We decided, since there were a bunch of themes that we really wanted to cover, we would do half-day tracks. The shorter tracks also are a way to gauge interest in a topic without making a big commitment to it,” Dr. Finn said. “The grouping of topics in smaller tracks in the Day-at-a-Glance helps people easily see a collection of lectures or a theme they might want to attend.”
While choosing themes for the conference, the planners were trying to stay true to their own theme: timeliness.
Assistant course director Dustin Smith, MD, SFHM, an associate professor of medicine at Emory University, Atlanta, said much of the information for this year’s conference came from the 2017 annual meeting, including attendance at sessions, speaker reviews, and session ratings.
“It’s building on momentum from the previous meeting,” he said. “Sometimes we choose things to offer that we know are going to go well, and sometimes we choose things that we hope go well, and all of a sudden we see [that they] go very, very well.” For instance, he said, the topic of sepsis was so popular last year that it has its own pre-course this year.
The data on which the HM18 program is built don’t stop there. The 23 members of the planning committee all bring their own thoughts and experiences, as well as input from colleagues at their own centers. Then there are the submissions for workshop topics: Any SHM member can submit an idea, and those ideas help organizers see patterns of interest that can affect the planning of the rest of the sessions.
Here are more details on the new tracks:
Great Debate
The annual meeting has traditionally had a “Great Debate” on perioperative medicine, but the format – with carefully chosen speakers who are dynamic and entertaining – will be used to cover pulmonary medicine and infectious diseases this year as well.
“It’s a hugely successful talk,” Dr. Finn said. “We can tell by our numbers that lots of people go, and it’s always funny, and it’s a very clever way of discussing the latest literature – by having two very dynamic speakers present a case and then debate the two options of the case and then use the literature to support the answer.”
NP/PA
This track includes topics that are chosen by the committee for advanced practice professionals.
“There are many hospitalist programs that include NP/PAs, and everybody is struggling with how best to incorporate NPs and PAs into the group practice and have everybody work at the top of their license and work well together,” Dr. Finn said.
“The idea, too, is to be very inclusive of all providers and offering a track that focuses on NP/PAs but also includes physicians, physician leaders, and physician administrators,” Dr. Smith said. “It’s not designed for one type of practicing professional; it should be a good educational track for all.”
Palliative Care
This was a topic that had been sprinkled throughout programs in previous years, but Dr. Finn and Dr. Smith said it was considered too important not to have its own track this year.
“I think hospitalists often are the doctors caring for patients at the end of their lives since many Americans die in the hospital,” Dr. Finn said. “As a result, this is a skill set that as hospitalists we need to be very good at.”
Seasoning Your Career
This is a track geared toward one of this year’s themes: With “hospital medicine” now a concept that’s more than 2 decades old, how do hospitalists keep up the momentum in their careers, how do they take stock, how do they make the important decisions they face as they move ahead in their jobs?
“Hospital medicine is now more than 20 years old – many hospitalists are now mid-career,” Dr. Finn said. “This track can help people reflect on and rethink their career. Do you want to expand what you’re doing? Do you want to change it? How do you make this a lifelong career?”
Career Development
There have always been workshops with a career-development focus, but this year, six of them were chosen to be placed under the heading of an official “Career Development” workshop track.
“Are there other skills you want to take on for the second half of your career?” Dr. Finn said. “Do you want to take on leadership? Do you want to learn how to better give your peers feedback? Do you want to promote women in your group? Do you want to prevent burnout or use emotional intelligence to improve your career?”
Aside from the new tracks, the course directors also drew attention to other new elements of the HM18 program.
For instance, there are new topics in the Rapid Fire sessions. In the “Managing the Patient on Your Service: Appendicitis, Bowel, and Biliary Obstruction” session, a general surgeon will talk about how to manage these surgical issues when the patient is on a medical service. In “Interventional Radiology: What Every Hospitalist Needs to Know,” an interventional radiologist will discuss when hospitalists may want to call in an interventional radiologist or refer to a hospital that has an interventional radiologist. And “Vulnerable Populations and Hospitalists” will focus on social determinants of health.
As for catchy Disney-influenced titles, such as “The Mad Hatter: Updates in Delirium” and “Waiting in Line for ‘It’s a Small World’ and Other Things We Do for No Reason,” part of the credit can go to Dr. Finn’s niece. She said she “hired” her to come up with a list of Disney, Pixar, and Harry Potter movies and catchphrases. Then the committee worked them into the session titles.
“One of the hopes for me at this meeting is that people bring their inner child and explore new ideas, new topics, and new career possibilities,” Dr. Finn said.
Product Theaters
Monday, April 9
12:15 - 1:15 p.m., Product Theater 1
Resetting Chronic HF Therapy in Hospitalized Patients with HFrEF
Richard Wright, MD
Chairman of the Board, Pacific Heart Institute
Santa Monica, CA
Sponsored by Novartis Pharmaceuticals
12:15 - 1:15 p.m., Product Theater 2
The Role of the Hospitalist in Hepatic Encephalopathy
Hameed Q. Ali, DO, FHM
Clinical Assistant Professor
Department of Internal Medicine
Texas A&M Health Science Center
Temple, Texas
Sponsored by Salix Pharmaceuticals
12:15 - 1:15 p.m., Product Theater 3
Clinical Data and Real-World Evidence to Support NVAF Treatment Decision Making
James F. Neuenschwander II, MD, FACEP
Research Director in the Emergency Department and Attending Physician
Genesis Healthcare Systems
Zanesville, Ohio
Sponsored by Janssen Pharmaceuticals
Tuesday, April 10
12:30 - 1:30 p.m., Product Theater 1
Expert Conversations in Heart Failure: Connecting the Pieces
Thomas Arne, Jr., DO, FACC
Sergey Kachur, MD
Sponsored by Novartis Pharmaceuticals
12:30 - 1:30 p.m., Product Theater 2 Opioid-Induced Constipation
Jeff Gudin, MD
Director, Pain and Palliative Care
Englewood Hospital and Medical Center
Englewood, NJ
Sponsored by Salix Pharmaceuticals
12:30 - 1:30 p.m., Product Theater 3
Challenges of Treating DVT and PE in the Hospital and After Discharge
Dr. Andrew Miller, Emergency Medicine, Lehigh Valley Hospital, Allentown, PA
Sponsored by Pfizer
Value over volume
Kate Goodrich, MD, MHS, chief medical officer at the Centers for Medicare & Medicaid Services, opens HM18 on April 9 with a plenary talk focused on the rising cost of health care in the United States, and how hospitalists can be part of the solution.
“What I want people to understand is the evolution within our health care system from one where we pay for volume to paying for value, and the role that Medicare can play in that,” Dr. Goodrich said in an interview. “Medicare has traditionally been sort of a passive payer, if you will, a passive payer of claims without a great deal of emphasis on the cost of care and the quality of care. [Now there is] a groundswell of concern nationally, not just here at CMS but nationwide, around the rising cost of care, and our quality of care is not as good as it should be for the amount that we spend.”
Dr. Goodrich said she will discuss how “that came to be, and what CMS and other payers in the country are trying to do about it.” She said the U.S. is in a “truly transformative era in our health care system in changing how we pay for care, in service of better outcomes for patients and lower costs. I would like to give attendees the larger picture, of how we got here and what’s happening both at CMS and nationally to try and reverse some of those trends.”
As value-based purchasing programs – and the push to pay for value over volume in Medicare and the private sector – continue to become the norm, the expected trend of sicker, more complex patients entering the hospital already is happening, Dr. Goodrich said. She is experiencing it in her own clinical work, which continues in addition to her role at CMS.
“I can confirm from my own personal experience [that] I have absolutely encountered that exact trend,” she said. “I feel like every time I go in the hospital, my patients are sicker and more complex. That is the population of patients that hospitalists are dealing with. That’s why we are actually in that practice. We enjoy taking care of those types of patients and the challenges they bring, both on a clinical level, but I would say also even on a social and economic level.”
Dr. Goodrich said that trend will present one of the key challenges hospitalists face in the future, especially as paying for value entails more two-sided risk.
“In a value-based purchasing world, transitioning to payments based on quality and cost is harder, because by nature the sicker patients cost more and it is harder to improve their outcomes. They come to you already quite sick,” she said. “That’s a dilemma that a lot of hospitalists face, wondering ‘How is this going to affect me if I am already seeing the sickest of the sick?’”
Integration of data and technology innovation will be critical to better serving this sicker population, but physicians currently spend too much time entering data into computers and don’t get much useful information out of it.
“How do we make [health care IT] usable for the average front-line nurse or doctor who didn’t go to school to learn how to code and analyze data?” Dr. Goodrich asked. “How do we get platforms and analytics that are developed using human-centered design principles to make it very understandable and actionable to the front-end clinician, but also to patients and consumers? What is really needed to truly drive improvement is not just access to the data but usability.”
She said this problem is directly related to the usability of electronic health records. “That is a significant focus right now for the Office of the National Coordinator [of Health Information Technology] – to move away from just [adopting] EHRs, to promoting interoperability and also the usability aspects that exactly get to the problems we’ve identified.”
Welcome to Orlando and HM18
Welcome to HM18 and Orlando! This is the annual conference’s first time in Orlando, a city dubbed “the happiest place on earth,” which conjures up magic and curiosity and brings out the kid in everyone. As Walt Disney noted, “Adults are only kids, grown up.” So we hope you have brought your sense of adventure and curiosity, as we have a lot planned for you!
Over the next 3 days, we invite you to network with nearly 5,000 hospitalist colleagues from around the “small world.” Introduce yourself to total strangers and discover you have a lot in common. This conference provides a wonderful opportunity to share best practices and discuss ideas.
Please have fun taking advantage of the wide array of learning opportunities the Annual Conference Committee developed for HM18. We hope the topics will grab your interest and pique your curiosity. We encourage you (and your inner kid) to try on new ideas, attend lectures that catch your eye, and roll up your sleeves to dive into interactive workshops. For extra fun, the committee created catchy Orlando-themed titles for many of the talks. We hope they make you smile!
The Annual Conference Committee members will be wearing large buttons to identify themselves. We welcome any feedback about the meeting. Please take the time to share your thoughts with us, and we are happy to help in any way. The committee members worked hard to create a pre-course day and meeting with something for everyone, knowing there is great diversity under the hospitalist tent. We also strove to make it relevant and timely. The driving force behind the content was “What do practicing hospitalists need and want to know now?”
HM18 contains an abundance of clinical content. Enjoy the 2 days of Clinical Update talks to hear the latest evidence from a diversity of fields. New this year is Updates in Addiction Medicine, given the large opioid crisis that affecting health care. There are 3 days of Rapid Fire talks to answer the clinical questions we all have while caring for patients. The Perioperative/Co-Management track is back with is unique and useful content. We even repeat some of the most popular talks on Tuesday, so you will be able to attend all the “can’t miss” sessions.
New this year is a focus on careers and how to make yours enjoyable and sustainable. Hospital medicine is more than 20 years old, and there are increasing numbers of mid-career hospitalists. The Career Development track offers a series of topics in case you want to spice up your current role, change your schedule, or plan for retirement. Accompanying this are career development workshops that provide practical skills to do just that.
We have also added a new NP/PA track, a palliative care track, and The Great Debate track. Come watch two entertaining speakers have a “smackdown” on a clinical topic. You’ll learn something while laughing.
We’ve also brought back your favorites: practice management, quality, high value care, diagnostic reasoning, academic/research, pediatrics, medical education, and health policy tracks. Don’t forget to check out our interactive workshops. Nearly 150 workshop ideas were submitted, and we are proud to feature 18 of the best.
Of course, you must attend the highly anticipated Updates in Hospital Medicine talk and Plenary Sessions, and be sure to catch the Research, Innovations, and Clinical Vignettes (RIV) Poster Competition. Check out the Exhibit Hall and join a Special Interest Forum! Remember to download the SHM events app, and make sure you get your MOC credit from 34 different lectures.
This conference would not be possible without the tireless effort of SHM staff and leadership, our amazing speakers and faculty, and the committee members. We are excited you are here, and we hope this conference nurtures your curiosity, expands your career, and provides you with valuable educational and networking opportunities.
We sincerely thank you for attending HM18! Enjoy Orlando.
Dr. Finn is an assistant professor of medicine at Harvard Medical School, Boston, and course director of HM18.