User login
Richner-Hanhart Syndrome (Tyrosinemia Type II)
To the Editor:
Richner-Hanhart syndrome, also known as tyrosinemia type II or oculocutaneous tyrosinemia, is a rare autosomal-recessive, childhood-onset, metabolic hereditary disease.1 A deficiency of tyrosine aminotransferase leads to an accumulation of tyrosine amino acid. It is characterized by the association of palmoplantar hyperkeratosis, bilateral keratitis, and neurological disorders.
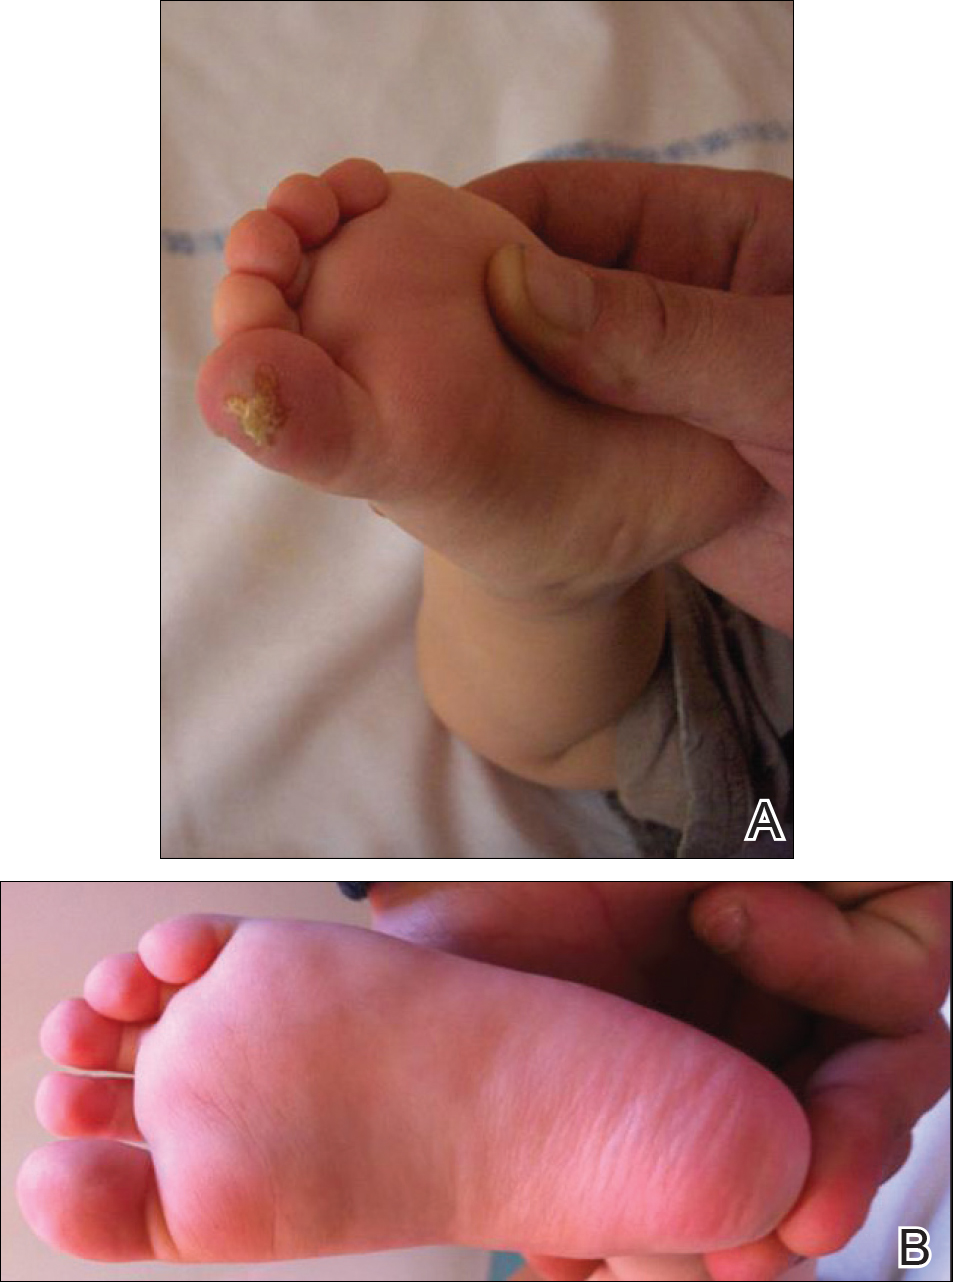
An 18-month-old girl with recurrent warts of 6 months' duration was admitted to the dermatology department. She had been treated repeatedly with acyclovir for recurrent bilateral herpetic keratitis with major photophobia since 9 months of age with no response. Clinical presentation included punctate hyperkeratosis of the fingers and toes (Figure, A), severe photophobia with decreased visual acuity, and speech delay.
Her medical record showed a break of the growth curve with a weight of 9.25 kg (3rd percentile), a height of 80 cm (50th percentile), and a head circumference of 45 cm (50th percentile). Her parents were nonconsanguineous. The association of bilateral dendritic keratitis with punctate palmoplantar keratosis suggested a diagnosis of Richner-Hanhart syndrome. Diagnosis was confirmed by an elevated plasma level of tyrosine (1580 µmol/L; reference range, 40-80 µmol/L).
A low tyrosine and low phenylalanine diet (no animal proteins) was immediately introduced, with supplementation of amino acids, vitamins, and trace elements. After 8 days, the plasma level of tyrosinemia decreased by a factor of 4 (392 µmol/L). After 1 month, the cutaneous and ocular lesions completely resolved (Figure, B). Discrete psychomotor slowing still persisted for 1 year and then reached complete normalization. Genetic analysis showed a composite heterozygous mutation of the tyrosine aminotransferase gene, TAT, on chromosome 16. The mutation detected in the patient's mother was an A to V substitution at codon 147 (A147V). The second mutation was detected in the father; it was an 8 nucleotides duplication and then a substitution leading to a premature stop codon at codon 37 (R37X).
Richner-Hanhart syndrome is a rare autosomal-recessive disorder that is more common in Italy and in areas where inbreeding is prevalent1,2; however, no data are available on disease prevalence. It is caused by a homozygous mutation in the TAT gene located on chromosome 16q22.3 Tyrosine aminotransferase is an important enzyme involved in the tyrosine and phenylalanine metabolic degradation pathway located in the hepatic cytosol. Symptoms are due to the accumulation of tyrosine and its metabolite. Diagnosis is confirmed by an elevated plasma level of tyrosine (>500 µmol/L). This oculocutaneous syndrome is characterized by bilateral pseudodendritic keratitis, palmoplantar hyperkeratosis, and a variable degree of mental retardation.1 In contrast to tyrosinemia type II, types I and III do not affect the skin.
Intrafamilial and interfamilial phenotypic variability is reported. A large spectrum of mutations within the TAT gene have been reported.4-7 These mutations lead to a reduction or an absence in the activity of hepatic tyrosine aminotransferase. The degradation pathway of tyrosine involving TAT occurs mainly in the liver. This process also is present in the mitochondria where the enzyme is called aspartate aminotransferase.1,2 The mechanism by which Richner-Hanhart syndrome causes painful palmoplantar keratosis and keratitis remains unknown. It has been suggested that intracellular L-tyrosine crystals initiate an inflammation process resulting in the typical skin lesions and keratitis.8 There is some evidence that patients with higher values of tyrosine in early life are more likely to develop neurological problems.1 In addition, phenotype variability has been observed, even among individuals sharing the same pathogenic mutation.4
Tyrosinemia type II typically demonstrates ocular symptoms (75% of cases) that usually occur in the first year of life.8 They are characterized by photophobia, redness, and increase of lacrimation. Examination reveals a superficial and bilateral punctate keratosis with corneal dystrophy, often misdiagnosed as herpetic keratosis, as in our case, which may delay the diagnosis.9,10 Bilateral ocular lesions are suggestive, even if they are asymmetric.8,11 Furthermore, negative fluorescein staining, negative culture, and resistance to antiviral treatment exclude the diagnosis of herpetic keratosis.9,10
Skin lesions (85% of cases) typically appear in the first year of life. They are characterized by painful, irregular, limited, punctate hyperkeratosis on the palms and soles.1 They are more frequent in weight-bearing areas and tend to improve during summer, possibly due to a seasonal change in dietary behavior.4,12 Hyperkeratotic papules in a linear pattern also have been described on the flexor aspects of the fingers or toes.13 In our case, the lesions were misdiagnosed as warts for 6 months.
Retarded development affects 60% of patients with tyrosinemia type II. Expression of neurological symptoms is variable and could include mental retardation, nystagmus, tremors, ataxia, and convulsion.4 Lifetime follow-up of these patients is recommended.
Early initiation of a tyrosine-phenylalanine-restricted diet in infancy is the most effective therapy for Richner-Hanhart syndrome.13 The enzyme phenylalanine hydroxylase normally converts the amino acid phenylalanine into amino acid tyrosine. Thus, dietary treatment of Richner-Hanhart syndrome requires restricting or eliminating foods high in phenylalanine and tyrosine with protein "medical food" substitute. The dietary treatment allows resolution of both eye and skin symptoms after a few days or weeks and also may prevent mental retardation. It is effective in lowering the plasma level to less than 400 µmol/L. The diet must be introduced as soon as Richner-Hanhart syndrome is suspected. Supplementation with essential amino acids, vitamins, and trace elements is needed. Early screening of siblings in families with Richner-Hanhart syndrome history is recommended, even in the absence of clinical findings. Careful dietary control of maternal plasma tyrosine level must be considered during future pregnancy for women.4,14,15
Richner-Hanhart syndrome should be suspected in patients demonstrating cutaneous lesions, especially palmoplantar keratosis associated with bilateral pseudodendritic corneal lesions unresponsive to antiviral therapy.
- Scott CR. The genetic tyrosinemias. Am J Med Genet C Semin Med Genet. 2006;142C:121-126.
- Meissner T, Betz RC, Pasternack SM, et al. Richner-Hanhart syndrome detected by expanded newborn screening. Pediatr Dermatol. 2008;25:378-380.
- Natt E, Kida K, Odievre M, et al. Point mutations in the tyrosine aminotransferase gene in tyrosinemia type II. Proc Natl Acad Sci USA. 1992;89:9297-9301.
- Charfeddine C, Monastiri K, Mokni M, et al. Clinical and mutational investigations of tyrosinemia type II in Northern Tunisia: identification and structural characterization of two novel TAT mutations. Mol Genet Metab. 2006;88:184-191.
- Legarda M, Wlodarczyk K, Lage S, et al. A large TAT deletion in a tyrosinaemia type II patient. Mol Genet Metab. 2011;104:407-409.
- Culic V, Betz RC, Refke M, et al. Tyrosinemia type II (Richner-Hanhart syndrome): a new mutation in the TAT gene. Eur J Med Genet. 2011;54:205-208.
- Pasternack SM, Betz RC, Brandrup F, et al. Identification of two new mutations in the TAT gene in a Danish family with tyrosinaemia type II. Br J Dermatol. 2009;160:704-706.
- Macsai MS, Schwartz TL, Hinkle D, et al. Tyrosinemia type II: nine cases of ocular signs and symptoms. Am J Ophthalmol. 2001;132:522-527.
- Kymionis GD, Kankariya VP, Kontadakis GA, et al. Isolated corneal pseudodendrites as the initial manifestation of tyrosinemia type II in monozygotic twins. J Pediatr Ophthalmol Strabismus.2012;49:E33-E36.
- Iskeleli G, Bilgeç MD, Arici C, et al. Richner-Hanhart syndrome (tyrosinemia type II): a case report of delayed diagnosis with pseudodendritic corneal lesion. Turk J Pediatr. 2011;53:692-694.
- Rehák A, Selim MM, Yadav G. Richner-Hanhart syndrome (tyrosinaemia-II)(report of four cases without ocular involvement). Br J Dermatol. 1981;104:469-475.
- Viglizzo GM, Occella C, Bleidl D, et al. Richner-Hanhart syndrome (tyrosinemia II): early diagnosis of an incomplete presentation with unusual findings. Pediatr Dermatol. 2006;23:259-261.
- Machino H, Miki Y, Kawatsu T, et al. Successful dietary control of tyrosinemia II. J Am Acad Dermatol. 1983;9:533-539.
- el-Badramany MH, Fawzy AR, Farag TI. Familial Richner-Hanhart syndrome in Kuwait: twelve-year clinical reassessment by a multidisciplinary approach. Am J Med Genet. 1995;60:353-355.
- Cerone R, Fantasia AR, Castellano E, et al. Pregnancy and tyrosinaemia type II. J Inherit Metab Dis. 2002;25:317-318.
To the Editor:
Richner-Hanhart syndrome, also known as tyrosinemia type II or oculocutaneous tyrosinemia, is a rare autosomal-recessive, childhood-onset, metabolic hereditary disease.1 A deficiency of tyrosine aminotransferase leads to an accumulation of tyrosine amino acid. It is characterized by the association of palmoplantar hyperkeratosis, bilateral keratitis, and neurological disorders.
An 18-month-old girl with recurrent warts of 6 months' duration was admitted to the dermatology department. She had been treated repeatedly with acyclovir for recurrent bilateral herpetic keratitis with major photophobia since 9 months of age with no response. Clinical presentation included punctate hyperkeratosis of the fingers and toes (Figure, A), severe photophobia with decreased visual acuity, and speech delay.
Her medical record showed a break of the growth curve with a weight of 9.25 kg (3rd percentile), a height of 80 cm (50th percentile), and a head circumference of 45 cm (50th percentile). Her parents were nonconsanguineous. The association of bilateral dendritic keratitis with punctate palmoplantar keratosis suggested a diagnosis of Richner-Hanhart syndrome. Diagnosis was confirmed by an elevated plasma level of tyrosine (1580 µmol/L; reference range, 40-80 µmol/L).
A low tyrosine and low phenylalanine diet (no animal proteins) was immediately introduced, with supplementation of amino acids, vitamins, and trace elements. After 8 days, the plasma level of tyrosinemia decreased by a factor of 4 (392 µmol/L). After 1 month, the cutaneous and ocular lesions completely resolved (Figure, B). Discrete psychomotor slowing still persisted for 1 year and then reached complete normalization. Genetic analysis showed a composite heterozygous mutation of the tyrosine aminotransferase gene, TAT, on chromosome 16. The mutation detected in the patient's mother was an A to V substitution at codon 147 (A147V). The second mutation was detected in the father; it was an 8 nucleotides duplication and then a substitution leading to a premature stop codon at codon 37 (R37X).
Richner-Hanhart syndrome is a rare autosomal-recessive disorder that is more common in Italy and in areas where inbreeding is prevalent1,2; however, no data are available on disease prevalence. It is caused by a homozygous mutation in the TAT gene located on chromosome 16q22.3 Tyrosine aminotransferase is an important enzyme involved in the tyrosine and phenylalanine metabolic degradation pathway located in the hepatic cytosol. Symptoms are due to the accumulation of tyrosine and its metabolite. Diagnosis is confirmed by an elevated plasma level of tyrosine (>500 µmol/L). This oculocutaneous syndrome is characterized by bilateral pseudodendritic keratitis, palmoplantar hyperkeratosis, and a variable degree of mental retardation.1 In contrast to tyrosinemia type II, types I and III do not affect the skin.
Intrafamilial and interfamilial phenotypic variability is reported. A large spectrum of mutations within the TAT gene have been reported.4-7 These mutations lead to a reduction or an absence in the activity of hepatic tyrosine aminotransferase. The degradation pathway of tyrosine involving TAT occurs mainly in the liver. This process also is present in the mitochondria where the enzyme is called aspartate aminotransferase.1,2 The mechanism by which Richner-Hanhart syndrome causes painful palmoplantar keratosis and keratitis remains unknown. It has been suggested that intracellular L-tyrosine crystals initiate an inflammation process resulting in the typical skin lesions and keratitis.8 There is some evidence that patients with higher values of tyrosine in early life are more likely to develop neurological problems.1 In addition, phenotype variability has been observed, even among individuals sharing the same pathogenic mutation.4
Tyrosinemia type II typically demonstrates ocular symptoms (75% of cases) that usually occur in the first year of life.8 They are characterized by photophobia, redness, and increase of lacrimation. Examination reveals a superficial and bilateral punctate keratosis with corneal dystrophy, often misdiagnosed as herpetic keratosis, as in our case, which may delay the diagnosis.9,10 Bilateral ocular lesions are suggestive, even if they are asymmetric.8,11 Furthermore, negative fluorescein staining, negative culture, and resistance to antiviral treatment exclude the diagnosis of herpetic keratosis.9,10
Skin lesions (85% of cases) typically appear in the first year of life. They are characterized by painful, irregular, limited, punctate hyperkeratosis on the palms and soles.1 They are more frequent in weight-bearing areas and tend to improve during summer, possibly due to a seasonal change in dietary behavior.4,12 Hyperkeratotic papules in a linear pattern also have been described on the flexor aspects of the fingers or toes.13 In our case, the lesions were misdiagnosed as warts for 6 months.
Retarded development affects 60% of patients with tyrosinemia type II. Expression of neurological symptoms is variable and could include mental retardation, nystagmus, tremors, ataxia, and convulsion.4 Lifetime follow-up of these patients is recommended.
Early initiation of a tyrosine-phenylalanine-restricted diet in infancy is the most effective therapy for Richner-Hanhart syndrome.13 The enzyme phenylalanine hydroxylase normally converts the amino acid phenylalanine into amino acid tyrosine. Thus, dietary treatment of Richner-Hanhart syndrome requires restricting or eliminating foods high in phenylalanine and tyrosine with protein "medical food" substitute. The dietary treatment allows resolution of both eye and skin symptoms after a few days or weeks and also may prevent mental retardation. It is effective in lowering the plasma level to less than 400 µmol/L. The diet must be introduced as soon as Richner-Hanhart syndrome is suspected. Supplementation with essential amino acids, vitamins, and trace elements is needed. Early screening of siblings in families with Richner-Hanhart syndrome history is recommended, even in the absence of clinical findings. Careful dietary control of maternal plasma tyrosine level must be considered during future pregnancy for women.4,14,15
Richner-Hanhart syndrome should be suspected in patients demonstrating cutaneous lesions, especially palmoplantar keratosis associated with bilateral pseudodendritic corneal lesions unresponsive to antiviral therapy.
- Scott CR. The genetic tyrosinemias. Am J Med Genet C Semin Med Genet. 2006;142C:121-126.
- Meissner T, Betz RC, Pasternack SM, et al. Richner-Hanhart syndrome detected by expanded newborn screening. Pediatr Dermatol. 2008;25:378-380.
- Natt E, Kida K, Odievre M, et al. Point mutations in the tyrosine aminotransferase gene in tyrosinemia type II. Proc Natl Acad Sci USA. 1992;89:9297-9301.
- Charfeddine C, Monastiri K, Mokni M, et al. Clinical and mutational investigations of tyrosinemia type II in Northern Tunisia: identification and structural characterization of two novel TAT mutations. Mol Genet Metab. 2006;88:184-191.
- Legarda M, Wlodarczyk K, Lage S, et al. A large TAT deletion in a tyrosinaemia type II patient. Mol Genet Metab. 2011;104:407-409.
- Culic V, Betz RC, Refke M, et al. Tyrosinemia type II (Richner-Hanhart syndrome): a new mutation in the TAT gene. Eur J Med Genet. 2011;54:205-208.
- Pasternack SM, Betz RC, Brandrup F, et al. Identification of two new mutations in the TAT gene in a Danish family with tyrosinaemia type II. Br J Dermatol. 2009;160:704-706.
- Macsai MS, Schwartz TL, Hinkle D, et al. Tyrosinemia type II: nine cases of ocular signs and symptoms. Am J Ophthalmol. 2001;132:522-527.
- Kymionis GD, Kankariya VP, Kontadakis GA, et al. Isolated corneal pseudodendrites as the initial manifestation of tyrosinemia type II in monozygotic twins. J Pediatr Ophthalmol Strabismus.2012;49:E33-E36.
- Iskeleli G, Bilgeç MD, Arici C, et al. Richner-Hanhart syndrome (tyrosinemia type II): a case report of delayed diagnosis with pseudodendritic corneal lesion. Turk J Pediatr. 2011;53:692-694.
- Rehák A, Selim MM, Yadav G. Richner-Hanhart syndrome (tyrosinaemia-II)(report of four cases without ocular involvement). Br J Dermatol. 1981;104:469-475.
- Viglizzo GM, Occella C, Bleidl D, et al. Richner-Hanhart syndrome (tyrosinemia II): early diagnosis of an incomplete presentation with unusual findings. Pediatr Dermatol. 2006;23:259-261.
- Machino H, Miki Y, Kawatsu T, et al. Successful dietary control of tyrosinemia II. J Am Acad Dermatol. 1983;9:533-539.
- el-Badramany MH, Fawzy AR, Farag TI. Familial Richner-Hanhart syndrome in Kuwait: twelve-year clinical reassessment by a multidisciplinary approach. Am J Med Genet. 1995;60:353-355.
- Cerone R, Fantasia AR, Castellano E, et al. Pregnancy and tyrosinaemia type II. J Inherit Metab Dis. 2002;25:317-318.
Practice Points
- Richner-Hanhart syndrome (tyrosinemia type II) should be suspected in patients demonstrating cutaneous lesions, especially palmoplantar keratosis associated with bilateral pseudodendritic corneal lesions unresponsive to antiviral therapy.
- Early diagnosis and initiation of a tyrosinephenylalanine–restricted diet in infancy is the most effective therapy to prevent mental retardation.

ISSOP’s Budapest Declaration: A call to action for children on the move
In late October 2017, pediatricians from over 25 countries gathered at the annual meeting of the International Society of Social Pediatrics and Child Health in Budapest to develop strategies to address the health and well-being of children on the move. With the staggering global increase in the displacement of children – due to conflict, climate change, natural disasters, and economic deprivation – there is a critical need for action.
An international slate of experts, including pediatricians who are responding to the needs of these children, provided an evidence base for intervention and action. These discussions informed the development of a consensus statement, the Budapest Declaration, that establishes a framework for a global response to the exigencies confronting these children and families.

The Budapest Declaration is grounded in children’s rights as guaranteed in the United Nation’s Convention on the Rights of the Child (CRC). All countries in the world have signed onto the CRC, with a notable exception being the United States. But leading American pediatric groups, including the American Academy of Pediatrics, have endorsed the CRC, making it a basis of organizational advocacy. The CRC entitles all children to optimal survival and development (Article 6) and optimal health and health care (Article 24).
As prescribed by these accepted legal rights for children, children and youth on the move are entitled to the same services, including health care, as resident populations of children, regardless of their legal status. Countries can be held accountable to ensure they receive the full rights due them as articulated in the CRC. Furthermore, efforts to do so should be assessed in national periodic reports to the Committee on the Rights of the Child to ensure accountability.
The relevance of the Budapest Declaration to the United States cannot be overstated. National and regional public policy throughout our country, and in particular along our Southern border, is having a devastating effect on the physical and mental health of children and youth on the move – and will continue to do so throughout their life course.
The involvement of pediatricians and other child health providers is essential to the planning and implementation of clinical and public health programs for children on the move. Child health professionals, in conjunction with their professional organizations, must be engaged in all aspects of local, national, and global responses. Leadership and contributions by pediatricians and pediatric societies and academic institutions are integral to the success of key partners, such as UNICEF, the World Health Organization, the International Organization for Migration, and the UN High Commissioner for Refugees.

Systems of care should be provided that address the physical, mental, and social health care needs of these children without bias and prejudice. Pregnant mothers on the move also should receive services to ensure the delivery of healthy newborns. Every nation should develop approaches and commitments to advance equity in the health and well-being for these children and families.
For much of the world, working within the realm of children’s rights provides a strategy and moral and legal basis for our efforts. Pediatricians need to work with colleagues in a transdisciplinary approach to ensure all children live in nurturing, rights-respecting environments. Our ongoing efforts should include encouraging academic institutions to assist with professional education, research, and evaluation in this regard. We need evaluations that contribute to continuous quality improvement in our efforts and integrate the metrics of child rights, social justice, and health equity into our care of children on the move.
We call on other national and international public, private, and academic sector organizations to advance the health and well-being of children and youth on the move. These children and families are depending on us to do so.
For the complete text of the Budapest Declaration, see www.issop.org/2017/11/10/budapest-declaration-rights-health-well-children-youth-move/.
Dr. Rushton is medical director of the South Carolina Quality Through Innovation in Pediatrics (SCQTIP) network. Dr. Goldhagen is president-elect, International Society for Social Pediatrics and Child Health, and professor of pediatrics, University of Florida, Jacksonville. Email them at [email protected].
In late October 2017, pediatricians from over 25 countries gathered at the annual meeting of the International Society of Social Pediatrics and Child Health in Budapest to develop strategies to address the health and well-being of children on the move. With the staggering global increase in the displacement of children – due to conflict, climate change, natural disasters, and economic deprivation – there is a critical need for action.
An international slate of experts, including pediatricians who are responding to the needs of these children, provided an evidence base for intervention and action. These discussions informed the development of a consensus statement, the Budapest Declaration, that establishes a framework for a global response to the exigencies confronting these children and families.
The Budapest Declaration is grounded in children’s rights as guaranteed in the United Nation’s Convention on the Rights of the Child (CRC). All countries in the world have signed onto the CRC, with a notable exception being the United States. But leading American pediatric groups, including the American Academy of Pediatrics, have endorsed the CRC, making it a basis of organizational advocacy. The CRC entitles all children to optimal survival and development (Article 6) and optimal health and health care (Article 24).
As prescribed by these accepted legal rights for children, children and youth on the move are entitled to the same services, including health care, as resident populations of children, regardless of their legal status. Countries can be held accountable to ensure they receive the full rights due them as articulated in the CRC. Furthermore, efforts to do so should be assessed in national periodic reports to the Committee on the Rights of the Child to ensure accountability.
The relevance of the Budapest Declaration to the United States cannot be overstated. National and regional public policy throughout our country, and in particular along our Southern border, is having a devastating effect on the physical and mental health of children and youth on the move – and will continue to do so throughout their life course.
The involvement of pediatricians and other child health providers is essential to the planning and implementation of clinical and public health programs for children on the move. Child health professionals, in conjunction with their professional organizations, must be engaged in all aspects of local, national, and global responses. Leadership and contributions by pediatricians and pediatric societies and academic institutions are integral to the success of key partners, such as UNICEF, the World Health Organization, the International Organization for Migration, and the UN High Commissioner for Refugees.
Systems of care should be provided that address the physical, mental, and social health care needs of these children without bias and prejudice. Pregnant mothers on the move also should receive services to ensure the delivery of healthy newborns. Every nation should develop approaches and commitments to advance equity in the health and well-being for these children and families.
For much of the world, working within the realm of children’s rights provides a strategy and moral and legal basis for our efforts. Pediatricians need to work with colleagues in a transdisciplinary approach to ensure all children live in nurturing, rights-respecting environments. Our ongoing efforts should include encouraging academic institutions to assist with professional education, research, and evaluation in this regard. We need evaluations that contribute to continuous quality improvement in our efforts and integrate the metrics of child rights, social justice, and health equity into our care of children on the move.
We call on other national and international public, private, and academic sector organizations to advance the health and well-being of children and youth on the move. These children and families are depending on us to do so.
For the complete text of the Budapest Declaration, see www.issop.org/2017/11/10/budapest-declaration-rights-health-well-children-youth-move/.
Dr. Rushton is medical director of the South Carolina Quality Through Innovation in Pediatrics (SCQTIP) network. Dr. Goldhagen is president-elect, International Society for Social Pediatrics and Child Health, and professor of pediatrics, University of Florida, Jacksonville. Email them at [email protected].
Cosmetic Corner: Dermatologists Weigh in on Pigment Correctors
To improve patient care and outcomes, leading dermatologists offered their recommendations on pigment correctors. Consideration must be given to:
- dEp Patch Full Face Mask
Activaderm, Inc
“This product uses microcurrent to push vitamin C into the skin. Vitamin C, a known antioxidant that usually has a difficult time passing through the stratum corneum, corrects pigmentary abnormalities. The product also comes with a botanical pigment corrector.”—Gary Goldenberg, MD, New York, New York
- De-Spot Skin Brightening Corrector
Peter Thomas Roth Labs LLC
“This product is a useful over-the-counter adjunct to prescription-strength hydroquinone, with niacinamide as one of the active ingredients.”—Shari Lipner, MD, PhD, New York, New York
- Glytone Dark Spot Corrector
Pierre Fabre Laboratories
“With 2% hydroquinone, glycolic acid, and kojic acid, you have a highly effective combination of ingredients that work synergistically to lighten areas of skin discoloration.”—Jeannette Graf, MD, Great Neck, New York
Cutis invites readers to send us their recommendations. Bar soap, lip plumper, and night cream will be featured in upcoming editions of Cosmetic Corner. Please e-mail your recommendation(s) to the Editorial Office.
Disclaimer: Opinions expressed herein do not necessarily reflect those of Cutis or Frontline Medical Communications Inc. and shall not be used for product endorsement purposes. Any reference made to a specific commercial product does not indicate or imply that Cutis or Frontline Medical Communications Inc. endorses, recommends, or favors the product mentioned. No guarantee is given to the effects of recommended products.
Impact of Hypsarrhythmia on Infantile Spasm Therapy
Infants experiencing spasms will likely respond to standard first-line treatment, whether or not they also have hypsarrhythmia, according to a multicenter study of the National Infantile Spasms Consortium.
- The investigation included infants between 2 months and 2 years who had been enrolled in the Consortium cohort with new onset spasms.
- 82% of the infants had hypsarrthythmia but the condition was not linked to the child’s average age, gender, any preexisting developmental delay or epilepsy, or their response to first line treatment.
First-line treatment, which consisted of vigabatrin, prednisolone, and adrenocorticotropic hormone (ACTH), was by far the most important variable that predicted the infants’ response to therapy, whether or not they had hypsarrhythmia.
The impact of hypsarrhythmia on infantile spasms treatment response: Observational cohort study from the National Infantile Spasms Consortium. Epilepsia. 2017;58:2098-2103.
Black Patients More Likely to Receive TLE Diagnosis
Black patients are almost twice as likely to be diagnosed with temporal lobe epilepsy than white patients, despite the fact that black patients make up only 20% of the patient population in the Southeastern United States, according to a recent study.
- The University of Alabama at Birmingham reviewed all the video EEG diagnoses in its seizure monitoring unit from 2000 to 2011.
- Researchers performed a statistical analysis that included multivariate logistic regression to detect factors associated with the temporal lobe epilepsy (TLE) diagnosis.
- The diagnoses in the entire patient population included 630 cases of TLE, 1150 cases of psychogenic nonepileptic seizures, 424 additional focal epilepsies, and 224 generalized epilepsies.
- The population included 77.3% white patients, 20% black patients, and 2.3% patients of other races.
- TLE was diagnosed far more often in black patients than white patients (odds ratio: 1.87).
There were more women in the study population, and black women were responsible for most of the statistical difference in TLE diagnoses.
Racial disparities in temporal lobe epilepsy. Epilepsy Res. 2017;16;140:56-60.
As Many as 47 Million Americans May Have Preclinical Alzheimer’s Disease
A treatment that would reduce the risk of developing amyloid plaques in the brain by 50% could save more than four million Americans from mild cognitive impairment (MCI) and 2.5 million Americans from Alzheimer’s disease by 2060, according to a study published online ahead of print November 29 in Alzheimer’s & Dementia.
The conclusion that modestly effective preventive therapy could greatly improve the Alzheimer’s disease outlook is especially important, given another finding in a new mathematical modeling study by Ron Brookmeyer, PhD, a biostatistician at the University of California, Los Angeles, and colleagues. They assert that 47 million cognitively normal people in the United States may have brain amyloidosis, the physical finding used to define preclinical Alzheimer’s disease.

This study is the first to quantify the number of cognitively healthy US residents who could eventually experience cognitive changes that put them at risk of developing Alzheimer’s dementia, according to a statement from the Alzheimer’s Association.
Model Predicted Increase in Preclinical Alzheimer’s Disease
“This is the first major attempt to forecast these proposed preclinical Alzheimer’s disease and [MCI] due to Alzheimer’s disease numbers. If confirmed, these data [will] provide essential information for public health planning and for informing and guiding the public and private investment in Alzheimer’s and dementia research,” said Dr. Brookmeyer. “We need more research to confirm the findings from this model, and more Alzheimer’s disease and dementia research that includes diverse populations.”
“I want to emphasize that of the 47 million [people] with these Alzheimer’s brain changes, but without clinical symptoms, most will not progress to clinical disease during their lifetimes. In fact, perhaps only one in seven will progress to full-blown dementia.” Nevertheless, the numbers represent a reality that must be confronted and managed proactively, said Dr. Brookmeyer.
The results may sound alarming, he said, “but I have every confidence in them. And they are important because they allow us to understand how many people could potentially benefit from treatment, at what point on the disease continuum it would be useful to implement treatment, and how those treatments could impact public health.”
Studies Provided Rates of Transition Between Disease States
To create predictive models, Dr. Brookmeyer used data from two prospective longitudinal cohort studies: the Mayo Clinic Study of Aging and a study conducted by Stephanie J. Vos, PhD, a postdoctoral researcher at Maastricht University in the Netherlands.
The Mayo Clinic study followed 1,541 cognitively normal older adults and provided data on the rate of transition from normal cognition to MCI. The study by Dr. Vos and her associates followed 353 patients with MCI and brain amyloid and 222 patients with late MCI as they progressed. It is the largest prospective study of progression from MCI to Alzheimer’s disease that also contains data on baseline neurodegeneration and amyloid burden.
“These studies gave us the rates of transition from one state to another,” said Dr. Brookmeyer. “For example, the Mayo Clinic study gave us rates of transition from normal [health] to amyloidosis: 3% of normal 60-year-olds will convert to this state every year.”
Dr. Vos’s study determined rates of progression from MCI to Alzheimer’s dementia, given two preclinical states: asymptomatic amyloid brain plaques alone, or plaques with evidence of neurodegeneration and cognitive signs, said Dr. Brookmeyer. Both of these transitional states were first defined in 2011 in a joint paper by the Alzheimer’s Association and the National Institute on Aging. While acknowledging that the root causes of Alzheimer’s disease are unknown, the paper hypothesized a pathophysiologic time line beginning with a three-stage preclinical phase.
Asymptomatic cerebral amyloidosis is the first stage. It entails amyloid-positive PET brain imaging with an amyloid-binding ligand, a CSF assay with a low level of amyloid-beta 42 in the presence of normal cognition, or both. Stage 2 is one of amyloid positivity and evidence of synaptic dysfunction or early neurodegeneration in the presence of normal cognition. Finally, stage 3 entails amyloid positivity with evidence of neurodegeneration in the presence of subtle cognitive decline.
“Using those definitions, and piecing together the numbers from these studies, we constructed a computer model based on US census population projections to [estimate] how many people might be in these different states of disease,” said Dr. Brookmeyer.
In 2017, six million Americans were in one of the clinical disease states (ie, MCI due to Alzheimer’s disease, early clinical Alzheimer’s disease, or late clinical Alzheimer’s disease). Dr. Brookmeyer and his colleagues predicted that that number would grow to 15 million by 2060. Similarly, in 2017, about 47 million Americans were in one of the preclinical Alzheimer’s disease states, including 22 million with amyloidosis, 8.3 million with neurodegeneration alone, and 16.2 million with both. He projects that this number will increase to 75.7 million by 2060.
Prevention Strategies
The team remodeled those numbers in three hypothetical intervention scenarios. Researchers say that a treatment that slows decline by at least 30% would have a meaningful clinical, financial, and societal impact. However, Dr. Brookmeyer modeled treatment scenarios with a greater effect.
A primary prevention method that reduced the annual risk of new amyloidosis by 50% could decrease the prevalence of MCI by about 700,000 in 2060. A secondary prevention strategy that reduced the annual risk progression to MCI by 50% would decrease the prevalence of MCI by more than two million and the prevalence of Alzheimer’s disease by about 3.8 million.
The results were more complicated with a secondary prevention strategy that would reduce annual risk of conversion from MCI to Alzheimer’s disease by 50%. In this scenario, the prevalence of MCI in 2060 would increase by 2.8 million, but the prevalence of Alzheimer’s disease would decrease by 2.5 million. These scenarios developed over different time courses, said the researchers.
“We find that the highly effective primary prevention strategy resulted in the lowest Alzheimer’s disease prevalence by the year 2060. However, [it] was associated with the largest Alzheimer’s disease prevalence in the 15 years immediately after its introduction ... The explanation for this finding is that the full benefits of delaying amyloidosis, in terms of reduced Alzheimer’s disease prevalence, are not realized for many years because of the long lag time between amyloidosis and clinical Alzheimer’s disease. A take-home message is that the full impact on disease burden of primary prevention that targets the early stages of the pathogenesis of Alzheimer’s disease may not be realized for decades.”
Decreasing preclinical conversion to MCI with a secondary prevention strategy would result in the highest Alzheimer’s disease prevalence reduction for most of the period. But the reduction resulting from the primary prevention strategy would surpass it by 2054.
The intervention targeting conversion from MCI to Alzheimer’s disease would reduce Alzheimer’s disease prevalence the quickest, with a slight decrease in the first three years after introduction. “The explanation for this finding is that MCI is proximate to clinical Alzheimer’s disease diagnosis, and thus the impact of delaying progression of MCI will be seen relatively quickly on Alzheimer’s disease prevalence, compared to interventions that delay onset of amyloidosis or MCI.
“By focusing attention on a concerning reality—that tens of millions of American adults may face the possibility of dementia due to Alzheimer’s disease—the results reported in this new article, if confirmed, illustrate and greatly amplify the need for more research to develop effective treatments and proven prevention strategies for Alzheimer’s disease,” said Dr. Brookmeyer. “This is especially true as we get better at early detection and are able to more accurately identify people who have the early brain changes associated with Alzheimer’s disease and other dementias.”
Dr. Brookmeyer reported receiving fees from Takeda for serving as a member of a data safety monitoring board.
—Michele G. Sullivan
Suggested Reading
Brookmeyer R, Abdalla N, Kawas CH, Corrada MM. Forecasting the prevalence of preclinical and clinical Alzheimer’s disease in the United States. Alzheimers Dement. 2017 Nov 29 [Epub ahead of print].
Derby CA, Katz MJ, Lipton RB, Hall CB. Trends in dementia incidence in a birth cohort analysis of the Einstein Aging Study. JAMA Neurol. 2017;74(11):1345-1351.
Sperling RA, Aisen PS, Beckett LA, et al. Toward defining the preclinical stages of Alzheimer’s disease: recommendations from the National Institute on Aging-Alzheimer’s Association workgroups on diagnostic guidelines for Alzheimer’s disease. Alzheimers Dement. 2011;7(3):280-292.
Vos SJ, Verhey F, Frölich L, et al. Prevalence and prognosis of Alzheimer’s disease at the mild cognitive impairment stage. Brain. 2015;138(Pt 5):1327-1338.
A treatment that would reduce the risk of developing amyloid plaques in the brain by 50% could save more than four million Americans from mild cognitive impairment (MCI) and 2.5 million Americans from Alzheimer’s disease by 2060, according to a study published online ahead of print November 29 in Alzheimer’s & Dementia.
The conclusion that modestly effective preventive therapy could greatly improve the Alzheimer’s disease outlook is especially important, given another finding in a new mathematical modeling study by Ron Brookmeyer, PhD, a biostatistician at the University of California, Los Angeles, and colleagues. They assert that 47 million cognitively normal people in the United States may have brain amyloidosis, the physical finding used to define preclinical Alzheimer’s disease.
This study is the first to quantify the number of cognitively healthy US residents who could eventually experience cognitive changes that put them at risk of developing Alzheimer’s dementia, according to a statement from the Alzheimer’s Association.
Model Predicted Increase in Preclinical Alzheimer’s Disease
“This is the first major attempt to forecast these proposed preclinical Alzheimer’s disease and [MCI] due to Alzheimer’s disease numbers. If confirmed, these data [will] provide essential information for public health planning and for informing and guiding the public and private investment in Alzheimer’s and dementia research,” said Dr. Brookmeyer. “We need more research to confirm the findings from this model, and more Alzheimer’s disease and dementia research that includes diverse populations.”
“I want to emphasize that of the 47 million [people] with these Alzheimer’s brain changes, but without clinical symptoms, most will not progress to clinical disease during their lifetimes. In fact, perhaps only one in seven will progress to full-blown dementia.” Nevertheless, the numbers represent a reality that must be confronted and managed proactively, said Dr. Brookmeyer.
The results may sound alarming, he said, “but I have every confidence in them. And they are important because they allow us to understand how many people could potentially benefit from treatment, at what point on the disease continuum it would be useful to implement treatment, and how those treatments could impact public health.”
Studies Provided Rates of Transition Between Disease States
To create predictive models, Dr. Brookmeyer used data from two prospective longitudinal cohort studies: the Mayo Clinic Study of Aging and a study conducted by Stephanie J. Vos, PhD, a postdoctoral researcher at Maastricht University in the Netherlands.
The Mayo Clinic study followed 1,541 cognitively normal older adults and provided data on the rate of transition from normal cognition to MCI. The study by Dr. Vos and her associates followed 353 patients with MCI and brain amyloid and 222 patients with late MCI as they progressed. It is the largest prospective study of progression from MCI to Alzheimer’s disease that also contains data on baseline neurodegeneration and amyloid burden.
“These studies gave us the rates of transition from one state to another,” said Dr. Brookmeyer. “For example, the Mayo Clinic study gave us rates of transition from normal [health] to amyloidosis: 3% of normal 60-year-olds will convert to this state every year.”
Dr. Vos’s study determined rates of progression from MCI to Alzheimer’s dementia, given two preclinical states: asymptomatic amyloid brain plaques alone, or plaques with evidence of neurodegeneration and cognitive signs, said Dr. Brookmeyer. Both of these transitional states were first defined in 2011 in a joint paper by the Alzheimer’s Association and the National Institute on Aging. While acknowledging that the root causes of Alzheimer’s disease are unknown, the paper hypothesized a pathophysiologic time line beginning with a three-stage preclinical phase.
Asymptomatic cerebral amyloidosis is the first stage. It entails amyloid-positive PET brain imaging with an amyloid-binding ligand, a CSF assay with a low level of amyloid-beta 42 in the presence of normal cognition, or both. Stage 2 is one of amyloid positivity and evidence of synaptic dysfunction or early neurodegeneration in the presence of normal cognition. Finally, stage 3 entails amyloid positivity with evidence of neurodegeneration in the presence of subtle cognitive decline.
“Using those definitions, and piecing together the numbers from these studies, we constructed a computer model based on US census population projections to [estimate] how many people might be in these different states of disease,” said Dr. Brookmeyer.
In 2017, six million Americans were in one of the clinical disease states (ie, MCI due to Alzheimer’s disease, early clinical Alzheimer’s disease, or late clinical Alzheimer’s disease). Dr. Brookmeyer and his colleagues predicted that that number would grow to 15 million by 2060. Similarly, in 2017, about 47 million Americans were in one of the preclinical Alzheimer’s disease states, including 22 million with amyloidosis, 8.3 million with neurodegeneration alone, and 16.2 million with both. He projects that this number will increase to 75.7 million by 2060.
Prevention Strategies
The team remodeled those numbers in three hypothetical intervention scenarios. Researchers say that a treatment that slows decline by at least 30% would have a meaningful clinical, financial, and societal impact. However, Dr. Brookmeyer modeled treatment scenarios with a greater effect.
A primary prevention method that reduced the annual risk of new amyloidosis by 50% could decrease the prevalence of MCI by about 700,000 in 2060. A secondary prevention strategy that reduced the annual risk progression to MCI by 50% would decrease the prevalence of MCI by more than two million and the prevalence of Alzheimer’s disease by about 3.8 million.
The results were more complicated with a secondary prevention strategy that would reduce annual risk of conversion from MCI to Alzheimer’s disease by 50%. In this scenario, the prevalence of MCI in 2060 would increase by 2.8 million, but the prevalence of Alzheimer’s disease would decrease by 2.5 million. These scenarios developed over different time courses, said the researchers.
“We find that the highly effective primary prevention strategy resulted in the lowest Alzheimer’s disease prevalence by the year 2060. However, [it] was associated with the largest Alzheimer’s disease prevalence in the 15 years immediately after its introduction ... The explanation for this finding is that the full benefits of delaying amyloidosis, in terms of reduced Alzheimer’s disease prevalence, are not realized for many years because of the long lag time between amyloidosis and clinical Alzheimer’s disease. A take-home message is that the full impact on disease burden of primary prevention that targets the early stages of the pathogenesis of Alzheimer’s disease may not be realized for decades.”
Decreasing preclinical conversion to MCI with a secondary prevention strategy would result in the highest Alzheimer’s disease prevalence reduction for most of the period. But the reduction resulting from the primary prevention strategy would surpass it by 2054.
The intervention targeting conversion from MCI to Alzheimer’s disease would reduce Alzheimer’s disease prevalence the quickest, with a slight decrease in the first three years after introduction. “The explanation for this finding is that MCI is proximate to clinical Alzheimer’s disease diagnosis, and thus the impact of delaying progression of MCI will be seen relatively quickly on Alzheimer’s disease prevalence, compared to interventions that delay onset of amyloidosis or MCI.
“By focusing attention on a concerning reality—that tens of millions of American adults may face the possibility of dementia due to Alzheimer’s disease—the results reported in this new article, if confirmed, illustrate and greatly amplify the need for more research to develop effective treatments and proven prevention strategies for Alzheimer’s disease,” said Dr. Brookmeyer. “This is especially true as we get better at early detection and are able to more accurately identify people who have the early brain changes associated with Alzheimer’s disease and other dementias.”
Dr. Brookmeyer reported receiving fees from Takeda for serving as a member of a data safety monitoring board.
—Michele G. Sullivan
Suggested Reading
Brookmeyer R, Abdalla N, Kawas CH, Corrada MM. Forecasting the prevalence of preclinical and clinical Alzheimer’s disease in the United States. Alzheimers Dement. 2017 Nov 29 [Epub ahead of print].
Derby CA, Katz MJ, Lipton RB, Hall CB. Trends in dementia incidence in a birth cohort analysis of the Einstein Aging Study. JAMA Neurol. 2017;74(11):1345-1351.
Sperling RA, Aisen PS, Beckett LA, et al. Toward defining the preclinical stages of Alzheimer’s disease: recommendations from the National Institute on Aging-Alzheimer’s Association workgroups on diagnostic guidelines for Alzheimer’s disease. Alzheimers Dement. 2011;7(3):280-292.
Vos SJ, Verhey F, Frölich L, et al. Prevalence and prognosis of Alzheimer’s disease at the mild cognitive impairment stage. Brain. 2015;138(Pt 5):1327-1338.
Gastrointestinal complications are a key risk factor for death after AEF repair
Aortoenteric fistulas (AEFs) are an uncommon but lethal form of aortic graft infection with morbidity and mortality rates reported in the literature to range from 14% to 75%. Over a 20-year period, researchers found that nearly half of their patients undergoing repair of their aortoenteric fistulas died within 60 days. The presence of gastrointestinal complications increased the risk of mortality more than threefold, according to the results of a single-center retrospective review of consecutive AEF repairs.
The researchers assessed 50 patients who presented with AEF and had repair during 1995-2014. Sixty percent of the patients were men, and the overall median age was 70 years. The median follow-up for the entire cohort was 14 months. The duodenum was the most common location of the enteric defect, found in 80% of the infections. Overall, 23 patients (46%) died by day 60, according to the report published in the July Journal of the American College of Surgeons.
Univariate analysis showed that advanced age, chronic renal insufficiency, any complications, and GI complications in particular (occurring in 26% of patients) were all associated with an increase in overall mortality (P less than .05). But upon multivariate analysis, gastrointestinal complications (hazard ratio, 3.23; P = .015) and advanced age (HR, 1.07; P = .01) were the only independent predictors of mortality, Atish Chopra, MD, of the division of vascular surgery, Oregon Health & Science University, Portland, and his colleagues wrote.
The institution changed operative procedures in 2007, based upon an earlier assessment of the importance of GI complications performed by the researchers, with greater emphasis placed on ensuring a viable GI reconstruction, and early intervention for mesenteric ischemia. In addition, they surmised that, after 2007, there was improved adherence to achieving wide debridement of nonviable and infected tissue, and to creating a tension-free anastomosis to healthy tissue edges while optimizing nutritional, medical, and antibiotic therapy, according to the researchers.
“When comparing the patients undergoing repair before 2007 with those compared after 2007 [38 and 12 AEF patients, respectively], we found that in-hospitality mortality decreased from 37% to 8% (P = .08), 60-day mortality decreased from 53% to 8% (P less than .01), and mortality at last follow-up decreased from 55% to 17% (P = .02). Dr. Chopra and his colleagues also found that mortality after GI complications decreased from 90% for those operated on before 2007 to 33% in those operated on after 2007 (P = .01).
“Methods to decrease and improvement management of GI complications may prove most effective at improving mortality rates for this lethal pathology,” the researchers concluded.
The authors reported that they had nothing to disclose.
SOURCE: Chopra A et al. J Am Coll Surg 2017 Jul;225(1):9-18.
While secondary aortoenteric fistulas fortunately are a rare occurrence after open aortic repair (less than 1%), the reported results of treatment are disappointing (up to 75% mortality). The authors have demonstrated significant improvement in overall mortality in their series by paying more attention to the GI component of the procedure and postoperative management of the patient.

When we published our institutions experience with AEFs from 1991 to 2004, the study included 29 patients with one-third of patients presenting in shock. Extra-anatomic repair was performed in 86% (68% single stage). Mortality was 24%, with shock, blood transfusions, and suprarenal clamping associated with a worse outcome. Our 5-year survival was 61% and freedom from recurrent infection or amputation was 86% and 88% respectively. While our experience favors an extra-anatomic reconstruction, there has been increased utilization of in-situ repair in recent years. The current authors have extensive experience with the Neoaortoiliac System (NAIS) procedure and have had minimal complications associated with the extensive vein harvest necessary for NAIS; however, this is not universal. Wound complications, compartment syndrome, and chronic venous insufficiency are not uncommon complications. Improved results using cryopreserved aortoiliac allografts (CAA) were reported by The Vascular Low-Frequency Disease Consortium. In a 2014 publication on 220 patients receiving CAA for aortic reconstruction for aortic graft infection, freedom from graft-related complications, graft explant, and limb loss was 80%, 88%, and 97%, respectively, at 5 years. This compares favorably with extra-anatomic reconstruction and other techniques. In suprarenal reconstructions, allografts have been favored since the natural branches can be used to simplify multiple vessel reconstruction. In cases of low-grade infection (Staphylococcus epidermidis), excellent results have been demonstrated with wide debridement, in-situ replacement with rifampin-bonded grafts and omental coverage.
AEF can also occur after endovascular abdominal aortic aneurysm (AAA) repair and a management strategy for removing the endograft should be considered in the planning of these cases. The authors describe their technique, which involves constraining the endograft using an umbilical tape. Another technique that I prefer uses a 20-cc syringe with the tip cut off. The endograft is constrained by advancing the syringe proximally over the endograft. The syringe collapses the device and can be used to constrain the proximal fixation stents of a suprarenal graft, simplifying removal of the stent graft. Infected EVAR will likely become more common as an etiology as we continue to expand EVAR utilization for AAA repair. Another Low-Frequency Consortium paper reviewed the treatment and outcome of EVAR infection. In that report of 206 infected EVAR (endovascular aneurysm repair) and TEVAR (thoracic endovascular aortic repair) patients, 90% had in situ replacement with a 30-day mortality of 11% and morbidity of 35%.
As in previous reports on AEF, the authors highlight the importance of high clinical suspicion in making an expeditious diagnosis. Many imaging modalities can be used, but often operative exploration is required for a definitive diagnosis. Complete graft excision and wide debridement are critical to minimize the risk of recurrent infection. Optimal revascularization techniques should be determined by the experience of the operator, current experience demonstrating nearly equivalent outcomes with extra-anatomic and in situ replacement. Careful GI reconstruction and post-operative nutrition, culture-specific antibiotics, and ICU care are likely more important than the mode of reconstruction. Lifelong surveillance to detect recurrent infections also is recommended.
Murray L. Shames, MD , is professor of surgery and radiology and chief of the division of vascular surgery at the University of South Florida, Tampa, and director of the Tampa General Hospital aortic program.
While secondary aortoenteric fistulas fortunately are a rare occurrence after open aortic repair (less than 1%), the reported results of treatment are disappointing (up to 75% mortality). The authors have demonstrated significant improvement in overall mortality in their series by paying more attention to the GI component of the procedure and postoperative management of the patient.
When we published our institutions experience with AEFs from 1991 to 2004, the study included 29 patients with one-third of patients presenting in shock. Extra-anatomic repair was performed in 86% (68% single stage). Mortality was 24%, with shock, blood transfusions, and suprarenal clamping associated with a worse outcome. Our 5-year survival was 61% and freedom from recurrent infection or amputation was 86% and 88% respectively. While our experience favors an extra-anatomic reconstruction, there has been increased utilization of in-situ repair in recent years. The current authors have extensive experience with the Neoaortoiliac System (NAIS) procedure and have had minimal complications associated with the extensive vein harvest necessary for NAIS; however, this is not universal. Wound complications, compartment syndrome, and chronic venous insufficiency are not uncommon complications. Improved results using cryopreserved aortoiliac allografts (CAA) were reported by The Vascular Low-Frequency Disease Consortium. In a 2014 publication on 220 patients receiving CAA for aortic reconstruction for aortic graft infection, freedom from graft-related complications, graft explant, and limb loss was 80%, 88%, and 97%, respectively, at 5 years. This compares favorably with extra-anatomic reconstruction and other techniques. In suprarenal reconstructions, allografts have been favored since the natural branches can be used to simplify multiple vessel reconstruction. In cases of low-grade infection (Staphylococcus epidermidis), excellent results have been demonstrated with wide debridement, in-situ replacement with rifampin-bonded grafts and omental coverage.
AEF can also occur after endovascular abdominal aortic aneurysm (AAA) repair and a management strategy for removing the endograft should be considered in the planning of these cases. The authors describe their technique, which involves constraining the endograft using an umbilical tape. Another technique that I prefer uses a 20-cc syringe with the tip cut off. The endograft is constrained by advancing the syringe proximally over the endograft. The syringe collapses the device and can be used to constrain the proximal fixation stents of a suprarenal graft, simplifying removal of the stent graft. Infected EVAR will likely become more common as an etiology as we continue to expand EVAR utilization for AAA repair. Another Low-Frequency Consortium paper reviewed the treatment and outcome of EVAR infection. In that report of 206 infected EVAR (endovascular aneurysm repair) and TEVAR (thoracic endovascular aortic repair) patients, 90% had in situ replacement with a 30-day mortality of 11% and morbidity of 35%.
As in previous reports on AEF, the authors highlight the importance of high clinical suspicion in making an expeditious diagnosis. Many imaging modalities can be used, but often operative exploration is required for a definitive diagnosis. Complete graft excision and wide debridement are critical to minimize the risk of recurrent infection. Optimal revascularization techniques should be determined by the experience of the operator, current experience demonstrating nearly equivalent outcomes with extra-anatomic and in situ replacement. Careful GI reconstruction and post-operative nutrition, culture-specific antibiotics, and ICU care are likely more important than the mode of reconstruction. Lifelong surveillance to detect recurrent infections also is recommended.
Murray L. Shames, MD , is professor of surgery and radiology and chief of the division of vascular surgery at the University of South Florida, Tampa, and director of the Tampa General Hospital aortic program.
Aortoenteric fistulas (AEFs) are an uncommon but lethal form of aortic graft infection with morbidity and mortality rates reported in the literature to range from 14% to 75%. Over a 20-year period, researchers found that nearly half of their patients undergoing repair of their aortoenteric fistulas died within 60 days. The presence of gastrointestinal complications increased the risk of mortality more than threefold, according to the results of a single-center retrospective review of consecutive AEF repairs.
The researchers assessed 50 patients who presented with AEF and had repair during 1995-2014. Sixty percent of the patients were men, and the overall median age was 70 years. The median follow-up for the entire cohort was 14 months. The duodenum was the most common location of the enteric defect, found in 80% of the infections. Overall, 23 patients (46%) died by day 60, according to the report published in the July Journal of the American College of Surgeons.
Univariate analysis showed that advanced age, chronic renal insufficiency, any complications, and GI complications in particular (occurring in 26% of patients) were all associated with an increase in overall mortality (P less than .05). But upon multivariate analysis, gastrointestinal complications (hazard ratio, 3.23; P = .015) and advanced age (HR, 1.07; P = .01) were the only independent predictors of mortality, Atish Chopra, MD, of the division of vascular surgery, Oregon Health & Science University, Portland, and his colleagues wrote.
The institution changed operative procedures in 2007, based upon an earlier assessment of the importance of GI complications performed by the researchers, with greater emphasis placed on ensuring a viable GI reconstruction, and early intervention for mesenteric ischemia. In addition, they surmised that, after 2007, there was improved adherence to achieving wide debridement of nonviable and infected tissue, and to creating a tension-free anastomosis to healthy tissue edges while optimizing nutritional, medical, and antibiotic therapy, according to the researchers.
“When comparing the patients undergoing repair before 2007 with those compared after 2007 [38 and 12 AEF patients, respectively], we found that in-hospitality mortality decreased from 37% to 8% (P = .08), 60-day mortality decreased from 53% to 8% (P less than .01), and mortality at last follow-up decreased from 55% to 17% (P = .02). Dr. Chopra and his colleagues also found that mortality after GI complications decreased from 90% for those operated on before 2007 to 33% in those operated on after 2007 (P = .01).
“Methods to decrease and improvement management of GI complications may prove most effective at improving mortality rates for this lethal pathology,” the researchers concluded.
The authors reported that they had nothing to disclose.
SOURCE: Chopra A et al. J Am Coll Surg 2017 Jul;225(1):9-18.
FROM THE JOURNAL OF THE AMERICAN COLLEGE OF SURGEONS
Key clinical point: Nearly half of patients undergoing aortoenteric fistula repair died within 60 days.
Major finding: The presence of gastrointestinal complications increased the risk of mortality for AEF repair more than threefold.
Study details: A single center, retrospective review of 50 consecutive patients with AEF repairs during 1995-2014.
Disclosures: The authors reported that they had nothing to disclose.
Source: Chopra A et al. J Am Coll Surg. 2017 Jul;225:9-18.
Trying to Keep Pace With 3-D Technology
Three-dimensional printing has revolutionized the drug and device market and already has changed the lives of millions of patients. The FDA has reviewed more than 100 devices now on the market that were manufactured on 3-D printers, including knee replacements and implants “designed to fit like a missing puzzle piece into a patient’s skull for facial reconstruction,” says FDA Commissioner Scott Gottlieb, MD. The FDA also has approved the first drug produced on a 3-D printer. It has a more porous matrix than that of the drug manufactured in the traditional way, which allows it to dissolve more rapidly. But the technology advances have been moving so fast that they have threatened to outpace safeguards.
Now the FDA is preparing for a “significant wave” of new technologies, Gottlieb says, such as 3-D-printer skin cells for burn victims and is working to provide a regulatory pathway that keeps pace with those advances, helping to keep them safe and effective. To that end, the FDA has issued new guidance to help advise manufacturers on technical aspects of 3-D printing. And as more hospitals and academic centers use their 3-D printers for innovations to use in clinical studies, the FDA also is establishing a regulatory framework for applying existing laws to nontraditional manufacturers.
The Center for Drug Evaluation and Research state-of-the-art 3-D printing facility allows FDA scientists to conduct research to determine how 3-D printing of drugs, for instance, affects drug components. The Center for Devices and Radiological Health also has a 3-D printing facility to investigate the effect of design changes on safety and performance.
Gottlieb calls the technical guidance leapfrog guidance because it helps bridge current policy with innovation. It is only intended, he says, to provide “initial thoughts on an emerging technology with the understanding that our recommendations are likely to evolve as the technology develops in unexpected ways.”
It's A Slow Grow
For more than two years, this 40-year-old African-American woman has had a lesion on her left maxilla. While it does not cause pain or discomfort, its presence is alarming to the patient. The lesion has grown steadily without responding to various topical OTC medications (tolnaftate, clotrimazole, miconazole, 1% hydrocortisone cream), oral anti-yeast medication, and antibiotics (fluconazole, erythromycin).
The patient claims to be in excellent health otherwise. She reports a strong family history of autoimmune disease, including rheumatoid arthritis and lupus.
EXAMINATION
There is an oval, scaly, atrophic patch on the upper left maxilla, just below the left nostril. The lesion measures 1.2 cm, has well-defined margins, and appears darker than the patient’s type V skin.

No redness or edema are seen, and no nodes are palpable in the area. Examination of the adjacent oral mucosal surface shows nothing amiss.
Under sterile conditions, and after local anesthesia (1% lidocaine with epinephrine) is administered, a 3-mm punch biopsy is obtained from the center of the lesion. The defect is closed with two interrupted nylon sutures.
What is the diagnosis?
DISCUSSION
The results showed follicular hyperkeratosis, epidermal atrophy, acanthosis with basal-layer degeneration, periadnexal lymphocytic infiltrate, and increased mucin in the dermis. These findings—along with the clinical picture and family history—are consistent with discoid lupus erythematosus (DLE).
This manifestation of an autoimmune process is especially common in younger women of color. DLE primarily affects sun-exposed areas (eg, face, ears, neck) and involves scaly, round-to-oval patches and plaques with atrophic centers and follicular accentuation.
These lesions are frequently misdiagnosed as “fungal.” The differential also includes lichen planus and Jessner lymphocytic infiltrate.
Of the three types of cutaneous lupus erythematosus (discoid, acute, subacute), DLE is the most common. The acute form is defined by a “butterfly rash” across the face, while the subacute form involves multiple round-to-oval scaly lesions in wide photodistribution.
The chronic cutaneous lupus category includes DLE, tumid (characterized by deep, painful, indurated nodules), and panniculitis, which affects large areas of adipose tissue. DLE is, once again, the most common.
DLE can be an entity unto itself or part of a larger diagnosis of systemic lupus erythematosus (SLE). The good news: Only about 15% of patients with DLE progress to SLE. It is debatable whether patients with DLE need a full workup for SLE, since corroborative findings are rarely found.
Emphasis is placed on effective treatment of DLE, which includes the use of class 3 or 4 topical steroids and oral antimalarials (eg, hydroxychloroquine). Even with treatment, DLE can take weeks or months to resolve and often leaves permanent scarring. Ongoing sun protection is necessary to prevent recurrence.
TAKE-HOME LEARNING POINTS
- Discoid lupus erythematosus (DLE) is a common form of chronic cutaneous lupus, which has an autoimmune origin but is triggered by sun exposure.
- DLE typically presents with scaly round-to-oval patches and plaques with atrophic centers and follicular accentuation, often on sun-exposed areas.
- Women of color are at increased risk for lupus, and biopsy is often needed to confirm the diagnosis.
- Only about 15% of DLE patients ever progress to systemic lupus erythematosus (SLE), but DLE can be part of a larger SLE diagnosis.
- Treatment includes topical steroids and oral antimalarials (eg, hydroxychloroquine)—and sun protection is crucial.
For more than two years, this 40-year-old African-American woman has had a lesion on her left maxilla. While it does not cause pain or discomfort, its presence is alarming to the patient. The lesion has grown steadily without responding to various topical OTC medications (tolnaftate, clotrimazole, miconazole, 1% hydrocortisone cream), oral anti-yeast medication, and antibiotics (fluconazole, erythromycin).
The patient claims to be in excellent health otherwise. She reports a strong family history of autoimmune disease, including rheumatoid arthritis and lupus.
EXAMINATION
There is an oval, scaly, atrophic patch on the upper left maxilla, just below the left nostril. The lesion measures 1.2 cm, has well-defined margins, and appears darker than the patient’s type V skin.
No redness or edema are seen, and no nodes are palpable in the area. Examination of the adjacent oral mucosal surface shows nothing amiss.
Under sterile conditions, and after local anesthesia (1% lidocaine with epinephrine) is administered, a 3-mm punch biopsy is obtained from the center of the lesion. The defect is closed with two interrupted nylon sutures.
What is the diagnosis?
DISCUSSION
The results showed follicular hyperkeratosis, epidermal atrophy, acanthosis with basal-layer degeneration, periadnexal lymphocytic infiltrate, and increased mucin in the dermis. These findings—along with the clinical picture and family history—are consistent with discoid lupus erythematosus (DLE).
This manifestation of an autoimmune process is especially common in younger women of color. DLE primarily affects sun-exposed areas (eg, face, ears, neck) and involves scaly, round-to-oval patches and plaques with atrophic centers and follicular accentuation.
These lesions are frequently misdiagnosed as “fungal.” The differential also includes lichen planus and Jessner lymphocytic infiltrate.
Of the three types of cutaneous lupus erythematosus (discoid, acute, subacute), DLE is the most common. The acute form is defined by a “butterfly rash” across the face, while the subacute form involves multiple round-to-oval scaly lesions in wide photodistribution.
The chronic cutaneous lupus category includes DLE, tumid (characterized by deep, painful, indurated nodules), and panniculitis, which affects large areas of adipose tissue. DLE is, once again, the most common.
DLE can be an entity unto itself or part of a larger diagnosis of systemic lupus erythematosus (SLE). The good news: Only about 15% of patients with DLE progress to SLE. It is debatable whether patients with DLE need a full workup for SLE, since corroborative findings are rarely found.
Emphasis is placed on effective treatment of DLE, which includes the use of class 3 or 4 topical steroids and oral antimalarials (eg, hydroxychloroquine). Even with treatment, DLE can take weeks or months to resolve and often leaves permanent scarring. Ongoing sun protection is necessary to prevent recurrence.
TAKE-HOME LEARNING POINTS
- Discoid lupus erythematosus (DLE) is a common form of chronic cutaneous lupus, which has an autoimmune origin but is triggered by sun exposure.
- DLE typically presents with scaly round-to-oval patches and plaques with atrophic centers and follicular accentuation, often on sun-exposed areas.
- Women of color are at increased risk for lupus, and biopsy is often needed to confirm the diagnosis.
- Only about 15% of DLE patients ever progress to systemic lupus erythematosus (SLE), but DLE can be part of a larger SLE diagnosis.
- Treatment includes topical steroids and oral antimalarials (eg, hydroxychloroquine)—and sun protection is crucial.
Combo shows promise for elderly/unfit ALL patients

ATLANTA—Results of a phase 2 trial suggest treatment with ponatinib and steroids is feasible for patients with acute lymphoblastic leukemia (ALL) who are elderly and/or unfit for intensive chemotherapy and stem cell transplant.
More than 90% of patients who received this combination had a complete hematologic response at 24 weeks, and the treatment was considered well-tolerated.
“Ponatinib plus steroids is safe and effective in this fragile patient population, which is in urgent need of better therapeutic regimens,” said Giovanni Martinelli, MD, of the University of Bologna in Italy.
Dr Martinelli presented these findings at the 2017 ASH Annual Meeting (abstract 99*).
The trial (GIMEMA LAL 1811) was designed to evaluate whether steroids and ponatinib would be safe and effective in patients with newly diagnosed, Philadelphia chromosome-positive ALL who were older than 60 or ineligible for intensive chemotherapy and stem cell transplant.
The study included 42 such patients. Their median age was 68 (range, 27-85). Nine patients were younger than 60 and unfit.
Sixty-two percent of patients had the p190 fusion transcript, 10% had p210, and 29% had p190/210 transcripts.
Patients received oral ponatinib (45 mg/day) for 8 consecutive 6-week courses. They also received steroids from day -14 to day 29 of course 1.
Patients received intrathecal methotrexate, cytarabine, and dexamethasone every 28 days for central nervous system (CNS) disease prophylaxis. If they were positive for CNS disease at diagnosis, patients received intrathecal therapy twice a week until complete remission.
The median follow-up was 17.2 months.
Results
Thirty-nine patients received steroid pretreatment, and 14 of them had a reduction in circulating blasts of 75% or more before starting ponatinib.
The study’s primary endpoint was complete hematologic response, which occurred in 95.2% of patients at 6 weeks and 90.5% at 24 weeks.
Based on test sensitivity of at least 10,000 ABL molecules, 60.6% of evaluable patients (20/33) had a complete molecular response at 24 weeks.
One patient with relapse had evidence of T315L mutations, which correlates with ponatinib resistance. No other mutations were detected in patients with relapse.
The overall survival rate was 97.6% at 6 months and 87.5% at 1 year.
“The fast and deep reduction of the disease burden in the majority of patients, the ability of ponatinib to prevent the emergence of clones harboring BCR-ABL mutations, and the synthetic lethality with steroids on the BCR-ABL, FLT3, HCK, CDK6, MCL1 pathway most likely explain the therapeutic effectiveness of this regimen,” Dr Martinelli said.
He also said steroids and ponatinib were well-tolerated, with 15 patients continuing treatment at 24 weeks.
Of 75 adverse events (AEs), 36 were related to ponatinib. There were 26 serious AEs, and 13 of them were related to ponatinib.
Serious cardiovascular AEs included arterial disorders (n=3), embolism (n=2), acute coronary syndrome (n=2), acute myocardial infarction (n=1), cardiac failure (n=1), pericardial effusion (n=1), and ischemia (n=1).
Ten deaths were reported. The causes were identified as progression (n=4), cardiovascular disease (n=3), toxicity (n=1), toxicity and progression (n=1), and unknown cause (n=1).
Dr Martinelli reported no disclosures. ![]()
*Data in the presentation differ from the abstract.