User login
FDA issues EUA for test to detect Zika virus RNA
The US Food and Drug Administration (FDA) has issued an emergency use authorization (EUA) for Nanobiosym Diagnostics Inc.’s Gene-RADAR® Zika Virus Test.
The Gene-RADAR® Zika Virus Test is authorized for the qualitative detection of RNA from Zika virus in human serum.
The test should be used on serum samples collected from individuals meeting the US Centers for Disease Control and Prevention’s (CDC) criteria for Zika virus testing.
This includes clinical criteria—such as a history of clinical signs and symptoms associated with Zika virus infection—and/or epidemiological criteria—such as a history of residence in or travel to a geographic region with active Zika transmission.
The Gene-RADAR® Zika Virus Test is intended for use in US laboratories that are certified under the Clinical Laboratory Improvement Amendments of 1988 (CLIA), 42 U.S.C. §263a, to perform high-complexity tests, or by similarly qualified non-US laboratories, pursuant to section 564 of the Federal Food, Drug, and Cosmetic Act (21 U.S.C. § 360bbb-3).
The Gene-RADAR® Zika Virus Test should be performed according to the CDC’s algorithm for Zika testing (see http://www.cdc.gov/zika/laboratories/lab-guidance.html).
According to the CDC, Zika virus RNA has been detected in serum up to 13 days post-symptom onset in non-pregnant patients, up to 62 days post-symptom onset in pregnant patients, and up to 53 days after the last known possible exposure in an asymptomatic pregnant woman.
About the EUA
The EUA does not mean the Gene-RADAR® Zika Virus Test is FDA cleared or approved.
An EUA allows for the use of unapproved medical products or unapproved uses of approved medical products in an emergency.
The products must be used to diagnose, treat, or prevent serious or life-threatening conditions caused by chemical, biological, radiological, or nuclear threat agents, when there are no adequate alternatives.
The EUA for the Gene-RADAR® Zika Virus Test means the test is only authorized as long as circumstances exist to justify the emergency use of in vitro diagnostics for the detection of Zika virus, unless the authorization is terminated or revoked sooner.
More information on the Gene-RADAR® Zika Virus Test and other Zika tests granted EUAs can be found on the FDA’s EUA page. ![]()
Treatment of Unstable Trochanteric Femur Fractures: Proximal Femur Nail Versus Proximal Femur Locking Compression Plate
Take-Home Points
- Both PFN and PFLCP are effective treatments for unstable trochanteric femur fractures.
- PFN is superior to PFLCP only in terms of shorter incisions and shorter time to full weight-bearing.
- Both devices have good long-term functional outcomes.
- Complication rates in unstable trochanteric fractures treated with both implants are comparable.
- Larger randomized controlled multicenter studies are needed to further evaluate and compare both implants in displaced unstable trochanteric femur fractures.
Trochanteric fractures are among the most widely treated orthopedic injuries, occurring mainly as low-energy injuries in elderly patients and high-energy injuries in younger patients.1,2 About half of these injuries are unstable.3 According to the AO/OTA (Arbeitsgemeinschaft für Osteosynthesefragen/Orthopaedic Trauma Association) system, trochanteric fractures can be classified stable (AO/OTA 31.A1-1 to 31.A2-1) or unstable (AO/OTA 31.A2-2 to 31.A3.3).4,5 For surgical fixation of trochanteric femur fractures, various internal fixation devices have been used, either extramedullary (EM) or intramedullary (IM).6 The dynamic hip screw (DHS) is the implant of choice in the treatment of stable trochanteric femur fractures (AO/OTA 31-A1), as it provides secure fixation and controlled impaction.7 Mechanical and technical failures continue to occur in up to 6% to 18% of cases of unstable trochanteric fractures treated with DHS.8 Excessive sliding of the lag screw within the plate barrel results in limb shortening and distal fragment medialization, which are the main causes of these failures.9,10 Dissatisfaction with DHS use in unstable fractures led to the use of IM nails. The various IM devices available are condylocephalic (Ender) nails and cephalomedullary nails, such as gamma nails; IM hip screws; trochanteric antegrade nails; proximal femoral nails (PFNs); and trochanteric fixation nails.11,12 Unstable trochanteric fractures treated with these IM fixation devices have had good results.12-14 Because of their central location and shorter lever arm, IM nails decrease the tensile strain on the implant and thereby reduce the risk of implant failure and provide more efficient load transfer while maintaining the advantage of controlled fracture impaction, as in DHS.15,16 According to some authors, IM nail insertion theoretically requires less operative time and less soft-tissue dissection, potentially resulting in decreased overall morbidity.15,16 PFN is one of the most effective fixation methods used to treat unstable trochanteric femur fractures.17 However, it is associated with various technical problems and failures, such as anterior femoral cortex penetration (caused by mismatch of nail curvature and intact femur), lag screw prominence in the lateral thigh, creation of a large hole in the greater trochanter (leading to abductors weakness), and potential for the Z-effect.18,19 Studies have compared PFN with the Less Invasive Stabilization System-Distal Femur (LISS-DF) in the treatment of proximal femur fracture, and the clinical results are encouraging.20,21 Recently, the proximal femoral locking compression plate (PFLCP) was introduced as a new implant that allows for angular-stable plating in the treatment of complex comminuted and osteoporotic intertrochanteric fractures.22,23
To our knowledge, our study is the first to compare functional outcomes and complications of unstable trochanteric fractures treated with PFN and those treated with PFLCP. We hypothesized that both PFN and PFLCP would provide good functional outcomes with acceptable and comparable complications in the treatment of unstable trochanteric fractures.
Materials and Methods
The protocol for this prospective comparative study was approved by the Institutional Review Board at Mayo Institute of Medical Sciences. Informed consent was provided by all patients. A power analysis with power of 90% to detect a Harris Hip Score (HHS) difference of 10 as being significant at the 5% level, and with a 10% to 15% dropout rate, determined that a sample size of 50 patients was needed. Each group (PFN, PFLCP) required at least 25 participants. From April 2009 to June 2011, 74 patients with unilateral closed unstable trochanteric fractures were admitted to our hospital. Of these patients, 48 met our inclusion criteria and were included in the study. A sealed envelope method was used to randomly assign 24 of these patients to PFN treatment and the other 24 to PFLCP treatment. One patient died of causes unrelated to an implant during the study, and 2 were lost to follow-up (telephone numbers changed). The remaining 45 patients (23 PFN, 22 PFLCP) reached 2-year follow-up.
Inclusion criteria were unilateral, closed unstable trochanteric fractures, and age over 18 years. Exclusion criteria were bilateral fractures, polytrauma, pathologic fractures, open fractures (American Society of Anesthesiologists [ASA] grade 4 or 5),24 and associated hip osteoarthritis (Kellgren-Lawrence grade 3 or 4).25 We collected data on demographics, operative time, incision length, intraoperative blood loss (measured by gravimetric method), hospital length of stay (LOS), and time to full weight-bearing. Mean (SD) age was 58.3 (9.3) years for the PFN group (range, 19-82 years) and 60.5 (8.1) years for the PFLCP group (range, 20-84 years). 
Before surgery, each patient’s standard plain radiographs (1 anteroposterior [AP], 1 lateral) were evaluated. Patients underwent surgery as soon as their general medical condition allowed. Surgery was performed through a lateral approach with the patient supine and in traction on a fracture table. PFN patients received 2 femoral neck screws (DePuy Synthes) (Figures A-D), and PFLCP patients received PFLCP (DePuy Synthes) in a fashion similar to that described in AO internal fixation manuals. 
Absolute values of differences were used for statistical analysis. For categorical outcome variables (eg, reoperation reason and type), Pearson χ2 test was used; for continuous variables (eg, pain, HHS), Student t test was used. Statistical significance was set at P = .05 (2-sided).
Results
Intraoperative blood loss (P = .02) and incision length (P = .008) were significantly less in the PFN group than in the PFLCP group. No significant difference was found between the groups in terms of operative time (P = .08), reduction quality (P = .82), radiologic exposure time (P = .18), LOS (P = .32), union rate (P = .42), and time to union (P = .68). 
Two PFN patients and 3 PFLCP patients developed a superficial infection (P = .36); all 5 infections were controlled with oral antibiotics. There was 1 nonunion in the PFN group but none in the PFLCP group (P = .28). The nonunion patient, who also had a broken implant without any history of fresh trauma, was treated with implant removal and bipolar hemiarthroplasty. 
There was no significant difference between the groups in terms of functional outcome (HHS) at final follow-up (P = .48). 
Discussion
The goal in managing proximal femoral fractures is to achieve near anatomical reduction with stable fracture fixation. Over the years, EM and IM devices have been used to treat trochanteric fractures; each has its merits and demerits.29,30 However, unstable trochanteric fractures treated with EM devices (eg, DHS, dynamic condylar screw) have high complication rates (6%-18%).8,31 Excessive sliding of the lag screw within the plate barrel may result in limb shortening and distal fragment medialization. EM devices cannot adequately prevent secondary limb shortening after weight-bearing, owing to medialization of the distal fragment.32,33 Varus collapse and implant failure (eg, cut-out of the femoral head screw) are also common.29 These complications led to the development of IM hip screw devices, such as PFN, which has several potential advantages, including a shorter lever arm (decreases tensile strain on implant) and efficient load transfer capacity. PFN has been found to have increased fracture stability, with no difference in operative time or intraoperative complication rates, but some studies have reported implant failure and other complications (3%-17%) in PFN-treated unstable trochanteric fractures.29,34,35
We conducted the present study to compare PFN and PFLCP, new treatment options for unstable and highly comminuted trochanteric fractures. The characteristics of the patients in this study are very different from those in most hip fracture studies. Our PFN and PFLCP groups’ mean ages were lower relative to other studies.14,15,36 In addition, time from injury to surgery was longer for both our groups than for groups in other studies, though some studies36 have reported comparable times. Moreover, our groups showed no statistically significant differences in operative time, radiologic exposure time, LOS, union rate, or time to union. Our PFN patients had significantly shorter incisions and less time to full weight-bearing.
Wang and colleagues37 compared the clinical outcomes of DHS, IM fixation (IMF), and PFLCP in the treatment of trochanteric fractures in elderly patients. Incision length and operative time were shorter for the IMF group than for DHS and PFLCP, but there were no significant differences between DHS and PFLCP. Intraoperative blood loss, rehabilitation, and time to healing were less for the IMF and PFLCP groups than for DHS, but there were no significant differences between IMF and PFLCP. Functional recovery was better for the IMF and PFLCP groups than for DHS, and there were significant differences among the 3 groups. There were fewer complications in the PFLCP group than in IMF and DHS.
Yao and colleagues38 compared reverse LISS and PFN treatment of intertrochanteric fractures and reported no significant differences in operative time, intraoperative blood loss, or functional outcome. Regarding complications, the PFN group had none, and the LISS group had 3 (1 nonunion with locking screw breakage, 2 varus unions).
Haq and colleagues39 compared PFN and contralateral reverse distal femoral locking compression plate (reverse DFLCP) in the management of unstable intertrochanteric fractures with compromised lateral wall and reported better intraoperative variables, better functional outcomes, and lower failure rates in the PFN group than in the reverse DFLCP group.
Zha and colleagues22 followed up 110 patients with intertrochanteric and subtrochanteric fractures treated with PFLCP fixation and reported a 100% union rate at 1-year follow-up. Mean operative time was 35.5minutes, and mean bleeding amount was 150mL, which included operative blood loss and wound drainage. Mean radiologic exposure time was 5minutes, and mean incision length was 9cm. There was 1 case of implant breakage.
Strohm and colleagues40 reported good results in children with trochanteric fractures treated with conventional locking compression plate.
Brett and colleagues41 compared blade plate and PFLCP with and without a kickstand screw in a composite femur subtrochanteric fracture gap model. In their biomechanical study, the PFLCP with a kickstand screw provided higher axial but less torsional stiffness than the blade plate. The authors concluded that, though the devices are biomechanically equivalent, PFLCP may allow percutaneous insertion that avoids the potential morbidity associated with the blade plate’s extensile approach.
Our PFN group’s mean (SD) time to healing was 4.2 (1.3) months. In other studies, mean healing time for IMF-treated unstable trochanteric fractures was 3 to 4 months. Some authors have reported even longer healing times, up to 17 months,42 for PFN-treated trochanteric fractures. Many of the studies indicated that gradual weight-bearing was allowed around 6 weeks, when callus formation was adequate.43 Our treatment protocol differed in that its protected weight-bearing period was prolonged, and controlled weight-bearing was delayed until around 6 weeks, when callus formation was adequate.
The better PFLCP outcomes in our study, relative to most other studies, can be attributed to the relatively younger age of our PFN and PFLCP groups. In a study of 19 patients with trochanteric fractures treated with open reduction and internal fixation using PFLCP, Wirtz and colleagues44 reported 4 cases of secondary varus collapse, 2 cut-outs of the proximal fragment, and 1 implant failure caused by a broken proximal screw. Eight patients experienced persistent trochanteric pain, and 3 underwent hardware removal.
Streubel and colleagues45 retrospectively analyzed 29 patients with 30 OTA 31.A3 fractures treated with PFLCP and reported 11 failures (37%) at 20-month follow-up. The most frequent failure mode (5 cases) was varus collapse with screw cut-out. Presence of a kickstand screw and medial cortical reduction were not significantly different between cases that failed and those that did not.
Glassner and Tejwani46 retrospectively studied 10 patients with trochanteric fractures treated with open reduction and internal fixation with PFLCP. Failure modes were implant fracture (4 cases) and fixation loss (3 cases) resulting from varus collapse and implant cutout.
One of our PFN patients had a lower neck screw back out by 9-month follow-up. As the fracture had consolidated well, the patient underwent screw removal. Another PFN patient had a broken implant and fracture nonunion at 1-year follow-up. Various complications have been reported in the literature,13,14,47,48 but none occurred in our study. There were no implant-related complications in our PFLCP group, possibly because of the mechanical advantage of 3-dimensional and angular-stable fixation with PFLCP in unstable trochanteric fractures.
Gadegone and Salphale49 analyzed 100 cases of PFN-treated trochanteric fractures and reported femoral head cut-through (4.8%), intraoperative femoral shaft fracture (0.8%), implant breakage (0.8%), wound-healing impairment (9.7%), and false placement of osteosynthesis materials (0.8%). The 19% reoperation rate in their study mainly involved cephalic screw removal for lateral protrusion at the proximal thigh. Our PFN reoperation rate was 8.7%; none of our PFLCP patients required revision surgery.
Tyllianakis and colleagues50 analyzed 45 cases of PFN-treated unstable trochanteric fractures and concluded technical or mechanical complications were related more to fracture type, surgical technique, and time to weight-bearing than to the implant itself. Our postoperative wound complication rate was similar to that of other studies.14,47,51 Regarding functional outcomes, our groups’ HHSs were good and comparable at final follow-up, as were their PPM scores.
This study was limited in that it was a small prospective comparative single-center study with a small number of patients. Larger randomized controlled multicenter studies are needed to evaluate and compare both implants in displaced unstable trochanteric femur fractures.
This study found that both PFN and PFLCP were effective treatments for unstable trochanteric femur fractures. PFN is superior to PFLCP only in terms of shorter incisions and shorter time to full weight-bearing. Both devices can be used in unstable trochanteric fractures, and both have good functional outcomes and acceptable complication rates.
Am J Orthop. 2017;46(2):E116-E123. Copyright Frontline Medical Communications Inc. 2017. All rights reserved.
1. Cummings SR, Rubin SM, Black D. The future of hip fractures in the United States. Numbers, costs, and potential effects of postmenopausal estrogen. Clin Orthop Relat Res. 1990;(252):163-166.
2. Kyle RF, Cabanela ME, Russell TA, et al. Fractures of the proximal part of the femur. Instr Course Lect. 1995;44:227-253.
3. Koval KJ, Aharonoff GB, Rokito AS, Lyon T, Zuckerman JD. Patients with femoral neck and intertrochanteric fractures. Are they the same? Clin Orthop Relat Res. 1996;(330):166-172.
4. Marsh JL, Slongo TF, Agel J, et al. Fracture and dislocation classification compendium - 2007: Orthopaedic Trauma Association classification, database and outcomes committee. J Orthop Trauma. 2007;21(10 suppl):S1-S133.
5. Lindskog D, Baumgaertner MR. Unstable intertrochanteric hip fractures in the elderly. J Am Acad Orthop Surg. 2004;12(3):179-190.
6. Kokoroghiannis C, Aktselis I, Deligeorgis A, Fragkomichalos E, Papadimas D, Pappadas I. Evolving concepts of stability and intramedullary fixation of intertrochanteric fractures—a review. Injury. 2012;43(6):686-693.
7. Larsson S, Friberg S, Hansson LI. Trochanteric fractures. Influence of reduction and implant position on impaction and complications. Clin Orthop Relat Res. 1990;(259):130-139.
8. Simpson AH, Varty K, Dodd CA. Sliding hip screws: modes of failure. Injury. 1989;20(4):227-231.
9. Rha JD, Kim YH, Yoon SI, Park TS, Lee MH. Factors affecting sliding of the lag screw in intertrochanteric fractures. Int Orthop. 1993;17(5):320-324.
10. Baixauli F, Vicent V, Baixauli E, et al. A reinforced rigid fixation device for unstable intertrochanteric fractures. Clin Orthop Relat Res. 1999;(361):205-215.
11. Harrington P, Nihal A, Singhania AK, Howell FR. Intramedullary hip screw versus sliding hip screw for unstable intertrochanteric femoral fractures in the elderly. Injury. 2002;33(1):23-28.
12. Parker MJ, Handoll HH. Gamma and other cephalocondylic intramedullary nails versus extramedullary implants for extracapsular hip fractures in adults. Cochrane Database Syst Rev. 2010;(9):CD000093.
13. Pajarinen J, Lindahl J, Michelsson O, Savolainen V, Hirvensalo E. Pertrochanteric femoral fractures treated with a dynamic hip screw or a proximal femoral nail. A randomised study comparing postoperative rehabilitation. J Bone Joint Surg Br. 2005;87(1):76-81.
14. Papasimos S, Koutsojannis CM, Panagopoulos A, Megas P, Lambiris E. A randomised comparison of AMBI, TGN and PFN for treatment of unstable trochanteric fractures. Arch Orthop Trauma Surg. 2005;125(7):462-468.
15. Saudan M, Lübbeke A, Sadowski C, Riand N, Stern R, Hoffmeyer P. Pertrochanteric fractures: is there an advantage to an intramedullary nail? A randomized, prospective study of 206 patients comparing the dynamic hip screw and proximal femoral nail. J Orthop Trauma. 2002;16(6):386-393.
16. Schipper IB, Steyerberg EW, Castelein RM, et al. Treatment of unstable trochanteric fractures. Randomised comparison of the gamma nail and the proximal femoral nail. J Bone Joint Surg Br. 2004;86(1):86-94.
17. Gardenbroek TJ, Segers MJ, Simmermacher RK, Hammacher ER. The proximal femur nail antirotation: an identifiable improvement in the treatment of unstable pertrochanteric fractures? J Trauma. 2011;71(1):169-174.
18. Egol KA, Chang EY, Cvitkovic J, Kummer FJ, Koval KJ. Mismatch of current intramedullary nails with the anterior bow of the femur. J Orthop Trauma. 2004;18(7):410-415.
19. Werner-Tutschku W, Lajtai G, Schmiedhuber G, Lang T, Pirkl C, Orthner E. Intra- and perioperative complications in the stabilization of per- and subtrochanteric femoral fractures by means of PFN [in German]. Unfallchirurg. 2002;105(10):881-885.
20. Ma CH, Tu YK, Yu SW, Yen CY, Yeh JH, Wu CH. Reverse LISS plates for unstable proximal femoral fractures. Injury. 2010;41(8):827-833.
21. Pryce Lewis JR, Ashcroft GP. Reverse LISS plating for proximal segmental femoral fractures in the polytrauma patient: a case report. Injury. 2007;38(2):235-239.
22. Zha GC, Chen ZL, Qi XB, Sun JY. Treatment of pertrochanteric fractures with a proximal femur locking compression plate. Injury. 2011;42(11):1294-1299.
23. Oh CW, Kim JJ, Byun YS, et al. Minimally invasive plate osteosynthesis of subtrochanteric femur fractures with a locking plate: a prospective series of 20 fractures. Arch Orthop Trauma Surg. 2009;129(12):1659-1665.
24. American Society of Anesthesiologists new classification of physical status. Anesthesiology. 1963;24:111-114.
25. Kellgren JH, Lawrence JS. Radiological assessment of osteo-arthrosis. Ann Rheum Dis. 1957;16(4):494-502.
26. Vidyadhara S, Rao SK. One and two femoral neck screws with intramedullary nails for unstable trochanteric fractures of femur in the elderly—randomised clinical trial. Injury. 2007;38(7):806-814.
27. Parker MJ, Palmer CR. A new mobility score for predicting mortality after hip fracture. J Bone Joint Surg Br. 1993;75(5):797-798.
28. Harris WH. Traumatic arthritis of the hip after dislocation and acetabular fractures: treatment by mold arthroplasty. An end-result study using a new method of result evaluation. J Bone Joint Surg Am. 1969;51(4):737-755.
29. Sadowski C, Lübbeke A, Saudan M, Riand N, Stern R, Hoffmeyer P. Treatment of reverse oblique and transverse intertrochanteric fractures with use of an intramedullary nail or a 95 degrees screw-plate: a prospective, randomized study. J Bone Joint Surg Am. 2002;84(3):372-381.
30. Suckel AA, Dietz K, Wuelker N, Helwig P. Evaluation of complications of three different types of proximal extra-articular femur fractures: differences in complications, age, sex and surviving rates. Int Orthop. 2007;31(5):689-695.
31. Nuber S, Schönweiss T, Rüter A. Stabilisation of unstable trochanteric femoral fractures. Dynamic hip screw (DHS) with trochanteric stabilisation plate vs. proximal femur nail (PFN) [in German]. Unfallchirurg. 2003;106(1):39-47.
32. Klinger HM, Baums MH, Eckert M, Neugebauer R. A comparative study of unstable per- and intertrochanteric femoral fractures treated with dynamic hip screw (DHS) and trochanteric butt-press plate vs. proximal femoral nail (PFN) [in German]. Zentralbl Chir. 2005;130(4):301-306.
33. Bridle SH, Patel AD, Bircher M, Calvert PT. Fixation of intertrochanteric fractures of the femur. A randomised prospective comparison of the gamma nail and the dynamic hip screw. J Bone Joint Surg Br. 1991;73(2):330-334.
34. Utrilla AL, Reig JS, Muñoz FM, Tufanisco CB. Trochanteric gamma nail and compression hip screw for trochanteric fractures: a randomized, prospective, comparative study in 210 elderly patients with a new design of the gamma nail. J Orthop Trauma. 2005;19(4):229-233.
35. Lenich A, Mayr E, Rüter A, Möckl CH, Füchtmeier B. First results with the trochanter fixation nail (TFN): a report on 120 cases. Arch Orthop Trauma Surg. 2006;126(10):706-712.
36. Tao R, Lu Y, Xu H, Zhou ZY, Wang YH, Liu F. Internal fixation of intertrochanteric hip fractures: a clinical comparison of two implant designs. ScientificWorldJournal. 2013;2013:834825.
37. Wang Y, Yang YY, Yu ZH, Li CQ, Wu YS, Zheng XX. Comparative study of intertrochanteric fractures treated with proximal femur locking compress plate in aged [in Chinese]. Zhongguo Gu Shang. 2011;24(5):370-373.
38. Yao C, Zhang CQ, Jin DX, Chen YF. Early results of reverse less invasive stabilization system plating in treating elderly intertrochanteric fractures: a prospective study compared to proximal femoral nail. Chin Med J (Engl). 2011;124(14):2150-2157.
39. Haq RU, Manhas V, Pankaj A, Srivastava A, Dhammi IK, Jain AK. Proximal femoral nails compared with reverse distal femoral locking plates in intertrochanteric fractures with a compromised lateral wall; a randomised controlled trial. Int Orthop. 2014;38(7):1443-1449.
40. Strohm PC, Schmal H, Kuminack K, Reising K, Südkamp NP. Intertrochanteric femoral fractures in children [in German]. Unfallchirurg. 2006;109(5):425-430.
41. Brett CD, Lee MA, Khalafi AK, Hazelwood SJ. A comparison of percutaneous versus traditional open plate fixation in a subtrochanteric fracture gap model. In: Proceedings of the Annual Meeting of the Orthopaedic Trauma Association (OTA); October 5-7, 2006; Phoenix, AZ. Basic science poster 71 (abstract).
42. Park SY, Yang KH, Yoo JH, Yoon HK, Park HW. The treatment of reverse obliquity intertrochanteric fractures with the intramedullary hip nail. J Trauma. 2008;65(4):852-857.
43. Habernek H, Wallner T, Aschauer E, Schmid L. Comparison of Ender nails, dynamic hip screws, and gamma nails in the treatment of peritrochanteric femoral fractures. Orthopedics. 2000;23(2):121-127.
44. Wirtz C, Abbassi F, Evangelopoulos DS, Kohl S, Siebenrock KA, Krüger A. High failure rate of trochanteric fracture osteosynthesis with proximal femoral locking compression plate. Injury. 2013;44(6):751-756.
45. Streubel PN, Moustoukas MJ, Obremskey WT. Mechanical failure after locking plate fixation of unstable intertrochanteric femur fractures. J Orthop Trauma. 2013;27(1):22-28.
46. Glassner PJ, Tejwani NC. Failure of proximal femoral locking compression plate: a case series. J Orthop Trauma. 2011;25(2):76-83.
47. Ekström W, Karlsson-Thur C, Larsson S, Ragnarsson B, Alberts KA. Functional outcome in treatment of unstable trochanteric and subtrochanteric fractures with the proximal femoral nail and the Medoff sliding plate. J Orthop Trauma. 2007;21(1):18-25.
48. Boldin C, Seibert FJ, Fankhauser F, Peicha G, Grechenig W, Szyszkowitz R. The proximal femoral nail (PFN)—a minimal invasive treatment of unstable proximal femoral fractures: a prospective study of 55 patients with a follow-up of 15 months. Acta Orthop Scand. 2003;74(1):53-58.
49. Gadegone WM, Salphale YS. Proximal femoral nail—an analysis of 100 cases of proximal femoral fractures with an average follow up of 1 year. Int Orthop. 2007;31(3):403-408.
50. Tyllianakis M, Panagopoulos A, Papadopoulos A, Papasimos S, Mousafiris K. Treatment of extracapsular hip fractures with the proximal femoral nail (PFN): long term results in 45 patients. Acta Orthop Belg. 2004;70(5):444-454.
51. Morihara T, Arai Y, Tokugawa S, Fujita S, Chatani K, Kubo T. Proximal femoral nail for treatment of trochanteric femoral fractures. J Orthop Surg (Hong Kong). 2007;15(3):273-277.
Take-Home Points
- Both PFN and PFLCP are effective treatments for unstable trochanteric femur fractures.
- PFN is superior to PFLCP only in terms of shorter incisions and shorter time to full weight-bearing.
- Both devices have good long-term functional outcomes.
- Complication rates in unstable trochanteric fractures treated with both implants are comparable.
- Larger randomized controlled multicenter studies are needed to further evaluate and compare both implants in displaced unstable trochanteric femur fractures.
Trochanteric fractures are among the most widely treated orthopedic injuries, occurring mainly as low-energy injuries in elderly patients and high-energy injuries in younger patients.1,2 About half of these injuries are unstable.3 According to the AO/OTA (Arbeitsgemeinschaft für Osteosynthesefragen/Orthopaedic Trauma Association) system, trochanteric fractures can be classified stable (AO/OTA 31.A1-1 to 31.A2-1) or unstable (AO/OTA 31.A2-2 to 31.A3.3).4,5 For surgical fixation of trochanteric femur fractures, various internal fixation devices have been used, either extramedullary (EM) or intramedullary (IM).6 The dynamic hip screw (DHS) is the implant of choice in the treatment of stable trochanteric femur fractures (AO/OTA 31-A1), as it provides secure fixation and controlled impaction.7 Mechanical and technical failures continue to occur in up to 6% to 18% of cases of unstable trochanteric fractures treated with DHS.8 Excessive sliding of the lag screw within the plate barrel results in limb shortening and distal fragment medialization, which are the main causes of these failures.9,10 Dissatisfaction with DHS use in unstable fractures led to the use of IM nails. The various IM devices available are condylocephalic (Ender) nails and cephalomedullary nails, such as gamma nails; IM hip screws; trochanteric antegrade nails; proximal femoral nails (PFNs); and trochanteric fixation nails.11,12 Unstable trochanteric fractures treated with these IM fixation devices have had good results.12-14 Because of their central location and shorter lever arm, IM nails decrease the tensile strain on the implant and thereby reduce the risk of implant failure and provide more efficient load transfer while maintaining the advantage of controlled fracture impaction, as in DHS.15,16 According to some authors, IM nail insertion theoretically requires less operative time and less soft-tissue dissection, potentially resulting in decreased overall morbidity.15,16 PFN is one of the most effective fixation methods used to treat unstable trochanteric femur fractures.17 However, it is associated with various technical problems and failures, such as anterior femoral cortex penetration (caused by mismatch of nail curvature and intact femur), lag screw prominence in the lateral thigh, creation of a large hole in the greater trochanter (leading to abductors weakness), and potential for the Z-effect.18,19 Studies have compared PFN with the Less Invasive Stabilization System-Distal Femur (LISS-DF) in the treatment of proximal femur fracture, and the clinical results are encouraging.20,21 Recently, the proximal femoral locking compression plate (PFLCP) was introduced as a new implant that allows for angular-stable plating in the treatment of complex comminuted and osteoporotic intertrochanteric fractures.22,23
To our knowledge, our study is the first to compare functional outcomes and complications of unstable trochanteric fractures treated with PFN and those treated with PFLCP. We hypothesized that both PFN and PFLCP would provide good functional outcomes with acceptable and comparable complications in the treatment of unstable trochanteric fractures.
Materials and Methods
The protocol for this prospective comparative study was approved by the Institutional Review Board at Mayo Institute of Medical Sciences. Informed consent was provided by all patients. A power analysis with power of 90% to detect a Harris Hip Score (HHS) difference of 10 as being significant at the 5% level, and with a 10% to 15% dropout rate, determined that a sample size of 50 patients was needed. Each group (PFN, PFLCP) required at least 25 participants. From April 2009 to June 2011, 74 patients with unilateral closed unstable trochanteric fractures were admitted to our hospital. Of these patients, 48 met our inclusion criteria and were included in the study. A sealed envelope method was used to randomly assign 24 of these patients to PFN treatment and the other 24 to PFLCP treatment. One patient died of causes unrelated to an implant during the study, and 2 were lost to follow-up (telephone numbers changed). The remaining 45 patients (23 PFN, 22 PFLCP) reached 2-year follow-up.
Inclusion criteria were unilateral, closed unstable trochanteric fractures, and age over 18 years. Exclusion criteria were bilateral fractures, polytrauma, pathologic fractures, open fractures (American Society of Anesthesiologists [ASA] grade 4 or 5),24 and associated hip osteoarthritis (Kellgren-Lawrence grade 3 or 4).25 We collected data on demographics, operative time, incision length, intraoperative blood loss (measured by gravimetric method), hospital length of stay (LOS), and time to full weight-bearing. Mean (SD) age was 58.3 (9.3) years for the PFN group (range, 19-82 years) and 60.5 (8.1) years for the PFLCP group (range, 20-84 years).
Before surgery, each patient’s standard plain radiographs (1 anteroposterior [AP], 1 lateral) were evaluated. Patients underwent surgery as soon as their general medical condition allowed. Surgery was performed through a lateral approach with the patient supine and in traction on a fracture table. PFN patients received 2 femoral neck screws (DePuy Synthes) (Figures A-D), and PFLCP patients received PFLCP (DePuy Synthes) in a fashion similar to that described in AO internal fixation manuals.
Absolute values of differences were used for statistical analysis. For categorical outcome variables (eg, reoperation reason and type), Pearson χ2 test was used; for continuous variables (eg, pain, HHS), Student t test was used. Statistical significance was set at P = .05 (2-sided).
Results
Intraoperative blood loss (P = .02) and incision length (P = .008) were significantly less in the PFN group than in the PFLCP group. No significant difference was found between the groups in terms of operative time (P = .08), reduction quality (P = .82), radiologic exposure time (P = .18), LOS (P = .32), union rate (P = .42), and time to union (P = .68).
Two PFN patients and 3 PFLCP patients developed a superficial infection (P = .36); all 5 infections were controlled with oral antibiotics. There was 1 nonunion in the PFN group but none in the PFLCP group (P = .28). The nonunion patient, who also had a broken implant without any history of fresh trauma, was treated with implant removal and bipolar hemiarthroplasty.
There was no significant difference between the groups in terms of functional outcome (HHS) at final follow-up (P = .48).
Discussion
The goal in managing proximal femoral fractures is to achieve near anatomical reduction with stable fracture fixation. Over the years, EM and IM devices have been used to treat trochanteric fractures; each has its merits and demerits.29,30 However, unstable trochanteric fractures treated with EM devices (eg, DHS, dynamic condylar screw) have high complication rates (6%-18%).8,31 Excessive sliding of the lag screw within the plate barrel may result in limb shortening and distal fragment medialization. EM devices cannot adequately prevent secondary limb shortening after weight-bearing, owing to medialization of the distal fragment.32,33 Varus collapse and implant failure (eg, cut-out of the femoral head screw) are also common.29 These complications led to the development of IM hip screw devices, such as PFN, which has several potential advantages, including a shorter lever arm (decreases tensile strain on implant) and efficient load transfer capacity. PFN has been found to have increased fracture stability, with no difference in operative time or intraoperative complication rates, but some studies have reported implant failure and other complications (3%-17%) in PFN-treated unstable trochanteric fractures.29,34,35
We conducted the present study to compare PFN and PFLCP, new treatment options for unstable and highly comminuted trochanteric fractures. The characteristics of the patients in this study are very different from those in most hip fracture studies. Our PFN and PFLCP groups’ mean ages were lower relative to other studies.14,15,36 In addition, time from injury to surgery was longer for both our groups than for groups in other studies, though some studies36 have reported comparable times. Moreover, our groups showed no statistically significant differences in operative time, radiologic exposure time, LOS, union rate, or time to union. Our PFN patients had significantly shorter incisions and less time to full weight-bearing.
Wang and colleagues37 compared the clinical outcomes of DHS, IM fixation (IMF), and PFLCP in the treatment of trochanteric fractures in elderly patients. Incision length and operative time were shorter for the IMF group than for DHS and PFLCP, but there were no significant differences between DHS and PFLCP. Intraoperative blood loss, rehabilitation, and time to healing were less for the IMF and PFLCP groups than for DHS, but there were no significant differences between IMF and PFLCP. Functional recovery was better for the IMF and PFLCP groups than for DHS, and there were significant differences among the 3 groups. There were fewer complications in the PFLCP group than in IMF and DHS.
Yao and colleagues38 compared reverse LISS and PFN treatment of intertrochanteric fractures and reported no significant differences in operative time, intraoperative blood loss, or functional outcome. Regarding complications, the PFN group had none, and the LISS group had 3 (1 nonunion with locking screw breakage, 2 varus unions).
Haq and colleagues39 compared PFN and contralateral reverse distal femoral locking compression plate (reverse DFLCP) in the management of unstable intertrochanteric fractures with compromised lateral wall and reported better intraoperative variables, better functional outcomes, and lower failure rates in the PFN group than in the reverse DFLCP group.
Zha and colleagues22 followed up 110 patients with intertrochanteric and subtrochanteric fractures treated with PFLCP fixation and reported a 100% union rate at 1-year follow-up. Mean operative time was 35.5minutes, and mean bleeding amount was 150mL, which included operative blood loss and wound drainage. Mean radiologic exposure time was 5minutes, and mean incision length was 9cm. There was 1 case of implant breakage.
Strohm and colleagues40 reported good results in children with trochanteric fractures treated with conventional locking compression plate.
Brett and colleagues41 compared blade plate and PFLCP with and without a kickstand screw in a composite femur subtrochanteric fracture gap model. In their biomechanical study, the PFLCP with a kickstand screw provided higher axial but less torsional stiffness than the blade plate. The authors concluded that, though the devices are biomechanically equivalent, PFLCP may allow percutaneous insertion that avoids the potential morbidity associated with the blade plate’s extensile approach.
Our PFN group’s mean (SD) time to healing was 4.2 (1.3) months. In other studies, mean healing time for IMF-treated unstable trochanteric fractures was 3 to 4 months. Some authors have reported even longer healing times, up to 17 months,42 for PFN-treated trochanteric fractures. Many of the studies indicated that gradual weight-bearing was allowed around 6 weeks, when callus formation was adequate.43 Our treatment protocol differed in that its protected weight-bearing period was prolonged, and controlled weight-bearing was delayed until around 6 weeks, when callus formation was adequate.
The better PFLCP outcomes in our study, relative to most other studies, can be attributed to the relatively younger age of our PFN and PFLCP groups. In a study of 19 patients with trochanteric fractures treated with open reduction and internal fixation using PFLCP, Wirtz and colleagues44 reported 4 cases of secondary varus collapse, 2 cut-outs of the proximal fragment, and 1 implant failure caused by a broken proximal screw. Eight patients experienced persistent trochanteric pain, and 3 underwent hardware removal.
Streubel and colleagues45 retrospectively analyzed 29 patients with 30 OTA 31.A3 fractures treated with PFLCP and reported 11 failures (37%) at 20-month follow-up. The most frequent failure mode (5 cases) was varus collapse with screw cut-out. Presence of a kickstand screw and medial cortical reduction were not significantly different between cases that failed and those that did not.
Glassner and Tejwani46 retrospectively studied 10 patients with trochanteric fractures treated with open reduction and internal fixation with PFLCP. Failure modes were implant fracture (4 cases) and fixation loss (3 cases) resulting from varus collapse and implant cutout.
One of our PFN patients had a lower neck screw back out by 9-month follow-up. As the fracture had consolidated well, the patient underwent screw removal. Another PFN patient had a broken implant and fracture nonunion at 1-year follow-up. Various complications have been reported in the literature,13,14,47,48 but none occurred in our study. There were no implant-related complications in our PFLCP group, possibly because of the mechanical advantage of 3-dimensional and angular-stable fixation with PFLCP in unstable trochanteric fractures.
Gadegone and Salphale49 analyzed 100 cases of PFN-treated trochanteric fractures and reported femoral head cut-through (4.8%), intraoperative femoral shaft fracture (0.8%), implant breakage (0.8%), wound-healing impairment (9.7%), and false placement of osteosynthesis materials (0.8%). The 19% reoperation rate in their study mainly involved cephalic screw removal for lateral protrusion at the proximal thigh. Our PFN reoperation rate was 8.7%; none of our PFLCP patients required revision surgery.
Tyllianakis and colleagues50 analyzed 45 cases of PFN-treated unstable trochanteric fractures and concluded technical or mechanical complications were related more to fracture type, surgical technique, and time to weight-bearing than to the implant itself. Our postoperative wound complication rate was similar to that of other studies.14,47,51 Regarding functional outcomes, our groups’ HHSs were good and comparable at final follow-up, as were their PPM scores.
This study was limited in that it was a small prospective comparative single-center study with a small number of patients. Larger randomized controlled multicenter studies are needed to evaluate and compare both implants in displaced unstable trochanteric femur fractures.
This study found that both PFN and PFLCP were effective treatments for unstable trochanteric femur fractures. PFN is superior to PFLCP only in terms of shorter incisions and shorter time to full weight-bearing. Both devices can be used in unstable trochanteric fractures, and both have good functional outcomes and acceptable complication rates.
Am J Orthop. 2017;46(2):E116-E123. Copyright Frontline Medical Communications Inc. 2017. All rights reserved.
1. Cummings SR, Rubin SM, Black D. The future of hip fractures in the United States. Numbers, costs, and potential effects of postmenopausal estrogen. Clin Orthop Relat Res. 1990;(252):163-166.
2. Kyle RF, Cabanela ME, Russell TA, et al. Fractures of the proximal part of the femur. Instr Course Lect. 1995;44:227-253.
3. Koval KJ, Aharonoff GB, Rokito AS, Lyon T, Zuckerman JD. Patients with femoral neck and intertrochanteric fractures. Are they the same? Clin Orthop Relat Res. 1996;(330):166-172.
4. Marsh JL, Slongo TF, Agel J, et al. Fracture and dislocation classification compendium - 2007: Orthopaedic Trauma Association classification, database and outcomes committee. J Orthop Trauma. 2007;21(10 suppl):S1-S133.
5. Lindskog D, Baumgaertner MR. Unstable intertrochanteric hip fractures in the elderly. J Am Acad Orthop Surg. 2004;12(3):179-190.
6. Kokoroghiannis C, Aktselis I, Deligeorgis A, Fragkomichalos E, Papadimas D, Pappadas I. Evolving concepts of stability and intramedullary fixation of intertrochanteric fractures—a review. Injury. 2012;43(6):686-693.
7. Larsson S, Friberg S, Hansson LI. Trochanteric fractures. Influence of reduction and implant position on impaction and complications. Clin Orthop Relat Res. 1990;(259):130-139.
8. Simpson AH, Varty K, Dodd CA. Sliding hip screws: modes of failure. Injury. 1989;20(4):227-231.
9. Rha JD, Kim YH, Yoon SI, Park TS, Lee MH. Factors affecting sliding of the lag screw in intertrochanteric fractures. Int Orthop. 1993;17(5):320-324.
10. Baixauli F, Vicent V, Baixauli E, et al. A reinforced rigid fixation device for unstable intertrochanteric fractures. Clin Orthop Relat Res. 1999;(361):205-215.
11. Harrington P, Nihal A, Singhania AK, Howell FR. Intramedullary hip screw versus sliding hip screw for unstable intertrochanteric femoral fractures in the elderly. Injury. 2002;33(1):23-28.
12. Parker MJ, Handoll HH. Gamma and other cephalocondylic intramedullary nails versus extramedullary implants for extracapsular hip fractures in adults. Cochrane Database Syst Rev. 2010;(9):CD000093.
13. Pajarinen J, Lindahl J, Michelsson O, Savolainen V, Hirvensalo E. Pertrochanteric femoral fractures treated with a dynamic hip screw or a proximal femoral nail. A randomised study comparing postoperative rehabilitation. J Bone Joint Surg Br. 2005;87(1):76-81.
14. Papasimos S, Koutsojannis CM, Panagopoulos A, Megas P, Lambiris E. A randomised comparison of AMBI, TGN and PFN for treatment of unstable trochanteric fractures. Arch Orthop Trauma Surg. 2005;125(7):462-468.
15. Saudan M, Lübbeke A, Sadowski C, Riand N, Stern R, Hoffmeyer P. Pertrochanteric fractures: is there an advantage to an intramedullary nail? A randomized, prospective study of 206 patients comparing the dynamic hip screw and proximal femoral nail. J Orthop Trauma. 2002;16(6):386-393.
16. Schipper IB, Steyerberg EW, Castelein RM, et al. Treatment of unstable trochanteric fractures. Randomised comparison of the gamma nail and the proximal femoral nail. J Bone Joint Surg Br. 2004;86(1):86-94.
17. Gardenbroek TJ, Segers MJ, Simmermacher RK, Hammacher ER. The proximal femur nail antirotation: an identifiable improvement in the treatment of unstable pertrochanteric fractures? J Trauma. 2011;71(1):169-174.
18. Egol KA, Chang EY, Cvitkovic J, Kummer FJ, Koval KJ. Mismatch of current intramedullary nails with the anterior bow of the femur. J Orthop Trauma. 2004;18(7):410-415.
19. Werner-Tutschku W, Lajtai G, Schmiedhuber G, Lang T, Pirkl C, Orthner E. Intra- and perioperative complications in the stabilization of per- and subtrochanteric femoral fractures by means of PFN [in German]. Unfallchirurg. 2002;105(10):881-885.
20. Ma CH, Tu YK, Yu SW, Yen CY, Yeh JH, Wu CH. Reverse LISS plates for unstable proximal femoral fractures. Injury. 2010;41(8):827-833.
21. Pryce Lewis JR, Ashcroft GP. Reverse LISS plating for proximal segmental femoral fractures in the polytrauma patient: a case report. Injury. 2007;38(2):235-239.
22. Zha GC, Chen ZL, Qi XB, Sun JY. Treatment of pertrochanteric fractures with a proximal femur locking compression plate. Injury. 2011;42(11):1294-1299.
23. Oh CW, Kim JJ, Byun YS, et al. Minimally invasive plate osteosynthesis of subtrochanteric femur fractures with a locking plate: a prospective series of 20 fractures. Arch Orthop Trauma Surg. 2009;129(12):1659-1665.
24. American Society of Anesthesiologists new classification of physical status. Anesthesiology. 1963;24:111-114.
25. Kellgren JH, Lawrence JS. Radiological assessment of osteo-arthrosis. Ann Rheum Dis. 1957;16(4):494-502.
26. Vidyadhara S, Rao SK. One and two femoral neck screws with intramedullary nails for unstable trochanteric fractures of femur in the elderly—randomised clinical trial. Injury. 2007;38(7):806-814.
27. Parker MJ, Palmer CR. A new mobility score for predicting mortality after hip fracture. J Bone Joint Surg Br. 1993;75(5):797-798.
28. Harris WH. Traumatic arthritis of the hip after dislocation and acetabular fractures: treatment by mold arthroplasty. An end-result study using a new method of result evaluation. J Bone Joint Surg Am. 1969;51(4):737-755.
29. Sadowski C, Lübbeke A, Saudan M, Riand N, Stern R, Hoffmeyer P. Treatment of reverse oblique and transverse intertrochanteric fractures with use of an intramedullary nail or a 95 degrees screw-plate: a prospective, randomized study. J Bone Joint Surg Am. 2002;84(3):372-381.
30. Suckel AA, Dietz K, Wuelker N, Helwig P. Evaluation of complications of three different types of proximal extra-articular femur fractures: differences in complications, age, sex and surviving rates. Int Orthop. 2007;31(5):689-695.
31. Nuber S, Schönweiss T, Rüter A. Stabilisation of unstable trochanteric femoral fractures. Dynamic hip screw (DHS) with trochanteric stabilisation plate vs. proximal femur nail (PFN) [in German]. Unfallchirurg. 2003;106(1):39-47.
32. Klinger HM, Baums MH, Eckert M, Neugebauer R. A comparative study of unstable per- and intertrochanteric femoral fractures treated with dynamic hip screw (DHS) and trochanteric butt-press plate vs. proximal femoral nail (PFN) [in German]. Zentralbl Chir. 2005;130(4):301-306.
33. Bridle SH, Patel AD, Bircher M, Calvert PT. Fixation of intertrochanteric fractures of the femur. A randomised prospective comparison of the gamma nail and the dynamic hip screw. J Bone Joint Surg Br. 1991;73(2):330-334.
34. Utrilla AL, Reig JS, Muñoz FM, Tufanisco CB. Trochanteric gamma nail and compression hip screw for trochanteric fractures: a randomized, prospective, comparative study in 210 elderly patients with a new design of the gamma nail. J Orthop Trauma. 2005;19(4):229-233.
35. Lenich A, Mayr E, Rüter A, Möckl CH, Füchtmeier B. First results with the trochanter fixation nail (TFN): a report on 120 cases. Arch Orthop Trauma Surg. 2006;126(10):706-712.
36. Tao R, Lu Y, Xu H, Zhou ZY, Wang YH, Liu F. Internal fixation of intertrochanteric hip fractures: a clinical comparison of two implant designs. ScientificWorldJournal. 2013;2013:834825.
37. Wang Y, Yang YY, Yu ZH, Li CQ, Wu YS, Zheng XX. Comparative study of intertrochanteric fractures treated with proximal femur locking compress plate in aged [in Chinese]. Zhongguo Gu Shang. 2011;24(5):370-373.
38. Yao C, Zhang CQ, Jin DX, Chen YF. Early results of reverse less invasive stabilization system plating in treating elderly intertrochanteric fractures: a prospective study compared to proximal femoral nail. Chin Med J (Engl). 2011;124(14):2150-2157.
39. Haq RU, Manhas V, Pankaj A, Srivastava A, Dhammi IK, Jain AK. Proximal femoral nails compared with reverse distal femoral locking plates in intertrochanteric fractures with a compromised lateral wall; a randomised controlled trial. Int Orthop. 2014;38(7):1443-1449.
40. Strohm PC, Schmal H, Kuminack K, Reising K, Südkamp NP. Intertrochanteric femoral fractures in children [in German]. Unfallchirurg. 2006;109(5):425-430.
41. Brett CD, Lee MA, Khalafi AK, Hazelwood SJ. A comparison of percutaneous versus traditional open plate fixation in a subtrochanteric fracture gap model. In: Proceedings of the Annual Meeting of the Orthopaedic Trauma Association (OTA); October 5-7, 2006; Phoenix, AZ. Basic science poster 71 (abstract).
42. Park SY, Yang KH, Yoo JH, Yoon HK, Park HW. The treatment of reverse obliquity intertrochanteric fractures with the intramedullary hip nail. J Trauma. 2008;65(4):852-857.
43. Habernek H, Wallner T, Aschauer E, Schmid L. Comparison of Ender nails, dynamic hip screws, and gamma nails in the treatment of peritrochanteric femoral fractures. Orthopedics. 2000;23(2):121-127.
44. Wirtz C, Abbassi F, Evangelopoulos DS, Kohl S, Siebenrock KA, Krüger A. High failure rate of trochanteric fracture osteosynthesis with proximal femoral locking compression plate. Injury. 2013;44(6):751-756.
45. Streubel PN, Moustoukas MJ, Obremskey WT. Mechanical failure after locking plate fixation of unstable intertrochanteric femur fractures. J Orthop Trauma. 2013;27(1):22-28.
46. Glassner PJ, Tejwani NC. Failure of proximal femoral locking compression plate: a case series. J Orthop Trauma. 2011;25(2):76-83.
47. Ekström W, Karlsson-Thur C, Larsson S, Ragnarsson B, Alberts KA. Functional outcome in treatment of unstable trochanteric and subtrochanteric fractures with the proximal femoral nail and the Medoff sliding plate. J Orthop Trauma. 2007;21(1):18-25.
48. Boldin C, Seibert FJ, Fankhauser F, Peicha G, Grechenig W, Szyszkowitz R. The proximal femoral nail (PFN)—a minimal invasive treatment of unstable proximal femoral fractures: a prospective study of 55 patients with a follow-up of 15 months. Acta Orthop Scand. 2003;74(1):53-58.
49. Gadegone WM, Salphale YS. Proximal femoral nail—an analysis of 100 cases of proximal femoral fractures with an average follow up of 1 year. Int Orthop. 2007;31(3):403-408.
50. Tyllianakis M, Panagopoulos A, Papadopoulos A, Papasimos S, Mousafiris K. Treatment of extracapsular hip fractures with the proximal femoral nail (PFN): long term results in 45 patients. Acta Orthop Belg. 2004;70(5):444-454.
51. Morihara T, Arai Y, Tokugawa S, Fujita S, Chatani K, Kubo T. Proximal femoral nail for treatment of trochanteric femoral fractures. J Orthop Surg (Hong Kong). 2007;15(3):273-277.
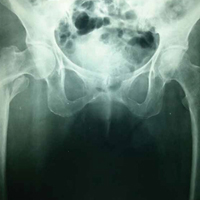
Flesh-Colored Nodule With Underlying Sclerotic Plaque
The Diagnosis: Collision Tumor
Excisional biopsy and histopathological examination demonstrated a collision tumor composed of a benign intradermal melanocytic nevus, tumor of follicular infundibulum, and an underlying sclerosing epithelial neoplasm, with a differential diagnosis of desmoplastic trichoepithelioma, morpheaform basal cell carcinoma, and microcystic adnexal carcinoma (Figure).
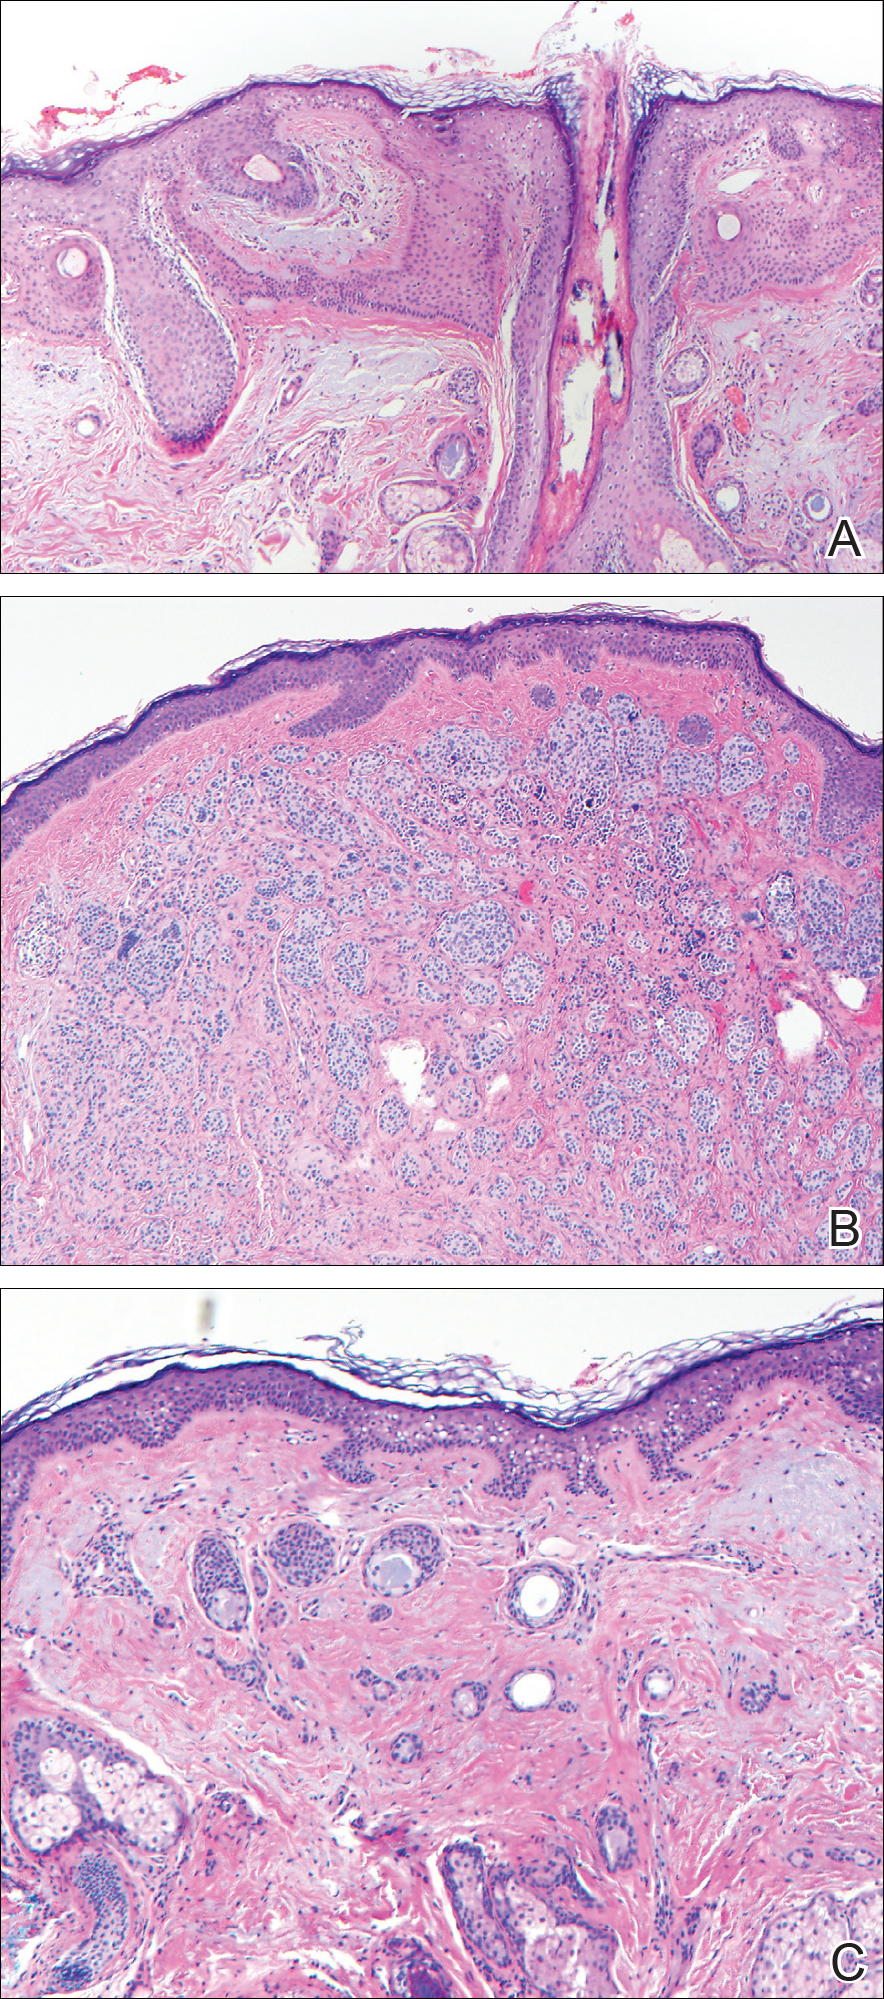
Common acquired melanocytic nevus presents clinically as a macule, papule, or nodule with smooth regular borders. The pigmented variant displays an evenly distributed pigment on the lesion. Intradermal melanocytic nevus often presents as a flesh-colored nodule, as in our case. Histopathologically, benign intradermal nevus typically is composed of a proliferation of melanocytes that exhibit dispersion as they go deeper in the dermis and maturation that manifests as melanocytes becoming smaller and more spindled in the deeper portions of the lesion.1 These 2 characteristics plus the bland cytology seen in the present case confirm the benign characteristic of this lesion (Figure, B).
In addition to the benign intradermal melanocytic nevus, an adjacent tumor of follicular infundibulum was noted. Tumor of follicular infundibulum is a rare adnexal tumor. It occurs frequently on the head and neck and shows some female predominance.2,3 Multiple lesions and eruptive lesions are rare forms that also have been reported.4 Histopathologically, the tumor demonstrates an epithelial plate that is present in the papillary dermis and is connected to the epidermis at multiple points with attachment to the follicular outer root sheath. Peripheral palisading is characteristically present above an eosinophilic basement membrane (Figure, A). Rare reports have documented sebaceous and eccrine differentiation.5,6
Tumor of follicular infundibulum has been reported to be associated with other tumors. Organoid nevus (nevus sebaceous), trichilemmal tumor, and fibroma have been reported to occur as a collision tumor with tumor of follicular infundibulum. An association with Cowden disease also has been described.7 Biopsies that represent partial samples should be interpreted cautiously, as step sections can reveal basal cell carcinoma.
The term sclerosing epithelial neoplasm describes tumors that share a paisley tielike epithelial pattern and sclerotic stroma. Small specimens often require clinicopathologic correlation (Figure, C). The differential diagnosis includes morpheaform basal cell carcinoma, desmoplastic trichoepithelioma, and microcystic adnexal carcinoma. A panel of stains using Ber-EP4, PHLDA1, cytokeratin 15, and cytokeratin 19 has been proposed to help differentiate these entities.8 CD34 and cytokeratin 20 also have been used with varying success in small specimens.9,10
- Ferringer T, Peckham S, Ko CJ, et al. Melanocytic neoplasms. In: Elston DM, Ferringer T, eds. Dermatopathology. 2nd ed. Philadelphia, PA: Elsevier Saunders; 2014:105-109.
- Headington JT. Tumors of the hair follicle. Am J Pathol. 1976;85:480-505.
- Davis DA, Cohen PR. Hair follicle nevus: case report and review of the literature. Pediatr Dermatol. 1996;13:135-138.
- Ikeda S, Kawada J, Yaguchi H, et al. A case of unilateral, systematized linear hair follicle nevi associated with epidermal nevus-like lesions. Dermatology. 2003;206:172-174.
- Mehregan AH. Hair follicle tumors of the skin. J Cutan Pathol. 1985;12:189-195.
- Mahalingam M, Bhawan J, Finn R, et al. Tumor of the follicular infundibulum with sebaceous differentiation. J Cutan Pathol. 2001;28:314-317.
- Cribier B, Grosshans E. Tumor of the follicular infundibulum: a clinicopathologic study. J Am Acad Dermatol. 1995;33:979-984.
- Sellheyer K, Nelson P, Kutzner H, et al. The immunohistochemical differential diagnosis of microcystic adnexal carcinoma, desmoplastic trichoepithelioma and morpheaform basal cell carcinoma using BerEP4 and stem cell markers. J Cutan Pathol. 2013;40:363-370.
- Abesamis-Cubillan E, El-Shabrawi-Caelen L, LeBoit PE. Merkel cells and sclerosing epithelial neoplasms. Am J Dermatopathol. 2000;22:311-315.
- Smith KJ, Williams J, Corbett D, et al. Microcystic adnexal carcinoma: an immunohistochemical study including markers of proliferation and apoptosis. Am J Surg Pathol. 2001;25:464-471.
The Diagnosis: Collision Tumor
Excisional biopsy and histopathological examination demonstrated a collision tumor composed of a benign intradermal melanocytic nevus, tumor of follicular infundibulum, and an underlying sclerosing epithelial neoplasm, with a differential diagnosis of desmoplastic trichoepithelioma, morpheaform basal cell carcinoma, and microcystic adnexal carcinoma (Figure).
Common acquired melanocytic nevus presents clinically as a macule, papule, or nodule with smooth regular borders. The pigmented variant displays an evenly distributed pigment on the lesion. Intradermal melanocytic nevus often presents as a flesh-colored nodule, as in our case. Histopathologically, benign intradermal nevus typically is composed of a proliferation of melanocytes that exhibit dispersion as they go deeper in the dermis and maturation that manifests as melanocytes becoming smaller and more spindled in the deeper portions of the lesion.1 These 2 characteristics plus the bland cytology seen in the present case confirm the benign characteristic of this lesion (Figure, B).
In addition to the benign intradermal melanocytic nevus, an adjacent tumor of follicular infundibulum was noted. Tumor of follicular infundibulum is a rare adnexal tumor. It occurs frequently on the head and neck and shows some female predominance.2,3 Multiple lesions and eruptive lesions are rare forms that also have been reported.4 Histopathologically, the tumor demonstrates an epithelial plate that is present in the papillary dermis and is connected to the epidermis at multiple points with attachment to the follicular outer root sheath. Peripheral palisading is characteristically present above an eosinophilic basement membrane (Figure, A). Rare reports have documented sebaceous and eccrine differentiation.5,6
Tumor of follicular infundibulum has been reported to be associated with other tumors. Organoid nevus (nevus sebaceous), trichilemmal tumor, and fibroma have been reported to occur as a collision tumor with tumor of follicular infundibulum. An association with Cowden disease also has been described.7 Biopsies that represent partial samples should be interpreted cautiously, as step sections can reveal basal cell carcinoma.
The term sclerosing epithelial neoplasm describes tumors that share a paisley tielike epithelial pattern and sclerotic stroma. Small specimens often require clinicopathologic correlation (Figure, C). The differential diagnosis includes morpheaform basal cell carcinoma, desmoplastic trichoepithelioma, and microcystic adnexal carcinoma. A panel of stains using Ber-EP4, PHLDA1, cytokeratin 15, and cytokeratin 19 has been proposed to help differentiate these entities.8 CD34 and cytokeratin 20 also have been used with varying success in small specimens.9,10
- Ferringer T, Peckham S, Ko CJ, et al. Melanocytic neoplasms. In: Elston DM, Ferringer T, eds. Dermatopathology. 2nd ed. Philadelphia, PA: Elsevier Saunders; 2014:105-109.
- Headington JT. Tumors of the hair follicle. Am J Pathol. 1976;85:480-505.
- Davis DA, Cohen PR. Hair follicle nevus: case report and review of the literature. Pediatr Dermatol. 1996;13:135-138.
- Ikeda S, Kawada J, Yaguchi H, et al. A case of unilateral, systematized linear hair follicle nevi associated with epidermal nevus-like lesions. Dermatology. 2003;206:172-174.
- Mehregan AH. Hair follicle tumors of the skin. J Cutan Pathol. 1985;12:189-195.
- Mahalingam M, Bhawan J, Finn R, et al. Tumor of the follicular infundibulum with sebaceous differentiation. J Cutan Pathol. 2001;28:314-317.
- Cribier B, Grosshans E. Tumor of the follicular infundibulum: a clinicopathologic study. J Am Acad Dermatol. 1995;33:979-984.
- Sellheyer K, Nelson P, Kutzner H, et al. The immunohistochemical differential diagnosis of microcystic adnexal carcinoma, desmoplastic trichoepithelioma and morpheaform basal cell carcinoma using BerEP4 and stem cell markers. J Cutan Pathol. 2013;40:363-370.
- Abesamis-Cubillan E, El-Shabrawi-Caelen L, LeBoit PE. Merkel cells and sclerosing epithelial neoplasms. Am J Dermatopathol. 2000;22:311-315.
- Smith KJ, Williams J, Corbett D, et al. Microcystic adnexal carcinoma: an immunohistochemical study including markers of proliferation and apoptosis. Am J Surg Pathol. 2001;25:464-471.
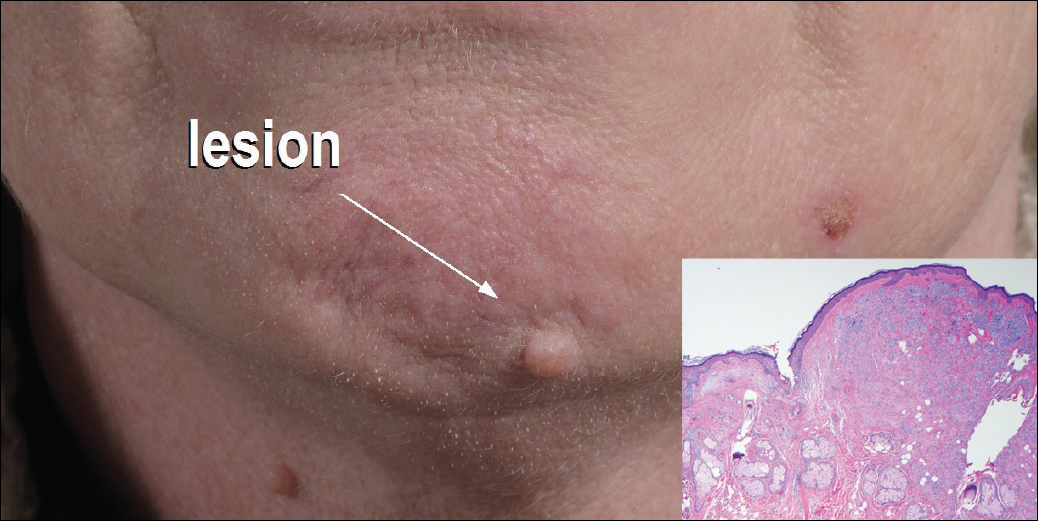
A 54-year-old man presented with a flesh-colored lesion on the chin. The nodule measured 0.6 cm in diameter. There was an underlying sclerotic plaque with indistinct borders.
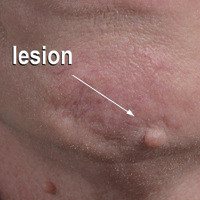
Bevy of monoclonal antibody migraine prevention trials awaits attendees
Calcitonin gene–related peptide (CGRP) monoclonal antibodies for migraine prevention will take center stage at the upcoming annual meeting of the American Academy of Neurology in Boston in a variety of talks aimed at describing the latest clinical trial findings.
Amaal J. Starling, MD, of the Mayo Clinic, Phoenix, Ariz., will lead off on the topic in the Contemporary Clinical Issues Plenary Session on April 24 by discussing in her presentation, “The Era of Targeted Preventive Treatment for Migraine: CGRP Monoclonal Antibodies,” the impact that CGRP monoclonal antibodies may have on migraine treatment
In the first of two presentations on the primary results of two phase III migraine prevention trials for the CGRP monoclonal antibody erenumab, also known as AMG 334, Peter Goadsby, MD, PhD, of the University of California, San Francisco, will report on the STRIVE trial in the Clinical Trials Plenary Session on April 25.
STRIVE is investigating two doses of erenumab against placebo in a 24-week trial examining the primary outcome of a change from baseline in mean monthly migraine days among 955 patients with a 1-year history of episodic migraine who are currently, have previously, or have never received migraine prophylactic medication. Patients will then be randomized after this initial double-blind treatment phase to 28 weeks of open-label active treatment with either dose of erenumab.
Later on April 25 in the Emerging Science Platform Session, David W. Dodick, MD, of the Mayo Clinic in Phoenix is set to describe the results of the phase III ARISE trial. Investigators in ARISE tested 12 weeks of one dosing regimen of erenumab versus placebo on the change from baseline in mean monthly migraine days in 577 patients with episodic migraine, followed by a 28-week open-label treatment phase.
Phase II study results of erenumab in the prevention of chronic migraine can be viewed April 28 in the “Headache: Clinical Trials and Disease Burden” platform session. The trial tested two doses of erenumab against placebo to detect differences in the change in monthly migraine days from baseline in the last 4 weeks of the trial’s 12-week double-blind treatment phase. The phase II trial results of a different CGRP monoclonal antibody known as eptinezumab or ALD403 in the prevention of chronic migraine will also be reported in the same platform session. The study evaluated a variety of doses of the drug for superiority against placebo in reducing the number of migraine days by 75% over 12 weeks.
AAN spotlights spinal muscular atrophy clinical research
A variety of plenary and emerging science sessions at this year’s annual meeting of the American Academy of Neurology in Boston will highlight clinical research efforts to treat children with spinal muscular atrophy.
At the Hot Topics Plenary Session on April 22, Claudia A. Chiriboga, MD, of Columbia University, New York, will discuss the results of clinical trials involving antisense oligonucleotide treatments for spinal muscular atrophy (SMA), including the recently approved nusinersen (Spinraza), which promotes transcription of the full-length survival motor neuron (SMN) protein from the SMN2 gene.
In the first of two reports on new clinical research about nusinersen, Nancy L. Kuntz, MD, of Ann & Robert H. Lurie Children’s Hospital of Chicago will present the initial interim efficacy and safety findings from the phase III international ENDEAR study on April 24 at the Contemporary Clinical Issues Plenary Session. The study of 122 infants with SMA is comparing intrathecal administration of nusinersen against a sham procedure of a small needle prick on the lower back to look for differences at day 402 in the primary outcome of the percentage of patients who attain motor milestones as assessed by section 2 of the Hammersmith Infant Neurological Examination or the time to death or need for respiratory intervention. Charlotte J. Sumner, MD, of Johns Hopkins University, Baltimore, will discuss the study following Dr. Kuntz’s presentation.
The second nusinersen trial to be reported at the meeting will describe interim results of the drug’s efficacy and safety in children with later-onset SMA in the phase III CHERISH study. At the Emerging Science Platform Session on April 25, Richard S. Finkel, MD, of Nemours Children’s Hospital in Orlando, Fla., will discuss how the primary outcome of the Hammersmith Functional Motor Scale–Expanded score changed from baseline to 15 months following intrathecal injection or a sham procedure in children aged 2-12 years.
An investigational SMA type 1 treatment just beginning testing in clinical trials will also receive attention in a plenary session and a platform session. In the Clinical Trials Plenary Session on April 25, Jerry R. Mendell, MD, of Nationwide Children’s Hospital, Columbus, Ohio, will report on the first gene therapy trial for SMA type 1, a phase I trial of AVXS-101, which delivers the SMN gene in a AAV9 viral vector that is able to cross the blood-brain barrier. The primary objective of the trial is to assess safety of a single intravenous dose. The secondary objectives include survival (avoidance of death/permanent-ventilation) and the ability to sit unassisted. Other analyses of data from the phase I trial will be reported during the “Motor Neuron Diseases: Biomarkers, Outcome Measures, and Therapeutics,” platform session on April 24, including the evaluation of preexisting anti-AAV9 antibodies and the proportion of patients who achieve CHOP-INTEND scores of 50 and above and sit unassisted.
CCP status doesn’t influence tocilizumab’s effectiveness in RA
Among adults with rheumatoid arthritis, serologic status regarding anti–cyclic citrullinated peptide (CCP) antibodies doesn’t appear to influence the effectiveness of tocilizumab therapy, according to a report published in Seminars in Arthritis and Rheumatism.
Compared with patients who have anti-CCP antibodies, those who don’t show differences in immune activation that may affect their response to various therapies. In particular, some experts have hypothesized that monoclonal antibodies such as tocilizumab that target the interleukin-6 receptor would be more effective in patients who are seronegative for anti-CCP antibodies than in those who are seropositive. Being able to predict patient response based on easily available biomarkers like CCP status would greatly assist treatment selection, said Laura C. Cappelli, MD, of the division of rheumatology at Johns Hopkins University, Baltimore, and her associates.
All but one of these eight measures of disease activity (the mHAQ) improved significantly with tocilizumab, regardless of patient anti-CCP status. In addition, the magnitude of change did not differ by anti-CCP status. These results persisted across several sensitivity analyses, Dr. Cappelli and her associates said (Semin Arthritis Rheum. 2017 Apr 1. doi: 10.1016/j.semarthrit.2017.03.024).
The findings indicate that CCP seronegativity does not improve the response to tocilizumab in this population derived from real-world patients at diverse clinical sites, the investigators noted.
This study was supported by the National Institute of Arthritis and Musculoskeletal and Skin Diseases. Dr. Cappelli and her associates reported having no relevant financial disclosures.
FROM SEMINARS IN ARTHRITIS AND RHEUMATISM
Key clinical point: In adults with RA, serologic status regarding anti–cyclic citrullinated peptide antibodies doesn’t appear to influence the effectiveness of tocilizumab therapy.
Major finding: Seven of eight measures of disease activity improved significantly with tocilizumab, regardless of the patients’ CCP status.
Data source: A secondary analysis of data from a patient registry regarding 316 adults who initiated tocilizumab in a 6-year period.
Disclosures: This study was supported by the National Institute of Arthritis and Musculoskeletal and Skin Diseases. Dr. Cappelli and her associates reported having no relevant financial disclosures.
A Heart Failure Management Program Using Shared Medical Appointments
Rising health care costs have led to threats of nonreimbursement for rehospitalization within 30 days postdischarge.1,2 Heart failure (HF) in particular is characterized by the highest 30-day rehospitalization rate (23.5% in 2013), which accounts for more than two-thirds of HF expenditures.3,4
Much of HF-related health care costs can be addressed with effective self-management by patients with HF. Therefore, developing and implementing effective disease management programs for this high-risk patient population is essential. Heart failure management programs may include optimizing HF medications, improving patient understanding of the importance of appropriate diet and physical activity, and cultivating psychological health and well-being. In a 2013 systematic review and meta-analysis, Wakefield and colleagues found that disease management programs improved nearly all HF outcomes, including lower mortality rates, lower hospital readmission rates, fewer clinic visits, higher satisfaction with care, and higher quality of life, compared with a no-treatment control or standard care.5 Moreover, these programs demonstrated cost-effectiveness by reducing HF-related hospitalizations and health care expenditures.5
One method to deliver specialized disease management programs to a greater number of patients may be to use shared medical appointments (SMAs). In a randomized controlled trial, Smith and colleagues demonstrated improved HF outcomes through 7 months among veterans who attended SMAs for HF management.6 However, the trial enrolled only 25% of patients screened, and 63% of the patients who did not enroll were classified as not interested. These findings suggest that patients with HF, and veterans in particular, may face additional barriers to enrolling in HF management programs, and these results may not be fully representative of veterans with HF.
In this study, the authors used a naturalistic study design via retrospective review of the electronic health record (EHR) to evaluate whether patients with acute HF who chose to attend SMAs promoting self-management skills for HF would have better hospitalization outcomes compared with those who received individual disease management instructions in a HF specialty clinic (ie, usual care). The authors hypothesized that veterans who participated in the HF SMA clinic would have fewer 12-month HF-related and all-cause hospitalizations, fewer days in the hospital, and more days to first hospitalization compared with patients in usual care.
Methods
The clinic for veterans with acute HF was initiated in October, 2010 at the Jesse Brown VAMC (JBVAMC) in Chicago, Illinois, to reduce readmissions by targeting patients who had been previously hospitalized for HF. In September 2011, the multidisciplinary SMA clinic was developed within the HF clinic to provide enhanced care focused on self-management strategies for patients with HF. The HF SMA program comprised 4 weekly face-to-face sessions co-led by a nurse practitioner (NP), a dietitian, and a clinical psychologist, similar to what has been shown to be successful and cost-effective in nonveteran populations.6-8 Patients attended at least 4 sessions before graduating to the advanced HF SMA program where they could attend monthly booster sessions. The program promoted self-management by providing education about and support for the HF process, HF medications, diet adherence, physical activity, psychological well-being, and stress management via interactive presentations. During the visit, patients’ medication and food logs were reviewed. Patients were encouraged to discuss successes and obstacles in achieving their goals. All study procedures were approved by the institutional review board at JBVAMC.
Study Design
Data were collected by retrospective review of the JBVAMC EHR. The EHR was reviewed for all veterans scheduled for ≥ 1 SMA clinic visit within the HF specialty clinic using predetermined, convenient selection between January 1, 2012, and December 31, 2013. Outcome data were collected through 12-month follow-up (through December 31, 2014).
Patients in both treatment arms received HF care through the HF clinic, including one-on-one education regarding HF self-management provided by a NP. Patients were assigned to the HF SMA group if they also attended the HF SMA clinic within 3 months of their initial HF clinic consult. The number of SMAs attended was included as a covariate in the models. Patients who were scheduled for, but did not attend, the HF SMA clinic were assigned to the HF clinic group. Patients who attended the initial HF consult before September 1, 2011, were excluded, thereby ensuring that all patients included in the present analyses had the opportunity to attend the HF SMA appointment within the predetermined period of chart review.
Data for all VA hospitalizations that occurred between January 1, 2012 and December 31, 2014, were extracted from the EHR. Extracted data included admission date, discharge date, and discharge diagnoses. From these data, the authors assessed 4 hospitalization outcomes for each HF hospitalization and all-cause hospitalization within 12 months of the initial HF clinic consult date: hospitalization (yes/no), number of hospitalizations, number of days in the hospital, and days to first hospitalization.
Data Analysis
Demographic, HF characteristics, and HF outcome variables for the HF SMA and HF clinic groups were compared using t tests and chi-square analyses. Logistic regressions were used to predict 12-month hospitalization, linear regressions were used to predict number of hospitalizations and number of days hospitalized, and Cox proportional hazards regressions were used to predict time from initial HF consult to first hospitalization for each HF-related hospitalization variable and all-cause hospitalization variable. A separate logistic regression was conducted to predict 12-month all-cause mortality. The primary predictor variable of interest for all models was group membership (HF SMA vs HF clinic). Covariates in all models included race (black vs nonblack), ethnicity (Hispanic/Latino vs non-Hispanic/Latino), age, and number of HF SMAs attended.
Results
Of 709 HF SMA clinic appointments made for 141 patients between January 1, 2012, and December 31, 2013, 54 patients were assigned to the HF SMA group and 37 patients were assigned to the HF clinic group (Figure). The majority of the sample was black (87%), non-Hispanic/Latino (96%), and the average age was 68 years. Patients were more likely to have nonischemic (rather than ischemic) cardiomyopathy (66%) and more likely to have HF with reduced (rather than preserved) ejection fraction (76%; ie, systolic HF). Furthermore, 40% of the sample was diagnosed with atrial fibrillation (AF) or atrial flutter (A-flutter), and 24% had an implantable cardioverter-defibrillator or pacemaker. There were no significant differences in demographics or HF characteristics between the HF SMA group and the HF clinic group (Table).
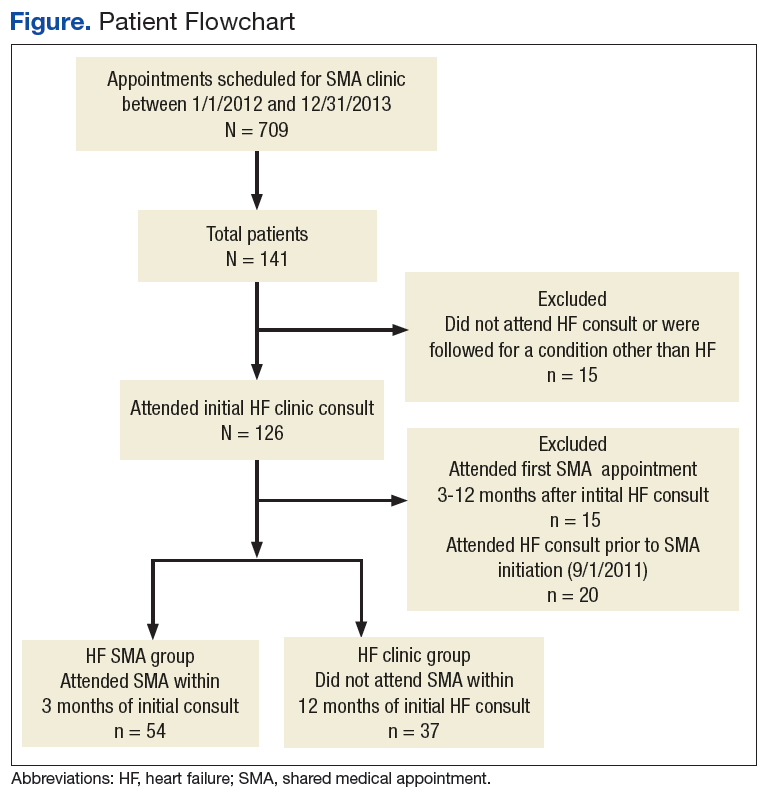
HF Hospitalization Outcomes
During the 12-month follow-up, 32 patients were hospitalized for HF, 18 (33.3%) in the SMA group and 14 (37.8%) in the HF clinic group, P = .658. Patients were hospitalized up to 4 times for between 1 and 38 days, and from 1 to 352 days postconsult. No differences between the HF SMA group and HF clinic group were observed on any of the HF hospitalization outcomes (Table). Group membership did not predict HF hospitalization (odds ratio [OR]: 0.39, 95% confidence interval [CI]: 0.11-1.42), number of HF hospitalizations (β: 0.15, SE: 0.29), number of days hospitalized for HF (β: 0.1.66, SE: 2.01), or time to first HF hospitalization (hazard ratio [HR]: 1.35, 95% CI: 0.66-2.77), all Ps > .10. In the Cox proportional hazards regression predicting time to HF hospitalization, the coefficients did not converge when the model included demographic covariates; therefore, the model was run only with HF group as a predictor variable. For all other models, no covariates significantly predicted HF hospitalization outcomes.
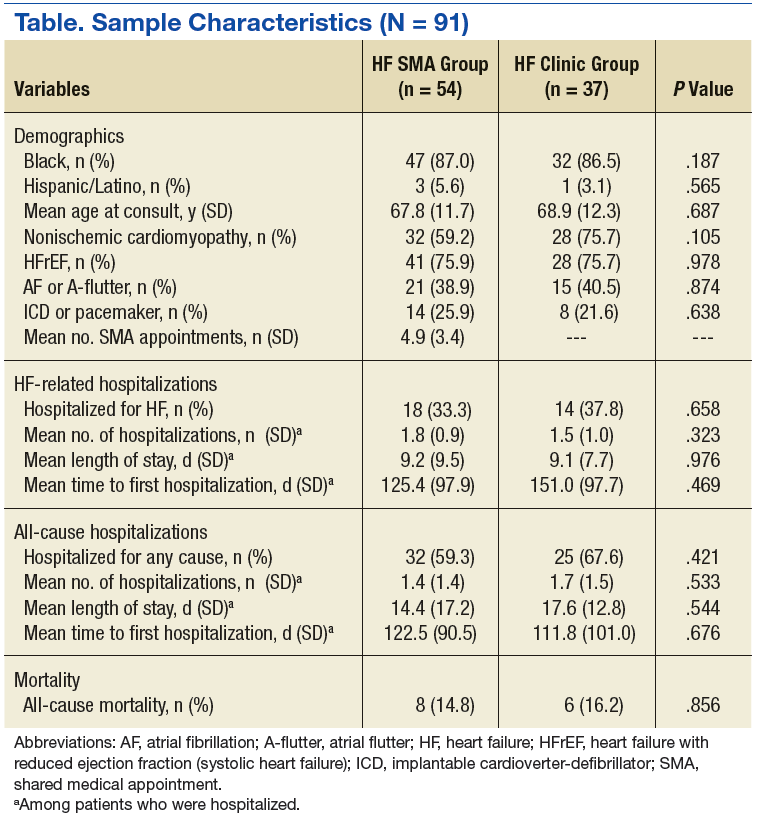
All-Cause Hospitalization Outcomes
During the 12-month follow-up, 57 patients were hospitalized for any cause (including HF hospitalizations), 32 (59.3%) in the SMA group and 25 (67.6%) in the HF clinic group, P = .421. Patients were hospitalized up to 6 times for between 1 and 106 days and from 1 to 352 days postconsult. No differences were observed between the groups on any of the all-cause hospitalization outcomes (Table). Group membership did not predict all-cause hospitalization (OR: 0.34, 95% CI: 0.10-1.19), number of all-cause hospitalizations (β: 0.49, SE: 0.41), number of days hospitalized for any cause (β: 5.15, SE: 5.15), or time to first all-cause hospitalization (HR: 0.98, 95% CI: 0.56-1.72), all P > .05. None of the covariates predicted any of the all-cause hospitalization outcomes.
All-Cause Mortality Outcomes
During the 12-month follow-up, 14 patients (15%) died of any cause, 8 (15%) in the SMA group and 6 (16%) in the HF clinic group, P = .856. Group membership did not predict all-cause mortality (OR: 2.32, 95% CI: 0.44-12.18), and likewise none of the covariates were associated with 12-month all-cause mortality.
Discussion
This study was a naturalistic, retrospective examination of a HF management program promoting self-management delivered via multidisciplinary SMAs among veterans who enrolled in an acute HF specialty clinic. The authors’ hypothesis was not supported: patients who attended the HF SMA clinic did not have lower 12-month hospitalization or mortality rates, shorter hospital stays, or longer time to hospitalization compared with patients in the HF clinic only.
In contrast to the patient-centered approach of this study, a randomized trial delivering a similar disease management program found that patients with acute HF in the SMA group had better short-term (< 7 months) hospitalization outcomes, specifically greater time to first HF-related hospitalization (HR 0.45, 95% CI: 0.21-0.98), but this effect did not last through 12 months when compared with patients in standard care.6 These disparate findings may be explained by the gap in bench-to-bedside research, where despite scientific evidence indicating better outcomes among patients randomized to an intervention, when patients are given a choice, they may not choose to engage in the best option for their HF treatment.
In the present study, veterans who chose not to attend the HF SMA clinic may have done so for numerous reasons that may have influenced the outcomes. For example, those veterans who did not attend the HF SMA clinic may have had higher health literacy and less need for an educational program. Health literacy has been inversely associated with HF outcomes, such that patients with HF with lower health literacy have greater risk of HF rehospitalization or mortality.9,10 In addition, many of the veterans who were followed in the HF clinic were taught the same disease management strategies by the NP during one-on-one visits, and they may have gained the same self-management skills in a different setting.
Another possibility is that the veterans enrolled in the HF clinic were less likely to be followed exclusively at the VA and therefore may have had external hospitalizations not recorded in their VA health records. In 2000, more than half the veterans who received health care services at the VA reported that they did not receive their care exclusively at the VA.11 This may be especially true since the Veteran’s Choice Program permits veterans who reside > 40 miles from a VA hospital to receive care closer to home.
Disease Management Programs
Disease management programs for HF in general promote better outcomes and lower health care expenditures.5,12 Self-management instruction delivered via SMAs may have greater potential for reducing HF-associated health care costs if it were to be integrated earlier in the continuum of care. The sample in this study was composed of veterans who were referred to a specialty clinic only after being hospitalized for HF. These patients likely were experiencing more advanced disease and/or low adherence, as indicated by the relatively high prevalence of AF diagnoses and pacemakers; these null findings are consistent with those from a randomized controlled trial of a disease management program among veterans with heavy HF symptom burden and impaired functional status.13 However, integrating self-management programs earlier in HF clinical care (eg, primary care or cardiology clinics) may be more effective in promoting proactive disease management and delaying or preventing initial HF hospitalizations.
For example, a disease management plan implemented by general practitioners for veterans with HF in Australia was associated with a 23% reduction in potentially preventable hospitalization rates.14 Veterans with HF enrolled in a NP-led disease management intervention, relative to those followed only in primary care, had significantly fewer hospitalizations and nearly half the risk mortality (15% vs 28% after 2 years; HR 0.55).15 Furthermore, some have suggested that SMAs may be more effective for patients for whom risk of disease is high but current disease burden (ie, symptoms) is low, such as diabetes mellitus management programs.16 Early intervention also may allow providers to reach more patients more quickly and before they experience advanced symptoms, thereby reducing specialty clinic wait times and overall health expenditures. Developing more effective disease management programs for patients with acute HF and veterans in particular remains a critical matter for future study.
Additional and novel components of HF management programs show promise for future interventions. First, various facets of social support, including emotional support, instrumental/tangible support, informational support, and appraisal support, are associated with improved self-care.17 For example, the levels of family functioning and family support predict HF outcomes, perhaps because between-appointment monitoring allows patients to report problems that might otherwise go unidentified and receive more external feedback about their disease and symptoms.18,19 Patients report that family members or especially supportive members of their health care team are invaluable contributors to their successful management of HF.20 A recently published feasibility trial of a couple-based disease management program observed positive trends in HF management for veterans, as well as improvements in caregiver’s depressive symptoms and burden, indicating that even support from informal caregivers may improve HF outcomes.21
Advances in technology-delivered disease management programs show promise in improving adherence to chronic disease management programs.22,23 Specifically for HF, veterans who enrolled in a daily telehealth intervention employing daily vital signs and symptom reporting, automated reminders and tips for self-management, and proactive monitoring and intervention telephone calls from a nurse successfully lowered their blood pressure, lost weight, reduced their HF medication dosages, and spent 80% fewer days in the hospital.24 Among patients with coronary artery disease, a text messaging service was shown to improve a number of cardiovascular risk factors.25 Moreover, mobile applications can be used to support informal caregivers of patients with HF.26 To the authors knowledge, no research studies have been conducted using text messaging or mobile applications among veterans with HF.
Limitations
Some limitations of the present study warrant discussion. First, as discussed earlier, patients were not randomized to the treatment arms. Second, veterans are referred to the HF clinic only after being hospitalized for HF. As a result, all the referred veterans likely were experiencing more advanced disease and/or low adherence, and these results may not be representative of patients with less advanced disease. Finally, the sample used in the present analysis was a small, homogeneous group of 91 male veterans who were 85% black and 95% non-Hispanic. These demographics are largely representative of the JBVAMC. Therefore, the present results may not be generalizable to more racially or ethnically diverse populations, women, or nonveterans.
Conclusion
Minimizing rehospitalization rates for patients with HF continues to be a priority. Health care costs of HF are more than double those of patients in the general population, primarily due to hospitalizations—in 2013, HF hospitalization costs in the U.S. exceeded $10 billion.27,28 Given the current emphasis on economical, patient-centered care, SMAs may be a cost-effective alternative to individualized disease management plans while continuing to allow providers to tailor treatment to individual patient needs.
Although this study did not find better outcomes among veterans whose specialty HF care was augmented by clinic-based SMAs, the authors believe that this type of program has great potential. Heart failure SMAs may improve HF outcomes, enhance efficiency of health care delivery, and reduce overall HF-associated health care costs if it is integrated earlier along the continuum of care or if other novel components, such as caregiver support or technology-based delivery, is included. Further studies are needed to systematically evaluate HF management programs delivered via SMAs to improve outcomes and reduce the economic burden that HF places on the health care system.
1. Boccuti C, Casillas G. Aiming for fewer hospital U-turns: the Medicare hospital readmissions reduction program. http://kff.org/medicare/issue-brief/aiming-for-fewer-hospital-u-turns-the-medicare-hospital-readmission-reduction-program/. Published September 30, 2016. Accessed March 6, 2017.
2. Barrett ML, Wier LM, Jiang HJ, Steiner CA. All-cause readmissions by payer and age, 2009-2013. Statistical Brief #199. https://www.hcup-us.ahrq .gov/reports/statbriefs/sb199-Readmissions-Payer -Age.jsp. Published December 2015. Accessed March 6, 2017.
3. Fingar K, Washington R. Trends in hospital readmissions for four high-volume conditions, 2009-2013. Statistical Brief #196. https://www.hcup-us .ahrq.gov/reports/statbriefs/sb196-Readmissions -Trends-High-Volume-Conditions.jsp. Published November 2015. Accessed March 6, 2017.
4. McMurray JJ, Adamopoulos S, Anker SD, et al; ESC Committee for Practice Guidelines. ESC guidelines for the diagnosis and treatment of acute and chronic heart failure 2012: the Task Force for the Diagnosis and Treatment of Acute and Chronic Heart Failure 2012 of the European Society of Cardiology. Developed in collaboration with the Heart Failure Association (HFA) of the ESC. Eur Heart J. 2012;33(14):1787-1847.
5. Wakefield BJ, Boren SA, Groves PS, Conn VS. Heart failure care management programs: a review of study interventions and meta-analysis of outcomes. J Cardiovasc Nurs. 2013;28(1):8-19.
6. Smith CE, Piamjariyakul U, Wick JA, et al. Multidisciplinary group clinic appointments: the Self-Management and Care of Heart Failure (SMAC-HF) trial. Circ Heart Fail. 2014;7(6):888-894.
7. Sochalski J, Jaarsma T, Krumholz HM, et al. What works in chronic care management: the case of heart failure. Health Aff (Millwood). 2009;28(1): 179-189.
8. Ågren S, Evangelista LS, Davidson T, Strömberg A. Cost-effectiveness of a nurse-led education and psychosocial programme for patients with chronic heart failure and their partners. J Clin Nurs. 2013;22(15-16):2347-2353.
9. Moser DK, Robinson S, Biddle MJ, et al. Health literacy predicts morbidity and mortality in rural patients with heart failure. J Card Fail. 2015;21(8):612-618.
10. McNaughton CD, Cawthon C, Kripalani S, Liu D, Storrow AB, Roumie CL. Health literacy and mortality: a cohort study of patients hospitalized for acute heart failure. J Am Heart Assoc. 2015;4(6). pii:e001799.
11. Nelson KM, Starkebaum GA, Reiber GE. Veterans using and uninsured veterans not using Veterans Affairs (VA) health care. Public Health Rep. 2007;122(1):93-100.
12. Whellan DJ, Hasselblad V, Peterson E, O’Connor CM, Schulman KA. Metaanalysis and review of heart failure disease management randomized controlled clinical trials. Am Heart J. 2005;149(4):722-729.
13. Bekelman DB, Plomondon ME, Carey EP, et al. Primary results of the Patient-Centered Disease Management (PCDM) for Heart Failure Study: a randomized clinical trial. JAMA Intern Med. 2015;175(5):725-732.
14. Vitry AI, Nguyen TA, Ramsay EN, et al. General practitioner management plans delaying time to next potentially preventable hospitalisation for patients with heart failure. Intern Med J. 2014;44(11):1117-1123.
15. Lowery J, Hopp F, Subramanian U, et al. Evaluation of a nurse practitioner disease management model for chronic heart failure: a multi-site implementation study. Congest Heart Fail. 2012;18(1):64-71.
16. Edelman D, McDuffie JR, Oddone E, Gierisch JM, Nagi A, Williams JW Jr. Shared medical appointments for chronic medical conditions: a systematic review. VAESP Project #09-010. http://www.hsrd.research.va.gov/publications/esp/shared -med- appt-REPORT.pdf. Published July 2012. Accessed March 6, 2017.
17. Graven LJ, Grant JS. Social support and self-care behaviors in individuals with heart failure: an integrative review. Int J Nurs Stud. 2014;51(2):320-333.
18. Dunbar SB, Clark PC, Quinn C, Gary RA, Kaslow NJ. Family influences on heart failure self-care and outcomes. J Cardiovasc Nurs. 2008;23(3):258-265.
19. Piette JD, Gregor MA, Share D, et al. Improving heart failure self-management support by actively engaging out-of-home caregivers: results of a feasibility study. Congest Heart Fail. 2008;14(1):12-18.
20. Skaperdas E, Tuepker A, Nicolaidis C, Robb JK, Kansagara D, Hickam DH. Congestive heart failure self-management among US veterans: the role of personal and professional advocates. Patient Educ Couns. 2014;95(3):371-377.
21. Trivedi R, Slightam C, Fan VS, et al. A couples’ based self-management program for heart failure: results of a feasibility study. Front Public Health. 2016;4:171.
22. Hamine S, Gerth-Guyette E, Faulx D, Green BB, Ginsburg SA. Impact of mHealth chronic disease management on treatment adherence and patient outcomes: a systematic review. J Med Internet Res. 2015;17(2):e52.
23. Free C, Phillips G, Galli L, et al. The effectiveness of mobile-health technology-based health behaviour change or disease management interventions for health care consumers: a systematic review. PLoS Med. 2013;10(1):e1001362.
24. Schofield RS, Kline SE, Schmalfuss CM, et al. Early outcomes of a care coordination-enhanced telehome care program for elderly veterans with chronic heart failure. Telemed J E Health. 2005;11(1):20-27.
25. Chow CK, Redfern J, Hillis GS, et al. Effect of lifestyle-focused text messaging on risk factor modification in patients with coronary heart disease: a randomized clinical trial. JAMA. 2015;314(12):1255-1263.
26. Piette JD, Striplin D, Marinec N, et al. A mobile health intervention supporting heart failure patients and their informal caregivers: a randomized comparative efficacy trial. J Med Internet Res. 2015;17(6):e142.
27. Mejhert M, Lindgren P, Schill O, Edner M, Persson H, Kahan T. Long term health care consumption and cost expenditure in systolic heart failure. Eur J Intern Med. 2013;24(3):260-265.
28. Torio CM, Moore BJ. National inpatient hospital costs: the most expensive conditions by payer, 2013. Statistical Brief #204. https://www.hcup-us.ahrq.gov/reports/statbriefs/sb204-Most-Expensive-Hospital-Conditions.jsp. Published May 2016. Accessed March 6, 2017.
Rising health care costs have led to threats of nonreimbursement for rehospitalization within 30 days postdischarge.1,2 Heart failure (HF) in particular is characterized by the highest 30-day rehospitalization rate (23.5% in 2013), which accounts for more than two-thirds of HF expenditures.3,4
Much of HF-related health care costs can be addressed with effective self-management by patients with HF. Therefore, developing and implementing effective disease management programs for this high-risk patient population is essential. Heart failure management programs may include optimizing HF medications, improving patient understanding of the importance of appropriate diet and physical activity, and cultivating psychological health and well-being. In a 2013 systematic review and meta-analysis, Wakefield and colleagues found that disease management programs improved nearly all HF outcomes, including lower mortality rates, lower hospital readmission rates, fewer clinic visits, higher satisfaction with care, and higher quality of life, compared with a no-treatment control or standard care.5 Moreover, these programs demonstrated cost-effectiveness by reducing HF-related hospitalizations and health care expenditures.5
One method to deliver specialized disease management programs to a greater number of patients may be to use shared medical appointments (SMAs). In a randomized controlled trial, Smith and colleagues demonstrated improved HF outcomes through 7 months among veterans who attended SMAs for HF management.6 However, the trial enrolled only 25% of patients screened, and 63% of the patients who did not enroll were classified as not interested. These findings suggest that patients with HF, and veterans in particular, may face additional barriers to enrolling in HF management programs, and these results may not be fully representative of veterans with HF.
In this study, the authors used a naturalistic study design via retrospective review of the electronic health record (EHR) to evaluate whether patients with acute HF who chose to attend SMAs promoting self-management skills for HF would have better hospitalization outcomes compared with those who received individual disease management instructions in a HF specialty clinic (ie, usual care). The authors hypothesized that veterans who participated in the HF SMA clinic would have fewer 12-month HF-related and all-cause hospitalizations, fewer days in the hospital, and more days to first hospitalization compared with patients in usual care.
Methods
The clinic for veterans with acute HF was initiated in October, 2010 at the Jesse Brown VAMC (JBVAMC) in Chicago, Illinois, to reduce readmissions by targeting patients who had been previously hospitalized for HF. In September 2011, the multidisciplinary SMA clinic was developed within the HF clinic to provide enhanced care focused on self-management strategies for patients with HF. The HF SMA program comprised 4 weekly face-to-face sessions co-led by a nurse practitioner (NP), a dietitian, and a clinical psychologist, similar to what has been shown to be successful and cost-effective in nonveteran populations.6-8 Patients attended at least 4 sessions before graduating to the advanced HF SMA program where they could attend monthly booster sessions. The program promoted self-management by providing education about and support for the HF process, HF medications, diet adherence, physical activity, psychological well-being, and stress management via interactive presentations. During the visit, patients’ medication and food logs were reviewed. Patients were encouraged to discuss successes and obstacles in achieving their goals. All study procedures were approved by the institutional review board at JBVAMC.
Study Design
Data were collected by retrospective review of the JBVAMC EHR. The EHR was reviewed for all veterans scheduled for ≥ 1 SMA clinic visit within the HF specialty clinic using predetermined, convenient selection between January 1, 2012, and December 31, 2013. Outcome data were collected through 12-month follow-up (through December 31, 2014).
Patients in both treatment arms received HF care through the HF clinic, including one-on-one education regarding HF self-management provided by a NP. Patients were assigned to the HF SMA group if they also attended the HF SMA clinic within 3 months of their initial HF clinic consult. The number of SMAs attended was included as a covariate in the models. Patients who were scheduled for, but did not attend, the HF SMA clinic were assigned to the HF clinic group. Patients who attended the initial HF consult before September 1, 2011, were excluded, thereby ensuring that all patients included in the present analyses had the opportunity to attend the HF SMA appointment within the predetermined period of chart review.
Data for all VA hospitalizations that occurred between January 1, 2012 and December 31, 2014, were extracted from the EHR. Extracted data included admission date, discharge date, and discharge diagnoses. From these data, the authors assessed 4 hospitalization outcomes for each HF hospitalization and all-cause hospitalization within 12 months of the initial HF clinic consult date: hospitalization (yes/no), number of hospitalizations, number of days in the hospital, and days to first hospitalization.
Data Analysis
Demographic, HF characteristics, and HF outcome variables for the HF SMA and HF clinic groups were compared using t tests and chi-square analyses. Logistic regressions were used to predict 12-month hospitalization, linear regressions were used to predict number of hospitalizations and number of days hospitalized, and Cox proportional hazards regressions were used to predict time from initial HF consult to first hospitalization for each HF-related hospitalization variable and all-cause hospitalization variable. A separate logistic regression was conducted to predict 12-month all-cause mortality. The primary predictor variable of interest for all models was group membership (HF SMA vs HF clinic). Covariates in all models included race (black vs nonblack), ethnicity (Hispanic/Latino vs non-Hispanic/Latino), age, and number of HF SMAs attended.
Results
Of 709 HF SMA clinic appointments made for 141 patients between January 1, 2012, and December 31, 2013, 54 patients were assigned to the HF SMA group and 37 patients were assigned to the HF clinic group (Figure). The majority of the sample was black (87%), non-Hispanic/Latino (96%), and the average age was 68 years. Patients were more likely to have nonischemic (rather than ischemic) cardiomyopathy (66%) and more likely to have HF with reduced (rather than preserved) ejection fraction (76%; ie, systolic HF). Furthermore, 40% of the sample was diagnosed with atrial fibrillation (AF) or atrial flutter (A-flutter), and 24% had an implantable cardioverter-defibrillator or pacemaker. There were no significant differences in demographics or HF characteristics between the HF SMA group and the HF clinic group (Table).
HF Hospitalization Outcomes
During the 12-month follow-up, 32 patients were hospitalized for HF, 18 (33.3%) in the SMA group and 14 (37.8%) in the HF clinic group, P = .658. Patients were hospitalized up to 4 times for between 1 and 38 days, and from 1 to 352 days postconsult. No differences between the HF SMA group and HF clinic group were observed on any of the HF hospitalization outcomes (Table). Group membership did not predict HF hospitalization (odds ratio [OR]: 0.39, 95% confidence interval [CI]: 0.11-1.42), number of HF hospitalizations (β: 0.15, SE: 0.29), number of days hospitalized for HF (β: 0.1.66, SE: 2.01), or time to first HF hospitalization (hazard ratio [HR]: 1.35, 95% CI: 0.66-2.77), all Ps > .10. In the Cox proportional hazards regression predicting time to HF hospitalization, the coefficients did not converge when the model included demographic covariates; therefore, the model was run only with HF group as a predictor variable. For all other models, no covariates significantly predicted HF hospitalization outcomes.
All-Cause Hospitalization Outcomes
During the 12-month follow-up, 57 patients were hospitalized for any cause (including HF hospitalizations), 32 (59.3%) in the SMA group and 25 (67.6%) in the HF clinic group, P = .421. Patients were hospitalized up to 6 times for between 1 and 106 days and from 1 to 352 days postconsult. No differences were observed between the groups on any of the all-cause hospitalization outcomes (Table). Group membership did not predict all-cause hospitalization (OR: 0.34, 95% CI: 0.10-1.19), number of all-cause hospitalizations (β: 0.49, SE: 0.41), number of days hospitalized for any cause (β: 5.15, SE: 5.15), or time to first all-cause hospitalization (HR: 0.98, 95% CI: 0.56-1.72), all P > .05. None of the covariates predicted any of the all-cause hospitalization outcomes.
All-Cause Mortality Outcomes
During the 12-month follow-up, 14 patients (15%) died of any cause, 8 (15%) in the SMA group and 6 (16%) in the HF clinic group, P = .856. Group membership did not predict all-cause mortality (OR: 2.32, 95% CI: 0.44-12.18), and likewise none of the covariates were associated with 12-month all-cause mortality.
Discussion
This study was a naturalistic, retrospective examination of a HF management program promoting self-management delivered via multidisciplinary SMAs among veterans who enrolled in an acute HF specialty clinic. The authors’ hypothesis was not supported: patients who attended the HF SMA clinic did not have lower 12-month hospitalization or mortality rates, shorter hospital stays, or longer time to hospitalization compared with patients in the HF clinic only.
In contrast to the patient-centered approach of this study, a randomized trial delivering a similar disease management program found that patients with acute HF in the SMA group had better short-term (< 7 months) hospitalization outcomes, specifically greater time to first HF-related hospitalization (HR 0.45, 95% CI: 0.21-0.98), but this effect did not last through 12 months when compared with patients in standard care.6 These disparate findings may be explained by the gap in bench-to-bedside research, where despite scientific evidence indicating better outcomes among patients randomized to an intervention, when patients are given a choice, they may not choose to engage in the best option for their HF treatment.
In the present study, veterans who chose not to attend the HF SMA clinic may have done so for numerous reasons that may have influenced the outcomes. For example, those veterans who did not attend the HF SMA clinic may have had higher health literacy and less need for an educational program. Health literacy has been inversely associated with HF outcomes, such that patients with HF with lower health literacy have greater risk of HF rehospitalization or mortality.9,10 In addition, many of the veterans who were followed in the HF clinic were taught the same disease management strategies by the NP during one-on-one visits, and they may have gained the same self-management skills in a different setting.
Another possibility is that the veterans enrolled in the HF clinic were less likely to be followed exclusively at the VA and therefore may have had external hospitalizations not recorded in their VA health records. In 2000, more than half the veterans who received health care services at the VA reported that they did not receive their care exclusively at the VA.11 This may be especially true since the Veteran’s Choice Program permits veterans who reside > 40 miles from a VA hospital to receive care closer to home.
Disease Management Programs
Disease management programs for HF in general promote better outcomes and lower health care expenditures.5,12 Self-management instruction delivered via SMAs may have greater potential for reducing HF-associated health care costs if it were to be integrated earlier in the continuum of care. The sample in this study was composed of veterans who were referred to a specialty clinic only after being hospitalized for HF. These patients likely were experiencing more advanced disease and/or low adherence, as indicated by the relatively high prevalence of AF diagnoses and pacemakers; these null findings are consistent with those from a randomized controlled trial of a disease management program among veterans with heavy HF symptom burden and impaired functional status.13 However, integrating self-management programs earlier in HF clinical care (eg, primary care or cardiology clinics) may be more effective in promoting proactive disease management and delaying or preventing initial HF hospitalizations.
For example, a disease management plan implemented by general practitioners for veterans with HF in Australia was associated with a 23% reduction in potentially preventable hospitalization rates.14 Veterans with HF enrolled in a NP-led disease management intervention, relative to those followed only in primary care, had significantly fewer hospitalizations and nearly half the risk mortality (15% vs 28% after 2 years; HR 0.55).15 Furthermore, some have suggested that SMAs may be more effective for patients for whom risk of disease is high but current disease burden (ie, symptoms) is low, such as diabetes mellitus management programs.16 Early intervention also may allow providers to reach more patients more quickly and before they experience advanced symptoms, thereby reducing specialty clinic wait times and overall health expenditures. Developing more effective disease management programs for patients with acute HF and veterans in particular remains a critical matter for future study.
Additional and novel components of HF management programs show promise for future interventions. First, various facets of social support, including emotional support, instrumental/tangible support, informational support, and appraisal support, are associated with improved self-care.17 For example, the levels of family functioning and family support predict HF outcomes, perhaps because between-appointment monitoring allows patients to report problems that might otherwise go unidentified and receive more external feedback about their disease and symptoms.18,19 Patients report that family members or especially supportive members of their health care team are invaluable contributors to their successful management of HF.20 A recently published feasibility trial of a couple-based disease management program observed positive trends in HF management for veterans, as well as improvements in caregiver’s depressive symptoms and burden, indicating that even support from informal caregivers may improve HF outcomes.21
Advances in technology-delivered disease management programs show promise in improving adherence to chronic disease management programs.22,23 Specifically for HF, veterans who enrolled in a daily telehealth intervention employing daily vital signs and symptom reporting, automated reminders and tips for self-management, and proactive monitoring and intervention telephone calls from a nurse successfully lowered their blood pressure, lost weight, reduced their HF medication dosages, and spent 80% fewer days in the hospital.24 Among patients with coronary artery disease, a text messaging service was shown to improve a number of cardiovascular risk factors.25 Moreover, mobile applications can be used to support informal caregivers of patients with HF.26 To the authors knowledge, no research studies have been conducted using text messaging or mobile applications among veterans with HF.
Limitations
Some limitations of the present study warrant discussion. First, as discussed earlier, patients were not randomized to the treatment arms. Second, veterans are referred to the HF clinic only after being hospitalized for HF. As a result, all the referred veterans likely were experiencing more advanced disease and/or low adherence, and these results may not be representative of patients with less advanced disease. Finally, the sample used in the present analysis was a small, homogeneous group of 91 male veterans who were 85% black and 95% non-Hispanic. These demographics are largely representative of the JBVAMC. Therefore, the present results may not be generalizable to more racially or ethnically diverse populations, women, or nonveterans.
Conclusion
Minimizing rehospitalization rates for patients with HF continues to be a priority. Health care costs of HF are more than double those of patients in the general population, primarily due to hospitalizations—in 2013, HF hospitalization costs in the U.S. exceeded $10 billion.27,28 Given the current emphasis on economical, patient-centered care, SMAs may be a cost-effective alternative to individualized disease management plans while continuing to allow providers to tailor treatment to individual patient needs.
Although this study did not find better outcomes among veterans whose specialty HF care was augmented by clinic-based SMAs, the authors believe that this type of program has great potential. Heart failure SMAs may improve HF outcomes, enhance efficiency of health care delivery, and reduce overall HF-associated health care costs if it is integrated earlier along the continuum of care or if other novel components, such as caregiver support or technology-based delivery, is included. Further studies are needed to systematically evaluate HF management programs delivered via SMAs to improve outcomes and reduce the economic burden that HF places on the health care system.
1. Boccuti C, Casillas G. Aiming for fewer hospital U-turns: the Medicare hospital readmissions reduction program. http://kff.org/medicare/issue-brief/aiming-for-fewer-hospital-u-turns-the-medicare-hospital-readmission-reduction-program/. Published September 30, 2016. Accessed March 6, 2017.
2. Barrett ML, Wier LM, Jiang HJ, Steiner CA. All-cause readmissions by payer and age, 2009-2013. Statistical Brief #199. https://www.hcup-us.ahrq .gov/reports/statbriefs/sb199-Readmissions-Payer -Age.jsp. Published December 2015. Accessed March 6, 2017.
3. Fingar K, Washington R. Trends in hospital readmissions for four high-volume conditions, 2009-2013. Statistical Brief #196. https://www.hcup-us .ahrq.gov/reports/statbriefs/sb196-Readmissions -Trends-High-Volume-Conditions.jsp. Published November 2015. Accessed March 6, 2017.
4. McMurray JJ, Adamopoulos S, Anker SD, et al; ESC Committee for Practice Guidelines. ESC guidelines for the diagnosis and treatment of acute and chronic heart failure 2012: the Task Force for the Diagnosis and Treatment of Acute and Chronic Heart Failure 2012 of the European Society of Cardiology. Developed in collaboration with the Heart Failure Association (HFA) of the ESC. Eur Heart J. 2012;33(14):1787-1847.
5. Wakefield BJ, Boren SA, Groves PS, Conn VS. Heart failure care management programs: a review of study interventions and meta-analysis of outcomes. J Cardiovasc Nurs. 2013;28(1):8-19.
6. Smith CE, Piamjariyakul U, Wick JA, et al. Multidisciplinary group clinic appointments: the Self-Management and Care of Heart Failure (SMAC-HF) trial. Circ Heart Fail. 2014;7(6):888-894.
7. Sochalski J, Jaarsma T, Krumholz HM, et al. What works in chronic care management: the case of heart failure. Health Aff (Millwood). 2009;28(1): 179-189.
8. Ågren S, Evangelista LS, Davidson T, Strömberg A. Cost-effectiveness of a nurse-led education and psychosocial programme for patients with chronic heart failure and their partners. J Clin Nurs. 2013;22(15-16):2347-2353.
9. Moser DK, Robinson S, Biddle MJ, et al. Health literacy predicts morbidity and mortality in rural patients with heart failure. J Card Fail. 2015;21(8):612-618.
10. McNaughton CD, Cawthon C, Kripalani S, Liu D, Storrow AB, Roumie CL. Health literacy and mortality: a cohort study of patients hospitalized for acute heart failure. J Am Heart Assoc. 2015;4(6). pii:e001799.
11. Nelson KM, Starkebaum GA, Reiber GE. Veterans using and uninsured veterans not using Veterans Affairs (VA) health care. Public Health Rep. 2007;122(1):93-100.
12. Whellan DJ, Hasselblad V, Peterson E, O’Connor CM, Schulman KA. Metaanalysis and review of heart failure disease management randomized controlled clinical trials. Am Heart J. 2005;149(4):722-729.
13. Bekelman DB, Plomondon ME, Carey EP, et al. Primary results of the Patient-Centered Disease Management (PCDM) for Heart Failure Study: a randomized clinical trial. JAMA Intern Med. 2015;175(5):725-732.
14. Vitry AI, Nguyen TA, Ramsay EN, et al. General practitioner management plans delaying time to next potentially preventable hospitalisation for patients with heart failure. Intern Med J. 2014;44(11):1117-1123.
15. Lowery J, Hopp F, Subramanian U, et al. Evaluation of a nurse practitioner disease management model for chronic heart failure: a multi-site implementation study. Congest Heart Fail. 2012;18(1):64-71.
16. Edelman D, McDuffie JR, Oddone E, Gierisch JM, Nagi A, Williams JW Jr. Shared medical appointments for chronic medical conditions: a systematic review. VAESP Project #09-010. http://www.hsrd.research.va.gov/publications/esp/shared -med- appt-REPORT.pdf. Published July 2012. Accessed March 6, 2017.
17. Graven LJ, Grant JS. Social support and self-care behaviors in individuals with heart failure: an integrative review. Int J Nurs Stud. 2014;51(2):320-333.
18. Dunbar SB, Clark PC, Quinn C, Gary RA, Kaslow NJ. Family influences on heart failure self-care and outcomes. J Cardiovasc Nurs. 2008;23(3):258-265.
19. Piette JD, Gregor MA, Share D, et al. Improving heart failure self-management support by actively engaging out-of-home caregivers: results of a feasibility study. Congest Heart Fail. 2008;14(1):12-18.
20. Skaperdas E, Tuepker A, Nicolaidis C, Robb JK, Kansagara D, Hickam DH. Congestive heart failure self-management among US veterans: the role of personal and professional advocates. Patient Educ Couns. 2014;95(3):371-377.
21. Trivedi R, Slightam C, Fan VS, et al. A couples’ based self-management program for heart failure: results of a feasibility study. Front Public Health. 2016;4:171.
22. Hamine S, Gerth-Guyette E, Faulx D, Green BB, Ginsburg SA. Impact of mHealth chronic disease management on treatment adherence and patient outcomes: a systematic review. J Med Internet Res. 2015;17(2):e52.
23. Free C, Phillips G, Galli L, et al. The effectiveness of mobile-health technology-based health behaviour change or disease management interventions for health care consumers: a systematic review. PLoS Med. 2013;10(1):e1001362.
24. Schofield RS, Kline SE, Schmalfuss CM, et al. Early outcomes of a care coordination-enhanced telehome care program for elderly veterans with chronic heart failure. Telemed J E Health. 2005;11(1):20-27.
25. Chow CK, Redfern J, Hillis GS, et al. Effect of lifestyle-focused text messaging on risk factor modification in patients with coronary heart disease: a randomized clinical trial. JAMA. 2015;314(12):1255-1263.
26. Piette JD, Striplin D, Marinec N, et al. A mobile health intervention supporting heart failure patients and their informal caregivers: a randomized comparative efficacy trial. J Med Internet Res. 2015;17(6):e142.
27. Mejhert M, Lindgren P, Schill O, Edner M, Persson H, Kahan T. Long term health care consumption and cost expenditure in systolic heart failure. Eur J Intern Med. 2013;24(3):260-265.
28. Torio CM, Moore BJ. National inpatient hospital costs: the most expensive conditions by payer, 2013. Statistical Brief #204. https://www.hcup-us.ahrq.gov/reports/statbriefs/sb204-Most-Expensive-Hospital-Conditions.jsp. Published May 2016. Accessed March 6, 2017.

Veterans as Caregivers:Those Who Continue to Serve
More than 20% of the U.S. population will be aged ≥ 65 years by 2030, an increase from 13% in 2012.1 The likelihood of needing assistance with activities of daily living (ADLs) increases with age.2 People who need such assistance often depend on informal and unpaid assistance from friends and family. In 2009, about 65.7 million Americans (28.5%) provided informal care for people with an illness or disability, and that number only is expected to rise.3 These informal caregivers provide up to 80% of the total care hours needed by community-dwelling older adults—an estimated economic value of $450 billion in unpaid contributions in 2009.4,5
Caregiving can lead to significant physical, psychological, social, and financial burdens.6 The caregiving burden is associated with a host of adverse health behaviors and outcomes such as poor diet, lack of exercise and sleep, smoking, decreased participation in preventive health care, anxiety, depression, relationship difficulties, employment disruption, financial hardship, suicide, and higher mortality compared with that of noncaregivers.6-10 Additionally, care recipients are at increased risk for abuse or neglect when the caregiver is experiencing a significant burden.11 Therefore, efforts to improve caregiver support are important for both partners in the caregiver/care recipient dyad.
Caregiver support is beneficial to the health of caregivers and care recipients.10,12 For example, the Resources for Enhancing Alzheimer’s Caregiver Health (REACH) program has been shown to reduce the stress of informal caregiving and the risk of depression in caregivers.13,14 This program showed similar effects when implemented within the VHA.14 In the Partners in Dementia Care project, the VHA and Alzheimer’s Association coordinated care and support for veterans with dementia and their family and friends. This intervention resulted in lower caregiver strain and depression scores among participants.15
With a growing medical literature that shows the benefits of caregiver support interventions, the VHA developed a robust support program for informal caregivers of veterans. The VA caregiver support website (www.caregiver.va.gov) provides information and resources targeted to caregivers for veterans, including psychosocial and functional support for caregivers. The psychosocial support provided by the VA includes caregiver education, counseling, access to caregiver support coordinators, a caregiver support line, support groups, and referral to community support organizations.16 Functional support on the site includes financial assistance toward skilled home care, home hospice care, adult day care, home-based primary care, homemaker and home health aide services, telehealth, and respite care.16 Veterans who are caregiving for nonveterans have access to VHA psychosocial support but not to functional support services. For these veterans, functional caregiver support must come from family or referral to community organizations.
Background
In the U.S., about 11% of caregivers are veterans, but the availability of data about these caregivers is limited to veteran subgroups.3 For example, a 2011 study reported that 20% of veterans aged ≥ 60 years are caregivers.17 However, this estimate included child care for unimpaired children, which is not commonly included in other caregiving estimates. In another study, 30% of middle-aged active-duty officers reported helping their parents with instrumental ADLs (IADLs).18 These data suggest a significant proportion of veterans may be caregivers; however, the estimates do not identify prevalence of caregiving among a population of VHA enrolled veterans.
Likewise, few studies discuss the burden veterans experience from caregiving. A study of the 2009/2010 CDC Behavioral Risk Factor Surveillance System data found that female caregivers were more likely to report problems with sleep and mental health if they were veterans vs nonveterans.19 In a second study, caregiving veterans frequently reported physical (39%) and emotional (53%) strain, with emotional strain relating to depressive symptoms. The study of active-duty officers noted that worry was prevalent among military officers caregiving for parents from a distance.18 In contrast to the negative outcomes of caregiving, Monin and colleagues found that many veterans perceived caregiving as rewarding. Since caregiving may be a positive experience, veterans may benefit and be a potential resource for care to elderly and disabled citizens.17
Project Rationale and Goals
Social workers are the cornerstone of caregiver support at the George E. Wahlen VA Salt Lake City Health Care System (VASLCHCS) in Utah. They educate veterans and caregivers about VA resources to support caregivers of veterans. For those veterans who are caregiving for a nonveteran, the VASLCHCS social workers provide psychosocial support and help veterans connect to a local area agency on aging (AAA) for access to functional support. In practice, primary care clinic (PCC) providers have observed that directing a veteran to call the AAA does not usually result in a phone call. Therefore, an aim of this quality improvement (QI) project was to determine the most effective means of completing a successful AAA referral.
The VASLCHCS Geriatric Research Education and Clinical Center collaborates with the Utah Aging and Disability Resource Connection (ADRC) to improve awareness of available resources for veterans. Building on this collaborative project, the authors created a formal referral process for veterans needing local AAA services. This QI project had 3 aims: (1) estimate the prevalence of caregiving among veterans in the VASLCHCS primary care clinic; (2) identify perceived caregiving difficulties and resource use difficulty in caregiving tasks; and (3) test different strategies to connect veterans with a referral to community resources through the AAA.
The authors hypothesized that a veteran would be more likely to connect with the AAA if contact was initiated by the AAA rather than the standard practice of asking the veteran to make the call. However, the authors also hypothesized that a veteran who took the time to make the call would be more likely to use AAA resources compared with veterans who were called by the AAA.
Methods
The VASLCHCS Research and Development Office reviewed this project and determined that it met the definition of QI. Therefore, it did not require IRB approval.
The study drew from a convenience sample of veterans who were waiting for appointments in the PCC and who were referred by their health care provider (HCP). To identify caregivers, veterans were asked: “People may provide regular care or assistance to a friend or family member who has a health problem, long-term illness, or disability. During the past month, did you provide any such care or assistance to a friend or family member?” Referrals from HCPs were included in all calculations except the prevalence estimate.
The authors interviewed veterans over a 3-month period in 2015. As of November 2014, the clinic was serving about 11,000 veterans, of which 6,589 lived in Salt Lake County. The clinic also serves veterans who live in other counties in Utah, Nevada, Wyoming, Idaho, and Colorado. 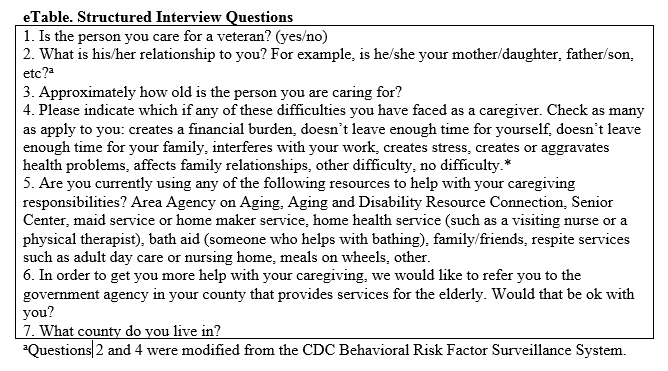
Intervention and Partnering With Community Resources
All willing caregivers were provided a referral to a local AAA (Figure). Salt Lake County veterans interested in referral to the AAA were randomized to 1 of 2 referral methods: veteran-initiated referral (VIR), in which the veteran was given a handout with the phone number of the Salt Lake County caregiver support program (CSP), or provider-initiated referral (PIR), in which the veteran’s phone number was given to the CSP. Caregiving veterans living outside Salt Lake County were provided the AAA phone number in their area and instructed to call for information.
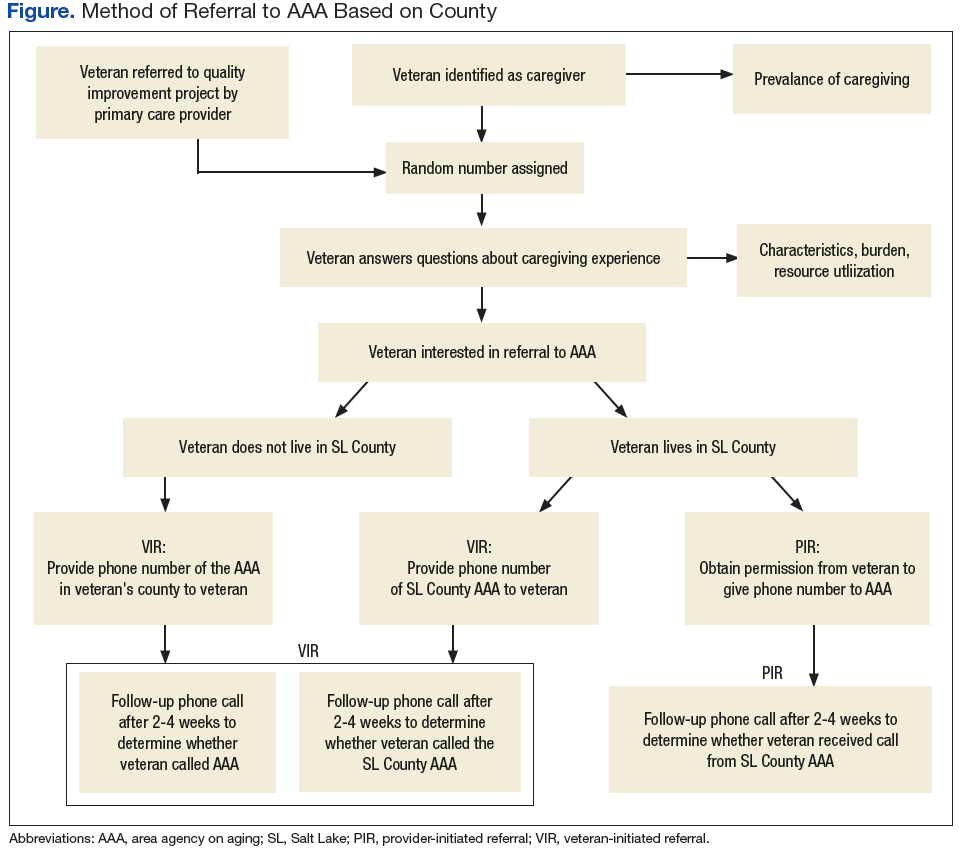
The interview form was randomized using an even or odd number before the interview. Some veterans who were randomized to a PIR needed to be moved into the VIR intervention arm because of the following reasons: the veteran’s care recipient was aged < 18 years (3); the veteran lived outside of Salt Lake County (20); the veteran did not want his/her name given to an outside agency (5); or the interviewer mistakenly gave the veteran the AAA contact information (4).
The primary author called caregivers in the PIR and VIR groups 2 to 4 weeks after the referral to determine whether they had contacted or were contacted by the AAA. Ten call attempts were made before participants were considered lost to follow-up. Caregivers that had been in contact with the AAA reported in open-ended fashion the resources to which they had been referred and whether those resources had been helpful.
Analysis
In this evaluation, the primary outcome of interest was whether contact between the veteran and AAA occurred. For the VIR group, contact was defined as the veteran having called the AAA, regardless of whether he or she actually spoke to someone. For the PIR group, contact occurred if the veteran reported receiving a phone call from AAA regardless of whether he or she had actually spoken with someone (eg, if the veteran reported that the AAA had left a voice mail, this was considered contact). Veterans also were asked whether connecting with the AAA led to resource referrals and whether these referrals were useful.
To achieve a power of 80% with a 95% confidence interval, 20 people were needed in each intervention group to detect a 40% difference in the rate of contact between the 2 groups. STATA12 (College Station, TX) was used to calculate Fisher exact and chi-square values to evaluate differences between groups.
Results
For the study, 433 PCC veterans were interviewed, and 157 (36%) self-identified as a caregiver. An additional 22 referrals were included for a total of 179 caregivers. Caregiver and care recipient characteristics, caregiver burden, and resource utilization were calculated for all 179 caregivers; however, all caregivers did not answer every question. Ninety-eight percent (176) of caregivers were men; 64% (109/170) were from Salt Lake County, and 5% were from outside Utah (8). Twelve percent (21) of the 179 caregivers were providing care for > 1 person. Of 177 caregivers, 3% (5) were caring for both a veteran and a nonveteran, 69% (122) were caring for a nonveteran only, and 28% (49) were caring for another veteran only (Table 1).
The most common burden reported by caregivers was stress (63%); 70% endorsed family/friends as a resource (Table 2). Just 6% (10) of caregivers used the AAA, whereas 26% (45) received VHA support. Of the 54 veterans who were caring for a veteran, 40 reported using the VHA as a resource. Five people caring for nonveterans reported using the VHA as a resource; however, data about which resources those caregivers were accessing were not collected (Table 3).
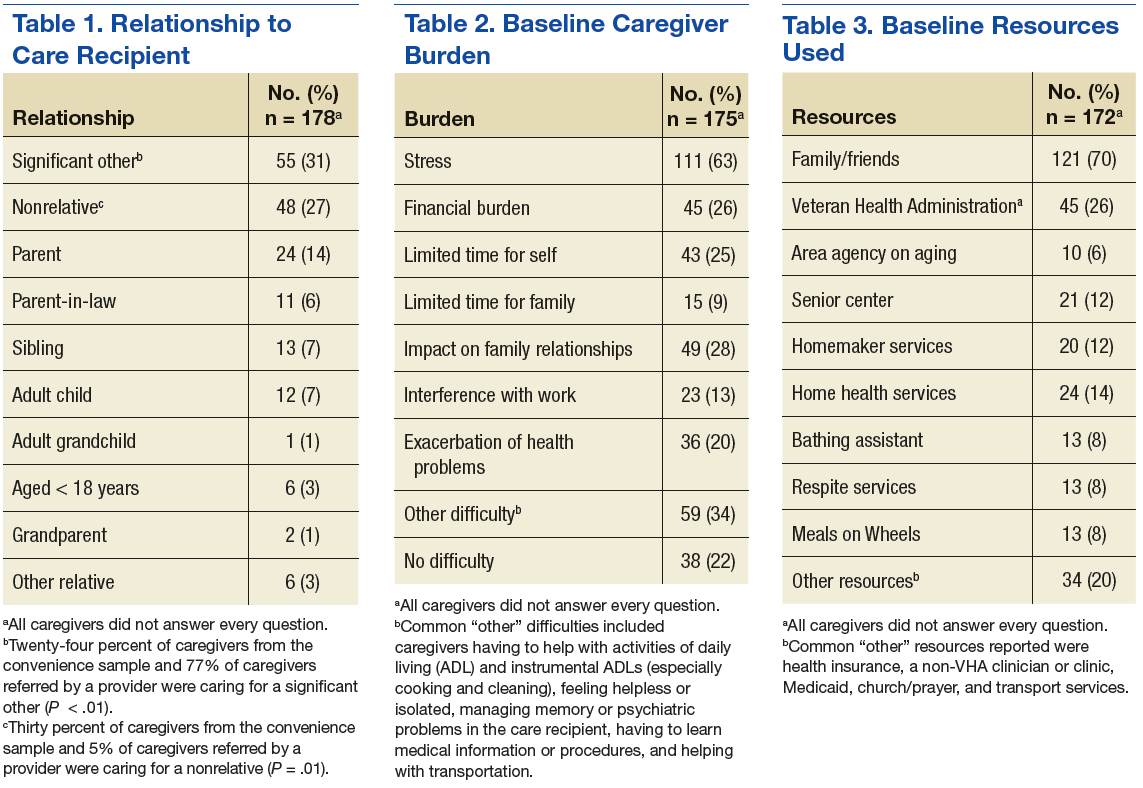
AAA Referral and Randomization
Sixty-five percent of caregivers accepted AAA referrals. Of 109 Salt Lake County caregivers, 70% accepted referral to the AAA. There was no statistically significant difference in referral acceptance rates when comparing Salt Lake County residents with nonresidents (P = .09).The authors were unable to obtain the phone number for 1 caregiver who had accepted a referral, and 1 caregiver who accepted referral did not want a follow-up. This left 111 caregivers available for follow-up, 75 in Salt Lake County. Fifty Salt Lake County veterans were randomly assigned to the VIR group and 25 to the PIR group. The 36 caregivers who accepted referrals outside Salt Lake County also were placed in the VIR group, for a total of 86 caregivers.
Follow-up
Ninety-eight percent of caregivers were reached for follow-up. Both people lost to follow-up were in Salt Lake County (1 in each group).
In Salt Lake County, 12% (6) of the VIR group and 64% (16) of the PIR group had connected with the AAA (P < .01). Although 64% of those in the PIR group reported having been called by the AAA, the AAA representative reported all 25 had been called. The AAA records showed 9 of those called were reached by voice mail, 6 were provided information about caregiving resources, 2 formally joined the support program, 5 declined help, 1 was no longer caregiving, 1 was too busy to talk, and 1 was the wrong phone number (and was lost to follow-up as well).
Outside of Salt Lake County 19% (7) reported calling the local AAA. There was no difference in referral completion between the Salt Lake County/non-Salt Lake County VIR groups (P = .4).
Fifteen percent of all VIR caregivers reported calling the AAA. There were no statistical differences between Salt Lake County VIR and non-Salt Lake County VIR for reasons why the veteran had not called the AAA (Table 4).
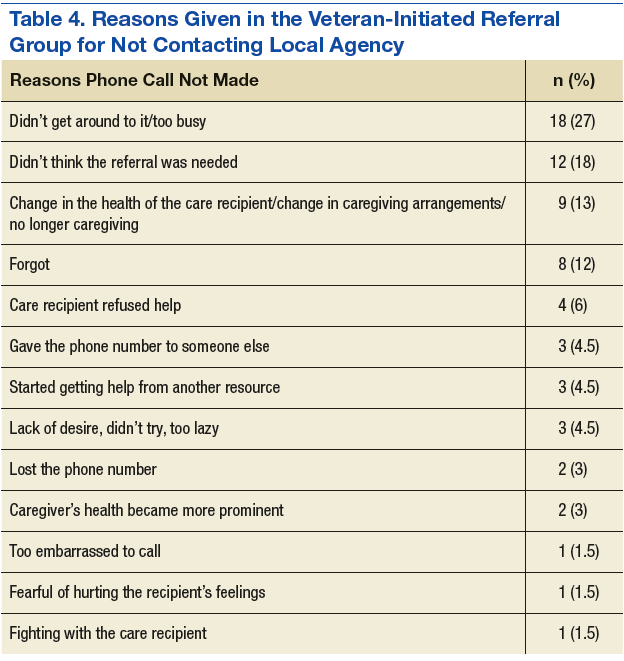
Of 28 people who connected with the AAA, 16 (57%) said they had received access to a needed resource as a result of the phone call. Seven caregivers (25%) said they had not been referred to other resources as a result of the call. The VIR group was more likely to be referred to other resources after contacting the AAA than was the PIR group, although this difference did not reach significance (69% vs 47%, P = .28).
Discussion
More than one-third (36%) of veterans seen in the VASLCHCS PCC are caregivers. This prevalence is higher than that reported for the general U.S. population and higher than that reported in other veteran groups.5,17,18 Most caregivers in this project were caring for nonveterans and only had access to VHA psychosocial caregiver support programs because VHA functional caregiver support (eg, respite, homemaker services) is not available to veterans who care for nonveterans. A majority (78%) of caregiving veterans reported some caregiver burden. Despite the burden, most are not using community resources. However when offered, more than half the caregivers were interested in an AAA referral.
Although the VHA does not provide functional caregiver support resources to veterans caring for nonveterans, there are other agencies that can assist veterans: AAAs for care recipients aged ≥ 60 years and the ADRCs for younger veterans. Through AAAs, caregivers can access a variety of support services, including transportation, adult day care, caregiver support, and health promotion programs. Partnership between agencies such as the VHA and the AAAs could benefit caregiving veterans. This QI project suggests ways to strengthen interagency cooperation.
This study also suggests that a provider or clinic-initiated referral is more likely to connect veterans with information and resources than the current practice of recommending that the veteran initiate the referral. Once in contact with the AAA, most caregivers were referred to needed resources. The next step will be to establish an efficient way for clinic staff to identify caregiving veterans and make referrals to community programs. Referrals could be made by any member of the patient aligned care team (PACT) to further standardize and streamline the process.
Thirty-one percent of veterans in this project were eligible for the VHA caregiver support program because they cared for a veteran. However, 25% of these caregiving veterans were not accessing this resource. Increasing awareness of the VHA caregiver support program among veterans caring for other veterans would improve caregiver support to both caregiving and care recipient veterans.
Limitations
One limitation of this project was the intentional exclusion of the women’s clinic from the sampling process. For consistency, the authors wanted to limit the intervention to 1 PCC and so they chose the clinic that serves the majority of the veterans who receive primary care at VASLCHCS. Additionally, the literature showed that male caregivers compared with women caregivers20,21 have different characteristics in regards to caregiver burden, and a well-designed study of women caregivers already has been published.19
Also, this study did not obtain data on age, health problems, or socioeconomic status of the caregivers to avoid identifying information. Last, the authors did not ask about time spent caregiving or type of care provided. These questions may be important for future studies. Future investigations should evaluate health care use and health of caregivers vs noncaregivers in the veteran population. It also could be important to determine methods for building bridges between the VHA, AAAs, and other community services.
Conclusion
To minimize the disruption that a research study might have caused to normal clinical workflow, the primary author played the role that a medical social worker or other PACT member might play in the future. This project sheds light on how to improve outcomes for community referrals and an important future step in this research would be to develop and test a process that would integrate the PACT into the referral process.
More than one-third of veterans seen in the VASLCHCS PCC are caregivers. To the authors’ knowledge, this is the first estimate of prevalence of caregiving in veterans who receive primary care from the VHA. About 63% of caregiving veterans perceived some burden due to caregiving, and 66% accepted referral to community resources. However, only 12% who were asked to self-refer made contact with the AAA compared with 64% when a provider made the referral for them. Provider referral is more effective in connecting caregiving veterans with resources. Development of interagency partnerships should be fostered to help veterans decrease caregiving burden.
This project is one of the few studies looking at this special group of caregivers: veterans who serve as caregivers. It highlights the need for the VHA to establish policies and partnerships to improve caregiver support to this valuable group of veterans.
1. Ortman JM, Velkoff VA, Hogan H. An aging nation: the older population in the United States: population estimates and projections. http://www.census .gov/prod/2014pubs/p25-1140.pdf. Published May 2014. Accessed March 9, 2017.
2. Smith AK, Walter LC, Miao Y, Boscardin WJ, Covinsky KE. Disability during the last two years of life. JAMA Intern Med. 2013;173(16):1506-1513.
3. National Alliance for Caregiving, American Association of Retired Persons. Caregiving in the U.S. 2009 executive summary. http://assets.aarp.org/rgcenter/il/caregiving_09_es.pdf. Published November 2009. Accessed March 9, 2017.
4. Spillman BC, Wolff J, Freedman VA, Kasper JD; Office of the Assistant Secretary for Planning and Evaluation, U.S. Department of Health and Human Services. Informal caregiving for older Americans: an analysis of the 2011 national study of caregiving. https://aspe.hhs.gov/report/informal-caregiving-older-americans-analysis-2011-national-study-caregiving. Published April 1, 2014. Accessed March 9, 2017.
5. Feinberg L, Reinhard SC, Houser A, Choula R; AARP Public Policy Institute. Valuing the invaluable: 2011 update. The growing contributions and costs of family caregiving. https://assets.aarp .org/rgcenter/ppi/ltc/i51-caregiving.pdf. Published June 2011. Accessed March 9, 2017.
6. Adelman RD, Tmanova LL, Delgado D, Dion S, Lachs MS. Caregiver burden: a clinical review. JAMA. 2014;311(10):1052-1059.
7. Burton LC, Newsom JT, Schulz R, Hirsch CH, German PS. Preventive health behaviors among spousal caregivers. Prev Med. 1997;26(2):162-169.
8. Talley RC, Crews JE. Framing the public health of caregiving. Am J Public Health. 2007;97(2):224-228.
9. Hoffman GJ, Lee J, Mendez-Luck CA. Health behaviors among baby boomer informal caregivers. Gerontologist. 2012;52(2):219-230.
10. National Alliance for Caregiving. Caregivers of veterans—serving on the homefront: report of study findings. http://www.caregiving.org/data/2010 _Caregivers_of_Veterans_FULLREPORT_WEB_FINAL.pdf. Published November 2010. Accessed March 9, 2017.
11. Johannesen M, LoGuidice D. Elder abuse: a systematic review of risk factors in community dwelling elders. Age Ageing. 2013;42(3):292-298.
12. Goy E, Kansagara D, Freeman M;Department of Veterans Affairs, Health Services Research & Development Service. A systematic evidence review of interventions for non-professional caregivers of individuals with dementia. http://www.hsrd.research .va.gov/publications/esp/DementiaCaregivers-EXEC .pdf. Published October 2010. Accessed March 9, 2017.
13. Belle SH, Burgio L, Burns R, et al; Resources for Enhancing Alzheimer’s Caregiver Health (REACH) II Investigators. Enhancing the quality of life of dementia caregivers from different ethnic or racial groups: a randomized controlled trial. Ann Intern Med. 2006;145(10):727-738.
14. Nichols LO, Martindale-Adams J, Burns R, Graney MJ, Zuber J. Translation of a dementia caregiver support program in a health care system—REACH VA. Arch Intern Med. 2011;171(4):353-359.
15. Bass DM, Judge KS, Snow AL, et al. Caregiver outcomes of partners in dementia care: effect of a care coordination program for veterans with dementia and their family members and friends. J Am Geriatr Soc. 2013;61(8):1377-1386.
16. U.S. Department of Veteran Affairs. VA caregiver support: caregiver services. http://www.caregiver .va.gov/support/support_services.asp. Updated June 3, 2015. Accessed March 9, 2017.
17. Monin JK, Levy BR, Pietrzak RH. From serving in the military to serving loved ones: unique experiences of older veteran caregivers. Am J Geriatr Psychiatry. 2014;22(6):570-579.
18. Parker MW, Call VR, Dunkle R, Vaitkus M. “Out of sight” but not “out of mind”: parent contact and worry among senior ranking male officers in the military who live long distances from parents. Milit Psychol. 2002;14(4):257-277.
19. Lavela SL, Etingen B, Louise-Bender Pape T. Caregiving experiences and health conditions of women veteran and non-veteran caregivers. Womens Health Issues. 2013;23(4):e225-e232.
20. Yee JL, Schultz RS. Gender differences in psychiatric morbidity among family caregivers: a review and analysis. Gerontologist. 2000;40(2):147-164.
21. Collins CR. Men as caregivers of the elderly: support for the contributions of sons. J Multidiscip Healthc. 2014;7:525-531.
More than 20% of the U.S. population will be aged ≥ 65 years by 2030, an increase from 13% in 2012.1 The likelihood of needing assistance with activities of daily living (ADLs) increases with age.2 People who need such assistance often depend on informal and unpaid assistance from friends and family. In 2009, about 65.7 million Americans (28.5%) provided informal care for people with an illness or disability, and that number only is expected to rise.3 These informal caregivers provide up to 80% of the total care hours needed by community-dwelling older adults—an estimated economic value of $450 billion in unpaid contributions in 2009.4,5
Caregiving can lead to significant physical, psychological, social, and financial burdens.6 The caregiving burden is associated with a host of adverse health behaviors and outcomes such as poor diet, lack of exercise and sleep, smoking, decreased participation in preventive health care, anxiety, depression, relationship difficulties, employment disruption, financial hardship, suicide, and higher mortality compared with that of noncaregivers.6-10 Additionally, care recipients are at increased risk for abuse or neglect when the caregiver is experiencing a significant burden.11 Therefore, efforts to improve caregiver support are important for both partners in the caregiver/care recipient dyad.
Caregiver support is beneficial to the health of caregivers and care recipients.10,12 For example, the Resources for Enhancing Alzheimer’s Caregiver Health (REACH) program has been shown to reduce the stress of informal caregiving and the risk of depression in caregivers.13,14 This program showed similar effects when implemented within the VHA.14 In the Partners in Dementia Care project, the VHA and Alzheimer’s Association coordinated care and support for veterans with dementia and their family and friends. This intervention resulted in lower caregiver strain and depression scores among participants.15
With a growing medical literature that shows the benefits of caregiver support interventions, the VHA developed a robust support program for informal caregivers of veterans. The VA caregiver support website (www.caregiver.va.gov) provides information and resources targeted to caregivers for veterans, including psychosocial and functional support for caregivers. The psychosocial support provided by the VA includes caregiver education, counseling, access to caregiver support coordinators, a caregiver support line, support groups, and referral to community support organizations.16 Functional support on the site includes financial assistance toward skilled home care, home hospice care, adult day care, home-based primary care, homemaker and home health aide services, telehealth, and respite care.16 Veterans who are caregiving for nonveterans have access to VHA psychosocial support but not to functional support services. For these veterans, functional caregiver support must come from family or referral to community organizations.
Background
In the U.S., about 11% of caregivers are veterans, but the availability of data about these caregivers is limited to veteran subgroups.3 For example, a 2011 study reported that 20% of veterans aged ≥ 60 years are caregivers.17 However, this estimate included child care for unimpaired children, which is not commonly included in other caregiving estimates. In another study, 30% of middle-aged active-duty officers reported helping their parents with instrumental ADLs (IADLs).18 These data suggest a significant proportion of veterans may be caregivers; however, the estimates do not identify prevalence of caregiving among a population of VHA enrolled veterans.
Likewise, few studies discuss the burden veterans experience from caregiving. A study of the 2009/2010 CDC Behavioral Risk Factor Surveillance System data found that female caregivers were more likely to report problems with sleep and mental health if they were veterans vs nonveterans.19 In a second study, caregiving veterans frequently reported physical (39%) and emotional (53%) strain, with emotional strain relating to depressive symptoms. The study of active-duty officers noted that worry was prevalent among military officers caregiving for parents from a distance.18 In contrast to the negative outcomes of caregiving, Monin and colleagues found that many veterans perceived caregiving as rewarding. Since caregiving may be a positive experience, veterans may benefit and be a potential resource for care to elderly and disabled citizens.17
Project Rationale and Goals
Social workers are the cornerstone of caregiver support at the George E. Wahlen VA Salt Lake City Health Care System (VASLCHCS) in Utah. They educate veterans and caregivers about VA resources to support caregivers of veterans. For those veterans who are caregiving for a nonveteran, the VASLCHCS social workers provide psychosocial support and help veterans connect to a local area agency on aging (AAA) for access to functional support. In practice, primary care clinic (PCC) providers have observed that directing a veteran to call the AAA does not usually result in a phone call. Therefore, an aim of this quality improvement (QI) project was to determine the most effective means of completing a successful AAA referral.
The VASLCHCS Geriatric Research Education and Clinical Center collaborates with the Utah Aging and Disability Resource Connection (ADRC) to improve awareness of available resources for veterans. Building on this collaborative project, the authors created a formal referral process for veterans needing local AAA services. This QI project had 3 aims: (1) estimate the prevalence of caregiving among veterans in the VASLCHCS primary care clinic; (2) identify perceived caregiving difficulties and resource use difficulty in caregiving tasks; and (3) test different strategies to connect veterans with a referral to community resources through the AAA.
The authors hypothesized that a veteran would be more likely to connect with the AAA if contact was initiated by the AAA rather than the standard practice of asking the veteran to make the call. However, the authors also hypothesized that a veteran who took the time to make the call would be more likely to use AAA resources compared with veterans who were called by the AAA.
Methods
The VASLCHCS Research and Development Office reviewed this project and determined that it met the definition of QI. Therefore, it did not require IRB approval.
The study drew from a convenience sample of veterans who were waiting for appointments in the PCC and who were referred by their health care provider (HCP). To identify caregivers, veterans were asked: “People may provide regular care or assistance to a friend or family member who has a health problem, long-term illness, or disability. During the past month, did you provide any such care or assistance to a friend or family member?” Referrals from HCPs were included in all calculations except the prevalence estimate.
The authors interviewed veterans over a 3-month period in 2015. As of November 2014, the clinic was serving about 11,000 veterans, of which 6,589 lived in Salt Lake County. The clinic also serves veterans who live in other counties in Utah, Nevada, Wyoming, Idaho, and Colorado.
Intervention and Partnering With Community Resources
All willing caregivers were provided a referral to a local AAA (Figure). Salt Lake County veterans interested in referral to the AAA were randomized to 1 of 2 referral methods: veteran-initiated referral (VIR), in which the veteran was given a handout with the phone number of the Salt Lake County caregiver support program (CSP), or provider-initiated referral (PIR), in which the veteran’s phone number was given to the CSP. Caregiving veterans living outside Salt Lake County were provided the AAA phone number in their area and instructed to call for information.
The interview form was randomized using an even or odd number before the interview. Some veterans who were randomized to a PIR needed to be moved into the VIR intervention arm because of the following reasons: the veteran’s care recipient was aged < 18 years (3); the veteran lived outside of Salt Lake County (20); the veteran did not want his/her name given to an outside agency (5); or the interviewer mistakenly gave the veteran the AAA contact information (4).
The primary author called caregivers in the PIR and VIR groups 2 to 4 weeks after the referral to determine whether they had contacted or were contacted by the AAA. Ten call attempts were made before participants were considered lost to follow-up. Caregivers that had been in contact with the AAA reported in open-ended fashion the resources to which they had been referred and whether those resources had been helpful.
Analysis
In this evaluation, the primary outcome of interest was whether contact between the veteran and AAA occurred. For the VIR group, contact was defined as the veteran having called the AAA, regardless of whether he or she actually spoke to someone. For the PIR group, contact occurred if the veteran reported receiving a phone call from AAA regardless of whether he or she had actually spoken with someone (eg, if the veteran reported that the AAA had left a voice mail, this was considered contact). Veterans also were asked whether connecting with the AAA led to resource referrals and whether these referrals were useful.
To achieve a power of 80% with a 95% confidence interval, 20 people were needed in each intervention group to detect a 40% difference in the rate of contact between the 2 groups. STATA12 (College Station, TX) was used to calculate Fisher exact and chi-square values to evaluate differences between groups.
Results
For the study, 433 PCC veterans were interviewed, and 157 (36%) self-identified as a caregiver. An additional 22 referrals were included for a total of 179 caregivers. Caregiver and care recipient characteristics, caregiver burden, and resource utilization were calculated for all 179 caregivers; however, all caregivers did not answer every question. Ninety-eight percent (176) of caregivers were men; 64% (109/170) were from Salt Lake County, and 5% were from outside Utah (8). Twelve percent (21) of the 179 caregivers were providing care for > 1 person. Of 177 caregivers, 3% (5) were caring for both a veteran and a nonveteran, 69% (122) were caring for a nonveteran only, and 28% (49) were caring for another veteran only (Table 1).
The most common burden reported by caregivers was stress (63%); 70% endorsed family/friends as a resource (Table 2). Just 6% (10) of caregivers used the AAA, whereas 26% (45) received VHA support. Of the 54 veterans who were caring for a veteran, 40 reported using the VHA as a resource. Five people caring for nonveterans reported using the VHA as a resource; however, data about which resources those caregivers were accessing were not collected (Table 3).
AAA Referral and Randomization
Sixty-five percent of caregivers accepted AAA referrals. Of 109 Salt Lake County caregivers, 70% accepted referral to the AAA. There was no statistically significant difference in referral acceptance rates when comparing Salt Lake County residents with nonresidents (P = .09).The authors were unable to obtain the phone number for 1 caregiver who had accepted a referral, and 1 caregiver who accepted referral did not want a follow-up. This left 111 caregivers available for follow-up, 75 in Salt Lake County. Fifty Salt Lake County veterans were randomly assigned to the VIR group and 25 to the PIR group. The 36 caregivers who accepted referrals outside Salt Lake County also were placed in the VIR group, for a total of 86 caregivers.
Follow-up
Ninety-eight percent of caregivers were reached for follow-up. Both people lost to follow-up were in Salt Lake County (1 in each group).
In Salt Lake County, 12% (6) of the VIR group and 64% (16) of the PIR group had connected with the AAA (P < .01). Although 64% of those in the PIR group reported having been called by the AAA, the AAA representative reported all 25 had been called. The AAA records showed 9 of those called were reached by voice mail, 6 were provided information about caregiving resources, 2 formally joined the support program, 5 declined help, 1 was no longer caregiving, 1 was too busy to talk, and 1 was the wrong phone number (and was lost to follow-up as well).
Outside of Salt Lake County 19% (7) reported calling the local AAA. There was no difference in referral completion between the Salt Lake County/non-Salt Lake County VIR groups (P = .4).
Fifteen percent of all VIR caregivers reported calling the AAA. There were no statistical differences between Salt Lake County VIR and non-Salt Lake County VIR for reasons why the veteran had not called the AAA (Table 4).
Of 28 people who connected with the AAA, 16 (57%) said they had received access to a needed resource as a result of the phone call. Seven caregivers (25%) said they had not been referred to other resources as a result of the call. The VIR group was more likely to be referred to other resources after contacting the AAA than was the PIR group, although this difference did not reach significance (69% vs 47%, P = .28).
Discussion
More than one-third (36%) of veterans seen in the VASLCHCS PCC are caregivers. This prevalence is higher than that reported for the general U.S. population and higher than that reported in other veteran groups.5,17,18 Most caregivers in this project were caring for nonveterans and only had access to VHA psychosocial caregiver support programs because VHA functional caregiver support (eg, respite, homemaker services) is not available to veterans who care for nonveterans. A majority (78%) of caregiving veterans reported some caregiver burden. Despite the burden, most are not using community resources. However when offered, more than half the caregivers were interested in an AAA referral.
Although the VHA does not provide functional caregiver support resources to veterans caring for nonveterans, there are other agencies that can assist veterans: AAAs for care recipients aged ≥ 60 years and the ADRCs for younger veterans. Through AAAs, caregivers can access a variety of support services, including transportation, adult day care, caregiver support, and health promotion programs. Partnership between agencies such as the VHA and the AAAs could benefit caregiving veterans. This QI project suggests ways to strengthen interagency cooperation.
This study also suggests that a provider or clinic-initiated referral is more likely to connect veterans with information and resources than the current practice of recommending that the veteran initiate the referral. Once in contact with the AAA, most caregivers were referred to needed resources. The next step will be to establish an efficient way for clinic staff to identify caregiving veterans and make referrals to community programs. Referrals could be made by any member of the patient aligned care team (PACT) to further standardize and streamline the process.
Thirty-one percent of veterans in this project were eligible for the VHA caregiver support program because they cared for a veteran. However, 25% of these caregiving veterans were not accessing this resource. Increasing awareness of the VHA caregiver support program among veterans caring for other veterans would improve caregiver support to both caregiving and care recipient veterans.
Limitations
One limitation of this project was the intentional exclusion of the women’s clinic from the sampling process. For consistency, the authors wanted to limit the intervention to 1 PCC and so they chose the clinic that serves the majority of the veterans who receive primary care at VASLCHCS. Additionally, the literature showed that male caregivers compared with women caregivers20,21 have different characteristics in regards to caregiver burden, and a well-designed study of women caregivers already has been published.19
Also, this study did not obtain data on age, health problems, or socioeconomic status of the caregivers to avoid identifying information. Last, the authors did not ask about time spent caregiving or type of care provided. These questions may be important for future studies. Future investigations should evaluate health care use and health of caregivers vs noncaregivers in the veteran population. It also could be important to determine methods for building bridges between the VHA, AAAs, and other community services.
Conclusion
To minimize the disruption that a research study might have caused to normal clinical workflow, the primary author played the role that a medical social worker or other PACT member might play in the future. This project sheds light on how to improve outcomes for community referrals and an important future step in this research would be to develop and test a process that would integrate the PACT into the referral process.
More than one-third of veterans seen in the VASLCHCS PCC are caregivers. To the authors’ knowledge, this is the first estimate of prevalence of caregiving in veterans who receive primary care from the VHA. About 63% of caregiving veterans perceived some burden due to caregiving, and 66% accepted referral to community resources. However, only 12% who were asked to self-refer made contact with the AAA compared with 64% when a provider made the referral for them. Provider referral is more effective in connecting caregiving veterans with resources. Development of interagency partnerships should be fostered to help veterans decrease caregiving burden.
This project is one of the few studies looking at this special group of caregivers: veterans who serve as caregivers. It highlights the need for the VHA to establish policies and partnerships to improve caregiver support to this valuable group of veterans.
1. Ortman JM, Velkoff VA, Hogan H. An aging nation: the older population in the United States: population estimates and projections. http://www.census .gov/prod/2014pubs/p25-1140.pdf. Published May 2014. Accessed March 9, 2017.
2. Smith AK, Walter LC, Miao Y, Boscardin WJ, Covinsky KE. Disability during the last two years of life. JAMA Intern Med. 2013;173(16):1506-1513.
3. National Alliance for Caregiving, American Association of Retired Persons. Caregiving in the U.S. 2009 executive summary. http://assets.aarp.org/rgcenter/il/caregiving_09_es.pdf. Published November 2009. Accessed March 9, 2017.
4. Spillman BC, Wolff J, Freedman VA, Kasper JD; Office of the Assistant Secretary for Planning and Evaluation, U.S. Department of Health and Human Services. Informal caregiving for older Americans: an analysis of the 2011 national study of caregiving. https://aspe.hhs.gov/report/informal-caregiving-older-americans-analysis-2011-national-study-caregiving. Published April 1, 2014. Accessed March 9, 2017.
5. Feinberg L, Reinhard SC, Houser A, Choula R; AARP Public Policy Institute. Valuing the invaluable: 2011 update. The growing contributions and costs of family caregiving. https://assets.aarp .org/rgcenter/ppi/ltc/i51-caregiving.pdf. Published June 2011. Accessed March 9, 2017.
6. Adelman RD, Tmanova LL, Delgado D, Dion S, Lachs MS. Caregiver burden: a clinical review. JAMA. 2014;311(10):1052-1059.
7. Burton LC, Newsom JT, Schulz R, Hirsch CH, German PS. Preventive health behaviors among spousal caregivers. Prev Med. 1997;26(2):162-169.
8. Talley RC, Crews JE. Framing the public health of caregiving. Am J Public Health. 2007;97(2):224-228.
9. Hoffman GJ, Lee J, Mendez-Luck CA. Health behaviors among baby boomer informal caregivers. Gerontologist. 2012;52(2):219-230.
10. National Alliance for Caregiving. Caregivers of veterans—serving on the homefront: report of study findings. http://www.caregiving.org/data/2010 _Caregivers_of_Veterans_FULLREPORT_WEB_FINAL.pdf. Published November 2010. Accessed March 9, 2017.
11. Johannesen M, LoGuidice D. Elder abuse: a systematic review of risk factors in community dwelling elders. Age Ageing. 2013;42(3):292-298.
12. Goy E, Kansagara D, Freeman M;Department of Veterans Affairs, Health Services Research & Development Service. A systematic evidence review of interventions for non-professional caregivers of individuals with dementia. http://www.hsrd.research .va.gov/publications/esp/DementiaCaregivers-EXEC .pdf. Published October 2010. Accessed March 9, 2017.
13. Belle SH, Burgio L, Burns R, et al; Resources for Enhancing Alzheimer’s Caregiver Health (REACH) II Investigators. Enhancing the quality of life of dementia caregivers from different ethnic or racial groups: a randomized controlled trial. Ann Intern Med. 2006;145(10):727-738.
14. Nichols LO, Martindale-Adams J, Burns R, Graney MJ, Zuber J. Translation of a dementia caregiver support program in a health care system—REACH VA. Arch Intern Med. 2011;171(4):353-359.
15. Bass DM, Judge KS, Snow AL, et al. Caregiver outcomes of partners in dementia care: effect of a care coordination program for veterans with dementia and their family members and friends. J Am Geriatr Soc. 2013;61(8):1377-1386.
16. U.S. Department of Veteran Affairs. VA caregiver support: caregiver services. http://www.caregiver .va.gov/support/support_services.asp. Updated June 3, 2015. Accessed March 9, 2017.
17. Monin JK, Levy BR, Pietrzak RH. From serving in the military to serving loved ones: unique experiences of older veteran caregivers. Am J Geriatr Psychiatry. 2014;22(6):570-579.
18. Parker MW, Call VR, Dunkle R, Vaitkus M. “Out of sight” but not “out of mind”: parent contact and worry among senior ranking male officers in the military who live long distances from parents. Milit Psychol. 2002;14(4):257-277.
19. Lavela SL, Etingen B, Louise-Bender Pape T. Caregiving experiences and health conditions of women veteran and non-veteran caregivers. Womens Health Issues. 2013;23(4):e225-e232.
20. Yee JL, Schultz RS. Gender differences in psychiatric morbidity among family caregivers: a review and analysis. Gerontologist. 2000;40(2):147-164.
21. Collins CR. Men as caregivers of the elderly: support for the contributions of sons. J Multidiscip Healthc. 2014;7:525-531.
Cells are key to specification of HSCs, team says
Experiments in zebrafish embryos have suggested that trunk neural crest cells play a key role in the specification of hematopoietic stem cells (HSCs).
Researchers believe this finding could be used to aid the creation of HSCs in the lab and ultimately help improve access to HSC transplant.
“The research will likely open new avenues of investigation in stem cell biology and blood development and provide insight to aid efforts to make transplantable hematopoietic stem cells in the lab,” said Wilson Clements, PhD, of St. Jude Children’s Research Hospital in Memphis, Tennessee.
Dr Clements and Erich W. Damm, PhD, also of St. Jude, described this research in Nature Cell Biology.
The researchers noted that scientists have yet to achieve in vitro specification of normal HSCs with a high level of engraftment and normal multilineage potential. And this suggests key specification signals remain unknown.
The pair pointed out that, in all vertebrates, HSCs arise from hemogenic endothelium in the ventral floor of the dorsal aorta. And stromal cells residing in stem cell microenvironments often act as a niche to contribute cues that regulate behavior.
“Researchers have speculated that the endothelial cells that give rise to blood-forming stem cells are surrounded by a support niche of other cells whose identity and origins were unknown,” Dr Damm said. “Our results support the existence of a niche and identify trunk neural crest cells as an occupant.”
Trunk neural crest cells are made in the developing spinal cord and migrate throughout the embryo. The cells eventually give rise to a variety of adult cells, including neurons and glial cells in the sympathetic and parasympathetic nervous system.
Using time-lapse video, Drs Clements and Damm tracked the migration of neural crest cells in the transparent embryos of zebrafish. (Zebrafish and humans share nearly identical blood systems.)
After about 20 hours, the neural crest cells had reached the developing aorta. After hour 24, the migrating cells had cozied up to the endothelial cells in the aorta, which then turned on genes, such as runx1, indicating their conversion to HSCs.
Additional experiments revealed that migration of neural crest cells to the dorsal aorta is dependent on platelet-derived growth factor signaling, and this signaling is required for HSC specification.
Likewise, the physical association of neural crest cells with the pre-hematopoietic dorsal aorta is required for initiation of the hematopoietic program and HSC specification.
Drs Clements and Damm said these results suggest neural crest cells are key cellular components of the HSC specification niche that can be profiled to identify unknown HSC specification signals. ![]()
Cancer risk, burden expected to shift in HIV population
WASHINGTON, DC—New research suggests HIV-positive adults in the US will see a shift in cancer risk and burden in the coming years.
The study indicates that, through 2030, people living with HIV will see a decrease in AIDS-defining cancers, such as non-Hodgkin lymphoma (NHL) and Kaposi sarcoma.
But this group will also see an increase in cancers not linked to AIDS, such as prostate and liver cancers.
Researchers made these projections in a presentation at the AACR Annual Meeting 2017 (abstract 5302).
“Declines in cancer incidence rates, particularly for AIDS-defining cancers, are likely driven by widespread treatment with modern antiretroviral therapies, which reduce immune suppression and decrease risk of some cancers,” said Jessica Y. Islam, a doctoral student at the University of North Carolina Gillings School of Global Public Health in Chapel Hill.
She and her collaborators estimated future cancer risk and burden for HIV-positive people using age-specific cancer incidence data from the National Cancer Institute HIV/AIDS Cancer Match (HACM) Study, and projected HIV prevalence data from the Centers for Disease Control and Prevention.
Cancer incidence
From 2000 to 2012, there were 23,907 cancers reported in 463,300 HIV-infected adults in the HACM Study. Based on trends in this study, the researchers made projections for cancer incidence through 2030.
They projected that HIV-positive adults of all ages will see a significant decrease over time in the incidence of NHL, Kaposi sarcoma, cervical cancer, anal cancer among men who have sex with men (MSM), lung cancer, and Hodgkin lymphoma.
Patients age 65 and older will see a significant decrease in colon cancer incidence over time. However, there will be no significant change for patients younger than 65.
HIV-positive adults of all ages will see no significant change over time in the incidence of liver cancer, oral cavity cancer, anal cancer among non-MSMs, and breast cancer.
The incidence of prostate cancer will increase significantly among patients ages 35 to 44 and among patients ages 45 to 64.
Cancer burden
The researchers said the number of adults living with HIV in the US is projected to increase from 1.06 million in 2006 to 1.17 million in 2018, but it is expected to decline to 1.09 million in 2030.
The team noted that, in 2006, there were an estimated 8241 cancers in patients with HIV—3522 AIDS-defining cancers and 4719 malignancies not associated with AIDS.
In 2030, the total number of cancers in the HIV-positive population is projected to be 6692, with decreases in AIDS-defining cancers (n=716) and increases in other cancers (n=5976) from the 2006 data.
In 2010, the most common cancers among HIV-positive patients were estimated to be NHL (n=1488), Kaposi sarcoma (n=1133), and lung cancer (n=815).
But in 2030, the most common cancers are projected to be prostate (n=1587), lung (n=1027), and liver cancers (n=483).
“It is critical to understand both incidence rates and burden over time, as rates capture changes in cancer risk, and burden quantifies the actual number of cancer cases expected to occur,” said study investigator Meredith S. Shiels, PhD, of the National Cancer Institute in Bethesda, Maryland.
“For example, lung cancer rates are expected to decrease in the future, but the burden is expected to increase due to the growing number of older people living with HIV.” ![]()