User login
The eyelids have it: bug bites 101
NEWPORT BEACH, CA. – Bed bugs rise when night falls. Drawn by the carbon dioxide of sleeping humans, they gather to feast, leaving bites galore.
But other insects dine on people, too. Telling their bites apart is an important – and sometimes difficult – job for dermatologists who treat children. Fortunately, there are clinical signs to look for, a pediatric dermatologist told an audience of colleagues, including one that she herself helped introduce.
It’s called the “Eyelid Sign,” a clinical clue, Andrea Zaenglein, MD, said at Skin Diseases Education Foundation’s Women & Pediatric Dermatology Seminar.

Dr. Zaenglein, professor of dermatology and pediatric dermatology at Penn State University, Hershey, has often seen children with bites on their eyelids since they’re being bitten by bed bugs while they’re asleep. “You don’t get a lot of eyelid bites with other things,” she said. “Think about bed bugs whenever you see eyelid bites.”
She and a colleague reported on the “Eyelid Sign” in a study published in 2014, describing papules on the upper eyelid or eyelids associated with erythema and edema in six patients (Pediatr Dermatol. 2014 May-Jun;31[3]:353-5).
During her presentation, Dr. Zaenglein offered more tips on detecting bed bugs:
• Keep in mind that they’re probably not going to be sitting there under the pillow, waiting for your patients to find them. “They like to hide in nooks and crannies,” she said. “They don’t really stay in your bed.” Common hiding places include mattresses, floorboards, and wallpaper.
• Bed bugs are about the size of an apple seed. Stains and dark spots on bed sheets and mattresses can be signs of crushed bed bugs and bed bug excrement.
• They’re more common in urban areas, but “bed bugs are a problem in probably all of our communities,” Dr. Zaenglein noted.
• Some children can develop a reaction to bed bugs and other insects known as papular urticaria. “I have to explain to parents that this is a hypersensitivity response that’s abnormal,” Dr. Zaenglein said.
She noted that papular urticaria tends to be worse in summer and rarely involves the face. Treatments include antihistamines, strong topical steroids, and prevention of insect bites.
As for bed bug bites in general, the Centers for Disease Control and Prevention recommends antiseptic creams or lotions and antihistamine use.
How can bed bugs be killed off for good? The CDC suggests insecticide spraying to eliminate bed bugs, and states that “the best way to prevent bed bugs is regular inspection for the signs of an infestation.”
During the presentation, Dr. Zaenglein also spoke about scabies, focusing on the unique traits of the condition in babies.
“They always present with a lot of rash,” she said. “They won’t have a few papules on their hands and feet like older kids.” The rash will be “dirty-looking,” she continued, and more asymmetric than symmetric. Also, “you’ll almost always get a lot of mites burden if you scrape a baby,” she said. “It’s much harder to find a mite in older kids and young adults.”
Affected babies may be referred from an emergency department or primary care doctor with an incorrect diagnosis of eczema, she said, adding that scabies is extremely contagious. “If a baby has scabies,” she said, “you inevitably have to get your prescription pad. Treat all the household members.”
Babies may be itchy, but itchiness is much more common in older kids and young adults, keeping them up at night, she said. “College students come home over the break with a couple of papules on the belly, and they say it’s driving them crazy. They say it’s crazy, crazy itchy. If you hear that, think scabies.”
Another scabies clue in older kids: hand involvement. “Always look at the wrist, between the fingers. You get these generalized eruptions there.”
Scabies bites can be treated with a topical corticosteroid and, in children aged 2 months and older, permethrin 5% cream. Dr. Zaenglein said there’s concern about a leukemia risk associated with permethrin, but that applies to industrial use and overuse. Ivermectin is an alternative for stubborn and institutional cases.
As for prevention, she said pesticide sprays and fogs are generally discouraged. She advises families to wash recently used clothing and bedding in hot water. Clothing and bedding, including pillows, can also be stored in a closed plastic bag for up to a week.
“You could dry clean it all too,” she said, “but I’ll bet your dry cleaner won’t be too happy about it.”
Dr. Zaenglein disclosed serving as a consultant and researcher for Ranbaxy Laboratories Limited.
SDEF and this news organization are owned by the same parent company.
NEWPORT BEACH, CA. – Bed bugs rise when night falls. Drawn by the carbon dioxide of sleeping humans, they gather to feast, leaving bites galore.
But other insects dine on people, too. Telling their bites apart is an important – and sometimes difficult – job for dermatologists who treat children. Fortunately, there are clinical signs to look for, a pediatric dermatologist told an audience of colleagues, including one that she herself helped introduce.
It’s called the “Eyelid Sign,” a clinical clue, Andrea Zaenglein, MD, said at Skin Diseases Education Foundation’s Women & Pediatric Dermatology Seminar.
Dr. Zaenglein, professor of dermatology and pediatric dermatology at Penn State University, Hershey, has often seen children with bites on their eyelids since they’re being bitten by bed bugs while they’re asleep. “You don’t get a lot of eyelid bites with other things,” she said. “Think about bed bugs whenever you see eyelid bites.”
She and a colleague reported on the “Eyelid Sign” in a study published in 2014, describing papules on the upper eyelid or eyelids associated with erythema and edema in six patients (Pediatr Dermatol. 2014 May-Jun;31[3]:353-5).
During her presentation, Dr. Zaenglein offered more tips on detecting bed bugs:
• Keep in mind that they’re probably not going to be sitting there under the pillow, waiting for your patients to find them. “They like to hide in nooks and crannies,” she said. “They don’t really stay in your bed.” Common hiding places include mattresses, floorboards, and wallpaper.
• Bed bugs are about the size of an apple seed. Stains and dark spots on bed sheets and mattresses can be signs of crushed bed bugs and bed bug excrement.
• They’re more common in urban areas, but “bed bugs are a problem in probably all of our communities,” Dr. Zaenglein noted.
• Some children can develop a reaction to bed bugs and other insects known as papular urticaria. “I have to explain to parents that this is a hypersensitivity response that’s abnormal,” Dr. Zaenglein said.
She noted that papular urticaria tends to be worse in summer and rarely involves the face. Treatments include antihistamines, strong topical steroids, and prevention of insect bites.
As for bed bug bites in general, the Centers for Disease Control and Prevention recommends antiseptic creams or lotions and antihistamine use.
How can bed bugs be killed off for good? The CDC suggests insecticide spraying to eliminate bed bugs, and states that “the best way to prevent bed bugs is regular inspection for the signs of an infestation.”
During the presentation, Dr. Zaenglein also spoke about scabies, focusing on the unique traits of the condition in babies.
“They always present with a lot of rash,” she said. “They won’t have a few papules on their hands and feet like older kids.” The rash will be “dirty-looking,” she continued, and more asymmetric than symmetric. Also, “you’ll almost always get a lot of mites burden if you scrape a baby,” she said. “It’s much harder to find a mite in older kids and young adults.”
Affected babies may be referred from an emergency department or primary care doctor with an incorrect diagnosis of eczema, she said, adding that scabies is extremely contagious. “If a baby has scabies,” she said, “you inevitably have to get your prescription pad. Treat all the household members.”
Babies may be itchy, but itchiness is much more common in older kids and young adults, keeping them up at night, she said. “College students come home over the break with a couple of papules on the belly, and they say it’s driving them crazy. They say it’s crazy, crazy itchy. If you hear that, think scabies.”
Another scabies clue in older kids: hand involvement. “Always look at the wrist, between the fingers. You get these generalized eruptions there.”
Scabies bites can be treated with a topical corticosteroid and, in children aged 2 months and older, permethrin 5% cream. Dr. Zaenglein said there’s concern about a leukemia risk associated with permethrin, but that applies to industrial use and overuse. Ivermectin is an alternative for stubborn and institutional cases.
As for prevention, she said pesticide sprays and fogs are generally discouraged. She advises families to wash recently used clothing and bedding in hot water. Clothing and bedding, including pillows, can also be stored in a closed plastic bag for up to a week.
“You could dry clean it all too,” she said, “but I’ll bet your dry cleaner won’t be too happy about it.”
Dr. Zaenglein disclosed serving as a consultant and researcher for Ranbaxy Laboratories Limited.
SDEF and this news organization are owned by the same parent company.
AT SDEF WOMEN'S & PEDIATRIC DERMATOLOGY SEMINAR
My Fitness Journey
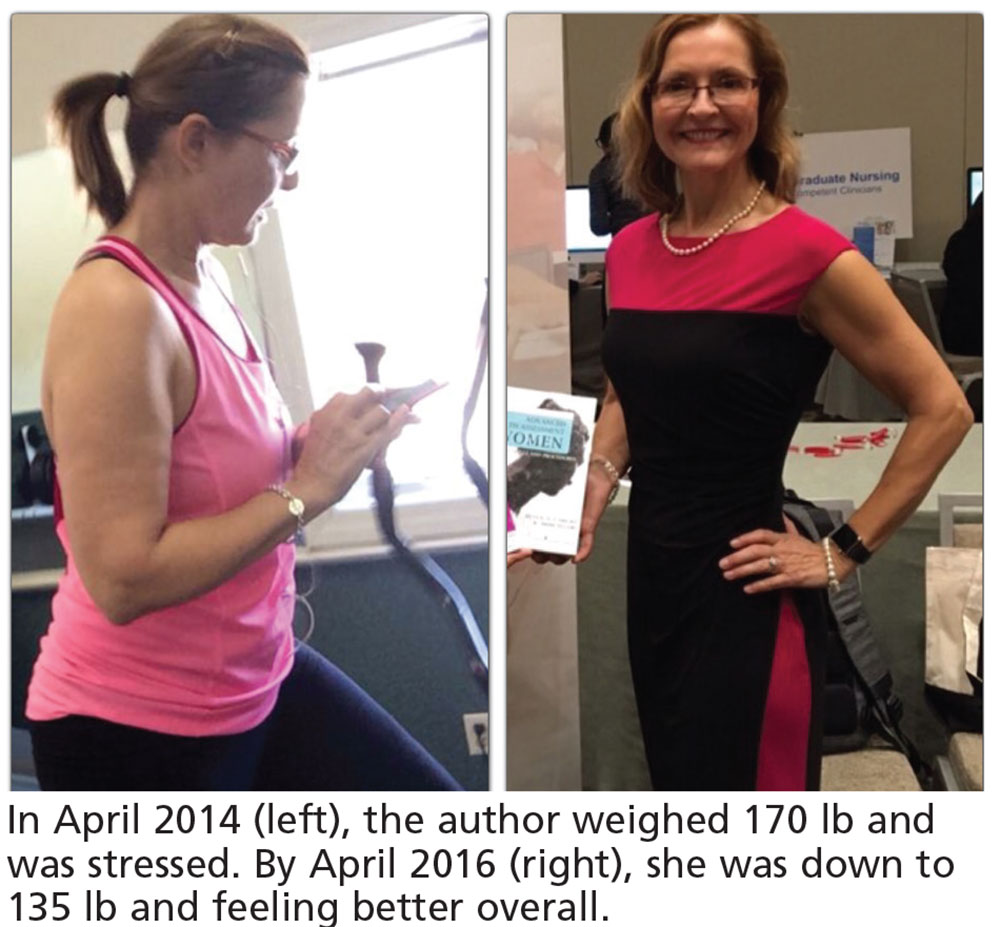
One month into my doctoral program, I was stressed out, anxious, not sleeping well, and gaining weight. I expressed these concerns to my daughter, who is a professional bodybuilder and fitness coach; she offered to help me get healthy and fit while earning my doctorate from Rocky Mountain University of Health Professions in Provo, Utah. Over the next two years, I lost 35 pounds and 12 inches of fat from my belly and became more muscular than ever before! I even decided to participate in my first bodybuilding show, “Debut at 62,” on November 19th in Providence, Rhode Island.
I was honored to be the student commencement speaker and recipient of the Student Service Award for my contributions to the NP profession—but what I’m most proud of is adopting a healthy and fit lifestyle in the midst of the most stressful two years of my life. In fact, I believe learning to cope with extreme stress helped me perform more effectively in my doctoral program. I had more energy and concentration, better sleep, and very few physical complaints.
Certainly, I realize that it can be difficult for us to walk our talk and be role models for our patients. When faced with extreme stress we often “crash and burn.” We gain weight, get depressed, sleep poorly, stop having sex, drink excessively, you name it! We know what we should do but lack the energy, time, and motivation to implement and maintain healthy habits. In order to effectively deal with the stress in our lives, we must practice self-care. This approach may seem counterintuitive, as our natural reaction to stress is usually to abandon healthy habits and resort to eating junk food, drinking alcohol, watching TV, and not exercising. It requires conscious effort, development of new habits (and breaking of old ones!), practice, consistency, and a lot of support to cope with stress in a positive way. Mind control, meditation, and paced breathing are other cognitive-based techniques that can be used to help combat the negative effects of stress and anxiety.
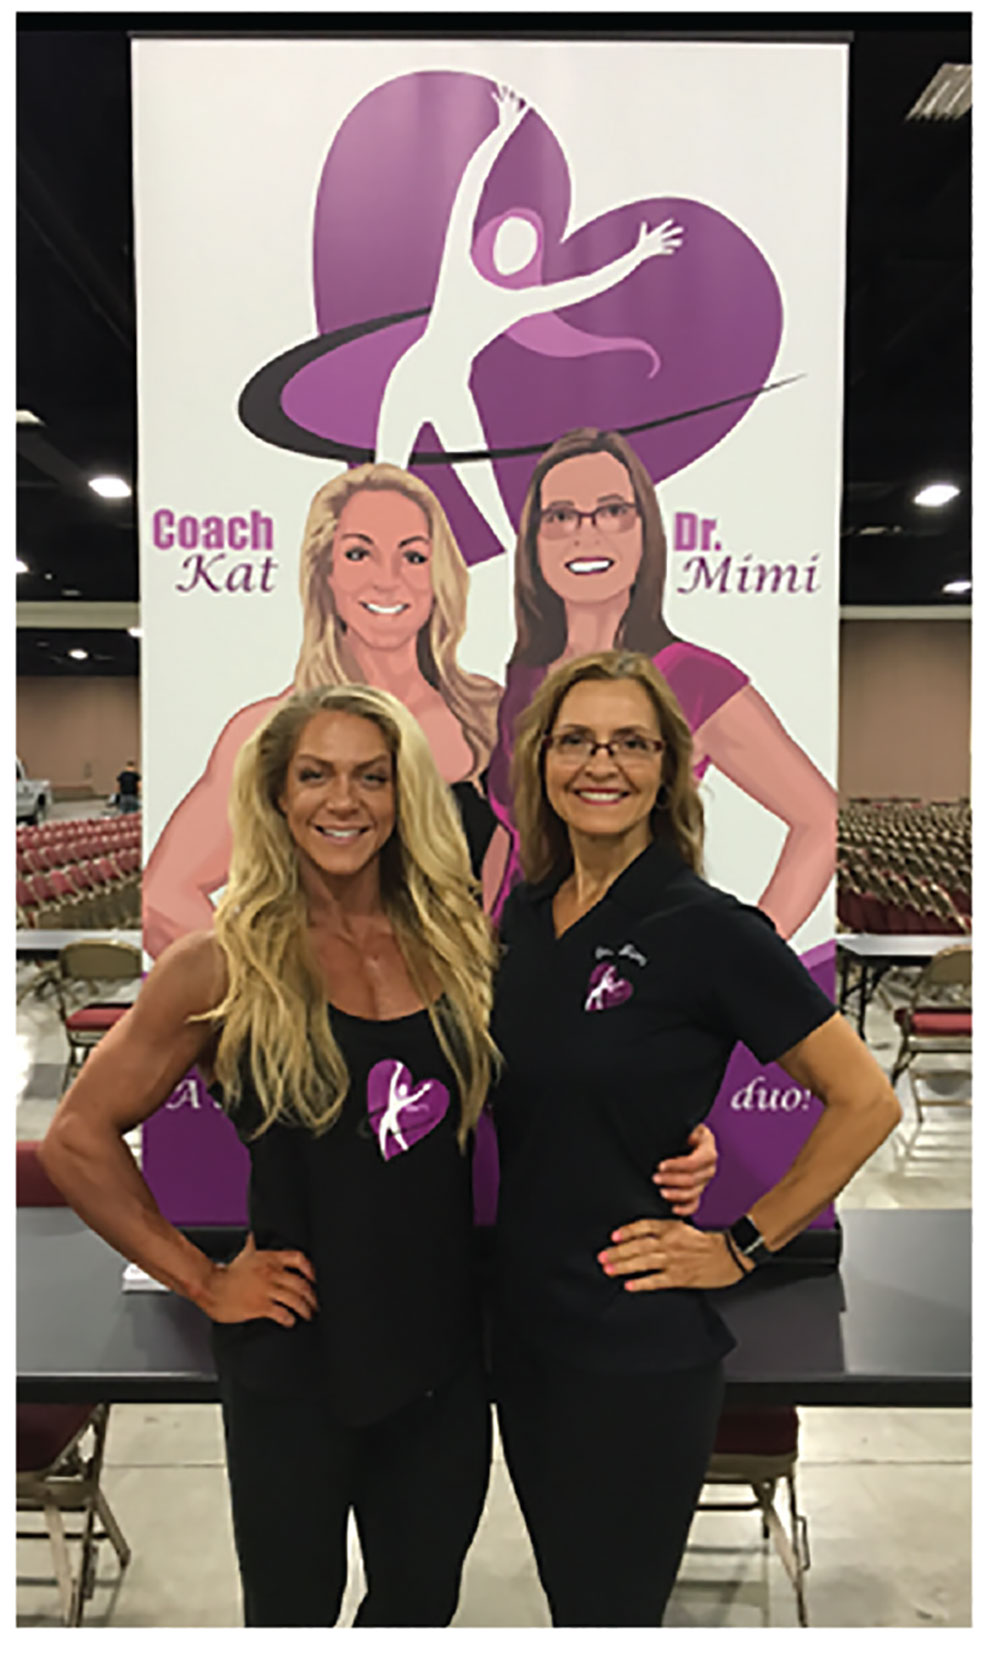
As a result of my experience and transformation, my daughter and I decided to team up to help other NPs and PAs make positive changes in their lives. Under the names Coach Kat and Doctor Mimi, we developed The Secor Initiative—an intensive, one-year, online program for NPs or PAs who are seriously committed to becoming healthy, happy, and fit. Upon completion of the program, participants achieve the esteemed title of “Top NP” or “Top PA,” enabling them to be role models for their peers and patients.
The Secor Initiative helps NPs and PAs gain insight into all the sources of stress in their lives and then go on to learn how to cope with these stressors. Our program includes five (10-week) courses, with topics such as nutrition, exercise, money/wealth, stress management, and advanced women’s health; for more information, visit www.MimiSecor.com and click on The Secor Initiative or check out our Facebook page, Coach Kat and Dr. Mimi.
Let’s step up to the plate and become healthy (and happy) role models for our patients.
One month into my doctoral program, I was stressed out, anxious, not sleeping well, and gaining weight. I expressed these concerns to my daughter, who is a professional bodybuilder and fitness coach; she offered to help me get healthy and fit while earning my doctorate from Rocky Mountain University of Health Professions in Provo, Utah. Over the next two years, I lost 35 pounds and 12 inches of fat from my belly and became more muscular than ever before! I even decided to participate in my first bodybuilding show, “Debut at 62,” on November 19th in Providence, Rhode Island.
I was honored to be the student commencement speaker and recipient of the Student Service Award for my contributions to the NP profession—but what I’m most proud of is adopting a healthy and fit lifestyle in the midst of the most stressful two years of my life. In fact, I believe learning to cope with extreme stress helped me perform more effectively in my doctoral program. I had more energy and concentration, better sleep, and very few physical complaints.
Certainly, I realize that it can be difficult for us to walk our talk and be role models for our patients. When faced with extreme stress we often “crash and burn.” We gain weight, get depressed, sleep poorly, stop having sex, drink excessively, you name it! We know what we should do but lack the energy, time, and motivation to implement and maintain healthy habits. In order to effectively deal with the stress in our lives, we must practice self-care. This approach may seem counterintuitive, as our natural reaction to stress is usually to abandon healthy habits and resort to eating junk food, drinking alcohol, watching TV, and not exercising. It requires conscious effort, development of new habits (and breaking of old ones!), practice, consistency, and a lot of support to cope with stress in a positive way. Mind control, meditation, and paced breathing are other cognitive-based techniques that can be used to help combat the negative effects of stress and anxiety.
As a result of my experience and transformation, my daughter and I decided to team up to help other NPs and PAs make positive changes in their lives. Under the names Coach Kat and Doctor Mimi, we developed The Secor Initiative—an intensive, one-year, online program for NPs or PAs who are seriously committed to becoming healthy, happy, and fit. Upon completion of the program, participants achieve the esteemed title of “Top NP” or “Top PA,” enabling them to be role models for their peers and patients.
The Secor Initiative helps NPs and PAs gain insight into all the sources of stress in their lives and then go on to learn how to cope with these stressors. Our program includes five (10-week) courses, with topics such as nutrition, exercise, money/wealth, stress management, and advanced women’s health; for more information, visit www.MimiSecor.com and click on The Secor Initiative or check out our Facebook page, Coach Kat and Dr. Mimi.
Let’s step up to the plate and become healthy (and happy) role models for our patients.
Threats in school: Is there a role for you?
Do you remember that kid in your class threatening to beat up a peer (or maybe you) after school? Mean children are not unique to current times. But actual threat to life while in school is a more recent problem, mainly due to the availability of firearms in American homes. Although rates of victimization have actually dropped 86% from 1992 to 2014, stories about school shootings are instantly broadcast across the country, making everyone feel that it could happen to them. Such public awareness also models threatening violence as a potent attention getter.

Often the threatening child lacks not only the skills to manage the frustrating situation, but also the language ability to choose less incendiary words. Saying, “I don’t think the way you handled that was fair to me,” might always be difficult, but is certainly impossible under the high emotions of the moment. Instead, “I’m going to kill you” pops out of their mouths. As for asking for help, school-aged children can only apologize or confess to being unsure a limited number of times before their need to save face takes precedence. This is especially true if they are confronted and humiliated in front of their peers.
Children who have oppositional or aggressive behavior diagnoses are by definition already in a pattern of reacting with hostility when demands are placed on them. In some cases, these negative reactions successfully get their parent(s) to back off the demand, resulting in what is called the “coercive cycle of interaction,” a prodrome to conduct disorder. Then, when a teacher issues a command, their reflexive response is more likely to be a defiant or aggressive one.
When threatening behavior is met by the supervising adults with confrontation, things may further accelerate, again especially in front of peers before whom the student does not want to look weak. Instead, a methodical approach to threat assessment in schools has been shown to be more effective. The main features of effective threat assessment involve identifying student threats, determining their seriousness, and developing intervention plans that both protect potential victims and address the underlying problem or conflict that sparked the threat.
A model program, Virginia Model for Student Threat Assessment by Dewey G. Cornell, PhD, of the University of Virginia, has been shown to help sort out transient (70%) from substantive (30%) threats and resulted in fewer long-term suspensions or expulsions and no cases in which the threats were carried out. (Send a copy to your local school superintendent.) While children receiving special education made three times more threats and more severe threats, they did not require more suspensions. With this threat assessment program, the number of disciplinary office referrals for these students declined by about 55% for the rest of that school year. Students in schools using this method reported less bullying, a greater willingness to seek help for bullying and threats, and more positive perceptions of the school climate as having fairer discipline and less aggression. Resulting plans to help the students involved in threats included modifications to special education plans, academic and behavioral support services, and referrals to mental health services. All these interventions are intended to address gaps in skills. In addition, ways to give even struggling students a meaningful connection to their school – for example, through sports, art, music, clubs, or volunteering – are essential components of both prevention and management.
There are several ways you, as a pediatrician, may be involved in the issue of threats at school. If one of your patients has been accused of threatening behavior, your knowledge of the child and family puts you in the best position to sort out the seriousness of the threat and appropriate next steps. Recently, one of my patients with mild autism was suspended for threatening to “kill the teacher.” He had never been aggressive at home or at school. This 8-year-old usually has a one-on-one aide, but the aide had been pulled to help other students. After an unannounced fire drill, the child called the teacher “evil” and was given his “third strike” for behavior, resulting in him making this threat.
Threat assessment in schools needs to follow the method of functional behavioral assessment, which should actually be standard for all school behavior problems. The method should consider the A (antecedent), B (behavior), C (consequence), and G (gaps) of the behavior. The antecedent here included the “setting” event of the fire drill. The behavior (sometimes also the belief) was the child’s negative reaction to the teacher (who had failed to protect him from being frightened). The consequence was a punishment (third strike) that the child felt was unfair. The gaps in skills included the facts that this is an anxious child who depends on support and routine because of his autism and who is also hypersensitive to loud noise such as a fire drill. In this case, I was able to explain these things to the school, but, in any case, you can, and should, request that the school perform a functional behavioral assessment when dealing with threats.
When you have a child with learning or emotional problems under your care, you need to include asking if they feel safe at school and if anything scary or bad has happened to them there. The parents may need to be directed to meet with school personnel about threats or fears the child reports. School violence prevention programs often include education of the children to be alert for and report threatening peers. This gives students an active role, but also may cause increased anxiety. Parents may need your support in requesting exemption from the school’s “violence prevention training” for anxious children. Anxious parents also may need extra coaching to avoid exposing their children to discussions about school threats.
In caring for all school-aged children (girls are as likely to be involved in school violence as boys), I ask about whether their teachers are nice or mean. I also ask if they have been bullied at school or have bullied others. I also sometimes ask struggling children, “If you had the choice, would you rather go to school or stay home?” The normal, almost universal preference is to go to school. School is the child’s job and social home, and, even when the work is hard, the need for mastery drives children to keep trying. Children preferring to be home are likely in pain and deserve careful assessment of their skills, their emotions, and the school and family environments.
While the percentage of students who reported being afraid of attack or harm at school decreased from 12% in 1995 to 3% in 2013, twice as many African American and Hispanic students feared being attacked than white students. It is clear that feeling anxious interferes with learning. Actual past experience with violence further lowers the threshold for feeling upset. The risk to learning of being fearful at school for children in stressed neighborhoods is multiplied by violence they may experience around them at home, causing even greater impact. Even when actual violence is rare, the media have put all kids and parents on edge about whether they are safe at school. This is a tragedy for everyone involved.
Dr. Howard is assistant professor of pediatrics at Johns Hopkins University, Baltimore, and creator of CHADIS (www.CHADIS.com). She had no other relevant disclosures. Dr. Howard’s contribution to this publication was as a paid expert to Frontline Medical News.
Do you remember that kid in your class threatening to beat up a peer (or maybe you) after school? Mean children are not unique to current times. But actual threat to life while in school is a more recent problem, mainly due to the availability of firearms in American homes. Although rates of victimization have actually dropped 86% from 1992 to 2014, stories about school shootings are instantly broadcast across the country, making everyone feel that it could happen to them. Such public awareness also models threatening violence as a potent attention getter.
Often the threatening child lacks not only the skills to manage the frustrating situation, but also the language ability to choose less incendiary words. Saying, “I don’t think the way you handled that was fair to me,” might always be difficult, but is certainly impossible under the high emotions of the moment. Instead, “I’m going to kill you” pops out of their mouths. As for asking for help, school-aged children can only apologize or confess to being unsure a limited number of times before their need to save face takes precedence. This is especially true if they are confronted and humiliated in front of their peers.
Children who have oppositional or aggressive behavior diagnoses are by definition already in a pattern of reacting with hostility when demands are placed on them. In some cases, these negative reactions successfully get their parent(s) to back off the demand, resulting in what is called the “coercive cycle of interaction,” a prodrome to conduct disorder. Then, when a teacher issues a command, their reflexive response is more likely to be a defiant or aggressive one.
When threatening behavior is met by the supervising adults with confrontation, things may further accelerate, again especially in front of peers before whom the student does not want to look weak. Instead, a methodical approach to threat assessment in schools has been shown to be more effective. The main features of effective threat assessment involve identifying student threats, determining their seriousness, and developing intervention plans that both protect potential victims and address the underlying problem or conflict that sparked the threat.
A model program, Virginia Model for Student Threat Assessment by Dewey G. Cornell, PhD, of the University of Virginia, has been shown to help sort out transient (70%) from substantive (30%) threats and resulted in fewer long-term suspensions or expulsions and no cases in which the threats were carried out. (Send a copy to your local school superintendent.) While children receiving special education made three times more threats and more severe threats, they did not require more suspensions. With this threat assessment program, the number of disciplinary office referrals for these students declined by about 55% for the rest of that school year. Students in schools using this method reported less bullying, a greater willingness to seek help for bullying and threats, and more positive perceptions of the school climate as having fairer discipline and less aggression. Resulting plans to help the students involved in threats included modifications to special education plans, academic and behavioral support services, and referrals to mental health services. All these interventions are intended to address gaps in skills. In addition, ways to give even struggling students a meaningful connection to their school – for example, through sports, art, music, clubs, or volunteering – are essential components of both prevention and management.
There are several ways you, as a pediatrician, may be involved in the issue of threats at school. If one of your patients has been accused of threatening behavior, your knowledge of the child and family puts you in the best position to sort out the seriousness of the threat and appropriate next steps. Recently, one of my patients with mild autism was suspended for threatening to “kill the teacher.” He had never been aggressive at home or at school. This 8-year-old usually has a one-on-one aide, but the aide had been pulled to help other students. After an unannounced fire drill, the child called the teacher “evil” and was given his “third strike” for behavior, resulting in him making this threat.
Threat assessment in schools needs to follow the method of functional behavioral assessment, which should actually be standard for all school behavior problems. The method should consider the A (antecedent), B (behavior), C (consequence), and G (gaps) of the behavior. The antecedent here included the “setting” event of the fire drill. The behavior (sometimes also the belief) was the child’s negative reaction to the teacher (who had failed to protect him from being frightened). The consequence was a punishment (third strike) that the child felt was unfair. The gaps in skills included the facts that this is an anxious child who depends on support and routine because of his autism and who is also hypersensitive to loud noise such as a fire drill. In this case, I was able to explain these things to the school, but, in any case, you can, and should, request that the school perform a functional behavioral assessment when dealing with threats.
When you have a child with learning or emotional problems under your care, you need to include asking if they feel safe at school and if anything scary or bad has happened to them there. The parents may need to be directed to meet with school personnel about threats or fears the child reports. School violence prevention programs often include education of the children to be alert for and report threatening peers. This gives students an active role, but also may cause increased anxiety. Parents may need your support in requesting exemption from the school’s “violence prevention training” for anxious children. Anxious parents also may need extra coaching to avoid exposing their children to discussions about school threats.
In caring for all school-aged children (girls are as likely to be involved in school violence as boys), I ask about whether their teachers are nice or mean. I also ask if they have been bullied at school or have bullied others. I also sometimes ask struggling children, “If you had the choice, would you rather go to school or stay home?” The normal, almost universal preference is to go to school. School is the child’s job and social home, and, even when the work is hard, the need for mastery drives children to keep trying. Children preferring to be home are likely in pain and deserve careful assessment of their skills, their emotions, and the school and family environments.
While the percentage of students who reported being afraid of attack or harm at school decreased from 12% in 1995 to 3% in 2013, twice as many African American and Hispanic students feared being attacked than white students. It is clear that feeling anxious interferes with learning. Actual past experience with violence further lowers the threshold for feeling upset. The risk to learning of being fearful at school for children in stressed neighborhoods is multiplied by violence they may experience around them at home, causing even greater impact. Even when actual violence is rare, the media have put all kids and parents on edge about whether they are safe at school. This is a tragedy for everyone involved.
Dr. Howard is assistant professor of pediatrics at Johns Hopkins University, Baltimore, and creator of CHADIS (www.CHADIS.com). She had no other relevant disclosures. Dr. Howard’s contribution to this publication was as a paid expert to Frontline Medical News.
Ph-like ALL is highly prevalent in adults
Philadelphia chromosome–like acute lymphoblastic leukemia, a high-risk subtype of childhood ALL, accounts for more than 24% of ALL in adults and is associated with poor outcome, according to gene-expression profiling in nearly 800 adults with B-cell ALL.
In the 798 subjects aged 21-86 years, Philadelphia chromosome–like (Ph-like) ALL accounted for 27.9% of ALL cases in those aged 21-39 years, 20.4% of cases in those aged 40-59 years, and 24% of cases in those aged 60-86 years. The overall 5-year event-free survival rate was inferior in those with Ph-like ALL vs. non–Ph-like ALL (22.5% vs. 49.3%), as was the 5-year overall survival (23.8% vs. 52.4%). Increasing age also was associated with inferior outcomes: 5-year event-free survival was 40.4%, 29.8%, and 18.9% in the age groups, respectively, and 5-year overall survival was 45.2%, 35.1%, and 28.4% in the groups, respectively, Kathryn G. Roberts, Ph.D., of St. Jude Children’s Research Hospital in Memphis and her colleagues reported online ahead of print (J Clin Oncol. 2016 Nov 21. doi: 10.1200/JCO.2016.69.0073).

Ph-like ALL in children is characterized by kinase-activating alterations amenable to treatment with tyrosine kinase inhibitors, but the prevalence in adults was unclear.
“These findings warrant the development of clinical trials in adults that assess the efficacy of TKIs, similar to those that are being established for pediatric ALL,” Dr. Roberts and her associates wrote.
This study was supported by grants and other awards, some to individual authors, from the American Lebanese Syrian Associated Charities of St. Jude Children’s Research Hospital; Stand Up to Cancer, St. Baldrick’s Foundation, the American Society of Hematology, the Lady Tata Memorial Trust, the Leukemia Research Foundation, the National Cancer Institute, and the National Institutes of Health. Dr. Roberts reported that she is the inventor on a pending patent application related to gene-expression signatures for detection of underlying Philadelphia chromosome-live events and therapeutic targeting in leukemia.
Philadelphia chromosome–like acute lymphoblastic leukemia, a high-risk subtype of childhood ALL, accounts for more than 24% of ALL in adults and is associated with poor outcome, according to gene-expression profiling in nearly 800 adults with B-cell ALL.
In the 798 subjects aged 21-86 years, Philadelphia chromosome–like (Ph-like) ALL accounted for 27.9% of ALL cases in those aged 21-39 years, 20.4% of cases in those aged 40-59 years, and 24% of cases in those aged 60-86 years. The overall 5-year event-free survival rate was inferior in those with Ph-like ALL vs. non–Ph-like ALL (22.5% vs. 49.3%), as was the 5-year overall survival (23.8% vs. 52.4%). Increasing age also was associated with inferior outcomes: 5-year event-free survival was 40.4%, 29.8%, and 18.9% in the age groups, respectively, and 5-year overall survival was 45.2%, 35.1%, and 28.4% in the groups, respectively, Kathryn G. Roberts, Ph.D., of St. Jude Children’s Research Hospital in Memphis and her colleagues reported online ahead of print (J Clin Oncol. 2016 Nov 21. doi: 10.1200/JCO.2016.69.0073).
Ph-like ALL in children is characterized by kinase-activating alterations amenable to treatment with tyrosine kinase inhibitors, but the prevalence in adults was unclear.
“These findings warrant the development of clinical trials in adults that assess the efficacy of TKIs, similar to those that are being established for pediatric ALL,” Dr. Roberts and her associates wrote.
This study was supported by grants and other awards, some to individual authors, from the American Lebanese Syrian Associated Charities of St. Jude Children’s Research Hospital; Stand Up to Cancer, St. Baldrick’s Foundation, the American Society of Hematology, the Lady Tata Memorial Trust, the Leukemia Research Foundation, the National Cancer Institute, and the National Institutes of Health. Dr. Roberts reported that she is the inventor on a pending patent application related to gene-expression signatures for detection of underlying Philadelphia chromosome-live events and therapeutic targeting in leukemia.
FROM THE JOURNAL OF CLINICAL ONCOLOGY
Key clinical point:
Major finding: Ph-like ALL accounted for 27.9% of ALL cases in adults aged 21-39 years, 20.4% of cases in those aged 40-59 years, and 24% of cases in those aged 60-86 years.
Data source: Gene-expression profiling of 798 patients.
Disclosures: This study was supported by grants and other awards, some to individual authors, from the American Lebanese Syrian Associated Charities of St. Jude Children’s Research Hospital; Stand Up to Cancer, St. Baldrick’s Foundation, the American Society of Hematology, the Lady Tata Memorial Trust, the Leukemia Research Foundation, the National Cancer Institute, and the National Institutes of Health. Dr. Roberts reported that she is the inventor on a pending patent application related to gene-expression signatures for detection of underlying Philadelphia chromosome–like events and therapeutic targeting in leukemia.
Blood Pressure Changes and Persistent Hypertension Increase Dementia Risk
BALTIMORE—The impact of blood pressure on the risk of dementia in late life follows a U-shaped curve in which elevated mid-life and late-life blood pressure, as well as late-life decline in blood pressure, all independently increase the risk of dementia, according to findings from a longitudinal study of the Framingham Offspring cohort of the Framingham Heart Study.
The findings highlight the benefits of establishing and maintaining lower blood pressure in mid-life for preventing or decreasing the risk of dementia, said Emer McGrath, MD, a neurology resident at Massachusetts General Hospital in Boston, at the 141st Annual Meeting of the American Neurological Association.

Hypertension has been linked to stroke and dementia and is the most important modifiable risk factor for both outcomes. Likewise, elevated blood pressure in mid-life (ie, ages 40 to 64) and late life (ie, age 65 or older) has been linked with a heightened risk of cognitive decline, as has low blood pressure in late life, but “the relationship between blood pressure in mid and late life and dementia [is] less clear, and the relationship of blood pressure changes from mid to late life is unknown,” said Dr. McGrath.
The researchers explored the issue using data from the Framingham Offspring cohort of the Framingham Heart Study. The cohort comprises 5,124 children and spouses of children of the original Framingham cohort. They have been examined clinically at regular intervals since 1971. The present study focused on 1,440 individuals who had five consecutive examinations during a 15-year period anytime between 1983 and 2001 and who had not been diagnosed with dementia at the time of the final blood pressure determination.
The 1,440 participants had a mean age of 69 at their fifth examination. Slightly more than half were female, 20% had been diagnosed with cardiovascular disease, and slightly less than 20% had been diagnosed with diabetes. Half were using antihypertensive medications.
During a mean eight-year follow-up period, 107 individuals developed dementia. Dementia was independently associated with mid-life hypertension (ie, blood pressure of 140/90 mm Hg or higher), with a stronger association for systolic hypertension (hazard ratio [HR], 1.57). Persistence of hypertension into late life, particularly systolic hypertension (HR, 1.96), was another independent risk factor for dementia.
Among individuals who did not have hypertension at mid-life, a decline in systolic blood pressure to less than 100/70 mm Hg in the ensuing years increased the risk of dementia (HR, 1.63).
The findings support the hypothesis of the U-shaped relationship between blood pressure and dementia, according to the researchers. “Our data also highlight the potential sustained cognitive benefits of lower mid-life blood pressure,” said Dr. McGrath.
The study was funded by the Framingham Heart Study, the National Institute on Aging, and the National Institute for Neurological Diseases and Stroke.
—Brian Hoyle
Suggested Reading
McDonald C, Pearce MS, Kerr SR, Newton JL. Blood pressure variability and cognitive decline in older people: a 5-year longitudinal study. J Hypertens. 2016 Sep 17 [Epub ahead of print].
BALTIMORE—The impact of blood pressure on the risk of dementia in late life follows a U-shaped curve in which elevated mid-life and late-life blood pressure, as well as late-life decline in blood pressure, all independently increase the risk of dementia, according to findings from a longitudinal study of the Framingham Offspring cohort of the Framingham Heart Study.
The findings highlight the benefits of establishing and maintaining lower blood pressure in mid-life for preventing or decreasing the risk of dementia, said Emer McGrath, MD, a neurology resident at Massachusetts General Hospital in Boston, at the 141st Annual Meeting of the American Neurological Association.
Hypertension has been linked to stroke and dementia and is the most important modifiable risk factor for both outcomes. Likewise, elevated blood pressure in mid-life (ie, ages 40 to 64) and late life (ie, age 65 or older) has been linked with a heightened risk of cognitive decline, as has low blood pressure in late life, but “the relationship between blood pressure in mid and late life and dementia [is] less clear, and the relationship of blood pressure changes from mid to late life is unknown,” said Dr. McGrath.
The researchers explored the issue using data from the Framingham Offspring cohort of the Framingham Heart Study. The cohort comprises 5,124 children and spouses of children of the original Framingham cohort. They have been examined clinically at regular intervals since 1971. The present study focused on 1,440 individuals who had five consecutive examinations during a 15-year period anytime between 1983 and 2001 and who had not been diagnosed with dementia at the time of the final blood pressure determination.
The 1,440 participants had a mean age of 69 at their fifth examination. Slightly more than half were female, 20% had been diagnosed with cardiovascular disease, and slightly less than 20% had been diagnosed with diabetes. Half were using antihypertensive medications.
During a mean eight-year follow-up period, 107 individuals developed dementia. Dementia was independently associated with mid-life hypertension (ie, blood pressure of 140/90 mm Hg or higher), with a stronger association for systolic hypertension (hazard ratio [HR], 1.57). Persistence of hypertension into late life, particularly systolic hypertension (HR, 1.96), was another independent risk factor for dementia.
Among individuals who did not have hypertension at mid-life, a decline in systolic blood pressure to less than 100/70 mm Hg in the ensuing years increased the risk of dementia (HR, 1.63).
The findings support the hypothesis of the U-shaped relationship between blood pressure and dementia, according to the researchers. “Our data also highlight the potential sustained cognitive benefits of lower mid-life blood pressure,” said Dr. McGrath.
The study was funded by the Framingham Heart Study, the National Institute on Aging, and the National Institute for Neurological Diseases and Stroke.
—Brian Hoyle
Suggested Reading
McDonald C, Pearce MS, Kerr SR, Newton JL. Blood pressure variability and cognitive decline in older people: a 5-year longitudinal study. J Hypertens. 2016 Sep 17 [Epub ahead of print].

Fear and hope: Helping LGBT youth cope with the 2016 election results
The day after the election, Time magazine reported an increased call volume to the Trevor Project, an organization that provides suicide counseling for LGBT youth.1 A colleague of mine who works closely with the Trevor Project told me that this was the second-highest call volume the organization has received since its inception.
Regardless of your political affiliation, we all can agree that this year’s election was divisive. Many minority groups, including the LGBT community, felt singled out. Although many of us have seen contentious elections in our lifetimes, teenagers, especially LGBT youth, are sensitive to this divisiveness.

Many LGBT youth who called the Trevor Project had expressed fear about the future. Whenever someone becomes suicidal, they have an overwhelming sense of hopelessness.2 Many perceive that the upcoming administration may be hostile to the LGBT community, and because many fear that this new administration may undo all the progress made in LGBT rights in the last 8 years, they have little hope for the future. Numerous reports of increased hate-crime incidents since the start of the election season last year may have exacerbated this feeling of hopelessness.3 This hopelessness may cause many to feel that the best way out is through suicide. Others feel that their sexual orientation or gender identity may be an additional burden to their family during this new era, and so to relieve them of this burden, they consider ending their own lives.4
For adults who have seen many administrations come and go, this may seem like hyperbole. But we have the advantage of living through various elections and administrations, knowing that they were not as catastrophic as others claimed. However, for many LGBT teens or young adults, this is probably their first election after reaching adolescence since Obama was elected in 2008. The Obama administration has been friendly to the LGBT community,5 and for LGBT youth, the upcoming Trump administration may be a substantial departure from this friendliness. In addition, people across the political spectrum have stoked fears among LGBT youth that the new administration will be devastating for the LGBT community. Adolescents, compared with adults, respond more strongly to the limbic system of the brain – the part of the brain involved in emotional processing, which includes fear.6 This fear will override any attempt by the prefrontal cortex – the part of the brain involved in cognitive processing6 – to put the results of this election within context and within perspective. In other words, it is easier for the adolescent brain to become much more despondent over a disappointing outcome.
What can providers do for LGBT youth who feel distressed over the outcome of the election? The approach is twofold. First, address the emotions emanating from the limbic system. Once this influence is dampened, engage the prefrontal cortex to process the emotions and address these fears in a more constructive way.
For LGBT youth who are actively suicidal, providers should first determine the risk for suicide (for example, determine the level of family support, access to lethal means of suicide, etc.) Then, depending on the risk, create a suicide safety plan that will help the teen or young adult cope with the distress. For more information on how to address suicidality among LGBT youth, please see my previous column (“It does get better... with your help: Preventing suicide,” October 2016, page 30).
Recognize and validate the fears of LGBT youth. Do not dismiss their fears as an overreaction. Because of the adolescent brain’s responsiveness to the limbic system, their fears and emotions are much more intense than are those of adults. Allow them to express how worried they are about the future. Remind them that you are their advocate and that your goal is to keep them safe. Remind your LGBT patients that people who have advocated for them did not disappear overnight because of the election. Some parents of my LGBT patients have pointed out that many LGBT youth feel safer when a nonfamily member advocates for them; therefore, it is essential to remind your LGBT patients about your role as their physician and their advocate.
Another way to support your LGBT patients during this stressful time is to help create a safe environment for them, especially at school. There are some concerns about an increase in antigay and antitrans harassment and bullying since the election.7 Schools are doing their best to respond appropriately to these incidents.8 Fortunately, many schools are responsive to physicians’ recommendations for preventing and addressing school bullying.9 For more information on how providers can address bullying of LGBT youth in school, please refer to my column on bullying (“Bullying,” May 2016, p.1).
Once you reduce the responsiveness of the adolescent brain to the limbic system, you then can focus on the prefrontal cortex to help adolescents engage and cope with their distress. Have them recall from their civics classes that the United States government has checks and balances and that one person does not have unilateral power. Remind the adolescent that administrations and governments do not last forever and that there is an opportunity to change administrations every 4 years.
One of the most powerful ways to engage the prefrontal cortex of the distressed adolescent is to provide the individual with opportunities to be an active member of the community. They can volunteer in many organizations that share their values and beliefs. These organizations do not need to be political, but they should provide some service to the community. This will remind the adolescents that they can have an impact on their own lives and in the lives of others. Volunteering in these organizations will give them a sense of purpose and create a stronger connection to their communities10 – both are antidotes to the intense feeling of despair and hopelessness.
The fear and concerns that LGBT youth have over the election results are intense and deserve attention. Their neurobiology and lack of experience make these fears much more powerful. Providers, parents, and advocates have the responsibility to address these fears, remind LGBT youth that they are their advocates, and remind LGBT youth of the ability to influence the outcomes of their own lives. Providing skills to cope with disappointing outcomes also will prepare LGBT youth for the challenges of adulthood and for the many elections to come.
Resources
AAP: Talking to your children about the election
HealthyChildren.org: How to support your child’s resilience in a time of crisis
Suicide Prevention Lifeline: Patient safety plan template
References
1. “Donald Trump Win Causes Spike in Crisis Support Line Calls,” Time magazine, Nov. 9, 2016.
2. Int Rev Psychiatry. 1992;4(2):177-84.
3. “U.S. Hate Crimes Surge 6%, Fueled by Attacks on Muslims,” the New York Times, Nov. 14, 2016.
4. Arch Suicide Res. 2015;19(3):385-400.
5. “The president of the United States shifted the mainstream in one interview,” Newsweek, May 13, 2012.
6. Neuropsychiatric Disease and Treatment. 2013;9:449-61.
7. “This is Trump’s America: LGBT community fears surge in hate crimes following reports of homophobic attacks,” Salon magazine, Nov. 13, 2016.
8. “School officials grapple with bullying, harassment after election,” Lansing State Journal, Nov. 13, 2016.
9. “Roles for pediatricians in bullying prevention and intervention,” StopBullying.gov, 2016.
10. Adv Psych Treatment. 2014;20(3):217-24.
Dr. Montano is an adolescent medicine fellow at Children’s Hospital of Pittsburgh of the University of Pittsburgh Medical Center and a postdoctoral fellow in the department of pediatrics the University of Pittsburgh. Email him at [email protected].
The day after the election, Time magazine reported an increased call volume to the Trevor Project, an organization that provides suicide counseling for LGBT youth.1 A colleague of mine who works closely with the Trevor Project told me that this was the second-highest call volume the organization has received since its inception.
Regardless of your political affiliation, we all can agree that this year’s election was divisive. Many minority groups, including the LGBT community, felt singled out. Although many of us have seen contentious elections in our lifetimes, teenagers, especially LGBT youth, are sensitive to this divisiveness.
Many LGBT youth who called the Trevor Project had expressed fear about the future. Whenever someone becomes suicidal, they have an overwhelming sense of hopelessness.2 Many perceive that the upcoming administration may be hostile to the LGBT community, and because many fear that this new administration may undo all the progress made in LGBT rights in the last 8 years, they have little hope for the future. Numerous reports of increased hate-crime incidents since the start of the election season last year may have exacerbated this feeling of hopelessness.3 This hopelessness may cause many to feel that the best way out is through suicide. Others feel that their sexual orientation or gender identity may be an additional burden to their family during this new era, and so to relieve them of this burden, they consider ending their own lives.4
For adults who have seen many administrations come and go, this may seem like hyperbole. But we have the advantage of living through various elections and administrations, knowing that they were not as catastrophic as others claimed. However, for many LGBT teens or young adults, this is probably their first election after reaching adolescence since Obama was elected in 2008. The Obama administration has been friendly to the LGBT community,5 and for LGBT youth, the upcoming Trump administration may be a substantial departure from this friendliness. In addition, people across the political spectrum have stoked fears among LGBT youth that the new administration will be devastating for the LGBT community. Adolescents, compared with adults, respond more strongly to the limbic system of the brain – the part of the brain involved in emotional processing, which includes fear.6 This fear will override any attempt by the prefrontal cortex – the part of the brain involved in cognitive processing6 – to put the results of this election within context and within perspective. In other words, it is easier for the adolescent brain to become much more despondent over a disappointing outcome.
What can providers do for LGBT youth who feel distressed over the outcome of the election? The approach is twofold. First, address the emotions emanating from the limbic system. Once this influence is dampened, engage the prefrontal cortex to process the emotions and address these fears in a more constructive way.
For LGBT youth who are actively suicidal, providers should first determine the risk for suicide (for example, determine the level of family support, access to lethal means of suicide, etc.) Then, depending on the risk, create a suicide safety plan that will help the teen or young adult cope with the distress. For more information on how to address suicidality among LGBT youth, please see my previous column (“It does get better... with your help: Preventing suicide,” October 2016, page 30).
Recognize and validate the fears of LGBT youth. Do not dismiss their fears as an overreaction. Because of the adolescent brain’s responsiveness to the limbic system, their fears and emotions are much more intense than are those of adults. Allow them to express how worried they are about the future. Remind them that you are their advocate and that your goal is to keep them safe. Remind your LGBT patients that people who have advocated for them did not disappear overnight because of the election. Some parents of my LGBT patients have pointed out that many LGBT youth feel safer when a nonfamily member advocates for them; therefore, it is essential to remind your LGBT patients about your role as their physician and their advocate.
Another way to support your LGBT patients during this stressful time is to help create a safe environment for them, especially at school. There are some concerns about an increase in antigay and antitrans harassment and bullying since the election.7 Schools are doing their best to respond appropriately to these incidents.8 Fortunately, many schools are responsive to physicians’ recommendations for preventing and addressing school bullying.9 For more information on how providers can address bullying of LGBT youth in school, please refer to my column on bullying (“Bullying,” May 2016, p.1).
Once you reduce the responsiveness of the adolescent brain to the limbic system, you then can focus on the prefrontal cortex to help adolescents engage and cope with their distress. Have them recall from their civics classes that the United States government has checks and balances and that one person does not have unilateral power. Remind the adolescent that administrations and governments do not last forever and that there is an opportunity to change administrations every 4 years.
One of the most powerful ways to engage the prefrontal cortex of the distressed adolescent is to provide the individual with opportunities to be an active member of the community. They can volunteer in many organizations that share their values and beliefs. These organizations do not need to be political, but they should provide some service to the community. This will remind the adolescents that they can have an impact on their own lives and in the lives of others. Volunteering in these organizations will give them a sense of purpose and create a stronger connection to their communities10 – both are antidotes to the intense feeling of despair and hopelessness.
The fear and concerns that LGBT youth have over the election results are intense and deserve attention. Their neurobiology and lack of experience make these fears much more powerful. Providers, parents, and advocates have the responsibility to address these fears, remind LGBT youth that they are their advocates, and remind LGBT youth of the ability to influence the outcomes of their own lives. Providing skills to cope with disappointing outcomes also will prepare LGBT youth for the challenges of adulthood and for the many elections to come.
Resources
AAP: Talking to your children about the election
HealthyChildren.org: How to support your child’s resilience in a time of crisis
Suicide Prevention Lifeline: Patient safety plan template
References
1. “Donald Trump Win Causes Spike in Crisis Support Line Calls,” Time magazine, Nov. 9, 2016.
2. Int Rev Psychiatry. 1992;4(2):177-84.
3. “U.S. Hate Crimes Surge 6%, Fueled by Attacks on Muslims,” the New York Times, Nov. 14, 2016.
4. Arch Suicide Res. 2015;19(3):385-400.
5. “The president of the United States shifted the mainstream in one interview,” Newsweek, May 13, 2012.
6. Neuropsychiatric Disease and Treatment. 2013;9:449-61.
7. “This is Trump’s America: LGBT community fears surge in hate crimes following reports of homophobic attacks,” Salon magazine, Nov. 13, 2016.
8. “School officials grapple with bullying, harassment after election,” Lansing State Journal, Nov. 13, 2016.
9. “Roles for pediatricians in bullying prevention and intervention,” StopBullying.gov, 2016.
10. Adv Psych Treatment. 2014;20(3):217-24.
Dr. Montano is an adolescent medicine fellow at Children’s Hospital of Pittsburgh of the University of Pittsburgh Medical Center and a postdoctoral fellow in the department of pediatrics the University of Pittsburgh. Email him at [email protected].
Opicinumab May Benefit Patients With Relapsing-Remitting MS
LONDON—Opicinumab, an investigational remyelinating agent, may promote clinical improvement in patients with multiple sclerosis (MS) who are receiving interferon beta-1a, according to research presented at the 32nd Congress of the European Committee for Treatment and Research in MS. The monoclonal antibody appears not to have a linear dose response; the high and low doses are associated with less improvement than the moderate doses.
In a phase IIb study, patients with relapsing-remitting MS, shorter disease duration, and less severe damage to the brain had a stronger response to opicinumab. “These biological markers are, we believe, valuable to inform all future steps,” said Diego Cadavid, MD, Senior Director at Biogen in Cambridge, Massachusetts. Opicinumab was generally well tolerated. The main adverse events were hypersensitivity reactions that occurred at a dose of 100 mg/kg.

Testing Effects on Pre-Existing Disability
Dr. Cadavid and colleagues conducted the SYNERGY trial to assess the efficacy of four doses of opicinumab versus placebo in patients with MS, pre-existing disability, and recent active relapse. Of the 418 patients enrolled, 80% had relapsing-remitting MS and 20% had secondary progressive MS. All participants were receiving intramuscular interferon beta-1a.
The investigators randomized patients to placebo or one of four doses of opicinumab (ie, 3 mg/kg, 10 mg/kg, 30 mg/kg, and 100 mg/kg). A total of 418 participants were randomized and dosed; 334 completed the study. The treatment period was 72 weeks, and a final safety and efficacy analysis occurred at 84 weeks. The primary end point was confirmed improvement on Expanded Disability Status Scale (EDSS) score, Timed 25-Foot Walk (T25FW), Nine-Hole Peg Test (9HPT), or 3-second Paced Auditory Serial Addition Test (PASAT-3).
The majority of participants were female, and mean age at baseline was approximately 40. Average disease duration was approximately 10 years. The median EDSS score was 3.5. Mean T25FW score was approximately 8 seconds. Mean 9HPT score was 25 seconds. Mean PASAT-3 score was 49. Randomization resulted in well-balanced treatment groups.
Moderate Doses Brought Most Benefit
Increasing doses of opicinumab did not lead to increases in the percentage of patients experiencing improvement of pre-existing disability. The estimated percentage of improvement responders was 52% for placebo, 51% for the 3-mg/kg dose, 66% for the 10-mg/kg dose, 69% for the 30-mg/kg dose, and 41% for the 100-mg/kg dose.
“We have observed an inverted-U dose response for the improvement of pre-existing disability with opicinumab,” said Dr. Cadavid. The odds ratios for improvement on the EDSS and the 9HPT were greatest for the 10-mg/kg dose. The odds ratio for improvement on the T25FW was greatest for the 3-mg dose. The odds ratio for improvement on PASAT-3 was greatest for the 30-mg/kg dose. The study, however, was not powered for any individual component.
Participants with better whole brain multispectral thermal imaging, greater whole brain radial diffusivity on diffusion tensor imaging (DTI RD), and greater normalized whole brain volume responded better to opicinumab. The strongest odds ratios in this univariable analysis were observed on the DTI RD at 10 mg/kg.
“Further work is clearly needed to understand what explains the behavior of opicinumab at the highest dose,” said Dr. Cadavid. “We have identified an appropriate patient population, a dose and exposure, and end points to inform the next study, and [we] are in the process of evaluating the optimized study design.”
—Erik Greb
LONDON—Opicinumab, an investigational remyelinating agent, may promote clinical improvement in patients with multiple sclerosis (MS) who are receiving interferon beta-1a, according to research presented at the 32nd Congress of the European Committee for Treatment and Research in MS. The monoclonal antibody appears not to have a linear dose response; the high and low doses are associated with less improvement than the moderate doses.
In a phase IIb study, patients with relapsing-remitting MS, shorter disease duration, and less severe damage to the brain had a stronger response to opicinumab. “These biological markers are, we believe, valuable to inform all future steps,” said Diego Cadavid, MD, Senior Director at Biogen in Cambridge, Massachusetts. Opicinumab was generally well tolerated. The main adverse events were hypersensitivity reactions that occurred at a dose of 100 mg/kg.
Testing Effects on Pre-Existing Disability
Dr. Cadavid and colleagues conducted the SYNERGY trial to assess the efficacy of four doses of opicinumab versus placebo in patients with MS, pre-existing disability, and recent active relapse. Of the 418 patients enrolled, 80% had relapsing-remitting MS and 20% had secondary progressive MS. All participants were receiving intramuscular interferon beta-1a.
The investigators randomized patients to placebo or one of four doses of opicinumab (ie, 3 mg/kg, 10 mg/kg, 30 mg/kg, and 100 mg/kg). A total of 418 participants were randomized and dosed; 334 completed the study. The treatment period was 72 weeks, and a final safety and efficacy analysis occurred at 84 weeks. The primary end point was confirmed improvement on Expanded Disability Status Scale (EDSS) score, Timed 25-Foot Walk (T25FW), Nine-Hole Peg Test (9HPT), or 3-second Paced Auditory Serial Addition Test (PASAT-3).
The majority of participants were female, and mean age at baseline was approximately 40. Average disease duration was approximately 10 years. The median EDSS score was 3.5. Mean T25FW score was approximately 8 seconds. Mean 9HPT score was 25 seconds. Mean PASAT-3 score was 49. Randomization resulted in well-balanced treatment groups.
Moderate Doses Brought Most Benefit
Increasing doses of opicinumab did not lead to increases in the percentage of patients experiencing improvement of pre-existing disability. The estimated percentage of improvement responders was 52% for placebo, 51% for the 3-mg/kg dose, 66% for the 10-mg/kg dose, 69% for the 30-mg/kg dose, and 41% for the 100-mg/kg dose.
“We have observed an inverted-U dose response for the improvement of pre-existing disability with opicinumab,” said Dr. Cadavid. The odds ratios for improvement on the EDSS and the 9HPT were greatest for the 10-mg/kg dose. The odds ratio for improvement on the T25FW was greatest for the 3-mg dose. The odds ratio for improvement on PASAT-3 was greatest for the 30-mg/kg dose. The study, however, was not powered for any individual component.
Participants with better whole brain multispectral thermal imaging, greater whole brain radial diffusivity on diffusion tensor imaging (DTI RD), and greater normalized whole brain volume responded better to opicinumab. The strongest odds ratios in this univariable analysis were observed on the DTI RD at 10 mg/kg.
“Further work is clearly needed to understand what explains the behavior of opicinumab at the highest dose,” said Dr. Cadavid. “We have identified an appropriate patient population, a dose and exposure, and end points to inform the next study, and [we] are in the process of evaluating the optimized study design.”
—Erik Greb

Postelection anxiety
Introduction
Since the election, many of the psychiatrists and psychologists in our office have reported a wave of anxiety among our patients. These fears have sometimes come from watching television commercials that highlight the faults of the other party or from watching the debates themselves. Children have reported fears of a nuclear war, of being taken away from family, or of being harmed or killed because of racial, religious, immigration, disability, gender, or sexual orientation status. In addition, some children are reporting remarks by peers.
Case summary
Discussion
How can we support our patients and their parents in responding to this surge in anxiety? First, we can reiterate the central importance of family. What the family models in values, behavior, and coping is central to how children respond to stress and winning and losing. Parents who manage their own emotions model how to cope with both victory and defeat, demonstrating appropriate celebration as well as grief and anger. Coping strategies for parents can include reaching out to supports from family and friends, using relaxation strategies, and then planning practical next steps to take.
Parents should reassure their children that they are there to keep their children safe. Modeling self-care and keeping the family routine as stable as possible is a powerful source of this sense of safety. As always, parents should think about what their children are consuming in the way of electronics.
In talking to children, listening is a first step. Help children find the words for what they are feeling. Consider your own words and the rhetoric of the election. Withering scorn of the other side has become increasingly common and not only damages our ability to understand other points of view and resolve conflicts but is also leading to intense anxiety in our children. The extreme nature of some of these words has led some children to believe that complete disaster is imminent should the other side win. Try to avoid using words that intensify fear. Acknowledge the feelings that children have, but provide reassurance of safety and hope.
Using the principles of cognitive-behavioral therapy, a therapist or parent can help a child think through how their thoughts are connected with feelings and behavior. When we are fearful, we often think that the absolute worst is going to happen, or we imagine that we definitely know the future. Sometimes an extreme thought can magnify feelings to the point that constructive behavior is blocked. A therapist might acknowledge feelings, but also help enlarge the child’s perspective. There are many reasons why people voted for or against candidates, and we don’t know everything about them just because of how they chose to vote. Discussing the three branches of government and the system of checks and balances that bring many people together to think over a problem can help a child see that the government is more than just one person. Parents or therapists can talk about protections in the Constitution such as freedom of the press, which allows us to be informed of what is going on. Parents might want to talk about the reality that we are one country, and that the vast majority of people on both sides share many, if not all, values.
Helping a child consider other perspectives isn’t saying that there are no reasons at all for anxiety, but that there are many possibilities for the future, and that a family can think together about what behaviors they want to engage in. There may be specific actions a child or family might want to take to have a voice in how the country moves forward.
Treatment plan for Jane
• Psychotherapy. Continue cognitive-behavioral therapy with a focus on identifying thoughts tied to anxiety that are overgeneralizations or exaggerations. Discuss alternative thoughts with greater perspective.
• Parents. Discuss supporting the child through listening, reassurance of safety, reestablishment of family routine, and family discussion about what actions to take to promote values.
• Health promotion. Discuss using exercise, pleasant activities, mindfulness, and minimizing of screen time as ways to cope with stress.
• Medications. There is no need to use medications for the child’s acute stress response.
Resources
1. Psychological First Aid: Field Operations Manual , 2nd ed. (National Child Traumatic Stress Network, National Center for PTSD, 2006).
2. Cognitive Behavioral Therapy for Anxious Children: Therapist Manual, 3rd edition. (Ardmore, Pa.: Workbook Publishing, 2006).
Dr. Hall is assistant professor of psychiatry and pediatrics at the University of Vermont, Burlington. She said she had no relevant financial disclosures.
An Overview of the History of Orthopedic Surgery
The modern term orthopedics stems from the older word orthopedia, which was the title of a book published in 1741 by Nicholas Andry, a professor of medicine at the University of Paris.1 The term orthopedia is a composite of 2 Greek words: orthos, meaning “straight and free from deformity,” and paidios, meaning “child.” Together, orthopedics literally means straight child, suggesting the importance of pediatric injuries and deformities in the development of this field. Interestingly, Andry’s book also depicted a crooked young tree attached to a straight and strong staff, which has become the universal symbol of orthopedic surgery and underscores the focus on correcting deformities in the young (Figure).1 
Orthopedic surgery is a rapidly advancing medical field with several recent advances noted within orthopedic subspecialties,2-4 basic science,5 and clinical research.6 It is important to recognize the role of history with regards to innovation and research, especially for young trainees and medical students interested in a particular medical specialty. More specifically, it is important to understand the successes and failures of the past in order to advance research and practice, and ultimately improve patient care and outcomes.
In the recent literature, there is no concise yet comprehensive article focusing on the history of orthopedic surgery. The goal of this review is to provide an overview of the history and development of orthopedic surgery from ancient practices to the modern era.
Ancient Orthopedics
While the evidence is limited, the practice of orthopedics dates back to the primitive man.7 Fossil evidence suggests that the orthopedic pathology of today, such as fractures and traumatic amputations, existed in primitive times.8 The union of fractures in fair alignment has also been observed, which emphasizes the efficacy of nonoperative orthopedics and suggests the early use of splints and rehabilitation practices.8,9 Since procedures such as trepanation and crude amputations occurred during the New Stone Age, it is feasible that sophisticated techniques had also been developed for the treatment of injuries.7-9 However, evidence continues to remain limited.7
Later civilizations also developed creative ways to manage orthopedic injuries. For example, the Shoshone Indians, who were known to exist around 700-2000 BCE, made a splint of fresh rawhide that had been soaked in water.9,10 Similarly, some South Australian tribes made splints of clay, which when dried were as good as plaster of Paris.9 Furthermore, bone-setting or reductions was practiced as a profession in many tribes, underscoring the importance of orthopedic injuries in early civilizations.8,9
Ancient Egypt
The ancient Egyptians seemed to have carried on the practices of splinting. For example, 2 splinted specimens were discovered during the Hearst Egyptian Expedition in 1903.7 More specifically, these specimens included a femur and forearm and dated to approximately 300 BCE.7 Other examples of splints made of bamboo and reed padded with linen have been found on mummies as well.8 Similarly, crutches were also used by this civilization, as depicted on a carving made on an Egyptian tomb in 2830 BCE.8
One of the earliest and most significant documents on medicine was discovered in 1862, known as the Edwin Smith papyrus. This document is thought to have been composed by Imhotep, a prominent Egyptian physician, astrologer, architect, and politician, and it specifically categorizes diseases and treatments. Many scholars recognize this medical document as the oldest surgical textbook.11,12 With regards to orthopedic conditions, this document describes the reduction of a dislocated mandible, signs of spinal or vertebral injuries, description of torticollis, and the treatment of fractures such as clavicle fractures.8 This document also discusses ryt, which refers to the purulent discharge from osteomyelitis.8 The following is an excerpt from this ancient document:9
“Instructions on erring a break in his upper arm…Thou shouldst spread out with his two shoulders in order to stretch apart his upper arm until that break falls into its place. Thou shouldst make for him two splints of linen, and thou shouldst apply for him one of them both on the inside of his arm, and the other of them both on the underside of his arm.”
This account illustrates the methodical and meticulous nature of this textbook, and it highlights some of the essentials of medical practice from diagnosis to medical decision-making to treatment.
There are various other contributions to the field of medicine from the Far East; however, many of these pertain to the fields of plastic surgery and general surgery.9
Greeks and Romans
The Greeks are considered to be the first to systematically employ the scientific approach to medicine.8 In the period between 430 BCE to 330 BCE, the Corpus Hippocrates was compiled, which is a Greek text on medicine. It is named for Hippocrates (460 BCE-370 BCE), the father of medicine, and it contains text that applies specifically to the field of orthopedic surgery. For example, this text discuses shoulder dislocations and describes various reduction maneuvers. Hippocrates had a keen understanding of the principles of traction and countertraction, especially as it pertains to the musculoskeletal system.8 In fact, the Hippocratic method is still used for reducing anterior shoulder dislocations, and its description can be found in several modern orthopedic texts, including recent articles.13 The Corpus Hippocrates also describes the correction of clubfoot deformity, and the treatment of infected open fractures with pitch cerate and wine compresses.8
Hippocrates also described the treatment of fractures, the principles of traction, and the implications of malunions. For example, Hippocrates wrote, “For the arm, when shortened, might be concealed and the mistake will not be great, but a shortened thigh bone will leave a man maimed.”1 In addition, spinal deformities were recognized by the Greeks, and Hippocrates devised an extension bench for the correction of such deformities.1 From their contributions to anatomy and surgical practice, the Greeks have made significant contributions to the field of surgery.9
During the Roman period, another Greek surgeon by the name of Galen described the musculoskeletal and nervous systems. He served as a gladiatorial surgeon in Rome, and today, he is considered to be the father of sports medicine.8 He is also credited with coining the terms scoliosis, kyphosis, and lordosis to denote the spinal deformities that were first described by Hippocrates.1 In the Roman period, amputations were also performed, and primitive prostheses were developed.9
The Middle Ages
There was relatively little progress in the study of medicine for a thousand years after the fall of the Roman Empire.9 This stagnation was predominantly due to the early Christian Church inhibiting freedom of thought and observation, as well as prohibiting human dissection and the study of anatomy. The first medical school in Europe was established in Salerno, Italy, during the ninth century. This school provided primarily pedantic teaching to its students and perpetuated the theories of the elements and humors. Later on, the University of Bologna became one of the first academic institutions to offer hands-on surgical training.9 One of the most famous surgeons of the Middle Ages was Guy de Chuauliac, who studied at Montpellier and Bologna. He was a leader in the ethical principles of surgery as well as the practice of surgery, and wrote the following with regards to femur fractures:9
“After the application of splints, I attach to the foot a mass of lead as a weight, taking care to pass the cord which supports the weight over a small pulley in such a manner that it shall pull on the leg in a horizontal direction.”
This description is strikingly similar to the modern-day nonoperative management of femur fractures, and underscores the importance of traction, which as mentioned above, was first described by Hippocrates.
Eventually, medicine began to separate from the Church, most likely due to an increase in the complexity of medical theories, the rise of secular universities, and an increase in medical knowledge from Eastern and Middle-Eastern groups.9
The Renaissance and the Foundations of Modern Orthopedics
Until the 16th century, the majority of medical theories were heavily influenced by the work of Hippocrates.8 The scientific study of anatomy gained prominence during this time, especially due to the work done by great artists, such as Leonardo Di Vinci.9 The Table 
After a period of rapid expansion of the field of orthopedics, and following the Renaissance, many hospitals were built focusing on the sick and disabled, which solidified orthopedics’ position as a major medical specialty.1 For example, in 1863, James Knight founded the Hospital for the Ruptured and Crippled in New York City. This hospital became the oldest orthopedic hospital in the United States, and it later became known as the Hospital for Special Surgery.14,15 Several additional orthopedic institutions were formed, including the New York Orthopedic Dispensary in 1886 and Hospital for Deformities and Joint Diseases in 1917. Orthopedic surgery residency programs also began to be developed in the late 1800s.14 More specifically, Virgil Gibney at Hospital for the Ruptured and Crippled began the first orthopedic training program in the United States in 1888. Young doctors in this program trained for 1 year as junior assistant, senior assistant, and house surgeon, and began to be known as resident doctors.14
The Modern Era
In the 20th century, rapid development continued to better control infections as well as develop and introduce novel technology. For example, the invention of x-ray in 1895 by Wilhelm Conrad Röntgen improved our ability to diagnose and manage orthopedic conditions ranging from fractures to avascular necrosis of the femoral head to osteoarthritis.8,14 Spinal surgery also developed rapidly with Russell Hibbs describing a technique for spinal fusion at the New York Orthopedic Hospital.8 Similarly, the World Wars served as a catalyst in the development of the subspecialty of orthopedic trauma, with increasing attention placed on open wounds and proficiency with amputations, internal fixation, and wound care. In 1942, Austin Moore performed the first metal hip arthroplasty, and the field of joint replacement was subsequently advanced by the work of Sir John Charnley in the 1960s.8
Conclusion
Despite its relatively recent specialization, orthopedic surgery has a rich history rooted in ancient practices dating back to the primitive man. Over time, there has been significant development in the field in terms of surgical and nonsurgical treatment of orthopedic pathology and disease. Various cultures have played an instrumental role in developing this field, and it is remarkable to see that several practices have persisted since the time of these ancient civilizations. During the Renaissance, there was a considerable emphasis placed on pediatric deformity, but orthopedic surgeons have now branched out to subspecialty practice ranging from orthopedic trauma to joint replacement to oncology.1 For students of medicine and orthopedics, it is important to learn about the origins of this field and to appreciate its gradual development. Orthopedic surgery is a diverse and fascinating field that will most likely continue to develop with increased subspecialization and improved research at the molecular and population level. With a growing emphasis placed on outcomes and healthcare cost by today’s society, it will be fascinating to see how this field continues to evolve in the future.
Am J Orthop. 2016;45(7):E434-E438. Copyright Frontline Medical Communications Inc. 2016. All rights reserved.
1. Ponseti IV. History of orthopedic surgery. Iowa Orthop J. 1991;11:59-64.
2. Ninomiya JT, Dean JC, Incavo SJ. What’s new in hip replacement. J Bone Joint Surg Am. 2015;97(18):1543-1551.
3. Sabharwal S, Nelson SC, Sontich JK. What’s new in limb lengthening and deformity correction. J Bone Joint Surg Am. 2015;97(16):1375-1384.
4. Ricci WM, Black JC, McAndrew CM, Gardner MJ. What’s new in orthopedic trauma. J Bone Joint Surg Am. 2015;97(14):1200-1207.
5. Rodeo SA, Sugiguchi F, Fortier LA, Cunningham ME, Maher S. What’s new in orthopedic research. J Bone Joint Surg Am. 2014;96(23):2015-2019.
6. Pugley AJ, Martin CT, Harwood J, Ong KL, Bozic KJ, Callaghan JJ. Database and registry research in orthopedic surgery. Part 1: Claims-based data. J Bone Joint Surg Am. 2015;97(15):1278-1287.
7. Colton CL. The history of fracture treatment. In: Browner BD, Jupiter JB, Levine AM, Trafton PG, Krettek C, eds. Skeletal Trauma: Basic Science, Management, and Reconstruction. 4th ed. Philadelphia, PA: Saunders Elsevier; 2009:3-32.
8. Brakoulias,V. History of orthopaedics. WorldOrtho Web site. http://pioa.net/documents/Historyoforthopaedics.pdf. Accessed October 6, 2016.
9. Bishop WJ. The Early History of Surgery. New York, NY: Barnes & Noble Books; 1995.
10. Watson T. Wyoming site reveals more prehistoric mountain villages. USA Today. October 20, 2013. http://www.usatoday.com/story/news/nation/2013/10/20/wyoming-prehistoric-villages/2965263. Accessed October 6, 2016.
11. Minagar A, Ragheb J, Kelley RE. The Edwin Smith surgical papyrus: description and analysis of the earliest case of aphasia. J Med Biogr. 2003;11(2):114-117.
12. Atta HM. Edwin Smith Surgical Papyrus: the oldest known surgical treatise. Am Surg. 1999;65(12):1190-1192.
13. Sayegh FE, Kenanidis EI, Papavasiliou KA, Potoupnis ME, Kirkos JM, Kapetanos GA. Reduction of acute anterior dislocations: a prospective randomized study comparing a new technique with the Hippocratic and Kocher methods. J Bone Joint Surg Am. 2009;91(12):2775-2782.
14. Levine DB. Anatomy of a Hospital: Hospital for Special Surgery 1863-2013. New York, NY: Print Mattes; 2013.
15. Wilson PD, Levine DB. Hospital for special surgery. A brief review of its development and current position. Clin Orthop Relat Res. 2000;(374):90-106.
The modern term orthopedics stems from the older word orthopedia, which was the title of a book published in 1741 by Nicholas Andry, a professor of medicine at the University of Paris.1 The term orthopedia is a composite of 2 Greek words: orthos, meaning “straight and free from deformity,” and paidios, meaning “child.” Together, orthopedics literally means straight child, suggesting the importance of pediatric injuries and deformities in the development of this field. Interestingly, Andry’s book also depicted a crooked young tree attached to a straight and strong staff, which has become the universal symbol of orthopedic surgery and underscores the focus on correcting deformities in the young (Figure).1
Orthopedic surgery is a rapidly advancing medical field with several recent advances noted within orthopedic subspecialties,2-4 basic science,5 and clinical research.6 It is important to recognize the role of history with regards to innovation and research, especially for young trainees and medical students interested in a particular medical specialty. More specifically, it is important to understand the successes and failures of the past in order to advance research and practice, and ultimately improve patient care and outcomes.
In the recent literature, there is no concise yet comprehensive article focusing on the history of orthopedic surgery. The goal of this review is to provide an overview of the history and development of orthopedic surgery from ancient practices to the modern era.
Ancient Orthopedics
While the evidence is limited, the practice of orthopedics dates back to the primitive man.7 Fossil evidence suggests that the orthopedic pathology of today, such as fractures and traumatic amputations, existed in primitive times.8 The union of fractures in fair alignment has also been observed, which emphasizes the efficacy of nonoperative orthopedics and suggests the early use of splints and rehabilitation practices.8,9 Since procedures such as trepanation and crude amputations occurred during the New Stone Age, it is feasible that sophisticated techniques had also been developed for the treatment of injuries.7-9 However, evidence continues to remain limited.7
Later civilizations also developed creative ways to manage orthopedic injuries. For example, the Shoshone Indians, who were known to exist around 700-2000 BCE, made a splint of fresh rawhide that had been soaked in water.9,10 Similarly, some South Australian tribes made splints of clay, which when dried were as good as plaster of Paris.9 Furthermore, bone-setting or reductions was practiced as a profession in many tribes, underscoring the importance of orthopedic injuries in early civilizations.8,9
Ancient Egypt
The ancient Egyptians seemed to have carried on the practices of splinting. For example, 2 splinted specimens were discovered during the Hearst Egyptian Expedition in 1903.7 More specifically, these specimens included a femur and forearm and dated to approximately 300 BCE.7 Other examples of splints made of bamboo and reed padded with linen have been found on mummies as well.8 Similarly, crutches were also used by this civilization, as depicted on a carving made on an Egyptian tomb in 2830 BCE.8
One of the earliest and most significant documents on medicine was discovered in 1862, known as the Edwin Smith papyrus. This document is thought to have been composed by Imhotep, a prominent Egyptian physician, astrologer, architect, and politician, and it specifically categorizes diseases and treatments. Many scholars recognize this medical document as the oldest surgical textbook.11,12 With regards to orthopedic conditions, this document describes the reduction of a dislocated mandible, signs of spinal or vertebral injuries, description of torticollis, and the treatment of fractures such as clavicle fractures.8 This document also discusses ryt, which refers to the purulent discharge from osteomyelitis.8 The following is an excerpt from this ancient document:9
“Instructions on erring a break in his upper arm…Thou shouldst spread out with his two shoulders in order to stretch apart his upper arm until that break falls into its place. Thou shouldst make for him two splints of linen, and thou shouldst apply for him one of them both on the inside of his arm, and the other of them both on the underside of his arm.”
This account illustrates the methodical and meticulous nature of this textbook, and it highlights some of the essentials of medical practice from diagnosis to medical decision-making to treatment.
There are various other contributions to the field of medicine from the Far East; however, many of these pertain to the fields of plastic surgery and general surgery.9
Greeks and Romans
The Greeks are considered to be the first to systematically employ the scientific approach to medicine.8 In the period between 430 BCE to 330 BCE, the Corpus Hippocrates was compiled, which is a Greek text on medicine. It is named for Hippocrates (460 BCE-370 BCE), the father of medicine, and it contains text that applies specifically to the field of orthopedic surgery. For example, this text discuses shoulder dislocations and describes various reduction maneuvers. Hippocrates had a keen understanding of the principles of traction and countertraction, especially as it pertains to the musculoskeletal system.8 In fact, the Hippocratic method is still used for reducing anterior shoulder dislocations, and its description can be found in several modern orthopedic texts, including recent articles.13 The Corpus Hippocrates also describes the correction of clubfoot deformity, and the treatment of infected open fractures with pitch cerate and wine compresses.8
Hippocrates also described the treatment of fractures, the principles of traction, and the implications of malunions. For example, Hippocrates wrote, “For the arm, when shortened, might be concealed and the mistake will not be great, but a shortened thigh bone will leave a man maimed.”1 In addition, spinal deformities were recognized by the Greeks, and Hippocrates devised an extension bench for the correction of such deformities.1 From their contributions to anatomy and surgical practice, the Greeks have made significant contributions to the field of surgery.9
During the Roman period, another Greek surgeon by the name of Galen described the musculoskeletal and nervous systems. He served as a gladiatorial surgeon in Rome, and today, he is considered to be the father of sports medicine.8 He is also credited with coining the terms scoliosis, kyphosis, and lordosis to denote the spinal deformities that were first described by Hippocrates.1 In the Roman period, amputations were also performed, and primitive prostheses were developed.9
The Middle Ages
There was relatively little progress in the study of medicine for a thousand years after the fall of the Roman Empire.9 This stagnation was predominantly due to the early Christian Church inhibiting freedom of thought and observation, as well as prohibiting human dissection and the study of anatomy. The first medical school in Europe was established in Salerno, Italy, during the ninth century. This school provided primarily pedantic teaching to its students and perpetuated the theories of the elements and humors. Later on, the University of Bologna became one of the first academic institutions to offer hands-on surgical training.9 One of the most famous surgeons of the Middle Ages was Guy de Chuauliac, who studied at Montpellier and Bologna. He was a leader in the ethical principles of surgery as well as the practice of surgery, and wrote the following with regards to femur fractures:9
“After the application of splints, I attach to the foot a mass of lead as a weight, taking care to pass the cord which supports the weight over a small pulley in such a manner that it shall pull on the leg in a horizontal direction.”
This description is strikingly similar to the modern-day nonoperative management of femur fractures, and underscores the importance of traction, which as mentioned above, was first described by Hippocrates.
Eventually, medicine began to separate from the Church, most likely due to an increase in the complexity of medical theories, the rise of secular universities, and an increase in medical knowledge from Eastern and Middle-Eastern groups.9
The Renaissance and the Foundations of Modern Orthopedics
Until the 16th century, the majority of medical theories were heavily influenced by the work of Hippocrates.8 The scientific study of anatomy gained prominence during this time, especially due to the work done by great artists, such as Leonardo Di Vinci.9 The Table
After a period of rapid expansion of the field of orthopedics, and following the Renaissance, many hospitals were built focusing on the sick and disabled, which solidified orthopedics’ position as a major medical specialty.1 For example, in 1863, James Knight founded the Hospital for the Ruptured and Crippled in New York City. This hospital became the oldest orthopedic hospital in the United States, and it later became known as the Hospital for Special Surgery.14,15 Several additional orthopedic institutions were formed, including the New York Orthopedic Dispensary in 1886 and Hospital for Deformities and Joint Diseases in 1917. Orthopedic surgery residency programs also began to be developed in the late 1800s.14 More specifically, Virgil Gibney at Hospital for the Ruptured and Crippled began the first orthopedic training program in the United States in 1888. Young doctors in this program trained for 1 year as junior assistant, senior assistant, and house surgeon, and began to be known as resident doctors.14
The Modern Era
In the 20th century, rapid development continued to better control infections as well as develop and introduce novel technology. For example, the invention of x-ray in 1895 by Wilhelm Conrad Röntgen improved our ability to diagnose and manage orthopedic conditions ranging from fractures to avascular necrosis of the femoral head to osteoarthritis.8,14 Spinal surgery also developed rapidly with Russell Hibbs describing a technique for spinal fusion at the New York Orthopedic Hospital.8 Similarly, the World Wars served as a catalyst in the development of the subspecialty of orthopedic trauma, with increasing attention placed on open wounds and proficiency with amputations, internal fixation, and wound care. In 1942, Austin Moore performed the first metal hip arthroplasty, and the field of joint replacement was subsequently advanced by the work of Sir John Charnley in the 1960s.8
Conclusion
Despite its relatively recent specialization, orthopedic surgery has a rich history rooted in ancient practices dating back to the primitive man. Over time, there has been significant development in the field in terms of surgical and nonsurgical treatment of orthopedic pathology and disease. Various cultures have played an instrumental role in developing this field, and it is remarkable to see that several practices have persisted since the time of these ancient civilizations. During the Renaissance, there was a considerable emphasis placed on pediatric deformity, but orthopedic surgeons have now branched out to subspecialty practice ranging from orthopedic trauma to joint replacement to oncology.1 For students of medicine and orthopedics, it is important to learn about the origins of this field and to appreciate its gradual development. Orthopedic surgery is a diverse and fascinating field that will most likely continue to develop with increased subspecialization and improved research at the molecular and population level. With a growing emphasis placed on outcomes and healthcare cost by today’s society, it will be fascinating to see how this field continues to evolve in the future.
Am J Orthop. 2016;45(7):E434-E438. Copyright Frontline Medical Communications Inc. 2016. All rights reserved.
1. Ponseti IV. History of orthopedic surgery. Iowa Orthop J. 1991;11:59-64.
2. Ninomiya JT, Dean JC, Incavo SJ. What’s new in hip replacement. J Bone Joint Surg Am. 2015;97(18):1543-1551.
3. Sabharwal S, Nelson SC, Sontich JK. What’s new in limb lengthening and deformity correction. J Bone Joint Surg Am. 2015;97(16):1375-1384.
4. Ricci WM, Black JC, McAndrew CM, Gardner MJ. What’s new in orthopedic trauma. J Bone Joint Surg Am. 2015;97(14):1200-1207.
5. Rodeo SA, Sugiguchi F, Fortier LA, Cunningham ME, Maher S. What’s new in orthopedic research. J Bone Joint Surg Am. 2014;96(23):2015-2019.
6. Pugley AJ, Martin CT, Harwood J, Ong KL, Bozic KJ, Callaghan JJ. Database and registry research in orthopedic surgery. Part 1: Claims-based data. J Bone Joint Surg Am. 2015;97(15):1278-1287.
7. Colton CL. The history of fracture treatment. In: Browner BD, Jupiter JB, Levine AM, Trafton PG, Krettek C, eds. Skeletal Trauma: Basic Science, Management, and Reconstruction. 4th ed. Philadelphia, PA: Saunders Elsevier; 2009:3-32.
8. Brakoulias,V. History of orthopaedics. WorldOrtho Web site. http://pioa.net/documents/Historyoforthopaedics.pdf. Accessed October 6, 2016.
9. Bishop WJ. The Early History of Surgery. New York, NY: Barnes & Noble Books; 1995.
10. Watson T. Wyoming site reveals more prehistoric mountain villages. USA Today. October 20, 2013. http://www.usatoday.com/story/news/nation/2013/10/20/wyoming-prehistoric-villages/2965263. Accessed October 6, 2016.
11. Minagar A, Ragheb J, Kelley RE. The Edwin Smith surgical papyrus: description and analysis of the earliest case of aphasia. J Med Biogr. 2003;11(2):114-117.
12. Atta HM. Edwin Smith Surgical Papyrus: the oldest known surgical treatise. Am Surg. 1999;65(12):1190-1192.
13. Sayegh FE, Kenanidis EI, Papavasiliou KA, Potoupnis ME, Kirkos JM, Kapetanos GA. Reduction of acute anterior dislocations: a prospective randomized study comparing a new technique with the Hippocratic and Kocher methods. J Bone Joint Surg Am. 2009;91(12):2775-2782.
14. Levine DB. Anatomy of a Hospital: Hospital for Special Surgery 1863-2013. New York, NY: Print Mattes; 2013.
15. Wilson PD, Levine DB. Hospital for special surgery. A brief review of its development and current position. Clin Orthop Relat Res. 2000;(374):90-106.
The $400 generic
Oren is 11. I often see him around the neighborhood.
The other day I gave his father a lift. “Oren had a rash on his face,” said Ben, slipping into the passenger seat. “The pediatrician said she thought it was eczema, but she gave him an acne medicine.”
I raised my eyebrows, but said nothing.
“How much did it cost?” I asked.
“$400.”
“$400!” I couldn’t quite stifle my shock. “What was in the cream?” I asked.
“Here it is,” he said. “I took a picture of the tube on my phone.”
He showed me a snapshot of a tube of clindamycin/benzoyl peroxide.
Although I try not to meddle in the medical issues of friends, I decided to make a small exception in this case. “Next time someone prescribes an expensive skin cream,” I said, “let me know. Maybe I can help you find a more affordable alternative.”
What skin problem did Oren have? I have no idea. I see his face enough to know that he has no acne at all. Nor would acne go away in 2 days.
On the other hand, if he did have a flare of eczema – I’ve never noticed that on him either – acne medicine would aggravate it, if anything.
Besides those questions, I have another one: Regardless of what she thought the diagnosis was, why on earth did Oren’s pediatrician feel compelled to prescribe a $400 generic? I say “compelled” because she told Ben straight out that the cream was going to cost a lot. But she just had to prescribe it because her experience told her it worked.
What experience did she have, exactly? What else had she tried that didn’t work? And what did she mean by “work”?
Ben’s and Oren’s experience is just a small, unnoticed incident of no general interest. It will spur no magazine exposés, incite no lawsuits, launch no professional or political inquiries.
• Oren’s pediatrician will go on prescribing a hideously priced cream intended to treat who-knows-what. Nobody will suggest to her that she might at least consider doing otherwise.
• Pharmacy benefit managers will not crack down on either pediatrician or cream. They have bigger fish to fry, like biologics that cost $50K per year.
• Health care administrators will take no notice. They will instead think up more creative and onerous disincentives to restrain providers from prescribing anything expensive. Whether they will also figure out how to keep monopolistic generic drug manufacturers from jacking up prices into the stratosphere is something else.
• Medical educators will strengthen their focus on sophisticated science (Genomics! Precision Medicine!), while doing a wholly inadequate job of passing on simple lessons that might help primary clinicians do a better job of managing everyday skin problems. Just yesterday, my colleague and I saw two patients who had been taking doxycycline for years with no clinical benefit, three kids with eczema who had used a succession of antifungal creams for over 4 months, one woman who had been dousing herself repeatedly with permethrin – to no avail – because her mites lived exclusively in her brain and those of her prescribers, and a partridge with alopecia in a pear tree. (OK, not the last one). All that in just 1 day!
• Simple common sense will stay elusive. Most rashes are really not rocket science.
I apologize, dear colleagues, for being so cranky. Much jollier to be upbeat and amusing. It’s just that, after 40 years in the business, observing the same skull-exploding clinical behaviors gets a little old, along with the observer.
Oren and Ben are fine, though. Oren’s face is as clear as ever. (It’s genetic – his mom has great skin). Even Ben isn’t disturbed. First of all, the rash went away. Second, he has an annual $2,000 drug cost deductible, “so I’d have to spend it anyway.”
“Look, Ben,” I told him, “if you need help exhausting your deductible, I’ll be happy to send you a couple of bills. No problem.”
He smiled. I guess he doesn’t really need my help on that.
Dr. Rockoff practices dermatology in Brookline, Mass, and is a longtime contributor to Dermatology News. He serves on the clinical faculty at Tufts University, Boston, and has taught senior medical students and other trainees for 30 years. His new book “Act Like a Doctor, Think Like a Patient” is now available at amazon.com and barnesandnoble.com. This is his second book. Write to him at [email protected].