User login
Is the General Population in French Farming Regions at Greater Risk for Parkinson’s Disease?
BERLIN—Populations living in French rural regions that require higher levels of pesticide may be at a greater risk of Parkinson’s disease, according to a study presented at the 20th International Congress of Parkinson’s Disease and Movement Disorders.
Evidence of a link between pesticides and incidence of Parkinson’s disease through occupational exposure already exists. This study, led by Sofiane Kab, a PhD student in epidemiology at the French National Institute of Health and Medical Research in Villejuif, France, and a team of French researchers investigated whether those living in rural French regions with more crops would be at a higher risk of developing Parkinson’s disease through non-occupational exposure.
The study identified cases of Parkinson’s disease from French National Health Insurance databases from 2010 to 2012 and examined the association between rates of Parkinson’s disease and types of farming. The researchers found higher rates of Parkinson’s disease in rural areas of France, particularly in areas with many vineyards, which require the most intense use of insecticides and fungicides. Ultimately, the data collected suggest that those who live in farming regions requiring high levels of pesticide are at a greater risk of Parkinson’s disease.

Sofiane Kab
Caroline Tanner, MD, PhD, Professor of Neurology at the University of California San Francisco and Director of the Parkinson’s Disease Research Education and Clinical Center at the San Francisco Veteran’s Affairs Medical Center, said, “This current report is the largest study assessing newly diagnosed Parkinson’s disease and inferred pesticide exposures. Because the study is derived from the national health insurance records of France, and investigates newly diagnosed (incident) cases, bias is minimized, providing an accurate picture for the entire population. Rural residence alone increases the risk of Parkinson’s disease, suggesting that ambient pesticide exposure is a risk factor. Information on smoking, a recognized risk modifier, was also included, adding to the strength of the study design.” Dr. Tanner added, “The current report strengthens the evidence associating Parkinson’s disease and rural residence, and, by inference, pesticide exposure. More detailed investigation in this large population will be critical, and would be expected to identify specific causative pesticides, and, in turn, underlying pathophysiologic mechanisms. Ultimately, this work may identify ways to reduce Parkinson’s disease incidence.”
BERLIN—Populations living in French rural regions that require higher levels of pesticide may be at a greater risk of Parkinson’s disease, according to a study presented at the 20th International Congress of Parkinson’s Disease and Movement Disorders.
Evidence of a link between pesticides and incidence of Parkinson’s disease through occupational exposure already exists. This study, led by Sofiane Kab, a PhD student in epidemiology at the French National Institute of Health and Medical Research in Villejuif, France, and a team of French researchers investigated whether those living in rural French regions with more crops would be at a higher risk of developing Parkinson’s disease through non-occupational exposure.
The study identified cases of Parkinson’s disease from French National Health Insurance databases from 2010 to 2012 and examined the association between rates of Parkinson’s disease and types of farming. The researchers found higher rates of Parkinson’s disease in rural areas of France, particularly in areas with many vineyards, which require the most intense use of insecticides and fungicides. Ultimately, the data collected suggest that those who live in farming regions requiring high levels of pesticide are at a greater risk of Parkinson’s disease.
Sofiane Kab
Caroline Tanner, MD, PhD, Professor of Neurology at the University of California San Francisco and Director of the Parkinson’s Disease Research Education and Clinical Center at the San Francisco Veteran’s Affairs Medical Center, said, “This current report is the largest study assessing newly diagnosed Parkinson’s disease and inferred pesticide exposures. Because the study is derived from the national health insurance records of France, and investigates newly diagnosed (incident) cases, bias is minimized, providing an accurate picture for the entire population. Rural residence alone increases the risk of Parkinson’s disease, suggesting that ambient pesticide exposure is a risk factor. Information on smoking, a recognized risk modifier, was also included, adding to the strength of the study design.” Dr. Tanner added, “The current report strengthens the evidence associating Parkinson’s disease and rural residence, and, by inference, pesticide exposure. More detailed investigation in this large population will be critical, and would be expected to identify specific causative pesticides, and, in turn, underlying pathophysiologic mechanisms. Ultimately, this work may identify ways to reduce Parkinson’s disease incidence.”

Minimalist TAVR without on-site surgery under study
PARIS – The buzzword in transcatheter aortic valve replacement today is “minimalist.” The search is on for ways in which to safely simplify the procedure to reduce the current unsustainably high cost and improve the patient experience.
Among the elements typically involved in minimalist TAVR are performance of the procedure in the cardiac catheterization laboratory via transfemoral access rather than in the costlier operating room, use of conscious sedation rather than general anesthesia, transthoracic echocardiographic guidance, no Swan-Ganz catheter, and no ICU stay for most patients. But these are tepid measures compared with what’s under study in Germany.
The German health care system is engaged in a study of what has to be the ultimate in minimalist TAVR: doing it in hospitals without on-site cardiac surgery. And the short-term results in more than 1,300 German patients treated in such a setting look every bit as good as in patients whose procedure took place in hospitals more conventionally equipped with both cardiology and cardiothoracic surgery departments, Holger Eggebrecht, MD, reported at the annual congress of the European Association of Percutaneous Cardiovascular Interventions.

“Lack of a cardiac surgery department on site should not be regarded as a contraindication for TAVR,” concluded Dr. Eggebrecht of Agaplesion Bethanien Hospital in Frankfurt, Germany.
Of course, it is deemed an absolute contraindication to TAVR both in the current European Society of Cardiology and U.S. guidelines. But that position was developed in an earlier era when procedural safety had not yet been established. It was based on the expert consensus opinion of physicians drawn mostly from large tertiary centers with both cardiology and cardiac surgery on site. And this absolute contraindication was never supported by any data, he said.
In the United States, arguably the most litigious nation in the world, it’s virtually unthinkable – at least for now – to perform TAVR without a cardiothoracic surgeon on site in the event bailout emergency cardiac surgery should become necessary. But Germany, which boasts universal health care coverage at an affordable cost, operates differently. Indeed, in Dr. Eggebrecht’s study of all 17,919 transfemoral TAVR procedures performed in Germany during 2013 and 2014, fully 22 of the 77 hospitals where the procedures took place had no on-site cardiac surgery department.
He presented a comparison of in-hospital outcomes in the 1,332 German patients (7.4%) whose TAVR took place in hospitals without a cardiac surgery department and the 16,587 patients treated in hospitals with both cardiology and cardiac surgery departments. The data came from the prospective German Quality Assurance Registry on Aortic Valve Replacement, which records in extensive detail all TAVR and surgical replacements in the country. Participation in the registry is mandatory.
The main study finding: Even though patients at no–cardiac surgery hospitals were older, had more comorbid conditions, and were at higher predicted perioperative risk of mortality, the rates of intraprocedural complications, in-hospital strokes, and mortality were similar in the two groups.
Moreover, when Dr. Eggebrecht and coinvestigators performed a case-control substudy involving 555 patient pairs extensively matched on more than a dozen variables, including a requirement for identical scores on validated risk prediction tools for estimating in-hospital mortality, the results were the same as in the full study population.
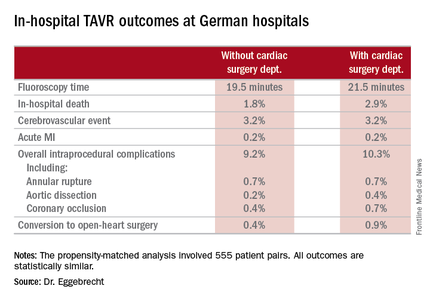
The key to the high-quality TAVR outcomes documented at hospitals without a cardiac surgery department, Dr. Eggebrecht emphasized, is that in Germany TAVR can be performed only at hospitals where a contractually obligated heart team has signed off on the procedure. At hospitals without a cardiac surgery department, this heart team is composed of in-house cardiologists and visiting cardiac surgeons from collaborating hospitals. In TAVRs at some of these hospitals, a collaborating cardiac surgeon is present for the procedure and brings along a heart-lung machine which is primed and ready to go, if needed, as was the case in just 0.4% of the 1,332 TAVRs. At others, the surgeon is off site.
“I would think our data show that close cooperation within the heart team is the key to successful outcomes, not having a cardiac surgeon on site,” he concluded.
Audience member Volkmar Falk, MD, strode briskly to a microphone and made no effort to hide his incredulity at this project.
“What is the real advantage in not having a surgeon present? I don’t get it,” declared Dr. Falk, professor and director of the department of cardiovascular and vascular surgery at Charité University Hospital in Berlin.
“For a surgeon, this is all quite difficult to understand,” he continued. “If a surgeon has to come to a TAVR rescue from 10 km away, I don’t know how well that works. And if surgeons have to travel with all their equipment in order to be on site, I think this is a logistical nightmare and shouldn’t be done at all.
“All of the studies, all the clinical trials we always discuss, have been done in the setting of hospitals where the procedure was done together with a surgeon on site. That’s why we have these excellent results,” Dr. Falk added.
Dr. Eggebrecht replied, “We’re having a scientific discussion here, and I think our data clearly show that you can construct a successful heart team even though you don’t have a cardiac surgery department on site.”
An Israeli cardiologist in the audience said a similar effort is underway in his country to open up TAVR to hospitals without an on-site cardiac surgeon. His objection is that, at least in Israel, a hospital with no on-site cardiac surgery is a marker for a TAVR center that is low volume, is late to embrace TAVR, and has cardiologists who are probably still early on the procedural learning curve.
Dr. Eggebrecht said that this is not the case in Germany, where some of the most experienced TAVR operators work at sites without a cardiac surgery department.
He reported that his study was partially funded by the German Cardiac Society, and he had no financial conflicts.
Simultaneously with his presentation, the study was published online (Eur Heart J. 2016 May 17. pii: ehw190).
PARIS – The buzzword in transcatheter aortic valve replacement today is “minimalist.” The search is on for ways in which to safely simplify the procedure to reduce the current unsustainably high cost and improve the patient experience.
Among the elements typically involved in minimalist TAVR are performance of the procedure in the cardiac catheterization laboratory via transfemoral access rather than in the costlier operating room, use of conscious sedation rather than general anesthesia, transthoracic echocardiographic guidance, no Swan-Ganz catheter, and no ICU stay for most patients. But these are tepid measures compared with what’s under study in Germany.
The German health care system is engaged in a study of what has to be the ultimate in minimalist TAVR: doing it in hospitals without on-site cardiac surgery. And the short-term results in more than 1,300 German patients treated in such a setting look every bit as good as in patients whose procedure took place in hospitals more conventionally equipped with both cardiology and cardiothoracic surgery departments, Holger Eggebrecht, MD, reported at the annual congress of the European Association of Percutaneous Cardiovascular Interventions.
“Lack of a cardiac surgery department on site should not be regarded as a contraindication for TAVR,” concluded Dr. Eggebrecht of Agaplesion Bethanien Hospital in Frankfurt, Germany.
Of course, it is deemed an absolute contraindication to TAVR both in the current European Society of Cardiology and U.S. guidelines. But that position was developed in an earlier era when procedural safety had not yet been established. It was based on the expert consensus opinion of physicians drawn mostly from large tertiary centers with both cardiology and cardiac surgery on site. And this absolute contraindication was never supported by any data, he said.
In the United States, arguably the most litigious nation in the world, it’s virtually unthinkable – at least for now – to perform TAVR without a cardiothoracic surgeon on site in the event bailout emergency cardiac surgery should become necessary. But Germany, which boasts universal health care coverage at an affordable cost, operates differently. Indeed, in Dr. Eggebrecht’s study of all 17,919 transfemoral TAVR procedures performed in Germany during 2013 and 2014, fully 22 of the 77 hospitals where the procedures took place had no on-site cardiac surgery department.
He presented a comparison of in-hospital outcomes in the 1,332 German patients (7.4%) whose TAVR took place in hospitals without a cardiac surgery department and the 16,587 patients treated in hospitals with both cardiology and cardiac surgery departments. The data came from the prospective German Quality Assurance Registry on Aortic Valve Replacement, which records in extensive detail all TAVR and surgical replacements in the country. Participation in the registry is mandatory.
The main study finding: Even though patients at no–cardiac surgery hospitals were older, had more comorbid conditions, and were at higher predicted perioperative risk of mortality, the rates of intraprocedural complications, in-hospital strokes, and mortality were similar in the two groups.
Moreover, when Dr. Eggebrecht and coinvestigators performed a case-control substudy involving 555 patient pairs extensively matched on more than a dozen variables, including a requirement for identical scores on validated risk prediction tools for estimating in-hospital mortality, the results were the same as in the full study population.
The key to the high-quality TAVR outcomes documented at hospitals without a cardiac surgery department, Dr. Eggebrecht emphasized, is that in Germany TAVR can be performed only at hospitals where a contractually obligated heart team has signed off on the procedure. At hospitals without a cardiac surgery department, this heart team is composed of in-house cardiologists and visiting cardiac surgeons from collaborating hospitals. In TAVRs at some of these hospitals, a collaborating cardiac surgeon is present for the procedure and brings along a heart-lung machine which is primed and ready to go, if needed, as was the case in just 0.4% of the 1,332 TAVRs. At others, the surgeon is off site.
“I would think our data show that close cooperation within the heart team is the key to successful outcomes, not having a cardiac surgeon on site,” he concluded.
Audience member Volkmar Falk, MD, strode briskly to a microphone and made no effort to hide his incredulity at this project.
“What is the real advantage in not having a surgeon present? I don’t get it,” declared Dr. Falk, professor and director of the department of cardiovascular and vascular surgery at Charité University Hospital in Berlin.
“For a surgeon, this is all quite difficult to understand,” he continued. “If a surgeon has to come to a TAVR rescue from 10 km away, I don’t know how well that works. And if surgeons have to travel with all their equipment in order to be on site, I think this is a logistical nightmare and shouldn’t be done at all.
“All of the studies, all the clinical trials we always discuss, have been done in the setting of hospitals where the procedure was done together with a surgeon on site. That’s why we have these excellent results,” Dr. Falk added.
Dr. Eggebrecht replied, “We’re having a scientific discussion here, and I think our data clearly show that you can construct a successful heart team even though you don’t have a cardiac surgery department on site.”
An Israeli cardiologist in the audience said a similar effort is underway in his country to open up TAVR to hospitals without an on-site cardiac surgeon. His objection is that, at least in Israel, a hospital with no on-site cardiac surgery is a marker for a TAVR center that is low volume, is late to embrace TAVR, and has cardiologists who are probably still early on the procedural learning curve.
Dr. Eggebrecht said that this is not the case in Germany, where some of the most experienced TAVR operators work at sites without a cardiac surgery department.
He reported that his study was partially funded by the German Cardiac Society, and he had no financial conflicts.
Simultaneously with his presentation, the study was published online (Eur Heart J. 2016 May 17. pii: ehw190).
AT EUROPCR 2016
Key clinical point: TAVR can be performed in hospitals safely without a cardiac surgery department.
Major finding: In-hospital mortality occurred in 3.8% of patients who underwent TAVR at hospitals without on-site cardiac surgery and in 4.2% of patients whose procedure was done at hospitals with a cardiac surgery department.
Data source: An analysis of in-hospital outcomes of all 17,919 patients who underwent TAVR in Germany during 2013 and 2014, including 1,332 whose procedures took place at one of the 22 hospitals with no on-site cardiac surgery department.
Disclosures: The study was partially funded by the German Cardiac Society. The presenter reported having no financial conflicts.

Lessons born of tragedy

Gun violence, the LGBT community, and terrorism. Who would have imagined these 3 entities tragically colliding in Orlando last month, in the shadow of “the happiest place on earth”? The tragedy was all too real for the victims—mostly gay young Hispanic men—their families and friends, and all those who responded with urgent help. Our hearts go out to the victims and their loved ones, and our hats go off to those who rushed in to help—especially the dedicated law enforcement and medical personnel who saved many lives.
We respond as a nation and as individuals with great sadness and anger to an event like this. But are there lessons embedded in the sorrow for us as family physicians and primary care clinicians? I believe there are.
1. Ask yourself: Am I doing all I can to provide compassionate care? Although I think of myself as a caring, compassionate family physician who treats all patients equally, I realize that I must continue to educate myself about the culture and health needs of specific segments of my patient population to ensure that I provide truly excellent care. Traditionally, cultural sensitivity training has focused on knowledge of races, ethnicities, and cultures, but it must also include training about sexual orientation. Asking patients about their sexual orientation must be a routine part of the medical history.
One of the minority groups we know least about is transgender individuals, who have unique medical and psychological issues. It is tragically ironic that we had planned an article about caring for transgender patients—a group that experiences disproportionate discrimination and violence1—for this issue of JFP long before the Orlando shooting. We still have much to learn about the most appropriate way of caring for transgender individuals because there has been so little research.
2. Treat gun violence like an infectious disease. Another lesson from the Orlando tragedy is to approach the issue of gun violence—which is always highly politicized and charged in this country—as a public health problem. One of the best examples of this approach in action is an organization called Cure Violence (cureviolence.org) led by Gary Slutkin, MD, a former Centers for Disease Control and Prevention infectious disease specialist and epidemiologist. The organization proposes that the best way to stop violence is by using the methods and strategies associated with disease control. The group claims to have made great strides in reducing violence in the communities in which it works by treating violence as an epidemic.
Violence and discrimination, like chronic disease, seem to be permanent fixtures on the human landscape. We all must do our small, but important, part as health professionals to prevent and mitigate these evils.
1. Pew Research Center. A survey of LGBT Americans: attitudes, experiences and values in changing times. Available at: http://www.pewsocialtrends.org/2013/06/13/a-survey-of-lgbt-americans. Accessed June 15, 2016.
Gun violence, the LGBT community, and terrorism. Who would have imagined these 3 entities tragically colliding in Orlando last month, in the shadow of “the happiest place on earth”? The tragedy was all too real for the victims—mostly gay young Hispanic men—their families and friends, and all those who responded with urgent help. Our hearts go out to the victims and their loved ones, and our hats go off to those who rushed in to help—especially the dedicated law enforcement and medical personnel who saved many lives.
We respond as a nation and as individuals with great sadness and anger to an event like this. But are there lessons embedded in the sorrow for us as family physicians and primary care clinicians? I believe there are.
1. Ask yourself: Am I doing all I can to provide compassionate care? Although I think of myself as a caring, compassionate family physician who treats all patients equally, I realize that I must continue to educate myself about the culture and health needs of specific segments of my patient population to ensure that I provide truly excellent care. Traditionally, cultural sensitivity training has focused on knowledge of races, ethnicities, and cultures, but it must also include training about sexual orientation. Asking patients about their sexual orientation must be a routine part of the medical history.
One of the minority groups we know least about is transgender individuals, who have unique medical and psychological issues. It is tragically ironic that we had planned an article about caring for transgender patients—a group that experiences disproportionate discrimination and violence1—for this issue of JFP long before the Orlando shooting. We still have much to learn about the most appropriate way of caring for transgender individuals because there has been so little research.
2. Treat gun violence like an infectious disease. Another lesson from the Orlando tragedy is to approach the issue of gun violence—which is always highly politicized and charged in this country—as a public health problem. One of the best examples of this approach in action is an organization called Cure Violence (cureviolence.org) led by Gary Slutkin, MD, a former Centers for Disease Control and Prevention infectious disease specialist and epidemiologist. The organization proposes that the best way to stop violence is by using the methods and strategies associated with disease control. The group claims to have made great strides in reducing violence in the communities in which it works by treating violence as an epidemic.
Violence and discrimination, like chronic disease, seem to be permanent fixtures on the human landscape. We all must do our small, but important, part as health professionals to prevent and mitigate these evils.
1. Pew Research Center. A survey of LGBT Americans: attitudes, experiences and values in changing times. Available at: http://www.pewsocialtrends.org/2013/06/13/a-survey-of-lgbt-americans. Accessed June 15, 2016.
1. Pew Research Center. A survey of LGBT Americans: attitudes, experiences and values in changing times. Available at: http://www.pewsocialtrends.org/2013/06/13/a-survey-of-lgbt-americans. Accessed June 15, 2016.
Joint Review Course set for August
The Society for Vascular Surgery and the Division of Vascular and Endovascular Surgery at University of California Los Angeles have merged their board review programs, resulting in the First Annual UCLA/SVS Symposium: A Comprehensive Review and Update of What’s New in Vascular and Endovascular Surgery.”
The three-day course will be Aug. 27 to 29 at the Beverly Hilton in Beverly Hills, Calif.
This program will offer an in-depth review for those preparing to take the vascular board examinations as well as providing the basic didactic education for vascular residents and fellows in training.
For more information, visit vsweb.org/JointSymposium.

AUDIO: New bipolar disorder algorithm changes ranking of first-line therapies
WASHINGTON – In 2015, the Florida Agency for Health Care Administration published clinical guidelines for numerous psychiatric conditions, including bipolar disorder, demoting several first-line therapies, and promoting others.
Because the authors of the Florida Best Practice Psychotherapeutic Medication Guidelines for Adults agreed that inflammation is a mechanism of action in bipolar disorder, they adopted an approach to care that seeks to avoid inflammation at all costs.
“Some medications create metabolic disturbances, which can be disruptive to the inflammatory milieu,” said Roger McIntyre, MD, a professor of psychiatry and pharmacology at the University of Toronto, and head of the Mood Disorders Psychopharmacology Unit at the University Health Network, Toronto. Dr. McIntyre, one of the coauthors of the guidelines, discussed why the combination of olanzapine and fluoxetine has been deferred in the algorithm, why other medications have moved further up, why antidepressants also are lower in the order of priority, and why psychoeducation, social rhythm therapy, and lifestyle changes have been emphasized more than ever before.
“There is no way our bipolar patients are going to achieve their goals with medication alone,” Dr. McIntyre said at the meeting, held by the Global Academy for Medical Education. In addition, Dr. McIntyre outlined why adding bipolar screening in the primary care setting is critical in 2016, and called the new recommendations “the most up-to-date guidelines for treating bipolar disorder, and the new nosology of major depression disorder with mixed features.”
To access the Florida Best Practice Psychotherapeutic Medication Guidelines for Adults online, visit the Florida Medicaid Drug Therapy Management Program for Behavioral Health website.
Dr. McIntyre has numerous industry relationships, including research funding from Eli Lilly, Janssen-Ortho, Astra-Zeneca; Pfizer, and Lundbeck. Global Academy and this news organization are owned by the same company.
On Twitter @whitneymcknight
AT SUMMIT IN NEUROLOGY & PSYCHIATRY
Ustekinumab misses primary endpoint in atopic dermatitis
SCOTTSDALE, ARIZ. – Treatment with ustekinumab did not result in significant improvements in atopic dermatitis after 16 weeks, compared with placebo in a phase II study of adults with moderate to severe atopic dermatitis, Dr. Patrick Brunner reported at the annual meeting of the Society for Investigative Dermatology.
However, molecular studies revealed robust modulation of relevant transcriptomic genes after 1 month of ustekinumab, compared with placebo, said Dr. Brunner, who is with the Laboratory for Investigative Dermatology, Rockefeller University, New York. Since the crossover design of this trial and the use of topical corticosteroids by patients probably diluted the differences in clinical outcomes between the intervention and placebo groups, “another study with a different design and dosing is mandated,” he said in an oral presentation at the meeting.

Ustekinumab (Stelara) is a long-acting injectable human interleukin-12 and interleukin-23 antagonist that suppresses Th1, Th17, and Th22 activation. It was approved in 2009 in the United States for moderate to severe plaque psoriasis, and in 2013 for active psoriatic arthritis.
To investigate ustekinumab as therapy for atopic dermatitis, Dr. Brunner and his associates randomly assigned 33 adults aged 18-75 years with refractory atopic dermatitis and baseline scores on the Scoring Atopic Dermatitis (SCORAD) severity scale above 15 to subcutaneous injections of either placebo (17 patients) or ustekinumab (16) at weeks 0, 4, and 16. Ustekinumab was dosed the same way as in psoriasis: 45 mg per injection for patients at or under 100 kg, and 90 mg per injection for heavier patients. At week 16, all patients crossed over to the other treatment for another 16 weeks.
The groups were similar in terms of baseline demographics, intrinsic versus extrinsic IgE status, mean SCORAD, and average levels of IgE and eosinophils. To increase enrollment and retention, both groups were given triamcinolone acetonide 0.025%.
The proportion of SCORAD50 responders (patients with at least a 50% drop from the baseline SCORAD) was greater for ustekinumab than placebo at weeks 12, 16, and 20, but the differences never reached statistical significance, Dr. Brunner reported. At week 16, five (31%) ustekinumab-treated patients had achieved SCORAD50 (the primary endpoint), compared with three (18%) of those on placebo. The ustekinumab SCORAD50 response reached 50% by week 20, but by then patients had crossed over and the two groups began to resemble each other, he said.
“The lessons learned for designing atopic dermatitis trials are to avoid a crossover design with a long-lasting drug, and to keep in mind that even mild background topical steroids can tremendously confound detection of drug effects,” Dr. Brunner commented.
Studies of the atopic dermatitis molecular profile, or transcriptome, revealed similar gene expression levels for both trial arms at baseline, but substantially more gene modulation after 4 weeks of ustekinumab, compared with placebo, he reported. This molecular response involved the Th1, Th17, Th22, but also Th2-related atopic dermatitis genes, and in all cases the differences from placebo were statistically significant (P less than .05). Furthermore, gene modulation became more pronounced through the end of the trial and correlated with clinical response, he added.
The most common adverse effect associated with ustekinumab was respiratory infection, which affected two patients. There were no serious adverse effects reported and none of the patients stopped treatment because of adverse effects.
“Ustekinumab had clear clinical and molecular effects, but clinical outcomes might have been obscured by a profound placebo effect, most likely due to background topical glucocorticosteroids and possibly insufficient dosing for atopic dermatitis,” Dr. Brunner and his associates concluded in a report of their findings, which was published online after the meeting in Experimental Dermatology (Exp Dermatol. 2016 Jun 15. doi: 10.1111/exd.13112).
The study was supported by Janssen, the manufacturer of ustekinumab, and by the National Institutes of Health. Dr. Brunner had no disclosures.
SCOTTSDALE, ARIZ. – Treatment with ustekinumab did not result in significant improvements in atopic dermatitis after 16 weeks, compared with placebo in a phase II study of adults with moderate to severe atopic dermatitis, Dr. Patrick Brunner reported at the annual meeting of the Society for Investigative Dermatology.
However, molecular studies revealed robust modulation of relevant transcriptomic genes after 1 month of ustekinumab, compared with placebo, said Dr. Brunner, who is with the Laboratory for Investigative Dermatology, Rockefeller University, New York. Since the crossover design of this trial and the use of topical corticosteroids by patients probably diluted the differences in clinical outcomes between the intervention and placebo groups, “another study with a different design and dosing is mandated,” he said in an oral presentation at the meeting.
Ustekinumab (Stelara) is a long-acting injectable human interleukin-12 and interleukin-23 antagonist that suppresses Th1, Th17, and Th22 activation. It was approved in 2009 in the United States for moderate to severe plaque psoriasis, and in 2013 for active psoriatic arthritis.
To investigate ustekinumab as therapy for atopic dermatitis, Dr. Brunner and his associates randomly assigned 33 adults aged 18-75 years with refractory atopic dermatitis and baseline scores on the Scoring Atopic Dermatitis (SCORAD) severity scale above 15 to subcutaneous injections of either placebo (17 patients) or ustekinumab (16) at weeks 0, 4, and 16. Ustekinumab was dosed the same way as in psoriasis: 45 mg per injection for patients at or under 100 kg, and 90 mg per injection for heavier patients. At week 16, all patients crossed over to the other treatment for another 16 weeks.
The groups were similar in terms of baseline demographics, intrinsic versus extrinsic IgE status, mean SCORAD, and average levels of IgE and eosinophils. To increase enrollment and retention, both groups were given triamcinolone acetonide 0.025%.
The proportion of SCORAD50 responders (patients with at least a 50% drop from the baseline SCORAD) was greater for ustekinumab than placebo at weeks 12, 16, and 20, but the differences never reached statistical significance, Dr. Brunner reported. At week 16, five (31%) ustekinumab-treated patients had achieved SCORAD50 (the primary endpoint), compared with three (18%) of those on placebo. The ustekinumab SCORAD50 response reached 50% by week 20, but by then patients had crossed over and the two groups began to resemble each other, he said.
“The lessons learned for designing atopic dermatitis trials are to avoid a crossover design with a long-lasting drug, and to keep in mind that even mild background topical steroids can tremendously confound detection of drug effects,” Dr. Brunner commented.
Studies of the atopic dermatitis molecular profile, or transcriptome, revealed similar gene expression levels for both trial arms at baseline, but substantially more gene modulation after 4 weeks of ustekinumab, compared with placebo, he reported. This molecular response involved the Th1, Th17, Th22, but also Th2-related atopic dermatitis genes, and in all cases the differences from placebo were statistically significant (P less than .05). Furthermore, gene modulation became more pronounced through the end of the trial and correlated with clinical response, he added.
The most common adverse effect associated with ustekinumab was respiratory infection, which affected two patients. There were no serious adverse effects reported and none of the patients stopped treatment because of adverse effects.
“Ustekinumab had clear clinical and molecular effects, but clinical outcomes might have been obscured by a profound placebo effect, most likely due to background topical glucocorticosteroids and possibly insufficient dosing for atopic dermatitis,” Dr. Brunner and his associates concluded in a report of their findings, which was published online after the meeting in Experimental Dermatology (Exp Dermatol. 2016 Jun 15. doi: 10.1111/exd.13112).
The study was supported by Janssen, the manufacturer of ustekinumab, and by the National Institutes of Health. Dr. Brunner had no disclosures.
AT THE 2016 SID ANNUAL MEETING
Key clinical point: Ustekinumab missed its primary endpoint in a phase II trial of adults with moderate to severe atopic dermatitis.
Major finding: At 16 weeks, five (31%) ustekinumab patients had achieved SCORAD50, compared with three (19%) placebo patients, a difference that was not statistically significant.
Data source: A randomized, double-blind study evaluated ustekinumab in 33 patients with moderate to severe atopic dermatitis.
Disclosures: The study was supported by Janssen, the maker of ustekinumab (Stelara), and by the National Institutes of Health. Dr. Brunner had no disclosures.

New SHM Members – July 2016
S. Godfrey, Alabama
A. Velayati, MD, Alabama
M. Neyman, MD, Arizona
S. StimsonRiahi, FACP, Arizona
D. Testa, Arizona
S. Thomas, MD, Arizona
A. Babaki, California
K. Blanton, BSN, California
K. Chan, DO, California
J. Cipa-Tatum, MD, California
M. Essig, California
R. Garcia, MPH, PA-C, California
C. Ho, California
J. Hoppe, California
M. Hudock, PA-C, California
V. Huynh, California
N. Lakhera, California
P. Lin, California
G. Martinez, California
R. Mistry, PA-C, California
A. Murphy, California
V. Reddy, California
S. Sharif, DO, California
J. Smith Jonas, RN, MSN, California
A. Williams, DO, California
H. Crossman, Colorado
L. Donigan, Colorado
F. Merritt, MD, Colorado
B. Clark, Connecticut
A. Kimowicz Ely, Delaware
V. Ramdoss, Delaware
B. Bhimji, MD, Florida
J. Dyer, Florida
S. Hussain, MD, Florida
J. Rodemeyer, Florida
R. A. Adene-Peter, MD, Georgia
M. Burnett, PA-C, Georgia
C. Gordon, MD, FACP, Georgia
M. Morris, Georgia
A. Roberson, PA-C, Georgia
A. Gorham, Idaho
M. Ashraf, Illinois
A. Kovalsky, DO, MPH, Illinois
G. Patel, USA, Illinois
A. Brown, ACNP, Indiana
A. Brown, ANP-BC, Indiana
R. De Los Santos, MD, Indiana
C. Frame, ACNP, Indiana
J. Myers, FNP, Indiana
A. Greif, MD, Iowa
M. Jones, DO, Kansas
S. Suman, MD, MPH, Kentucky
S. Davuluri, MD, Louisiana
A. LaComb, FAAFP, Louisiana
E. Von Felten, FAAFP, Maine
K. Anwar, Maryland
R. Sedighi Manesh, MD, Maryland
K. Islam, Massachusetts
V. Kandimalla, MD, Massachusetts
K. Ntiforo, Massachusetts
S. Paudel, MD, Massachusetts
O. Enaohwo, MD, Michigan
N. Wisniewski, MEd, MPAS, PA-C, Michigan
M. Buchner-Mehling, Minnesota
T. Mukonje, Minnesota
T. Perttula, Minnesota
C. Plooster, MPAS, PA-C, Minnesota
S. Reichl, Minnesota
J. Sundberg, MD, Minnesota
D. Wolbrink, MD, Minnesota
D. Haddad, MD, Mississippi
K. Bleisch, AGNP, Missouri
V. Kenguva, MD, Missouri
R. Kroeger, MD, Missouri
H. McKeever, ACAGNP, Missouri
A. Pickrell, MD, Missouri
P. Podaralla, MD, Missouri
C. Robertson, FNP, Missouri
E. Robinson-Mitchell, MD, Missouri
K. Schaefermeier, AGNP, Missouri
A. Shah, MD, Missouri
S. V. Yew, MBBS, Missouri
T. Hylland, FNP, Montana
R. Goodwin, Nebraska
M. Hofreiter, FACP, New Hampshire
G. Looser, PA-C, New Hampshire
V. Verma, MD, New Jersey
M. Behl, MD, New Mexico
P. Boehringer, MD, FACP, New Mexico
L. Fatemi, DO, New Mexico
L. Flores, New Mexico
B. Khan, MD, New Mexico
M. Knof, New Mexico
H. McKnight, MD, New Mexico
B. Murguia, MD, New Mexico
R. Pierce, MD, New Mexico
A. Belman, MD, New York
W. Dissanayake, MD, New York
M. Fabisevich, MD, New York
S. Madderla, MD, New York
M. Maynard, DO, New York
P. Park, MD, New York
V. Subramanian, MD, New York
M. Wolfe, New York
A. Chatterjee, MD, North Carolina
G. Gilson, MHA, North Carolina
C. Nashatizadeh, MD, North Carolina
J. Perez Coste, North Carolina
K. Gupta, North Dakota
M. Sampson, CCFP, MD, Nova Scotia
M. J. Belderol, MD, Ohio
K. Crouser, MD, Ohio
C. Lambert, MD, Ohio
J. Muriithi, MD, Ohio
Y. Omran, USA, Ohio
T. Scheufler, DO, Ohio
J. Springer, Ohio
H. Szugye, DO, Ohio
J. Zang, MS, Ohio
J. Zimmerman, FACEP, Ohio
D. Beeson, MD, Oklahoma
E. Mathias, LPN, Oklahoma
M. Salehidobakhshari, Ontario
J. Hull, DO, Oregon
R. Asaad, Pennsylvania
N. Desai, MD, Pennsylvania
N. Ezeife, MD, Pennsylvania
M. Mazich, PA, Pennsylvania
K. Mezue, MSC, Pennsylvania
V. Shah, MD, MBBS, Pennsylvania
W. Sherman, DO, MBA, MS, Pennsylvania
S. Tripp, Pennsylvania
M. Weidner, CRNP, Pennsylvania
B. Weinbaum, MD, Pennsylvania
A. Gupta, MD, Rhode Island
S. El-Ibiary, South Carolina
C. Obi, South Carolina
J. Reed, MD, South Dakota
R. Mahboob, MD, Tennessee
L. Ackerman, MD, Texas
K. Chung, Texas
N. Jayaswal, MBBS, Texas
R. Kessel, MD, Texas
A. Khatoon, Texas
C. Renner, Texas
H. Smith, PA-C, Texas
R. Trien, Texas
J. Anderson, ACNP, Utah
C. Mitchell, MD, Vermont
L. Lawson, Virginia
S. Glass, MD, Washington
J. Joy, MHA, Washington
D. Farmer, BS, DO, MS, West Virginia
D. Nunev, MD, West Virginia
Preorder 2016 State of Hospital Medicine Report
The State of Hospital Medicine (SoHM) report is the most comprehensive survey of hospital medicine in the country and provides current data on hospitalist compensation and productivity and also covers practice demographics, staffing levels, staff growth, and compensation models.
“The SoHM report is an indispensable tool for hospital medicine group directors,” says Andrew White, MD, SFHM. “I really appreciate the breakdown by characteristics, such as region of the country, academic practice, pediatrics, family medicine, and the involvement of NP and PA providers. The SoHM represents an excellent value. It has a ton of information in an easy-to-read format.”
Don’t miss out on getting your copy when it becomes available. Order now and be notified directly when the report is released in September at www.hospitalmedicine.org/Survey.
Risk of AML death varies by region
Photo by Rhoda Baer
The risk of death from acute myeloid leukemia (AML) may be influenced by where a patient lives, according to a study published in Cancer.
Three regions in North Carolina were found to be associated with a higher risk of death, when compared to the rest of the state.
Patients had a significantly higher risk of death if they lived in northeastern North Carolina (from Wilson to Roanoke Rapids), in a region around Greenville, and a region around Wake County, including Durham County.
The increased risk remained even when the researchers controlled for other factors.
“The geographic survival disparities we found could not be explained by other sociodemographic variables or proximity to experienced treating facilities,” said study author Ashley Freeman, MD, of the University of North Carolina (UNC) in Chapel Hill.
“This raises the possibility that more complex features of the local healthcare infrastructure, including provider referral and practice patterns, are affecting patient outcomes.”
To study death rates from AML across North Carolina, Dr Freeman and her colleagues analyzed data on 553 adults who were diagnosed with AML between 2003 and 2009 and received inpatient chemotherapy within 30 days of diagnosis.
The team used the UNC Lineberger Integrated Cancer Information and Surveillance System, a database that links insurance claims information to a state information database called the NC Cancer Registry.
The researchers assessed the risk of death in 9 regions defined by the North Carolina Area Health Education Centers (AHEC) Program, a program established in 1972 to address physician shortages and the uneven distribution of healthcare services in North Carolina.
“We looked at geographic disparities because we are trying to improve outcomes for all citizens in North Carolina, consistent with the mission of our cancer center,” said William A. Wood, MD, of UNC.
“We are also trying to find situations in which disparities shouldn’t exist but do for arbitrary reasons—such as where a patient happens to live—so that we can figure out how to improve equity across the state.”
The researchers determined that a region around Greensboro had the lowest risk of death for AML.
Compared to the Greensboro region, the risk of death was 4 times higher in an area of northeastern North Carolina that included Roanoke Rapids, Rocky Mount, and Wilson—the highest in the state.
Compared to the Greensboro region, the risk of death was more than 2 times greater in the eastern region of the state around Greenville, and it was nearly twice as high in the region around Wake County.
“There are areas of the state where there is an elevated mortality, and we need to better understand the factors that are driving that—whether they’re environmental, patient, or provider-related,” said Anne-Marie Meyer, PhD, of UNC.
Nearly half of patients in the study received their care at hospitals not affiliated with one of the state’s 3 National Cancer Institute (NCI) comprehensive cancer centers.
The researchers did not find a significant link between the risk of death and the distance from patients’ homes to their treating facility or the nearest NCI-designated center.
And there was no significant difference in the risk of death at 1 year between patients who received treatment at an NCI-designated cancer center and those who did not. However, patients with a more serious prognosis were more likely to be treated at an NCI-designated cancer center.
The researchers did identify regional differences in healthcare resources. “Area L,” which is the name for the region in northeastern North Carolina that spans from Wilson to Roanoke Rapids, for example, has some of the lowest proportion of general practitioner physicians and radiation oncologists, as well as the highest burden of disease.
However, it is not clear why the disparities continued even after the researchers controlled for regional factors like poverty and education. The team believes other factors could be involved, such as the providers’ experience with treating rare or complex diseases or how supportive care is delivered.
Although there was not a significant association between survival and treatment at an NCI-designated center, there may be other features of treatment facilities, such as patient volume and academic affiliation, that are important for patient outcomes.
The researchers said their next step is to identify those factors and develop programs to try to close the gaps.
“The message here is that acute myeloid leukemia is representative of diseases that are uncommon, involve high-complexity care, and have high risk for morbidity and mortality,” Dr Wood said.
“If we can figure out how to coordinate and improve delivery of effective interventions for this disease throughout the state of North Carolina, then we may be able to develop a model for improving outcomes in many other diseases throughout the state as well.” ![]()
Drug granted breakthrough, orphan designation for cGVHD

Photo courtesy of Janssen
The US Food and Drug Administration (FDA) has granted breakthrough therapy designation for ibrutinib (Imbruvica), a Bruton’s tyrosine kinase inhibitor, as a potential treatment for chronic graft-versus-host-disease (cGVHD) in patients who have failed 1 or more lines of systemic therapy.
The FDA has also granted ibrutinib orphan drug designation for this indication.
The request for breakthrough therapy designation and orphan designation for ibrutinib in patients with cGVHD was based on preliminary data from a phase 1b/2 study of patients with steroid-dependent or refractory cGVHD.
Results from this trial were presented at the 2015 ASCO Annual Meeting (abstract 7024) and the 2016 EBMT meeting (abstract P124).
About ibrutinib
Ibrutinib is an oral, once-daily therapy that inhibits Bruton’s tyrosine kinase, a signaling molecule in the B-cell receptor signaling complex that plays an important role in the survival and spread of malignant B cells.
Ibrutinib is FDA-approved to treat patients with chronic lymphocytic leukemia (CLL) and small lymphocytic lymphoma (SLL), including those with 17p deletion, patients with mantle cell lymphoma (MCL) who have received at least 1 prior therapy, and patients with Waldenström’s macroglobulinemia.
Accelerated approval was granted for the MCL indication based on overall response rate. Continued approval for this indication may be contingent upon verification of clinical benefit in confirmatory trials.
The FDA previously granted ibrutinib breakthrough designation for the treatment of relapsed or refractory MCL, Waldenström’s macroglobulinemia, and CLL/SLL patients with 17p deletion. The FDA also granted ibrutinib orphan designation for all 3 indications.
Ibrutinib is jointly developed and commercialized by Pharmacyclics LLC, an AbbVie company, and Janssen Biotech, Inc.
About breakthrough designation
The FDA’s breakthrough therapy designation is intended to expedite the development and review of new therapies for serious or life-threatening conditions.
To earn the designation, a treatment must show encouraging early clinical results demonstrating substantial improvement over available therapies with regard to a clinically significant endpoint, or it must fulfill an unmet need.
About orphan designation
The FDA grants orphan designation to drugs and biologics intended to treat, diagnose, or prevent diseases/disorders that affect fewer than 200,000 people in the US.
The designation provides incentives for sponsors to develop products for rare diseases. This may include tax credits toward the cost of clinical trials, prescription drug user fee waivers, and 7 years of market exclusivity if the drug is approved. ![]()