User login
Treatment of preschool ADHD
Attention deficit/hyperactivity disorder (ADHD) has been identified in children, and appropriate treatments studied now for over half a century. The vast majority of cases that present for treatment do so after the child starts school and concerns are raised about ability to manage academics. Yet, when asked when the symptoms first began, many parents will describe onset prior to the school years – in the preschool period. But identification of ADHD in preschoolers can be difficult because of the developmental changes that are ongoing during the period from 3 to 5 years. Many of the symptoms that one would attribute to ADHD, such as increased motor activity, inattention, and distractibility are commonplace in this age group. Furthermore, some behaviors commonly associated with ADHD, such as emotional lability and obstinacy, are nearly synonymous with being a preschooler. So, how is the diagnosis made? When is it appropriate to treat? And what would that treatment look like? The following case, where symptoms of preschool ADHD go beyond typical development, provides some guides for treatment based on the evolving literature regarding preschool ADHD.
Case Summary
Johnny is a 4-year-old boy who was the product of a complicated pregnancy and delivery. Born at 35 weeks to a 17-year-old mother with a history of tobacco use disorder and depression, he spent several weeks in the special care nursery before leaving the hospital with his mother. His early temperament was described as being “difficult” with frequent episodes of colic and trouble establishing a sleep routine. His father had a history of conduct problems and school failure, and would come in and out of the family for the first 3 years. Lately, he had moved in with Johnny and his mother, and they were trying to “make a go of it.” Johnny had been slightly behind in his developmental milestones – particularly his language – but by 4 years he was able to speak in simple sentences, was able to name his colors, and had started copying circles and squares.

His parents bring Johnny in for an appointment that they made specifically to discuss his activity level and the question of ADHD, which has been brought up by multiple family members and his preschool teacher. They describe some behaviors that you have not heard about previously because they had assumed that “this is what boys did.” At age 3 years, he impulsively ran into the road after being told “no” and was nearly struck by a car. He continually tries to put things into the toaster, and they have had to get “industrial strength” plug covers because he tries to pry them off with a kitchen knife. On multiple occasions, his mother has locked herself in her bedroom because he wouldn’t stop talking to her and she couldn’t stand it anymore. When this happens, she checks often to make sure Johnny is safe, but then calls Johnny’s father home from his job as a delivery driver because she’s at her limit. In fact, Johnny’s father has been called to the preschool to bring Johnny home so many times that his father is in danger of losing his job. While Johnny appears to be a good athlete, he is often picked last for teams because he doesn’t pay attention in the game and likes to “play his own game” of tackling the other children. The stress of raising Johnny is weighing on the parents’ relationship, and Johnny’s father is considering moving out again. The parents ask for an assessment and treatment, preferably with medication.
Case Discussion
Johnny very likely has ADHD. However, to take appropriate caution in the diagnosis, one would consider that he needs to have six of nine criteria of inattention (being careless, difficulty sustaining attention, not listening, not following through, avoiding hard mental tasks, not organizing, losing important items, being easily distractible, and being forgetful) and/or six of nine criteria of hyperactivity/impulsivity (squirming/fidgeting, can’t stay seated, running or climbing excessively, can’t play quietly, “driven by a motor,” talking excessively, blurting out answers, not waiting his turn, and interrupting/intruding on others). As with school-aged ADHD, there need to be symptoms that are frequent (“often”) and that interfere with home, academic, or occupational function. One must take into account the base rate for these symptoms in preschoolers. For example, Willoughby and colleagues (J. Abnorm. Child Psychol. 2012;40:1301-12) demonstrated that at age 4 years, 26.3% of children fidget or squirm, 39.5% act as if “driven by a motor,” 46.3% talk excessively, 28.8% are easily distracted, and 25.4% have difficult waiting their turn. In fact, on average, a 4-year-old will have 1.3 inattentive items and 2.4 hyperactive-impulsive items. Still, Johnny seems to have more than his fair share. This can be validated by a) doing a careful evaluation over time using multiple informants, b) taking a family history, c) looking at developmental signs and ruling out other developmental disorders, d) making physical observations in the office (although these can be deceiving) and e) having the parents and others complete parent and caregiver checklists.
When asking parents and caregivers to complete checklists, it is crucial to make sure that these checklists look for symptoms other than just ADHD, because there are often co-occurring symptoms and disorders. These include oppositional defiant disorder, anxiety, obsessive compulsive disorder, depressive disorders, autism spectrum disorders, trauma, and learning/communication disorders. In fact, the Preschool ADHD Treatment Study (PATS) demonstrated that 71.5% of children with preschool ADHD had at least one other diagnosis and 29.7% had two or more (J. Child Adolesc. Psychopharmacol. 2007;17:563-80). Use of a broad-based instrument that captures all of these domains, in addition to attention, is warranted. In our clinic, we also assess the parents for psychopathology using the same instruments. The reason for this is, first, that family history increases the likelihood of an ADHD diagnosis and, perhaps more importantly, presence of family psychopathology makes treatment more difficult. This is because the treatment you will prescribe is going to actively involve the parents.
The treatment of choice for preschool ADHD, based on practice parameters and expert opinion, is to start with family-based behavioral treatments. There are now several empirically-based treatments that have shown efficacy for the symptoms of inattention and hyperactivity-impulsivity in preschoolers. These include Triple P (“Practitioner’s Manual for Enhanced Triple P” [Brisbane: Families International Publishing, 1998]), The Incredible Years (Webster-Stratton & Hancock, 1998), and the Revised New Forest Parent Program (Daley & Thompson, 2007), among others. If these are not available in your community, other options would be “Helping the noncompliant child: A clinician’s guide to effective parent training,” 2nd ed. (The Guilford Press: New York, 2003) or any other empirically-based parent training program. This is why it is critical to engage the parents in treatment and to refer them for treatment for their own psychopathology, if present. Furthermore, engaging the family in a program of wellness (freedom from substances, enhanced nutrition, avoidance of artificial food coloring, increased exercise), has less of a research base, but the available evidence is that it is helpful.
If medications become necessary because of safety concerns, there are few options that have a Food and Drug Administration indication. Those that do have an indication for disruptive behavior below the age of 5 years (haloperidol, dextroamphetamine, chlorpromazine, and risperidone) should not be considered as first line. The PATS study demonstrated the safety and efficacy of methylphenidate, but with optimal doses lower than those seen in school-aged children (0.7 mg/kg per day) and with increased numbers of adverse effects (11% discontinuing) (J. Am. Acad. Child Adolesc. Psychiatry 2006;45:1284-93; J. Am. Acad. Child Adolesc. Psychiatry 2006;45:1294-303).
Because of the increased amount of side effects, medication treatment cannot be considered as the first treatment. Treatment with nonstimulants is poorly studied. Any treatment with methylphenidate would be considered off-label prescribing, which must be done with great caution and, preferably, in consultation with a child and adolescent psychiatrist.
The diagnosis and management of ADHD in the very young is tricky, but possible. Doing a comprehensive evaluation with information from multiple informants, assessing and treating the parents for psychopathology, engaging the family in wellness, and starting with behavioral management is the way to go. If you feel that medication treatment is necessary for safety of the little ones, it’s best to consult, because none of the medications with FDA indication are likely to be the answer.
Dr. Althoff is associate professor of psychiatry, psychology, and pediatrics at the University of Vermont, Burlington. He is director of the division of behavioral genetics and conducts research on the development of self-regulation in children. Dr. Althoff receives no funding from pharmaceutical companies or industry. He has grant funding from the National Institute of General Medical Sciences and the Klingenstein Third Generation Foundation, and is employed, in part, by the nonprofit Research Center for Children, Youth, and Families that develops the Child Behavior Checklist and associated instruments. E-mail him at [email protected].
Attention deficit/hyperactivity disorder (ADHD) has been identified in children, and appropriate treatments studied now for over half a century. The vast majority of cases that present for treatment do so after the child starts school and concerns are raised about ability to manage academics. Yet, when asked when the symptoms first began, many parents will describe onset prior to the school years – in the preschool period. But identification of ADHD in preschoolers can be difficult because of the developmental changes that are ongoing during the period from 3 to 5 years. Many of the symptoms that one would attribute to ADHD, such as increased motor activity, inattention, and distractibility are commonplace in this age group. Furthermore, some behaviors commonly associated with ADHD, such as emotional lability and obstinacy, are nearly synonymous with being a preschooler. So, how is the diagnosis made? When is it appropriate to treat? And what would that treatment look like? The following case, where symptoms of preschool ADHD go beyond typical development, provides some guides for treatment based on the evolving literature regarding preschool ADHD.
Case Summary
Johnny is a 4-year-old boy who was the product of a complicated pregnancy and delivery. Born at 35 weeks to a 17-year-old mother with a history of tobacco use disorder and depression, he spent several weeks in the special care nursery before leaving the hospital with his mother. His early temperament was described as being “difficult” with frequent episodes of colic and trouble establishing a sleep routine. His father had a history of conduct problems and school failure, and would come in and out of the family for the first 3 years. Lately, he had moved in with Johnny and his mother, and they were trying to “make a go of it.” Johnny had been slightly behind in his developmental milestones – particularly his language – but by 4 years he was able to speak in simple sentences, was able to name his colors, and had started copying circles and squares.
His parents bring Johnny in for an appointment that they made specifically to discuss his activity level and the question of ADHD, which has been brought up by multiple family members and his preschool teacher. They describe some behaviors that you have not heard about previously because they had assumed that “this is what boys did.” At age 3 years, he impulsively ran into the road after being told “no” and was nearly struck by a car. He continually tries to put things into the toaster, and they have had to get “industrial strength” plug covers because he tries to pry them off with a kitchen knife. On multiple occasions, his mother has locked herself in her bedroom because he wouldn’t stop talking to her and she couldn’t stand it anymore. When this happens, she checks often to make sure Johnny is safe, but then calls Johnny’s father home from his job as a delivery driver because she’s at her limit. In fact, Johnny’s father has been called to the preschool to bring Johnny home so many times that his father is in danger of losing his job. While Johnny appears to be a good athlete, he is often picked last for teams because he doesn’t pay attention in the game and likes to “play his own game” of tackling the other children. The stress of raising Johnny is weighing on the parents’ relationship, and Johnny’s father is considering moving out again. The parents ask for an assessment and treatment, preferably with medication.
Case Discussion
Johnny very likely has ADHD. However, to take appropriate caution in the diagnosis, one would consider that he needs to have six of nine criteria of inattention (being careless, difficulty sustaining attention, not listening, not following through, avoiding hard mental tasks, not organizing, losing important items, being easily distractible, and being forgetful) and/or six of nine criteria of hyperactivity/impulsivity (squirming/fidgeting, can’t stay seated, running or climbing excessively, can’t play quietly, “driven by a motor,” talking excessively, blurting out answers, not waiting his turn, and interrupting/intruding on others). As with school-aged ADHD, there need to be symptoms that are frequent (“often”) and that interfere with home, academic, or occupational function. One must take into account the base rate for these symptoms in preschoolers. For example, Willoughby and colleagues (J. Abnorm. Child Psychol. 2012;40:1301-12) demonstrated that at age 4 years, 26.3% of children fidget or squirm, 39.5% act as if “driven by a motor,” 46.3% talk excessively, 28.8% are easily distracted, and 25.4% have difficult waiting their turn. In fact, on average, a 4-year-old will have 1.3 inattentive items and 2.4 hyperactive-impulsive items. Still, Johnny seems to have more than his fair share. This can be validated by a) doing a careful evaluation over time using multiple informants, b) taking a family history, c) looking at developmental signs and ruling out other developmental disorders, d) making physical observations in the office (although these can be deceiving) and e) having the parents and others complete parent and caregiver checklists.
When asking parents and caregivers to complete checklists, it is crucial to make sure that these checklists look for symptoms other than just ADHD, because there are often co-occurring symptoms and disorders. These include oppositional defiant disorder, anxiety, obsessive compulsive disorder, depressive disorders, autism spectrum disorders, trauma, and learning/communication disorders. In fact, the Preschool ADHD Treatment Study (PATS) demonstrated that 71.5% of children with preschool ADHD had at least one other diagnosis and 29.7% had two or more (J. Child Adolesc. Psychopharmacol. 2007;17:563-80). Use of a broad-based instrument that captures all of these domains, in addition to attention, is warranted. In our clinic, we also assess the parents for psychopathology using the same instruments. The reason for this is, first, that family history increases the likelihood of an ADHD diagnosis and, perhaps more importantly, presence of family psychopathology makes treatment more difficult. This is because the treatment you will prescribe is going to actively involve the parents.
The treatment of choice for preschool ADHD, based on practice parameters and expert opinion, is to start with family-based behavioral treatments. There are now several empirically-based treatments that have shown efficacy for the symptoms of inattention and hyperactivity-impulsivity in preschoolers. These include Triple P (“Practitioner’s Manual for Enhanced Triple P” [Brisbane: Families International Publishing, 1998]), The Incredible Years (Webster-Stratton & Hancock, 1998), and the Revised New Forest Parent Program (Daley & Thompson, 2007), among others. If these are not available in your community, other options would be “Helping the noncompliant child: A clinician’s guide to effective parent training,” 2nd ed. (The Guilford Press: New York, 2003) or any other empirically-based parent training program. This is why it is critical to engage the parents in treatment and to refer them for treatment for their own psychopathology, if present. Furthermore, engaging the family in a program of wellness (freedom from substances, enhanced nutrition, avoidance of artificial food coloring, increased exercise), has less of a research base, but the available evidence is that it is helpful.
If medications become necessary because of safety concerns, there are few options that have a Food and Drug Administration indication. Those that do have an indication for disruptive behavior below the age of 5 years (haloperidol, dextroamphetamine, chlorpromazine, and risperidone) should not be considered as first line. The PATS study demonstrated the safety and efficacy of methylphenidate, but with optimal doses lower than those seen in school-aged children (0.7 mg/kg per day) and with increased numbers of adverse effects (11% discontinuing) (J. Am. Acad. Child Adolesc. Psychiatry 2006;45:1284-93; J. Am. Acad. Child Adolesc. Psychiatry 2006;45:1294-303).
Because of the increased amount of side effects, medication treatment cannot be considered as the first treatment. Treatment with nonstimulants is poorly studied. Any treatment with methylphenidate would be considered off-label prescribing, which must be done with great caution and, preferably, in consultation with a child and adolescent psychiatrist.
The diagnosis and management of ADHD in the very young is tricky, but possible. Doing a comprehensive evaluation with information from multiple informants, assessing and treating the parents for psychopathology, engaging the family in wellness, and starting with behavioral management is the way to go. If you feel that medication treatment is necessary for safety of the little ones, it’s best to consult, because none of the medications with FDA indication are likely to be the answer.
Dr. Althoff is associate professor of psychiatry, psychology, and pediatrics at the University of Vermont, Burlington. He is director of the division of behavioral genetics and conducts research on the development of self-regulation in children. Dr. Althoff receives no funding from pharmaceutical companies or industry. He has grant funding from the National Institute of General Medical Sciences and the Klingenstein Third Generation Foundation, and is employed, in part, by the nonprofit Research Center for Children, Youth, and Families that develops the Child Behavior Checklist and associated instruments. E-mail him at [email protected].
Attention deficit/hyperactivity disorder (ADHD) has been identified in children, and appropriate treatments studied now for over half a century. The vast majority of cases that present for treatment do so after the child starts school and concerns are raised about ability to manage academics. Yet, when asked when the symptoms first began, many parents will describe onset prior to the school years – in the preschool period. But identification of ADHD in preschoolers can be difficult because of the developmental changes that are ongoing during the period from 3 to 5 years. Many of the symptoms that one would attribute to ADHD, such as increased motor activity, inattention, and distractibility are commonplace in this age group. Furthermore, some behaviors commonly associated with ADHD, such as emotional lability and obstinacy, are nearly synonymous with being a preschooler. So, how is the diagnosis made? When is it appropriate to treat? And what would that treatment look like? The following case, where symptoms of preschool ADHD go beyond typical development, provides some guides for treatment based on the evolving literature regarding preschool ADHD.
Case Summary
Johnny is a 4-year-old boy who was the product of a complicated pregnancy and delivery. Born at 35 weeks to a 17-year-old mother with a history of tobacco use disorder and depression, he spent several weeks in the special care nursery before leaving the hospital with his mother. His early temperament was described as being “difficult” with frequent episodes of colic and trouble establishing a sleep routine. His father had a history of conduct problems and school failure, and would come in and out of the family for the first 3 years. Lately, he had moved in with Johnny and his mother, and they were trying to “make a go of it.” Johnny had been slightly behind in his developmental milestones – particularly his language – but by 4 years he was able to speak in simple sentences, was able to name his colors, and had started copying circles and squares.
His parents bring Johnny in for an appointment that they made specifically to discuss his activity level and the question of ADHD, which has been brought up by multiple family members and his preschool teacher. They describe some behaviors that you have not heard about previously because they had assumed that “this is what boys did.” At age 3 years, he impulsively ran into the road after being told “no” and was nearly struck by a car. He continually tries to put things into the toaster, and they have had to get “industrial strength” plug covers because he tries to pry them off with a kitchen knife. On multiple occasions, his mother has locked herself in her bedroom because he wouldn’t stop talking to her and she couldn’t stand it anymore. When this happens, she checks often to make sure Johnny is safe, but then calls Johnny’s father home from his job as a delivery driver because she’s at her limit. In fact, Johnny’s father has been called to the preschool to bring Johnny home so many times that his father is in danger of losing his job. While Johnny appears to be a good athlete, he is often picked last for teams because he doesn’t pay attention in the game and likes to “play his own game” of tackling the other children. The stress of raising Johnny is weighing on the parents’ relationship, and Johnny’s father is considering moving out again. The parents ask for an assessment and treatment, preferably with medication.
Case Discussion
Johnny very likely has ADHD. However, to take appropriate caution in the diagnosis, one would consider that he needs to have six of nine criteria of inattention (being careless, difficulty sustaining attention, not listening, not following through, avoiding hard mental tasks, not organizing, losing important items, being easily distractible, and being forgetful) and/or six of nine criteria of hyperactivity/impulsivity (squirming/fidgeting, can’t stay seated, running or climbing excessively, can’t play quietly, “driven by a motor,” talking excessively, blurting out answers, not waiting his turn, and interrupting/intruding on others). As with school-aged ADHD, there need to be symptoms that are frequent (“often”) and that interfere with home, academic, or occupational function. One must take into account the base rate for these symptoms in preschoolers. For example, Willoughby and colleagues (J. Abnorm. Child Psychol. 2012;40:1301-12) demonstrated that at age 4 years, 26.3% of children fidget or squirm, 39.5% act as if “driven by a motor,” 46.3% talk excessively, 28.8% are easily distracted, and 25.4% have difficult waiting their turn. In fact, on average, a 4-year-old will have 1.3 inattentive items and 2.4 hyperactive-impulsive items. Still, Johnny seems to have more than his fair share. This can be validated by a) doing a careful evaluation over time using multiple informants, b) taking a family history, c) looking at developmental signs and ruling out other developmental disorders, d) making physical observations in the office (although these can be deceiving) and e) having the parents and others complete parent and caregiver checklists.
When asking parents and caregivers to complete checklists, it is crucial to make sure that these checklists look for symptoms other than just ADHD, because there are often co-occurring symptoms and disorders. These include oppositional defiant disorder, anxiety, obsessive compulsive disorder, depressive disorders, autism spectrum disorders, trauma, and learning/communication disorders. In fact, the Preschool ADHD Treatment Study (PATS) demonstrated that 71.5% of children with preschool ADHD had at least one other diagnosis and 29.7% had two or more (J. Child Adolesc. Psychopharmacol. 2007;17:563-80). Use of a broad-based instrument that captures all of these domains, in addition to attention, is warranted. In our clinic, we also assess the parents for psychopathology using the same instruments. The reason for this is, first, that family history increases the likelihood of an ADHD diagnosis and, perhaps more importantly, presence of family psychopathology makes treatment more difficult. This is because the treatment you will prescribe is going to actively involve the parents.
The treatment of choice for preschool ADHD, based on practice parameters and expert opinion, is to start with family-based behavioral treatments. There are now several empirically-based treatments that have shown efficacy for the symptoms of inattention and hyperactivity-impulsivity in preschoolers. These include Triple P (“Practitioner’s Manual for Enhanced Triple P” [Brisbane: Families International Publishing, 1998]), The Incredible Years (Webster-Stratton & Hancock, 1998), and the Revised New Forest Parent Program (Daley & Thompson, 2007), among others. If these are not available in your community, other options would be “Helping the noncompliant child: A clinician’s guide to effective parent training,” 2nd ed. (The Guilford Press: New York, 2003) or any other empirically-based parent training program. This is why it is critical to engage the parents in treatment and to refer them for treatment for their own psychopathology, if present. Furthermore, engaging the family in a program of wellness (freedom from substances, enhanced nutrition, avoidance of artificial food coloring, increased exercise), has less of a research base, but the available evidence is that it is helpful.
If medications become necessary because of safety concerns, there are few options that have a Food and Drug Administration indication. Those that do have an indication for disruptive behavior below the age of 5 years (haloperidol, dextroamphetamine, chlorpromazine, and risperidone) should not be considered as first line. The PATS study demonstrated the safety and efficacy of methylphenidate, but with optimal doses lower than those seen in school-aged children (0.7 mg/kg per day) and with increased numbers of adverse effects (11% discontinuing) (J. Am. Acad. Child Adolesc. Psychiatry 2006;45:1284-93; J. Am. Acad. Child Adolesc. Psychiatry 2006;45:1294-303).
Because of the increased amount of side effects, medication treatment cannot be considered as the first treatment. Treatment with nonstimulants is poorly studied. Any treatment with methylphenidate would be considered off-label prescribing, which must be done with great caution and, preferably, in consultation with a child and adolescent psychiatrist.
The diagnosis and management of ADHD in the very young is tricky, but possible. Doing a comprehensive evaluation with information from multiple informants, assessing and treating the parents for psychopathology, engaging the family in wellness, and starting with behavioral management is the way to go. If you feel that medication treatment is necessary for safety of the little ones, it’s best to consult, because none of the medications with FDA indication are likely to be the answer.
Dr. Althoff is associate professor of psychiatry, psychology, and pediatrics at the University of Vermont, Burlington. He is director of the division of behavioral genetics and conducts research on the development of self-regulation in children. Dr. Althoff receives no funding from pharmaceutical companies or industry. He has grant funding from the National Institute of General Medical Sciences and the Klingenstein Third Generation Foundation, and is employed, in part, by the nonprofit Research Center for Children, Youth, and Families that develops the Child Behavior Checklist and associated instruments. E-mail him at [email protected].

Dexrazoxane Tx did not affect overall survival in pediatric leukemia and lymphoma
Exposure to dexrazoxane among pediatric patients with leukemia or lymphoma did not affect overall mortality during a median follow-up period of 12.6 years, according to a report published online in the Journal of Clinical Oncology.
Aggregated data from three Children’s Oncology Group trials showed that among 1,008 pediatric patients who received treatment with doxorubicin with or without dexrazoxane (DRZ) from 1996 to 2001, exposure to DRZ was not associated with an increased risk of relapse (HR, 0.81; 95% CI, 0.60-1.08) or death (HR, 1.03; 0.73-1.45). Comparing DRZ with non-DRZ treatment groups at 10 years, the cumulative incidence of relapse was 16.1% vs. 19.1% (difference, – 3.0%; 95% CI, – 7.9% to 0.2%) and overall mortality was 12.8% vs. 12.2% (difference, – 0.6%; 95% CI, – 3.5% to 4.7%). The three trials (P9404, P9425, and P9426) evaluated individually likewise did not show significant differences in relapse or mortality rates.
Although studies in adults show a positive effect of DRZ on heart failure rates after anthracycline therapy, concern over DRZ interference with cancer therapies and a possible link to second cancers have limited its use in children and prompted Dr. Eric Chow of the Fred Hutchinson Cancer Research Center, Seattle, and his colleagues to assess the effect of DRZ on mortality.
The investigators wrote that DRZ “does not appear to interfere with cancer treatment efficacy, in terms of original cancer mortality or overall risk of relapse. Although the risk for secondary cancer mortality (mainly as a result of AML/MDS [acute myeloid leukemia/myelodysplastic syndrome]) was greater among those exposed to DRZ, the overall number of events was small, and the differences were not statistically significant,” the investigators said. (J. Clin. Oncol. 2015 May 26 [doi:10.1200/JCO.2014.59.4473])
Aggregated data from the three trials shows that the 10-year mortality rate of AML/MDS was 1.4% for those treated with DRZ (seven patients), compared with 0.8% for those treated without DRZ (five patients).
The beneficial effects of DRZ in decreasing the risk of heart failure have been observed in trials of adult patients, but the results for survivors of childhood cancers have been inconclusive because heart failure may develop over a longer time period in children. With the median age of survivors in this study of 24 years, significant differences in cardiac mortality due to DRZ use are not detectable. To evaluate DRZ as a cardioprotectant, a new Children’s Oncology Group study (Effects of Dexrazoxane Hydrochloride on Biomarkers Associated With Cardiomyopathy and Heart Failure After Cancer Treatment [HEART]) will determine the cardiovascular health of individuals in the three trials P9404, P9425, and P9426.
“Given that second cancers and symptomatic cardiac disease appear to be by far the two most common categories of serious late effects (in terms of both absolute and relative risks) among long-term childhood cancer survivors as a group … with cumulative incidences of each approaching 20% by age 50 years, any strategy that offers the promise of reduced cardiotoxicity without being offset by second cancers is highly attractive,” Dr. Chow and his associates wrote.
The study was supported by the National Institutes of Health, St. Baldrick’s Foundation, and the Leukemia and Lymphoma Society. Dr. Chow reported having no relevant financial conflicts. Three of his coauthors reported having financial relationships with industry.
Exposure to dexrazoxane among pediatric patients with leukemia or lymphoma did not affect overall mortality during a median follow-up period of 12.6 years, according to a report published online in the Journal of Clinical Oncology.
Aggregated data from three Children’s Oncology Group trials showed that among 1,008 pediatric patients who received treatment with doxorubicin with or without dexrazoxane (DRZ) from 1996 to 2001, exposure to DRZ was not associated with an increased risk of relapse (HR, 0.81; 95% CI, 0.60-1.08) or death (HR, 1.03; 0.73-1.45). Comparing DRZ with non-DRZ treatment groups at 10 years, the cumulative incidence of relapse was 16.1% vs. 19.1% (difference, – 3.0%; 95% CI, – 7.9% to 0.2%) and overall mortality was 12.8% vs. 12.2% (difference, – 0.6%; 95% CI, – 3.5% to 4.7%). The three trials (P9404, P9425, and P9426) evaluated individually likewise did not show significant differences in relapse or mortality rates.
Although studies in adults show a positive effect of DRZ on heart failure rates after anthracycline therapy, concern over DRZ interference with cancer therapies and a possible link to second cancers have limited its use in children and prompted Dr. Eric Chow of the Fred Hutchinson Cancer Research Center, Seattle, and his colleagues to assess the effect of DRZ on mortality.
The investigators wrote that DRZ “does not appear to interfere with cancer treatment efficacy, in terms of original cancer mortality or overall risk of relapse. Although the risk for secondary cancer mortality (mainly as a result of AML/MDS [acute myeloid leukemia/myelodysplastic syndrome]) was greater among those exposed to DRZ, the overall number of events was small, and the differences were not statistically significant,” the investigators said. (J. Clin. Oncol. 2015 May 26 [doi:10.1200/JCO.2014.59.4473])
Aggregated data from the three trials shows that the 10-year mortality rate of AML/MDS was 1.4% for those treated with DRZ (seven patients), compared with 0.8% for those treated without DRZ (five patients).
The beneficial effects of DRZ in decreasing the risk of heart failure have been observed in trials of adult patients, but the results for survivors of childhood cancers have been inconclusive because heart failure may develop over a longer time period in children. With the median age of survivors in this study of 24 years, significant differences in cardiac mortality due to DRZ use are not detectable. To evaluate DRZ as a cardioprotectant, a new Children’s Oncology Group study (Effects of Dexrazoxane Hydrochloride on Biomarkers Associated With Cardiomyopathy and Heart Failure After Cancer Treatment [HEART]) will determine the cardiovascular health of individuals in the three trials P9404, P9425, and P9426.
“Given that second cancers and symptomatic cardiac disease appear to be by far the two most common categories of serious late effects (in terms of both absolute and relative risks) among long-term childhood cancer survivors as a group … with cumulative incidences of each approaching 20% by age 50 years, any strategy that offers the promise of reduced cardiotoxicity without being offset by second cancers is highly attractive,” Dr. Chow and his associates wrote.
The study was supported by the National Institutes of Health, St. Baldrick’s Foundation, and the Leukemia and Lymphoma Society. Dr. Chow reported having no relevant financial conflicts. Three of his coauthors reported having financial relationships with industry.
Exposure to dexrazoxane among pediatric patients with leukemia or lymphoma did not affect overall mortality during a median follow-up period of 12.6 years, according to a report published online in the Journal of Clinical Oncology.
Aggregated data from three Children’s Oncology Group trials showed that among 1,008 pediatric patients who received treatment with doxorubicin with or without dexrazoxane (DRZ) from 1996 to 2001, exposure to DRZ was not associated with an increased risk of relapse (HR, 0.81; 95% CI, 0.60-1.08) or death (HR, 1.03; 0.73-1.45). Comparing DRZ with non-DRZ treatment groups at 10 years, the cumulative incidence of relapse was 16.1% vs. 19.1% (difference, – 3.0%; 95% CI, – 7.9% to 0.2%) and overall mortality was 12.8% vs. 12.2% (difference, – 0.6%; 95% CI, – 3.5% to 4.7%). The three trials (P9404, P9425, and P9426) evaluated individually likewise did not show significant differences in relapse or mortality rates.
Although studies in adults show a positive effect of DRZ on heart failure rates after anthracycline therapy, concern over DRZ interference with cancer therapies and a possible link to second cancers have limited its use in children and prompted Dr. Eric Chow of the Fred Hutchinson Cancer Research Center, Seattle, and his colleagues to assess the effect of DRZ on mortality.
The investigators wrote that DRZ “does not appear to interfere with cancer treatment efficacy, in terms of original cancer mortality or overall risk of relapse. Although the risk for secondary cancer mortality (mainly as a result of AML/MDS [acute myeloid leukemia/myelodysplastic syndrome]) was greater among those exposed to DRZ, the overall number of events was small, and the differences were not statistically significant,” the investigators said. (J. Clin. Oncol. 2015 May 26 [doi:10.1200/JCO.2014.59.4473])
Aggregated data from the three trials shows that the 10-year mortality rate of AML/MDS was 1.4% for those treated with DRZ (seven patients), compared with 0.8% for those treated without DRZ (five patients).
The beneficial effects of DRZ in decreasing the risk of heart failure have been observed in trials of adult patients, but the results for survivors of childhood cancers have been inconclusive because heart failure may develop over a longer time period in children. With the median age of survivors in this study of 24 years, significant differences in cardiac mortality due to DRZ use are not detectable. To evaluate DRZ as a cardioprotectant, a new Children’s Oncology Group study (Effects of Dexrazoxane Hydrochloride on Biomarkers Associated With Cardiomyopathy and Heart Failure After Cancer Treatment [HEART]) will determine the cardiovascular health of individuals in the three trials P9404, P9425, and P9426.
“Given that second cancers and symptomatic cardiac disease appear to be by far the two most common categories of serious late effects (in terms of both absolute and relative risks) among long-term childhood cancer survivors as a group … with cumulative incidences of each approaching 20% by age 50 years, any strategy that offers the promise of reduced cardiotoxicity without being offset by second cancers is highly attractive,” Dr. Chow and his associates wrote.
The study was supported by the National Institutes of Health, St. Baldrick’s Foundation, and the Leukemia and Lymphoma Society. Dr. Chow reported having no relevant financial conflicts. Three of his coauthors reported having financial relationships with industry.
FROM JOURNAL OF CLINICAL ONCOLOGY
Key clinical point: Treatment with dexrazoxane was not associated with an increased risk for cancer relapse or death.
Major finding: For pediatric patients with leukemia and lymphoma, the cumulative incidence of relapse at 10 years was 16.1% with DRZ, compared with 19.1% without DRZ (difference, – 3.0%; 95% CI, – 7.9% to 0.2%); overall mortality was 12.8% with DRZ vs. 12.2% without DRZ (difference, – 0.6%; 95% CI, – 3.5% to 4.7%).
Data source: Aggregated Children’s Oncology Group trials enrolling 1,008 pediatric patients with leukemia or lymphoma who were randomized to receive doxorubicin with or without DRZ from 1996 to 2001.
Disclosures: The study was supported by the National Institutes of Health, St. Baldrick’s Foundation, and the Leukemia and Lymphoma Society. Dr. Chow reported having no relevant financial conflicts. Three of his coauthors reported having financial relationships with industry.
HRS: Meta-analyses strengthen obesity–atrial fib link
BOSTON– The already-firm evidence implicating obesity in boosting both the incidence and severity of atrial fibrillation grew even stronger with results from four meta-analyses that comprised 51 controlled studies involving a total of more than 600,000 people.
“We should pay more attention to using weight reduction strategies to prevent AF [atrial fibrillation] and to reduce its burden in patients with obesity and established AF,” Dr. Dennis H. Lau said at the annual scientific sessions of the Heart Rhythm Society.
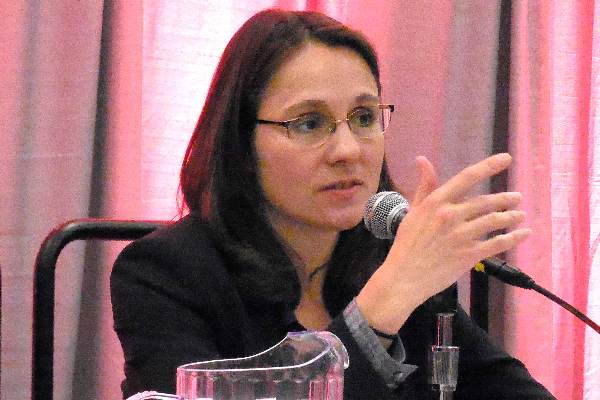
Physicians are increasingly aware of the strong evidence linking obesity and atrial fibrillation incidence and severity, said Dr. Christine M. Albert, director of the Center for Arrhythmia Prevention at Brigham and Women’s Hospital, Boston. The existence of this link is “really important because it is something we can offer patients,” Dr. Albert said in an interview. Obesity interventions provide a way to intervene in patients with, or at risk for, atrial fibrillation that goes beyond atrial ablation and antiarrhythmic drugs to reduce symptoms and help patients feel better, she noted.
Dr. Lau and his associates reviewed the published medical literature through January 2012 and identified 51 studies that examined the link between obesity and AF in a total of 626,603 people.
They found 16 studies with 5,864 patients that assessed the link between obesity and AF recurrence following atrial ablation treatment and found a statistically significant 13% increased rate of recurrent AF for every 5-unit rise in body mass index, Dr. Lau reported.

They also identified 12 studies on the impact of obesity in 62,160 patients who underwent cardiac surgery that collectively showed a statistically significant 10% higher incidence of postoperative AF for every additional 5 BMI units.
The researchers found nine studies of the role of obesity in new-onset AF in cohort analyses with a total of 157,518 patients that showed an overall, statistically significant 29% rise in AF incidence for every 5 additional BMI units. And in 14 case-control studies with 401,061 patients, the rate of new-onset AF increased by a statistically significant 19% for every 5-unit rise in BMI.
These findings fit into an already substantial body of evidence documenting a significant link between obesity and AF, said Dr. Lau, director of the cardiac pacing unit at the Royal Adelaide (Australia) Hospital. For example, an analysis of 14,598 Americans enrolled in the Atherosclerosis Risk in Communities (ARIC) study found that 18% of the 1,520 new cases of AF that occurred in this cohort during an average 17 years of follow-up could be attributed to obesity or overweight (Circulation 2011;123:1501-8). Data collected from 34,309 women enrolled in the Women’s Health Study who had 834 cases of incident AF during an average 13-year follow-up showed that every 1-unit increase in BMI was linked to a 5% increased risk for AF, and that obese women had an overall 65% higher incidence of AF than did women with a normal BMI (J. Am Coll. Cardiol. 2010;55:2319-27).
And Dr. Lau and his associates recently published a review of 355 patients with AF and a baseline BMI of at least 27 kg/m2 who participated in a weight-management program. After 5 years, patients who lost at least 10% of their baseline weight had an 86% rate of arrhythmia-free survival, compared with a 40% rate in patients who either lost less than 3% of their baseline weight or gained weight. In a multivariate analysis, weight loss of at least 10% linked with a statistically significant sixfold increase in arrhythmia-free survival, compared with all the other patients in the analysis (J. Am. Coll. Cardiol. 2015;65:2159-69).
Dr. Lau also cited findings from animal studies by his group that point to a direct role for obesity, and specifically deposits of epicardial fat in causing AF. Their model uses overfed sheep, and his group found that a higher burden of epicardial fat leads to fat infiltration into the myocardium, including atrial tissue. “We postulate that this fat contributes to conduction heterogeneity, increased re-entry, increased susceptibility to AF, and increased duration of AF episodes,” he said.
“It’s quite clear that obesity itself is important because, for example, the sheep do not develop sleep apnea, and they have only marginally elevated blood pressures. Using this animal model, we are quite convinced that obesity itself is an important risk factor.”
Dr. Lau added that results from recent sheep studies showed that after previously obese sheep lose their excess weight their atrial abnormalities revert to normal.
On Twitter @mitchelzoler
BOSTON– The already-firm evidence implicating obesity in boosting both the incidence and severity of atrial fibrillation grew even stronger with results from four meta-analyses that comprised 51 controlled studies involving a total of more than 600,000 people.
“We should pay more attention to using weight reduction strategies to prevent AF [atrial fibrillation] and to reduce its burden in patients with obesity and established AF,” Dr. Dennis H. Lau said at the annual scientific sessions of the Heart Rhythm Society.
Physicians are increasingly aware of the strong evidence linking obesity and atrial fibrillation incidence and severity, said Dr. Christine M. Albert, director of the Center for Arrhythmia Prevention at Brigham and Women’s Hospital, Boston. The existence of this link is “really important because it is something we can offer patients,” Dr. Albert said in an interview. Obesity interventions provide a way to intervene in patients with, or at risk for, atrial fibrillation that goes beyond atrial ablation and antiarrhythmic drugs to reduce symptoms and help patients feel better, she noted.
Dr. Lau and his associates reviewed the published medical literature through January 2012 and identified 51 studies that examined the link between obesity and AF in a total of 626,603 people.
They found 16 studies with 5,864 patients that assessed the link between obesity and AF recurrence following atrial ablation treatment and found a statistically significant 13% increased rate of recurrent AF for every 5-unit rise in body mass index, Dr. Lau reported.
They also identified 12 studies on the impact of obesity in 62,160 patients who underwent cardiac surgery that collectively showed a statistically significant 10% higher incidence of postoperative AF for every additional 5 BMI units.
The researchers found nine studies of the role of obesity in new-onset AF in cohort analyses with a total of 157,518 patients that showed an overall, statistically significant 29% rise in AF incidence for every 5 additional BMI units. And in 14 case-control studies with 401,061 patients, the rate of new-onset AF increased by a statistically significant 19% for every 5-unit rise in BMI.
These findings fit into an already substantial body of evidence documenting a significant link between obesity and AF, said Dr. Lau, director of the cardiac pacing unit at the Royal Adelaide (Australia) Hospital. For example, an analysis of 14,598 Americans enrolled in the Atherosclerosis Risk in Communities (ARIC) study found that 18% of the 1,520 new cases of AF that occurred in this cohort during an average 17 years of follow-up could be attributed to obesity or overweight (Circulation 2011;123:1501-8). Data collected from 34,309 women enrolled in the Women’s Health Study who had 834 cases of incident AF during an average 13-year follow-up showed that every 1-unit increase in BMI was linked to a 5% increased risk for AF, and that obese women had an overall 65% higher incidence of AF than did women with a normal BMI (J. Am Coll. Cardiol. 2010;55:2319-27).
And Dr. Lau and his associates recently published a review of 355 patients with AF and a baseline BMI of at least 27 kg/m2 who participated in a weight-management program. After 5 years, patients who lost at least 10% of their baseline weight had an 86% rate of arrhythmia-free survival, compared with a 40% rate in patients who either lost less than 3% of their baseline weight or gained weight. In a multivariate analysis, weight loss of at least 10% linked with a statistically significant sixfold increase in arrhythmia-free survival, compared with all the other patients in the analysis (J. Am. Coll. Cardiol. 2015;65:2159-69).
Dr. Lau also cited findings from animal studies by his group that point to a direct role for obesity, and specifically deposits of epicardial fat in causing AF. Their model uses overfed sheep, and his group found that a higher burden of epicardial fat leads to fat infiltration into the myocardium, including atrial tissue. “We postulate that this fat contributes to conduction heterogeneity, increased re-entry, increased susceptibility to AF, and increased duration of AF episodes,” he said.
“It’s quite clear that obesity itself is important because, for example, the sheep do not develop sleep apnea, and they have only marginally elevated blood pressures. Using this animal model, we are quite convinced that obesity itself is an important risk factor.”
Dr. Lau added that results from recent sheep studies showed that after previously obese sheep lose their excess weight their atrial abnormalities revert to normal.
On Twitter @mitchelzoler
BOSTON– The already-firm evidence implicating obesity in boosting both the incidence and severity of atrial fibrillation grew even stronger with results from four meta-analyses that comprised 51 controlled studies involving a total of more than 600,000 people.
“We should pay more attention to using weight reduction strategies to prevent AF [atrial fibrillation] and to reduce its burden in patients with obesity and established AF,” Dr. Dennis H. Lau said at the annual scientific sessions of the Heart Rhythm Society.
Physicians are increasingly aware of the strong evidence linking obesity and atrial fibrillation incidence and severity, said Dr. Christine M. Albert, director of the Center for Arrhythmia Prevention at Brigham and Women’s Hospital, Boston. The existence of this link is “really important because it is something we can offer patients,” Dr. Albert said in an interview. Obesity interventions provide a way to intervene in patients with, or at risk for, atrial fibrillation that goes beyond atrial ablation and antiarrhythmic drugs to reduce symptoms and help patients feel better, she noted.
Dr. Lau and his associates reviewed the published medical literature through January 2012 and identified 51 studies that examined the link between obesity and AF in a total of 626,603 people.
They found 16 studies with 5,864 patients that assessed the link between obesity and AF recurrence following atrial ablation treatment and found a statistically significant 13% increased rate of recurrent AF for every 5-unit rise in body mass index, Dr. Lau reported.
They also identified 12 studies on the impact of obesity in 62,160 patients who underwent cardiac surgery that collectively showed a statistically significant 10% higher incidence of postoperative AF for every additional 5 BMI units.
The researchers found nine studies of the role of obesity in new-onset AF in cohort analyses with a total of 157,518 patients that showed an overall, statistically significant 29% rise in AF incidence for every 5 additional BMI units. And in 14 case-control studies with 401,061 patients, the rate of new-onset AF increased by a statistically significant 19% for every 5-unit rise in BMI.
These findings fit into an already substantial body of evidence documenting a significant link between obesity and AF, said Dr. Lau, director of the cardiac pacing unit at the Royal Adelaide (Australia) Hospital. For example, an analysis of 14,598 Americans enrolled in the Atherosclerosis Risk in Communities (ARIC) study found that 18% of the 1,520 new cases of AF that occurred in this cohort during an average 17 years of follow-up could be attributed to obesity or overweight (Circulation 2011;123:1501-8). Data collected from 34,309 women enrolled in the Women’s Health Study who had 834 cases of incident AF during an average 13-year follow-up showed that every 1-unit increase in BMI was linked to a 5% increased risk for AF, and that obese women had an overall 65% higher incidence of AF than did women with a normal BMI (J. Am Coll. Cardiol. 2010;55:2319-27).
And Dr. Lau and his associates recently published a review of 355 patients with AF and a baseline BMI of at least 27 kg/m2 who participated in a weight-management program. After 5 years, patients who lost at least 10% of their baseline weight had an 86% rate of arrhythmia-free survival, compared with a 40% rate in patients who either lost less than 3% of their baseline weight or gained weight. In a multivariate analysis, weight loss of at least 10% linked with a statistically significant sixfold increase in arrhythmia-free survival, compared with all the other patients in the analysis (J. Am. Coll. Cardiol. 2015;65:2159-69).
Dr. Lau also cited findings from animal studies by his group that point to a direct role for obesity, and specifically deposits of epicardial fat in causing AF. Their model uses overfed sheep, and his group found that a higher burden of epicardial fat leads to fat infiltration into the myocardium, including atrial tissue. “We postulate that this fat contributes to conduction heterogeneity, increased re-entry, increased susceptibility to AF, and increased duration of AF episodes,” he said.
“It’s quite clear that obesity itself is important because, for example, the sheep do not develop sleep apnea, and they have only marginally elevated blood pressures. Using this animal model, we are quite convinced that obesity itself is an important risk factor.”
Dr. Lau added that results from recent sheep studies showed that after previously obese sheep lose their excess weight their atrial abnormalities revert to normal.
On Twitter @mitchelzoler
AT HEART RHYTHM 2015
Key clinical point: Four meta-analyses that together included 51 controlled studies provide further evidence that obesity boosts the risk for new-onset atrial fibrillation.
Major finding: For every 5-unit rise in body mass index, the incidence of atrial fibrillation increased by 10%-29%.
Data source: Meta-analyses of 51 controlled studies involving a total of 626,603 people.
Disclosures: Dr. Lau and Dr. Albert had no relevant disclosures.

Subclinical hyperthyroidism linked to higher fracture risk
Individuals with subclinical hyperthyroidism are at increased risk of hip and other fractures, according to the authors of a meta-analysis.
Researchers examined data from 70,298 individuals – 4,092 with subclinical hypothyroidism and 2,219 with subclinical hyperthyroidism – enrolled in 13 prospective cohort studies.
After adjusting for age, sex, and other fracture risk factors, the researchers found that individuals with subclinical hyperthyroidism had a 28% increase in the risk of any fracture and a 36% increased risk of hip fracture compared to individuals with normal thyroid function.
Subclinical hyperthyroidism – defined as a thyroid-stimulating hormone (TSH) level of less than 0.45 mIU/L with normal FT4 levels – was also associated with a 16% increase in the risk of nonspine fracture, according to a paper published online in the May 26 edition of JAMA.
Men with subclinical hyperthyroidism had a more than 3.5-fold increased in the risk of spine fracture, but the increase was not significant in women.
Lower TSH was associated with higher fracture rates, and the analysis showed a 61% increase in the risk of hip fracture and more than a 3.5-fold increase in spine fracture risk among individuals with a TSH less than 0.10 mIU/L.
The analysis yielded no link between subclinical hypothyroidism and fracture risk, and a comparison of fracture risk between individuals treated with thyroxine at baseline and untreated participants also showed no impact of thyroxine therapy on fracture outcomes (JAMA 2015, May 26 [doi:10.1001/jama.2015.5161].
“In prospective cohort studies, data about the association between subclinical thyroid dysfunction and fracture risk are in conflict because of inclusion of participants with overt thyroid disease and small sample sizes of participants with thyroid dysfunction or fracture events,” wrote Dr. Manuel R. Blum of Bern University Hospital, Switzerland, and an international team of coauthors.
They proposed three mechanisms by which thyroid dysfunction may affect fracture risk.
“First, thyroid hormones have been shown to have effects on osteoclasts and osteoblasts, with thyroid status in the upper normal range or excess thyroid hormones leading to accelerated bone turnover with bone loss and increased fracture risk,” they wrote.
Subclinical hyperthyroidism may also increase the risk of falls by affecting muscle strength and coordination, and thyroxine supplementation was also suggested as impacting fracture risk.
“Endogenous subclinical hyperthyroidism may be undetected for years because symptoms of subclinical hyperthyroidism are often nonspecific or absent,” the authors wrote. “This phenomenon has the potential to lead to a greater length of time for adverse associations with bone metabolism.”
The authors stressed the limitations of the observational data; for example, that thyroid function was assessed only at baseline and that some individuals may have progressed to overt thyroid dysfunction over the course of the study, and a lack of uniform definition of fracture type across the cohorts.
They said their findings supported current guideline recommendations that anyone aged 65 years or older, with subclinical hyperthyroidism and a TSH persistently lower than 0.1 mIU/L, should be treated, and treatment should be considered in those individuals with low TSH but still above 0.1 mIU/L.
The Swiss National Science Foundation and Swiss Heart Foundation supported the study. Some authors disclosed personal fees, grants and funding from a range of pharmaceutical companies.
Individuals with subclinical hyperthyroidism are at increased risk of hip and other fractures, according to the authors of a meta-analysis.
Researchers examined data from 70,298 individuals – 4,092 with subclinical hypothyroidism and 2,219 with subclinical hyperthyroidism – enrolled in 13 prospective cohort studies.
After adjusting for age, sex, and other fracture risk factors, the researchers found that individuals with subclinical hyperthyroidism had a 28% increase in the risk of any fracture and a 36% increased risk of hip fracture compared to individuals with normal thyroid function.
Subclinical hyperthyroidism – defined as a thyroid-stimulating hormone (TSH) level of less than 0.45 mIU/L with normal FT4 levels – was also associated with a 16% increase in the risk of nonspine fracture, according to a paper published online in the May 26 edition of JAMA.
Men with subclinical hyperthyroidism had a more than 3.5-fold increased in the risk of spine fracture, but the increase was not significant in women.
Lower TSH was associated with higher fracture rates, and the analysis showed a 61% increase in the risk of hip fracture and more than a 3.5-fold increase in spine fracture risk among individuals with a TSH less than 0.10 mIU/L.
The analysis yielded no link between subclinical hypothyroidism and fracture risk, and a comparison of fracture risk between individuals treated with thyroxine at baseline and untreated participants also showed no impact of thyroxine therapy on fracture outcomes (JAMA 2015, May 26 [doi:10.1001/jama.2015.5161].
“In prospective cohort studies, data about the association between subclinical thyroid dysfunction and fracture risk are in conflict because of inclusion of participants with overt thyroid disease and small sample sizes of participants with thyroid dysfunction or fracture events,” wrote Dr. Manuel R. Blum of Bern University Hospital, Switzerland, and an international team of coauthors.
They proposed three mechanisms by which thyroid dysfunction may affect fracture risk.
“First, thyroid hormones have been shown to have effects on osteoclasts and osteoblasts, with thyroid status in the upper normal range or excess thyroid hormones leading to accelerated bone turnover with bone loss and increased fracture risk,” they wrote.
Subclinical hyperthyroidism may also increase the risk of falls by affecting muscle strength and coordination, and thyroxine supplementation was also suggested as impacting fracture risk.
“Endogenous subclinical hyperthyroidism may be undetected for years because symptoms of subclinical hyperthyroidism are often nonspecific or absent,” the authors wrote. “This phenomenon has the potential to lead to a greater length of time for adverse associations with bone metabolism.”
The authors stressed the limitations of the observational data; for example, that thyroid function was assessed only at baseline and that some individuals may have progressed to overt thyroid dysfunction over the course of the study, and a lack of uniform definition of fracture type across the cohorts.
They said their findings supported current guideline recommendations that anyone aged 65 years or older, with subclinical hyperthyroidism and a TSH persistently lower than 0.1 mIU/L, should be treated, and treatment should be considered in those individuals with low TSH but still above 0.1 mIU/L.
The Swiss National Science Foundation and Swiss Heart Foundation supported the study. Some authors disclosed personal fees, grants and funding from a range of pharmaceutical companies.
Individuals with subclinical hyperthyroidism are at increased risk of hip and other fractures, according to the authors of a meta-analysis.
Researchers examined data from 70,298 individuals – 4,092 with subclinical hypothyroidism and 2,219 with subclinical hyperthyroidism – enrolled in 13 prospective cohort studies.
After adjusting for age, sex, and other fracture risk factors, the researchers found that individuals with subclinical hyperthyroidism had a 28% increase in the risk of any fracture and a 36% increased risk of hip fracture compared to individuals with normal thyroid function.
Subclinical hyperthyroidism – defined as a thyroid-stimulating hormone (TSH) level of less than 0.45 mIU/L with normal FT4 levels – was also associated with a 16% increase in the risk of nonspine fracture, according to a paper published online in the May 26 edition of JAMA.
Men with subclinical hyperthyroidism had a more than 3.5-fold increased in the risk of spine fracture, but the increase was not significant in women.
Lower TSH was associated with higher fracture rates, and the analysis showed a 61% increase in the risk of hip fracture and more than a 3.5-fold increase in spine fracture risk among individuals with a TSH less than 0.10 mIU/L.
The analysis yielded no link between subclinical hypothyroidism and fracture risk, and a comparison of fracture risk between individuals treated with thyroxine at baseline and untreated participants also showed no impact of thyroxine therapy on fracture outcomes (JAMA 2015, May 26 [doi:10.1001/jama.2015.5161].
“In prospective cohort studies, data about the association between subclinical thyroid dysfunction and fracture risk are in conflict because of inclusion of participants with overt thyroid disease and small sample sizes of participants with thyroid dysfunction or fracture events,” wrote Dr. Manuel R. Blum of Bern University Hospital, Switzerland, and an international team of coauthors.
They proposed three mechanisms by which thyroid dysfunction may affect fracture risk.
“First, thyroid hormones have been shown to have effects on osteoclasts and osteoblasts, with thyroid status in the upper normal range or excess thyroid hormones leading to accelerated bone turnover with bone loss and increased fracture risk,” they wrote.
Subclinical hyperthyroidism may also increase the risk of falls by affecting muscle strength and coordination, and thyroxine supplementation was also suggested as impacting fracture risk.
“Endogenous subclinical hyperthyroidism may be undetected for years because symptoms of subclinical hyperthyroidism are often nonspecific or absent,” the authors wrote. “This phenomenon has the potential to lead to a greater length of time for adverse associations with bone metabolism.”
The authors stressed the limitations of the observational data; for example, that thyroid function was assessed only at baseline and that some individuals may have progressed to overt thyroid dysfunction over the course of the study, and a lack of uniform definition of fracture type across the cohorts.
They said their findings supported current guideline recommendations that anyone aged 65 years or older, with subclinical hyperthyroidism and a TSH persistently lower than 0.1 mIU/L, should be treated, and treatment should be considered in those individuals with low TSH but still above 0.1 mIU/L.
The Swiss National Science Foundation and Swiss Heart Foundation supported the study. Some authors disclosed personal fees, grants and funding from a range of pharmaceutical companies.
FROM JAMA
Key clinical point: Subclinical hyperthyroidism is associated with an increased risk of hip and other fractures.
Major finding: Individuals with subclinical hyperthyroidism had a 28% increase in their risk of any fracture compared to individuals with normal thyroid function.
Data source: A meta-analysis of 13 prospective cohort studies comprising 70,298 individuals.
Disclosures: The Swiss National Science Foundation and Swiss Heart Foundation supported the study. Some authors disclosed personal fees, grants, and funding from a range of pharmaceutical companies.
Warfarin bridge therapy ups bleeding risk, with no reduction in VTE
Bridge therapy for warfarin patients undergoing invasive therapy is unnecessary for most, said investigators who found an increased risk of bleeding associated with the use of short-acting anticoagulant at the time of the procedure.
A retrospective cohort study of 1,812 procedures in 1,178 patients – most of whom were considered to be at low risk of venous thromboembolism recurrence – showed a 17-fold increase in the risk of clinically relevant bleeding in the group that received bridge anticoagulant therapy, compared with the group that didn’t (2.7% vs. 0.2%).

There was, however, no significant difference in the rate of recurrent venous thromboembolism between the bridge-therapy and non–bridge-therapy groups (0 vs. 3), and no deaths were observed in either group, according to an article published online May 26 (JAMA Intern. Med. [doi:10.1001/jamainternmed.2015.1843].
“Our results confirm and strengthen the findings of those previous studies and highlight the need for a risk categorization scheme that identifies patients at highest risk for recurrent VTE who may benefit from bridge therapy,” wrote Thomas Delate, Ph.D., from Kaiser Permanente Colorado, and coauthors.
The study was conducted and supported by Kaiser Permanente Colorado. One author reported consultancies with Astra-Zeneca, Boehringer-Ingelheim, Pfizer, and Sanofi.

|
| Dr. Daniel J. Brotman |
There are undoubtedly some patients at such high risk for recurrent venous thromboembolism that bridge therapy is a necessary evil, such as those with acute VTE in the preceding month and those with a prior pattern of brisk VTE recurrence during short-term interruption of anticoagulation therapy.
However, for the vast majority of patients receiving oral anticoagulants for VTE, it is probably safer to simply allow the oral anticoagulant to wash out before the procedure and, if indicated based on the type of surgery, to use routine prophylactic-dose anticoagulation therapy afterward.
Dr. Daniel J. Brotman and Dr. Michael B. Streiff are from Johns Hopkins University, Baltimore. These comments are taken from an accompanying editorial (JAMA Intern. Med. 2015 May 26 [doi:10.1001/jamainternmed.2015.1858]). Dr Streiff declared research funding from Bristol-Myers Squibb and Portola and consultancies for Boehringer-Ingelheim, Daiichi-Sankyo, Eisai, Janssen HealthCare, Pfizer, and Sanofi.
|
|
| Dr. Daniel J. Brotman |
There are undoubtedly some patients at such high risk for recurrent venous thromboembolism that bridge therapy is a necessary evil, such as those with acute VTE in the preceding month and those with a prior pattern of brisk VTE recurrence during short-term interruption of anticoagulation therapy.
However, for the vast majority of patients receiving oral anticoagulants for VTE, it is probably safer to simply allow the oral anticoagulant to wash out before the procedure and, if indicated based on the type of surgery, to use routine prophylactic-dose anticoagulation therapy afterward.
Dr. Daniel J. Brotman and Dr. Michael B. Streiff are from Johns Hopkins University, Baltimore. These comments are taken from an accompanying editorial (JAMA Intern. Med. 2015 May 26 [doi:10.1001/jamainternmed.2015.1858]). Dr Streiff declared research funding from Bristol-Myers Squibb and Portola and consultancies for Boehringer-Ingelheim, Daiichi-Sankyo, Eisai, Janssen HealthCare, Pfizer, and Sanofi.
|
|
| Dr. Daniel J. Brotman |
There are undoubtedly some patients at such high risk for recurrent venous thromboembolism that bridge therapy is a necessary evil, such as those with acute VTE in the preceding month and those with a prior pattern of brisk VTE recurrence during short-term interruption of anticoagulation therapy.
However, for the vast majority of patients receiving oral anticoagulants for VTE, it is probably safer to simply allow the oral anticoagulant to wash out before the procedure and, if indicated based on the type of surgery, to use routine prophylactic-dose anticoagulation therapy afterward.
Dr. Daniel J. Brotman and Dr. Michael B. Streiff are from Johns Hopkins University, Baltimore. These comments are taken from an accompanying editorial (JAMA Intern. Med. 2015 May 26 [doi:10.1001/jamainternmed.2015.1858]). Dr Streiff declared research funding from Bristol-Myers Squibb and Portola and consultancies for Boehringer-Ingelheim, Daiichi-Sankyo, Eisai, Janssen HealthCare, Pfizer, and Sanofi.
Bridge therapy for warfarin patients undergoing invasive therapy is unnecessary for most, said investigators who found an increased risk of bleeding associated with the use of short-acting anticoagulant at the time of the procedure.
A retrospective cohort study of 1,812 procedures in 1,178 patients – most of whom were considered to be at low risk of venous thromboembolism recurrence – showed a 17-fold increase in the risk of clinically relevant bleeding in the group that received bridge anticoagulant therapy, compared with the group that didn’t (2.7% vs. 0.2%).
There was, however, no significant difference in the rate of recurrent venous thromboembolism between the bridge-therapy and non–bridge-therapy groups (0 vs. 3), and no deaths were observed in either group, according to an article published online May 26 (JAMA Intern. Med. [doi:10.1001/jamainternmed.2015.1843].
“Our results confirm and strengthen the findings of those previous studies and highlight the need for a risk categorization scheme that identifies patients at highest risk for recurrent VTE who may benefit from bridge therapy,” wrote Thomas Delate, Ph.D., from Kaiser Permanente Colorado, and coauthors.
The study was conducted and supported by Kaiser Permanente Colorado. One author reported consultancies with Astra-Zeneca, Boehringer-Ingelheim, Pfizer, and Sanofi.
Bridge therapy for warfarin patients undergoing invasive therapy is unnecessary for most, said investigators who found an increased risk of bleeding associated with the use of short-acting anticoagulant at the time of the procedure.
A retrospective cohort study of 1,812 procedures in 1,178 patients – most of whom were considered to be at low risk of venous thromboembolism recurrence – showed a 17-fold increase in the risk of clinically relevant bleeding in the group that received bridge anticoagulant therapy, compared with the group that didn’t (2.7% vs. 0.2%).
There was, however, no significant difference in the rate of recurrent venous thromboembolism between the bridge-therapy and non–bridge-therapy groups (0 vs. 3), and no deaths were observed in either group, according to an article published online May 26 (JAMA Intern. Med. [doi:10.1001/jamainternmed.2015.1843].
“Our results confirm and strengthen the findings of those previous studies and highlight the need for a risk categorization scheme that identifies patients at highest risk for recurrent VTE who may benefit from bridge therapy,” wrote Thomas Delate, Ph.D., from Kaiser Permanente Colorado, and coauthors.
The study was conducted and supported by Kaiser Permanente Colorado. One author reported consultancies with Astra-Zeneca, Boehringer-Ingelheim, Pfizer, and Sanofi.
Key clinical point: Bridge therapy for warfarin patients undergoing invasive therapy is associated with an increased risk of bleeding without a reduction in thromboembolism risk.
Major finding: Patients given bridge therapy during invasive therapy had a 17-fold increase in the risk of clinically significant bleeding.
Data source: A retrospective cohort study of 1,812 procedures in 1,178 patients.
Disclosures: The study was conducted and supported by Kaiser Permanente Colorado. One author reported consultancies with AstraZeneca, Boehringer-Ingelheim, Pfizer, and Sanofi.

Optimal duration of DAPT still unclear

Photo by Sage Ross
A systematic review of published evidence has failed to elucidate the optimal duration of dual antiplatelet therapy (DAPT) in patients who have a drug-eluting stent.
The data showed that patients who received DAPT for a longer period had a small reduction in myocardial infarction as well as a small increase in major bleeding and an even smaller increase in all-cause mortality, compared to patients who received DAPT for a shorter period.
Frederick A. Spencer, MD, of McMaster University in Hamilton, Ontario, Canada, and his colleagues reported these findings in Annals of Internal Medicine.
The team searched databases for trials of DAPT published from 1996 to March 2015. They identified 9 randomized, controlled trials including a total of 29,531 patients. There was complete data for 28,808 patients who had coronary artery disease and received DAPT after drug-eluting stent placement.
In 4 of the trials, patients were randomized to DAPT when they received their stent. Patients in the shorter-duration arm received DAPT for 3 to 6 months, and patients in the longer-duration arm received DAPT for 12 to 24 months.
In a fifth study, patients were randomized to DAPT at stent placement, but thrombotic events occurring during the first 6 months (when both arms received DAPT) were excluded.
In the 4 remaining trials, patients were randomized to DAPT 6 months or more after stent placement. Patients in the shorter-duration arm received DAPT for 6 to 18 months, and patients in the longer-duration arm received DAPT for 12 to 42 months.
Analyzing data from these trials together, Dr Spencer and his colleagues found moderate-quality evidence suggesting that receiving DAPT for a longer period decreased the risk of myocardial infarction (risk ratio [RR]=0.73) but increased the risk of mortality (RR=1.19).
The team also said there was high-quality evidence suggesting that longer-duration DAPT increased the risk of major bleeding (RR=1.63).
Receiving DAPT for a longer period was associated with approximately 8 fewer myocardial infarctions per 1000 patients per year, 6 more major bleeding events per 1000 patients per year, and 2 more deaths per 1000 patients per year, when compared to shorter-duration DAPT.
Because these differences are small, Dr Spencer and his colleagues said the duration of DAPT therapy should probably be based on patient preference, following a discussion of the potential risks and benefits. 
Photo by Sage Ross
A systematic review of published evidence has failed to elucidate the optimal duration of dual antiplatelet therapy (DAPT) in patients who have a drug-eluting stent.
The data showed that patients who received DAPT for a longer period had a small reduction in myocardial infarction as well as a small increase in major bleeding and an even smaller increase in all-cause mortality, compared to patients who received DAPT for a shorter period.
Frederick A. Spencer, MD, of McMaster University in Hamilton, Ontario, Canada, and his colleagues reported these findings in Annals of Internal Medicine.
The team searched databases for trials of DAPT published from 1996 to March 2015. They identified 9 randomized, controlled trials including a total of 29,531 patients. There was complete data for 28,808 patients who had coronary artery disease and received DAPT after drug-eluting stent placement.
In 4 of the trials, patients were randomized to DAPT when they received their stent. Patients in the shorter-duration arm received DAPT for 3 to 6 months, and patients in the longer-duration arm received DAPT for 12 to 24 months.
In a fifth study, patients were randomized to DAPT at stent placement, but thrombotic events occurring during the first 6 months (when both arms received DAPT) were excluded.
In the 4 remaining trials, patients were randomized to DAPT 6 months or more after stent placement. Patients in the shorter-duration arm received DAPT for 6 to 18 months, and patients in the longer-duration arm received DAPT for 12 to 42 months.
Analyzing data from these trials together, Dr Spencer and his colleagues found moderate-quality evidence suggesting that receiving DAPT for a longer period decreased the risk of myocardial infarction (risk ratio [RR]=0.73) but increased the risk of mortality (RR=1.19).
The team also said there was high-quality evidence suggesting that longer-duration DAPT increased the risk of major bleeding (RR=1.63).
Receiving DAPT for a longer period was associated with approximately 8 fewer myocardial infarctions per 1000 patients per year, 6 more major bleeding events per 1000 patients per year, and 2 more deaths per 1000 patients per year, when compared to shorter-duration DAPT.
Because these differences are small, Dr Spencer and his colleagues said the duration of DAPT therapy should probably be based on patient preference, following a discussion of the potential risks and benefits.
Photo by Sage Ross
A systematic review of published evidence has failed to elucidate the optimal duration of dual antiplatelet therapy (DAPT) in patients who have a drug-eluting stent.
The data showed that patients who received DAPT for a longer period had a small reduction in myocardial infarction as well as a small increase in major bleeding and an even smaller increase in all-cause mortality, compared to patients who received DAPT for a shorter period.
Frederick A. Spencer, MD, of McMaster University in Hamilton, Ontario, Canada, and his colleagues reported these findings in Annals of Internal Medicine.
The team searched databases for trials of DAPT published from 1996 to March 2015. They identified 9 randomized, controlled trials including a total of 29,531 patients. There was complete data for 28,808 patients who had coronary artery disease and received DAPT after drug-eluting stent placement.
In 4 of the trials, patients were randomized to DAPT when they received their stent. Patients in the shorter-duration arm received DAPT for 3 to 6 months, and patients in the longer-duration arm received DAPT for 12 to 24 months.
In a fifth study, patients were randomized to DAPT at stent placement, but thrombotic events occurring during the first 6 months (when both arms received DAPT) were excluded.
In the 4 remaining trials, patients were randomized to DAPT 6 months or more after stent placement. Patients in the shorter-duration arm received DAPT for 6 to 18 months, and patients in the longer-duration arm received DAPT for 12 to 42 months.
Analyzing data from these trials together, Dr Spencer and his colleagues found moderate-quality evidence suggesting that receiving DAPT for a longer period decreased the risk of myocardial infarction (risk ratio [RR]=0.73) but increased the risk of mortality (RR=1.19).
The team also said there was high-quality evidence suggesting that longer-duration DAPT increased the risk of major bleeding (RR=1.63).
Receiving DAPT for a longer period was associated with approximately 8 fewer myocardial infarctions per 1000 patients per year, 6 more major bleeding events per 1000 patients per year, and 2 more deaths per 1000 patients per year, when compared to shorter-duration DAPT.
Because these differences are small, Dr Spencer and his colleagues said the duration of DAPT therapy should probably be based on patient preference, following a discussion of the potential risks and benefits.
Teaching Effectiveness in HM
Hospital medicine (HM), which is the fastest growing medical specialty in the United States, includes more than 40,000 healthcare providers.[1] Hospitalists include practitioners from a variety of medical specialties, including internal medicine and pediatrics, and professional backgrounds such as physicians, nurse practitioners. and physician assistants.[2, 3] Originally defined as specialists of inpatient medicine, hospitalists must diagnose and manage a wide variety of clinical conditions, coordinate transitions of care, provide perioperative management to surgical patients, and contribute to quality improvement and hospital administration.[4, 5]
With the evolution of the HM, the need for effective continuing medical education (CME) has become increasingly important. Courses make up the largest percentage of CME activity types,[6] which also include regularly scheduled lecture series, internet materials, and journal‐related CME. Successful CME courses require educational content that matches the learning needs of its participants.[7] In 2006, the Society for Hospital Medicine (SHM) developed core competencies in HM to guide educators in identifying professional practice gaps for useful CME.[8] However, knowing a population's characteristics and learning needs is a key first step to recognizing a practice gap.[9] Understanding these components is important to ensuring that competencies in the field of HM remain relevant to address existing practice gaps.[10] Currently, little is known about the demographic characteristics of participants in HM CME.
Research on the characteristics of effective clinical teachers in medicine has revealed the importance of establishing a positive learning climate, asking questions, diagnosing learners needs, giving feedback, utilizing established teaching frameworks, and developing a personalized philosophy of teaching.[11] Within CME, research has generally demonstrated that courses lead to improvements in lower level outcomes,[12] such as satisfaction and learning, yet higher level outcomes such as behavior change and impacts on patients are inconsistent.[13, 14, 15] Additionally, we have shown that participant reflection on CME is enhanced by presenters who have prior teaching experience and higher teaching effectiveness scores, by the use of audience participation and by incorporating relevant content.[16, 17] Despite the existence of research on CME in general, we are not aware of prior studies regarding characteristics of effective CME in the field of HM.
To better understand and improve the quality of HM CME, we sought to describe the characteristics of participants at a large, national HM CME course, and to identify associations between characteristics of presentations and CME teaching effectiveness (CMETE) scores using a previously validated instrument.
METHODS
Study Design and Participants
This cross‐sectional study included all participants (n=368) and presenters (n=29) at the Mayo Clinic Hospital Medicine Managing Complex Patients (MCP) course in October 2014. MCP is a CME course designed for hospitalists (defined as those who spend most of their professional practice caring for hospitalized patients) and provides up to 24.5 American Medical Association Physician's Recognition Award category 1 credits. The course took place over 4 days and consisted of 32 didactic presentations, which comprised the context for data collection for this study. The structure of the course day consisted of early and late morning sessions, each made up of 3 to 5 presentations, followed by a question and answer session with presenters and a 15‐minute break. The study was deemed exempt by the Mayo Clinic Institutional Review Board.
Independent Variables: Characteristics of Participants and Presentations
Demographic characteristics of participants were obtained through anonymous surveys attached to CME teaching effectiveness forms. Variables included participant sex, professional degree, self‐identified hospitalist, medical specialty, geographic practice location, age, years in practice/level of training, practice setting, American Board of Internal Medicine (ABIM) certification of Focused Practice in Hospital Medicine, number of CME credits earned, and number of CME programs attended in the past year. These variables were selected in an effort to describe potentially relevant demographics of a national cohort of HM CME participants.
Presentation variables included use of clinical cases, audience response system (ARS), number of slides, defined goals/objectives, summary slide and presentation length in minutes, and are supported by previous CME effectiveness research.[16, 17, 18, 19]
Outcome Variable: CME Teaching Effectiveness Scores
The CMETE scores for this study were obtained from an instrument described in our previous research.[16] The instrument contains 7 items on 5‐point scales (range: strongly disagree to strongly agree) that address speaker clarity and organization, relevant content, use of case examples, effective slides, interactive learning methods (eg, audience response), use of supporting evidence, appropriate amount of content, and summary of key points. Additionally, the instrument includes 2 open‐ended questions: (1) What did the speaker do well? (Please describe specific behaviors and examples) and (2) What could the speaker improve on? (Please describe specific behaviors and examples). Validity evidence for CMETE scores included factor analysis demonstrating a unidimensional model for measuring presenter feedback, along with excellent internal consistency and inter‐rater reliability.[16]
Data Analysis
A CMETE score per presentation from each attendee was calculated as the average over the 7 instrument items. A composite presentation‐level CMETE score was then computed as the average overall score within each presentation. CMETE scores were summarized using means and standard deviations (SDs). The overall CMETE scores were compared by presentation characteristics using Kruskal‐Wallis tests. To illustrate the size of observed differences, Cohen effect sizes are presented as the average difference between groups divided by the common SD. All analyses were performed using SAS version 9 (SAS Institute Inc., Cary, NC).
RESULTS
There were 32 presentations during the MCP conference in 2014. A total of 277 (75.2%) out of 368 participants completed the survey. This yielded 7947 CMETE evaluations for analysis, with an average of 28.7 per person (median: 31, interquartile range: 2732, range: 632).
Demographic characteristics of course participants are listed in Table 1. Participants (number, %), described themselves as hospitalists (181, 70.4%), ABIM certified with HM focus (48, 18.8%), physicians with MD or MBBS degrees (181, 70.4%), nurse practitioners or physician assistants (52; 20.2%), and in practice 20 years (73, 28%). The majority of participants (148, 58.3%) worked in private practice, whereas only 63 (24.8%) worked in academic settings.
| Variable | No. of Attendees (%), N=277 |
|---|---|
| |
| Sex | |
| Unknown | 22 |
| Male | 124 (48.6%) |
| Female | 131 (51.4%) |
| Age | |
| Unknown | 17 |
| 2029 years | 11 (4.2%) |
| 3039 years | 83 (31.9%) |
| 4049 years | 61 (23.5%) |
| 5059 years | 56 (21.5%) |
| 6069 years | 38 (14.6%) |
| 70+ years | 11 (4.2%) |
| Professional degree | |
| Unknown | 20 |
| MD/MBBS | 181 (70.4%) |
| DO | 23 (8.9%) |
| NP | 28 (10.9%) |
| PA | 24 (9.3%) |
| Other | 1 (0.4%) |
| Medical specialty | |
| Unknown | 26 |
| Internal medicine | 149 (59.4%) |
| Family medicine | 47 (18.7%) |
| IM subspecialty | 14 (5.6%) |
| Other | 41 (16.3%) |
| Geographic location | |
| Unknown | 16 |
| Western US | 48 (18.4%) |
| Northeastern US | 33 (12.6%) |
| Midwestern US | 98 (37.5%) |
| Southern US | 40 (15.3%) |
| Canada | 13 (5.0%) |
| Other | 29 (11.1%) |
| Years of practice/training | |
| Unknown | 16 |
| Currently in training | 1 (0.4%) |
| Practice 04 years | 68 (26.1%) |
| Practice 59 years | 55 (21.1%) |
| Practice 1019 years | 64 (24.5%) |
| Practice 20+ years | 73 (28.0%) |
| Practice setting | |
| Unknown | 23 |
| Academic | 63 (24.8%) |
| Privateurban | 99 (39.0%) |
| Privaterural | 49 (19.3%) |
| Other | 43 (16.9%) |
| ABIM certification HM | |
| Unknown | 22 |
| Yes | 48 (18.8%) |
| No | 207 (81.2%) |
| Hospitalist | |
| Unknown | 20 |
| Yes | 181 (70.4%) |
| No | 76 (29.6%) |
| CME credits claimed | |
| Unknown | 20 |
| 024 | 54 (21.0%) |
| 2549 | 105 (40.9%) |
| 5074 | 61 (23.7%) |
| 7599 | 15 (5.8%) |
| 100+ | 22 (8.6%) |
| CME programs attended | |
| Unknown | 18 |
| 0 | 38 (14.7%) |
| 12 | 166 (64.1%) |
| 35 | 52 (20.1%) |
| 6+ | 3 (1.2%) |
CMETE scores (mean [SD]) were significantly associated with the use of ARS (4.64 [0.16]) vs no ARS (4.49 [0.16]; P=0.01, Table 2, Figure 1), longer presentations (30 minutes: 4.67 [0.13] vs <30 minutes: 4.51 [0.18]; P=0.02), and larger number of slides (50: 4.66 [0.17] vs <50: 4.55 [0.17]; P=0.04). There were no significant associations between CMETE scores and use of clinical cases, defined goals, or summary slides.
| Presentation Variable | No. (%) | Mean Score | Standard Deviation | P Value |
|---|---|---|---|---|
| Use of clinical cases | ||||
| Yes | 28 (87.5%) | 4.60 | 0.18 | 0.14 |
| No | 4 (12.5%) | 4.49 | 0.14 | |
| Audience response system | ||||
| Yes | 20 (62.5%) | 4.64 | 0.16 | 0.01 |
| No | 12 (37.5%) | 4.49 | 0.16 | |
| No. of slides | ||||
| 50 | 10 (31.3%) | 4.66 | 0.17 | 0.04 |
| <50 | 22 (68.8%) | 4.55 | 0.17 | |
| Defined goals/objectives | ||||
| Yes | 29 (90.6%) | 4.58 | 0.18 | 0.87 |
| No | 3 (9.4%) | 4.61 | 0.17 | |
| Summary slide | ||||
| Yes | 22 (68.8%) | 4.56 | 0.18 | 0.44 |
| No | 10 (31.3%) | 4.62 | 0.15 | |
| Presentation length | ||||
| 30 minutes | 14 (43.8%) | 4.67 | 0.13 | 0.02 |
| <30 minutes | 18 (56.3%) | 4.51 | 0.18 |
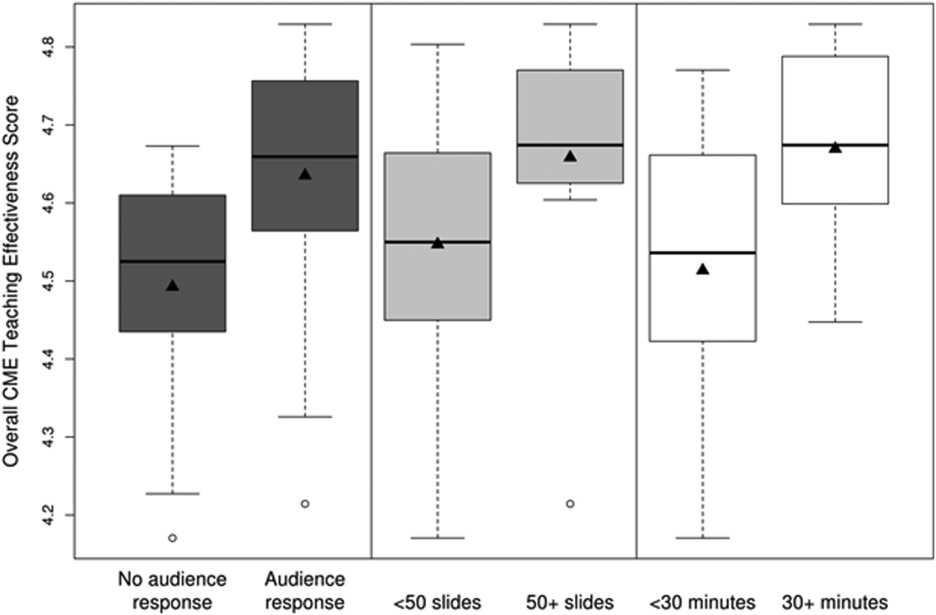
The magnitude of score differences observed in this study are substantial when considered in terms of Cohen's effect sizes. For number of slides, the effect size is 0.65, for audience response the effect size is 0.94, and for presentation length the effect size is approximately 1. According to Cohen, effect sizes of 0.5 to 0.8 are moderate, and effect sizes >0.8 are large. Consequently, the effect sizes of our observed differences are moderate to large.[20, 21]
DISCUSSION
To our knowledge, this is the first study to measure associations between validated teaching effectiveness scores and characteristics of presentations in HM CME. We found that the use of ARS and longer presentations were associated with significantly higher CMETE scores. Our findings have implications for HM CME course directors and presenters as they attempt to develop methods to improve the quality of CME.
CME participants in our study crossed a wide range of ages and experience, which is consistent with national surveys of hospitalists.[22, 23] Interestingly, however, nearly 1 in 3 participants trained in a specialty other than internal medicine. Additionally, the professional degrees of participants were diverse, with 20% of participants having trained as nurse practitioners or physician assistants. These findings are at odds with an early national survey of inpatient practitioners,[22] but consistent with recent literature that the diversity of training backgrounds among hospitalists is increasing as the field of HM evolves.[24] Hospital medicine CME providers will need to be cognizant of these demographic changes as they work to identify practice gaps and apply appropriate educational methods.
The use of an ARS allows for increased participation and engagement among lecture attendees, which in turn promotes active learning.[25, 26, 27] The association of higher teaching scores with the use of ARS is consistent with previous research in other CME settings such as clinical round tables and medical grand rounds.[17, 28] As it pertains to HM specifically, our findings also build upon a recent study by Sehgal et al., which reported on the novel use of bedside CME to enhance interactive learning and discussion among hospitalists, and which was viewed favorably by course participants.[29]
The reasons why longer presentations in our study were linked to higher CMETE scores are not entirely clear, as previous CME research has failed to demonstrate this relationship.[18] One possibility is that course participants prefer learning from presentations that provide granular, content‐rich information. Another possibility may be that characteristics of effective presenters who gave longer presentations and that were not measured in this study, such as presenter experience and expertise, were responsible for the observed increase in CMETE scores. Yet another possibility is that effective presentations were longer due to the use of ARS, which was also associated with better CMETE scores. This explanation may be plausible because the ARS requires additional slides and provides opportunities for audience interaction, which may lengthen the duration of any given presentation.
This study has several limitations. This was a single CME conference sponsored by a large academic medical center, which may limit generalizability, especially to smaller conferences in community settings. However, the audience was large and diverse in terms of participants experiences, practice settings, professional backgrounds, and geographic locations. Furthermore, the demographic characteristics of hospitalists at our course appear very similar to a recently reported national cross‐section of hospitalist groups.[30] Second, this is a cross‐sectional study without a comparison group. Nonetheless, a systematic review showed that most published education research studies involved single‐group designs without comparison groups.[31] Last, the outcomes of the study include attitudes and objectively measured presenter behaviors such as the use of ARS, but not patient‐related outcomes. Nonetheless, evidence indicates that the majority of medical education research does not present outcomes beyond knowledge,[31] and it has been noted that behavior‐related outcomes strike the ideal balance between feasibility and rigor.[32, 33] Finally, the instrument used in this study to measure teaching effectiveness is supported by prior validity evidence.[16]
In summary, we found that hospital medicine CME presentations, which are longer and use audience responses, are associated with greater teaching effectiveness ratings by CME course participants. These findings build upon previous CME research and suggest that CME course directors and presenters should strive to incorporate opportunities that promote audience engagement and participation. Additionally, this study adds to the existing validity of evidence for the CMETE assessment tool. We believe that future research should explore potential associations between teacher effectiveness and patient‐related outcomes, and determine whether course content that reflects the SHM core competencies improves CME teaching effectiveness scores.
Disclosure
Nothing to report.
- Society of Hospital Medicine. 2013/2014 press kit. Available at: http://www.hospitalmedicine.org/Web/Media_Center/Web/Media_Center/Media_Center.aspx?hkey=e26ceba7-ba93-4e50-8eb1-1ccc75d6f0fd. Accessed May 18, 2015.
- , , , , , . Hospitalist services: an evolving opportunity. Nurse Pract. 2008;33:9–10.
- , , , et al. The evolving role of the pediatric nurse practitioner in hospital medicine. J Hosp Med. 2014;9:261–265.
- , . The emerging role of “hospitalists” in the American health care system. N Engl J Med. 1996;335:514–517.
- Society of Hospital Medicine. Definition of a hospitalist and hospital medicine. Available at: http://www.hospitalmedicine.org/Web/About_SHM/Hospitalist_Definition/Web/About_SHM/Industry/Hospital_Medicine_Hospital_Definition.aspx. Accessed February 16, 2015.
- Accreditation Council for Continuing Medical Education. 2013 annual report data executive summary. Available at: http://www.accme.org/sites/default/files/630_2013_Annual_Report_20140715_0.pdf. Accessed February 16, 2015.
- . The anatomy of an outstanding CME meeting. J Am Coll Radiol. 2005;2:534–540.
- , , , , . How to use The Core Competencies in Hospital Medicine: a framework for curriculum development. J Hosp Med. 2006;1:57–67.
- , , , , , . Perspective: a practical approach to defining professional practice gaps for continuing medical education. Acad Med. 2012;87:582–585.
- , , , , . Core competencies in hospital medicine: development and methodology. J Hosp Med. 2006;1(suppl 1):148–156.
- , . Proposal for a collaborative approach to clinical teaching. Mayo Clin Proc. 2009;84:339–344.
- , . Developing scholarly projects in education: a primer for medical teachers. Med Teach. 2007;29:210–218.
- , . A meta‐analysis of continuing medical education effectiveness. J Contin Educ Health Prof. 2007;27:6–15.
- , , . Achieving desired results and improved outcomes: integrating planning and assessment throughout learning activities. J Contin Educ Health Prof. 2009;29:1–15.
- , . Effectiveness of continuing medical education: updated synthesis of systematic reviews. Available at: http://www.accme.org/sites/default/files/652_20141104_Effectiveness_of_Continuing_Medical_Education_Cervero_and_Gaines.pdf. Accessed March 25, 2015.
- , , , et al. Improving participant feedback to continuing medical education presenters in internal medicine: a mixed‐methods study. J Gen Intern Med. 2012;27:425–431.
- , , , et al. Measuring faculty reflection on medical grand rounds at Mayo Clinic: associations with teaching experience, clinical exposure, and presenter effectiveness. Mayo Clin Proc. 2013;88:277–284.
- , , , . Successful lecturing: a prospective study to validate attributes of the effective medical lecture. J Gen Intern Med. 2000;15:366–371.
- , , , , , . A standardized approach to assessing physician expectations and perceptions of continuing medical education. J Contin Educ Health Prof. 2007;27:173–182.
- . Statistical Power Analysis for the Behavioral Sciences. New York, NY: Academic Press; 1977.
- . Statistical Power Analysis for the Behavioral Sciences. 2nd ed. Hillsdale, NJ: Erlbaum; 1988.
- , , , . Hospitalists and the practice of inpatient medicine: results of a survey of the National Association of Inpatient Physicians. Ann Intern Med. 1999;130:343–349.
- , , , , . Worklife and satisfaction of hospitalists: toward flourishing careers. J Gen Intern Med. 2012;27:28–36.
- , , , et al. Nurse practitioner and physician assistant scope of practice in 118 acute care hospitals. J Hosp Med. 2014;9:615–620.
- , . A primer on audience response systems: current applications and future considerations. Am J Pharm Educ. 2008;72:77.
- , , . Continuing medical education: AMEE education guide no 35. Med Teach. 2008;30:652–666.
- . Clickers in the large classroom: current research and best‐practice tips. CBE Life Sci Educ. 2007;6:9–20.
- , , . Evaluation of an audience response system for the continuing education of health professionals. J Contin Educ Health Prof. 2003;23:109–115.
- , , . Bringing continuing medical education to the bedside: the University of California, San Francisco Hospitalist Mini‐College. J Hosp Med. 2014;9:129–134.
- Society of Hospital Medicine. 2014 State of Hospital Medicine Report. Philadelphia, PA: Society of Hospital Medicine; 2014.
- , , , , , . Association between funding and quality of published medical education research. JAMA. 2007;298:1002–1009.
- . Mind the gap: some reasons why medical education research is different from health services research. Med Educ. 2001;35:319–320.
- , . Reflections on experimental research in medical education. Adv Health Sci Educ Theory Pract. 2010;15:455–464.
Hospital medicine (HM), which is the fastest growing medical specialty in the United States, includes more than 40,000 healthcare providers.[1] Hospitalists include practitioners from a variety of medical specialties, including internal medicine and pediatrics, and professional backgrounds such as physicians, nurse practitioners. and physician assistants.[2, 3] Originally defined as specialists of inpatient medicine, hospitalists must diagnose and manage a wide variety of clinical conditions, coordinate transitions of care, provide perioperative management to surgical patients, and contribute to quality improvement and hospital administration.[4, 5]
With the evolution of the HM, the need for effective continuing medical education (CME) has become increasingly important. Courses make up the largest percentage of CME activity types,[6] which also include regularly scheduled lecture series, internet materials, and journal‐related CME. Successful CME courses require educational content that matches the learning needs of its participants.[7] In 2006, the Society for Hospital Medicine (SHM) developed core competencies in HM to guide educators in identifying professional practice gaps for useful CME.[8] However, knowing a population's characteristics and learning needs is a key first step to recognizing a practice gap.[9] Understanding these components is important to ensuring that competencies in the field of HM remain relevant to address existing practice gaps.[10] Currently, little is known about the demographic characteristics of participants in HM CME.
Research on the characteristics of effective clinical teachers in medicine has revealed the importance of establishing a positive learning climate, asking questions, diagnosing learners needs, giving feedback, utilizing established teaching frameworks, and developing a personalized philosophy of teaching.[11] Within CME, research has generally demonstrated that courses lead to improvements in lower level outcomes,[12] such as satisfaction and learning, yet higher level outcomes such as behavior change and impacts on patients are inconsistent.[13, 14, 15] Additionally, we have shown that participant reflection on CME is enhanced by presenters who have prior teaching experience and higher teaching effectiveness scores, by the use of audience participation and by incorporating relevant content.[16, 17] Despite the existence of research on CME in general, we are not aware of prior studies regarding characteristics of effective CME in the field of HM.
To better understand and improve the quality of HM CME, we sought to describe the characteristics of participants at a large, national HM CME course, and to identify associations between characteristics of presentations and CME teaching effectiveness (CMETE) scores using a previously validated instrument.
METHODS
Study Design and Participants
This cross‐sectional study included all participants (n=368) and presenters (n=29) at the Mayo Clinic Hospital Medicine Managing Complex Patients (MCP) course in October 2014. MCP is a CME course designed for hospitalists (defined as those who spend most of their professional practice caring for hospitalized patients) and provides up to 24.5 American Medical Association Physician's Recognition Award category 1 credits. The course took place over 4 days and consisted of 32 didactic presentations, which comprised the context for data collection for this study. The structure of the course day consisted of early and late morning sessions, each made up of 3 to 5 presentations, followed by a question and answer session with presenters and a 15‐minute break. The study was deemed exempt by the Mayo Clinic Institutional Review Board.
Independent Variables: Characteristics of Participants and Presentations
Demographic characteristics of participants were obtained through anonymous surveys attached to CME teaching effectiveness forms. Variables included participant sex, professional degree, self‐identified hospitalist, medical specialty, geographic practice location, age, years in practice/level of training, practice setting, American Board of Internal Medicine (ABIM) certification of Focused Practice in Hospital Medicine, number of CME credits earned, and number of CME programs attended in the past year. These variables were selected in an effort to describe potentially relevant demographics of a national cohort of HM CME participants.
Presentation variables included use of clinical cases, audience response system (ARS), number of slides, defined goals/objectives, summary slide and presentation length in minutes, and are supported by previous CME effectiveness research.[16, 17, 18, 19]
Outcome Variable: CME Teaching Effectiveness Scores
The CMETE scores for this study were obtained from an instrument described in our previous research.[16] The instrument contains 7 items on 5‐point scales (range: strongly disagree to strongly agree) that address speaker clarity and organization, relevant content, use of case examples, effective slides, interactive learning methods (eg, audience response), use of supporting evidence, appropriate amount of content, and summary of key points. Additionally, the instrument includes 2 open‐ended questions: (1) What did the speaker do well? (Please describe specific behaviors and examples) and (2) What could the speaker improve on? (Please describe specific behaviors and examples). Validity evidence for CMETE scores included factor analysis demonstrating a unidimensional model for measuring presenter feedback, along with excellent internal consistency and inter‐rater reliability.[16]
Data Analysis
A CMETE score per presentation from each attendee was calculated as the average over the 7 instrument items. A composite presentation‐level CMETE score was then computed as the average overall score within each presentation. CMETE scores were summarized using means and standard deviations (SDs). The overall CMETE scores were compared by presentation characteristics using Kruskal‐Wallis tests. To illustrate the size of observed differences, Cohen effect sizes are presented as the average difference between groups divided by the common SD. All analyses were performed using SAS version 9 (SAS Institute Inc., Cary, NC).
RESULTS
There were 32 presentations during the MCP conference in 2014. A total of 277 (75.2%) out of 368 participants completed the survey. This yielded 7947 CMETE evaluations for analysis, with an average of 28.7 per person (median: 31, interquartile range: 2732, range: 632).
Demographic characteristics of course participants are listed in Table 1. Participants (number, %), described themselves as hospitalists (181, 70.4%), ABIM certified with HM focus (48, 18.8%), physicians with MD or MBBS degrees (181, 70.4%), nurse practitioners or physician assistants (52; 20.2%), and in practice 20 years (73, 28%). The majority of participants (148, 58.3%) worked in private practice, whereas only 63 (24.8%) worked in academic settings.
| Variable | No. of Attendees (%), N=277 |
|---|---|
| |
| Sex | |
| Unknown | 22 |
| Male | 124 (48.6%) |
| Female | 131 (51.4%) |
| Age | |
| Unknown | 17 |
| 2029 years | 11 (4.2%) |
| 3039 years | 83 (31.9%) |
| 4049 years | 61 (23.5%) |
| 5059 years | 56 (21.5%) |
| 6069 years | 38 (14.6%) |
| 70+ years | 11 (4.2%) |
| Professional degree | |
| Unknown | 20 |
| MD/MBBS | 181 (70.4%) |
| DO | 23 (8.9%) |
| NP | 28 (10.9%) |
| PA | 24 (9.3%) |
| Other | 1 (0.4%) |
| Medical specialty | |
| Unknown | 26 |
| Internal medicine | 149 (59.4%) |
| Family medicine | 47 (18.7%) |
| IM subspecialty | 14 (5.6%) |
| Other | 41 (16.3%) |
| Geographic location | |
| Unknown | 16 |
| Western US | 48 (18.4%) |
| Northeastern US | 33 (12.6%) |
| Midwestern US | 98 (37.5%) |
| Southern US | 40 (15.3%) |
| Canada | 13 (5.0%) |
| Other | 29 (11.1%) |
| Years of practice/training | |
| Unknown | 16 |
| Currently in training | 1 (0.4%) |
| Practice 04 years | 68 (26.1%) |
| Practice 59 years | 55 (21.1%) |
| Practice 1019 years | 64 (24.5%) |
| Practice 20+ years | 73 (28.0%) |
| Practice setting | |
| Unknown | 23 |
| Academic | 63 (24.8%) |
| Privateurban | 99 (39.0%) |
| Privaterural | 49 (19.3%) |
| Other | 43 (16.9%) |
| ABIM certification HM | |
| Unknown | 22 |
| Yes | 48 (18.8%) |
| No | 207 (81.2%) |
| Hospitalist | |
| Unknown | 20 |
| Yes | 181 (70.4%) |
| No | 76 (29.6%) |
| CME credits claimed | |
| Unknown | 20 |
| 024 | 54 (21.0%) |
| 2549 | 105 (40.9%) |
| 5074 | 61 (23.7%) |
| 7599 | 15 (5.8%) |
| 100+ | 22 (8.6%) |
| CME programs attended | |
| Unknown | 18 |
| 0 | 38 (14.7%) |
| 12 | 166 (64.1%) |
| 35 | 52 (20.1%) |
| 6+ | 3 (1.2%) |
CMETE scores (mean [SD]) were significantly associated with the use of ARS (4.64 [0.16]) vs no ARS (4.49 [0.16]; P=0.01, Table 2, Figure 1), longer presentations (30 minutes: 4.67 [0.13] vs <30 minutes: 4.51 [0.18]; P=0.02), and larger number of slides (50: 4.66 [0.17] vs <50: 4.55 [0.17]; P=0.04). There were no significant associations between CMETE scores and use of clinical cases, defined goals, or summary slides.
| Presentation Variable | No. (%) | Mean Score | Standard Deviation | P Value |
|---|---|---|---|---|
| Use of clinical cases | ||||
| Yes | 28 (87.5%) | 4.60 | 0.18 | 0.14 |
| No | 4 (12.5%) | 4.49 | 0.14 | |
| Audience response system | ||||
| Yes | 20 (62.5%) | 4.64 | 0.16 | 0.01 |
| No | 12 (37.5%) | 4.49 | 0.16 | |
| No. of slides | ||||
| 50 | 10 (31.3%) | 4.66 | 0.17 | 0.04 |
| <50 | 22 (68.8%) | 4.55 | 0.17 | |
| Defined goals/objectives | ||||
| Yes | 29 (90.6%) | 4.58 | 0.18 | 0.87 |
| No | 3 (9.4%) | 4.61 | 0.17 | |
| Summary slide | ||||
| Yes | 22 (68.8%) | 4.56 | 0.18 | 0.44 |
| No | 10 (31.3%) | 4.62 | 0.15 | |
| Presentation length | ||||
| 30 minutes | 14 (43.8%) | 4.67 | 0.13 | 0.02 |
| <30 minutes | 18 (56.3%) | 4.51 | 0.18 |
The magnitude of score differences observed in this study are substantial when considered in terms of Cohen's effect sizes. For number of slides, the effect size is 0.65, for audience response the effect size is 0.94, and for presentation length the effect size is approximately 1. According to Cohen, effect sizes of 0.5 to 0.8 are moderate, and effect sizes >0.8 are large. Consequently, the effect sizes of our observed differences are moderate to large.[20, 21]
DISCUSSION
To our knowledge, this is the first study to measure associations between validated teaching effectiveness scores and characteristics of presentations in HM CME. We found that the use of ARS and longer presentations were associated with significantly higher CMETE scores. Our findings have implications for HM CME course directors and presenters as they attempt to develop methods to improve the quality of CME.
CME participants in our study crossed a wide range of ages and experience, which is consistent with national surveys of hospitalists.[22, 23] Interestingly, however, nearly 1 in 3 participants trained in a specialty other than internal medicine. Additionally, the professional degrees of participants were diverse, with 20% of participants having trained as nurse practitioners or physician assistants. These findings are at odds with an early national survey of inpatient practitioners,[22] but consistent with recent literature that the diversity of training backgrounds among hospitalists is increasing as the field of HM evolves.[24] Hospital medicine CME providers will need to be cognizant of these demographic changes as they work to identify practice gaps and apply appropriate educational methods.
The use of an ARS allows for increased participation and engagement among lecture attendees, which in turn promotes active learning.[25, 26, 27] The association of higher teaching scores with the use of ARS is consistent with previous research in other CME settings such as clinical round tables and medical grand rounds.[17, 28] As it pertains to HM specifically, our findings also build upon a recent study by Sehgal et al., which reported on the novel use of bedside CME to enhance interactive learning and discussion among hospitalists, and which was viewed favorably by course participants.[29]
The reasons why longer presentations in our study were linked to higher CMETE scores are not entirely clear, as previous CME research has failed to demonstrate this relationship.[18] One possibility is that course participants prefer learning from presentations that provide granular, content‐rich information. Another possibility may be that characteristics of effective presenters who gave longer presentations and that were not measured in this study, such as presenter experience and expertise, were responsible for the observed increase in CMETE scores. Yet another possibility is that effective presentations were longer due to the use of ARS, which was also associated with better CMETE scores. This explanation may be plausible because the ARS requires additional slides and provides opportunities for audience interaction, which may lengthen the duration of any given presentation.
This study has several limitations. This was a single CME conference sponsored by a large academic medical center, which may limit generalizability, especially to smaller conferences in community settings. However, the audience was large and diverse in terms of participants experiences, practice settings, professional backgrounds, and geographic locations. Furthermore, the demographic characteristics of hospitalists at our course appear very similar to a recently reported national cross‐section of hospitalist groups.[30] Second, this is a cross‐sectional study without a comparison group. Nonetheless, a systematic review showed that most published education research studies involved single‐group designs without comparison groups.[31] Last, the outcomes of the study include attitudes and objectively measured presenter behaviors such as the use of ARS, but not patient‐related outcomes. Nonetheless, evidence indicates that the majority of medical education research does not present outcomes beyond knowledge,[31] and it has been noted that behavior‐related outcomes strike the ideal balance between feasibility and rigor.[32, 33] Finally, the instrument used in this study to measure teaching effectiveness is supported by prior validity evidence.[16]
In summary, we found that hospital medicine CME presentations, which are longer and use audience responses, are associated with greater teaching effectiveness ratings by CME course participants. These findings build upon previous CME research and suggest that CME course directors and presenters should strive to incorporate opportunities that promote audience engagement and participation. Additionally, this study adds to the existing validity of evidence for the CMETE assessment tool. We believe that future research should explore potential associations between teacher effectiveness and patient‐related outcomes, and determine whether course content that reflects the SHM core competencies improves CME teaching effectiveness scores.
Disclosure
Nothing to report.
Hospital medicine (HM), which is the fastest growing medical specialty in the United States, includes more than 40,000 healthcare providers.[1] Hospitalists include practitioners from a variety of medical specialties, including internal medicine and pediatrics, and professional backgrounds such as physicians, nurse practitioners. and physician assistants.[2, 3] Originally defined as specialists of inpatient medicine, hospitalists must diagnose and manage a wide variety of clinical conditions, coordinate transitions of care, provide perioperative management to surgical patients, and contribute to quality improvement and hospital administration.[4, 5]
With the evolution of the HM, the need for effective continuing medical education (CME) has become increasingly important. Courses make up the largest percentage of CME activity types,[6] which also include regularly scheduled lecture series, internet materials, and journal‐related CME. Successful CME courses require educational content that matches the learning needs of its participants.[7] In 2006, the Society for Hospital Medicine (SHM) developed core competencies in HM to guide educators in identifying professional practice gaps for useful CME.[8] However, knowing a population's characteristics and learning needs is a key first step to recognizing a practice gap.[9] Understanding these components is important to ensuring that competencies in the field of HM remain relevant to address existing practice gaps.[10] Currently, little is known about the demographic characteristics of participants in HM CME.
Research on the characteristics of effective clinical teachers in medicine has revealed the importance of establishing a positive learning climate, asking questions, diagnosing learners needs, giving feedback, utilizing established teaching frameworks, and developing a personalized philosophy of teaching.[11] Within CME, research has generally demonstrated that courses lead to improvements in lower level outcomes,[12] such as satisfaction and learning, yet higher level outcomes such as behavior change and impacts on patients are inconsistent.[13, 14, 15] Additionally, we have shown that participant reflection on CME is enhanced by presenters who have prior teaching experience and higher teaching effectiveness scores, by the use of audience participation and by incorporating relevant content.[16, 17] Despite the existence of research on CME in general, we are not aware of prior studies regarding characteristics of effective CME in the field of HM.
To better understand and improve the quality of HM CME, we sought to describe the characteristics of participants at a large, national HM CME course, and to identify associations between characteristics of presentations and CME teaching effectiveness (CMETE) scores using a previously validated instrument.
METHODS
Study Design and Participants
This cross‐sectional study included all participants (n=368) and presenters (n=29) at the Mayo Clinic Hospital Medicine Managing Complex Patients (MCP) course in October 2014. MCP is a CME course designed for hospitalists (defined as those who spend most of their professional practice caring for hospitalized patients) and provides up to 24.5 American Medical Association Physician's Recognition Award category 1 credits. The course took place over 4 days and consisted of 32 didactic presentations, which comprised the context for data collection for this study. The structure of the course day consisted of early and late morning sessions, each made up of 3 to 5 presentations, followed by a question and answer session with presenters and a 15‐minute break. The study was deemed exempt by the Mayo Clinic Institutional Review Board.
Independent Variables: Characteristics of Participants and Presentations
Demographic characteristics of participants were obtained through anonymous surveys attached to CME teaching effectiveness forms. Variables included participant sex, professional degree, self‐identified hospitalist, medical specialty, geographic practice location, age, years in practice/level of training, practice setting, American Board of Internal Medicine (ABIM) certification of Focused Practice in Hospital Medicine, number of CME credits earned, and number of CME programs attended in the past year. These variables were selected in an effort to describe potentially relevant demographics of a national cohort of HM CME participants.
Presentation variables included use of clinical cases, audience response system (ARS), number of slides, defined goals/objectives, summary slide and presentation length in minutes, and are supported by previous CME effectiveness research.[16, 17, 18, 19]
Outcome Variable: CME Teaching Effectiveness Scores
The CMETE scores for this study were obtained from an instrument described in our previous research.[16] The instrument contains 7 items on 5‐point scales (range: strongly disagree to strongly agree) that address speaker clarity and organization, relevant content, use of case examples, effective slides, interactive learning methods (eg, audience response), use of supporting evidence, appropriate amount of content, and summary of key points. Additionally, the instrument includes 2 open‐ended questions: (1) What did the speaker do well? (Please describe specific behaviors and examples) and (2) What could the speaker improve on? (Please describe specific behaviors and examples). Validity evidence for CMETE scores included factor analysis demonstrating a unidimensional model for measuring presenter feedback, along with excellent internal consistency and inter‐rater reliability.[16]
Data Analysis
A CMETE score per presentation from each attendee was calculated as the average over the 7 instrument items. A composite presentation‐level CMETE score was then computed as the average overall score within each presentation. CMETE scores were summarized using means and standard deviations (SDs). The overall CMETE scores were compared by presentation characteristics using Kruskal‐Wallis tests. To illustrate the size of observed differences, Cohen effect sizes are presented as the average difference between groups divided by the common SD. All analyses were performed using SAS version 9 (SAS Institute Inc., Cary, NC).
RESULTS
There were 32 presentations during the MCP conference in 2014. A total of 277 (75.2%) out of 368 participants completed the survey. This yielded 7947 CMETE evaluations for analysis, with an average of 28.7 per person (median: 31, interquartile range: 2732, range: 632).
Demographic characteristics of course participants are listed in Table 1. Participants (number, %), described themselves as hospitalists (181, 70.4%), ABIM certified with HM focus (48, 18.8%), physicians with MD or MBBS degrees (181, 70.4%), nurse practitioners or physician assistants (52; 20.2%), and in practice 20 years (73, 28%). The majority of participants (148, 58.3%) worked in private practice, whereas only 63 (24.8%) worked in academic settings.
| Variable | No. of Attendees (%), N=277 |
|---|---|
| |
| Sex | |
| Unknown | 22 |
| Male | 124 (48.6%) |
| Female | 131 (51.4%) |
| Age | |
| Unknown | 17 |
| 2029 years | 11 (4.2%) |
| 3039 years | 83 (31.9%) |
| 4049 years | 61 (23.5%) |
| 5059 years | 56 (21.5%) |
| 6069 years | 38 (14.6%) |
| 70+ years | 11 (4.2%) |
| Professional degree | |
| Unknown | 20 |
| MD/MBBS | 181 (70.4%) |
| DO | 23 (8.9%) |
| NP | 28 (10.9%) |
| PA | 24 (9.3%) |
| Other | 1 (0.4%) |
| Medical specialty | |
| Unknown | 26 |
| Internal medicine | 149 (59.4%) |
| Family medicine | 47 (18.7%) |
| IM subspecialty | 14 (5.6%) |
| Other | 41 (16.3%) |
| Geographic location | |
| Unknown | 16 |
| Western US | 48 (18.4%) |
| Northeastern US | 33 (12.6%) |
| Midwestern US | 98 (37.5%) |
| Southern US | 40 (15.3%) |
| Canada | 13 (5.0%) |
| Other | 29 (11.1%) |
| Years of practice/training | |
| Unknown | 16 |
| Currently in training | 1 (0.4%) |
| Practice 04 years | 68 (26.1%) |
| Practice 59 years | 55 (21.1%) |
| Practice 1019 years | 64 (24.5%) |
| Practice 20+ years | 73 (28.0%) |
| Practice setting | |
| Unknown | 23 |
| Academic | 63 (24.8%) |
| Privateurban | 99 (39.0%) |
| Privaterural | 49 (19.3%) |
| Other | 43 (16.9%) |
| ABIM certification HM | |
| Unknown | 22 |
| Yes | 48 (18.8%) |
| No | 207 (81.2%) |
| Hospitalist | |
| Unknown | 20 |
| Yes | 181 (70.4%) |
| No | 76 (29.6%) |
| CME credits claimed | |
| Unknown | 20 |
| 024 | 54 (21.0%) |
| 2549 | 105 (40.9%) |
| 5074 | 61 (23.7%) |
| 7599 | 15 (5.8%) |
| 100+ | 22 (8.6%) |
| CME programs attended | |
| Unknown | 18 |
| 0 | 38 (14.7%) |
| 12 | 166 (64.1%) |
| 35 | 52 (20.1%) |
| 6+ | 3 (1.2%) |
CMETE scores (mean [SD]) were significantly associated with the use of ARS (4.64 [0.16]) vs no ARS (4.49 [0.16]; P=0.01, Table 2, Figure 1), longer presentations (30 minutes: 4.67 [0.13] vs <30 minutes: 4.51 [0.18]; P=0.02), and larger number of slides (50: 4.66 [0.17] vs <50: 4.55 [0.17]; P=0.04). There were no significant associations between CMETE scores and use of clinical cases, defined goals, or summary slides.
| Presentation Variable | No. (%) | Mean Score | Standard Deviation | P Value |
|---|---|---|---|---|
| Use of clinical cases | ||||
| Yes | 28 (87.5%) | 4.60 | 0.18 | 0.14 |
| No | 4 (12.5%) | 4.49 | 0.14 | |
| Audience response system | ||||
| Yes | 20 (62.5%) | 4.64 | 0.16 | 0.01 |
| No | 12 (37.5%) | 4.49 | 0.16 | |
| No. of slides | ||||
| 50 | 10 (31.3%) | 4.66 | 0.17 | 0.04 |
| <50 | 22 (68.8%) | 4.55 | 0.17 | |
| Defined goals/objectives | ||||
| Yes | 29 (90.6%) | 4.58 | 0.18 | 0.87 |
| No | 3 (9.4%) | 4.61 | 0.17 | |
| Summary slide | ||||
| Yes | 22 (68.8%) | 4.56 | 0.18 | 0.44 |
| No | 10 (31.3%) | 4.62 | 0.15 | |
| Presentation length | ||||
| 30 minutes | 14 (43.8%) | 4.67 | 0.13 | 0.02 |
| <30 minutes | 18 (56.3%) | 4.51 | 0.18 |
The magnitude of score differences observed in this study are substantial when considered in terms of Cohen's effect sizes. For number of slides, the effect size is 0.65, for audience response the effect size is 0.94, and for presentation length the effect size is approximately 1. According to Cohen, effect sizes of 0.5 to 0.8 are moderate, and effect sizes >0.8 are large. Consequently, the effect sizes of our observed differences are moderate to large.[20, 21]
DISCUSSION
To our knowledge, this is the first study to measure associations between validated teaching effectiveness scores and characteristics of presentations in HM CME. We found that the use of ARS and longer presentations were associated with significantly higher CMETE scores. Our findings have implications for HM CME course directors and presenters as they attempt to develop methods to improve the quality of CME.
CME participants in our study crossed a wide range of ages and experience, which is consistent with national surveys of hospitalists.[22, 23] Interestingly, however, nearly 1 in 3 participants trained in a specialty other than internal medicine. Additionally, the professional degrees of participants were diverse, with 20% of participants having trained as nurse practitioners or physician assistants. These findings are at odds with an early national survey of inpatient practitioners,[22] but consistent with recent literature that the diversity of training backgrounds among hospitalists is increasing as the field of HM evolves.[24] Hospital medicine CME providers will need to be cognizant of these demographic changes as they work to identify practice gaps and apply appropriate educational methods.
The use of an ARS allows for increased participation and engagement among lecture attendees, which in turn promotes active learning.[25, 26, 27] The association of higher teaching scores with the use of ARS is consistent with previous research in other CME settings such as clinical round tables and medical grand rounds.[17, 28] As it pertains to HM specifically, our findings also build upon a recent study by Sehgal et al., which reported on the novel use of bedside CME to enhance interactive learning and discussion among hospitalists, and which was viewed favorably by course participants.[29]
The reasons why longer presentations in our study were linked to higher CMETE scores are not entirely clear, as previous CME research has failed to demonstrate this relationship.[18] One possibility is that course participants prefer learning from presentations that provide granular, content‐rich information. Another possibility may be that characteristics of effective presenters who gave longer presentations and that were not measured in this study, such as presenter experience and expertise, were responsible for the observed increase in CMETE scores. Yet another possibility is that effective presentations were longer due to the use of ARS, which was also associated with better CMETE scores. This explanation may be plausible because the ARS requires additional slides and provides opportunities for audience interaction, which may lengthen the duration of any given presentation.
This study has several limitations. This was a single CME conference sponsored by a large academic medical center, which may limit generalizability, especially to smaller conferences in community settings. However, the audience was large and diverse in terms of participants experiences, practice settings, professional backgrounds, and geographic locations. Furthermore, the demographic characteristics of hospitalists at our course appear very similar to a recently reported national cross‐section of hospitalist groups.[30] Second, this is a cross‐sectional study without a comparison group. Nonetheless, a systematic review showed that most published education research studies involved single‐group designs without comparison groups.[31] Last, the outcomes of the study include attitudes and objectively measured presenter behaviors such as the use of ARS, but not patient‐related outcomes. Nonetheless, evidence indicates that the majority of medical education research does not present outcomes beyond knowledge,[31] and it has been noted that behavior‐related outcomes strike the ideal balance between feasibility and rigor.[32, 33] Finally, the instrument used in this study to measure teaching effectiveness is supported by prior validity evidence.[16]
In summary, we found that hospital medicine CME presentations, which are longer and use audience responses, are associated with greater teaching effectiveness ratings by CME course participants. These findings build upon previous CME research and suggest that CME course directors and presenters should strive to incorporate opportunities that promote audience engagement and participation. Additionally, this study adds to the existing validity of evidence for the CMETE assessment tool. We believe that future research should explore potential associations between teacher effectiveness and patient‐related outcomes, and determine whether course content that reflects the SHM core competencies improves CME teaching effectiveness scores.
Disclosure
Nothing to report.
- Society of Hospital Medicine. 2013/2014 press kit. Available at: http://www.hospitalmedicine.org/Web/Media_Center/Web/Media_Center/Media_Center.aspx?hkey=e26ceba7-ba93-4e50-8eb1-1ccc75d6f0fd. Accessed May 18, 2015.
- , , , , , . Hospitalist services: an evolving opportunity. Nurse Pract. 2008;33:9–10.
- , , , et al. The evolving role of the pediatric nurse practitioner in hospital medicine. J Hosp Med. 2014;9:261–265.
- , . The emerging role of “hospitalists” in the American health care system. N Engl J Med. 1996;335:514–517.
- Society of Hospital Medicine. Definition of a hospitalist and hospital medicine. Available at: http://www.hospitalmedicine.org/Web/About_SHM/Hospitalist_Definition/Web/About_SHM/Industry/Hospital_Medicine_Hospital_Definition.aspx. Accessed February 16, 2015.
- Accreditation Council for Continuing Medical Education. 2013 annual report data executive summary. Available at: http://www.accme.org/sites/default/files/630_2013_Annual_Report_20140715_0.pdf. Accessed February 16, 2015.
- . The anatomy of an outstanding CME meeting. J Am Coll Radiol. 2005;2:534–540.
- , , , , . How to use The Core Competencies in Hospital Medicine: a framework for curriculum development. J Hosp Med. 2006;1:57–67.
- , , , , , . Perspective: a practical approach to defining professional practice gaps for continuing medical education. Acad Med. 2012;87:582–585.
- , , , , . Core competencies in hospital medicine: development and methodology. J Hosp Med. 2006;1(suppl 1):148–156.
- , . Proposal for a collaborative approach to clinical teaching. Mayo Clin Proc. 2009;84:339–344.
- , . Developing scholarly projects in education: a primer for medical teachers. Med Teach. 2007;29:210–218.
- , . A meta‐analysis of continuing medical education effectiveness. J Contin Educ Health Prof. 2007;27:6–15.
- , , . Achieving desired results and improved outcomes: integrating planning and assessment throughout learning activities. J Contin Educ Health Prof. 2009;29:1–15.
- , . Effectiveness of continuing medical education: updated synthesis of systematic reviews. Available at: http://www.accme.org/sites/default/files/652_20141104_Effectiveness_of_Continuing_Medical_Education_Cervero_and_Gaines.pdf. Accessed March 25, 2015.
- , , , et al. Improving participant feedback to continuing medical education presenters in internal medicine: a mixed‐methods study. J Gen Intern Med. 2012;27:425–431.
- , , , et al. Measuring faculty reflection on medical grand rounds at Mayo Clinic: associations with teaching experience, clinical exposure, and presenter effectiveness. Mayo Clin Proc. 2013;88:277–284.
- , , , . Successful lecturing: a prospective study to validate attributes of the effective medical lecture. J Gen Intern Med. 2000;15:366–371.
- , , , , , . A standardized approach to assessing physician expectations and perceptions of continuing medical education. J Contin Educ Health Prof. 2007;27:173–182.
- . Statistical Power Analysis for the Behavioral Sciences. New York, NY: Academic Press; 1977.
- . Statistical Power Analysis for the Behavioral Sciences. 2nd ed. Hillsdale, NJ: Erlbaum; 1988.
- , , , . Hospitalists and the practice of inpatient medicine: results of a survey of the National Association of Inpatient Physicians. Ann Intern Med. 1999;130:343–349.
- , , , , . Worklife and satisfaction of hospitalists: toward flourishing careers. J Gen Intern Med. 2012;27:28–36.
- , , , et al. Nurse practitioner and physician assistant scope of practice in 118 acute care hospitals. J Hosp Med. 2014;9:615–620.
- , . A primer on audience response systems: current applications and future considerations. Am J Pharm Educ. 2008;72:77.
- , , . Continuing medical education: AMEE education guide no 35. Med Teach. 2008;30:652–666.
- . Clickers in the large classroom: current research and best‐practice tips. CBE Life Sci Educ. 2007;6:9–20.
- , , . Evaluation of an audience response system for the continuing education of health professionals. J Contin Educ Health Prof. 2003;23:109–115.
- , , . Bringing continuing medical education to the bedside: the University of California, San Francisco Hospitalist Mini‐College. J Hosp Med. 2014;9:129–134.
- Society of Hospital Medicine. 2014 State of Hospital Medicine Report. Philadelphia, PA: Society of Hospital Medicine; 2014.
- , , , , , . Association between funding and quality of published medical education research. JAMA. 2007;298:1002–1009.
- . Mind the gap: some reasons why medical education research is different from health services research. Med Educ. 2001;35:319–320.
- , . Reflections on experimental research in medical education. Adv Health Sci Educ Theory Pract. 2010;15:455–464.
- Society of Hospital Medicine. 2013/2014 press kit. Available at: http://www.hospitalmedicine.org/Web/Media_Center/Web/Media_Center/Media_Center.aspx?hkey=e26ceba7-ba93-4e50-8eb1-1ccc75d6f0fd. Accessed May 18, 2015.
- , , , , , . Hospitalist services: an evolving opportunity. Nurse Pract. 2008;33:9–10.
- , , , et al. The evolving role of the pediatric nurse practitioner in hospital medicine. J Hosp Med. 2014;9:261–265.
- , . The emerging role of “hospitalists” in the American health care system. N Engl J Med. 1996;335:514–517.
- Society of Hospital Medicine. Definition of a hospitalist and hospital medicine. Available at: http://www.hospitalmedicine.org/Web/About_SHM/Hospitalist_Definition/Web/About_SHM/Industry/Hospital_Medicine_Hospital_Definition.aspx. Accessed February 16, 2015.
- Accreditation Council for Continuing Medical Education. 2013 annual report data executive summary. Available at: http://www.accme.org/sites/default/files/630_2013_Annual_Report_20140715_0.pdf. Accessed February 16, 2015.
- . The anatomy of an outstanding CME meeting. J Am Coll Radiol. 2005;2:534–540.
- , , , , . How to use The Core Competencies in Hospital Medicine: a framework for curriculum development. J Hosp Med. 2006;1:57–67.
- , , , , , . Perspective: a practical approach to defining professional practice gaps for continuing medical education. Acad Med. 2012;87:582–585.
- , , , , . Core competencies in hospital medicine: development and methodology. J Hosp Med. 2006;1(suppl 1):148–156.
- , . Proposal for a collaborative approach to clinical teaching. Mayo Clin Proc. 2009;84:339–344.
- , . Developing scholarly projects in education: a primer for medical teachers. Med Teach. 2007;29:210–218.
- , . A meta‐analysis of continuing medical education effectiveness. J Contin Educ Health Prof. 2007;27:6–15.
- , , . Achieving desired results and improved outcomes: integrating planning and assessment throughout learning activities. J Contin Educ Health Prof. 2009;29:1–15.
- , . Effectiveness of continuing medical education: updated synthesis of systematic reviews. Available at: http://www.accme.org/sites/default/files/652_20141104_Effectiveness_of_Continuing_Medical_Education_Cervero_and_Gaines.pdf. Accessed March 25, 2015.
- , , , et al. Improving participant feedback to continuing medical education presenters in internal medicine: a mixed‐methods study. J Gen Intern Med. 2012;27:425–431.
- , , , et al. Measuring faculty reflection on medical grand rounds at Mayo Clinic: associations with teaching experience, clinical exposure, and presenter effectiveness. Mayo Clin Proc. 2013;88:277–284.
- , , , . Successful lecturing: a prospective study to validate attributes of the effective medical lecture. J Gen Intern Med. 2000;15:366–371.
- , , , , , . A standardized approach to assessing physician expectations and perceptions of continuing medical education. J Contin Educ Health Prof. 2007;27:173–182.
- . Statistical Power Analysis for the Behavioral Sciences. New York, NY: Academic Press; 1977.
- . Statistical Power Analysis for the Behavioral Sciences. 2nd ed. Hillsdale, NJ: Erlbaum; 1988.
- , , , . Hospitalists and the practice of inpatient medicine: results of a survey of the National Association of Inpatient Physicians. Ann Intern Med. 1999;130:343–349.
- , , , , . Worklife and satisfaction of hospitalists: toward flourishing careers. J Gen Intern Med. 2012;27:28–36.
- , , , et al. Nurse practitioner and physician assistant scope of practice in 118 acute care hospitals. J Hosp Med. 2014;9:615–620.
- , . A primer on audience response systems: current applications and future considerations. Am J Pharm Educ. 2008;72:77.
- , , . Continuing medical education: AMEE education guide no 35. Med Teach. 2008;30:652–666.
- . Clickers in the large classroom: current research and best‐practice tips. CBE Life Sci Educ. 2007;6:9–20.
- , , . Evaluation of an audience response system for the continuing education of health professionals. J Contin Educ Health Prof. 2003;23:109–115.
- , , . Bringing continuing medical education to the bedside: the University of California, San Francisco Hospitalist Mini‐College. J Hosp Med. 2014;9:129–134.
- Society of Hospital Medicine. 2014 State of Hospital Medicine Report. Philadelphia, PA: Society of Hospital Medicine; 2014.
- , , , , , . Association between funding and quality of published medical education research. JAMA. 2007;298:1002–1009.
- . Mind the gap: some reasons why medical education research is different from health services research. Med Educ. 2001;35:319–320.
- , . Reflections on experimental research in medical education. Adv Health Sci Educ Theory Pract. 2010;15:455–464.
© 2015 Society of Hospital Medicine
Frequently Admitted Patients
The national healthcare improvement paradigm is shifting toward a more comprehensive, value‐focused, and patient‐centered approach. Reducing hospital readmissions has become a focal point as a policy strategy to improve care quality while reducing cost. Section 3025 of the Affordable Care Act mandated the Centers for Medicare and Medicaid Services to make progressive reductions in Medicare payments to hospitals that have higher than expected readmission rates for 3 conditions (heart failure, acute myocardial infarction, and pneumonia), and expanding to include chronic obstructive pulmonary disease and total hip and knee arthroplasty in 2015.[1] In response, hospitals and systems are developing and implementing programs that coordinate care beyond hospital walls to reduce readmissions and healthcare costs.[2, 3] However, patients are readmitted for a variety of reasons, and programs that address the needs of some may not address the distinct needs of others. Understanding the characteristics of patients with frequent readmissions will permit the well‐informed creation of solutions specific to this population to reduce cost, free resources, and provide better care.
Although a solid body of literature already exists that describes the characteristics of patients who frequently visit the emergency department (ED),[4, 5, 6, 7, 8, 9, 10, 11, 12] it is not clear to what extent these characteristics also apply to patients with frequent hospital admissions. Frequent ED visitors have been found to be largely insured (85%) although with over‐representation of public insurance, and to be heavy users of the healthcare system overall.[6] A high disease burden associated with multiple chronic conditions has been found to predict frequent ED use.[4, 9, 11, 12] Some characteristics may vary by location; for example, alcohol abuse and psychiatric morbidity have been found to be associated with frequent ED use in New York and San Francisco, but it is not clear to what extent they are a factor in less urban areas.[4, 6, 12]
Several previous studies have investigated the characteristics of frequently admitted patients at single sites.[13, 14, 15, 16] Nguyen et al. (2013) studied patients with the highest costs and the most admissions at a large academic medical center in San Francisco.[13] High admit patients were defined as those responsible for the top decile of admissions, and were grouped into equal‐sized high‐ and low‐cost cohorts. The high‐admission/high‐cost group represented 5% of all patients, 25% of all costs, and 16% of all admissions. These patients were hospitalized primarily for medical conditions (78%) and had a high 30‐day readmission rate (47%). The high‐admission/low‐cost group accounted for 5% of all patients, 12% of all admissions, and 7% of all costs. These patients were also predominantly admitted for medical conditions (87%), with the most common admitting diagnoses representing respiratory, gastrointestinal, and cardiovascular conditions.[13]
Hwa (2012) conducted an analysis of 29 patients admitted 6 or more times in 1 year to an inpatient medical service in San Francisco.[14] These patients represented just 1% of all patients, but 13% of readmissions. Fifty‐five percent of these patients had a psychiatric diagnosis, and 52% had chronic pain. Ninety percent had a primary care physician in the hospital system, 100% were insured either privately or publicly, and 93% had housing, although for 17% housing was described as marginal.[14]
In a third study, Boonyasai et al. (2012) identified 76 patients with 82 readmissions at a Baltimore, Maryland, hospital and classified them as isolated (1 readmission per 6‐month period) or serial (more than 1 readmission per 6‐month period) readmissions.[15] Patients with serial readmissions accounted for 70% of the total. Isolated readmissions were most likely to be related to suboptimal quality of care and care coordination, whereas serial readmissions were more likely to result from disease progression, psychiatric illness, and substance abuse.[15]
All of these studies were conducted at single‐site academic medical centers serving inner city populations. We undertook this study to identify patient and hospital‐level characteristics of frequently admitted patients in a broad sample of 101 US academic medical centers to determine whether previously reported findings are generalizable, and to identify characteristics of frequently admitted patients that can inform interventions designed to meet the needs of this relatively small but resource‐intensive group of patients.
METHODS
All data were obtained from the University HealthSystem Consortium (UHC) (Chicago, IL) Clinical Data Base/Resource Manager (CDB), a large administrative database to which UHC principal members submit comprehensive administrative data files. UHC's principal members include approximately 120 US academic medical centers delivering tertiary and quaternary care, with an average of 647 acute care beds. The CDB includes primary and secondary diagnoses using International Classification of Diseases, Ninth Revision (ICD‐9)[17] codes.
The data of 101 academic medical centers with complete datasets for the study period (October 1, 2011, to September 30, 2012) were included in this analysis. Frequently admitted patients were defined as patients admitted 5 or more times to the same facility in a 12‐month period; all admissions were included, even those more than 30 days apart. This definition was established based on a naturally occurring break in the frequency distribution (Figure 1) and our intention to focus on the unique characteristics of patients at the far right of the distribution. We excluded obstetric (MDC 14, ICD‐9)[17] admissions and pediatric (<18 years of age at index admission) patients, as well as admissions with principal diagnoses for chemotherapy (ICD‐9 diagnosis codes v5811v5812), dialysis (ICD‐9 diagnosis codes v560v568), and rehabilitation (ICD‐9 diagnosis codes v570v579), which are typically planned. The Agency for Healthcare Research and Quality (AHRQ) comorbidity software was used to identify comorbid conditions,[18, 19] and a score based on the Elixhauser comorbidity measures was calculated using a modified acuity point system.[20] For comparisons based on safety net status, we used a definition of payer mix being 25% Medicaid or uninsured.
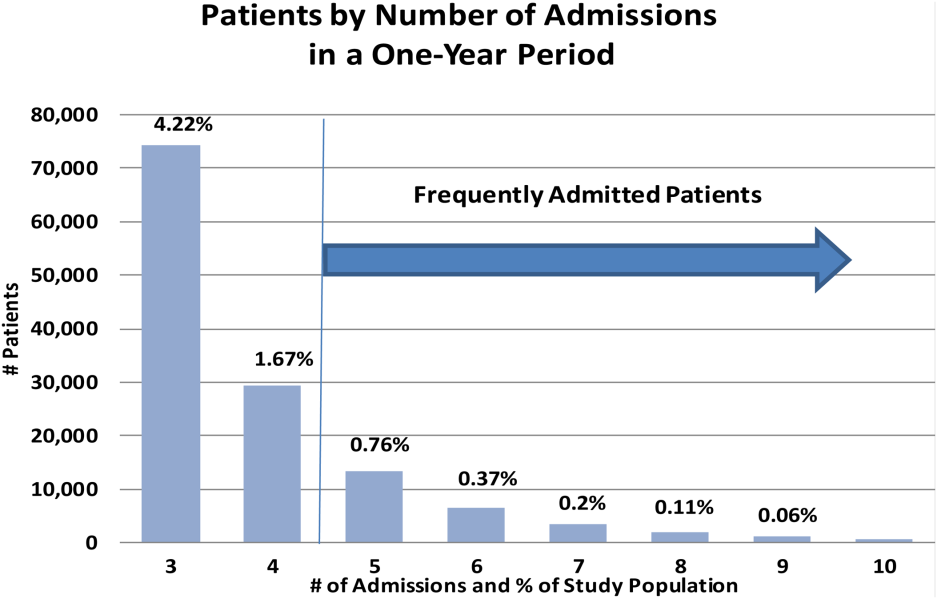
Our analyses included patient demographics, admission source and discharge status, clinical diagnoses, procedures, and comorbidities, cost, and length of stay. Patients defined as frequently admitted were compared in aggregate to all other hospitalized patients (all other admissions).
To evaluate associations, we used [2] tests for categorical variables and t tests for continuous variables. When comparing the non‐normally distributed comorbidities of the control group to the normally distributed comorbidities of the frequently admitted patients, we performed a Kruskal‐Wallis test on the medians.
RESULTS
During a 1‐year period (October 1, 2011, to September 30, 2012), 1,758,027 patients were admitted 2,388,124 times at 101 academic medical centers. Of these, 28,291 patients had 5 or more admissions during this period, resulting in 180,185 admissions. These frequently admitted patients represented 1.6% of all patients (Figure 1) and 7.6% of all inpatient admissions. By comparison, nonfrequently admitted patients were admitted once (79%), twice (14%), 3 times (4%), or 4 times (2%).
Among hospitals, the volume and impact of frequently admitted patients varied widely. The frequently admitted patient population ranged from 64 patients (0.7% of all patients) to 785 patients (3.5%), with an average of 280 patients (1.6%). To look for differences that might explain this range, we compared hospitals in the top and bottom deciles with respect to geographic region and to safety net status, but found no significant or meaningful differences. The average number of admissions per patient was 6.4, with a range of 5 to 76. Days per patient ranged from 5 to 434 days, with an average of 42. The average patient‐day percentage (frequently admitted patient days/total patient days) was 8.4%, and ranged from 3.2% to 15.4%.
Frequently admitted patients were more likely to be younger than all other patients (71.9% under the age of 65 years, as compared with 65.3% of all other patients (P<0.001)). They were also more likely to have either Medicaid or no healthcare insurance (27.6% compared with 21.6%, P<0.001), although nearly three‐quarters had either private insurance or Medicare coverage.
Eighty‐four percent of frequently admitted patient admissions were to medical services (vs 58% of all other patients (P<0.001)). The admission status for these patients was much less likely to be elective (9.1% of frequently admitted patient admissions vs 26.6% of all other patients' admissions [P<0.001]). Frequently admitted patients were more likely to be discharged to a skilled nursing facility (9.3% vs 8.4%, [P<0.001]) or with home health services (19.7% vs 13.4% [P<0.001]).
The 10 most common primary diagnoses for patient admissions are shown in Table 1. No single primary diagnosis accounted for a large share of the admissions of these patients; the most common diagnosis, sickle cell disease with crisis, accounted for only about 4% of admissions. The 10 most common diagnoses accounted for <20% of all admissions. The remainder of the diagnoses was spread over more than 3000 diagnosis codes; only about 300 codes had more than 100 admissions each.
| Primary Diagnoses | Secondary Diagnoses | Principal Procedures | ||||||||
|---|---|---|---|---|---|---|---|---|---|---|
| Frequently Admitted Patient Admissions, N=180,185 | All Other Patient Admissions, N=2,207,939 | All Other Patient Rank | Frequently Admitted Patient Admissions, N=180,185 | All Other Patient Admissions, N=2,207,939 | All Other PatientRank | Frequently Admitted Patient Admissions, N=180,185 | All Other Patient Admissions, N=2,207,939 | |||
| ||||||||||
| Sickle cell disease with crisis | 3.97% (7,152) | 0.002% (5,887) | 63 | Hypertension NOS | 31.39% (56,556) | 40.04% (884,045) | 1 | Hemodialysis | 6.32% (11,380) | 1.08% (23,871) |
| Septicemia NOS | 2.58% (4,652) | 1.87% (41,369) | 1 | Hyperlipidemia NOS | 24.47% (44,089) | 25.94% (572,760) | 2 | Packed cell transfusion | 4.49% (8.091) | 1.57% (34,669) |
| Acute and chronic systolic heart failure | 2.06% (3,708) | 0.81% (17,802) | 12 | Congestive heart failure NOS | 22.86% (41,197) | 11.82% (260,944) | 8 | Percutaneous abdominal drainage | 2.42% (4,366) | 0.86% (18,974) |
| Acute kidney failure NOS | 2.04% (3,680) | 1.16% (25,528) | 6 | Esophageal reflux | 21.19% (38,184) | 17.32% (382,511) | 3 | Venous catheter NEC | 2.13% (3,843) | 0.89% (19,718) |
| Obstructive chronic bronchitis with exacerbation | 1.76% (3,180) | 0.68% (14,957) | 14 | Diabetes mellitus NOS uncomplicated | 20.39% (36,743) | 16.75% (369,808) | 4 | Central venous catheter placement with guidewire | 2.13% (3,834)) | 0.83% (18,307) |
| Pneumonia organism NOS | 1.72% (3,091) | 1.29% (28,468) | 4 | Tobacco use disorder | 16.98% (30,604) | 16.71% (368,880) | 5 | Continuous invasive mechanical ventilation <96 consecutive hours | 1.38% (2,480) | 0.7% (15,441) |
| Urinary tract infection NOS | 1.63% (2,939) | 0.86% (19,069) | 9 | History of tobacco use | 16.89% (30,439) | 14.77% (326,026) | 6 | Noninvasive mechanical ventilation | 1.3% (2,345) | 0.58% (12,899) |
| Acute pancreatitis | 1.23% (2,212) | 0.73% (16,168) | 13 | Coronary atherosclerosis native vessel | 16.12% (29,040) | 12.88% (284,487) | 7 | Small intestine endoscopy NEC | 1.26% (2.265) | 0.7% (15,480) |
| Acute and chronic diastolic heart failure | 1.22% (2,190) | 0.48% (10,600) | 22 | Depressive disorder | 15.42% (27,785) | 10.34% (228,347) | 10 | Heart ultrasound | 1.11% (1,997) | 1.37% (30,161) |
| Complication of kidney transplant | 1.08% (1,944) | 0.42% (9,354) | 28 | Acute kidney failure NOS | 13.8% (24,859) | 9.37%% (206,951) | 12 | Esophagogastroduodenoscopy with closed biopsy | 1.09% (1,963) | 0.8% (17,644) |
Secondary diagnoses were mainly chronic conditions, including hypertension, hyperlipidemia, esophageal reflux, and diabetes mellitus type 2 (Table 1.) Combined, congestive heart failure and diabetes mellitus accounted for 43.3% of the secondary diagnoses of admissions of frequently admitted patients, but for only 28.6% of other patients. Acute kidney failure was more common in frequently admitted patients (13.8% vs 9.4% [P<0.001]). Psychiatric disorders accounted for <1% of primary diagnoses for both frequently admitted patients and all other patients. As a secondary diagnosis, depressive disorder appeared in the top 10 for both groups, although more commonly for frequently admitted patients (15.4% vs 10.3% [P<0.001]).
The most commonly performed principal procedures are also shown in Table 1. These include hemodialysis (6.32%) and packed cell transfusion (4.49%), nonoperating room procedures associated with chronic medical conditions.
Comorbidities were compared using the AHRQ comorbidity software.[18, 19] Comorbid conditions were counted once per patient, regardless of the number of admissions in which the condition was coded. Frequently admitted patients have a significantly higher mean number of comorbidities: 7.1 compared to 2.5 for all other patients (P<0.001; Figure 2). In an additional analysis using the Elixhauser comorbidity measures to determine acuity scores, the mean scores were 13.1 for frequently admitted patients and 3.17 for all others (P<0.001). The most common comorbidities were hypertension (74%), fluid and electrolyte disorders (73%), and deficiency anemias (66%). The only behavioral health comorbidity that affected more than a quarter of frequently admitted patients was depression (40% as compared to 13% for all others).
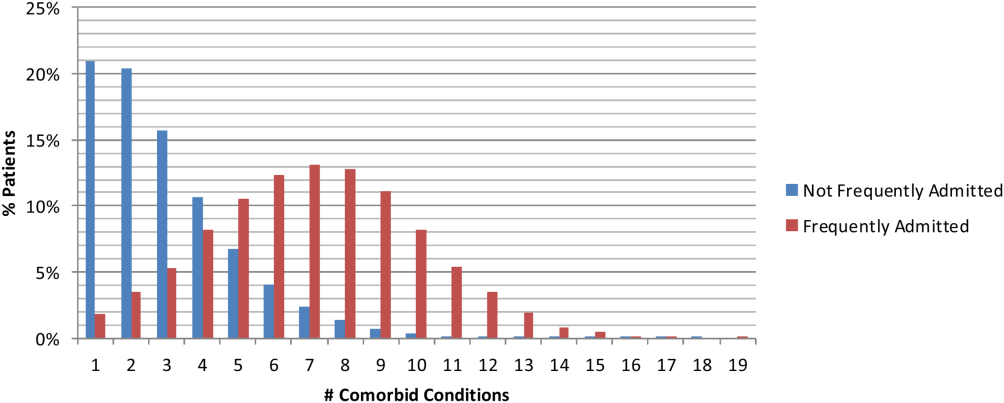
Additionally, frequently admitted patients were significantly more likely to have comorbidities of psychosis (18% vs 5% [P<0.001]), alcohol abuse (16% vs 7% [P<0.001]), and drug abuse (20% vs 7% [P<0.001]). Among hospitals, these comorbidities ranged widely: psychosis (3% 48%); alcohol abuse (3%46%); and drug abuse (3%58%). Hospitals with the highest rates (top decile) of frequently admitted patients with alcohol and drug abuse comorbidities were more likely to be safety net hospitals than those in the lowest decile (P<0.05 for each independently), but no such difference was found regarding rates of patients with psychosis.
Although the frequently admitted patient population accounted for only 1.6% of patients, they accounted for an average of 8.4% of all bed days and 7.1% of direct cost. The average cost per day was $1746, compared to $2144 for all other patients (Table 2).
| Length of Stay, Days | Direct Cost | % Total Bed Days | Cost/Day | All Other Patients Cost/Day | Difference | |
|---|---|---|---|---|---|---|
| Minimum | 1.0 | 2.3% | 3.2% | $809 | $1,005 | $(196) |
| Maximum | 86.8 | 14.1% | 15.4% | $3,208 | $4,070 | $(862) |
| Mean | 6.7 | 7.1% | 8.4% | $1,746 | $2,144 | $(398) |
| Median | 5.5 | 7.0% | 8.3% | $1,703 | $2,112 | $(410) |
DISCUSSION
An extensive analysis of the characteristics of frequently admitted patients at 101 US academic medical centers, from October 1, 2011 to September 30, 2012, revealed that these patients comprised 1.6% of all patients, but accounted for 8% of all admissions and 7% of direct costs. Relative to all other hospitalized patients, frequently admitted patients were likely to be younger, of lower socioeconomic status, in poorer health, and more often affected by mental health or substance abuse conditions that may mediate their health behaviors. However, the prevalence of patients with psychiatric or behavior conditions varied widely among hospitals, and hospitals with the highest rates of patients with substance abuse comorbidities were more likely to be safety net hospitals. Frequently admitted patients' diagnoses and procedures suggest that their admissions were related to complex chronic diseases; more than three‐quarters were admitted to medicine services, and their average length of stay was nearly 7 days. No single primary diagnosis accounted for a predominant share of their admissions; the most common diagnosis, sickle cell disease with crisis, accounted for only about 4%. The cost of their care was lower than that of other patients, reflecting the preponderance of their admissions to medicine service lines.
In many ways, frequently admitted patients seem similar to frequent ED visitors. Their visits were driven by a high disease burden associated with multiple chronic conditions, and they were heavy users of the healthcare system overall.[4, 6] The majority of both groups were insured, although there was over‐representation of public insurance.[6] As with frequent ED users, some frequently admitted patients are affected by psychiatric morbidity and substance abuse.[4, 12]
Our results in some ways confirmed, and in some ways differed from, findings of prior studies of patients with frequent hospital admissions. Although each study performed to date has defined the population differently, comparison of findings is useful. Our population was similar to the high‐admission groups identified by Nguyen et al. (patients responsible for the top decile of admissions).[13] These patients were also predominantly admitted for medical conditions, with common admitting diagnoses representing respiratory, gastrointestinal, and cardiovascular conditions. However, the median length of stay (3 days for the high‐admission/low‐cost group and 5 days for the high‐admission/high‐cost group) was lower than that of our population (5.5 days).
Hwa, who studied 29 patients admitted 6 or more times in 1 year to an inpatient medical service in San Francisco,[14] found that 55% of frequently admitted patients had a psychiatric diagnosis, higher than our patient population. Our findings are similar to those of Boonyasai et al.[15] whose serial readmitters had admissions resulting from disease progression, psychiatric illness, and substance abuse.
Our more nationally representative analysis documented a wide range of patient volumes and clinical characteristics, including psychiatric and substance abuse comorbidities, across study hospitals. It demonstrates that different approachesand resourcesare needed to meet the needs of these varied groups of patients. Each hospital must identify, evaluate, and understand its own population of frequently admitted patients to create well‐informed solutions to prevent repeat hospitalization for these patients.
Our ability to create a distinctive picture of the population of frequently admitted patients in US academic medical centers is based on access to an expansive dataset that captures complete diagnostic and demographic information on the universe of patients admitted to our member hospitals. The availability of clinical and administrative data for the entire population of patients permits both an accurate description of patient characteristics and a standardized comparison of groups. All data conform to accepted formats and definitions; their validity is universally recognized by contributing database participants.
Limitations
There are several important limitations to our study. First, patients with 5 or more admissions in 1 year may be undercounted. The UHC Clinical Data Base/Resource Manager only captures readmissions to a single facility; admissions of any patient admitted to more than 1 hospital, even within the UHC membership, cannot be determined. This could have a particularly strong effect on our ability to detect admissions of patients with acute episodes related to psychiatric illness or substance abuse, as they may be more likely to present to multiple or specialty hospitals. Additionally, readmission rates vary among UHC‐member hospitals, based to some extent on geography and the availability of alternative settings of care.
It is possible that surveillance bias played a role in our finding that frequently admitted patients have a significantly higher mean number of comorbidities; each admission presents an opportunity to document additional comorbid conditions. Psychiatric conditions may be underdocumented in medical settings in academic medical centers, where the focus is often on acute medical conditions. Additionally, certain data elements that we believe are central to understanding the characteristics of frequently admitted patients are not part of the UHC Clinical Data Base/Resource Manager and were therefore not a part of our analysis. These highly influential upstream determinants of health include documentation of a primary care physician, housing status, and access to services at discharge.
CONCLUSION
The valuable information reported from analysis of nearly 2 million patients in the UHC Clinical Data Base/Resource Manager can be used to better understand the characteristics of frequently admitted patients. This important cohort of individuals has complex care needs that often result in hospitalization, but may be amenable to solutions that allow patients to remain in their communities. By understanding the demographic, social, and medical characteristics of these patients, hospitals can develop and implement solutions that address the needs of this small group of patients who consume a highly disproportionate share of healthcare resources.
Acknowledgements
The authors acknowledge the contributions of Samuel F. Hohmann, PhD, and Ryan Carroll, MBA, who provided expert statistical analyses and generous assistance in the completion of this article.
Disclosure: Nothing to report.
- Centers for Medicare 21(9):117–120.
- , , , . The influence of a postdischarge intervention on reducing hospital readmissions in a Medicare population. Popul Health Manag. 2013;16(5):310–316.
- , . Dispelling an urban legend: frequent emergency department users have substantial burden of disease. Health Aff (Millwood). 2013;32:2099–2108.
- , , , et al. Effectiveness of interventions targeting frequent users of emergency departments: a systematic review. Ann Emerg Med. 2011;58:41–52.
- , . Frequent users of emergency departments: the myths, the data, and the policy implications. Ann Emerg Med. 2010;20(10):1–8.
- , , , . Development and validation of a model for predicting emergency admissions over the next year. Arch Intern Med. 2008;168:1416–1422.
- , , , et al. A comparison of frequent and infrequent visitors to an urban emergency department. J Emerg Med. 2008;38:115–121.
- , . Frequent users of Massachusetts emergency departments: a statewide analysis. Ann Emerg Med. 2006;48:9–16.
- , , , et al. A descriptive study of heavy emergency department users at an academic emergency department reveals heavy users have better access to care than average users. J Emerg Nurs. 2005;31:139–144.
- , , . Predictors and outcomes of frequent emergency department users. Acad Emerg Med. 2003;10:320–328.
- , , . Epidemiologic analysis of an urban, public emergency department's frequent users. Acad Emerg Med. 2000;7:637–646.
- , , , . What's cost got to do with it? Association between hospital costs and frequency of admissions among “high users” of hospital care. J Hosp Med. 2013;8:665–671.
- . Characteristics of a frequently readmitted patient population on an inpatient medical service. Abstract presented at: Society of Hospital Medicine Annual Meeting, April 1– 4, 2012; San Diego, CA.
- , , , , . Characteristics of isolated and serial rehospitalizations suggest a need for different types of improvement strategies [abstract] J Hosp Med. 2012;7(suppl 2):513.
- , , , , . An intervention to improve care and reduce costs for high‐risk patients with frequent hospital admissions: a pilot study. BMC Health Serv Res. 2011;11:270–279.
- Centers for Disease Control and Prevention. International Classification of Diseases, Ninth Revision (ICD‐9). Available at: http://www.cdc.gov/nchs/icd/icd9.htm. Accessed February 18, 2015.
- Agency for Healthcare Research and Quality, Healthcare Cost and Utilization Project. Comorbidity software, version 3.7. Available at: http://www.hcup‐us.ahrq.gov/toolssoftware/comorbidity/comorbidity.jsp. Accessed February 18, 2015.
- , , , . Comorbidity measures for use with administrative data. Med Care. 1998;36:8–27.
- , , , , . A modification of the Elixhauser comorbidity measures into a point system for hospital death using administrative data. Med Care. 2009;47:626–633.
The national healthcare improvement paradigm is shifting toward a more comprehensive, value‐focused, and patient‐centered approach. Reducing hospital readmissions has become a focal point as a policy strategy to improve care quality while reducing cost. Section 3025 of the Affordable Care Act mandated the Centers for Medicare and Medicaid Services to make progressive reductions in Medicare payments to hospitals that have higher than expected readmission rates for 3 conditions (heart failure, acute myocardial infarction, and pneumonia), and expanding to include chronic obstructive pulmonary disease and total hip and knee arthroplasty in 2015.[1] In response, hospitals and systems are developing and implementing programs that coordinate care beyond hospital walls to reduce readmissions and healthcare costs.[2, 3] However, patients are readmitted for a variety of reasons, and programs that address the needs of some may not address the distinct needs of others. Understanding the characteristics of patients with frequent readmissions will permit the well‐informed creation of solutions specific to this population to reduce cost, free resources, and provide better care.
Although a solid body of literature already exists that describes the characteristics of patients who frequently visit the emergency department (ED),[4, 5, 6, 7, 8, 9, 10, 11, 12] it is not clear to what extent these characteristics also apply to patients with frequent hospital admissions. Frequent ED visitors have been found to be largely insured (85%) although with over‐representation of public insurance, and to be heavy users of the healthcare system overall.[6] A high disease burden associated with multiple chronic conditions has been found to predict frequent ED use.[4, 9, 11, 12] Some characteristics may vary by location; for example, alcohol abuse and psychiatric morbidity have been found to be associated with frequent ED use in New York and San Francisco, but it is not clear to what extent they are a factor in less urban areas.[4, 6, 12]
Several previous studies have investigated the characteristics of frequently admitted patients at single sites.[13, 14, 15, 16] Nguyen et al. (2013) studied patients with the highest costs and the most admissions at a large academic medical center in San Francisco.[13] High admit patients were defined as those responsible for the top decile of admissions, and were grouped into equal‐sized high‐ and low‐cost cohorts. The high‐admission/high‐cost group represented 5% of all patients, 25% of all costs, and 16% of all admissions. These patients were hospitalized primarily for medical conditions (78%) and had a high 30‐day readmission rate (47%). The high‐admission/low‐cost group accounted for 5% of all patients, 12% of all admissions, and 7% of all costs. These patients were also predominantly admitted for medical conditions (87%), with the most common admitting diagnoses representing respiratory, gastrointestinal, and cardiovascular conditions.[13]
Hwa (2012) conducted an analysis of 29 patients admitted 6 or more times in 1 year to an inpatient medical service in San Francisco.[14] These patients represented just 1% of all patients, but 13% of readmissions. Fifty‐five percent of these patients had a psychiatric diagnosis, and 52% had chronic pain. Ninety percent had a primary care physician in the hospital system, 100% were insured either privately or publicly, and 93% had housing, although for 17% housing was described as marginal.[14]
In a third study, Boonyasai et al. (2012) identified 76 patients with 82 readmissions at a Baltimore, Maryland, hospital and classified them as isolated (1 readmission per 6‐month period) or serial (more than 1 readmission per 6‐month period) readmissions.[15] Patients with serial readmissions accounted for 70% of the total. Isolated readmissions were most likely to be related to suboptimal quality of care and care coordination, whereas serial readmissions were more likely to result from disease progression, psychiatric illness, and substance abuse.[15]
All of these studies were conducted at single‐site academic medical centers serving inner city populations. We undertook this study to identify patient and hospital‐level characteristics of frequently admitted patients in a broad sample of 101 US academic medical centers to determine whether previously reported findings are generalizable, and to identify characteristics of frequently admitted patients that can inform interventions designed to meet the needs of this relatively small but resource‐intensive group of patients.
METHODS
All data were obtained from the University HealthSystem Consortium (UHC) (Chicago, IL) Clinical Data Base/Resource Manager (CDB), a large administrative database to which UHC principal members submit comprehensive administrative data files. UHC's principal members include approximately 120 US academic medical centers delivering tertiary and quaternary care, with an average of 647 acute care beds. The CDB includes primary and secondary diagnoses using International Classification of Diseases, Ninth Revision (ICD‐9)[17] codes.
The data of 101 academic medical centers with complete datasets for the study period (October 1, 2011, to September 30, 2012) were included in this analysis. Frequently admitted patients were defined as patients admitted 5 or more times to the same facility in a 12‐month period; all admissions were included, even those more than 30 days apart. This definition was established based on a naturally occurring break in the frequency distribution (Figure 1) and our intention to focus on the unique characteristics of patients at the far right of the distribution. We excluded obstetric (MDC 14, ICD‐9)[17] admissions and pediatric (<18 years of age at index admission) patients, as well as admissions with principal diagnoses for chemotherapy (ICD‐9 diagnosis codes v5811v5812), dialysis (ICD‐9 diagnosis codes v560v568), and rehabilitation (ICD‐9 diagnosis codes v570v579), which are typically planned. The Agency for Healthcare Research and Quality (AHRQ) comorbidity software was used to identify comorbid conditions,[18, 19] and a score based on the Elixhauser comorbidity measures was calculated using a modified acuity point system.[20] For comparisons based on safety net status, we used a definition of payer mix being 25% Medicaid or uninsured.
Our analyses included patient demographics, admission source and discharge status, clinical diagnoses, procedures, and comorbidities, cost, and length of stay. Patients defined as frequently admitted were compared in aggregate to all other hospitalized patients (all other admissions).
To evaluate associations, we used [2] tests for categorical variables and t tests for continuous variables. When comparing the non‐normally distributed comorbidities of the control group to the normally distributed comorbidities of the frequently admitted patients, we performed a Kruskal‐Wallis test on the medians.
RESULTS
During a 1‐year period (October 1, 2011, to September 30, 2012), 1,758,027 patients were admitted 2,388,124 times at 101 academic medical centers. Of these, 28,291 patients had 5 or more admissions during this period, resulting in 180,185 admissions. These frequently admitted patients represented 1.6% of all patients (Figure 1) and 7.6% of all inpatient admissions. By comparison, nonfrequently admitted patients were admitted once (79%), twice (14%), 3 times (4%), or 4 times (2%).
Among hospitals, the volume and impact of frequently admitted patients varied widely. The frequently admitted patient population ranged from 64 patients (0.7% of all patients) to 785 patients (3.5%), with an average of 280 patients (1.6%). To look for differences that might explain this range, we compared hospitals in the top and bottom deciles with respect to geographic region and to safety net status, but found no significant or meaningful differences. The average number of admissions per patient was 6.4, with a range of 5 to 76. Days per patient ranged from 5 to 434 days, with an average of 42. The average patient‐day percentage (frequently admitted patient days/total patient days) was 8.4%, and ranged from 3.2% to 15.4%.
Frequently admitted patients were more likely to be younger than all other patients (71.9% under the age of 65 years, as compared with 65.3% of all other patients (P<0.001)). They were also more likely to have either Medicaid or no healthcare insurance (27.6% compared with 21.6%, P<0.001), although nearly three‐quarters had either private insurance or Medicare coverage.
Eighty‐four percent of frequently admitted patient admissions were to medical services (vs 58% of all other patients (P<0.001)). The admission status for these patients was much less likely to be elective (9.1% of frequently admitted patient admissions vs 26.6% of all other patients' admissions [P<0.001]). Frequently admitted patients were more likely to be discharged to a skilled nursing facility (9.3% vs 8.4%, [P<0.001]) or with home health services (19.7% vs 13.4% [P<0.001]).
The 10 most common primary diagnoses for patient admissions are shown in Table 1. No single primary diagnosis accounted for a large share of the admissions of these patients; the most common diagnosis, sickle cell disease with crisis, accounted for only about 4% of admissions. The 10 most common diagnoses accounted for <20% of all admissions. The remainder of the diagnoses was spread over more than 3000 diagnosis codes; only about 300 codes had more than 100 admissions each.
| Primary Diagnoses | Secondary Diagnoses | Principal Procedures | ||||||||
|---|---|---|---|---|---|---|---|---|---|---|
| Frequently Admitted Patient Admissions, N=180,185 | All Other Patient Admissions, N=2,207,939 | All Other Patient Rank | Frequently Admitted Patient Admissions, N=180,185 | All Other Patient Admissions, N=2,207,939 | All Other PatientRank | Frequently Admitted Patient Admissions, N=180,185 | All Other Patient Admissions, N=2,207,939 | |||
| ||||||||||
| Sickle cell disease with crisis | 3.97% (7,152) | 0.002% (5,887) | 63 | Hypertension NOS | 31.39% (56,556) | 40.04% (884,045) | 1 | Hemodialysis | 6.32% (11,380) | 1.08% (23,871) |
| Septicemia NOS | 2.58% (4,652) | 1.87% (41,369) | 1 | Hyperlipidemia NOS | 24.47% (44,089) | 25.94% (572,760) | 2 | Packed cell transfusion | 4.49% (8.091) | 1.57% (34,669) |
| Acute and chronic systolic heart failure | 2.06% (3,708) | 0.81% (17,802) | 12 | Congestive heart failure NOS | 22.86% (41,197) | 11.82% (260,944) | 8 | Percutaneous abdominal drainage | 2.42% (4,366) | 0.86% (18,974) |
| Acute kidney failure NOS | 2.04% (3,680) | 1.16% (25,528) | 6 | Esophageal reflux | 21.19% (38,184) | 17.32% (382,511) | 3 | Venous catheter NEC | 2.13% (3,843) | 0.89% (19,718) |
| Obstructive chronic bronchitis with exacerbation | 1.76% (3,180) | 0.68% (14,957) | 14 | Diabetes mellitus NOS uncomplicated | 20.39% (36,743) | 16.75% (369,808) | 4 | Central venous catheter placement with guidewire | 2.13% (3,834)) | 0.83% (18,307) |
| Pneumonia organism NOS | 1.72% (3,091) | 1.29% (28,468) | 4 | Tobacco use disorder | 16.98% (30,604) | 16.71% (368,880) | 5 | Continuous invasive mechanical ventilation <96 consecutive hours | 1.38% (2,480) | 0.7% (15,441) |
| Urinary tract infection NOS | 1.63% (2,939) | 0.86% (19,069) | 9 | History of tobacco use | 16.89% (30,439) | 14.77% (326,026) | 6 | Noninvasive mechanical ventilation | 1.3% (2,345) | 0.58% (12,899) |
| Acute pancreatitis | 1.23% (2,212) | 0.73% (16,168) | 13 | Coronary atherosclerosis native vessel | 16.12% (29,040) | 12.88% (284,487) | 7 | Small intestine endoscopy NEC | 1.26% (2.265) | 0.7% (15,480) |
| Acute and chronic diastolic heart failure | 1.22% (2,190) | 0.48% (10,600) | 22 | Depressive disorder | 15.42% (27,785) | 10.34% (228,347) | 10 | Heart ultrasound | 1.11% (1,997) | 1.37% (30,161) |
| Complication of kidney transplant | 1.08% (1,944) | 0.42% (9,354) | 28 | Acute kidney failure NOS | 13.8% (24,859) | 9.37%% (206,951) | 12 | Esophagogastroduodenoscopy with closed biopsy | 1.09% (1,963) | 0.8% (17,644) |
Secondary diagnoses were mainly chronic conditions, including hypertension, hyperlipidemia, esophageal reflux, and diabetes mellitus type 2 (Table 1.) Combined, congestive heart failure and diabetes mellitus accounted for 43.3% of the secondary diagnoses of admissions of frequently admitted patients, but for only 28.6% of other patients. Acute kidney failure was more common in frequently admitted patients (13.8% vs 9.4% [P<0.001]). Psychiatric disorders accounted for <1% of primary diagnoses for both frequently admitted patients and all other patients. As a secondary diagnosis, depressive disorder appeared in the top 10 for both groups, although more commonly for frequently admitted patients (15.4% vs 10.3% [P<0.001]).
The most commonly performed principal procedures are also shown in Table 1. These include hemodialysis (6.32%) and packed cell transfusion (4.49%), nonoperating room procedures associated with chronic medical conditions.
Comorbidities were compared using the AHRQ comorbidity software.[18, 19] Comorbid conditions were counted once per patient, regardless of the number of admissions in which the condition was coded. Frequently admitted patients have a significantly higher mean number of comorbidities: 7.1 compared to 2.5 for all other patients (P<0.001; Figure 2). In an additional analysis using the Elixhauser comorbidity measures to determine acuity scores, the mean scores were 13.1 for frequently admitted patients and 3.17 for all others (P<0.001). The most common comorbidities were hypertension (74%), fluid and electrolyte disorders (73%), and deficiency anemias (66%). The only behavioral health comorbidity that affected more than a quarter of frequently admitted patients was depression (40% as compared to 13% for all others).
Additionally, frequently admitted patients were significantly more likely to have comorbidities of psychosis (18% vs 5% [P<0.001]), alcohol abuse (16% vs 7% [P<0.001]), and drug abuse (20% vs 7% [P<0.001]). Among hospitals, these comorbidities ranged widely: psychosis (3% 48%); alcohol abuse (3%46%); and drug abuse (3%58%). Hospitals with the highest rates (top decile) of frequently admitted patients with alcohol and drug abuse comorbidities were more likely to be safety net hospitals than those in the lowest decile (P<0.05 for each independently), but no such difference was found regarding rates of patients with psychosis.
Although the frequently admitted patient population accounted for only 1.6% of patients, they accounted for an average of 8.4% of all bed days and 7.1% of direct cost. The average cost per day was $1746, compared to $2144 for all other patients (Table 2).
| Length of Stay, Days | Direct Cost | % Total Bed Days | Cost/Day | All Other Patients Cost/Day | Difference | |
|---|---|---|---|---|---|---|
| Minimum | 1.0 | 2.3% | 3.2% | $809 | $1,005 | $(196) |
| Maximum | 86.8 | 14.1% | 15.4% | $3,208 | $4,070 | $(862) |
| Mean | 6.7 | 7.1% | 8.4% | $1,746 | $2,144 | $(398) |
| Median | 5.5 | 7.0% | 8.3% | $1,703 | $2,112 | $(410) |
DISCUSSION
An extensive analysis of the characteristics of frequently admitted patients at 101 US academic medical centers, from October 1, 2011 to September 30, 2012, revealed that these patients comprised 1.6% of all patients, but accounted for 8% of all admissions and 7% of direct costs. Relative to all other hospitalized patients, frequently admitted patients were likely to be younger, of lower socioeconomic status, in poorer health, and more often affected by mental health or substance abuse conditions that may mediate their health behaviors. However, the prevalence of patients with psychiatric or behavior conditions varied widely among hospitals, and hospitals with the highest rates of patients with substance abuse comorbidities were more likely to be safety net hospitals. Frequently admitted patients' diagnoses and procedures suggest that their admissions were related to complex chronic diseases; more than three‐quarters were admitted to medicine services, and their average length of stay was nearly 7 days. No single primary diagnosis accounted for a predominant share of their admissions; the most common diagnosis, sickle cell disease with crisis, accounted for only about 4%. The cost of their care was lower than that of other patients, reflecting the preponderance of their admissions to medicine service lines.
In many ways, frequently admitted patients seem similar to frequent ED visitors. Their visits were driven by a high disease burden associated with multiple chronic conditions, and they were heavy users of the healthcare system overall.[4, 6] The majority of both groups were insured, although there was over‐representation of public insurance.[6] As with frequent ED users, some frequently admitted patients are affected by psychiatric morbidity and substance abuse.[4, 12]
Our results in some ways confirmed, and in some ways differed from, findings of prior studies of patients with frequent hospital admissions. Although each study performed to date has defined the population differently, comparison of findings is useful. Our population was similar to the high‐admission groups identified by Nguyen et al. (patients responsible for the top decile of admissions).[13] These patients were also predominantly admitted for medical conditions, with common admitting diagnoses representing respiratory, gastrointestinal, and cardiovascular conditions. However, the median length of stay (3 days for the high‐admission/low‐cost group and 5 days for the high‐admission/high‐cost group) was lower than that of our population (5.5 days).
Hwa, who studied 29 patients admitted 6 or more times in 1 year to an inpatient medical service in San Francisco,[14] found that 55% of frequently admitted patients had a psychiatric diagnosis, higher than our patient population. Our findings are similar to those of Boonyasai et al.[15] whose serial readmitters had admissions resulting from disease progression, psychiatric illness, and substance abuse.
Our more nationally representative analysis documented a wide range of patient volumes and clinical characteristics, including psychiatric and substance abuse comorbidities, across study hospitals. It demonstrates that different approachesand resourcesare needed to meet the needs of these varied groups of patients. Each hospital must identify, evaluate, and understand its own population of frequently admitted patients to create well‐informed solutions to prevent repeat hospitalization for these patients.
Our ability to create a distinctive picture of the population of frequently admitted patients in US academic medical centers is based on access to an expansive dataset that captures complete diagnostic and demographic information on the universe of patients admitted to our member hospitals. The availability of clinical and administrative data for the entire population of patients permits both an accurate description of patient characteristics and a standardized comparison of groups. All data conform to accepted formats and definitions; their validity is universally recognized by contributing database participants.
Limitations
There are several important limitations to our study. First, patients with 5 or more admissions in 1 year may be undercounted. The UHC Clinical Data Base/Resource Manager only captures readmissions to a single facility; admissions of any patient admitted to more than 1 hospital, even within the UHC membership, cannot be determined. This could have a particularly strong effect on our ability to detect admissions of patients with acute episodes related to psychiatric illness or substance abuse, as they may be more likely to present to multiple or specialty hospitals. Additionally, readmission rates vary among UHC‐member hospitals, based to some extent on geography and the availability of alternative settings of care.
It is possible that surveillance bias played a role in our finding that frequently admitted patients have a significantly higher mean number of comorbidities; each admission presents an opportunity to document additional comorbid conditions. Psychiatric conditions may be underdocumented in medical settings in academic medical centers, where the focus is often on acute medical conditions. Additionally, certain data elements that we believe are central to understanding the characteristics of frequently admitted patients are not part of the UHC Clinical Data Base/Resource Manager and were therefore not a part of our analysis. These highly influential upstream determinants of health include documentation of a primary care physician, housing status, and access to services at discharge.
CONCLUSION
The valuable information reported from analysis of nearly 2 million patients in the UHC Clinical Data Base/Resource Manager can be used to better understand the characteristics of frequently admitted patients. This important cohort of individuals has complex care needs that often result in hospitalization, but may be amenable to solutions that allow patients to remain in their communities. By understanding the demographic, social, and medical characteristics of these patients, hospitals can develop and implement solutions that address the needs of this small group of patients who consume a highly disproportionate share of healthcare resources.
Acknowledgements
The authors acknowledge the contributions of Samuel F. Hohmann, PhD, and Ryan Carroll, MBA, who provided expert statistical analyses and generous assistance in the completion of this article.
Disclosure: Nothing to report.
The national healthcare improvement paradigm is shifting toward a more comprehensive, value‐focused, and patient‐centered approach. Reducing hospital readmissions has become a focal point as a policy strategy to improve care quality while reducing cost. Section 3025 of the Affordable Care Act mandated the Centers for Medicare and Medicaid Services to make progressive reductions in Medicare payments to hospitals that have higher than expected readmission rates for 3 conditions (heart failure, acute myocardial infarction, and pneumonia), and expanding to include chronic obstructive pulmonary disease and total hip and knee arthroplasty in 2015.[1] In response, hospitals and systems are developing and implementing programs that coordinate care beyond hospital walls to reduce readmissions and healthcare costs.[2, 3] However, patients are readmitted for a variety of reasons, and programs that address the needs of some may not address the distinct needs of others. Understanding the characteristics of patients with frequent readmissions will permit the well‐informed creation of solutions specific to this population to reduce cost, free resources, and provide better care.
Although a solid body of literature already exists that describes the characteristics of patients who frequently visit the emergency department (ED),[4, 5, 6, 7, 8, 9, 10, 11, 12] it is not clear to what extent these characteristics also apply to patients with frequent hospital admissions. Frequent ED visitors have been found to be largely insured (85%) although with over‐representation of public insurance, and to be heavy users of the healthcare system overall.[6] A high disease burden associated with multiple chronic conditions has been found to predict frequent ED use.[4, 9, 11, 12] Some characteristics may vary by location; for example, alcohol abuse and psychiatric morbidity have been found to be associated with frequent ED use in New York and San Francisco, but it is not clear to what extent they are a factor in less urban areas.[4, 6, 12]
Several previous studies have investigated the characteristics of frequently admitted patients at single sites.[13, 14, 15, 16] Nguyen et al. (2013) studied patients with the highest costs and the most admissions at a large academic medical center in San Francisco.[13] High admit patients were defined as those responsible for the top decile of admissions, and were grouped into equal‐sized high‐ and low‐cost cohorts. The high‐admission/high‐cost group represented 5% of all patients, 25% of all costs, and 16% of all admissions. These patients were hospitalized primarily for medical conditions (78%) and had a high 30‐day readmission rate (47%). The high‐admission/low‐cost group accounted for 5% of all patients, 12% of all admissions, and 7% of all costs. These patients were also predominantly admitted for medical conditions (87%), with the most common admitting diagnoses representing respiratory, gastrointestinal, and cardiovascular conditions.[13]
Hwa (2012) conducted an analysis of 29 patients admitted 6 or more times in 1 year to an inpatient medical service in San Francisco.[14] These patients represented just 1% of all patients, but 13% of readmissions. Fifty‐five percent of these patients had a psychiatric diagnosis, and 52% had chronic pain. Ninety percent had a primary care physician in the hospital system, 100% were insured either privately or publicly, and 93% had housing, although for 17% housing was described as marginal.[14]
In a third study, Boonyasai et al. (2012) identified 76 patients with 82 readmissions at a Baltimore, Maryland, hospital and classified them as isolated (1 readmission per 6‐month period) or serial (more than 1 readmission per 6‐month period) readmissions.[15] Patients with serial readmissions accounted for 70% of the total. Isolated readmissions were most likely to be related to suboptimal quality of care and care coordination, whereas serial readmissions were more likely to result from disease progression, psychiatric illness, and substance abuse.[15]
All of these studies were conducted at single‐site academic medical centers serving inner city populations. We undertook this study to identify patient and hospital‐level characteristics of frequently admitted patients in a broad sample of 101 US academic medical centers to determine whether previously reported findings are generalizable, and to identify characteristics of frequently admitted patients that can inform interventions designed to meet the needs of this relatively small but resource‐intensive group of patients.
METHODS
All data were obtained from the University HealthSystem Consortium (UHC) (Chicago, IL) Clinical Data Base/Resource Manager (CDB), a large administrative database to which UHC principal members submit comprehensive administrative data files. UHC's principal members include approximately 120 US academic medical centers delivering tertiary and quaternary care, with an average of 647 acute care beds. The CDB includes primary and secondary diagnoses using International Classification of Diseases, Ninth Revision (ICD‐9)[17] codes.
The data of 101 academic medical centers with complete datasets for the study period (October 1, 2011, to September 30, 2012) were included in this analysis. Frequently admitted patients were defined as patients admitted 5 or more times to the same facility in a 12‐month period; all admissions were included, even those more than 30 days apart. This definition was established based on a naturally occurring break in the frequency distribution (Figure 1) and our intention to focus on the unique characteristics of patients at the far right of the distribution. We excluded obstetric (MDC 14, ICD‐9)[17] admissions and pediatric (<18 years of age at index admission) patients, as well as admissions with principal diagnoses for chemotherapy (ICD‐9 diagnosis codes v5811v5812), dialysis (ICD‐9 diagnosis codes v560v568), and rehabilitation (ICD‐9 diagnosis codes v570v579), which are typically planned. The Agency for Healthcare Research and Quality (AHRQ) comorbidity software was used to identify comorbid conditions,[18, 19] and a score based on the Elixhauser comorbidity measures was calculated using a modified acuity point system.[20] For comparisons based on safety net status, we used a definition of payer mix being 25% Medicaid or uninsured.
Our analyses included patient demographics, admission source and discharge status, clinical diagnoses, procedures, and comorbidities, cost, and length of stay. Patients defined as frequently admitted were compared in aggregate to all other hospitalized patients (all other admissions).
To evaluate associations, we used [2] tests for categorical variables and t tests for continuous variables. When comparing the non‐normally distributed comorbidities of the control group to the normally distributed comorbidities of the frequently admitted patients, we performed a Kruskal‐Wallis test on the medians.
RESULTS
During a 1‐year period (October 1, 2011, to September 30, 2012), 1,758,027 patients were admitted 2,388,124 times at 101 academic medical centers. Of these, 28,291 patients had 5 or more admissions during this period, resulting in 180,185 admissions. These frequently admitted patients represented 1.6% of all patients (Figure 1) and 7.6% of all inpatient admissions. By comparison, nonfrequently admitted patients were admitted once (79%), twice (14%), 3 times (4%), or 4 times (2%).
Among hospitals, the volume and impact of frequently admitted patients varied widely. The frequently admitted patient population ranged from 64 patients (0.7% of all patients) to 785 patients (3.5%), with an average of 280 patients (1.6%). To look for differences that might explain this range, we compared hospitals in the top and bottom deciles with respect to geographic region and to safety net status, but found no significant or meaningful differences. The average number of admissions per patient was 6.4, with a range of 5 to 76. Days per patient ranged from 5 to 434 days, with an average of 42. The average patient‐day percentage (frequently admitted patient days/total patient days) was 8.4%, and ranged from 3.2% to 15.4%.
Frequently admitted patients were more likely to be younger than all other patients (71.9% under the age of 65 years, as compared with 65.3% of all other patients (P<0.001)). They were also more likely to have either Medicaid or no healthcare insurance (27.6% compared with 21.6%, P<0.001), although nearly three‐quarters had either private insurance or Medicare coverage.
Eighty‐four percent of frequently admitted patient admissions were to medical services (vs 58% of all other patients (P<0.001)). The admission status for these patients was much less likely to be elective (9.1% of frequently admitted patient admissions vs 26.6% of all other patients' admissions [P<0.001]). Frequently admitted patients were more likely to be discharged to a skilled nursing facility (9.3% vs 8.4%, [P<0.001]) or with home health services (19.7% vs 13.4% [P<0.001]).
The 10 most common primary diagnoses for patient admissions are shown in Table 1. No single primary diagnosis accounted for a large share of the admissions of these patients; the most common diagnosis, sickle cell disease with crisis, accounted for only about 4% of admissions. The 10 most common diagnoses accounted for <20% of all admissions. The remainder of the diagnoses was spread over more than 3000 diagnosis codes; only about 300 codes had more than 100 admissions each.
| Primary Diagnoses | Secondary Diagnoses | Principal Procedures | ||||||||
|---|---|---|---|---|---|---|---|---|---|---|
| Frequently Admitted Patient Admissions, N=180,185 | All Other Patient Admissions, N=2,207,939 | All Other Patient Rank | Frequently Admitted Patient Admissions, N=180,185 | All Other Patient Admissions, N=2,207,939 | All Other PatientRank | Frequently Admitted Patient Admissions, N=180,185 | All Other Patient Admissions, N=2,207,939 | |||
| ||||||||||
| Sickle cell disease with crisis | 3.97% (7,152) | 0.002% (5,887) | 63 | Hypertension NOS | 31.39% (56,556) | 40.04% (884,045) | 1 | Hemodialysis | 6.32% (11,380) | 1.08% (23,871) |
| Septicemia NOS | 2.58% (4,652) | 1.87% (41,369) | 1 | Hyperlipidemia NOS | 24.47% (44,089) | 25.94% (572,760) | 2 | Packed cell transfusion | 4.49% (8.091) | 1.57% (34,669) |
| Acute and chronic systolic heart failure | 2.06% (3,708) | 0.81% (17,802) | 12 | Congestive heart failure NOS | 22.86% (41,197) | 11.82% (260,944) | 8 | Percutaneous abdominal drainage | 2.42% (4,366) | 0.86% (18,974) |
| Acute kidney failure NOS | 2.04% (3,680) | 1.16% (25,528) | 6 | Esophageal reflux | 21.19% (38,184) | 17.32% (382,511) | 3 | Venous catheter NEC | 2.13% (3,843) | 0.89% (19,718) |
| Obstructive chronic bronchitis with exacerbation | 1.76% (3,180) | 0.68% (14,957) | 14 | Diabetes mellitus NOS uncomplicated | 20.39% (36,743) | 16.75% (369,808) | 4 | Central venous catheter placement with guidewire | 2.13% (3,834)) | 0.83% (18,307) |
| Pneumonia organism NOS | 1.72% (3,091) | 1.29% (28,468) | 4 | Tobacco use disorder | 16.98% (30,604) | 16.71% (368,880) | 5 | Continuous invasive mechanical ventilation <96 consecutive hours | 1.38% (2,480) | 0.7% (15,441) |
| Urinary tract infection NOS | 1.63% (2,939) | 0.86% (19,069) | 9 | History of tobacco use | 16.89% (30,439) | 14.77% (326,026) | 6 | Noninvasive mechanical ventilation | 1.3% (2,345) | 0.58% (12,899) |
| Acute pancreatitis | 1.23% (2,212) | 0.73% (16,168) | 13 | Coronary atherosclerosis native vessel | 16.12% (29,040) | 12.88% (284,487) | 7 | Small intestine endoscopy NEC | 1.26% (2.265) | 0.7% (15,480) |
| Acute and chronic diastolic heart failure | 1.22% (2,190) | 0.48% (10,600) | 22 | Depressive disorder | 15.42% (27,785) | 10.34% (228,347) | 10 | Heart ultrasound | 1.11% (1,997) | 1.37% (30,161) |
| Complication of kidney transplant | 1.08% (1,944) | 0.42% (9,354) | 28 | Acute kidney failure NOS | 13.8% (24,859) | 9.37%% (206,951) | 12 | Esophagogastroduodenoscopy with closed biopsy | 1.09% (1,963) | 0.8% (17,644) |
Secondary diagnoses were mainly chronic conditions, including hypertension, hyperlipidemia, esophageal reflux, and diabetes mellitus type 2 (Table 1.) Combined, congestive heart failure and diabetes mellitus accounted for 43.3% of the secondary diagnoses of admissions of frequently admitted patients, but for only 28.6% of other patients. Acute kidney failure was more common in frequently admitted patients (13.8% vs 9.4% [P<0.001]). Psychiatric disorders accounted for <1% of primary diagnoses for both frequently admitted patients and all other patients. As a secondary diagnosis, depressive disorder appeared in the top 10 for both groups, although more commonly for frequently admitted patients (15.4% vs 10.3% [P<0.001]).
The most commonly performed principal procedures are also shown in Table 1. These include hemodialysis (6.32%) and packed cell transfusion (4.49%), nonoperating room procedures associated with chronic medical conditions.
Comorbidities were compared using the AHRQ comorbidity software.[18, 19] Comorbid conditions were counted once per patient, regardless of the number of admissions in which the condition was coded. Frequently admitted patients have a significantly higher mean number of comorbidities: 7.1 compared to 2.5 for all other patients (P<0.001; Figure 2). In an additional analysis using the Elixhauser comorbidity measures to determine acuity scores, the mean scores were 13.1 for frequently admitted patients and 3.17 for all others (P<0.001). The most common comorbidities were hypertension (74%), fluid and electrolyte disorders (73%), and deficiency anemias (66%). The only behavioral health comorbidity that affected more than a quarter of frequently admitted patients was depression (40% as compared to 13% for all others).
Additionally, frequently admitted patients were significantly more likely to have comorbidities of psychosis (18% vs 5% [P<0.001]), alcohol abuse (16% vs 7% [P<0.001]), and drug abuse (20% vs 7% [P<0.001]). Among hospitals, these comorbidities ranged widely: psychosis (3% 48%); alcohol abuse (3%46%); and drug abuse (3%58%). Hospitals with the highest rates (top decile) of frequently admitted patients with alcohol and drug abuse comorbidities were more likely to be safety net hospitals than those in the lowest decile (P<0.05 for each independently), but no such difference was found regarding rates of patients with psychosis.
Although the frequently admitted patient population accounted for only 1.6% of patients, they accounted for an average of 8.4% of all bed days and 7.1% of direct cost. The average cost per day was $1746, compared to $2144 for all other patients (Table 2).
| Length of Stay, Days | Direct Cost | % Total Bed Days | Cost/Day | All Other Patients Cost/Day | Difference | |
|---|---|---|---|---|---|---|
| Minimum | 1.0 | 2.3% | 3.2% | $809 | $1,005 | $(196) |
| Maximum | 86.8 | 14.1% | 15.4% | $3,208 | $4,070 | $(862) |
| Mean | 6.7 | 7.1% | 8.4% | $1,746 | $2,144 | $(398) |
| Median | 5.5 | 7.0% | 8.3% | $1,703 | $2,112 | $(410) |
DISCUSSION
An extensive analysis of the characteristics of frequently admitted patients at 101 US academic medical centers, from October 1, 2011 to September 30, 2012, revealed that these patients comprised 1.6% of all patients, but accounted for 8% of all admissions and 7% of direct costs. Relative to all other hospitalized patients, frequently admitted patients were likely to be younger, of lower socioeconomic status, in poorer health, and more often affected by mental health or substance abuse conditions that may mediate their health behaviors. However, the prevalence of patients with psychiatric or behavior conditions varied widely among hospitals, and hospitals with the highest rates of patients with substance abuse comorbidities were more likely to be safety net hospitals. Frequently admitted patients' diagnoses and procedures suggest that their admissions were related to complex chronic diseases; more than three‐quarters were admitted to medicine services, and their average length of stay was nearly 7 days. No single primary diagnosis accounted for a predominant share of their admissions; the most common diagnosis, sickle cell disease with crisis, accounted for only about 4%. The cost of their care was lower than that of other patients, reflecting the preponderance of their admissions to medicine service lines.
In many ways, frequently admitted patients seem similar to frequent ED visitors. Their visits were driven by a high disease burden associated with multiple chronic conditions, and they were heavy users of the healthcare system overall.[4, 6] The majority of both groups were insured, although there was over‐representation of public insurance.[6] As with frequent ED users, some frequently admitted patients are affected by psychiatric morbidity and substance abuse.[4, 12]
Our results in some ways confirmed, and in some ways differed from, findings of prior studies of patients with frequent hospital admissions. Although each study performed to date has defined the population differently, comparison of findings is useful. Our population was similar to the high‐admission groups identified by Nguyen et al. (patients responsible for the top decile of admissions).[13] These patients were also predominantly admitted for medical conditions, with common admitting diagnoses representing respiratory, gastrointestinal, and cardiovascular conditions. However, the median length of stay (3 days for the high‐admission/low‐cost group and 5 days for the high‐admission/high‐cost group) was lower than that of our population (5.5 days).
Hwa, who studied 29 patients admitted 6 or more times in 1 year to an inpatient medical service in San Francisco,[14] found that 55% of frequently admitted patients had a psychiatric diagnosis, higher than our patient population. Our findings are similar to those of Boonyasai et al.[15] whose serial readmitters had admissions resulting from disease progression, psychiatric illness, and substance abuse.
Our more nationally representative analysis documented a wide range of patient volumes and clinical characteristics, including psychiatric and substance abuse comorbidities, across study hospitals. It demonstrates that different approachesand resourcesare needed to meet the needs of these varied groups of patients. Each hospital must identify, evaluate, and understand its own population of frequently admitted patients to create well‐informed solutions to prevent repeat hospitalization for these patients.
Our ability to create a distinctive picture of the population of frequently admitted patients in US academic medical centers is based on access to an expansive dataset that captures complete diagnostic and demographic information on the universe of patients admitted to our member hospitals. The availability of clinical and administrative data for the entire population of patients permits both an accurate description of patient characteristics and a standardized comparison of groups. All data conform to accepted formats and definitions; their validity is universally recognized by contributing database participants.
Limitations
There are several important limitations to our study. First, patients with 5 or more admissions in 1 year may be undercounted. The UHC Clinical Data Base/Resource Manager only captures readmissions to a single facility; admissions of any patient admitted to more than 1 hospital, even within the UHC membership, cannot be determined. This could have a particularly strong effect on our ability to detect admissions of patients with acute episodes related to psychiatric illness or substance abuse, as they may be more likely to present to multiple or specialty hospitals. Additionally, readmission rates vary among UHC‐member hospitals, based to some extent on geography and the availability of alternative settings of care.
It is possible that surveillance bias played a role in our finding that frequently admitted patients have a significantly higher mean number of comorbidities; each admission presents an opportunity to document additional comorbid conditions. Psychiatric conditions may be underdocumented in medical settings in academic medical centers, where the focus is often on acute medical conditions. Additionally, certain data elements that we believe are central to understanding the characteristics of frequently admitted patients are not part of the UHC Clinical Data Base/Resource Manager and were therefore not a part of our analysis. These highly influential upstream determinants of health include documentation of a primary care physician, housing status, and access to services at discharge.
CONCLUSION
The valuable information reported from analysis of nearly 2 million patients in the UHC Clinical Data Base/Resource Manager can be used to better understand the characteristics of frequently admitted patients. This important cohort of individuals has complex care needs that often result in hospitalization, but may be amenable to solutions that allow patients to remain in their communities. By understanding the demographic, social, and medical characteristics of these patients, hospitals can develop and implement solutions that address the needs of this small group of patients who consume a highly disproportionate share of healthcare resources.
Acknowledgements
The authors acknowledge the contributions of Samuel F. Hohmann, PhD, and Ryan Carroll, MBA, who provided expert statistical analyses and generous assistance in the completion of this article.
Disclosure: Nothing to report.
- Centers for Medicare 21(9):117–120.
- , , , . The influence of a postdischarge intervention on reducing hospital readmissions in a Medicare population. Popul Health Manag. 2013;16(5):310–316.
- , . Dispelling an urban legend: frequent emergency department users have substantial burden of disease. Health Aff (Millwood). 2013;32:2099–2108.
- , , , et al. Effectiveness of interventions targeting frequent users of emergency departments: a systematic review. Ann Emerg Med. 2011;58:41–52.
- , . Frequent users of emergency departments: the myths, the data, and the policy implications. Ann Emerg Med. 2010;20(10):1–8.
- , , , . Development and validation of a model for predicting emergency admissions over the next year. Arch Intern Med. 2008;168:1416–1422.
- , , , et al. A comparison of frequent and infrequent visitors to an urban emergency department. J Emerg Med. 2008;38:115–121.
- , . Frequent users of Massachusetts emergency departments: a statewide analysis. Ann Emerg Med. 2006;48:9–16.
- , , , et al. A descriptive study of heavy emergency department users at an academic emergency department reveals heavy users have better access to care than average users. J Emerg Nurs. 2005;31:139–144.
- , , . Predictors and outcomes of frequent emergency department users. Acad Emerg Med. 2003;10:320–328.
- , , . Epidemiologic analysis of an urban, public emergency department's frequent users. Acad Emerg Med. 2000;7:637–646.
- , , , . What's cost got to do with it? Association between hospital costs and frequency of admissions among “high users” of hospital care. J Hosp Med. 2013;8:665–671.
- . Characteristics of a frequently readmitted patient population on an inpatient medical service. Abstract presented at: Society of Hospital Medicine Annual Meeting, April 1– 4, 2012; San Diego, CA.
- , , , , . Characteristics of isolated and serial rehospitalizations suggest a need for different types of improvement strategies [abstract] J Hosp Med. 2012;7(suppl 2):513.
- , , , , . An intervention to improve care and reduce costs for high‐risk patients with frequent hospital admissions: a pilot study. BMC Health Serv Res. 2011;11:270–279.
- Centers for Disease Control and Prevention. International Classification of Diseases, Ninth Revision (ICD‐9). Available at: http://www.cdc.gov/nchs/icd/icd9.htm. Accessed February 18, 2015.
- Agency for Healthcare Research and Quality, Healthcare Cost and Utilization Project. Comorbidity software, version 3.7. Available at: http://www.hcup‐us.ahrq.gov/toolssoftware/comorbidity/comorbidity.jsp. Accessed February 18, 2015.
- , , , . Comorbidity measures for use with administrative data. Med Care. 1998;36:8–27.
- , , , , . A modification of the Elixhauser comorbidity measures into a point system for hospital death using administrative data. Med Care. 2009;47:626–633.
- Centers for Medicare 21(9):117–120.
- , , , . The influence of a postdischarge intervention on reducing hospital readmissions in a Medicare population. Popul Health Manag. 2013;16(5):310–316.
- , . Dispelling an urban legend: frequent emergency department users have substantial burden of disease. Health Aff (Millwood). 2013;32:2099–2108.
- , , , et al. Effectiveness of interventions targeting frequent users of emergency departments: a systematic review. Ann Emerg Med. 2011;58:41–52.
- , . Frequent users of emergency departments: the myths, the data, and the policy implications. Ann Emerg Med. 2010;20(10):1–8.
- , , , . Development and validation of a model for predicting emergency admissions over the next year. Arch Intern Med. 2008;168:1416–1422.
- , , , et al. A comparison of frequent and infrequent visitors to an urban emergency department. J Emerg Med. 2008;38:115–121.
- , . Frequent users of Massachusetts emergency departments: a statewide analysis. Ann Emerg Med. 2006;48:9–16.
- , , , et al. A descriptive study of heavy emergency department users at an academic emergency department reveals heavy users have better access to care than average users. J Emerg Nurs. 2005;31:139–144.
- , , . Predictors and outcomes of frequent emergency department users. Acad Emerg Med. 2003;10:320–328.
- , , . Epidemiologic analysis of an urban, public emergency department's frequent users. Acad Emerg Med. 2000;7:637–646.
- , , , . What's cost got to do with it? Association between hospital costs and frequency of admissions among “high users” of hospital care. J Hosp Med. 2013;8:665–671.
- . Characteristics of a frequently readmitted patient population on an inpatient medical service. Abstract presented at: Society of Hospital Medicine Annual Meeting, April 1– 4, 2012; San Diego, CA.
- , , , , . Characteristics of isolated and serial rehospitalizations suggest a need for different types of improvement strategies [abstract] J Hosp Med. 2012;7(suppl 2):513.
- , , , , . An intervention to improve care and reduce costs for high‐risk patients with frequent hospital admissions: a pilot study. BMC Health Serv Res. 2011;11:270–279.
- Centers for Disease Control and Prevention. International Classification of Diseases, Ninth Revision (ICD‐9). Available at: http://www.cdc.gov/nchs/icd/icd9.htm. Accessed February 18, 2015.
- Agency for Healthcare Research and Quality, Healthcare Cost and Utilization Project. Comorbidity software, version 3.7. Available at: http://www.hcup‐us.ahrq.gov/toolssoftware/comorbidity/comorbidity.jsp. Accessed February 18, 2015.
- , , , . Comorbidity measures for use with administrative data. Med Care. 1998;36:8–27.
- , , , , . A modification of the Elixhauser comorbidity measures into a point system for hospital death using administrative data. Med Care. 2009;47:626–633.
© 2015 The Authors Journal of Hospital Medicine published by Wiley Periodicals, Inc. on behalf of Society of Hospital Medicine
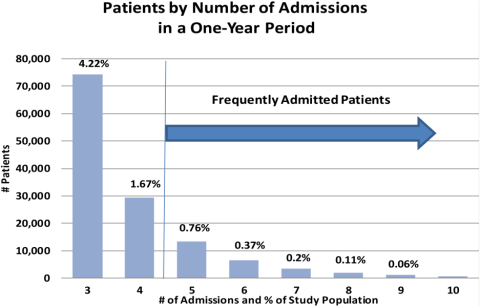
CKD Awareness in Hospitalized Patients
Chronic kidney disease (CKD) affects over 13% of the US population and is associated with increased morbidity, mortality, and healthcare costs.[1] However, only 10% of individuals with CKD are aware of their diagnoses.[2] Even in those with stage 5 CKD, only 60% of individuals are aware of their CKD.[3] To our knowledge, no work has examined CKD awareness in a hospitalized patient population.
Patient awareness of their CKD diagnosis is important because progression of kidney disease can be slowed by patient self‐management of diabetes and hypertension.[4] Patient awareness of CKD may also increase acceptance of preend‐stage renal disease (ESRD) patient education and nephrology referral, which have been shown to delay CKD progression and improve clinical status at dialysis initiation.[5] However, only 60% of patients with advanced CKD have visited a nephrologist in the past year or have seen a nephrologist prior to dialysis initiation.[1]
The hospital is an important site for patient education and linkage to outpatient care for patients with CKD.[6] The hospital serves high‐risk patients who may not be well connected to outpatient care or who have lesswell‐controlled disease.[6, 7] Thus, hospitalization represents an opportunity to identify existing CKD and to use a multidisciplinary approach to preventative care, patient education, and patient‐provider planning for renal replacement therapy needs. In our cross‐sectional study in an urban, minority‐serving hospital, we sought to determine what patient factors were associated with hospitalized patients correctly self‐identifying as having CKD.
METHODS
Subjects and Data
We used data from the University of Chicago Hospitalist Project, a study of hospitalized patient outcomes.[8] Within 48 hours of hospitalization, all general medicine patients or their proxies are approached to enroll. During one‐on‐one inpatient interviews, a trained research assistant obtains demographic, health status, and healthcare utilization information. Participants consent for study staff to review their medical records. More than 80% of general medicine patients enroll.
We obtained data on 1234 general medicine patients discharged between January 1, 2012 and March 31, 2013 with an International Classification of Diseases, Ninth Revision (ICD‐9) code for chronic kidney disease (ICD‐9 codes 585.0585.5, 585.9) in their first 20 admission diagnoses. These codes are highly specific for CKD but have lower sensitivity.[9] We excluded all patients with a history of transplant (996.81, V42.0, n=90) or ESRD (585.6, n=416). We excluded repeat admissions during the study period (n=138). Our final sample included 590 unique patients with ICD‐9 diagnosis of CKD without ESRD.
Demographic, Clinical, and Health Service Utilization Characteristics
Our outcome was CKD awareness, the patient's correct self‐report of kidney disease. Patients selected their chronic medical conditions from a list read to them and were specifically asked if they had kidney problems. Demographic characteristics including age, gender, race/ethnicity, marital status, and education were also obtained. Healthcare utilization variables included how often the patient saw their primary medical care provider in the past year and whether patients had a prior hospitalization in the last year.
Health status variables such as mental status, diabetes, hypertension, and CKD stage were also assessed. Mental status was quantified using the telephone version of the Mini‐Mental State Examination (MMSE), scored from 1 to 22.10 We defined diabetes as ICD‐9 codes 250.0250.00, and hypertension as ICD‐9 codes 401.0, 401.9, 403, 405.09, 405.19, 405.91, 405.99, or by patient self‐report. CKD stage was based on the estimated glomerular filtration rate (eGFR) from the medical record using Kidney Disease Outcomes Quality Initiative guidelines.[11] We used the mode of the eGFR to calculate the appropriate CKD stage for those with more than 1 eGFR value from the hospitalization (576/590, 98%). The eGFR was calculated by the modified Modification of Diet in Renal Disease equation: (GFR (mL/min/1.73 m2)=175 (Screatinine)1.154 (Age)0.203 (0.742 if female) x (1.212 if African American)) recommended by the National Kidney Disease Education Program.[12]
Analysis
We used logistic regression to analyze the influence of the demographic, clinical, and healthcare utilization covariates on the likelihood of a patient reporting kidney problems. For the multivariate analysis, we sequentially added variables in a step‐wise fashion. We adjusted for (1) demographic factors: gender, race, ethnicity, marital status, and education; (2) eGFR‐calculated CKD stage and comorbidities: diabetes, hypertension, and mental status; and (3) healthcare utilization in the last 12 months: any hospitalizations and the number of visits to a health provider.
RESULTS
Patient Characteristics and Bivariable Association With Patient CKD Self‐Report
Table 1 shows demographic, clinical, and health service use characteristics for 590 patients with ICD‐9 coded CKD. In the bivariable model in Table 1, age, race, marital status and comorbidities, were associated with patient self‐report of CKD. Patients older than 80 years with physician‐identified CKD through ICD‐9 coding had 57% lower odds of reporting CKD than their younger counterparts. Patients of other races (nonwhite, non‐African American), married patients, and those with CKD stages 4 and 5 were much more likely to correctly self‐report CKD. Patients with higher MMSE score, diabetes, or hypertension had greater odds of CKD self‐report (all P0.05).
| Total, N=590 | Bivariable Odds Ratio (95% CI) | Multivariable With Stepwise Addition (95% CI) | |||
|---|---|---|---|---|---|
| Model 1, Demographic Factors | Model 2, Plus CKD Stage and Other Comorbidities | Model 3, Plus Health Service Use | |||
| |||||
| Female | 312 (52.98%) | 1.21 (0.85‐1.70) | 1.64 (1.09‐2.47)* | 1.28 (0.79‐2.06) | 1.36 (0.75‐2.48) |
| Age, y | |||||
| Below 54 | 138 (23.4%) | REF | REF | REF | REF |
| 5466 | 150 (24.4%) | 0.96 (0.59‐1.54) | 0.95 (0.56‐1.59) | 1.01 (0.56‐1.81) | 0.83 (0.41‐1.68) |
| 6779 | 161 (27.3%) | 0.77 (0.48‐1.23) | 0.67 (0.39‐1.15) | 0.66 (0.35‐1.23) | 0.72(0.34‐1.52) |
| Above 80 | 141 (23.9%) | 0.43 (0.26‐0.74) | 0.32 (0.17‐0.60) | 0.42 (0.20‐0.91)* | 0.37 (0.15‐0.93)* |
| Race | |||||
| African American | 449 (82.1%) | REF | REF | REF | REF |
| White | 75 (13.7%) | 1.47 (0.89‐2.42) | 1.53 (0.86‐2.71) | 1.56 (0.78‐3.12) | 1.08 (0.47‐2.49) |
| Other | 23 (4.2%) | 3.62 (1.53‐8.54) | 5.29 (1.78‐15.73) | 6.19 (1.72‐22.29) | 11.63 (1.80‐75.21)* |
| Ethnicity (Hispanic is reference group) | 21 (4.0%) | 0.97 (0.38‐2.44) | 0.43 (0.13‐1.45) | 0.71 (0.16‐3.09) | 0.46 (0.06‐3.57) |
| Married | 171 (32.6%) | 1.49 (1.03‐2.18)* | 1.32 (0.85‐2.04) | 1.20 (0.73‐1.98) | 1.77 (0.94‐3.33) |
| Education | |||||
| Less than high school | 128 (25.2%) | REF | REF | REF | REF |
| High school grad/some college | 296 (58.2%) | 1.05 (0.68‐1.63) | 0.93 (0.58‐1.49) | 0.95 (0.54‐1.67) | 0.85 (0.42‐1.72) |
| College grad or higher | 85 (16.7%) | 1.13 (0.64‐2.01) | 0.96 (0.51‐1.78) | 1.07 (0.51‐2.23) | 0.69 (0.27‐1.77) |
| CKD stage (eGFR calculated, mode) | |||||
| 12 | 115 (20.0%) | 0.55 (0.32‐0.95)* | 0.52 (0.27‐1.01) | 0.28 (0.11‐0.69) | |
| 3 | 300 (52.1%) | REF | REF | REF | |
| 4 | 112 (19.4%) | 2.43 (1.55‐3.81) | 2.69 (1.52‐4.76) | 3.07 (1.56‐6.07) | |
| 5 | 49 (8.5%) | 4.50 (2.39‐8.48) | 3.94 (1.81‐8.56) | 5.16 (1.85‐14.41) | |
| Diabetes (ICD‐9 coded or self‐report)‖ | 292 (49.5%) | 1.52 (1.07‐2.15)* | 1.54 (0.97‐2.45) | 1.26 (0.71‐2.26) | |
| Hypertension (ICD‐9 coded or self‐report) | 436 (73.9%) | 3.36 (2.09‐5.41) | 1.53 (0.80‐2.90) | 1.26 (0.57‐2.81) | |
| Mini‐Mental State Exam score# | 19.7 (2.5) | 1.13 (1.03‐1.23) | 1.09 (0.98‐1.22) | 1.22 (1.06‐1.42) | |
| Hospitalized in last 12 months | 253 (46.9%) | 1.50 (1.05‐2.13)* | 1.12 (0.65‐1.95) | ||
| No. of visits to health provider | |||||
| Once/year or less | 80 (18.4%) | REF | REF | ||
| 23 times/year | 58 (13.3%) | 0.80 (0.40‐1.60) | 0.44 (0.17‐1.16) | ||
| 4+ times/year | 298 (68.4%) | 0.60 (0.36‐0.99)* | 0.38 (0.19‐0.74) | ||
Multivariable Associations With Patient CKD Self‐Report
Age, race, and CKD stage remained consistently associated with CKD self‐report, although the magnitude of the effects (odds ratios [ORs]) varied across models (Table 1). Across all the models, patients older than 80 years were still significantly less likely than younger patients to self‐report CKD (ORs ranging from 0.32 to 0.42, all P0.05). Patients classified as being of other race were found to have a 5.29 to 11.63 greater odds of CKD self‐report than African American patients (all P0.05).
Patients with CKD stage 4 and 5 were more likely to self‐report than patients with CKD stage 3 (ORs ranging from 2.693.07 for stage 4 and 3.945.16 for stage 5, P0.05). In the final model, every unit increase in MMSE score increased the odds of CKD self‐report by 22%. In addition, patients who saw their health provider 4 or more times per year were 62% less likely to self‐report CKD than patients who saw their provider 1 or fewer times per year (OR: 0.38, P0.05).
A large proportion of patients (68.6%) were CKD unspecified by ICD‐9 codes, and only 27% of the unspecified group reported having CKD (Table 2). Examining the eGFR CKD stage of the CKD unspecified group showed that 22.8% were eGFR‐determined CKD stage 1 to 2, 57.1% were CKD stage 3, 14.8% were CKD stage 4, and 5.3% were CKD stage 5. Patients had 2 to 3 times greater odds of correct CKD self‐report if physicians had correctly identified their CKD stage (bivariable OR: 2.42, 95% confidence interval [CI]: 1.57‐3.72, multivariable OR: 3.22, 95% CI: 0.99‐10.46) (analysis not shown).
| CKD Stage* | Physician (ICD‐9) Coded | eGFR Calculated | eGFR Coded With ICD‐9 Correct |
|---|---|---|---|
| |||
| Unspecified | 110 (27.2%) | ||
| 12 | 5 (31.2%) | 20 (17.4%) | 0 |
| 3 | 25 (27.2%) | 83 (27.7%) | 17 (29.8%) |
| 4 | 40 (63.5%) | 54 (48.2%) | 25 (69.4%) |
| 5 | 11 (78.6%) | 31 (63.3%) | 10 (83.3%) |
DISCUSSION
Although prior work has examined CKD awareness in the general population and in high‐risk cohorts,[2, 3, 13] this is the first study examining CKD awareness in an urban, underserved hospitalized population. We found that overall patients' CKD awareness was low (32%), but increased as high as 63% for CKD stage 5, even after controlling for patient demographic, clinical characteristics, and healthcare use. Our overall rate of CKD awareness was higher than prior studies overall and at lower CKD stages.[2, 3, 13] Our work is consistent with prior literature that shows increasing CKD awareness with advancing CKD stage.[2, 3, 13]
Older patients (>80 years) had lower awareness of CKD. Older patients are more likely to have a near normal creatinine, despite a markedly reduced eGFR, so their CKD may go unnoticed.[14] Even with appropriate recognition, providers may also feel like their CKD is unlikely to progress to ESRD, given its stability and/or their competing risk of death.[15] Finally, older hospitalized patients may also be less likely to report a CKD diagnosis due to difficulty in recall due to denial, dementia, or delirium.
One limitation is that our case‐finding for CKD was physician ICD‐9 coding, which is highly specific but not sensitive.[9] The majority of patients with physician‐identified CKD were CKD unspecified, perhaps due to poor coding, physician underdocumentation, or physician under‐recognition of CKD stage. Although only 27% of the CKD unspecified group correctly self‐identified as having CKD, over 75% were found to be CKD stage 3 or higher, which should trigger additional monitoring or care based on guidelines.[10] In addition, despite statistical significance, we may not be able to make meaningful inferences about our small other group (nonwhite, non‐African American). Our sample was from 1 hospitalan urban, academic, tertiary care center with a large proportion of African American patientswhich may limit generalizability. The multivariable model will need to be tested in other populations for reproducibility.
Our study significantly contributes to the literature by examining patient awareness of CKD in a high‐risk, urban, hospitalized minority population. Other study strengths include use of basic demographic information, as well as survey and laboratory data for a richer examination of the associations between patient factors and CKD awareness.
CONCLUSION
Hospitalized patients with CKD have a low CKD awareness. Patient awareness of their CKD is increased with physician documentation of CKD severity. Patient awareness of their CKD must be coupled with provider awareness and CKD documentation to link patients to multidisciplinary CKD education and care to slow CKD progression and reduce associated cardiovascular and metabolic complications. Further work is needed across hospitals to determineand improveCKD awareness among both patients and providers.
Disclosures
Dr. Saunders was supported by Pilot and Feasibility Funding from the Chicago Center for Diabetes Translation Research (NIDDK P30 DK092949). Dr. Chin was supported by NIDDK K24 DK071933. Dr. Meltzer was supported by NIA T35 AG029795. Dr. Saunders had full access to all of the study data and takes responsibility for the integrity of the data and accuracy of the data analysis. An abstract of this article was presented at the Society of Hospital Medicine Annual Meeting in Las Vegas, Nevada in March 2014 and at the Society of General Internal Medicine Annual Meeting in San Diego, California in April 2014. The authors report no conflicts of interest.
- United States Renal Data System. Annual Data Report: Atlas of Chronic Kidney Disease and End‐Stage Renal Disease in the United States. Bethesda, MD: National Institutes of Health; 2012.
- , , , et al. Chronic kidney disease awareness among individuals with clinical markers of kidney dysfunction. Clin J Am Soc Neph. 2011;6(8):1838–1844.
- , , , et al. Comparison of CKD awareness in a screening population using the Modification of Diet in Renal Disease (MDRD) Study and CKD Epidemiology Collaboration (CKD‐EPI) equations. Am J Kidney Dis. 2011;57(3 suppl 2):S17–S23.
- , , , et al. Preserving renal function in adults with hypertension and diabetes: a consensus approach. Am J Kidney Dis. 2000;36(3):646–661.
- , , , et al. Multidisciplinary predialysis education decreases the incidence of dialysis and reduces mortality—a controlled cohort study based on the NKFDOQI guidelines. Nephrol Dial Transplant. 2009;24(11):3426–3433.
- , , . Pre‐dialysis hospital use and late referrals in incident dialysis patients in England: a retrospective cohort study. Nephrol Dial Transplant. 2015;30(1):124–129.
- , , , et al. Do hospitals that provide heart failure patient education prior to discharge also promote continuity of care? A report from OPTIMIZE‐HF. J Card Fail. 2006;12(6 suppl):S111.
- , , , et al. Effects of physician experience on costs and outcomes on an academic general medicine service: results of a trial of hospitalists. Ann Intern Med. 2002;137(11):866–874.
- , , , et al. Failure of ICD‐9‐CM codes to identify patients with comorbid chronic kidney disease in diabetes. Health Serv Res. 2006;41(2):564–580.
- , , , . Validation of a telephone version of the mini‐mental state examination. J Am Geriatr Soc. 1992;40(7):697–702.
- National Kidney Foundation. Kidney disease outcomes quality initiative guidelines 2002. Available at: http://www2.kidney.org/professionals/KDOQI/guidelines_ckd/toc.htm. Accessed October 9, 2014.
- , , , , , . A more accurate method to estimate glomerular filtration rate from serum creatinine: a new prediction equation. Ann Intern Med. 1999;130(6):461–470.
- , , , et al. Prevalence and awareness of CKD among African Americans: the Jackson Heart Study. Am J Kidney Dis. 2009;53(2):238–247.
- , , , , , . Magnitude of underascertainment of impaired kidney function in older adults with normal serum creatinine. J Am Geriatr Soc. 2007;55(6):816–823.
- , , , et al. Prediction, Progression, and Outcomes of Chronic Kidney Disease in Older Adults. J Am Soc Neph. 2009;20(6):1199–1209.
Chronic kidney disease (CKD) affects over 13% of the US population and is associated with increased morbidity, mortality, and healthcare costs.[1] However, only 10% of individuals with CKD are aware of their diagnoses.[2] Even in those with stage 5 CKD, only 60% of individuals are aware of their CKD.[3] To our knowledge, no work has examined CKD awareness in a hospitalized patient population.
Patient awareness of their CKD diagnosis is important because progression of kidney disease can be slowed by patient self‐management of diabetes and hypertension.[4] Patient awareness of CKD may also increase acceptance of preend‐stage renal disease (ESRD) patient education and nephrology referral, which have been shown to delay CKD progression and improve clinical status at dialysis initiation.[5] However, only 60% of patients with advanced CKD have visited a nephrologist in the past year or have seen a nephrologist prior to dialysis initiation.[1]
The hospital is an important site for patient education and linkage to outpatient care for patients with CKD.[6] The hospital serves high‐risk patients who may not be well connected to outpatient care or who have lesswell‐controlled disease.[6, 7] Thus, hospitalization represents an opportunity to identify existing CKD and to use a multidisciplinary approach to preventative care, patient education, and patient‐provider planning for renal replacement therapy needs. In our cross‐sectional study in an urban, minority‐serving hospital, we sought to determine what patient factors were associated with hospitalized patients correctly self‐identifying as having CKD.
METHODS
Subjects and Data
We used data from the University of Chicago Hospitalist Project, a study of hospitalized patient outcomes.[8] Within 48 hours of hospitalization, all general medicine patients or their proxies are approached to enroll. During one‐on‐one inpatient interviews, a trained research assistant obtains demographic, health status, and healthcare utilization information. Participants consent for study staff to review their medical records. More than 80% of general medicine patients enroll.
We obtained data on 1234 general medicine patients discharged between January 1, 2012 and March 31, 2013 with an International Classification of Diseases, Ninth Revision (ICD‐9) code for chronic kidney disease (ICD‐9 codes 585.0585.5, 585.9) in their first 20 admission diagnoses. These codes are highly specific for CKD but have lower sensitivity.[9] We excluded all patients with a history of transplant (996.81, V42.0, n=90) or ESRD (585.6, n=416). We excluded repeat admissions during the study period (n=138). Our final sample included 590 unique patients with ICD‐9 diagnosis of CKD without ESRD.
Demographic, Clinical, and Health Service Utilization Characteristics
Our outcome was CKD awareness, the patient's correct self‐report of kidney disease. Patients selected their chronic medical conditions from a list read to them and were specifically asked if they had kidney problems. Demographic characteristics including age, gender, race/ethnicity, marital status, and education were also obtained. Healthcare utilization variables included how often the patient saw their primary medical care provider in the past year and whether patients had a prior hospitalization in the last year.
Health status variables such as mental status, diabetes, hypertension, and CKD stage were also assessed. Mental status was quantified using the telephone version of the Mini‐Mental State Examination (MMSE), scored from 1 to 22.10 We defined diabetes as ICD‐9 codes 250.0250.00, and hypertension as ICD‐9 codes 401.0, 401.9, 403, 405.09, 405.19, 405.91, 405.99, or by patient self‐report. CKD stage was based on the estimated glomerular filtration rate (eGFR) from the medical record using Kidney Disease Outcomes Quality Initiative guidelines.[11] We used the mode of the eGFR to calculate the appropriate CKD stage for those with more than 1 eGFR value from the hospitalization (576/590, 98%). The eGFR was calculated by the modified Modification of Diet in Renal Disease equation: (GFR (mL/min/1.73 m2)=175 (Screatinine)1.154 (Age)0.203 (0.742 if female) x (1.212 if African American)) recommended by the National Kidney Disease Education Program.[12]
Analysis
We used logistic regression to analyze the influence of the demographic, clinical, and healthcare utilization covariates on the likelihood of a patient reporting kidney problems. For the multivariate analysis, we sequentially added variables in a step‐wise fashion. We adjusted for (1) demographic factors: gender, race, ethnicity, marital status, and education; (2) eGFR‐calculated CKD stage and comorbidities: diabetes, hypertension, and mental status; and (3) healthcare utilization in the last 12 months: any hospitalizations and the number of visits to a health provider.
RESULTS
Patient Characteristics and Bivariable Association With Patient CKD Self‐Report
Table 1 shows demographic, clinical, and health service use characteristics for 590 patients with ICD‐9 coded CKD. In the bivariable model in Table 1, age, race, marital status and comorbidities, were associated with patient self‐report of CKD. Patients older than 80 years with physician‐identified CKD through ICD‐9 coding had 57% lower odds of reporting CKD than their younger counterparts. Patients of other races (nonwhite, non‐African American), married patients, and those with CKD stages 4 and 5 were much more likely to correctly self‐report CKD. Patients with higher MMSE score, diabetes, or hypertension had greater odds of CKD self‐report (all P0.05).
| Total, N=590 | Bivariable Odds Ratio (95% CI) | Multivariable With Stepwise Addition (95% CI) | |||
|---|---|---|---|---|---|
| Model 1, Demographic Factors | Model 2, Plus CKD Stage and Other Comorbidities | Model 3, Plus Health Service Use | |||
| |||||
| Female | 312 (52.98%) | 1.21 (0.85‐1.70) | 1.64 (1.09‐2.47)* | 1.28 (0.79‐2.06) | 1.36 (0.75‐2.48) |
| Age, y | |||||
| Below 54 | 138 (23.4%) | REF | REF | REF | REF |
| 5466 | 150 (24.4%) | 0.96 (0.59‐1.54) | 0.95 (0.56‐1.59) | 1.01 (0.56‐1.81) | 0.83 (0.41‐1.68) |
| 6779 | 161 (27.3%) | 0.77 (0.48‐1.23) | 0.67 (0.39‐1.15) | 0.66 (0.35‐1.23) | 0.72(0.34‐1.52) |
| Above 80 | 141 (23.9%) | 0.43 (0.26‐0.74) | 0.32 (0.17‐0.60) | 0.42 (0.20‐0.91)* | 0.37 (0.15‐0.93)* |
| Race | |||||
| African American | 449 (82.1%) | REF | REF | REF | REF |
| White | 75 (13.7%) | 1.47 (0.89‐2.42) | 1.53 (0.86‐2.71) | 1.56 (0.78‐3.12) | 1.08 (0.47‐2.49) |
| Other | 23 (4.2%) | 3.62 (1.53‐8.54) | 5.29 (1.78‐15.73) | 6.19 (1.72‐22.29) | 11.63 (1.80‐75.21)* |
| Ethnicity (Hispanic is reference group) | 21 (4.0%) | 0.97 (0.38‐2.44) | 0.43 (0.13‐1.45) | 0.71 (0.16‐3.09) | 0.46 (0.06‐3.57) |
| Married | 171 (32.6%) | 1.49 (1.03‐2.18)* | 1.32 (0.85‐2.04) | 1.20 (0.73‐1.98) | 1.77 (0.94‐3.33) |
| Education | |||||
| Less than high school | 128 (25.2%) | REF | REF | REF | REF |
| High school grad/some college | 296 (58.2%) | 1.05 (0.68‐1.63) | 0.93 (0.58‐1.49) | 0.95 (0.54‐1.67) | 0.85 (0.42‐1.72) |
| College grad or higher | 85 (16.7%) | 1.13 (0.64‐2.01) | 0.96 (0.51‐1.78) | 1.07 (0.51‐2.23) | 0.69 (0.27‐1.77) |
| CKD stage (eGFR calculated, mode) | |||||
| 12 | 115 (20.0%) | 0.55 (0.32‐0.95)* | 0.52 (0.27‐1.01) | 0.28 (0.11‐0.69) | |
| 3 | 300 (52.1%) | REF | REF | REF | |
| 4 | 112 (19.4%) | 2.43 (1.55‐3.81) | 2.69 (1.52‐4.76) | 3.07 (1.56‐6.07) | |
| 5 | 49 (8.5%) | 4.50 (2.39‐8.48) | 3.94 (1.81‐8.56) | 5.16 (1.85‐14.41) | |
| Diabetes (ICD‐9 coded or self‐report)‖ | 292 (49.5%) | 1.52 (1.07‐2.15)* | 1.54 (0.97‐2.45) | 1.26 (0.71‐2.26) | |
| Hypertension (ICD‐9 coded or self‐report) | 436 (73.9%) | 3.36 (2.09‐5.41) | 1.53 (0.80‐2.90) | 1.26 (0.57‐2.81) | |
| Mini‐Mental State Exam score# | 19.7 (2.5) | 1.13 (1.03‐1.23) | 1.09 (0.98‐1.22) | 1.22 (1.06‐1.42) | |
| Hospitalized in last 12 months | 253 (46.9%) | 1.50 (1.05‐2.13)* | 1.12 (0.65‐1.95) | ||
| No. of visits to health provider | |||||
| Once/year or less | 80 (18.4%) | REF | REF | ||
| 23 times/year | 58 (13.3%) | 0.80 (0.40‐1.60) | 0.44 (0.17‐1.16) | ||
| 4+ times/year | 298 (68.4%) | 0.60 (0.36‐0.99)* | 0.38 (0.19‐0.74) | ||
Multivariable Associations With Patient CKD Self‐Report
Age, race, and CKD stage remained consistently associated with CKD self‐report, although the magnitude of the effects (odds ratios [ORs]) varied across models (Table 1). Across all the models, patients older than 80 years were still significantly less likely than younger patients to self‐report CKD (ORs ranging from 0.32 to 0.42, all P0.05). Patients classified as being of other race were found to have a 5.29 to 11.63 greater odds of CKD self‐report than African American patients (all P0.05).
Patients with CKD stage 4 and 5 were more likely to self‐report than patients with CKD stage 3 (ORs ranging from 2.693.07 for stage 4 and 3.945.16 for stage 5, P0.05). In the final model, every unit increase in MMSE score increased the odds of CKD self‐report by 22%. In addition, patients who saw their health provider 4 or more times per year were 62% less likely to self‐report CKD than patients who saw their provider 1 or fewer times per year (OR: 0.38, P0.05).
A large proportion of patients (68.6%) were CKD unspecified by ICD‐9 codes, and only 27% of the unspecified group reported having CKD (Table 2). Examining the eGFR CKD stage of the CKD unspecified group showed that 22.8% were eGFR‐determined CKD stage 1 to 2, 57.1% were CKD stage 3, 14.8% were CKD stage 4, and 5.3% were CKD stage 5. Patients had 2 to 3 times greater odds of correct CKD self‐report if physicians had correctly identified their CKD stage (bivariable OR: 2.42, 95% confidence interval [CI]: 1.57‐3.72, multivariable OR: 3.22, 95% CI: 0.99‐10.46) (analysis not shown).
| CKD Stage* | Physician (ICD‐9) Coded | eGFR Calculated | eGFR Coded With ICD‐9 Correct |
|---|---|---|---|
| |||
| Unspecified | 110 (27.2%) | ||
| 12 | 5 (31.2%) | 20 (17.4%) | 0 |
| 3 | 25 (27.2%) | 83 (27.7%) | 17 (29.8%) |
| 4 | 40 (63.5%) | 54 (48.2%) | 25 (69.4%) |
| 5 | 11 (78.6%) | 31 (63.3%) | 10 (83.3%) |
DISCUSSION
Although prior work has examined CKD awareness in the general population and in high‐risk cohorts,[2, 3, 13] this is the first study examining CKD awareness in an urban, underserved hospitalized population. We found that overall patients' CKD awareness was low (32%), but increased as high as 63% for CKD stage 5, even after controlling for patient demographic, clinical characteristics, and healthcare use. Our overall rate of CKD awareness was higher than prior studies overall and at lower CKD stages.[2, 3, 13] Our work is consistent with prior literature that shows increasing CKD awareness with advancing CKD stage.[2, 3, 13]
Older patients (>80 years) had lower awareness of CKD. Older patients are more likely to have a near normal creatinine, despite a markedly reduced eGFR, so their CKD may go unnoticed.[14] Even with appropriate recognition, providers may also feel like their CKD is unlikely to progress to ESRD, given its stability and/or their competing risk of death.[15] Finally, older hospitalized patients may also be less likely to report a CKD diagnosis due to difficulty in recall due to denial, dementia, or delirium.
One limitation is that our case‐finding for CKD was physician ICD‐9 coding, which is highly specific but not sensitive.[9] The majority of patients with physician‐identified CKD were CKD unspecified, perhaps due to poor coding, physician underdocumentation, or physician under‐recognition of CKD stage. Although only 27% of the CKD unspecified group correctly self‐identified as having CKD, over 75% were found to be CKD stage 3 or higher, which should trigger additional monitoring or care based on guidelines.[10] In addition, despite statistical significance, we may not be able to make meaningful inferences about our small other group (nonwhite, non‐African American). Our sample was from 1 hospitalan urban, academic, tertiary care center with a large proportion of African American patientswhich may limit generalizability. The multivariable model will need to be tested in other populations for reproducibility.
Our study significantly contributes to the literature by examining patient awareness of CKD in a high‐risk, urban, hospitalized minority population. Other study strengths include use of basic demographic information, as well as survey and laboratory data for a richer examination of the associations between patient factors and CKD awareness.
CONCLUSION
Hospitalized patients with CKD have a low CKD awareness. Patient awareness of their CKD is increased with physician documentation of CKD severity. Patient awareness of their CKD must be coupled with provider awareness and CKD documentation to link patients to multidisciplinary CKD education and care to slow CKD progression and reduce associated cardiovascular and metabolic complications. Further work is needed across hospitals to determineand improveCKD awareness among both patients and providers.
Disclosures
Dr. Saunders was supported by Pilot and Feasibility Funding from the Chicago Center for Diabetes Translation Research (NIDDK P30 DK092949). Dr. Chin was supported by NIDDK K24 DK071933. Dr. Meltzer was supported by NIA T35 AG029795. Dr. Saunders had full access to all of the study data and takes responsibility for the integrity of the data and accuracy of the data analysis. An abstract of this article was presented at the Society of Hospital Medicine Annual Meeting in Las Vegas, Nevada in March 2014 and at the Society of General Internal Medicine Annual Meeting in San Diego, California in April 2014. The authors report no conflicts of interest.
Chronic kidney disease (CKD) affects over 13% of the US population and is associated with increased morbidity, mortality, and healthcare costs.[1] However, only 10% of individuals with CKD are aware of their diagnoses.[2] Even in those with stage 5 CKD, only 60% of individuals are aware of their CKD.[3] To our knowledge, no work has examined CKD awareness in a hospitalized patient population.
Patient awareness of their CKD diagnosis is important because progression of kidney disease can be slowed by patient self‐management of diabetes and hypertension.[4] Patient awareness of CKD may also increase acceptance of preend‐stage renal disease (ESRD) patient education and nephrology referral, which have been shown to delay CKD progression and improve clinical status at dialysis initiation.[5] However, only 60% of patients with advanced CKD have visited a nephrologist in the past year or have seen a nephrologist prior to dialysis initiation.[1]
The hospital is an important site for patient education and linkage to outpatient care for patients with CKD.[6] The hospital serves high‐risk patients who may not be well connected to outpatient care or who have lesswell‐controlled disease.[6, 7] Thus, hospitalization represents an opportunity to identify existing CKD and to use a multidisciplinary approach to preventative care, patient education, and patient‐provider planning for renal replacement therapy needs. In our cross‐sectional study in an urban, minority‐serving hospital, we sought to determine what patient factors were associated with hospitalized patients correctly self‐identifying as having CKD.
METHODS
Subjects and Data
We used data from the University of Chicago Hospitalist Project, a study of hospitalized patient outcomes.[8] Within 48 hours of hospitalization, all general medicine patients or their proxies are approached to enroll. During one‐on‐one inpatient interviews, a trained research assistant obtains demographic, health status, and healthcare utilization information. Participants consent for study staff to review their medical records. More than 80% of general medicine patients enroll.
We obtained data on 1234 general medicine patients discharged between January 1, 2012 and March 31, 2013 with an International Classification of Diseases, Ninth Revision (ICD‐9) code for chronic kidney disease (ICD‐9 codes 585.0585.5, 585.9) in their first 20 admission diagnoses. These codes are highly specific for CKD but have lower sensitivity.[9] We excluded all patients with a history of transplant (996.81, V42.0, n=90) or ESRD (585.6, n=416). We excluded repeat admissions during the study period (n=138). Our final sample included 590 unique patients with ICD‐9 diagnosis of CKD without ESRD.
Demographic, Clinical, and Health Service Utilization Characteristics
Our outcome was CKD awareness, the patient's correct self‐report of kidney disease. Patients selected their chronic medical conditions from a list read to them and were specifically asked if they had kidney problems. Demographic characteristics including age, gender, race/ethnicity, marital status, and education were also obtained. Healthcare utilization variables included how often the patient saw their primary medical care provider in the past year and whether patients had a prior hospitalization in the last year.
Health status variables such as mental status, diabetes, hypertension, and CKD stage were also assessed. Mental status was quantified using the telephone version of the Mini‐Mental State Examination (MMSE), scored from 1 to 22.10 We defined diabetes as ICD‐9 codes 250.0250.00, and hypertension as ICD‐9 codes 401.0, 401.9, 403, 405.09, 405.19, 405.91, 405.99, or by patient self‐report. CKD stage was based on the estimated glomerular filtration rate (eGFR) from the medical record using Kidney Disease Outcomes Quality Initiative guidelines.[11] We used the mode of the eGFR to calculate the appropriate CKD stage for those with more than 1 eGFR value from the hospitalization (576/590, 98%). The eGFR was calculated by the modified Modification of Diet in Renal Disease equation: (GFR (mL/min/1.73 m2)=175 (Screatinine)1.154 (Age)0.203 (0.742 if female) x (1.212 if African American)) recommended by the National Kidney Disease Education Program.[12]
Analysis
We used logistic regression to analyze the influence of the demographic, clinical, and healthcare utilization covariates on the likelihood of a patient reporting kidney problems. For the multivariate analysis, we sequentially added variables in a step‐wise fashion. We adjusted for (1) demographic factors: gender, race, ethnicity, marital status, and education; (2) eGFR‐calculated CKD stage and comorbidities: diabetes, hypertension, and mental status; and (3) healthcare utilization in the last 12 months: any hospitalizations and the number of visits to a health provider.
RESULTS
Patient Characteristics and Bivariable Association With Patient CKD Self‐Report
Table 1 shows demographic, clinical, and health service use characteristics for 590 patients with ICD‐9 coded CKD. In the bivariable model in Table 1, age, race, marital status and comorbidities, were associated with patient self‐report of CKD. Patients older than 80 years with physician‐identified CKD through ICD‐9 coding had 57% lower odds of reporting CKD than their younger counterparts. Patients of other races (nonwhite, non‐African American), married patients, and those with CKD stages 4 and 5 were much more likely to correctly self‐report CKD. Patients with higher MMSE score, diabetes, or hypertension had greater odds of CKD self‐report (all P0.05).
| Total, N=590 | Bivariable Odds Ratio (95% CI) | Multivariable With Stepwise Addition (95% CI) | |||
|---|---|---|---|---|---|
| Model 1, Demographic Factors | Model 2, Plus CKD Stage and Other Comorbidities | Model 3, Plus Health Service Use | |||
| |||||
| Female | 312 (52.98%) | 1.21 (0.85‐1.70) | 1.64 (1.09‐2.47)* | 1.28 (0.79‐2.06) | 1.36 (0.75‐2.48) |
| Age, y | |||||
| Below 54 | 138 (23.4%) | REF | REF | REF | REF |
| 5466 | 150 (24.4%) | 0.96 (0.59‐1.54) | 0.95 (0.56‐1.59) | 1.01 (0.56‐1.81) | 0.83 (0.41‐1.68) |
| 6779 | 161 (27.3%) | 0.77 (0.48‐1.23) | 0.67 (0.39‐1.15) | 0.66 (0.35‐1.23) | 0.72(0.34‐1.52) |
| Above 80 | 141 (23.9%) | 0.43 (0.26‐0.74) | 0.32 (0.17‐0.60) | 0.42 (0.20‐0.91)* | 0.37 (0.15‐0.93)* |
| Race | |||||
| African American | 449 (82.1%) | REF | REF | REF | REF |
| White | 75 (13.7%) | 1.47 (0.89‐2.42) | 1.53 (0.86‐2.71) | 1.56 (0.78‐3.12) | 1.08 (0.47‐2.49) |
| Other | 23 (4.2%) | 3.62 (1.53‐8.54) | 5.29 (1.78‐15.73) | 6.19 (1.72‐22.29) | 11.63 (1.80‐75.21)* |
| Ethnicity (Hispanic is reference group) | 21 (4.0%) | 0.97 (0.38‐2.44) | 0.43 (0.13‐1.45) | 0.71 (0.16‐3.09) | 0.46 (0.06‐3.57) |
| Married | 171 (32.6%) | 1.49 (1.03‐2.18)* | 1.32 (0.85‐2.04) | 1.20 (0.73‐1.98) | 1.77 (0.94‐3.33) |
| Education | |||||
| Less than high school | 128 (25.2%) | REF | REF | REF | REF |
| High school grad/some college | 296 (58.2%) | 1.05 (0.68‐1.63) | 0.93 (0.58‐1.49) | 0.95 (0.54‐1.67) | 0.85 (0.42‐1.72) |
| College grad or higher | 85 (16.7%) | 1.13 (0.64‐2.01) | 0.96 (0.51‐1.78) | 1.07 (0.51‐2.23) | 0.69 (0.27‐1.77) |
| CKD stage (eGFR calculated, mode) | |||||
| 12 | 115 (20.0%) | 0.55 (0.32‐0.95)* | 0.52 (0.27‐1.01) | 0.28 (0.11‐0.69) | |
| 3 | 300 (52.1%) | REF | REF | REF | |
| 4 | 112 (19.4%) | 2.43 (1.55‐3.81) | 2.69 (1.52‐4.76) | 3.07 (1.56‐6.07) | |
| 5 | 49 (8.5%) | 4.50 (2.39‐8.48) | 3.94 (1.81‐8.56) | 5.16 (1.85‐14.41) | |
| Diabetes (ICD‐9 coded or self‐report)‖ | 292 (49.5%) | 1.52 (1.07‐2.15)* | 1.54 (0.97‐2.45) | 1.26 (0.71‐2.26) | |
| Hypertension (ICD‐9 coded or self‐report) | 436 (73.9%) | 3.36 (2.09‐5.41) | 1.53 (0.80‐2.90) | 1.26 (0.57‐2.81) | |
| Mini‐Mental State Exam score# | 19.7 (2.5) | 1.13 (1.03‐1.23) | 1.09 (0.98‐1.22) | 1.22 (1.06‐1.42) | |
| Hospitalized in last 12 months | 253 (46.9%) | 1.50 (1.05‐2.13)* | 1.12 (0.65‐1.95) | ||
| No. of visits to health provider | |||||
| Once/year or less | 80 (18.4%) | REF | REF | ||
| 23 times/year | 58 (13.3%) | 0.80 (0.40‐1.60) | 0.44 (0.17‐1.16) | ||
| 4+ times/year | 298 (68.4%) | 0.60 (0.36‐0.99)* | 0.38 (0.19‐0.74) | ||
Multivariable Associations With Patient CKD Self‐Report
Age, race, and CKD stage remained consistently associated with CKD self‐report, although the magnitude of the effects (odds ratios [ORs]) varied across models (Table 1). Across all the models, patients older than 80 years were still significantly less likely than younger patients to self‐report CKD (ORs ranging from 0.32 to 0.42, all P0.05). Patients classified as being of other race were found to have a 5.29 to 11.63 greater odds of CKD self‐report than African American patients (all P0.05).
Patients with CKD stage 4 and 5 were more likely to self‐report than patients with CKD stage 3 (ORs ranging from 2.693.07 for stage 4 and 3.945.16 for stage 5, P0.05). In the final model, every unit increase in MMSE score increased the odds of CKD self‐report by 22%. In addition, patients who saw their health provider 4 or more times per year were 62% less likely to self‐report CKD than patients who saw their provider 1 or fewer times per year (OR: 0.38, P0.05).
A large proportion of patients (68.6%) were CKD unspecified by ICD‐9 codes, and only 27% of the unspecified group reported having CKD (Table 2). Examining the eGFR CKD stage of the CKD unspecified group showed that 22.8% were eGFR‐determined CKD stage 1 to 2, 57.1% were CKD stage 3, 14.8% were CKD stage 4, and 5.3% were CKD stage 5. Patients had 2 to 3 times greater odds of correct CKD self‐report if physicians had correctly identified their CKD stage (bivariable OR: 2.42, 95% confidence interval [CI]: 1.57‐3.72, multivariable OR: 3.22, 95% CI: 0.99‐10.46) (analysis not shown).
| CKD Stage* | Physician (ICD‐9) Coded | eGFR Calculated | eGFR Coded With ICD‐9 Correct |
|---|---|---|---|
| |||
| Unspecified | 110 (27.2%) | ||
| 12 | 5 (31.2%) | 20 (17.4%) | 0 |
| 3 | 25 (27.2%) | 83 (27.7%) | 17 (29.8%) |
| 4 | 40 (63.5%) | 54 (48.2%) | 25 (69.4%) |
| 5 | 11 (78.6%) | 31 (63.3%) | 10 (83.3%) |
DISCUSSION
Although prior work has examined CKD awareness in the general population and in high‐risk cohorts,[2, 3, 13] this is the first study examining CKD awareness in an urban, underserved hospitalized population. We found that overall patients' CKD awareness was low (32%), but increased as high as 63% for CKD stage 5, even after controlling for patient demographic, clinical characteristics, and healthcare use. Our overall rate of CKD awareness was higher than prior studies overall and at lower CKD stages.[2, 3, 13] Our work is consistent with prior literature that shows increasing CKD awareness with advancing CKD stage.[2, 3, 13]
Older patients (>80 years) had lower awareness of CKD. Older patients are more likely to have a near normal creatinine, despite a markedly reduced eGFR, so their CKD may go unnoticed.[14] Even with appropriate recognition, providers may also feel like their CKD is unlikely to progress to ESRD, given its stability and/or their competing risk of death.[15] Finally, older hospitalized patients may also be less likely to report a CKD diagnosis due to difficulty in recall due to denial, dementia, or delirium.
One limitation is that our case‐finding for CKD was physician ICD‐9 coding, which is highly specific but not sensitive.[9] The majority of patients with physician‐identified CKD were CKD unspecified, perhaps due to poor coding, physician underdocumentation, or physician under‐recognition of CKD stage. Although only 27% of the CKD unspecified group correctly self‐identified as having CKD, over 75% were found to be CKD stage 3 or higher, which should trigger additional monitoring or care based on guidelines.[10] In addition, despite statistical significance, we may not be able to make meaningful inferences about our small other group (nonwhite, non‐African American). Our sample was from 1 hospitalan urban, academic, tertiary care center with a large proportion of African American patientswhich may limit generalizability. The multivariable model will need to be tested in other populations for reproducibility.
Our study significantly contributes to the literature by examining patient awareness of CKD in a high‐risk, urban, hospitalized minority population. Other study strengths include use of basic demographic information, as well as survey and laboratory data for a richer examination of the associations between patient factors and CKD awareness.
CONCLUSION
Hospitalized patients with CKD have a low CKD awareness. Patient awareness of their CKD is increased with physician documentation of CKD severity. Patient awareness of their CKD must be coupled with provider awareness and CKD documentation to link patients to multidisciplinary CKD education and care to slow CKD progression and reduce associated cardiovascular and metabolic complications. Further work is needed across hospitals to determineand improveCKD awareness among both patients and providers.
Disclosures
Dr. Saunders was supported by Pilot and Feasibility Funding from the Chicago Center for Diabetes Translation Research (NIDDK P30 DK092949). Dr. Chin was supported by NIDDK K24 DK071933. Dr. Meltzer was supported by NIA T35 AG029795. Dr. Saunders had full access to all of the study data and takes responsibility for the integrity of the data and accuracy of the data analysis. An abstract of this article was presented at the Society of Hospital Medicine Annual Meeting in Las Vegas, Nevada in March 2014 and at the Society of General Internal Medicine Annual Meeting in San Diego, California in April 2014. The authors report no conflicts of interest.
- United States Renal Data System. Annual Data Report: Atlas of Chronic Kidney Disease and End‐Stage Renal Disease in the United States. Bethesda, MD: National Institutes of Health; 2012.
- , , , et al. Chronic kidney disease awareness among individuals with clinical markers of kidney dysfunction. Clin J Am Soc Neph. 2011;6(8):1838–1844.
- , , , et al. Comparison of CKD awareness in a screening population using the Modification of Diet in Renal Disease (MDRD) Study and CKD Epidemiology Collaboration (CKD‐EPI) equations. Am J Kidney Dis. 2011;57(3 suppl 2):S17–S23.
- , , , et al. Preserving renal function in adults with hypertension and diabetes: a consensus approach. Am J Kidney Dis. 2000;36(3):646–661.
- , , , et al. Multidisciplinary predialysis education decreases the incidence of dialysis and reduces mortality—a controlled cohort study based on the NKFDOQI guidelines. Nephrol Dial Transplant. 2009;24(11):3426–3433.
- , , . Pre‐dialysis hospital use and late referrals in incident dialysis patients in England: a retrospective cohort study. Nephrol Dial Transplant. 2015;30(1):124–129.
- , , , et al. Do hospitals that provide heart failure patient education prior to discharge also promote continuity of care? A report from OPTIMIZE‐HF. J Card Fail. 2006;12(6 suppl):S111.
- , , , et al. Effects of physician experience on costs and outcomes on an academic general medicine service: results of a trial of hospitalists. Ann Intern Med. 2002;137(11):866–874.
- , , , et al. Failure of ICD‐9‐CM codes to identify patients with comorbid chronic kidney disease in diabetes. Health Serv Res. 2006;41(2):564–580.
- , , , . Validation of a telephone version of the mini‐mental state examination. J Am Geriatr Soc. 1992;40(7):697–702.
- National Kidney Foundation. Kidney disease outcomes quality initiative guidelines 2002. Available at: http://www2.kidney.org/professionals/KDOQI/guidelines_ckd/toc.htm. Accessed October 9, 2014.
- , , , , , . A more accurate method to estimate glomerular filtration rate from serum creatinine: a new prediction equation. Ann Intern Med. 1999;130(6):461–470.
- , , , et al. Prevalence and awareness of CKD among African Americans: the Jackson Heart Study. Am J Kidney Dis. 2009;53(2):238–247.
- , , , , , . Magnitude of underascertainment of impaired kidney function in older adults with normal serum creatinine. J Am Geriatr Soc. 2007;55(6):816–823.
- , , , et al. Prediction, Progression, and Outcomes of Chronic Kidney Disease in Older Adults. J Am Soc Neph. 2009;20(6):1199–1209.
- United States Renal Data System. Annual Data Report: Atlas of Chronic Kidney Disease and End‐Stage Renal Disease in the United States. Bethesda, MD: National Institutes of Health; 2012.
- , , , et al. Chronic kidney disease awareness among individuals with clinical markers of kidney dysfunction. Clin J Am Soc Neph. 2011;6(8):1838–1844.
- , , , et al. Comparison of CKD awareness in a screening population using the Modification of Diet in Renal Disease (MDRD) Study and CKD Epidemiology Collaboration (CKD‐EPI) equations. Am J Kidney Dis. 2011;57(3 suppl 2):S17–S23.
- , , , et al. Preserving renal function in adults with hypertension and diabetes: a consensus approach. Am J Kidney Dis. 2000;36(3):646–661.
- , , , et al. Multidisciplinary predialysis education decreases the incidence of dialysis and reduces mortality—a controlled cohort study based on the NKFDOQI guidelines. Nephrol Dial Transplant. 2009;24(11):3426–3433.
- , , . Pre‐dialysis hospital use and late referrals in incident dialysis patients in England: a retrospective cohort study. Nephrol Dial Transplant. 2015;30(1):124–129.
- , , , et al. Do hospitals that provide heart failure patient education prior to discharge also promote continuity of care? A report from OPTIMIZE‐HF. J Card Fail. 2006;12(6 suppl):S111.
- , , , et al. Effects of physician experience on costs and outcomes on an academic general medicine service: results of a trial of hospitalists. Ann Intern Med. 2002;137(11):866–874.
- , , , et al. Failure of ICD‐9‐CM codes to identify patients with comorbid chronic kidney disease in diabetes. Health Serv Res. 2006;41(2):564–580.
- , , , . Validation of a telephone version of the mini‐mental state examination. J Am Geriatr Soc. 1992;40(7):697–702.
- National Kidney Foundation. Kidney disease outcomes quality initiative guidelines 2002. Available at: http://www2.kidney.org/professionals/KDOQI/guidelines_ckd/toc.htm. Accessed October 9, 2014.
- , , , , , . A more accurate method to estimate glomerular filtration rate from serum creatinine: a new prediction equation. Ann Intern Med. 1999;130(6):461–470.
- , , , et al. Prevalence and awareness of CKD among African Americans: the Jackson Heart Study. Am J Kidney Dis. 2009;53(2):238–247.
- , , , , , . Magnitude of underascertainment of impaired kidney function in older adults with normal serum creatinine. J Am Geriatr Soc. 2007;55(6):816–823.
- , , , et al. Prediction, Progression, and Outcomes of Chronic Kidney Disease in Older Adults. J Am Soc Neph. 2009;20(6):1199–1209.
Peripheral Administration of VM
Vasoactive medications (VMs) are often required to improve hemodynamic function in patients with shock. They are usually given through central venous catheter (CVC) access, primarily out of concern that extravasation of peripheral intravenous (PIV) access may result in local tissue injury due to the vasoconstrictive effect of the VM. However, insertion of CVC is associated with a variety of mechanical complications and risk of central lineassociated bacteremia. To examine the feasibility and safety of using VM via PIV access, we report on the administration of VM in the form of norepinephrine, dopamine, and phenylephrine via PIV access, with the rationale that this would be a method of reducing the need of CVC use. Our hypotheses are that VM via PIV access is both feasible and safe.
MATERIAL AND METHODS
Study Design
This was a single‐arm, consecutive‐patient study conducted from September 2012 to June 2014. The study site was an 18‐bed medical intensive care unit (MICU) staffed by full‐time attendings, fellows, and residents at the Long Island Jewish Medical Center, which is an 827‐bed tertiary care teaching hospital that is part of the North ShoreLong Island Jewish Health System. The primary outcome measure was the rate of local tissue injury resulting from use of VM via PIV access. The study was approved by the hospital institutional review board (study #13583A), which waived requirement for informed consent.
Protocol for Administration of VM via PIV Access
In cooperation with the Department of Pharmacy, medical and nursing staff developed a written protocol for administration of VM via PIV access. The protocol was reviewed and approved by the hospital pharmacy and therapeutics committee and the MICU nursing leadership. The MICU nursing staff received in‐service training before rollout of the protocol, which included training on the recognition of PIV access extravasation and the type of line that could be used. The MICU housestaff teams were given specific instructions concerning the protocol during their MICU rotations. A summary of the requirements for PIV access for VM use is summarized in Table 1.
|
| Vein diameter >4 mm measured with ultrasonography |
| Position of PIV access documented to be in the vein with ultrasonography before starting infusion of VM |
| Upper extremity only, contralateral to the blood pressure cuff |
| Intravenous line size 20 gauge or 18 gauge |
| No hand, wrist, or antecubital fossa PIV access position |
| Blood return from the PIV access prior to VM administration |
| Assessment of PIV access function every 2 hours as per nursing protocol |
| Immediate alert by nursing staff to the medical team if line extravasation, with prompt initiation of local treatment |
| 72 hours maximum duration of PIV access use |
Patient Management
The decision to initiate treatment with VM was made by the clinical management team. The standard concentrations of VM for use via PIV access were: norepinephrine 8 mg or 16 mg/250 mL normal saline, dopamine 400 mg or 800 mg/250 mL D5W, and phenylephrine 80 mg or 160 mg/500 mL normal saline. If the attending or fellow in charge of the case decided that VM should be administered through PIV access, peripheral access was established that conformed to the requirements of the protocol, and VM was administered via PIV access for as long as there was clinical indication or until PIV access suitable for VM administration was no longer feasible. If the patient received VM via PIV access, a second PIV access site was established in case of failure of the primary PIV site. If no PIV access could be inserted, the patient received CVC access. The decision to use VM via CVC access was made by the clinical management team, as was the type, dose, and duration of the VM use via PIV access or CVC access. Vasopressin was not used via PIV access. Dobutamine was used via PIV access but not recorded in our results, as it has no ‐mediated vasoconstrictor effect. Dobutamine was not used concomitantly with other vasoactive medication through the same PIV access. If PIV access was not established using standard technique by nursing staff, medical residents or critical care fellows inserted PIV access using real‐time ultrasound guidance. The PIV access use for VM could also be used for other medications providing they were compatible with the VM. Only 1 type of VM was infused through the PIV access.
As indicated in Table 1, the nursing staff examined the PIV access site every 2 hours and checked that blood could be aspirated from the line. The aspiration of the line requires several seconds of discontinuation of VM use, which we considered to have no clinical relevance. If the nursing staff identified extravasation of the PIV access site through which VM was infusing, they notified the medical housestaff, who promptly initiated treatment with local injection of phentolamine and local application of nitroglycerin paste as described in Table 2. The extravasation site was examined for tissue injury on a shift basis by the nursing staff, and on bedside rounds by the attending and fellow for at least 48 hours following PIV access removal. Tissue injury was defined as any erythema, blistering, skin breakdown, or necrosis in the site of extravasation.
|
| 1. The VM via PIV infusion is stopped immediately. |
| 2. Residual medication is aspirated through the PIV access, and the catheter is removed. |
| 3. The extent of the extravasation is outlined to provide a baseline for monitoring. |
| 4. Two vials, each containing 5 mg of phentolamine, are reconstituted with 5 mL of normal saline per vial to yield a final concentration of 1 mg/mL. |
| 5. The phentolamine solution is injected in 0.5‐ to 1‐mL aliquots in 5 separate injections around the leading edge of the extravasation, using separate 25‐gauge or 27‐gauge needles for each injection. |
| 6. Nitroglycerin paste (2.5 cm) is applied to the area of extravasation. |
| 7. A medication occurrence report is filled out for review by the quality committee. |
Data were collected prospectively by an investigator (J.C.‐G.) and entered into a standard data‐collection sheet for quality and safety assessment for the initial 13 months of the study. In the subsequent 7 months of observation, data were collected from retrospective chart review. The initial 13 months of data collection were performed as an ongoing safety analysis project; the subsequent 7‐month review was performed as an additional quality assessment project. The deidentified data included patient demographics, patient disease characteristics, use of VM, and VM via PIV access complications.
Statistical Analysis
The statistical analysis was performed using SPSS 21 (Statistical Package for the Social Sciences; IBM, Armonk, NY). Continuous variables are presented as meanstandard deviation.
RESULTS
Characteristics of patients who received VM via PIV access are presented in Table 3. During the study period, there were 2462 admissions to the MICU, and 267 CVCs were inserted by the MICU team, 170 of which were triple‐lumen catheters and 97 were large‐gauge catheters for hemodialysis or plasmapheresis. Of the total admissions, 953 cases received VM; 783/953 (82%) received VM via PIV access, and 170/953 received VM via CVC access (18%). For VM use, an 18‐gauge PIV catheter was used in 192/783 (25%), a 20‐gauge catheter was used in 590/783 (75%), and a 22‐gauge catheter was used in 1/783 of interventions. Catheter length was 30 mm, 45 mm, or 48 mm depending on availability. The 22‐gauge catheter, which was a deviation from standard protocol, infiltrated shortly following insertion. We did not formally record the anatomic position of the PIV access in the standard data‐collection sheet; anecdotally, the majority of PIV accesses were placed in the upper arm basilic or cephalic vein. The duration of VM via PIV access was 4922 hours. Central intravenous access was required in 95/734 (13%) of patients who initially had VM via PIV access. These catheters are included in the 170 triple‐lumen CVCs that were inserted by the MICU team during the study period. The type and highest dose of VM administered via PIV access are presented in Table 4.
| Total Study Group | |
|---|---|
| |
| No. of patients | 734 |
| Age, y | 7215 |
| Gender | |
| Male | 398 (54%) |
| Female | 336 (46%) |
| SAPS II score | 7515 |
| Patients on mechanical ventilation | 235 (32%) |
| Patients on hemodialysis | 90 (12%) |
| MICU mortality | 177 (23%) |
| Use of VM via PIV access | 783 |
| Extravasations of VM via PIV access | 19 (2%) |
| Total MICU admissions during study period | 2,462 |
| |
| Norepinephrine | |
| Interventions | 506 |
| Dose, g/kg/min, meanSD | 0.700.23 |
| PIV access extravasations | 16 |
| Dopamine | |
| Interventions | 101 |
| Dose, g/kg/min, meanSD | 12.75.23 |
| PIV access extravasations | 3 |
| Phenylephrine | |
| Interventions | 176 |
| Dose, g/kg/min, meanSD | 3.251.69 |
| PIV access extravasations | 0 |
A total of 734 patients received VM via PIV access during the 20‐month study period; 49 of these patients required 2 or more PIV access insertions, as the initial and/or subsequent site timed out at 72 hours, resulting in a total of 783 separate interventions. Infiltration of the PIV access site occurred in 19/783 (2%) of interventions. All of them were identified by nursing staff with prompt response using local injection of phentolamine and application of nitroglycerin paste at the site of the extravasation. There was no tissue injury at the site of VM extravasation. Sixteen of the extravasations occurred with norepinephrine infusions and 3 with dopamine infusions. There were no infections of the PIV access sites used for VM. Use of phentolamine and nitroglycerin paste was not associated with hypotension, as defined as mean arterial pressure less than 65 mm Hg.
DISCUSSION
Our study demonstrates that administration of VM via PIV access is feasible, carries a low rate of complications, and offers an alternative to CVC access. There are several elements that may have allowed safe use of VM via PIV access. We developed a protocol that involved a multidisciplinary team. The hospital pharmacy performed an extensive literature search and formulated the initial protocol with the MICU attending staff. The protocol was then subjected to iterative process improvement by a hospital committee and nursing leadership in the MICU. Before program rollout, the MICU nursing staff were educated and trained to use the protocol. This was a key component of the program, as the nurses were responsible for many of the line insertions, line maintenance, and identification of infiltration. Although we did not perform any formal measurement of the impact of PIV access use on nursing workflow, we note that leadership and frontline nurses have been enthusiastic about the implementation of VM via PIV access. The MICU housestaff teams were given an in‐service instruction concerning the importance of prompt initiation of local treatment in case of infiltration of the PIV access site. Specific elements of the protocol that may have improved safety were the use of ultrasonography to insert difficult PIV access and confirmation of all PIV access insertions using ultrasonography by the MICU housestaff. The requirement for frequent checks of PIV access function, prompt recognition of infiltration, and specific antidote to extravasation were important elements of safety. The low rate of PIV access extravasation (2%) may be related to the use of ultrasonography to guide PIV access insertion in patients who had challenging anatomy (eg, obesity, edema, recreational drug use, history of multiple PIV insertions), and ultrasonography was used to check that the PIV access was well positioned before VM infusion.
There were early literature reports that subcutaneous extravasation of catecholamines could result in local ischemic injury both in human patients and animal models.[1, 2, 3, 4, 5] Local phentolamine injection has been identified as a specific antidote to block the local ischemic injury.[6, 7, 8, 9, 10, 11, 12, 13, 14, 15] More recently, there have been anecdotal reports showing that local application of nitroglycerin paste blocks ischemic injury in the pediatric population.[5, 16, 17] With this information, our protocol included the requirement of prompt treatment of local extravasation with phentolamine and nitroglycerin paste at the site of VM via PIV access extravasation. In theory, both phentolamine and nitroglycerin might cause hypotension. In our study, administration of both phentolamine and nitroglycerin paste was not associated with more hypotension nor did it increase requirements for VM.
Multilumen small bore CVCs may be used for several reasons, some of which need to be reconsidered. First, before introduction of the VM via PIV access protocol, a common indication for triple lumen CVC insertion in our MICU was the perception that VM could only be administered through CVC access, for fear of local tissue injury should extravasation of the VM occur through the PIV access site. Our results indicate that VM use is not an automatic indication for CVC insertion. Second, a possible indication for CVC insertion is to measure central venous pressure for the purpose of guiding volume resuscitation in patients with hemodynamic failure. As the utility of central venous pressure monitoring has been called into serious question,[18, 19, 20] we do not consider this indication for CVC use to be valid. Third, CVC access may be required due to anatomic constraints (ie, there is no suitable PIV site). Fourth, there may be need for such a large number of intravenous medications that PIV access cannot support. Fifth, there is occasional situation where the patient requires use of medications where extravasation of PIV access would cause local tissue injury without local antidote (eg, certain chemotherapeutic agents). The continued need for CVC access in some patients is reflected in the finding that 13% of our study patients who received VM via PIV access eventually required triple‐lumen CVC insertion. However, our results indicate that the rate of CVC use may be reduced by using PIV access for VM administration.
Our study has some methodological limitations. Study design was single center and observational. The focus of this study was to examine the safety of VM via PIV access. We cannot comment on its effectiveness, indications, or influence on patient outcome nor on why some patients required CVC insertion whereas others did not. The decision to administer VM was made by the clinical team, as was the route of its administration and concentration, without any input from the investigators. We did not collect data on who performed the PIV access insertion (medical or nursing staff), demographics, and disease characteristics of the CVC group, nor to what extent ultrasonography was used to guide PIV insertion. We did not attempt to define whether there were any factors that identified risk for PIV access extravasation, nor did we evaluate for any differences between the PIV and CVC group in terms of demographics and disease characteristics. Lacking a control group, we cannot say definitively that VM via PIV access is safer than VM via CVC. Being a single‐center study, it is not possible to say that the results are transferable to another clinical environment; this applies particularly to the use of ultrasonography, which is a user‐dependent skill. We cannot determine which, if any, component of the protocol was responsible for the safe use of VM via PIV access. The rate of PIV access extravasation was low, so it is possible that a larger sample size is required to identify incidents of tissue necrosis from extravasation of VM delivered via PIV access despite the use of local antidote.
CONCLUSIONS
The delivery of VM via PIV access is safe and feasible. Tto reduce the risk of extravasation leading to possible local tissue injury, we developed a protocol that emphasized close cooperation between the nursing and medical staff, routine use of ultrasonography, rapid identification of extravasation of the PIV access, and prompt response to local extravasation of VM using phentolamine and nitroglycerin paste. This approach offers a means of reducing CVC use, in both intensive care unit (ICU) and non‐ICU settings, including hospital wards and emergency departments. Clinicians should no longer consider administration of norepinephrine, dopamine, or phenylephrine to be an automatic indication for CVC access. This study focused on the safety of VM administered via PIV access, with emphasis on local complications related to extravasation, and should be considered a preliminary single‐center study that demonstrates that administration of certain vasoactive medications may not universally require central venous access. A broader study regarding assessment of safety and efficacy will require a multicenter design.
Disclosures
J.C.‐G., K.F.S., Y.G.B., M.N., S.J.K., and P.H.M. participated in the study design, statistical review, and manuscript writing. J.C.‐G. is the guarantor of the article, taking responsibility for the integrity of the work as a whole from inception to published article. This work is original, and all authors meet the criteria for authorship, including acceptance of responsibility for the scientific content of the article. This article is not under consideration in any other journal, and all of the authors have read and approved the content of the article. No potential conflict of interest exists with any companies or organizations whose products or services are discussed in this article. This article has not been funded by the National Institutes of Health, the Wellcome Trust, or their agencies. All financial support of the study was derived from the Division of Pulmonary, Critical Care and Sleep Medicine at North ShoreLong Island Jewish Medical Center, New Hyde Park, New York.
- , , . Cutaneous necrosis due to norepinephrine. II. Mechanism and prevention. Ann Surg. 1958;147:44–50.
- , , . Pedal gangrene associated with the use of dopamine. N Engl J Med. 1975;293:591.
- , . Gangrene aggravation after use of dopamine [letter]. JAMA. 1976;235:2812.
- , . Dopamine gangrene [letter]. N Engl J Med. 1976;294:114.
- , . Extravasation injury associated with low‐dose dopamine. Ann Pharmacother. 1998;32:545–548.
- . Use of phenytolamine to prevent necrosis due to levarterenol. JAMA. 1957;163:1477–1479.
- . Phentolamine hydrochloride in prevention of cutaneous necrosis due to levarterenol. JAMA. 1959;170:1916–1917.
- , . Avoidance of vascular complications associated with the use of dopamine. Can Anaesth Soc J. 1977;24:727–733.
- . Management of intravenous extravasations. Infusion. 1984;6:77–79.
- , . Acute management of dopamine infiltration injury with Regitine. Plast Reconstr Surg. 1987;80:610–612.
- . High dose phentolamine for extravasation of pressors [letter]. Clin Pharm. 1989;8:689.
- , . Phentolamine reversal of epinephrine‐induced digital vasospasm. How to save an ischemic finger. Arch Fam Med. 1994;3:193–195.
- , , . Phentolamine use in a neonate for the prevention of dermal necrosis caused by dopamine: a case report. J Perinatol. 2001;21:324–326.
- , , , , . Images in vascular medicine: rapid epinephrine 'reversal' with phentolamine following accidental autoinjector inoculation. Vasc Med. 2011;16:215–216.
- , . Extravasation of noncytotoxic drugs: a review of the literature. Ann Pharmacother. 2014 8;48:870–886.
- , . Reversal of dopamine extravasation injury with topical nitroglycerin ointment. Plast Reconstr Surg. 1989;84:811–813.
- , . Treatment of peripheral tissue ischemia with topical nitroglycerin ointment in neonates. J Pediatr. 1992;121:980–983.
- , , . Does central venous pressure predict fluid responsiveness? A systematic review of the literature and the tale of seven mares. Chest. 2008;134:172–178.
- , . Does the central venous pressure predict fluid responsiveness? An updated meta‐analysis and a plea for some common sense. Crit Care Med. 2013;41:1774–1781.
- ProCESS Investigators, , , , et al. A randomized trial of protocol‐based care for early septic shock. N Engl J Med. 2014;370:1683–1693.
Vasoactive medications (VMs) are often required to improve hemodynamic function in patients with shock. They are usually given through central venous catheter (CVC) access, primarily out of concern that extravasation of peripheral intravenous (PIV) access may result in local tissue injury due to the vasoconstrictive effect of the VM. However, insertion of CVC is associated with a variety of mechanical complications and risk of central lineassociated bacteremia. To examine the feasibility and safety of using VM via PIV access, we report on the administration of VM in the form of norepinephrine, dopamine, and phenylephrine via PIV access, with the rationale that this would be a method of reducing the need of CVC use. Our hypotheses are that VM via PIV access is both feasible and safe.
MATERIAL AND METHODS
Study Design
This was a single‐arm, consecutive‐patient study conducted from September 2012 to June 2014. The study site was an 18‐bed medical intensive care unit (MICU) staffed by full‐time attendings, fellows, and residents at the Long Island Jewish Medical Center, which is an 827‐bed tertiary care teaching hospital that is part of the North ShoreLong Island Jewish Health System. The primary outcome measure was the rate of local tissue injury resulting from use of VM via PIV access. The study was approved by the hospital institutional review board (study #13583A), which waived requirement for informed consent.
Protocol for Administration of VM via PIV Access
In cooperation with the Department of Pharmacy, medical and nursing staff developed a written protocol for administration of VM via PIV access. The protocol was reviewed and approved by the hospital pharmacy and therapeutics committee and the MICU nursing leadership. The MICU nursing staff received in‐service training before rollout of the protocol, which included training on the recognition of PIV access extravasation and the type of line that could be used. The MICU housestaff teams were given specific instructions concerning the protocol during their MICU rotations. A summary of the requirements for PIV access for VM use is summarized in Table 1.
|
| Vein diameter >4 mm measured with ultrasonography |
| Position of PIV access documented to be in the vein with ultrasonography before starting infusion of VM |
| Upper extremity only, contralateral to the blood pressure cuff |
| Intravenous line size 20 gauge or 18 gauge |
| No hand, wrist, or antecubital fossa PIV access position |
| Blood return from the PIV access prior to VM administration |
| Assessment of PIV access function every 2 hours as per nursing protocol |
| Immediate alert by nursing staff to the medical team if line extravasation, with prompt initiation of local treatment |
| 72 hours maximum duration of PIV access use |
Patient Management
The decision to initiate treatment with VM was made by the clinical management team. The standard concentrations of VM for use via PIV access were: norepinephrine 8 mg or 16 mg/250 mL normal saline, dopamine 400 mg or 800 mg/250 mL D5W, and phenylephrine 80 mg or 160 mg/500 mL normal saline. If the attending or fellow in charge of the case decided that VM should be administered through PIV access, peripheral access was established that conformed to the requirements of the protocol, and VM was administered via PIV access for as long as there was clinical indication or until PIV access suitable for VM administration was no longer feasible. If the patient received VM via PIV access, a second PIV access site was established in case of failure of the primary PIV site. If no PIV access could be inserted, the patient received CVC access. The decision to use VM via CVC access was made by the clinical management team, as was the type, dose, and duration of the VM use via PIV access or CVC access. Vasopressin was not used via PIV access. Dobutamine was used via PIV access but not recorded in our results, as it has no ‐mediated vasoconstrictor effect. Dobutamine was not used concomitantly with other vasoactive medication through the same PIV access. If PIV access was not established using standard technique by nursing staff, medical residents or critical care fellows inserted PIV access using real‐time ultrasound guidance. The PIV access use for VM could also be used for other medications providing they were compatible with the VM. Only 1 type of VM was infused through the PIV access.
As indicated in Table 1, the nursing staff examined the PIV access site every 2 hours and checked that blood could be aspirated from the line. The aspiration of the line requires several seconds of discontinuation of VM use, which we considered to have no clinical relevance. If the nursing staff identified extravasation of the PIV access site through which VM was infusing, they notified the medical housestaff, who promptly initiated treatment with local injection of phentolamine and local application of nitroglycerin paste as described in Table 2. The extravasation site was examined for tissue injury on a shift basis by the nursing staff, and on bedside rounds by the attending and fellow for at least 48 hours following PIV access removal. Tissue injury was defined as any erythema, blistering, skin breakdown, or necrosis in the site of extravasation.
|
| 1. The VM via PIV infusion is stopped immediately. |
| 2. Residual medication is aspirated through the PIV access, and the catheter is removed. |
| 3. The extent of the extravasation is outlined to provide a baseline for monitoring. |
| 4. Two vials, each containing 5 mg of phentolamine, are reconstituted with 5 mL of normal saline per vial to yield a final concentration of 1 mg/mL. |
| 5. The phentolamine solution is injected in 0.5‐ to 1‐mL aliquots in 5 separate injections around the leading edge of the extravasation, using separate 25‐gauge or 27‐gauge needles for each injection. |
| 6. Nitroglycerin paste (2.5 cm) is applied to the area of extravasation. |
| 7. A medication occurrence report is filled out for review by the quality committee. |
Data were collected prospectively by an investigator (J.C.‐G.) and entered into a standard data‐collection sheet for quality and safety assessment for the initial 13 months of the study. In the subsequent 7 months of observation, data were collected from retrospective chart review. The initial 13 months of data collection were performed as an ongoing safety analysis project; the subsequent 7‐month review was performed as an additional quality assessment project. The deidentified data included patient demographics, patient disease characteristics, use of VM, and VM via PIV access complications.
Statistical Analysis
The statistical analysis was performed using SPSS 21 (Statistical Package for the Social Sciences; IBM, Armonk, NY). Continuous variables are presented as meanstandard deviation.
RESULTS
Characteristics of patients who received VM via PIV access are presented in Table 3. During the study period, there were 2462 admissions to the MICU, and 267 CVCs were inserted by the MICU team, 170 of which were triple‐lumen catheters and 97 were large‐gauge catheters for hemodialysis or plasmapheresis. Of the total admissions, 953 cases received VM; 783/953 (82%) received VM via PIV access, and 170/953 received VM via CVC access (18%). For VM use, an 18‐gauge PIV catheter was used in 192/783 (25%), a 20‐gauge catheter was used in 590/783 (75%), and a 22‐gauge catheter was used in 1/783 of interventions. Catheter length was 30 mm, 45 mm, or 48 mm depending on availability. The 22‐gauge catheter, which was a deviation from standard protocol, infiltrated shortly following insertion. We did not formally record the anatomic position of the PIV access in the standard data‐collection sheet; anecdotally, the majority of PIV accesses were placed in the upper arm basilic or cephalic vein. The duration of VM via PIV access was 4922 hours. Central intravenous access was required in 95/734 (13%) of patients who initially had VM via PIV access. These catheters are included in the 170 triple‐lumen CVCs that were inserted by the MICU team during the study period. The type and highest dose of VM administered via PIV access are presented in Table 4.
| Total Study Group | |
|---|---|
| |
| No. of patients | 734 |
| Age, y | 7215 |
| Gender | |
| Male | 398 (54%) |
| Female | 336 (46%) |
| SAPS II score | 7515 |
| Patients on mechanical ventilation | 235 (32%) |
| Patients on hemodialysis | 90 (12%) |
| MICU mortality | 177 (23%) |
| Use of VM via PIV access | 783 |
| Extravasations of VM via PIV access | 19 (2%) |
| Total MICU admissions during study period | 2,462 |
| |
| Norepinephrine | |
| Interventions | 506 |
| Dose, g/kg/min, meanSD | 0.700.23 |
| PIV access extravasations | 16 |
| Dopamine | |
| Interventions | 101 |
| Dose, g/kg/min, meanSD | 12.75.23 |
| PIV access extravasations | 3 |
| Phenylephrine | |
| Interventions | 176 |
| Dose, g/kg/min, meanSD | 3.251.69 |
| PIV access extravasations | 0 |
A total of 734 patients received VM via PIV access during the 20‐month study period; 49 of these patients required 2 or more PIV access insertions, as the initial and/or subsequent site timed out at 72 hours, resulting in a total of 783 separate interventions. Infiltration of the PIV access site occurred in 19/783 (2%) of interventions. All of them were identified by nursing staff with prompt response using local injection of phentolamine and application of nitroglycerin paste at the site of the extravasation. There was no tissue injury at the site of VM extravasation. Sixteen of the extravasations occurred with norepinephrine infusions and 3 with dopamine infusions. There were no infections of the PIV access sites used for VM. Use of phentolamine and nitroglycerin paste was not associated with hypotension, as defined as mean arterial pressure less than 65 mm Hg.
DISCUSSION
Our study demonstrates that administration of VM via PIV access is feasible, carries a low rate of complications, and offers an alternative to CVC access. There are several elements that may have allowed safe use of VM via PIV access. We developed a protocol that involved a multidisciplinary team. The hospital pharmacy performed an extensive literature search and formulated the initial protocol with the MICU attending staff. The protocol was then subjected to iterative process improvement by a hospital committee and nursing leadership in the MICU. Before program rollout, the MICU nursing staff were educated and trained to use the protocol. This was a key component of the program, as the nurses were responsible for many of the line insertions, line maintenance, and identification of infiltration. Although we did not perform any formal measurement of the impact of PIV access use on nursing workflow, we note that leadership and frontline nurses have been enthusiastic about the implementation of VM via PIV access. The MICU housestaff teams were given an in‐service instruction concerning the importance of prompt initiation of local treatment in case of infiltration of the PIV access site. Specific elements of the protocol that may have improved safety were the use of ultrasonography to insert difficult PIV access and confirmation of all PIV access insertions using ultrasonography by the MICU housestaff. The requirement for frequent checks of PIV access function, prompt recognition of infiltration, and specific antidote to extravasation were important elements of safety. The low rate of PIV access extravasation (2%) may be related to the use of ultrasonography to guide PIV access insertion in patients who had challenging anatomy (eg, obesity, edema, recreational drug use, history of multiple PIV insertions), and ultrasonography was used to check that the PIV access was well positioned before VM infusion.
There were early literature reports that subcutaneous extravasation of catecholamines could result in local ischemic injury both in human patients and animal models.[1, 2, 3, 4, 5] Local phentolamine injection has been identified as a specific antidote to block the local ischemic injury.[6, 7, 8, 9, 10, 11, 12, 13, 14, 15] More recently, there have been anecdotal reports showing that local application of nitroglycerin paste blocks ischemic injury in the pediatric population.[5, 16, 17] With this information, our protocol included the requirement of prompt treatment of local extravasation with phentolamine and nitroglycerin paste at the site of VM via PIV access extravasation. In theory, both phentolamine and nitroglycerin might cause hypotension. In our study, administration of both phentolamine and nitroglycerin paste was not associated with more hypotension nor did it increase requirements for VM.
Multilumen small bore CVCs may be used for several reasons, some of which need to be reconsidered. First, before introduction of the VM via PIV access protocol, a common indication for triple lumen CVC insertion in our MICU was the perception that VM could only be administered through CVC access, for fear of local tissue injury should extravasation of the VM occur through the PIV access site. Our results indicate that VM use is not an automatic indication for CVC insertion. Second, a possible indication for CVC insertion is to measure central venous pressure for the purpose of guiding volume resuscitation in patients with hemodynamic failure. As the utility of central venous pressure monitoring has been called into serious question,[18, 19, 20] we do not consider this indication for CVC use to be valid. Third, CVC access may be required due to anatomic constraints (ie, there is no suitable PIV site). Fourth, there may be need for such a large number of intravenous medications that PIV access cannot support. Fifth, there is occasional situation where the patient requires use of medications where extravasation of PIV access would cause local tissue injury without local antidote (eg, certain chemotherapeutic agents). The continued need for CVC access in some patients is reflected in the finding that 13% of our study patients who received VM via PIV access eventually required triple‐lumen CVC insertion. However, our results indicate that the rate of CVC use may be reduced by using PIV access for VM administration.
Our study has some methodological limitations. Study design was single center and observational. The focus of this study was to examine the safety of VM via PIV access. We cannot comment on its effectiveness, indications, or influence on patient outcome nor on why some patients required CVC insertion whereas others did not. The decision to administer VM was made by the clinical team, as was the route of its administration and concentration, without any input from the investigators. We did not collect data on who performed the PIV access insertion (medical or nursing staff), demographics, and disease characteristics of the CVC group, nor to what extent ultrasonography was used to guide PIV insertion. We did not attempt to define whether there were any factors that identified risk for PIV access extravasation, nor did we evaluate for any differences between the PIV and CVC group in terms of demographics and disease characteristics. Lacking a control group, we cannot say definitively that VM via PIV access is safer than VM via CVC. Being a single‐center study, it is not possible to say that the results are transferable to another clinical environment; this applies particularly to the use of ultrasonography, which is a user‐dependent skill. We cannot determine which, if any, component of the protocol was responsible for the safe use of VM via PIV access. The rate of PIV access extravasation was low, so it is possible that a larger sample size is required to identify incidents of tissue necrosis from extravasation of VM delivered via PIV access despite the use of local antidote.
CONCLUSIONS
The delivery of VM via PIV access is safe and feasible. Tto reduce the risk of extravasation leading to possible local tissue injury, we developed a protocol that emphasized close cooperation between the nursing and medical staff, routine use of ultrasonography, rapid identification of extravasation of the PIV access, and prompt response to local extravasation of VM using phentolamine and nitroglycerin paste. This approach offers a means of reducing CVC use, in both intensive care unit (ICU) and non‐ICU settings, including hospital wards and emergency departments. Clinicians should no longer consider administration of norepinephrine, dopamine, or phenylephrine to be an automatic indication for CVC access. This study focused on the safety of VM administered via PIV access, with emphasis on local complications related to extravasation, and should be considered a preliminary single‐center study that demonstrates that administration of certain vasoactive medications may not universally require central venous access. A broader study regarding assessment of safety and efficacy will require a multicenter design.
Disclosures
J.C.‐G., K.F.S., Y.G.B., M.N., S.J.K., and P.H.M. participated in the study design, statistical review, and manuscript writing. J.C.‐G. is the guarantor of the article, taking responsibility for the integrity of the work as a whole from inception to published article. This work is original, and all authors meet the criteria for authorship, including acceptance of responsibility for the scientific content of the article. This article is not under consideration in any other journal, and all of the authors have read and approved the content of the article. No potential conflict of interest exists with any companies or organizations whose products or services are discussed in this article. This article has not been funded by the National Institutes of Health, the Wellcome Trust, or their agencies. All financial support of the study was derived from the Division of Pulmonary, Critical Care and Sleep Medicine at North ShoreLong Island Jewish Medical Center, New Hyde Park, New York.
Vasoactive medications (VMs) are often required to improve hemodynamic function in patients with shock. They are usually given through central venous catheter (CVC) access, primarily out of concern that extravasation of peripheral intravenous (PIV) access may result in local tissue injury due to the vasoconstrictive effect of the VM. However, insertion of CVC is associated with a variety of mechanical complications and risk of central lineassociated bacteremia. To examine the feasibility and safety of using VM via PIV access, we report on the administration of VM in the form of norepinephrine, dopamine, and phenylephrine via PIV access, with the rationale that this would be a method of reducing the need of CVC use. Our hypotheses are that VM via PIV access is both feasible and safe.
MATERIAL AND METHODS
Study Design
This was a single‐arm, consecutive‐patient study conducted from September 2012 to June 2014. The study site was an 18‐bed medical intensive care unit (MICU) staffed by full‐time attendings, fellows, and residents at the Long Island Jewish Medical Center, which is an 827‐bed tertiary care teaching hospital that is part of the North ShoreLong Island Jewish Health System. The primary outcome measure was the rate of local tissue injury resulting from use of VM via PIV access. The study was approved by the hospital institutional review board (study #13583A), which waived requirement for informed consent.
Protocol for Administration of VM via PIV Access
In cooperation with the Department of Pharmacy, medical and nursing staff developed a written protocol for administration of VM via PIV access. The protocol was reviewed and approved by the hospital pharmacy and therapeutics committee and the MICU nursing leadership. The MICU nursing staff received in‐service training before rollout of the protocol, which included training on the recognition of PIV access extravasation and the type of line that could be used. The MICU housestaff teams were given specific instructions concerning the protocol during their MICU rotations. A summary of the requirements for PIV access for VM use is summarized in Table 1.
|
| Vein diameter >4 mm measured with ultrasonography |
| Position of PIV access documented to be in the vein with ultrasonography before starting infusion of VM |
| Upper extremity only, contralateral to the blood pressure cuff |
| Intravenous line size 20 gauge or 18 gauge |
| No hand, wrist, or antecubital fossa PIV access position |
| Blood return from the PIV access prior to VM administration |
| Assessment of PIV access function every 2 hours as per nursing protocol |
| Immediate alert by nursing staff to the medical team if line extravasation, with prompt initiation of local treatment |
| 72 hours maximum duration of PIV access use |
Patient Management
The decision to initiate treatment with VM was made by the clinical management team. The standard concentrations of VM for use via PIV access were: norepinephrine 8 mg or 16 mg/250 mL normal saline, dopamine 400 mg or 800 mg/250 mL D5W, and phenylephrine 80 mg or 160 mg/500 mL normal saline. If the attending or fellow in charge of the case decided that VM should be administered through PIV access, peripheral access was established that conformed to the requirements of the protocol, and VM was administered via PIV access for as long as there was clinical indication or until PIV access suitable for VM administration was no longer feasible. If the patient received VM via PIV access, a second PIV access site was established in case of failure of the primary PIV site. If no PIV access could be inserted, the patient received CVC access. The decision to use VM via CVC access was made by the clinical management team, as was the type, dose, and duration of the VM use via PIV access or CVC access. Vasopressin was not used via PIV access. Dobutamine was used via PIV access but not recorded in our results, as it has no ‐mediated vasoconstrictor effect. Dobutamine was not used concomitantly with other vasoactive medication through the same PIV access. If PIV access was not established using standard technique by nursing staff, medical residents or critical care fellows inserted PIV access using real‐time ultrasound guidance. The PIV access use for VM could also be used for other medications providing they were compatible with the VM. Only 1 type of VM was infused through the PIV access.
As indicated in Table 1, the nursing staff examined the PIV access site every 2 hours and checked that blood could be aspirated from the line. The aspiration of the line requires several seconds of discontinuation of VM use, which we considered to have no clinical relevance. If the nursing staff identified extravasation of the PIV access site through which VM was infusing, they notified the medical housestaff, who promptly initiated treatment with local injection of phentolamine and local application of nitroglycerin paste as described in Table 2. The extravasation site was examined for tissue injury on a shift basis by the nursing staff, and on bedside rounds by the attending and fellow for at least 48 hours following PIV access removal. Tissue injury was defined as any erythema, blistering, skin breakdown, or necrosis in the site of extravasation.
|
| 1. The VM via PIV infusion is stopped immediately. |
| 2. Residual medication is aspirated through the PIV access, and the catheter is removed. |
| 3. The extent of the extravasation is outlined to provide a baseline for monitoring. |
| 4. Two vials, each containing 5 mg of phentolamine, are reconstituted with 5 mL of normal saline per vial to yield a final concentration of 1 mg/mL. |
| 5. The phentolamine solution is injected in 0.5‐ to 1‐mL aliquots in 5 separate injections around the leading edge of the extravasation, using separate 25‐gauge or 27‐gauge needles for each injection. |
| 6. Nitroglycerin paste (2.5 cm) is applied to the area of extravasation. |
| 7. A medication occurrence report is filled out for review by the quality committee. |
Data were collected prospectively by an investigator (J.C.‐G.) and entered into a standard data‐collection sheet for quality and safety assessment for the initial 13 months of the study. In the subsequent 7 months of observation, data were collected from retrospective chart review. The initial 13 months of data collection were performed as an ongoing safety analysis project; the subsequent 7‐month review was performed as an additional quality assessment project. The deidentified data included patient demographics, patient disease characteristics, use of VM, and VM via PIV access complications.
Statistical Analysis
The statistical analysis was performed using SPSS 21 (Statistical Package for the Social Sciences; IBM, Armonk, NY). Continuous variables are presented as meanstandard deviation.
RESULTS
Characteristics of patients who received VM via PIV access are presented in Table 3. During the study period, there were 2462 admissions to the MICU, and 267 CVCs were inserted by the MICU team, 170 of which were triple‐lumen catheters and 97 were large‐gauge catheters for hemodialysis or plasmapheresis. Of the total admissions, 953 cases received VM; 783/953 (82%) received VM via PIV access, and 170/953 received VM via CVC access (18%). For VM use, an 18‐gauge PIV catheter was used in 192/783 (25%), a 20‐gauge catheter was used in 590/783 (75%), and a 22‐gauge catheter was used in 1/783 of interventions. Catheter length was 30 mm, 45 mm, or 48 mm depending on availability. The 22‐gauge catheter, which was a deviation from standard protocol, infiltrated shortly following insertion. We did not formally record the anatomic position of the PIV access in the standard data‐collection sheet; anecdotally, the majority of PIV accesses were placed in the upper arm basilic or cephalic vein. The duration of VM via PIV access was 4922 hours. Central intravenous access was required in 95/734 (13%) of patients who initially had VM via PIV access. These catheters are included in the 170 triple‐lumen CVCs that were inserted by the MICU team during the study period. The type and highest dose of VM administered via PIV access are presented in Table 4.
| Total Study Group | |
|---|---|
| |
| No. of patients | 734 |
| Age, y | 7215 |
| Gender | |
| Male | 398 (54%) |
| Female | 336 (46%) |
| SAPS II score | 7515 |
| Patients on mechanical ventilation | 235 (32%) |
| Patients on hemodialysis | 90 (12%) |
| MICU mortality | 177 (23%) |
| Use of VM via PIV access | 783 |
| Extravasations of VM via PIV access | 19 (2%) |
| Total MICU admissions during study period | 2,462 |
| |
| Norepinephrine | |
| Interventions | 506 |
| Dose, g/kg/min, meanSD | 0.700.23 |
| PIV access extravasations | 16 |
| Dopamine | |
| Interventions | 101 |
| Dose, g/kg/min, meanSD | 12.75.23 |
| PIV access extravasations | 3 |
| Phenylephrine | |
| Interventions | 176 |
| Dose, g/kg/min, meanSD | 3.251.69 |
| PIV access extravasations | 0 |
A total of 734 patients received VM via PIV access during the 20‐month study period; 49 of these patients required 2 or more PIV access insertions, as the initial and/or subsequent site timed out at 72 hours, resulting in a total of 783 separate interventions. Infiltration of the PIV access site occurred in 19/783 (2%) of interventions. All of them were identified by nursing staff with prompt response using local injection of phentolamine and application of nitroglycerin paste at the site of the extravasation. There was no tissue injury at the site of VM extravasation. Sixteen of the extravasations occurred with norepinephrine infusions and 3 with dopamine infusions. There were no infections of the PIV access sites used for VM. Use of phentolamine and nitroglycerin paste was not associated with hypotension, as defined as mean arterial pressure less than 65 mm Hg.
DISCUSSION
Our study demonstrates that administration of VM via PIV access is feasible, carries a low rate of complications, and offers an alternative to CVC access. There are several elements that may have allowed safe use of VM via PIV access. We developed a protocol that involved a multidisciplinary team. The hospital pharmacy performed an extensive literature search and formulated the initial protocol with the MICU attending staff. The protocol was then subjected to iterative process improvement by a hospital committee and nursing leadership in the MICU. Before program rollout, the MICU nursing staff were educated and trained to use the protocol. This was a key component of the program, as the nurses were responsible for many of the line insertions, line maintenance, and identification of infiltration. Although we did not perform any formal measurement of the impact of PIV access use on nursing workflow, we note that leadership and frontline nurses have been enthusiastic about the implementation of VM via PIV access. The MICU housestaff teams were given an in‐service instruction concerning the importance of prompt initiation of local treatment in case of infiltration of the PIV access site. Specific elements of the protocol that may have improved safety were the use of ultrasonography to insert difficult PIV access and confirmation of all PIV access insertions using ultrasonography by the MICU housestaff. The requirement for frequent checks of PIV access function, prompt recognition of infiltration, and specific antidote to extravasation were important elements of safety. The low rate of PIV access extravasation (2%) may be related to the use of ultrasonography to guide PIV access insertion in patients who had challenging anatomy (eg, obesity, edema, recreational drug use, history of multiple PIV insertions), and ultrasonography was used to check that the PIV access was well positioned before VM infusion.
There were early literature reports that subcutaneous extravasation of catecholamines could result in local ischemic injury both in human patients and animal models.[1, 2, 3, 4, 5] Local phentolamine injection has been identified as a specific antidote to block the local ischemic injury.[6, 7, 8, 9, 10, 11, 12, 13, 14, 15] More recently, there have been anecdotal reports showing that local application of nitroglycerin paste blocks ischemic injury in the pediatric population.[5, 16, 17] With this information, our protocol included the requirement of prompt treatment of local extravasation with phentolamine and nitroglycerin paste at the site of VM via PIV access extravasation. In theory, both phentolamine and nitroglycerin might cause hypotension. In our study, administration of both phentolamine and nitroglycerin paste was not associated with more hypotension nor did it increase requirements for VM.
Multilumen small bore CVCs may be used for several reasons, some of which need to be reconsidered. First, before introduction of the VM via PIV access protocol, a common indication for triple lumen CVC insertion in our MICU was the perception that VM could only be administered through CVC access, for fear of local tissue injury should extravasation of the VM occur through the PIV access site. Our results indicate that VM use is not an automatic indication for CVC insertion. Second, a possible indication for CVC insertion is to measure central venous pressure for the purpose of guiding volume resuscitation in patients with hemodynamic failure. As the utility of central venous pressure monitoring has been called into serious question,[18, 19, 20] we do not consider this indication for CVC use to be valid. Third, CVC access may be required due to anatomic constraints (ie, there is no suitable PIV site). Fourth, there may be need for such a large number of intravenous medications that PIV access cannot support. Fifth, there is occasional situation where the patient requires use of medications where extravasation of PIV access would cause local tissue injury without local antidote (eg, certain chemotherapeutic agents). The continued need for CVC access in some patients is reflected in the finding that 13% of our study patients who received VM via PIV access eventually required triple‐lumen CVC insertion. However, our results indicate that the rate of CVC use may be reduced by using PIV access for VM administration.
Our study has some methodological limitations. Study design was single center and observational. The focus of this study was to examine the safety of VM via PIV access. We cannot comment on its effectiveness, indications, or influence on patient outcome nor on why some patients required CVC insertion whereas others did not. The decision to administer VM was made by the clinical team, as was the route of its administration and concentration, without any input from the investigators. We did not collect data on who performed the PIV access insertion (medical or nursing staff), demographics, and disease characteristics of the CVC group, nor to what extent ultrasonography was used to guide PIV insertion. We did not attempt to define whether there were any factors that identified risk for PIV access extravasation, nor did we evaluate for any differences between the PIV and CVC group in terms of demographics and disease characteristics. Lacking a control group, we cannot say definitively that VM via PIV access is safer than VM via CVC. Being a single‐center study, it is not possible to say that the results are transferable to another clinical environment; this applies particularly to the use of ultrasonography, which is a user‐dependent skill. We cannot determine which, if any, component of the protocol was responsible for the safe use of VM via PIV access. The rate of PIV access extravasation was low, so it is possible that a larger sample size is required to identify incidents of tissue necrosis from extravasation of VM delivered via PIV access despite the use of local antidote.
CONCLUSIONS
The delivery of VM via PIV access is safe and feasible. Tto reduce the risk of extravasation leading to possible local tissue injury, we developed a protocol that emphasized close cooperation between the nursing and medical staff, routine use of ultrasonography, rapid identification of extravasation of the PIV access, and prompt response to local extravasation of VM using phentolamine and nitroglycerin paste. This approach offers a means of reducing CVC use, in both intensive care unit (ICU) and non‐ICU settings, including hospital wards and emergency departments. Clinicians should no longer consider administration of norepinephrine, dopamine, or phenylephrine to be an automatic indication for CVC access. This study focused on the safety of VM administered via PIV access, with emphasis on local complications related to extravasation, and should be considered a preliminary single‐center study that demonstrates that administration of certain vasoactive medications may not universally require central venous access. A broader study regarding assessment of safety and efficacy will require a multicenter design.
Disclosures
J.C.‐G., K.F.S., Y.G.B., M.N., S.J.K., and P.H.M. participated in the study design, statistical review, and manuscript writing. J.C.‐G. is the guarantor of the article, taking responsibility for the integrity of the work as a whole from inception to published article. This work is original, and all authors meet the criteria for authorship, including acceptance of responsibility for the scientific content of the article. This article is not under consideration in any other journal, and all of the authors have read and approved the content of the article. No potential conflict of interest exists with any companies or organizations whose products or services are discussed in this article. This article has not been funded by the National Institutes of Health, the Wellcome Trust, or their agencies. All financial support of the study was derived from the Division of Pulmonary, Critical Care and Sleep Medicine at North ShoreLong Island Jewish Medical Center, New Hyde Park, New York.
- , , . Cutaneous necrosis due to norepinephrine. II. Mechanism and prevention. Ann Surg. 1958;147:44–50.
- , , . Pedal gangrene associated with the use of dopamine. N Engl J Med. 1975;293:591.
- , . Gangrene aggravation after use of dopamine [letter]. JAMA. 1976;235:2812.
- , . Dopamine gangrene [letter]. N Engl J Med. 1976;294:114.
- , . Extravasation injury associated with low‐dose dopamine. Ann Pharmacother. 1998;32:545–548.
- . Use of phenytolamine to prevent necrosis due to levarterenol. JAMA. 1957;163:1477–1479.
- . Phentolamine hydrochloride in prevention of cutaneous necrosis due to levarterenol. JAMA. 1959;170:1916–1917.
- , . Avoidance of vascular complications associated with the use of dopamine. Can Anaesth Soc J. 1977;24:727–733.
- . Management of intravenous extravasations. Infusion. 1984;6:77–79.
- , . Acute management of dopamine infiltration injury with Regitine. Plast Reconstr Surg. 1987;80:610–612.
- . High dose phentolamine for extravasation of pressors [letter]. Clin Pharm. 1989;8:689.
- , . Phentolamine reversal of epinephrine‐induced digital vasospasm. How to save an ischemic finger. Arch Fam Med. 1994;3:193–195.
- , , . Phentolamine use in a neonate for the prevention of dermal necrosis caused by dopamine: a case report. J Perinatol. 2001;21:324–326.
- , , , , . Images in vascular medicine: rapid epinephrine 'reversal' with phentolamine following accidental autoinjector inoculation. Vasc Med. 2011;16:215–216.
- , . Extravasation of noncytotoxic drugs: a review of the literature. Ann Pharmacother. 2014 8;48:870–886.
- , . Reversal of dopamine extravasation injury with topical nitroglycerin ointment. Plast Reconstr Surg. 1989;84:811–813.
- , . Treatment of peripheral tissue ischemia with topical nitroglycerin ointment in neonates. J Pediatr. 1992;121:980–983.
- , , . Does central venous pressure predict fluid responsiveness? A systematic review of the literature and the tale of seven mares. Chest. 2008;134:172–178.
- , . Does the central venous pressure predict fluid responsiveness? An updated meta‐analysis and a plea for some common sense. Crit Care Med. 2013;41:1774–1781.
- ProCESS Investigators, , , , et al. A randomized trial of protocol‐based care for early septic shock. N Engl J Med. 2014;370:1683–1693.
- , , . Cutaneous necrosis due to norepinephrine. II. Mechanism and prevention. Ann Surg. 1958;147:44–50.
- , , . Pedal gangrene associated with the use of dopamine. N Engl J Med. 1975;293:591.
- , . Gangrene aggravation after use of dopamine [letter]. JAMA. 1976;235:2812.
- , . Dopamine gangrene [letter]. N Engl J Med. 1976;294:114.
- , . Extravasation injury associated with low‐dose dopamine. Ann Pharmacother. 1998;32:545–548.
- . Use of phenytolamine to prevent necrosis due to levarterenol. JAMA. 1957;163:1477–1479.
- . Phentolamine hydrochloride in prevention of cutaneous necrosis due to levarterenol. JAMA. 1959;170:1916–1917.
- , . Avoidance of vascular complications associated with the use of dopamine. Can Anaesth Soc J. 1977;24:727–733.
- . Management of intravenous extravasations. Infusion. 1984;6:77–79.
- , . Acute management of dopamine infiltration injury with Regitine. Plast Reconstr Surg. 1987;80:610–612.
- . High dose phentolamine for extravasation of pressors [letter]. Clin Pharm. 1989;8:689.
- , . Phentolamine reversal of epinephrine‐induced digital vasospasm. How to save an ischemic finger. Arch Fam Med. 1994;3:193–195.
- , , . Phentolamine use in a neonate for the prevention of dermal necrosis caused by dopamine: a case report. J Perinatol. 2001;21:324–326.
- , , , , . Images in vascular medicine: rapid epinephrine 'reversal' with phentolamine following accidental autoinjector inoculation. Vasc Med. 2011;16:215–216.
- , . Extravasation of noncytotoxic drugs: a review of the literature. Ann Pharmacother. 2014 8;48:870–886.
- , . Reversal of dopamine extravasation injury with topical nitroglycerin ointment. Plast Reconstr Surg. 1989;84:811–813.
- , . Treatment of peripheral tissue ischemia with topical nitroglycerin ointment in neonates. J Pediatr. 1992;121:980–983.
- , , . Does central venous pressure predict fluid responsiveness? A systematic review of the literature and the tale of seven mares. Chest. 2008;134:172–178.
- , . Does the central venous pressure predict fluid responsiveness? An updated meta‐analysis and a plea for some common sense. Crit Care Med. 2013;41:1774–1781.
- ProCESS Investigators, , , , et al. A randomized trial of protocol‐based care for early septic shock. N Engl J Med. 2014;370:1683–1693.
© 2015 Society of Hospital Medicine