User login
Exercise-induced anaphylaxis
Anaphylaxis is a relatively common occurrence for many adolescents. As primary care doctors, we normally see the patient after the acute phase, and then are required to do the detective work to figure out the causes of the episode. The cause may be obvious, but many times we have to hope for another occurrence with similar circumstances to identify it. Surprisingly, the cause may not be what you think. Factors that contribute to an anaphylaxis response may be related to activity, timing of food ingestion, an environmental factor, or medication.
Let’s look at just one type, exercise-induced anaphylaxis. It’s divided into two categories: food dependent and nonfood dependent. Both are described as an induction of itching, urticaria, and fatigue, with progression to angioedema and hypotension, associated with exercise (J. Allergy Clin. Immunol. 1980;66:106-11).
Food-dependent exercise-induced anaphylaxis occurs when exercise is started 30 minutes after ingesting food. This may be difficult to identify because patients react to the food only if they exercise, so food is usually eliminated as a cause. Wheat and wheat flour are common culprits for this type of reaction because of the omega-5 gliadin, which is the protein in gluten (J. Allergy Clin. Immunol. 1991;87:34-40). In one study, larger amounts of the suspected agent were given; hives and angioedema did start to occur in 20% of patients challenged, which suggested that there was likely a baseline allergy to the food, and exercise itself might be a cofactor in augmentation of the allergic reaction.
In nonfood-dependent exercise-induced anaphylaxis, symptoms of itching, urticaria, and fatigue can occur 5-30 minutes after the start of exercise. Although bronchospasm is rare, it can occur along with angioedema, nausea, vomiting, and hypotension, and can even be fatal if exercise continues. If exercise is stopped, it usually resolves. However, many people try to push through it, which only worsens the symptoms.
Cofactors associated with nonfood-dependent exercise-induced anaphylaxis are ingestion of alcohol and an NSAID several hours beforehand. These agents also might be overlooked if well tolerated independently (Br. J. Dermatol. 2001;145:336-9).
Timing of the episode also plays a role. Premenstrual syndrome can be a factor in augmentation of anaphylaxis, so it also should be considered. Knowing the date of the last menstrual cycle and identifying if the anaphylaxis is episodic will identify premenstrual syndrome as a cause.
The work-up should include standard allergy testing and determination of tryptase levels. Skin testing is essential to identify offending agents, and is rarely negative. If a food is suspected and skin testing is negative, repeat the skin testing in 6 months. In one study, wheat extract was found to be positive in only 29% of persons suspected of having a wheat allergy, but when the paste of wheat flour was tested, 80% were identified. The ImmunoCAP Test also was found to have a sensitivity of 80%, so it is a valuable test to try along with the skin prick.
Tryptase levels should be evaluated because in nonfood-dependent exercise-induced anaphylaxis, these levels are slightly elevated at the time of the anaphylaxis, but return to normal. A patient with mastocytosis, a group of disorders characterized by pathologic mast cells infiltrating the skin, will consistently have elevated tryptase levels. Seasonal allergies associated with pollen, and asthma bronchospasm also should be considered as causes.
Although these exercise-induced anaphylaxis episodes can occur at any age, they are most frequent in the adolescent age group, probably because that’s the time most of this population are involved in organized sports. Upon presentation, a careful detailed history will help to identify the cause of anaphylaxis and result in quicker resolution.
Treatment includes avoidance of the offending agent if identified and an antihistamine, and if symptoms do occur, ceasing exercise immediately to avoid a full-blown anaphylactic reaction.
Dr. Pearce is a pediatrician in Frankfort, Ill. E-mail her at [email protected].
Anaphylaxis is a relatively common occurrence for many adolescents. As primary care doctors, we normally see the patient after the acute phase, and then are required to do the detective work to figure out the causes of the episode. The cause may be obvious, but many times we have to hope for another occurrence with similar circumstances to identify it. Surprisingly, the cause may not be what you think. Factors that contribute to an anaphylaxis response may be related to activity, timing of food ingestion, an environmental factor, or medication.
Let’s look at just one type, exercise-induced anaphylaxis. It’s divided into two categories: food dependent and nonfood dependent. Both are described as an induction of itching, urticaria, and fatigue, with progression to angioedema and hypotension, associated with exercise (J. Allergy Clin. Immunol. 1980;66:106-11).
Food-dependent exercise-induced anaphylaxis occurs when exercise is started 30 minutes after ingesting food. This may be difficult to identify because patients react to the food only if they exercise, so food is usually eliminated as a cause. Wheat and wheat flour are common culprits for this type of reaction because of the omega-5 gliadin, which is the protein in gluten (J. Allergy Clin. Immunol. 1991;87:34-40). In one study, larger amounts of the suspected agent were given; hives and angioedema did start to occur in 20% of patients challenged, which suggested that there was likely a baseline allergy to the food, and exercise itself might be a cofactor in augmentation of the allergic reaction.
In nonfood-dependent exercise-induced anaphylaxis, symptoms of itching, urticaria, and fatigue can occur 5-30 minutes after the start of exercise. Although bronchospasm is rare, it can occur along with angioedema, nausea, vomiting, and hypotension, and can even be fatal if exercise continues. If exercise is stopped, it usually resolves. However, many people try to push through it, which only worsens the symptoms.
Cofactors associated with nonfood-dependent exercise-induced anaphylaxis are ingestion of alcohol and an NSAID several hours beforehand. These agents also might be overlooked if well tolerated independently (Br. J. Dermatol. 2001;145:336-9).
Timing of the episode also plays a role. Premenstrual syndrome can be a factor in augmentation of anaphylaxis, so it also should be considered. Knowing the date of the last menstrual cycle and identifying if the anaphylaxis is episodic will identify premenstrual syndrome as a cause.
The work-up should include standard allergy testing and determination of tryptase levels. Skin testing is essential to identify offending agents, and is rarely negative. If a food is suspected and skin testing is negative, repeat the skin testing in 6 months. In one study, wheat extract was found to be positive in only 29% of persons suspected of having a wheat allergy, but when the paste of wheat flour was tested, 80% were identified. The ImmunoCAP Test also was found to have a sensitivity of 80%, so it is a valuable test to try along with the skin prick.
Tryptase levels should be evaluated because in nonfood-dependent exercise-induced anaphylaxis, these levels are slightly elevated at the time of the anaphylaxis, but return to normal. A patient with mastocytosis, a group of disorders characterized by pathologic mast cells infiltrating the skin, will consistently have elevated tryptase levels. Seasonal allergies associated with pollen, and asthma bronchospasm also should be considered as causes.
Although these exercise-induced anaphylaxis episodes can occur at any age, they are most frequent in the adolescent age group, probably because that’s the time most of this population are involved in organized sports. Upon presentation, a careful detailed history will help to identify the cause of anaphylaxis and result in quicker resolution.
Treatment includes avoidance of the offending agent if identified and an antihistamine, and if symptoms do occur, ceasing exercise immediately to avoid a full-blown anaphylactic reaction.
Dr. Pearce is a pediatrician in Frankfort, Ill. E-mail her at [email protected].
Anaphylaxis is a relatively common occurrence for many adolescents. As primary care doctors, we normally see the patient after the acute phase, and then are required to do the detective work to figure out the causes of the episode. The cause may be obvious, but many times we have to hope for another occurrence with similar circumstances to identify it. Surprisingly, the cause may not be what you think. Factors that contribute to an anaphylaxis response may be related to activity, timing of food ingestion, an environmental factor, or medication.
Let’s look at just one type, exercise-induced anaphylaxis. It’s divided into two categories: food dependent and nonfood dependent. Both are described as an induction of itching, urticaria, and fatigue, with progression to angioedema and hypotension, associated with exercise (J. Allergy Clin. Immunol. 1980;66:106-11).
Food-dependent exercise-induced anaphylaxis occurs when exercise is started 30 minutes after ingesting food. This may be difficult to identify because patients react to the food only if they exercise, so food is usually eliminated as a cause. Wheat and wheat flour are common culprits for this type of reaction because of the omega-5 gliadin, which is the protein in gluten (J. Allergy Clin. Immunol. 1991;87:34-40). In one study, larger amounts of the suspected agent were given; hives and angioedema did start to occur in 20% of patients challenged, which suggested that there was likely a baseline allergy to the food, and exercise itself might be a cofactor in augmentation of the allergic reaction.
In nonfood-dependent exercise-induced anaphylaxis, symptoms of itching, urticaria, and fatigue can occur 5-30 minutes after the start of exercise. Although bronchospasm is rare, it can occur along with angioedema, nausea, vomiting, and hypotension, and can even be fatal if exercise continues. If exercise is stopped, it usually resolves. However, many people try to push through it, which only worsens the symptoms.
Cofactors associated with nonfood-dependent exercise-induced anaphylaxis are ingestion of alcohol and an NSAID several hours beforehand. These agents also might be overlooked if well tolerated independently (Br. J. Dermatol. 2001;145:336-9).
Timing of the episode also plays a role. Premenstrual syndrome can be a factor in augmentation of anaphylaxis, so it also should be considered. Knowing the date of the last menstrual cycle and identifying if the anaphylaxis is episodic will identify premenstrual syndrome as a cause.
The work-up should include standard allergy testing and determination of tryptase levels. Skin testing is essential to identify offending agents, and is rarely negative. If a food is suspected and skin testing is negative, repeat the skin testing in 6 months. In one study, wheat extract was found to be positive in only 29% of persons suspected of having a wheat allergy, but when the paste of wheat flour was tested, 80% were identified. The ImmunoCAP Test also was found to have a sensitivity of 80%, so it is a valuable test to try along with the skin prick.
Tryptase levels should be evaluated because in nonfood-dependent exercise-induced anaphylaxis, these levels are slightly elevated at the time of the anaphylaxis, but return to normal. A patient with mastocytosis, a group of disorders characterized by pathologic mast cells infiltrating the skin, will consistently have elevated tryptase levels. Seasonal allergies associated with pollen, and asthma bronchospasm also should be considered as causes.
Although these exercise-induced anaphylaxis episodes can occur at any age, they are most frequent in the adolescent age group, probably because that’s the time most of this population are involved in organized sports. Upon presentation, a careful detailed history will help to identify the cause of anaphylaxis and result in quicker resolution.
Treatment includes avoidance of the offending agent if identified and an antihistamine, and if symptoms do occur, ceasing exercise immediately to avoid a full-blown anaphylactic reaction.
Dr. Pearce is a pediatrician in Frankfort, Ill. E-mail her at [email protected].

Fatigue after depression responds to therapy. What are the next steps?
Fatigue and depression can be viewed as a “vicious cycle”: Fatigue can be a symptom of major depression, and fatigue can be a risk factor for depression.1 For example, fatigue associated with a general medical condition or traumatic brain injury can be a risk factor for developing major depressive disorder (MDD).1-3 It isn’t surprising that fatigue has been studied as a predictor of relapse after previous response to treatment in patients with MDD.
Despite the observed association between fatigue and depression, their underlying relationship often is unclear. The literature does not differentiate among fatigue associated with depression, fatigue as a treatment-emergent adverse effect, and fatigue as a residual symptom of depression that is partially responsive to treatment.4,5 To complicate the situation, many medications used to treat MDD can cause fatigue.
Patients often describe fatigue as (1) feeling tired, exhausted, or drained and (2) lacking energy and motivation. Fatigue can be related to impaired wakefulness but is believed to be a different entity than sleepiness.6 Residual fatigue can affect social, cognitive, emotional, and physical health.
We reviewed the literature about fatigue as a symptom of MDD by conducting a search of Medline, PubMed, and Google Scholar, using keywords depression, fatigue, residual symptoms, and treatment. We chose the papers cited in this article based on our consensus and because these publications represent expert opinion or the highest quality evidence available.
Residual fatigue has an effect on prognosis
Fatigue is a common symptom of MDD that persists in 20% to 30% of patients whose symptoms of depression otherwise remit.4,7-9 Several studies have linked residual fatigue with the overall prognosis of MDD.5 Data from a prospective study demonstrate that depressed patients have a higher risk of relapse when they continue to report symptoms of fatigue after their symptoms of depression have otherwise entered partial remission.10 Another study demonstrated that the severity of residual symptoms of depression is a strong predictor of another major depressive episode.11
In a large-scale study, the prevalence of residual fatigue after adequate treatment of MDD in both partial responders and remitters was 84.6%.12 The same study showed that one-third of patients who had been treated for MDD had persistent and clinically significant fatigue, which could suggest a relationship between fatigue and selective serotonin reuptake inhibitors (SSRIs) and other antidepressants.
Another study demonstrated that 64.6% of patients who responded to antidepressant treatment and who had baseline fatigue continued to exhibit symptoms of fatigue after an adequate trial of an antidepressant.13
Neurobiological considerations
Studies have shown that the neuronal circuits that malfunction in fatigue are different from those that malfunction in depression.14 Although the neurobiology of fatigue has not been determined, decreased neuronal activity in the prefrontal circuits has been associated with symptoms of fatigue.15
In addition, evidence from the literature shows a decrease in hormone secretion16 and cognitive abilities in patients exhibiting symptoms of fatigue.17 These findings have led some experts to hypothesize that symptoms of fatigue associated with depression could be the result of (1) immune dysregulation18 and (2) an inability of available antidepressants to target the underlying biology of the disorder.2
Despite the hypothesis that fatigue associated with depression might be biologically related to immune dysregulation, some authors continue to point to an imbalance in neurotransmitters—norepinephrine, histamine, dopamine, acetylcholine—as being associated with fatigue.14 For example, a study demonstrated that drugs targeting noradrenergic reuptake inhibition were more effective at preventing a relapse of fatigue compared with serotonergic drugs.19 Another study showed improvement in energy with an increase in the plasma level of desipramine, which affects noradrenergic neurotransmission.20
Inflammatory cytokines also have been explored in the search for an understanding of the etiology of fatigue and depression.21 Physical and mental stress promote the release of cytokines, which activate the immune system by inducing an inflammatory response; this response has been etiologically linked to depressive disorders.22 Furthermore, studies have demonstrated an elevated level of inflammatory cytokines in patients who have MDD— suggesting that MDD is associated with a chronic low level of inflammation that crosses the blood−brain barrier.23
Clinical considerations: A role for rating scales?
Despite the significance of residual fatigue on the quality of life of patients who have MDD, most common rating scales, such as the Hamilton Depression Rating Scale24 and the Montgomery-Åsberg Depression Rating Scale,25 have limited sensitivity for measuring fatigue.26 The Fatigue Associated with Depression (FAsD)27 questionnaire, designed according to FDA guidelines,28 is used to assess fatigue associated with depression. The final version of the FAsD includes 13 items: a 6-item experience subscale and a 7-item impact subscale.
Is the FAsD helpful? The experience subscale of the FAsD assesses how often the patient experiences different aspects of fatigue (tiredness, exhaustion, lack of energy, physical weakness, and a feeling that everything requires too much effort). The impact subscale of the FAsD assesses the effect of fatigue on daily life.
The overall FAsD score is calculated by taking the mean of each subscale; a change of 0.67 on the experience subscale and 0.57 on the impact subscale are considered clinically meaningful.27 The measurement properties of the questionnaire showed internal consistency, reliability, and validity in testing. Researchers note, however, that FAsD does not include items to assess the impact of fatigue on cognition. This means that the FAsD might not distinguish between physical and mental aspects of fatigue.
Treatment
It isn’t surprising that residual depression can increase health care utilization and economic burden, including such indirect costs as lost productivity and wages.29 Despite these impacts, there is a paucity of studies evaluating the relationship between residual symptoms, such as fatigue, and work productivity. It has been established that improving a depressed patient’s level of energy correlates with improved performance at work.
Treating fatigue as a residual symptom of MDD can be complicated because symptoms of fatigue might be:
• a discrete symptom of MDD
• a prodromal symptom of another disorder
• an adverse effect of an antidepressant.2,30
It is a major clinical problem, therefore, that antidepressants can alleviate and cause symptoms of fatigue.31 Treatment strategy should focus on identifying antidepressants that are less likely to cause fatigue (ie, noradrenergic or dopaminergic drugs, or both). Adjunctive treatments to target residual fatigue also can be used.32
There are limited published data on the effective treatment of residual fatigue in patients with MDD. Given the absence of sufficient evidence, agents that promote noradrenergic and dopaminergic neurotransmission have been the treatment of choice when targeting fatigue in depressed patients.2,14,21,33
The Table34-37 lists potential treatment options often used to treat fatigue associated with depression. 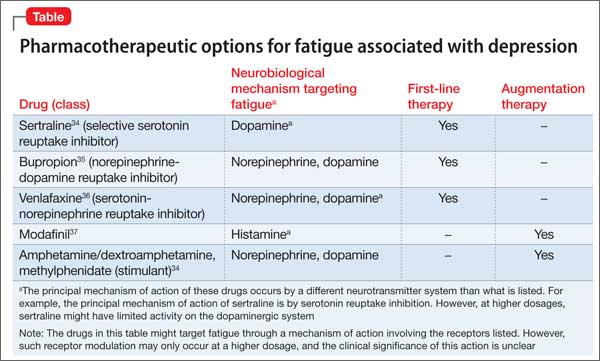
SSRIs. Treatment with SSRIs has been associated with a low probability of achieving remission when targeting fatigue as a symptom of MDD.21
One study reported that, after 8 weeks of treatment with an SSRI, treatment-emergent adverse events, such as worsening fatigue and weakness, were observed—along with an overall lack of efficacy in targeting all symptoms of depression.38
Another study demonstrated positive effects when a noradrenergic agent was added to an SSRI in partial responders who continued to complain of residual fatigue.33
However, studies that compared the effects of SSRIs with those of antidepressants that have pronoradrenergic effects showed that the 2 mechanisms of action were not significantly different from each other in their ability to resolve residual symptoms of fatigue.21 A limiting factor might be that these studies were retrospective and did not analyze the efficacy of a noradrenergic agent as an adjunct for alleviating symptoms of fatigue.39
Bupropion. This commonly used medication for fatigue is believed to cause a significantly lower level of fatigue compared with SSRIs.40 The potential utility of bupropion in this area could be a reflection of its mechanism of action—ie, the drug targets both noradrenergic and dopaminergic neurotransmission.41
A study comparing bupropion with SSRIs in targeting somatic symptoms of depression reported a small but statistically significant difference in favor of the bupropion-treated group. However, this finding was confounded by the small effect size and difficulty quantifying somatic symptoms.40
Stimulants and modafinil. Psycho-stimulants have been shown to be efficacious for depression and fatigue, both as monotherapy and adjunctively.39,42
Modafinil has demonstrated efficacy in open-label trials for improving residual fatigue, but failed to separate from placebo in controlled trials.43 At least 1 other failed study has been published examining modafinil as a treatment for fatigue associated with depression.43
Adjunctive therapy with CNS stimulants, such as amphetamine/dextroamphetamine and methylphenidate, has been used to treat fatigue, with positive results.16 Modafinil and stimulants also could be tried as an augmentation strategy to other antidepressants; such use is off-label and should be attempted only after careful consideration.16
Exercise might be a nonpharmacotherapeutic modality that targets the underlying physiology associated with fatigue. Exercise releases endorphins, which can affect overall brain chemistry and which have been theorized to diminish symptoms of fatigue and depression.44 Consider exercise in addition to treatment with an antidepressant in selected patients.45
To sum up
In general, the literature does not recommend one medication as superior to any other for treating fatigue that is a residual symptom of depression. Such hesitation suggests that more empirical studies are needed to determine what is the best and proper management of treating fatigue associated with depression.
Bottom LinE
Fatigue can be a symptom of major depressive disorder (MDD) or a risk factor for depression. Fatigue has been studied as a predictor of relapse after previous response to treatment in patients with MDD. Residual fatigue can affect social, cognitive, emotional, and physical health and can result in increased utilization of health care services. A number of treatment options are available; none has been shown to be superior to the others.
Related Resources
• Leone SS. A disabling combination: fatigue and depression. Br J Psychiatry. 2010;197(2):86-87.
• Targum SD, Fava M. Fatigue as a residual symptom of depression. Innov Clin Neurosci. 2011;8(10):40-43.
• Illiades C. How to fight depression fatigue. Everyday Health. http://www.everydayhealth.com/health-report/major-depression-living-well/fight-depression-fatigue.aspx.
• Kerr M. Depression and fatigue: a vicious cycle. Healthline. http://www.healthline.com/health/depression/fatigue.
Drug Brand Names
Amphetamine/dextroamphetamine • Adderall
Bupropion • Wellbutrin
Desipramine • Norpramin
Methylphenidate • Ritalin
Modafinil • Provigil
Sertraline • Zoloft
Venlafaxine • Effexor
Disclosures
Dr. Sohail reports no financial relationships with any company whose products are mentioned in this article or with manufacturers of competing products.
Dr. Macaluso has conducted clinical trials research as principal investigator for the following pharmaceutical manufacturers in the past 12 months: AbbVie, Inc.; Alkermes; AssureRx Health, Inc.; Eisai Co., Ltd.; FORUM Pharmaceuticals, Inc.; Janssen Pharmaceuticals, Inc.; and Naurex Inc. All clinical trial and study contracts were with, and payments were made to, University of Kansas Medical Center Research Institute, Kansas City, Kansas, a research institute affiliated with University of Kansas School of Medicine−Wichita.
1. Schönberger M, Herrberg M, Ponsford J. Fatigue as a cause, not a consequence of depression and daytime sleepiness: a cross-lagged analysis. J Head Trauma Rehabil. 2014;29(5):427-431.
2. Demyttenaere K, De Fruyt J, Stahl, SM. The many faces of fatigue in major depressive disorder. Int J Neuropsychopharmacol. 2005;8(1):93-105.
3. Skapinakis P, Lewis G, Mavreas V. Temporal relations between unexplained fatigue and depression: longitudinal data from an international study in primary care. Psychosom Med. 2004;66(3):330-335.
4. Nierenberg AA, Husain MM, Trivedi MH, et al. Residual symptoms after remission of major depressive disorder with citalopram and risk of relapse: a STAR*D report. Psychol Med. 2010;40(1):41-50.
5. Kennedy N, Paykel ES. Residual symptoms at remission from depression: impact on long-term outcome. J Affect Disord. 2004;80(2-3):135-144.
6. Shen J, Barbera J, Shapiro CM. Distinguishing sleepiness and fatigue: focus on definition and measurement. Sleep Med Rev. 2006;10:63-76.
7. Nierenberg AA, Keefe BR, Leslie VC, et al. Residual symptoms in depressed patients who respond acutely to fluoxetine. J Clin Psychiatry. 1999;60(4):221-225.
8. Tylee A, Gastpar M, Lépine JP, et al. DEPRES II (Depression Research in European Society II): a patient survey of the symptoms, disability and current management of depression in the community. DEPRES Steering Committee. Int Clin Psychopharmacol. 1999;14(3):139-151.
9. Marcus SM, Young EA, Kerber KB, et al. Gender differences in depression: findings from the STAR*D study. J Affect Disord. 2005;87(2-3):141-150.
10. Paykel ES, Ramana, R, Cooper Z, et al. Residual symptoms after partial remission: an important outcome in depression. Psychol Med. 1995;25(6):1171-1180.
11. Bockting CL, Spinhoven P, Koeter MW, et al; Depression Evaluation Longitudinal Therapy Assessment Study Group. Prediction of recurrence in recurrent depression and the influence of consecutive episodes on vulnerability for depression: a 2-year prospective study. J Clin Psychiatry. 2006;67(5):747-755.
12. Greco T, Eckert G, Kroenke K. The outcome of physical symptoms with treatment of depression. J Gen Intern Med. 2004;19(8):813-818.
13. McClintock SM, Husain MM, Wisniewski SR, et al. Residual symptoms in depressed outpatients who respond by 50% but do not remit to antidepressant medication. J Clin Psychopharmacol. 2011;31(2):180-186.
14. Stahl SM, Zhang L, Damatarca C, et al. Brain circuits determine destiny in depression: a novel approach to the psychopharmacology of wakefulness, fatigue, and executive dysfunction in major depressive disorder. J Clin Psychiatry. 2003;64(suppl 14):6-17.
15. MacHale SM, Law´rie SM, Cavanagh JT, et al. Cerebral perfusion in chronic fatigue syndrome and depression. Br J Psychiatry. 2000;176:550-556.
16. Paykel ES. Achieving gains beyond response. Acta Psychiatrica Scandinavica Suppl. 2002;(415):12-17.
17. van den Heuvel OA, Groenewegen HJ, Barkhof F, et al. Frontostriatal system in planning complexity: a parametric functional magnetic resonance version of Tower of London task. Neuroimage. 2003;18(2):367-374.
18. Jaremka LM, Fagundes CP, Glaser R, et al. Loneliness predicts pain, depression, and fatigue: understanding the role of immune dysregulation. Psychoneuroendocrinology. 2013;38(8):1310-1317.
19. Delgado PL, Charney DS, Price LH, et al. Serotonin function and the mechanism of antidepressant action. Reversal of antidepressant-induced remission by rapid depletion of plasma tryptophan. Arch Gen Psychiatry. 1990;47(5):411-418.
20. Nelson JC, Mazure C, Quinlan DM, et al. Drug-responsive symptoms in melancholia. Arch Gen Psychiatry. 1984;41(7):663-668.
21. Fava M, Ball S, Nelson, JC, et al. Clinical relevance of fatigue as a residual symptom in major depressive disorder. Depress Anxiety. 2014;31(3):250-257.
22. Anisman H, Merali Z, Poulter MO, et al. Cytokines as a precipitant of depressive illness: animal and human studies. Curr Pharm Des. 2005;11(8):963-972.
23. Simon NM, McNamara K, Chow CW, et al. A detailed examination of cytokine abnormalities in major depressive disorder. Eur Neuropsychopharmacol. 2008;18(3):230-233.
24. Hamilton M. A rating scale for depression. J Neurol Neurosurg Psychiatry. 1960;23:56-62.
25. Montgomery SA, Asberg M. A new depression scale designed to be sensitive to change. Br J Psychiatry. 1979;134:382-389.
26. Matza LS, Phillips GA, Revicki DA, et al. Development and validation of a patient-report measure of fatigue associated with depression. J Affect Disord. 2011;134(1-3):294-303.
27. Matza LS, Wyrwich KW, Phillips GA, et al. The Fatigue Associated with Depression Questionnaire (FAsD): responsiveness and responder definition. Qual Life Res. 2013;22(2):351-360.
28. Guidance for industry. Patient-reported outcome measures: use in medical product development to support labeling claims. Food and Drug Administration. http://www.fda. gov/downloads/Drugs/Guidances/UCM193282.pdf. Published December 2009. Accessed May 7, 2015.
29. Knoth RL, Bolge SC, Kim E, et al. Effect of inadequate response to treatment in patients with depression. Am J Manag Care. 2010;16(8):e188-e196.
30. Fava M. Symptoms of fatigue and cognitive/executive dysfunction in major depressive disorder before and after antidepressant treatment. J Clin Psychiatry. 2003;64(suppl 14):30-34.
31. Chang T, Fava M. The future of psychopharmacology of depression. J Clin Psychiatry. 2010;71(8):971-975.
32. Baldwin DS, Papakostas GI. Symptoms of fatigue and sleepiness in major depressive disorder. J Clin Psychiatry. 2006;67(suppl 6):9-15.
33. Ball SG, Dellva MA, D’Souza D, et al. A double-blind, placebo-controlled study of augmentation with LY2216684 for major depressive disorder patients who are partial responders to selective serotonin reuptake inhibitors [abstract P 05]. Int J Psych Clin Pract. 2010;14(suppl 1):19.
34. Stahl SM. Using secondary binding properties to select a not so elective serotonin reuptake inhibitor. J Clin Psychiatry. 1998;59(12):642-643.
35. Stahl SM. Essential psychopharmacology: neuroscientific basis and practical applications. 2nd ed. New York, NY: Cambridge University Press; 2000.
36. Bymaster FP, Katner JS, Nelson DL, et al. Atomoxetine increases extracellular levels of norepinephrine and dopamine in prefrontal cortex of rat: a potential mechanism for efficacy in attention deficit/hyperactivity disorder. Neuropsychopharmacology. 2002;27(5):699-711.
37. Scammell TE, Estabrooke IV, McCarthy MT, et al. Hypothalamic arousal regions are activated during modafinil-induced wakefulness. J Neurosci. 2000;20(22):8620-8628.
38. Daly EJ, Trivedi MH, Fava M, et al. The relationship between adverse events during selective serotonin reuptake inhibitor treatment for major depressive disorder and nonremission in the suicide assessment methodology study. J Clin Psychopharmacol. 2011;31(1):31-38.
39. Nelson JC. A review of the efficacy of serotonergic and noradrenergic reuptake inhibitors for treatment of major depression. Biol Psychiatry. 1999;46(9):1301-1308.
40. Papakostas GI, Nutt DJ, Hallett LA, et al. Resolution of sleepiness and fatigue in major depressive disorder: a comparison of bupropion and the selective serotonin reuptake inhibitors. Biol Psychiatry. 2006;60(12):1350-1355.
41. Fava M, Rush AJ, Thase ME, et al. 15 years of clinical experience with bupropion HCl: from bupropion to bupropion SR to bupropion XL. Prim Care Companion J Clin Psychiatry. 2005;7(3):106-113.
42. Candy M, Jones CB, Williams R, et al. Psychostimulants for depression. Cochrane Database Syst Rev. 2008;(2):CD006722. doi: 10.1002/14651858.CD006722.pub2.
43. Lam JY, Freeman MK, Cates ME. Modafinil augmentation for residual symptoms of fatigue in patients with a partial response to antidepressants. Ann Pharmacother. 2007;41(6):1005-1012.
44. Salmon P. Effects of physical exercise on anxiety, depression, and sensitivity to stress: a unifying theory. Clinical Psychol Rev. 2001;21(1):33-61.
45. Trivedi MH, Greer TL, Grannemann BD, et al. Exercise as an augmentation strategy for treatment of major depression. J Psychiatr Pract. 2006;12(4):205-213.
Fatigue and depression can be viewed as a “vicious cycle”: Fatigue can be a symptom of major depression, and fatigue can be a risk factor for depression.1 For example, fatigue associated with a general medical condition or traumatic brain injury can be a risk factor for developing major depressive disorder (MDD).1-3 It isn’t surprising that fatigue has been studied as a predictor of relapse after previous response to treatment in patients with MDD.
Despite the observed association between fatigue and depression, their underlying relationship often is unclear. The literature does not differentiate among fatigue associated with depression, fatigue as a treatment-emergent adverse effect, and fatigue as a residual symptom of depression that is partially responsive to treatment.4,5 To complicate the situation, many medications used to treat MDD can cause fatigue.
Patients often describe fatigue as (1) feeling tired, exhausted, or drained and (2) lacking energy and motivation. Fatigue can be related to impaired wakefulness but is believed to be a different entity than sleepiness.6 Residual fatigue can affect social, cognitive, emotional, and physical health.
We reviewed the literature about fatigue as a symptom of MDD by conducting a search of Medline, PubMed, and Google Scholar, using keywords depression, fatigue, residual symptoms, and treatment. We chose the papers cited in this article based on our consensus and because these publications represent expert opinion or the highest quality evidence available.
Residual fatigue has an effect on prognosis
Fatigue is a common symptom of MDD that persists in 20% to 30% of patients whose symptoms of depression otherwise remit.4,7-9 Several studies have linked residual fatigue with the overall prognosis of MDD.5 Data from a prospective study demonstrate that depressed patients have a higher risk of relapse when they continue to report symptoms of fatigue after their symptoms of depression have otherwise entered partial remission.10 Another study demonstrated that the severity of residual symptoms of depression is a strong predictor of another major depressive episode.11
In a large-scale study, the prevalence of residual fatigue after adequate treatment of MDD in both partial responders and remitters was 84.6%.12 The same study showed that one-third of patients who had been treated for MDD had persistent and clinically significant fatigue, which could suggest a relationship between fatigue and selective serotonin reuptake inhibitors (SSRIs) and other antidepressants.
Another study demonstrated that 64.6% of patients who responded to antidepressant treatment and who had baseline fatigue continued to exhibit symptoms of fatigue after an adequate trial of an antidepressant.13
Neurobiological considerations
Studies have shown that the neuronal circuits that malfunction in fatigue are different from those that malfunction in depression.14 Although the neurobiology of fatigue has not been determined, decreased neuronal activity in the prefrontal circuits has been associated with symptoms of fatigue.15
In addition, evidence from the literature shows a decrease in hormone secretion16 and cognitive abilities in patients exhibiting symptoms of fatigue.17 These findings have led some experts to hypothesize that symptoms of fatigue associated with depression could be the result of (1) immune dysregulation18 and (2) an inability of available antidepressants to target the underlying biology of the disorder.2
Despite the hypothesis that fatigue associated with depression might be biologically related to immune dysregulation, some authors continue to point to an imbalance in neurotransmitters—norepinephrine, histamine, dopamine, acetylcholine—as being associated with fatigue.14 For example, a study demonstrated that drugs targeting noradrenergic reuptake inhibition were more effective at preventing a relapse of fatigue compared with serotonergic drugs.19 Another study showed improvement in energy with an increase in the plasma level of desipramine, which affects noradrenergic neurotransmission.20
Inflammatory cytokines also have been explored in the search for an understanding of the etiology of fatigue and depression.21 Physical and mental stress promote the release of cytokines, which activate the immune system by inducing an inflammatory response; this response has been etiologically linked to depressive disorders.22 Furthermore, studies have demonstrated an elevated level of inflammatory cytokines in patients who have MDD— suggesting that MDD is associated with a chronic low level of inflammation that crosses the blood−brain barrier.23
Clinical considerations: A role for rating scales?
Despite the significance of residual fatigue on the quality of life of patients who have MDD, most common rating scales, such as the Hamilton Depression Rating Scale24 and the Montgomery-Åsberg Depression Rating Scale,25 have limited sensitivity for measuring fatigue.26 The Fatigue Associated with Depression (FAsD)27 questionnaire, designed according to FDA guidelines,28 is used to assess fatigue associated with depression. The final version of the FAsD includes 13 items: a 6-item experience subscale and a 7-item impact subscale.
Is the FAsD helpful? The experience subscale of the FAsD assesses how often the patient experiences different aspects of fatigue (tiredness, exhaustion, lack of energy, physical weakness, and a feeling that everything requires too much effort). The impact subscale of the FAsD assesses the effect of fatigue on daily life.
The overall FAsD score is calculated by taking the mean of each subscale; a change of 0.67 on the experience subscale and 0.57 on the impact subscale are considered clinically meaningful.27 The measurement properties of the questionnaire showed internal consistency, reliability, and validity in testing. Researchers note, however, that FAsD does not include items to assess the impact of fatigue on cognition. This means that the FAsD might not distinguish between physical and mental aspects of fatigue.
Treatment
It isn’t surprising that residual depression can increase health care utilization and economic burden, including such indirect costs as lost productivity and wages.29 Despite these impacts, there is a paucity of studies evaluating the relationship between residual symptoms, such as fatigue, and work productivity. It has been established that improving a depressed patient’s level of energy correlates with improved performance at work.
Treating fatigue as a residual symptom of MDD can be complicated because symptoms of fatigue might be:
• a discrete symptom of MDD
• a prodromal symptom of another disorder
• an adverse effect of an antidepressant.2,30
It is a major clinical problem, therefore, that antidepressants can alleviate and cause symptoms of fatigue.31 Treatment strategy should focus on identifying antidepressants that are less likely to cause fatigue (ie, noradrenergic or dopaminergic drugs, or both). Adjunctive treatments to target residual fatigue also can be used.32
There are limited published data on the effective treatment of residual fatigue in patients with MDD. Given the absence of sufficient evidence, agents that promote noradrenergic and dopaminergic neurotransmission have been the treatment of choice when targeting fatigue in depressed patients.2,14,21,33
The Table34-37 lists potential treatment options often used to treat fatigue associated with depression.
SSRIs. Treatment with SSRIs has been associated with a low probability of achieving remission when targeting fatigue as a symptom of MDD.21
One study reported that, after 8 weeks of treatment with an SSRI, treatment-emergent adverse events, such as worsening fatigue and weakness, were observed—along with an overall lack of efficacy in targeting all symptoms of depression.38
Another study demonstrated positive effects when a noradrenergic agent was added to an SSRI in partial responders who continued to complain of residual fatigue.33
However, studies that compared the effects of SSRIs with those of antidepressants that have pronoradrenergic effects showed that the 2 mechanisms of action were not significantly different from each other in their ability to resolve residual symptoms of fatigue.21 A limiting factor might be that these studies were retrospective and did not analyze the efficacy of a noradrenergic agent as an adjunct for alleviating symptoms of fatigue.39
Bupropion. This commonly used medication for fatigue is believed to cause a significantly lower level of fatigue compared with SSRIs.40 The potential utility of bupropion in this area could be a reflection of its mechanism of action—ie, the drug targets both noradrenergic and dopaminergic neurotransmission.41
A study comparing bupropion with SSRIs in targeting somatic symptoms of depression reported a small but statistically significant difference in favor of the bupropion-treated group. However, this finding was confounded by the small effect size and difficulty quantifying somatic symptoms.40
Stimulants and modafinil. Psycho-stimulants have been shown to be efficacious for depression and fatigue, both as monotherapy and adjunctively.39,42
Modafinil has demonstrated efficacy in open-label trials for improving residual fatigue, but failed to separate from placebo in controlled trials.43 At least 1 other failed study has been published examining modafinil as a treatment for fatigue associated with depression.43
Adjunctive therapy with CNS stimulants, such as amphetamine/dextroamphetamine and methylphenidate, has been used to treat fatigue, with positive results.16 Modafinil and stimulants also could be tried as an augmentation strategy to other antidepressants; such use is off-label and should be attempted only after careful consideration.16
Exercise might be a nonpharmacotherapeutic modality that targets the underlying physiology associated with fatigue. Exercise releases endorphins, which can affect overall brain chemistry and which have been theorized to diminish symptoms of fatigue and depression.44 Consider exercise in addition to treatment with an antidepressant in selected patients.45
To sum up
In general, the literature does not recommend one medication as superior to any other for treating fatigue that is a residual symptom of depression. Such hesitation suggests that more empirical studies are needed to determine what is the best and proper management of treating fatigue associated with depression.
Bottom LinE
Fatigue can be a symptom of major depressive disorder (MDD) or a risk factor for depression. Fatigue has been studied as a predictor of relapse after previous response to treatment in patients with MDD. Residual fatigue can affect social, cognitive, emotional, and physical health and can result in increased utilization of health care services. A number of treatment options are available; none has been shown to be superior to the others.
Related Resources
• Leone SS. A disabling combination: fatigue and depression. Br J Psychiatry. 2010;197(2):86-87.
• Targum SD, Fava M. Fatigue as a residual symptom of depression. Innov Clin Neurosci. 2011;8(10):40-43.
• Illiades C. How to fight depression fatigue. Everyday Health. http://www.everydayhealth.com/health-report/major-depression-living-well/fight-depression-fatigue.aspx.
• Kerr M. Depression and fatigue: a vicious cycle. Healthline. http://www.healthline.com/health/depression/fatigue.
Drug Brand Names
Amphetamine/dextroamphetamine • Adderall
Bupropion • Wellbutrin
Desipramine • Norpramin
Methylphenidate • Ritalin
Modafinil • Provigil
Sertraline • Zoloft
Venlafaxine • Effexor
Disclosures
Dr. Sohail reports no financial relationships with any company whose products are mentioned in this article or with manufacturers of competing products.
Dr. Macaluso has conducted clinical trials research as principal investigator for the following pharmaceutical manufacturers in the past 12 months: AbbVie, Inc.; Alkermes; AssureRx Health, Inc.; Eisai Co., Ltd.; FORUM Pharmaceuticals, Inc.; Janssen Pharmaceuticals, Inc.; and Naurex Inc. All clinical trial and study contracts were with, and payments were made to, University of Kansas Medical Center Research Institute, Kansas City, Kansas, a research institute affiliated with University of Kansas School of Medicine−Wichita.
Fatigue and depression can be viewed as a “vicious cycle”: Fatigue can be a symptom of major depression, and fatigue can be a risk factor for depression.1 For example, fatigue associated with a general medical condition or traumatic brain injury can be a risk factor for developing major depressive disorder (MDD).1-3 It isn’t surprising that fatigue has been studied as a predictor of relapse after previous response to treatment in patients with MDD.
Despite the observed association between fatigue and depression, their underlying relationship often is unclear. The literature does not differentiate among fatigue associated with depression, fatigue as a treatment-emergent adverse effect, and fatigue as a residual symptom of depression that is partially responsive to treatment.4,5 To complicate the situation, many medications used to treat MDD can cause fatigue.
Patients often describe fatigue as (1) feeling tired, exhausted, or drained and (2) lacking energy and motivation. Fatigue can be related to impaired wakefulness but is believed to be a different entity than sleepiness.6 Residual fatigue can affect social, cognitive, emotional, and physical health.
We reviewed the literature about fatigue as a symptom of MDD by conducting a search of Medline, PubMed, and Google Scholar, using keywords depression, fatigue, residual symptoms, and treatment. We chose the papers cited in this article based on our consensus and because these publications represent expert opinion or the highest quality evidence available.
Residual fatigue has an effect on prognosis
Fatigue is a common symptom of MDD that persists in 20% to 30% of patients whose symptoms of depression otherwise remit.4,7-9 Several studies have linked residual fatigue with the overall prognosis of MDD.5 Data from a prospective study demonstrate that depressed patients have a higher risk of relapse when they continue to report symptoms of fatigue after their symptoms of depression have otherwise entered partial remission.10 Another study demonstrated that the severity of residual symptoms of depression is a strong predictor of another major depressive episode.11
In a large-scale study, the prevalence of residual fatigue after adequate treatment of MDD in both partial responders and remitters was 84.6%.12 The same study showed that one-third of patients who had been treated for MDD had persistent and clinically significant fatigue, which could suggest a relationship between fatigue and selective serotonin reuptake inhibitors (SSRIs) and other antidepressants.
Another study demonstrated that 64.6% of patients who responded to antidepressant treatment and who had baseline fatigue continued to exhibit symptoms of fatigue after an adequate trial of an antidepressant.13
Neurobiological considerations
Studies have shown that the neuronal circuits that malfunction in fatigue are different from those that malfunction in depression.14 Although the neurobiology of fatigue has not been determined, decreased neuronal activity in the prefrontal circuits has been associated with symptoms of fatigue.15
In addition, evidence from the literature shows a decrease in hormone secretion16 and cognitive abilities in patients exhibiting symptoms of fatigue.17 These findings have led some experts to hypothesize that symptoms of fatigue associated with depression could be the result of (1) immune dysregulation18 and (2) an inability of available antidepressants to target the underlying biology of the disorder.2
Despite the hypothesis that fatigue associated with depression might be biologically related to immune dysregulation, some authors continue to point to an imbalance in neurotransmitters—norepinephrine, histamine, dopamine, acetylcholine—as being associated with fatigue.14 For example, a study demonstrated that drugs targeting noradrenergic reuptake inhibition were more effective at preventing a relapse of fatigue compared with serotonergic drugs.19 Another study showed improvement in energy with an increase in the plasma level of desipramine, which affects noradrenergic neurotransmission.20
Inflammatory cytokines also have been explored in the search for an understanding of the etiology of fatigue and depression.21 Physical and mental stress promote the release of cytokines, which activate the immune system by inducing an inflammatory response; this response has been etiologically linked to depressive disorders.22 Furthermore, studies have demonstrated an elevated level of inflammatory cytokines in patients who have MDD— suggesting that MDD is associated with a chronic low level of inflammation that crosses the blood−brain barrier.23
Clinical considerations: A role for rating scales?
Despite the significance of residual fatigue on the quality of life of patients who have MDD, most common rating scales, such as the Hamilton Depression Rating Scale24 and the Montgomery-Åsberg Depression Rating Scale,25 have limited sensitivity for measuring fatigue.26 The Fatigue Associated with Depression (FAsD)27 questionnaire, designed according to FDA guidelines,28 is used to assess fatigue associated with depression. The final version of the FAsD includes 13 items: a 6-item experience subscale and a 7-item impact subscale.
Is the FAsD helpful? The experience subscale of the FAsD assesses how often the patient experiences different aspects of fatigue (tiredness, exhaustion, lack of energy, physical weakness, and a feeling that everything requires too much effort). The impact subscale of the FAsD assesses the effect of fatigue on daily life.
The overall FAsD score is calculated by taking the mean of each subscale; a change of 0.67 on the experience subscale and 0.57 on the impact subscale are considered clinically meaningful.27 The measurement properties of the questionnaire showed internal consistency, reliability, and validity in testing. Researchers note, however, that FAsD does not include items to assess the impact of fatigue on cognition. This means that the FAsD might not distinguish between physical and mental aspects of fatigue.
Treatment
It isn’t surprising that residual depression can increase health care utilization and economic burden, including such indirect costs as lost productivity and wages.29 Despite these impacts, there is a paucity of studies evaluating the relationship between residual symptoms, such as fatigue, and work productivity. It has been established that improving a depressed patient’s level of energy correlates with improved performance at work.
Treating fatigue as a residual symptom of MDD can be complicated because symptoms of fatigue might be:
• a discrete symptom of MDD
• a prodromal symptom of another disorder
• an adverse effect of an antidepressant.2,30
It is a major clinical problem, therefore, that antidepressants can alleviate and cause symptoms of fatigue.31 Treatment strategy should focus on identifying antidepressants that are less likely to cause fatigue (ie, noradrenergic or dopaminergic drugs, or both). Adjunctive treatments to target residual fatigue also can be used.32
There are limited published data on the effective treatment of residual fatigue in patients with MDD. Given the absence of sufficient evidence, agents that promote noradrenergic and dopaminergic neurotransmission have been the treatment of choice when targeting fatigue in depressed patients.2,14,21,33
The Table34-37 lists potential treatment options often used to treat fatigue associated with depression.
SSRIs. Treatment with SSRIs has been associated with a low probability of achieving remission when targeting fatigue as a symptom of MDD.21
One study reported that, after 8 weeks of treatment with an SSRI, treatment-emergent adverse events, such as worsening fatigue and weakness, were observed—along with an overall lack of efficacy in targeting all symptoms of depression.38
Another study demonstrated positive effects when a noradrenergic agent was added to an SSRI in partial responders who continued to complain of residual fatigue.33
However, studies that compared the effects of SSRIs with those of antidepressants that have pronoradrenergic effects showed that the 2 mechanisms of action were not significantly different from each other in their ability to resolve residual symptoms of fatigue.21 A limiting factor might be that these studies were retrospective and did not analyze the efficacy of a noradrenergic agent as an adjunct for alleviating symptoms of fatigue.39
Bupropion. This commonly used medication for fatigue is believed to cause a significantly lower level of fatigue compared with SSRIs.40 The potential utility of bupropion in this area could be a reflection of its mechanism of action—ie, the drug targets both noradrenergic and dopaminergic neurotransmission.41
A study comparing bupropion with SSRIs in targeting somatic symptoms of depression reported a small but statistically significant difference in favor of the bupropion-treated group. However, this finding was confounded by the small effect size and difficulty quantifying somatic symptoms.40
Stimulants and modafinil. Psycho-stimulants have been shown to be efficacious for depression and fatigue, both as monotherapy and adjunctively.39,42
Modafinil has demonstrated efficacy in open-label trials for improving residual fatigue, but failed to separate from placebo in controlled trials.43 At least 1 other failed study has been published examining modafinil as a treatment for fatigue associated with depression.43
Adjunctive therapy with CNS stimulants, such as amphetamine/dextroamphetamine and methylphenidate, has been used to treat fatigue, with positive results.16 Modafinil and stimulants also could be tried as an augmentation strategy to other antidepressants; such use is off-label and should be attempted only after careful consideration.16
Exercise might be a nonpharmacotherapeutic modality that targets the underlying physiology associated with fatigue. Exercise releases endorphins, which can affect overall brain chemistry and which have been theorized to diminish symptoms of fatigue and depression.44 Consider exercise in addition to treatment with an antidepressant in selected patients.45
To sum up
In general, the literature does not recommend one medication as superior to any other for treating fatigue that is a residual symptom of depression. Such hesitation suggests that more empirical studies are needed to determine what is the best and proper management of treating fatigue associated with depression.
Bottom LinE
Fatigue can be a symptom of major depressive disorder (MDD) or a risk factor for depression. Fatigue has been studied as a predictor of relapse after previous response to treatment in patients with MDD. Residual fatigue can affect social, cognitive, emotional, and physical health and can result in increased utilization of health care services. A number of treatment options are available; none has been shown to be superior to the others.
Related Resources
• Leone SS. A disabling combination: fatigue and depression. Br J Psychiatry. 2010;197(2):86-87.
• Targum SD, Fava M. Fatigue as a residual symptom of depression. Innov Clin Neurosci. 2011;8(10):40-43.
• Illiades C. How to fight depression fatigue. Everyday Health. http://www.everydayhealth.com/health-report/major-depression-living-well/fight-depression-fatigue.aspx.
• Kerr M. Depression and fatigue: a vicious cycle. Healthline. http://www.healthline.com/health/depression/fatigue.
Drug Brand Names
Amphetamine/dextroamphetamine • Adderall
Bupropion • Wellbutrin
Desipramine • Norpramin
Methylphenidate • Ritalin
Modafinil • Provigil
Sertraline • Zoloft
Venlafaxine • Effexor
Disclosures
Dr. Sohail reports no financial relationships with any company whose products are mentioned in this article or with manufacturers of competing products.
Dr. Macaluso has conducted clinical trials research as principal investigator for the following pharmaceutical manufacturers in the past 12 months: AbbVie, Inc.; Alkermes; AssureRx Health, Inc.; Eisai Co., Ltd.; FORUM Pharmaceuticals, Inc.; Janssen Pharmaceuticals, Inc.; and Naurex Inc. All clinical trial and study contracts were with, and payments were made to, University of Kansas Medical Center Research Institute, Kansas City, Kansas, a research institute affiliated with University of Kansas School of Medicine−Wichita.
1. Schönberger M, Herrberg M, Ponsford J. Fatigue as a cause, not a consequence of depression and daytime sleepiness: a cross-lagged analysis. J Head Trauma Rehabil. 2014;29(5):427-431.
2. Demyttenaere K, De Fruyt J, Stahl, SM. The many faces of fatigue in major depressive disorder. Int J Neuropsychopharmacol. 2005;8(1):93-105.
3. Skapinakis P, Lewis G, Mavreas V. Temporal relations between unexplained fatigue and depression: longitudinal data from an international study in primary care. Psychosom Med. 2004;66(3):330-335.
4. Nierenberg AA, Husain MM, Trivedi MH, et al. Residual symptoms after remission of major depressive disorder with citalopram and risk of relapse: a STAR*D report. Psychol Med. 2010;40(1):41-50.
5. Kennedy N, Paykel ES. Residual symptoms at remission from depression: impact on long-term outcome. J Affect Disord. 2004;80(2-3):135-144.
6. Shen J, Barbera J, Shapiro CM. Distinguishing sleepiness and fatigue: focus on definition and measurement. Sleep Med Rev. 2006;10:63-76.
7. Nierenberg AA, Keefe BR, Leslie VC, et al. Residual symptoms in depressed patients who respond acutely to fluoxetine. J Clin Psychiatry. 1999;60(4):221-225.
8. Tylee A, Gastpar M, Lépine JP, et al. DEPRES II (Depression Research in European Society II): a patient survey of the symptoms, disability and current management of depression in the community. DEPRES Steering Committee. Int Clin Psychopharmacol. 1999;14(3):139-151.
9. Marcus SM, Young EA, Kerber KB, et al. Gender differences in depression: findings from the STAR*D study. J Affect Disord. 2005;87(2-3):141-150.
10. Paykel ES, Ramana, R, Cooper Z, et al. Residual symptoms after partial remission: an important outcome in depression. Psychol Med. 1995;25(6):1171-1180.
11. Bockting CL, Spinhoven P, Koeter MW, et al; Depression Evaluation Longitudinal Therapy Assessment Study Group. Prediction of recurrence in recurrent depression and the influence of consecutive episodes on vulnerability for depression: a 2-year prospective study. J Clin Psychiatry. 2006;67(5):747-755.
12. Greco T, Eckert G, Kroenke K. The outcome of physical symptoms with treatment of depression. J Gen Intern Med. 2004;19(8):813-818.
13. McClintock SM, Husain MM, Wisniewski SR, et al. Residual symptoms in depressed outpatients who respond by 50% but do not remit to antidepressant medication. J Clin Psychopharmacol. 2011;31(2):180-186.
14. Stahl SM, Zhang L, Damatarca C, et al. Brain circuits determine destiny in depression: a novel approach to the psychopharmacology of wakefulness, fatigue, and executive dysfunction in major depressive disorder. J Clin Psychiatry. 2003;64(suppl 14):6-17.
15. MacHale SM, Law´rie SM, Cavanagh JT, et al. Cerebral perfusion in chronic fatigue syndrome and depression. Br J Psychiatry. 2000;176:550-556.
16. Paykel ES. Achieving gains beyond response. Acta Psychiatrica Scandinavica Suppl. 2002;(415):12-17.
17. van den Heuvel OA, Groenewegen HJ, Barkhof F, et al. Frontostriatal system in planning complexity: a parametric functional magnetic resonance version of Tower of London task. Neuroimage. 2003;18(2):367-374.
18. Jaremka LM, Fagundes CP, Glaser R, et al. Loneliness predicts pain, depression, and fatigue: understanding the role of immune dysregulation. Psychoneuroendocrinology. 2013;38(8):1310-1317.
19. Delgado PL, Charney DS, Price LH, et al. Serotonin function and the mechanism of antidepressant action. Reversal of antidepressant-induced remission by rapid depletion of plasma tryptophan. Arch Gen Psychiatry. 1990;47(5):411-418.
20. Nelson JC, Mazure C, Quinlan DM, et al. Drug-responsive symptoms in melancholia. Arch Gen Psychiatry. 1984;41(7):663-668.
21. Fava M, Ball S, Nelson, JC, et al. Clinical relevance of fatigue as a residual symptom in major depressive disorder. Depress Anxiety. 2014;31(3):250-257.
22. Anisman H, Merali Z, Poulter MO, et al. Cytokines as a precipitant of depressive illness: animal and human studies. Curr Pharm Des. 2005;11(8):963-972.
23. Simon NM, McNamara K, Chow CW, et al. A detailed examination of cytokine abnormalities in major depressive disorder. Eur Neuropsychopharmacol. 2008;18(3):230-233.
24. Hamilton M. A rating scale for depression. J Neurol Neurosurg Psychiatry. 1960;23:56-62.
25. Montgomery SA, Asberg M. A new depression scale designed to be sensitive to change. Br J Psychiatry. 1979;134:382-389.
26. Matza LS, Phillips GA, Revicki DA, et al. Development and validation of a patient-report measure of fatigue associated with depression. J Affect Disord. 2011;134(1-3):294-303.
27. Matza LS, Wyrwich KW, Phillips GA, et al. The Fatigue Associated with Depression Questionnaire (FAsD): responsiveness and responder definition. Qual Life Res. 2013;22(2):351-360.
28. Guidance for industry. Patient-reported outcome measures: use in medical product development to support labeling claims. Food and Drug Administration. http://www.fda. gov/downloads/Drugs/Guidances/UCM193282.pdf. Published December 2009. Accessed May 7, 2015.
29. Knoth RL, Bolge SC, Kim E, et al. Effect of inadequate response to treatment in patients with depression. Am J Manag Care. 2010;16(8):e188-e196.
30. Fava M. Symptoms of fatigue and cognitive/executive dysfunction in major depressive disorder before and after antidepressant treatment. J Clin Psychiatry. 2003;64(suppl 14):30-34.
31. Chang T, Fava M. The future of psychopharmacology of depression. J Clin Psychiatry. 2010;71(8):971-975.
32. Baldwin DS, Papakostas GI. Symptoms of fatigue and sleepiness in major depressive disorder. J Clin Psychiatry. 2006;67(suppl 6):9-15.
33. Ball SG, Dellva MA, D’Souza D, et al. A double-blind, placebo-controlled study of augmentation with LY2216684 for major depressive disorder patients who are partial responders to selective serotonin reuptake inhibitors [abstract P 05]. Int J Psych Clin Pract. 2010;14(suppl 1):19.
34. Stahl SM. Using secondary binding properties to select a not so elective serotonin reuptake inhibitor. J Clin Psychiatry. 1998;59(12):642-643.
35. Stahl SM. Essential psychopharmacology: neuroscientific basis and practical applications. 2nd ed. New York, NY: Cambridge University Press; 2000.
36. Bymaster FP, Katner JS, Nelson DL, et al. Atomoxetine increases extracellular levels of norepinephrine and dopamine in prefrontal cortex of rat: a potential mechanism for efficacy in attention deficit/hyperactivity disorder. Neuropsychopharmacology. 2002;27(5):699-711.
37. Scammell TE, Estabrooke IV, McCarthy MT, et al. Hypothalamic arousal regions are activated during modafinil-induced wakefulness. J Neurosci. 2000;20(22):8620-8628.
38. Daly EJ, Trivedi MH, Fava M, et al. The relationship between adverse events during selective serotonin reuptake inhibitor treatment for major depressive disorder and nonremission in the suicide assessment methodology study. J Clin Psychopharmacol. 2011;31(1):31-38.
39. Nelson JC. A review of the efficacy of serotonergic and noradrenergic reuptake inhibitors for treatment of major depression. Biol Psychiatry. 1999;46(9):1301-1308.
40. Papakostas GI, Nutt DJ, Hallett LA, et al. Resolution of sleepiness and fatigue in major depressive disorder: a comparison of bupropion and the selective serotonin reuptake inhibitors. Biol Psychiatry. 2006;60(12):1350-1355.
41. Fava M, Rush AJ, Thase ME, et al. 15 years of clinical experience with bupropion HCl: from bupropion to bupropion SR to bupropion XL. Prim Care Companion J Clin Psychiatry. 2005;7(3):106-113.
42. Candy M, Jones CB, Williams R, et al. Psychostimulants for depression. Cochrane Database Syst Rev. 2008;(2):CD006722. doi: 10.1002/14651858.CD006722.pub2.
43. Lam JY, Freeman MK, Cates ME. Modafinil augmentation for residual symptoms of fatigue in patients with a partial response to antidepressants. Ann Pharmacother. 2007;41(6):1005-1012.
44. Salmon P. Effects of physical exercise on anxiety, depression, and sensitivity to stress: a unifying theory. Clinical Psychol Rev. 2001;21(1):33-61.
45. Trivedi MH, Greer TL, Grannemann BD, et al. Exercise as an augmentation strategy for treatment of major depression. J Psychiatr Pract. 2006;12(4):205-213.
1. Schönberger M, Herrberg M, Ponsford J. Fatigue as a cause, not a consequence of depression and daytime sleepiness: a cross-lagged analysis. J Head Trauma Rehabil. 2014;29(5):427-431.
2. Demyttenaere K, De Fruyt J, Stahl, SM. The many faces of fatigue in major depressive disorder. Int J Neuropsychopharmacol. 2005;8(1):93-105.
3. Skapinakis P, Lewis G, Mavreas V. Temporal relations between unexplained fatigue and depression: longitudinal data from an international study in primary care. Psychosom Med. 2004;66(3):330-335.
4. Nierenberg AA, Husain MM, Trivedi MH, et al. Residual symptoms after remission of major depressive disorder with citalopram and risk of relapse: a STAR*D report. Psychol Med. 2010;40(1):41-50.
5. Kennedy N, Paykel ES. Residual symptoms at remission from depression: impact on long-term outcome. J Affect Disord. 2004;80(2-3):135-144.
6. Shen J, Barbera J, Shapiro CM. Distinguishing sleepiness and fatigue: focus on definition and measurement. Sleep Med Rev. 2006;10:63-76.
7. Nierenberg AA, Keefe BR, Leslie VC, et al. Residual symptoms in depressed patients who respond acutely to fluoxetine. J Clin Psychiatry. 1999;60(4):221-225.
8. Tylee A, Gastpar M, Lépine JP, et al. DEPRES II (Depression Research in European Society II): a patient survey of the symptoms, disability and current management of depression in the community. DEPRES Steering Committee. Int Clin Psychopharmacol. 1999;14(3):139-151.
9. Marcus SM, Young EA, Kerber KB, et al. Gender differences in depression: findings from the STAR*D study. J Affect Disord. 2005;87(2-3):141-150.
10. Paykel ES, Ramana, R, Cooper Z, et al. Residual symptoms after partial remission: an important outcome in depression. Psychol Med. 1995;25(6):1171-1180.
11. Bockting CL, Spinhoven P, Koeter MW, et al; Depression Evaluation Longitudinal Therapy Assessment Study Group. Prediction of recurrence in recurrent depression and the influence of consecutive episodes on vulnerability for depression: a 2-year prospective study. J Clin Psychiatry. 2006;67(5):747-755.
12. Greco T, Eckert G, Kroenke K. The outcome of physical symptoms with treatment of depression. J Gen Intern Med. 2004;19(8):813-818.
13. McClintock SM, Husain MM, Wisniewski SR, et al. Residual symptoms in depressed outpatients who respond by 50% but do not remit to antidepressant medication. J Clin Psychopharmacol. 2011;31(2):180-186.
14. Stahl SM, Zhang L, Damatarca C, et al. Brain circuits determine destiny in depression: a novel approach to the psychopharmacology of wakefulness, fatigue, and executive dysfunction in major depressive disorder. J Clin Psychiatry. 2003;64(suppl 14):6-17.
15. MacHale SM, Law´rie SM, Cavanagh JT, et al. Cerebral perfusion in chronic fatigue syndrome and depression. Br J Psychiatry. 2000;176:550-556.
16. Paykel ES. Achieving gains beyond response. Acta Psychiatrica Scandinavica Suppl. 2002;(415):12-17.
17. van den Heuvel OA, Groenewegen HJ, Barkhof F, et al. Frontostriatal system in planning complexity: a parametric functional magnetic resonance version of Tower of London task. Neuroimage. 2003;18(2):367-374.
18. Jaremka LM, Fagundes CP, Glaser R, et al. Loneliness predicts pain, depression, and fatigue: understanding the role of immune dysregulation. Psychoneuroendocrinology. 2013;38(8):1310-1317.
19. Delgado PL, Charney DS, Price LH, et al. Serotonin function and the mechanism of antidepressant action. Reversal of antidepressant-induced remission by rapid depletion of plasma tryptophan. Arch Gen Psychiatry. 1990;47(5):411-418.
20. Nelson JC, Mazure C, Quinlan DM, et al. Drug-responsive symptoms in melancholia. Arch Gen Psychiatry. 1984;41(7):663-668.
21. Fava M, Ball S, Nelson, JC, et al. Clinical relevance of fatigue as a residual symptom in major depressive disorder. Depress Anxiety. 2014;31(3):250-257.
22. Anisman H, Merali Z, Poulter MO, et al. Cytokines as a precipitant of depressive illness: animal and human studies. Curr Pharm Des. 2005;11(8):963-972.
23. Simon NM, McNamara K, Chow CW, et al. A detailed examination of cytokine abnormalities in major depressive disorder. Eur Neuropsychopharmacol. 2008;18(3):230-233.
24. Hamilton M. A rating scale for depression. J Neurol Neurosurg Psychiatry. 1960;23:56-62.
25. Montgomery SA, Asberg M. A new depression scale designed to be sensitive to change. Br J Psychiatry. 1979;134:382-389.
26. Matza LS, Phillips GA, Revicki DA, et al. Development and validation of a patient-report measure of fatigue associated with depression. J Affect Disord. 2011;134(1-3):294-303.
27. Matza LS, Wyrwich KW, Phillips GA, et al. The Fatigue Associated with Depression Questionnaire (FAsD): responsiveness and responder definition. Qual Life Res. 2013;22(2):351-360.
28. Guidance for industry. Patient-reported outcome measures: use in medical product development to support labeling claims. Food and Drug Administration. http://www.fda. gov/downloads/Drugs/Guidances/UCM193282.pdf. Published December 2009. Accessed May 7, 2015.
29. Knoth RL, Bolge SC, Kim E, et al. Effect of inadequate response to treatment in patients with depression. Am J Manag Care. 2010;16(8):e188-e196.
30. Fava M. Symptoms of fatigue and cognitive/executive dysfunction in major depressive disorder before and after antidepressant treatment. J Clin Psychiatry. 2003;64(suppl 14):30-34.
31. Chang T, Fava M. The future of psychopharmacology of depression. J Clin Psychiatry. 2010;71(8):971-975.
32. Baldwin DS, Papakostas GI. Symptoms of fatigue and sleepiness in major depressive disorder. J Clin Psychiatry. 2006;67(suppl 6):9-15.
33. Ball SG, Dellva MA, D’Souza D, et al. A double-blind, placebo-controlled study of augmentation with LY2216684 for major depressive disorder patients who are partial responders to selective serotonin reuptake inhibitors [abstract P 05]. Int J Psych Clin Pract. 2010;14(suppl 1):19.
34. Stahl SM. Using secondary binding properties to select a not so elective serotonin reuptake inhibitor. J Clin Psychiatry. 1998;59(12):642-643.
35. Stahl SM. Essential psychopharmacology: neuroscientific basis and practical applications. 2nd ed. New York, NY: Cambridge University Press; 2000.
36. Bymaster FP, Katner JS, Nelson DL, et al. Atomoxetine increases extracellular levels of norepinephrine and dopamine in prefrontal cortex of rat: a potential mechanism for efficacy in attention deficit/hyperactivity disorder. Neuropsychopharmacology. 2002;27(5):699-711.
37. Scammell TE, Estabrooke IV, McCarthy MT, et al. Hypothalamic arousal regions are activated during modafinil-induced wakefulness. J Neurosci. 2000;20(22):8620-8628.
38. Daly EJ, Trivedi MH, Fava M, et al. The relationship between adverse events during selective serotonin reuptake inhibitor treatment for major depressive disorder and nonremission in the suicide assessment methodology study. J Clin Psychopharmacol. 2011;31(1):31-38.
39. Nelson JC. A review of the efficacy of serotonergic and noradrenergic reuptake inhibitors for treatment of major depression. Biol Psychiatry. 1999;46(9):1301-1308.
40. Papakostas GI, Nutt DJ, Hallett LA, et al. Resolution of sleepiness and fatigue in major depressive disorder: a comparison of bupropion and the selective serotonin reuptake inhibitors. Biol Psychiatry. 2006;60(12):1350-1355.
41. Fava M, Rush AJ, Thase ME, et al. 15 years of clinical experience with bupropion HCl: from bupropion to bupropion SR to bupropion XL. Prim Care Companion J Clin Psychiatry. 2005;7(3):106-113.
42. Candy M, Jones CB, Williams R, et al. Psychostimulants for depression. Cochrane Database Syst Rev. 2008;(2):CD006722. doi: 10.1002/14651858.CD006722.pub2.
43. Lam JY, Freeman MK, Cates ME. Modafinil augmentation for residual symptoms of fatigue in patients with a partial response to antidepressants. Ann Pharmacother. 2007;41(6):1005-1012.
44. Salmon P. Effects of physical exercise on anxiety, depression, and sensitivity to stress: a unifying theory. Clinical Psychol Rev. 2001;21(1):33-61.
45. Trivedi MH, Greer TL, Grannemann BD, et al. Exercise as an augmentation strategy for treatment of major depression. J Psychiatr Pract. 2006;12(4):205-213.

DDW: Intragastric balloon eyed for primary obesity intervention
WASHINGTON – Obese patients implanted with an intragastric balloon lost significantly more weight than those following a behavioral modification program in a randomized, nonblinded trial.
Moreover, weight loss was preserved even after device removal, study author Dr. Barham Abu Dayyeh said at the annual Digestive Disease Week.

The Orbera intragastric balloon (Apollo Endosurgery) could fill a gap in the United States between obesity lifestyle interventions that are minimally effective and a range of bariatric surgical interventions that are effective, but come at a cost of increased complications and health care costs, he said. Moreover, only 1% of qualified patients actually end up having bariatric surgery.
The silicone, saline-filled intragastric balloon (IGB) has been widely used outside the U.S. for more than 17 years in more than 200,000 patients, added Dr. Abu Dayyeh* of Mayo Clinic in Rochester, Minn.
The multicenter trial was designed for premarketing approval in the U.S. of the Orbera IGB and randomly assigned 273 adults with a body mass index (BMI) of 30-40 kg/m2 for more than 2 years to a 12-month behavioral modification program with or without endoscopic placement of the IGB filled to 500-600 cc. The balloon was removed at month 6, with regular office visits through 1 year.
Eighteen patients withdrew before treatment; 215 patients were evaluable at 6 months, 206 at 9 months, and 191 at 12 months. The mean baseline BMI was 35 kg/m2 and 90% of patients were female.
At 6 months, the mean percent total body weight loss was greater in the IGB group than the control group (about 10% vs. 4%; P < .001), Dr. Abu Dayyeh said, noting that total body weight loss was significantly higher in the balloon group at each time point: 3, 6, 9, and 12 months.
Similarly, the mean percent of excess weight loss at 6 months was better in the balloon group than in the control group (about 40% vs. 13%; P < .001). The majority of excess weight loss achieved at 6 months was also maintained at 12 months, he said.
At 9 months (3 months after device removal), 45.6% of patients in the IGB group had an excess weight loss at least 15% higher than patients in the control group, which exceeded the 30% threshold set as a primary study outcome, he said.
The mean percent excess weight loss was 26.5% at 9 months in the balloon group, which also exceeded the 25% threshold set as a second primary outcome.
This IGB system “appears to meet the thresholds set forth by the ASGE/ASMBS PIVI for endoscopic bariatric therapies intended as a primary obesity intervention,” Dr. Abu Dayyeh said.
The American Society for Gastrointestinal Endoscopy/American Society for Metabolic and Bariatric Surgery PIVI (Preservation and Incorporation of Valuable endoscopic Innovations) recommends that endoscopic bariatric therapies intended as a primary obesity intervention achieve a mean minimum threshold of 25% excess weight loss at 12 months.
At 52 weeks, both groups had an improvement from baseline in diabetes, hypertension, and lipids, but the improvement was greater with the IGB, he said.
Beck Depression Scores and quality of life also improved in both groups, with the improvement again greater with the IGB.
Serious adverse events were reported by 7% of controls and 9.6% of the balloon group including 8 early removals for intolerance, 1 gastric outlet obstruction, 1 laryngospasm during placement, 1 case of severe abdominal cramping, and 1 case of severe dehydration.
Early device removals occurred in 22% of patients, 15 for symptoms and 13 at subject request, Dr. Abu Dayyeh said. No deaths occurred in the trial.
*Changed on July 8, 2015.
On Twitter @pwendl
WASHINGTON – Obese patients implanted with an intragastric balloon lost significantly more weight than those following a behavioral modification program in a randomized, nonblinded trial.
Moreover, weight loss was preserved even after device removal, study author Dr. Barham Abu Dayyeh said at the annual Digestive Disease Week.
The Orbera intragastric balloon (Apollo Endosurgery) could fill a gap in the United States between obesity lifestyle interventions that are minimally effective and a range of bariatric surgical interventions that are effective, but come at a cost of increased complications and health care costs, he said. Moreover, only 1% of qualified patients actually end up having bariatric surgery.
The silicone, saline-filled intragastric balloon (IGB) has been widely used outside the U.S. for more than 17 years in more than 200,000 patients, added Dr. Abu Dayyeh* of Mayo Clinic in Rochester, Minn.
The multicenter trial was designed for premarketing approval in the U.S. of the Orbera IGB and randomly assigned 273 adults with a body mass index (BMI) of 30-40 kg/m2 for more than 2 years to a 12-month behavioral modification program with or without endoscopic placement of the IGB filled to 500-600 cc. The balloon was removed at month 6, with regular office visits through 1 year.
Eighteen patients withdrew before treatment; 215 patients were evaluable at 6 months, 206 at 9 months, and 191 at 12 months. The mean baseline BMI was 35 kg/m2 and 90% of patients were female.
At 6 months, the mean percent total body weight loss was greater in the IGB group than the control group (about 10% vs. 4%; P < .001), Dr. Abu Dayyeh said, noting that total body weight loss was significantly higher in the balloon group at each time point: 3, 6, 9, and 12 months.
Similarly, the mean percent of excess weight loss at 6 months was better in the balloon group than in the control group (about 40% vs. 13%; P < .001). The majority of excess weight loss achieved at 6 months was also maintained at 12 months, he said.
At 9 months (3 months after device removal), 45.6% of patients in the IGB group had an excess weight loss at least 15% higher than patients in the control group, which exceeded the 30% threshold set as a primary study outcome, he said.
The mean percent excess weight loss was 26.5% at 9 months in the balloon group, which also exceeded the 25% threshold set as a second primary outcome.
This IGB system “appears to meet the thresholds set forth by the ASGE/ASMBS PIVI for endoscopic bariatric therapies intended as a primary obesity intervention,” Dr. Abu Dayyeh said.
The American Society for Gastrointestinal Endoscopy/American Society for Metabolic and Bariatric Surgery PIVI (Preservation and Incorporation of Valuable endoscopic Innovations) recommends that endoscopic bariatric therapies intended as a primary obesity intervention achieve a mean minimum threshold of 25% excess weight loss at 12 months.
At 52 weeks, both groups had an improvement from baseline in diabetes, hypertension, and lipids, but the improvement was greater with the IGB, he said.
Beck Depression Scores and quality of life also improved in both groups, with the improvement again greater with the IGB.
Serious adverse events were reported by 7% of controls and 9.6% of the balloon group including 8 early removals for intolerance, 1 gastric outlet obstruction, 1 laryngospasm during placement, 1 case of severe abdominal cramping, and 1 case of severe dehydration.
Early device removals occurred in 22% of patients, 15 for symptoms and 13 at subject request, Dr. Abu Dayyeh said. No deaths occurred in the trial.
*Changed on July 8, 2015.
On Twitter @pwendl
WASHINGTON – Obese patients implanted with an intragastric balloon lost significantly more weight than those following a behavioral modification program in a randomized, nonblinded trial.
Moreover, weight loss was preserved even after device removal, study author Dr. Barham Abu Dayyeh said at the annual Digestive Disease Week.
The Orbera intragastric balloon (Apollo Endosurgery) could fill a gap in the United States between obesity lifestyle interventions that are minimally effective and a range of bariatric surgical interventions that are effective, but come at a cost of increased complications and health care costs, he said. Moreover, only 1% of qualified patients actually end up having bariatric surgery.
The silicone, saline-filled intragastric balloon (IGB) has been widely used outside the U.S. for more than 17 years in more than 200,000 patients, added Dr. Abu Dayyeh* of Mayo Clinic in Rochester, Minn.
The multicenter trial was designed for premarketing approval in the U.S. of the Orbera IGB and randomly assigned 273 adults with a body mass index (BMI) of 30-40 kg/m2 for more than 2 years to a 12-month behavioral modification program with or without endoscopic placement of the IGB filled to 500-600 cc. The balloon was removed at month 6, with regular office visits through 1 year.
Eighteen patients withdrew before treatment; 215 patients were evaluable at 6 months, 206 at 9 months, and 191 at 12 months. The mean baseline BMI was 35 kg/m2 and 90% of patients were female.
At 6 months, the mean percent total body weight loss was greater in the IGB group than the control group (about 10% vs. 4%; P < .001), Dr. Abu Dayyeh said, noting that total body weight loss was significantly higher in the balloon group at each time point: 3, 6, 9, and 12 months.
Similarly, the mean percent of excess weight loss at 6 months was better in the balloon group than in the control group (about 40% vs. 13%; P < .001). The majority of excess weight loss achieved at 6 months was also maintained at 12 months, he said.
At 9 months (3 months after device removal), 45.6% of patients in the IGB group had an excess weight loss at least 15% higher than patients in the control group, which exceeded the 30% threshold set as a primary study outcome, he said.
The mean percent excess weight loss was 26.5% at 9 months in the balloon group, which also exceeded the 25% threshold set as a second primary outcome.
This IGB system “appears to meet the thresholds set forth by the ASGE/ASMBS PIVI for endoscopic bariatric therapies intended as a primary obesity intervention,” Dr. Abu Dayyeh said.
The American Society for Gastrointestinal Endoscopy/American Society for Metabolic and Bariatric Surgery PIVI (Preservation and Incorporation of Valuable endoscopic Innovations) recommends that endoscopic bariatric therapies intended as a primary obesity intervention achieve a mean minimum threshold of 25% excess weight loss at 12 months.
At 52 weeks, both groups had an improvement from baseline in diabetes, hypertension, and lipids, but the improvement was greater with the IGB, he said.
Beck Depression Scores and quality of life also improved in both groups, with the improvement again greater with the IGB.
Serious adverse events were reported by 7% of controls and 9.6% of the balloon group including 8 early removals for intolerance, 1 gastric outlet obstruction, 1 laryngospasm during placement, 1 case of severe abdominal cramping, and 1 case of severe dehydration.
Early device removals occurred in 22% of patients, 15 for symptoms and 13 at subject request, Dr. Abu Dayyeh said. No deaths occurred in the trial.
*Changed on July 8, 2015.
On Twitter @pwendl
AT DDW® 2015
Key clinical point: An intragastric balloon system is an effective adjunct to lifestyle intervention for weight loss in obese patients with a BMI of 30-40 kg/m2.
Major finding: Mean percent excess weight loss at 6 months was about 40% for the intragastric balloon group vs. 13% for controls (P < .001).
Data source: Prospective, randomized, nonblinded study in 273 obese patients with a BMI of 30-40 kg/m2.
Disclosures: Apollo Endosurgery sponsored the study. Dr. Dayyeh reported financial relationships with Apollo Endosurgery, Aspire Bariatrics, and GI Dynamics.

Slower teen reaction times may increase anxiety and depression risk later in life
Adolescents with slower processing speeds and longer reaction times were at a greater risk of anxiety and depression later in life, according to Catharine R. Gale, Ph.D., of the University of Southampton (England) and her associates.
In this 20-year study of 705 males and females, longer reaction time at 16 years indicated a small but significant association with poorer mental health at age 36.
Adjusting for sex, parental social class, General Health Questionnaire (GHQ) score at age 16 years, health behaviors at age 36 years, and allostatic load had little effect on the association between reaction time and the GHQ score, but the association was weakened with Hospital Anxiety and Depression Scale (HADS) scores for both anxiety and depression. Smoking had a mediating effect on the HADS anxiety score, but not on the depression subscale.
“Further prospective studies of the relation between reaction time and mental health outcomes in other samples are needed to gauge whether reaction time is a true risk factor for mental disorders and to confirm the mediating roles played by smoking and allostatic load,” the investigators noted.
Find the full study in Psychosomatic Medicine (doi:10.1097/PSY.0000000000000189).
Adolescents with slower processing speeds and longer reaction times were at a greater risk of anxiety and depression later in life, according to Catharine R. Gale, Ph.D., of the University of Southampton (England) and her associates.
In this 20-year study of 705 males and females, longer reaction time at 16 years indicated a small but significant association with poorer mental health at age 36.
Adjusting for sex, parental social class, General Health Questionnaire (GHQ) score at age 16 years, health behaviors at age 36 years, and allostatic load had little effect on the association between reaction time and the GHQ score, but the association was weakened with Hospital Anxiety and Depression Scale (HADS) scores for both anxiety and depression. Smoking had a mediating effect on the HADS anxiety score, but not on the depression subscale.
“Further prospective studies of the relation between reaction time and mental health outcomes in other samples are needed to gauge whether reaction time is a true risk factor for mental disorders and to confirm the mediating roles played by smoking and allostatic load,” the investigators noted.
Find the full study in Psychosomatic Medicine (doi:10.1097/PSY.0000000000000189).
Adolescents with slower processing speeds and longer reaction times were at a greater risk of anxiety and depression later in life, according to Catharine R. Gale, Ph.D., of the University of Southampton (England) and her associates.
In this 20-year study of 705 males and females, longer reaction time at 16 years indicated a small but significant association with poorer mental health at age 36.
Adjusting for sex, parental social class, General Health Questionnaire (GHQ) score at age 16 years, health behaviors at age 36 years, and allostatic load had little effect on the association between reaction time and the GHQ score, but the association was weakened with Hospital Anxiety and Depression Scale (HADS) scores for both anxiety and depression. Smoking had a mediating effect on the HADS anxiety score, but not on the depression subscale.
“Further prospective studies of the relation between reaction time and mental health outcomes in other samples are needed to gauge whether reaction time is a true risk factor for mental disorders and to confirm the mediating roles played by smoking and allostatic load,” the investigators noted.
Find the full study in Psychosomatic Medicine (doi:10.1097/PSY.0000000000000189).
Study quantifies VTE risk with different birth control pills
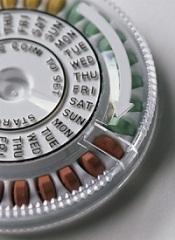
Results of a large, retrospective study support the association between newer contraceptive pills and a higher risk of venous thromboembolism (VTE).
The research showed that pills containing one of the newer types of progestogen—drospirenone, desogestrel, gestodene, and cyproterone—are associated with a nearly 2-fold higher risk of VTE than pills containing older progestogens—levonorgestrel, norethisterone, and norgestimate.
The researchers said this study has sufficient power to provide reliable comparative findings for different formulations of combined oral contraceptives. However, because it is an observational study, no definitive conclusions can be drawn about cause and effect.
The team described this research in BMJ alongside a related editorial.
Although the increased risk of VTE associated with combined oral contraceptives has been suggested previously, prior studies have used different methods to examine this link. So the relative risks associated with different combinations remain inconclusive.
Yana Vinogradova, of the University of Nottingham in the UK, and her colleagues tried to address these differences to help explain the range of results.
The team used prescription data from 2 large UK general practice databases to measure the associations between the use of combined oral contraceptives and the risk of VTE in women aged 15 to 49, adjusting for other known VTE risk factors.
The researchers matched 10,562 women with VTE to 42,034 control subjects and found that women who used any combined oral contraceptive within the past year had an increased risk of VTE compared with non-users of similar age and health status. The adjusted odds ratio was 2.97.
The risk of VTE was significantly higher for women who used the newer oral contraceptives than the older pills (P<0.001). The adjusted odds ratios were 4.28 for desogestrel, 4.27 for cyproterone, 4.12 for drospirenone, and 3.64 for gestodene, compared to 2.38 for levonorgestrel, 2.53 for norgestimate, and 2.56 for norethisterone.
The number of extra VTE cases per year per 10,000 treated women was lowest for levonorgestrel and norgestimate (6 cases for both) and highest for desogestrel and cyproterone (14 cases for both).
The researchers said that, although this is an observational study, it has produced the most reliable possible VTE risk estimates using currently available UK prescription data. 
Results of a large, retrospective study support the association between newer contraceptive pills and a higher risk of venous thromboembolism (VTE).
The research showed that pills containing one of the newer types of progestogen—drospirenone, desogestrel, gestodene, and cyproterone—are associated with a nearly 2-fold higher risk of VTE than pills containing older progestogens—levonorgestrel, norethisterone, and norgestimate.
The researchers said this study has sufficient power to provide reliable comparative findings for different formulations of combined oral contraceptives. However, because it is an observational study, no definitive conclusions can be drawn about cause and effect.
The team described this research in BMJ alongside a related editorial.
Although the increased risk of VTE associated with combined oral contraceptives has been suggested previously, prior studies have used different methods to examine this link. So the relative risks associated with different combinations remain inconclusive.
Yana Vinogradova, of the University of Nottingham in the UK, and her colleagues tried to address these differences to help explain the range of results.
The team used prescription data from 2 large UK general practice databases to measure the associations between the use of combined oral contraceptives and the risk of VTE in women aged 15 to 49, adjusting for other known VTE risk factors.
The researchers matched 10,562 women with VTE to 42,034 control subjects and found that women who used any combined oral contraceptive within the past year had an increased risk of VTE compared with non-users of similar age and health status. The adjusted odds ratio was 2.97.
The risk of VTE was significantly higher for women who used the newer oral contraceptives than the older pills (P<0.001). The adjusted odds ratios were 4.28 for desogestrel, 4.27 for cyproterone, 4.12 for drospirenone, and 3.64 for gestodene, compared to 2.38 for levonorgestrel, 2.53 for norgestimate, and 2.56 for norethisterone.
The number of extra VTE cases per year per 10,000 treated women was lowest for levonorgestrel and norgestimate (6 cases for both) and highest for desogestrel and cyproterone (14 cases for both).
The researchers said that, although this is an observational study, it has produced the most reliable possible VTE risk estimates using currently available UK prescription data.
Results of a large, retrospective study support the association between newer contraceptive pills and a higher risk of venous thromboembolism (VTE).
The research showed that pills containing one of the newer types of progestogen—drospirenone, desogestrel, gestodene, and cyproterone—are associated with a nearly 2-fold higher risk of VTE than pills containing older progestogens—levonorgestrel, norethisterone, and norgestimate.
The researchers said this study has sufficient power to provide reliable comparative findings for different formulations of combined oral contraceptives. However, because it is an observational study, no definitive conclusions can be drawn about cause and effect.
The team described this research in BMJ alongside a related editorial.
Although the increased risk of VTE associated with combined oral contraceptives has been suggested previously, prior studies have used different methods to examine this link. So the relative risks associated with different combinations remain inconclusive.
Yana Vinogradova, of the University of Nottingham in the UK, and her colleagues tried to address these differences to help explain the range of results.
The team used prescription data from 2 large UK general practice databases to measure the associations between the use of combined oral contraceptives and the risk of VTE in women aged 15 to 49, adjusting for other known VTE risk factors.
The researchers matched 10,562 women with VTE to 42,034 control subjects and found that women who used any combined oral contraceptive within the past year had an increased risk of VTE compared with non-users of similar age and health status. The adjusted odds ratio was 2.97.
The risk of VTE was significantly higher for women who used the newer oral contraceptives than the older pills (P<0.001). The adjusted odds ratios were 4.28 for desogestrel, 4.27 for cyproterone, 4.12 for drospirenone, and 3.64 for gestodene, compared to 2.38 for levonorgestrel, 2.53 for norgestimate, and 2.56 for norethisterone.
The number of extra VTE cases per year per 10,000 treated women was lowest for levonorgestrel and norgestimate (6 cases for both) and highest for desogestrel and cyproterone (14 cases for both).
The researchers said that, although this is an observational study, it has produced the most reliable possible VTE risk estimates using currently available UK prescription data.
FDA clears test to detect bacteria in platelets
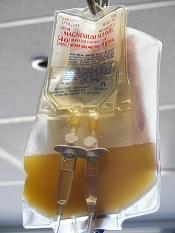
The US Food and Drug Administration (FDA) has expanded the authorized use of Verax Biomedical’s Platelet PGD Test, which detects bacteria in platelets intended for transfusion.
The FDA previously approved the test for leukocyte-reduced apheresis platelets (in 2007) and platelets derived from whole blood (in 2009).
Now, the test has been approved for pre-storage pooled platelets and apheresis platelets in platelet additive solution C (PAS-C) and plasma.
This makes the Platelet PGD Test the only rapid test on the market that can check every commonly distributed platelet type in the US, according to Verax Biomedical.
About the test
The Platelet PGD Test is an immunoassay used on the day of transfusion at the point of care—a hospital or transfusion service—to detect bacterial contamination in platelets to be transfused.
The test consists of a disposable plastic cartridge and 3 pretreatment reagents. To use, the tester pretreats a freshly collected platelet sample (500µL) and applies it to the sample well on the test cartridge.
Lights on the cartridge change from yellow to blue-violet when the test is ready to be interpreted, which is typically about 20 minutes after the sample is applied to the cartridge. The lights confirm that the appropriate volume of a sample was added and the testing is complete.
If the test is positive, a pink line will appear in 1 of the 2 windows on the cartridge. One window represents Gram-positive bacteria and the other Gram-negative. Non-reactive samples will have no line in either window.
Now that the FDA has expanded the indications for the Platelet PGD Test, it can be used as a quality control test for pools of up to 6 units of leukocyte-reduced and non-leukocyte-reduced whole-blood-derived platelets suspended in plasma that are pooled within 4 hours of transfusion.
The test can also be used within 24 hours of transfusion as a safety measure following testing with a growth-based, quality control test cleared by the FDA. For this indication, the Platelet PGD Test can be used with:
- Leukocyte-reduced apheresis platelets suspended in plasma
- Leukocyte-reduced apheresis platelets suspended in PAS-C and plasma
- Pre-storage pools of up to 6 leukocyte-reduced whole-blood-derived platelets suspended in plasma.
In studies conducted by Verax Biomedical (described in the summary document here), the Platelet PGD Test successfully detected bacteria in pre-storage pools of whole-blood derived platelets suspended in plasma and leukocyte-reduced apheresis platelets suspended in plasma or PAS-C and plasma.
The US Food and Drug Administration (FDA) has expanded the authorized use of Verax Biomedical’s Platelet PGD Test, which detects bacteria in platelets intended for transfusion.
The FDA previously approved the test for leukocyte-reduced apheresis platelets (in 2007) and platelets derived from whole blood (in 2009).
Now, the test has been approved for pre-storage pooled platelets and apheresis platelets in platelet additive solution C (PAS-C) and plasma.
This makes the Platelet PGD Test the only rapid test on the market that can check every commonly distributed platelet type in the US, according to Verax Biomedical.
About the test
The Platelet PGD Test is an immunoassay used on the day of transfusion at the point of care—a hospital or transfusion service—to detect bacterial contamination in platelets to be transfused.
The test consists of a disposable plastic cartridge and 3 pretreatment reagents. To use, the tester pretreats a freshly collected platelet sample (500µL) and applies it to the sample well on the test cartridge.
Lights on the cartridge change from yellow to blue-violet when the test is ready to be interpreted, which is typically about 20 minutes after the sample is applied to the cartridge. The lights confirm that the appropriate volume of a sample was added and the testing is complete.
If the test is positive, a pink line will appear in 1 of the 2 windows on the cartridge. One window represents Gram-positive bacteria and the other Gram-negative. Non-reactive samples will have no line in either window.
Now that the FDA has expanded the indications for the Platelet PGD Test, it can be used as a quality control test for pools of up to 6 units of leukocyte-reduced and non-leukocyte-reduced whole-blood-derived platelets suspended in plasma that are pooled within 4 hours of transfusion.
The test can also be used within 24 hours of transfusion as a safety measure following testing with a growth-based, quality control test cleared by the FDA. For this indication, the Platelet PGD Test can be used with:
- Leukocyte-reduced apheresis platelets suspended in plasma
- Leukocyte-reduced apheresis platelets suspended in PAS-C and plasma
- Pre-storage pools of up to 6 leukocyte-reduced whole-blood-derived platelets suspended in plasma.
In studies conducted by Verax Biomedical (described in the summary document here), the Platelet PGD Test successfully detected bacteria in pre-storage pools of whole-blood derived platelets suspended in plasma and leukocyte-reduced apheresis platelets suspended in plasma or PAS-C and plasma.
The US Food and Drug Administration (FDA) has expanded the authorized use of Verax Biomedical’s Platelet PGD Test, which detects bacteria in platelets intended for transfusion.
The FDA previously approved the test for leukocyte-reduced apheresis platelets (in 2007) and platelets derived from whole blood (in 2009).
Now, the test has been approved for pre-storage pooled platelets and apheresis platelets in platelet additive solution C (PAS-C) and plasma.
This makes the Platelet PGD Test the only rapid test on the market that can check every commonly distributed platelet type in the US, according to Verax Biomedical.
About the test
The Platelet PGD Test is an immunoassay used on the day of transfusion at the point of care—a hospital or transfusion service—to detect bacterial contamination in platelets to be transfused.
The test consists of a disposable plastic cartridge and 3 pretreatment reagents. To use, the tester pretreats a freshly collected platelet sample (500µL) and applies it to the sample well on the test cartridge.
Lights on the cartridge change from yellow to blue-violet when the test is ready to be interpreted, which is typically about 20 minutes after the sample is applied to the cartridge. The lights confirm that the appropriate volume of a sample was added and the testing is complete.
If the test is positive, a pink line will appear in 1 of the 2 windows on the cartridge. One window represents Gram-positive bacteria and the other Gram-negative. Non-reactive samples will have no line in either window.
Now that the FDA has expanded the indications for the Platelet PGD Test, it can be used as a quality control test for pools of up to 6 units of leukocyte-reduced and non-leukocyte-reduced whole-blood-derived platelets suspended in plasma that are pooled within 4 hours of transfusion.
The test can also be used within 24 hours of transfusion as a safety measure following testing with a growth-based, quality control test cleared by the FDA. For this indication, the Platelet PGD Test can be used with:
- Leukocyte-reduced apheresis platelets suspended in plasma
- Leukocyte-reduced apheresis platelets suspended in PAS-C and plasma
- Pre-storage pools of up to 6 leukocyte-reduced whole-blood-derived platelets suspended in plasma.
In studies conducted by Verax Biomedical (described in the summary document here), the Platelet PGD Test successfully detected bacteria in pre-storage pools of whole-blood derived platelets suspended in plasma and leukocyte-reduced apheresis platelets suspended in plasma or PAS-C and plasma.
Team says delayed cord clamping can’t hurt

Photo by Meutia Chaerani
and Indradi Soemardjan
New research suggests that delayed umbilical cord clamping in full-term infants may confer some minor long-term benefits and, at the very least, does not pose any harm.
Delayed clamping did not appear to have a significant effect on most of the mental and physical measures assessed in the study.
It was associated with improved scores in fine-motor skills and social skills at age 4, but these effects only occurred in boys.
Researchers reported these results in JAMA Pediatrics alongside a related editorial.
Previous research has shown that delaying umbilical cord clamping by 2 to 3 minutes after delivery allows fetal blood remaining in the placental circulation to be transfused back to the newborn, and this is associated with improved iron status at 4 to 6 months of age.
However, there is a lack of knowledge regarding the long-term effects of delayed clamping. So policymakers have been hesitant about making clear recommendations regarding cord clamping in full-term infants.
To gain more insight, Ola Andersson, MD, PhD, of Uppsala University in Sweden, and his colleagues performed follow-up assessments of 263 children who were previously enrolled in a randomized trial of cord clamping in full-term infants born in a Swedish hospital.
The team assessed the effects of delayed cord clamping on childhood development at age 4. Delayed clamping (n=141) was defined as occurring 3 or more minutes after delivery, and early clamping (n=122) was defined as occurring 10 seconds or fewer after delivery.
The researchers evaluated child behavior and development using parents’ responses on the Ages and Stages Questionnaire, Third Edition (ASQ), which is used to assess communication, motor skills, and other measures; and the Strengths and Difficulties Questionnaire, which is used to score children’s emotional difficulties, hyperactivity, and other difficulties.
A blinded psychologist also assessed children’s scores on the Wechsler Preschool and Primary Scale of Intelligence (WPPSI-III), which is used to assess IQ and similar measures, and the Movement Assessment Battery for Children (Movement ABC), which is used to assess manual dexterity and similar measures.
The researchers found no significant differences between the delayed and early clamping groups with regard to results on the WPPSI-III or the Movement ABC.
However, delayed clamping was associated with a significant improvement over early clamping in ASQ personal-social scores (adjusted mean difference [AMD]=2.8, P=0.006), fine-motor scores (AMD=2.1, P=0.03), and the Strengths and Difficulties Questionnaire prosocial subscale (AMD=0.5, P=0.05).
When the researchers assessed the children according to sex, they found that significant improvements associated with delayed clamping were only present in males.
Males in the delayed clamping group had significantly higher mean scores in tasks involving fine-motor function, including the WPPSI-III processing-speed quotient (AMD=4.2, P=0.02), the Movement ABC bicycle-trail task (AMD=0.8, P=0.03), and fine-motor scores on the ASQ (AMD=4.7, P=0.01). These boys also had significantly higher personal-social scores on the ASQ (AMD=4.9, P=0.004).
The researchers concluded that, although delayed cord clamping and early clamping resulted in similar overall neurodevelopment and behavior among 4-year-old children, there were differences in this study. And this suggests there are some positive, and no harmful, long-term effects of delayed cord clamping.
Photo by Meutia Chaerani
and Indradi Soemardjan
New research suggests that delayed umbilical cord clamping in full-term infants may confer some minor long-term benefits and, at the very least, does not pose any harm.
Delayed clamping did not appear to have a significant effect on most of the mental and physical measures assessed in the study.
It was associated with improved scores in fine-motor skills and social skills at age 4, but these effects only occurred in boys.
Researchers reported these results in JAMA Pediatrics alongside a related editorial.
Previous research has shown that delaying umbilical cord clamping by 2 to 3 minutes after delivery allows fetal blood remaining in the placental circulation to be transfused back to the newborn, and this is associated with improved iron status at 4 to 6 months of age.
However, there is a lack of knowledge regarding the long-term effects of delayed clamping. So policymakers have been hesitant about making clear recommendations regarding cord clamping in full-term infants.
To gain more insight, Ola Andersson, MD, PhD, of Uppsala University in Sweden, and his colleagues performed follow-up assessments of 263 children who were previously enrolled in a randomized trial of cord clamping in full-term infants born in a Swedish hospital.
The team assessed the effects of delayed cord clamping on childhood development at age 4. Delayed clamping (n=141) was defined as occurring 3 or more minutes after delivery, and early clamping (n=122) was defined as occurring 10 seconds or fewer after delivery.
The researchers evaluated child behavior and development using parents’ responses on the Ages and Stages Questionnaire, Third Edition (ASQ), which is used to assess communication, motor skills, and other measures; and the Strengths and Difficulties Questionnaire, which is used to score children’s emotional difficulties, hyperactivity, and other difficulties.
A blinded psychologist also assessed children’s scores on the Wechsler Preschool and Primary Scale of Intelligence (WPPSI-III), which is used to assess IQ and similar measures, and the Movement Assessment Battery for Children (Movement ABC), which is used to assess manual dexterity and similar measures.
The researchers found no significant differences between the delayed and early clamping groups with regard to results on the WPPSI-III or the Movement ABC.
However, delayed clamping was associated with a significant improvement over early clamping in ASQ personal-social scores (adjusted mean difference [AMD]=2.8, P=0.006), fine-motor scores (AMD=2.1, P=0.03), and the Strengths and Difficulties Questionnaire prosocial subscale (AMD=0.5, P=0.05).
When the researchers assessed the children according to sex, they found that significant improvements associated with delayed clamping were only present in males.
Males in the delayed clamping group had significantly higher mean scores in tasks involving fine-motor function, including the WPPSI-III processing-speed quotient (AMD=4.2, P=0.02), the Movement ABC bicycle-trail task (AMD=0.8, P=0.03), and fine-motor scores on the ASQ (AMD=4.7, P=0.01). These boys also had significantly higher personal-social scores on the ASQ (AMD=4.9, P=0.004).
The researchers concluded that, although delayed cord clamping and early clamping resulted in similar overall neurodevelopment and behavior among 4-year-old children, there were differences in this study. And this suggests there are some positive, and no harmful, long-term effects of delayed cord clamping.
Photo by Meutia Chaerani
and Indradi Soemardjan
New research suggests that delayed umbilical cord clamping in full-term infants may confer some minor long-term benefits and, at the very least, does not pose any harm.
Delayed clamping did not appear to have a significant effect on most of the mental and physical measures assessed in the study.
It was associated with improved scores in fine-motor skills and social skills at age 4, but these effects only occurred in boys.
Researchers reported these results in JAMA Pediatrics alongside a related editorial.
Previous research has shown that delaying umbilical cord clamping by 2 to 3 minutes after delivery allows fetal blood remaining in the placental circulation to be transfused back to the newborn, and this is associated with improved iron status at 4 to 6 months of age.
However, there is a lack of knowledge regarding the long-term effects of delayed clamping. So policymakers have been hesitant about making clear recommendations regarding cord clamping in full-term infants.
To gain more insight, Ola Andersson, MD, PhD, of Uppsala University in Sweden, and his colleagues performed follow-up assessments of 263 children who were previously enrolled in a randomized trial of cord clamping in full-term infants born in a Swedish hospital.
The team assessed the effects of delayed cord clamping on childhood development at age 4. Delayed clamping (n=141) was defined as occurring 3 or more minutes after delivery, and early clamping (n=122) was defined as occurring 10 seconds or fewer after delivery.
The researchers evaluated child behavior and development using parents’ responses on the Ages and Stages Questionnaire, Third Edition (ASQ), which is used to assess communication, motor skills, and other measures; and the Strengths and Difficulties Questionnaire, which is used to score children’s emotional difficulties, hyperactivity, and other difficulties.
A blinded psychologist also assessed children’s scores on the Wechsler Preschool and Primary Scale of Intelligence (WPPSI-III), which is used to assess IQ and similar measures, and the Movement Assessment Battery for Children (Movement ABC), which is used to assess manual dexterity and similar measures.
The researchers found no significant differences between the delayed and early clamping groups with regard to results on the WPPSI-III or the Movement ABC.
However, delayed clamping was associated with a significant improvement over early clamping in ASQ personal-social scores (adjusted mean difference [AMD]=2.8, P=0.006), fine-motor scores (AMD=2.1, P=0.03), and the Strengths and Difficulties Questionnaire prosocial subscale (AMD=0.5, P=0.05).
When the researchers assessed the children according to sex, they found that significant improvements associated with delayed clamping were only present in males.
Males in the delayed clamping group had significantly higher mean scores in tasks involving fine-motor function, including the WPPSI-III processing-speed quotient (AMD=4.2, P=0.02), the Movement ABC bicycle-trail task (AMD=0.8, P=0.03), and fine-motor scores on the ASQ (AMD=4.7, P=0.01). These boys also had significantly higher personal-social scores on the ASQ (AMD=4.9, P=0.004).
The researchers concluded that, although delayed cord clamping and early clamping resulted in similar overall neurodevelopment and behavior among 4-year-old children, there were differences in this study. And this suggests there are some positive, and no harmful, long-term effects of delayed cord clamping.
Histone variant may contribute to lymphoma

Image by Eric Smith
Researchers say they have identified histone chaperones that play an important role in the structure of chromatin.
The team believes this finding, published in Molecular Cell, could lead to a better understanding of lymphomas and other cancers.
“Maintaining an appropriate chromatin structure is essential for normal development, and, not surprisingly, defects in chromatin components can lead to several diseases,” said study author François Robert, PhD, of Institut de Recherches Cliniques de Montréal in Québec, Canada.
In studying chromatin, Dr Robert and his colleagues have been interested in a histone variant called H2A.Z.
The researchers knew that H2A.Z is incorporated into promoter regions of the gene by SWR-C-related chromatin remodeling complexes, but they wanted to determine if H2A.Z is actively excluded from non-promoter regions.
“With this study, we discovered that 2 other proteins, FACT and Spt6, play an important role in the location of H2A.Z,” said Célia Jeronimo, PhD, a research associate in Dr Robert’s lab.
The team found that FACT and SPt6 both help keep H2A.Z from accumulating in intragenic regions. When either histone chaperone is absent, H2A.Z is mislocalized, which alters chromatin composition and contributes to cryptic transcription.
“Inappropriate H2A.Z localization has previously been observed in cancer cells, but little was understood about the consequences of this phenomenon,” Dr Robert said.
“Although our study was performed in yeast cells, it suggests that mislocalization of H2A.Z may lead to cryptic transcription in some types of cancer such as lymphoma, and this may contribute to the disease. Our next step is therefore to investigate the possible role of H2A.Z and its associated gene expression defects in cancer cells.”
Image by Eric Smith
Researchers say they have identified histone chaperones that play an important role in the structure of chromatin.
The team believes this finding, published in Molecular Cell, could lead to a better understanding of lymphomas and other cancers.
“Maintaining an appropriate chromatin structure is essential for normal development, and, not surprisingly, defects in chromatin components can lead to several diseases,” said study author François Robert, PhD, of Institut de Recherches Cliniques de Montréal in Québec, Canada.
In studying chromatin, Dr Robert and his colleagues have been interested in a histone variant called H2A.Z.
The researchers knew that H2A.Z is incorporated into promoter regions of the gene by SWR-C-related chromatin remodeling complexes, but they wanted to determine if H2A.Z is actively excluded from non-promoter regions.
“With this study, we discovered that 2 other proteins, FACT and Spt6, play an important role in the location of H2A.Z,” said Célia Jeronimo, PhD, a research associate in Dr Robert’s lab.
The team found that FACT and SPt6 both help keep H2A.Z from accumulating in intragenic regions. When either histone chaperone is absent, H2A.Z is mislocalized, which alters chromatin composition and contributes to cryptic transcription.
“Inappropriate H2A.Z localization has previously been observed in cancer cells, but little was understood about the consequences of this phenomenon,” Dr Robert said.
“Although our study was performed in yeast cells, it suggests that mislocalization of H2A.Z may lead to cryptic transcription in some types of cancer such as lymphoma, and this may contribute to the disease. Our next step is therefore to investigate the possible role of H2A.Z and its associated gene expression defects in cancer cells.”
Image by Eric Smith
Researchers say they have identified histone chaperones that play an important role in the structure of chromatin.
The team believes this finding, published in Molecular Cell, could lead to a better understanding of lymphomas and other cancers.
“Maintaining an appropriate chromatin structure is essential for normal development, and, not surprisingly, defects in chromatin components can lead to several diseases,” said study author François Robert, PhD, of Institut de Recherches Cliniques de Montréal in Québec, Canada.
In studying chromatin, Dr Robert and his colleagues have been interested in a histone variant called H2A.Z.
The researchers knew that H2A.Z is incorporated into promoter regions of the gene by SWR-C-related chromatin remodeling complexes, but they wanted to determine if H2A.Z is actively excluded from non-promoter regions.
“With this study, we discovered that 2 other proteins, FACT and Spt6, play an important role in the location of H2A.Z,” said Célia Jeronimo, PhD, a research associate in Dr Robert’s lab.
The team found that FACT and SPt6 both help keep H2A.Z from accumulating in intragenic regions. When either histone chaperone is absent, H2A.Z is mislocalized, which alters chromatin composition and contributes to cryptic transcription.
“Inappropriate H2A.Z localization has previously been observed in cancer cells, but little was understood about the consequences of this phenomenon,” Dr Robert said.
“Although our study was performed in yeast cells, it suggests that mislocalization of H2A.Z may lead to cryptic transcription in some types of cancer such as lymphoma, and this may contribute to the disease. Our next step is therefore to investigate the possible role of H2A.Z and its associated gene expression defects in cancer cells.”
Improving Patient Satisfaction
INTRODUCTION
Patient experience and satisfaction is intrinsically valued, as strong physician‐patient communication, empathy, and patient comfort require little justification. However, studies have also shown that patient satisfaction is associated with better health outcomes and greater compliance.[1, 2, 3] A systematic review of studies linking patient satisfaction to outcomes found that patient experience is positively associated with patient safety, clinical effectiveness, health outcomes, adherence, and lower resource utilization.[4] Of 378 associations studied between patient experience and health outcomes, there were 312 positive associations.[4] However, not all studies have shown a positive association between patient satisfaction and outcomes.
Nevertheless, hospitals now have to strive to improve patient satisfaction, as Centers for Medicare & Medicaid Services (CMS) has introduced Hospital Value‐Based Purchasing. CMS started to withhold Medicare Severity Diagnosis‐Related Groups payments, starting at 1.0% in 2013, 1.25% in 2014, and increasing to 2.0% in 2017. This money is redistributed based on performance on core quality measures, including patient satisfaction measured through the Hospital Consumer Assessment of Healthcare Providers and Systems (HCAHPS) survey.[5]
Various studies have evaluated interventions to improve patient satisfaction, but to our knowledge, no study published in a peer‐reviewed research journal has shown a significant improvement in HCAHPS scores.[6, 7, 8, 9, 10, 11, 12] Levinson et al. argue that physician communication skills should be taught during residency, and that individualized feedback is an effective way to allow physicians to track their progress over time and compared to their peers.[13] We thus aimed to evaluate an intervention to improve patient satisfaction designed by the Patient Affairs Department for Ronald Reagan University of California, Los Angeles (UCLA) Medical Center (RRUCLAMC) and the UCLA Department of Medicine.
METHODOLOGY
Design Overview
The intervention for the IM residents consisted of education on improving physician‐patient communication provided at a conference, frequent individualized patient feedback, and an incentive program in addition to existing patient satisfaction training. The results of the intervention were measured by comparing the postintervention HCAHPS scores in the Department of Medicine versus the rest of the hospital and the national averages.
Setting and Participants
The study setting was RRUCLAMC, a large university‐affiliated academic center. The internal medicine (IM) residents and patients in the Department of Medicine were in the intervention cohort. The residents in all other departments that were involved with direct adult patient care and their patients were the control cohort. Our intervention targeted resident physicians because they were most involved in the majority of direct patient care at RRUCLAMC. Residents are in house 24 hours a day, are the first line of contact for nurses and patients, and provide the most continuity, as attendings often rotate every 1 to 2 weeks, but residents are on service for at least 2 to 4 weeks for each rotation. IM residents are on all inpatient general medicine, critical care, and cardiology services at RRUCLAMC. RRUMCLA does not have a nonteaching service for adult IM patients.
Interventions
Since 2006, there has been a program at RRUCLAMC called Assessing Residents' CICARE (ARC). CICARE is an acronym that represents UCLA's patient communication model and training elements (Connect with patients, Introduce yourself and role, Communicate, Ask and anticipate, Respond, Exit courteously). The ARC program consists of trained undergraduate student volunteers surveying hospitalized patients with an optional and anonymous survey regarding specific resident physician's communication skills (see Supporting Information, Appendix A, in the online version of this article). Patients were randomly selected for the ARC and HCAHPS survey, but they were selected separately for each survey. There may have been some overlap between patients selected for ARC and HCAHPS surveys. Residents received feedback from 7 to 10 patients a year on average.
The volunteers show the patients a picture of individual resident physicians assigned to their care to confirm the resident's identity. The volunteer then asks 18 multiple‐choice questions about their physician‐patient communication skills. The patients are also asked to provide general comments regarding the resident physician.[14] The patients were interviewed in private hospital rooms by ARC volunteers. No information linking the patient to the survey is recorded. Survey data are entered into a database, and individual residents are assigned a code that links them to their patient feedback. These survey results and comments are sent to the program directors of the residency programs weekly. However, a review of the practice revealed that results were only reviewed semiannually by the residents with their program director.
Starting December 2011, the results of the ARC survey were directly e‐mailed to the interns and residents in the Department of Medicine in real time while they were on general medicine wards and the cardiology inpatient service at RRUCLAMC. Residents in other departments at RRUCLAMC continued to review the patient feedback with program directors at most biannually. This continued until June 2012 and had to be stopped during July 2012 because many of the CICARE volunteers were away on summer break.
Starting January 2012, IM residents who stood out in the ARC survey received a Commendation of Excellence. Each month, 3 residents were selected for this award based on their patient comments and if they had over 90% overall satisfaction on the survey questions. These residents received department‐wide recognition via e‐mail and a movie package (2 movie tickets, popcorn, and a drink) as a reward.
In January 2012, a 1‐hour lunchtime conference was held for IM residents to discuss best practices in physician‐patient communication, upcoming changes with Hospital Value‐Based Purchasing, and strengths and weaknesses of the Department of Medicine in patient communication. About 50% of the IM residents included in the study arm were not able to attend the education session and so no universal training was provided.
Outcomes
We analyzed the before and after intervention impact on the HCAHPS results. HCAHPS is a standardized national survey measuring patient perspectives after they are discharged from hospitals across the nation. The survey addresses communication with doctors and nurses, responsiveness of hospital staff, pain management, communication about medicines, discharge information, cleanliness of the hospital environment, and quietness of the hospital environment. The survey also includes demographic questions.[15]
Our analysis focused on the following specific questions: Would you recommend this hospital to your friends and family? During this hospital stay, how often did doctors: (1) treat you with courtesy and respect, (2) listen carefully to you, and (3) explain things in a way you could understand? Responders who did not answer all of the above questions were excluded.
Our outcomes focused on the change from January to June 2011 to January to June 2012, during which time the intervention was ongoing. We did not include data past July 2012 in the primary outcome, because the intervention did not continue due to volunteers being away for summer break. In addition, July also marks the time when the third‐year IM residents graduate and the new interns start. Thus, one‐third of the residents in the IM department had never been exposed to the intervention after June of 2012.
Statistical Analysis
We used a difference‐in‐differences regression analysis (DDRA) for these outcomes and controlled for other covariates in the patient populations to predict adjusted probabilities for each of the outcomes studied. The key predictors in the models were indicator variables for year (2011, 2012) and service (IM, all others) and an interaction between year and service. We controlled for perceived patient health, admission through emergency room (ER), age, race, patient education level, intensive care unit (ICU) stay, length of stay, and gender.[16] We calculated adjusted probabilities for each level of the interaction between service and year, holding all controls at their means. The 95% confidence intervals for these predictions were generated using the delta method.
We compared the changes in HCAHPS results for the RRUCLAMC Department of Medicine patients with all other RRUCLAMC department patients and to the national averages. We only had access to national average point estimates and not individual responses from the national sample and so were unable to do statistical analysis involving the national cohort. The prespecified significant P value was 0.05. Stata 13 (StataCorp, College Station, TX) was used for statistical analysis. The study received institutional review board exempt status.
RESULTS
Sample Size and Excluded Cases
There were initially 3637 HCAHPS patient cases. We dropped all HCAHPS cases that were missing values for outcome or demographic/explanatory variables. We dropped 226 cases due to 1 or more missing outcome variables, and we dropped 322 cases due to 1 or more missing demographic/explanatory variables. This resulted in 548 total dropped cases and a final sample size of 3089 (see Supporting Information, Appendix B, in the online version of this article). Of the 548 dropped cases, 228 cases were in the IM cohort and 320 cases from the rest of the hospital. There were 993 patients in the UCLA IM cohort and 2096 patients in the control cohort from all other UCLA adult departments. Patients excluded due to missing data were similar to the patients included in the final analysis except for 2 differences. Patients excluded were older (63 years vs 58 years, P<0.01) and more likely to have been admitted from the ER (57.4% vs 39.6%, P<0.01) than the patients we had included.
Patient Characteristics
The patient population demographics from all patients discharged from RRUCLAMC who completed HCAHPS surveys January to June 2011 and 2012 are displayed in Table 1. In both 2011 and 2012, the patients in the IM cohort were significantly older, more likely to be male, had lower perceived health, and more likely to be admitted through the emergency room than the HCAHPS patients in all other UCLA adult departments. In 2011, the IM cohort had a lower percentage of patients than the non‐IM cohort that required an ICU stay (8.0% vs 20.5%, P<0.01), but there was no statistically significant difference in 2012 (20.6% vs 20.8%, P=0.9). Other than differences in ICU stay, the demographic characteristics from 2011 to 2012 did not change in the intervention and control cohorts. The response rate for UCLA on HCAHPS during the study period was 29%, consistent with national results.[17, 18]
| 2011 | 2012 | |||||
|---|---|---|---|---|---|---|
| UCLA Internal Medicine | All Other UCLA Adult Departments | P | UCLA Internal Medicine | All Other UCLA Adult Departments | P | |
| ||||||
| Total no. | 465 | 865 | 528 | 1,231 | ||
| Age, y | 62.8 | 55.3 | <0.01 | 65.1 | 54.9 | <0.01 |
| Length of stay, d | 5.7 | 5.7 | 0.94 | 5.8 | 4.9 | 0.19 |
| Gender, male | 56.6 | 44.1 | <0.01 | 55.3 | 41.4 | <0.01 |
| Education (4 years of college or greater) | 47.3 | 49.3 | 0.5 | 47.3 | 51.3 | 0.13 |
| Patient‐perceived overall health (responding very good or excellent) | 30.5 | 55.0 | <0.01 | 27.5 | 58.2 | <0.01 |
| Admission through emergency room, yes | 75.5 | 23.8 | <0.01 | 72.4 | 23.1 | <0.01 |
| Intensive care unit, yes | 8.0 | 20.5 | <0.01 | 20.6 | 20.8 | 0.9 |
| Ethnicity (non‐Hispanic white) | 63.2 | 61.4 | 0.6 | 62.5 | 60.9 | 0.5 |
Difference‐in‐Differences Regression Analysis
The adjusted results of the DDRA for the physician‐related HCAHPS questions are presented in Table 2. The adjusted results for the percentage of patients responding positively to all 3 physician‐related HCAHPS questions in the DDRA increased by 8.1% in the IM cohort (from 65.7% to 73.8%) and by 1.5% in the control cohort (from 64.4% to 65.9%) (P=0.04). The adjusted results for the percentage of patients responding always to How often did doctors treat you with courtesy and respect? in the DDRA increased by 5.1% (from 83.8% to 88.9%) in the IM cohort and by 1.0% (from 83.3% to 84.3%) in the control cohort (P=0.09). The adjusted results for the percentage of patients responding always to Does your doctor listen carefully to you? in the DDRA increased by 6.0% in the IM department (75.6% to 81.6%) and by 1.2% (75.2% to 76.4%) in the control (P=0.1). The adjusted results for the percentage of patients responding always to Does your doctor explain things in a way you could understand? in the DDRA increased by 7.8% in the IM department (from 72.1% to 79.9%) and by 1.0% in the control cohort (from 72.2% to 73.2%) (P=0.03). There was no more than 3.1% absolute increase in any of the 4 questions in the national average. There was also a significant improvement in percentage of patients who would definitely recommend this hospital to their friends and family. The adjusted results in the DDRA for the percentage of patients responding that they would definitely recommend this hospital increased by 7.1% in the IM cohort (from 82.7% to 89.8%) and 1.5% in the control group (from 84.1% to 85.6%) (P=0.02).
| UCLA IM | All Other UCLA Adult Departments | National Average | |
|---|---|---|---|
| |||
| % Patients responding that their doctors always treated them with courtesy and respect | |||
| January to June 2011, preintervention (95% CI) | 83.8 (80.587.1) | 83.3 (80.785.9) | 82.4 |
| January to June 2012, postintervention | 88.9 (86.391.4) | 84.3 (82.186.5) | 85.5 |
| Change from 2011 to 2012, January to June | 5.1 | 1.0 | 3.1 |
| Change in UCLA IM minus change in all other UCLA adult departments, difference in differences | 4.1 | ||
| P value of difference in differences between IM and the rest of the hospital | 0.09 | ||
| % Patients responding that their doctors always listened carefully | |||
| January to June 2011, preintervention (95% CI) | 75.6 (71.779.5) | 75.2 (72.278.1) | 76.4 |
| January to June 2012, postintervention (95% CI) | 81.6 (78.484.8) | 76.4 (73.978.9) | 73.7 |
| Change from 2011 to 2012, January to June | 6.0 | 1.2 | 2.7 |
| Change in UCLA IM minus change in all other UCLA adult departments, difference in differences | 4.6 | ||
| P value of difference in differences between IM and the rest of the hospital | 0.1 | ||
| % Patients responding that their doctors always explained things in a way they could understand | |||
| January to June 2011, preintervention (95% CI) | 72.1 (6876.1) | 72.2 (69.275.4) | 70.1 |
| January to June 2012, postintervention | 79.9 (76.683.1) | 73.2 (70.675.8) | 72.2 |
| Change from 2011 to 2012, January to June | 7.8 | 1.0 | 2.1 |
| Change in UCLA IM minus change in all other UCLA adult departments, difference in differences | 6.8 | ||
| P value of difference in differences between IM and the rest of the hospital | 0.03 | ||
| % Patients responding "always" for all 3 physician‐related HCAHPS questions | |||
| January to June 2011, preintervention (95% CI) | 65.7 (61.370.1) | 64.4 (61.267.7) | 80.1 |
| January to June 2012, postintervention | 73.8 (70.177.5) | 65.9 (63.168.6) | 87.8 |
| Change from 2011 to 2012, January to June | 8.1 | 1.5 | 7.7 |
| Change in UCLA IM minus change in all other UCLA adult departments, difference in differences | 6.6 | ||
| P value of difference in differences between IM and the rest of the hospital | 0.04 | ||
| % Patients who would definitely recommend this hospital to their friends and family | |||
| January to June 2011, preintervention (95% CI) | 82.7 (79.386.1) | 84.1 (81.586.6) | 68.8 |
| January to June 2012, postintervention | 89.8 (87.392.3) | 85.6 (83.587.7) | 71.2 |
| Change from 2011 to 2012, January to June | 7.1 | 1.5 | 2.4 |
| Change in UCLA IM minus change in all other UCLA adult departments, difference in differences | 5.6 | ||
| P value of difference in differences between IM and the rest of the hospital | 0.02 | ||
DISCUSSION
Our intervention, which included real‐time feedback to physicians on results of the patient survey, monthly recognition of physicians who stood out on this survey, and an educational conference, was associated with a clear improvement in patient satisfaction with physician‐patient communication and overall recommendation of the hospital. These results are significant because they demonstrate a cost‐effective intervention that can be applied to academic hospitals across the country with the use of nonmedically trained volunteers, such as the undergraduate volunteers involved in our program. The limited costs associated with the intervention were the time in managing the volunteers and movie package award ($20). To our knowledge, it is the first study published in a peer‐reviewed research journal that has demonstrated an intervention associated with significant improvements in HCAHPS scores, the standard by which CMS reimbursement will be affected.
The improvements associated with this intervention could be very valuable to hospitals and patient care. The positive correlation of higher patient satisfaction with improved outcomes suggests this intervention may have additional benefits.[4] Last, these improvements in patient satisfaction in the HCAHPS scores could minimize losses to hospital revenue, as hospitals with low patient‐satisfaction scores will be penalized.
There was a statistically significant improvement in adjusted scores for the question Did your physicians explain things understandably? with patients responding always to all 3 physician‐related HCAHPS questions and Would you recommend this hospital to friends and family. The results for the 2 other physician‐related questions (Did your doctor explain things understandably? and Did your doctor listen carefully?) did show a trend toward significance, with p values of <0.1, and a larger study may have been better powered to detect a statistically significant difference. The improvement in response to the adjusted scores for the question Did your physicians explain things understandably? was the primary driver in the improvement in the adjusted percentage of patients who responded always to all 3 physician‐related HCAHPS questions. This was likely because the IM cohort had the lowest score on this question, and so the feedback to the residents may have helped to address this area of weakness. The UCLA IM HCAHPS scores prior to 2012 have always been lower than other programs at UCLA. As a result, we do not believe the change was due to a regression to the mean.
We believe that the intervention had a positive effect on patient satisfaction for several reasons. The regular e‐mails with the results of the survey may have served as a reminder to residents that patient satisfaction was being monitored and linked to them. The immediate and individualized feedback also may have facilitated adjustments of clinical practice in real time. The residents were able to compare their own scores and comments to the anonymous results of their peers. The monthly department‐wide recognition for residents who excelled in patient communication may have created an incentive and competition among the residents. It is possible that there may be an element of the Hawthorne effect that explained the improvement in HCAHPS scores. However, all of the residents in the departments studied were already being measured through the ARC survey. The primary change was more frequent reporting of ARC survey results, and so we believe that perception of measurement alone was less likely driving the results. The findings from this study are similar to those from provider‐specific report cards, which have shown that outcomes can be improved by forcing greater accountability and competition among physicians.[19]
Brown et al. demonstrated that 2, 4‐hour physician communication workshops in their study had no impact on patient satisfaction, and so we believe that our 1‐hour workshop with only 50% attendance had minimal impact on the improved patient satisfaction scores in our study.[20] Our intervention also coincided with the implementation of the Accreditation Council for Graduate Medical Education (ACGME) work‐hour restrictions implemented in July 2011. These restrictions limited residents to 80 hours per week, intern duty periods were restricted to 16 hours and residents to 28 hours, and interns and residents required 8 to 10 hours free of duty between scheduled duty periods.[21] One of the biggest impacts of ACGME work‐hour restrictions was that interns were doing more day and night shifts rather than 28‐hour calls. However, these work‐hour restrictions were the same for all specialties and so were unlikely to explain the improved patient satisfaction associated with our intervention.
Our study has limitations. The study was a nonrandomized pre‐post study. We attempted to control for the differences in the cohorts with a multivariable regression analysis, but there may be unmeasured differences that we were unable to control for. Due to deidentification of the data, we could only control for patient health based on patient perceived health. In addition, the percentage of patients requiring ICU care in the IM cohort was higher in 2012 than in 2011. We did not identify differences in outcomes from analyses stratified by ICU or non‐ICU patients. In addition, patients who were excluded because of missing outcomes were more likely to be older and admitted through the ER. Further investigation would be needed to see if the findings of this study could be extended to other clinical situations.
In conclusion, our study found an intervention program that was associated with a significant improvement in patient satisfaction in the intervention cohort, even after adjusting for differences in the patient population, whereas there was no change in the control group. This intervention can serve as a model for academic hospitals to improve patient satisfaction, avoid revenue loss in the era of Hospital Value‐Based Purchasing, and to train the next generation of physicians on providing patient‐centered care.
Disclosure
This work was supported by the Beryl Institute and UCLA QI Initiative.
- , , , , . Relationship between patient satisfaction with inpatient care and hospital readmission within 30 Days. Am J Manag Care. 2011;17:41–48.
- , , , . Patients' Perception of Hospital Care in the United States. N Engl J Med. 2008;359:1921–1931.
- , , , et al. Patient satisfaction and its relationship with clinical quality and inpatient mortality in acute myocardial infarction. Circ Cardiovasc Qual Outcomes. 2010;3:188–195.
- , , . A systematic review of evidence on the links between patient experience and clinical safety and effectiveness. BMJ Open. 2013;3(1).
- Centers for Medicare 70:729–732.
- , , , . Emergency department patient satisfaction: customer service training improves patient satisfaction and ratings of physician and nurse skill. J Healthc Manag. 1998;43:427–440; discussion 441–442.
- , , . Emergency department information: does it effect patients' perception and satisfaction about the care given in an emergency department? Eur J Emerg Med 1999;6:245–248.
- . Can communication skills workshops for emergency department doctors improve patient satisfaction? J Accid Emerg Med. 2000;17:251–253.
- , , , . Effects of a physician communication intervention on patient care outcomes. J Gen Intern Med. 1996;11:147–155.
- , , , , . Health‐related quality‐of‐life assessments and patient‐physician communication: a randomized controlled trial. JAMA. 2002;288:3027–3034.
- , , , . Modification of residents' behavior by preceptor feedback of patient satisfaction. J Gen Intern Med. 1986;1:394–398.
- , , . Developing physician communication skills for patient‐centered care. Health Aff (Millwood) 2010;29:1310–1318.
- ARC Medical Program @ UCLA. Available at: http://Arcmedicalprogram.Wordpress.com. Accessed July 1, 2013.
- Hospital Consumer Assessment of Healthcare Providers 12:151–162.
- Summary of HCAHPS survey results January 2010 to December 2010 discharges. Available at: http://Www.Hcahpsonline.Org/Files/Hcahps survey results table %28report_Hei_October_2011_States%29.Pdf. Accessed October 18, 2013.
- , , , et al. A randomized experiment investigating the suitability of speech‐enabled IVR and web modes for publicly reported surveys of patients' experience of hospital care. Med Care Res Rev. 2013;70:165–184.
- . Provider‐specific report cards: a tool for health sector accountability in developing countries. Health Policy Plan. 2006;21:101–109.
- , , , . Effect of clinician communication skills training on patient satisfaction: a randomized, controlled trial. Ann Intern Med. 1999;131:822–829.
- Frequently asked questions: ACGME common duty hour requirements. Available at: http://www.Acgme.Org/Acgmeweb/Portals/0/Pdfs/Dh‐Faqs2011.Pdf. Accessed January 3, 2015.
INTRODUCTION
Patient experience and satisfaction is intrinsically valued, as strong physician‐patient communication, empathy, and patient comfort require little justification. However, studies have also shown that patient satisfaction is associated with better health outcomes and greater compliance.[1, 2, 3] A systematic review of studies linking patient satisfaction to outcomes found that patient experience is positively associated with patient safety, clinical effectiveness, health outcomes, adherence, and lower resource utilization.[4] Of 378 associations studied between patient experience and health outcomes, there were 312 positive associations.[4] However, not all studies have shown a positive association between patient satisfaction and outcomes.
Nevertheless, hospitals now have to strive to improve patient satisfaction, as Centers for Medicare & Medicaid Services (CMS) has introduced Hospital Value‐Based Purchasing. CMS started to withhold Medicare Severity Diagnosis‐Related Groups payments, starting at 1.0% in 2013, 1.25% in 2014, and increasing to 2.0% in 2017. This money is redistributed based on performance on core quality measures, including patient satisfaction measured through the Hospital Consumer Assessment of Healthcare Providers and Systems (HCAHPS) survey.[5]
Various studies have evaluated interventions to improve patient satisfaction, but to our knowledge, no study published in a peer‐reviewed research journal has shown a significant improvement in HCAHPS scores.[6, 7, 8, 9, 10, 11, 12] Levinson et al. argue that physician communication skills should be taught during residency, and that individualized feedback is an effective way to allow physicians to track their progress over time and compared to their peers.[13] We thus aimed to evaluate an intervention to improve patient satisfaction designed by the Patient Affairs Department for Ronald Reagan University of California, Los Angeles (UCLA) Medical Center (RRUCLAMC) and the UCLA Department of Medicine.
METHODOLOGY
Design Overview
The intervention for the IM residents consisted of education on improving physician‐patient communication provided at a conference, frequent individualized patient feedback, and an incentive program in addition to existing patient satisfaction training. The results of the intervention were measured by comparing the postintervention HCAHPS scores in the Department of Medicine versus the rest of the hospital and the national averages.
Setting and Participants
The study setting was RRUCLAMC, a large university‐affiliated academic center. The internal medicine (IM) residents and patients in the Department of Medicine were in the intervention cohort. The residents in all other departments that were involved with direct adult patient care and their patients were the control cohort. Our intervention targeted resident physicians because they were most involved in the majority of direct patient care at RRUCLAMC. Residents are in house 24 hours a day, are the first line of contact for nurses and patients, and provide the most continuity, as attendings often rotate every 1 to 2 weeks, but residents are on service for at least 2 to 4 weeks for each rotation. IM residents are on all inpatient general medicine, critical care, and cardiology services at RRUCLAMC. RRUMCLA does not have a nonteaching service for adult IM patients.
Interventions
Since 2006, there has been a program at RRUCLAMC called Assessing Residents' CICARE (ARC). CICARE is an acronym that represents UCLA's patient communication model and training elements (Connect with patients, Introduce yourself and role, Communicate, Ask and anticipate, Respond, Exit courteously). The ARC program consists of trained undergraduate student volunteers surveying hospitalized patients with an optional and anonymous survey regarding specific resident physician's communication skills (see Supporting Information, Appendix A, in the online version of this article). Patients were randomly selected for the ARC and HCAHPS survey, but they were selected separately for each survey. There may have been some overlap between patients selected for ARC and HCAHPS surveys. Residents received feedback from 7 to 10 patients a year on average.
The volunteers show the patients a picture of individual resident physicians assigned to their care to confirm the resident's identity. The volunteer then asks 18 multiple‐choice questions about their physician‐patient communication skills. The patients are also asked to provide general comments regarding the resident physician.[14] The patients were interviewed in private hospital rooms by ARC volunteers. No information linking the patient to the survey is recorded. Survey data are entered into a database, and individual residents are assigned a code that links them to their patient feedback. These survey results and comments are sent to the program directors of the residency programs weekly. However, a review of the practice revealed that results were only reviewed semiannually by the residents with their program director.
Starting December 2011, the results of the ARC survey were directly e‐mailed to the interns and residents in the Department of Medicine in real time while they were on general medicine wards and the cardiology inpatient service at RRUCLAMC. Residents in other departments at RRUCLAMC continued to review the patient feedback with program directors at most biannually. This continued until June 2012 and had to be stopped during July 2012 because many of the CICARE volunteers were away on summer break.
Starting January 2012, IM residents who stood out in the ARC survey received a Commendation of Excellence. Each month, 3 residents were selected for this award based on their patient comments and if they had over 90% overall satisfaction on the survey questions. These residents received department‐wide recognition via e‐mail and a movie package (2 movie tickets, popcorn, and a drink) as a reward.
In January 2012, a 1‐hour lunchtime conference was held for IM residents to discuss best practices in physician‐patient communication, upcoming changes with Hospital Value‐Based Purchasing, and strengths and weaknesses of the Department of Medicine in patient communication. About 50% of the IM residents included in the study arm were not able to attend the education session and so no universal training was provided.
Outcomes
We analyzed the before and after intervention impact on the HCAHPS results. HCAHPS is a standardized national survey measuring patient perspectives after they are discharged from hospitals across the nation. The survey addresses communication with doctors and nurses, responsiveness of hospital staff, pain management, communication about medicines, discharge information, cleanliness of the hospital environment, and quietness of the hospital environment. The survey also includes demographic questions.[15]
Our analysis focused on the following specific questions: Would you recommend this hospital to your friends and family? During this hospital stay, how often did doctors: (1) treat you with courtesy and respect, (2) listen carefully to you, and (3) explain things in a way you could understand? Responders who did not answer all of the above questions were excluded.
Our outcomes focused on the change from January to June 2011 to January to June 2012, during which time the intervention was ongoing. We did not include data past July 2012 in the primary outcome, because the intervention did not continue due to volunteers being away for summer break. In addition, July also marks the time when the third‐year IM residents graduate and the new interns start. Thus, one‐third of the residents in the IM department had never been exposed to the intervention after June of 2012.
Statistical Analysis
We used a difference‐in‐differences regression analysis (DDRA) for these outcomes and controlled for other covariates in the patient populations to predict adjusted probabilities for each of the outcomes studied. The key predictors in the models were indicator variables for year (2011, 2012) and service (IM, all others) and an interaction between year and service. We controlled for perceived patient health, admission through emergency room (ER), age, race, patient education level, intensive care unit (ICU) stay, length of stay, and gender.[16] We calculated adjusted probabilities for each level of the interaction between service and year, holding all controls at their means. The 95% confidence intervals for these predictions were generated using the delta method.
We compared the changes in HCAHPS results for the RRUCLAMC Department of Medicine patients with all other RRUCLAMC department patients and to the national averages. We only had access to national average point estimates and not individual responses from the national sample and so were unable to do statistical analysis involving the national cohort. The prespecified significant P value was 0.05. Stata 13 (StataCorp, College Station, TX) was used for statistical analysis. The study received institutional review board exempt status.
RESULTS
Sample Size and Excluded Cases
There were initially 3637 HCAHPS patient cases. We dropped all HCAHPS cases that were missing values for outcome or demographic/explanatory variables. We dropped 226 cases due to 1 or more missing outcome variables, and we dropped 322 cases due to 1 or more missing demographic/explanatory variables. This resulted in 548 total dropped cases and a final sample size of 3089 (see Supporting Information, Appendix B, in the online version of this article). Of the 548 dropped cases, 228 cases were in the IM cohort and 320 cases from the rest of the hospital. There were 993 patients in the UCLA IM cohort and 2096 patients in the control cohort from all other UCLA adult departments. Patients excluded due to missing data were similar to the patients included in the final analysis except for 2 differences. Patients excluded were older (63 years vs 58 years, P<0.01) and more likely to have been admitted from the ER (57.4% vs 39.6%, P<0.01) than the patients we had included.
Patient Characteristics
The patient population demographics from all patients discharged from RRUCLAMC who completed HCAHPS surveys January to June 2011 and 2012 are displayed in Table 1. In both 2011 and 2012, the patients in the IM cohort were significantly older, more likely to be male, had lower perceived health, and more likely to be admitted through the emergency room than the HCAHPS patients in all other UCLA adult departments. In 2011, the IM cohort had a lower percentage of patients than the non‐IM cohort that required an ICU stay (8.0% vs 20.5%, P<0.01), but there was no statistically significant difference in 2012 (20.6% vs 20.8%, P=0.9). Other than differences in ICU stay, the demographic characteristics from 2011 to 2012 did not change in the intervention and control cohorts. The response rate for UCLA on HCAHPS during the study period was 29%, consistent with national results.[17, 18]
| 2011 | 2012 | |||||
|---|---|---|---|---|---|---|
| UCLA Internal Medicine | All Other UCLA Adult Departments | P | UCLA Internal Medicine | All Other UCLA Adult Departments | P | |
| ||||||
| Total no. | 465 | 865 | 528 | 1,231 | ||
| Age, y | 62.8 | 55.3 | <0.01 | 65.1 | 54.9 | <0.01 |
| Length of stay, d | 5.7 | 5.7 | 0.94 | 5.8 | 4.9 | 0.19 |
| Gender, male | 56.6 | 44.1 | <0.01 | 55.3 | 41.4 | <0.01 |
| Education (4 years of college or greater) | 47.3 | 49.3 | 0.5 | 47.3 | 51.3 | 0.13 |
| Patient‐perceived overall health (responding very good or excellent) | 30.5 | 55.0 | <0.01 | 27.5 | 58.2 | <0.01 |
| Admission through emergency room, yes | 75.5 | 23.8 | <0.01 | 72.4 | 23.1 | <0.01 |
| Intensive care unit, yes | 8.0 | 20.5 | <0.01 | 20.6 | 20.8 | 0.9 |
| Ethnicity (non‐Hispanic white) | 63.2 | 61.4 | 0.6 | 62.5 | 60.9 | 0.5 |
Difference‐in‐Differences Regression Analysis
The adjusted results of the DDRA for the physician‐related HCAHPS questions are presented in Table 2. The adjusted results for the percentage of patients responding positively to all 3 physician‐related HCAHPS questions in the DDRA increased by 8.1% in the IM cohort (from 65.7% to 73.8%) and by 1.5% in the control cohort (from 64.4% to 65.9%) (P=0.04). The adjusted results for the percentage of patients responding always to How often did doctors treat you with courtesy and respect? in the DDRA increased by 5.1% (from 83.8% to 88.9%) in the IM cohort and by 1.0% (from 83.3% to 84.3%) in the control cohort (P=0.09). The adjusted results for the percentage of patients responding always to Does your doctor listen carefully to you? in the DDRA increased by 6.0% in the IM department (75.6% to 81.6%) and by 1.2% (75.2% to 76.4%) in the control (P=0.1). The adjusted results for the percentage of patients responding always to Does your doctor explain things in a way you could understand? in the DDRA increased by 7.8% in the IM department (from 72.1% to 79.9%) and by 1.0% in the control cohort (from 72.2% to 73.2%) (P=0.03). There was no more than 3.1% absolute increase in any of the 4 questions in the national average. There was also a significant improvement in percentage of patients who would definitely recommend this hospital to their friends and family. The adjusted results in the DDRA for the percentage of patients responding that they would definitely recommend this hospital increased by 7.1% in the IM cohort (from 82.7% to 89.8%) and 1.5% in the control group (from 84.1% to 85.6%) (P=0.02).
| UCLA IM | All Other UCLA Adult Departments | National Average | |
|---|---|---|---|
| |||
| % Patients responding that their doctors always treated them with courtesy and respect | |||
| January to June 2011, preintervention (95% CI) | 83.8 (80.587.1) | 83.3 (80.785.9) | 82.4 |
| January to June 2012, postintervention | 88.9 (86.391.4) | 84.3 (82.186.5) | 85.5 |
| Change from 2011 to 2012, January to June | 5.1 | 1.0 | 3.1 |
| Change in UCLA IM minus change in all other UCLA adult departments, difference in differences | 4.1 | ||
| P value of difference in differences between IM and the rest of the hospital | 0.09 | ||
| % Patients responding that their doctors always listened carefully | |||
| January to June 2011, preintervention (95% CI) | 75.6 (71.779.5) | 75.2 (72.278.1) | 76.4 |
| January to June 2012, postintervention (95% CI) | 81.6 (78.484.8) | 76.4 (73.978.9) | 73.7 |
| Change from 2011 to 2012, January to June | 6.0 | 1.2 | 2.7 |
| Change in UCLA IM minus change in all other UCLA adult departments, difference in differences | 4.6 | ||
| P value of difference in differences between IM and the rest of the hospital | 0.1 | ||
| % Patients responding that their doctors always explained things in a way they could understand | |||
| January to June 2011, preintervention (95% CI) | 72.1 (6876.1) | 72.2 (69.275.4) | 70.1 |
| January to June 2012, postintervention | 79.9 (76.683.1) | 73.2 (70.675.8) | 72.2 |
| Change from 2011 to 2012, January to June | 7.8 | 1.0 | 2.1 |
| Change in UCLA IM minus change in all other UCLA adult departments, difference in differences | 6.8 | ||
| P value of difference in differences between IM and the rest of the hospital | 0.03 | ||
| % Patients responding "always" for all 3 physician‐related HCAHPS questions | |||
| January to June 2011, preintervention (95% CI) | 65.7 (61.370.1) | 64.4 (61.267.7) | 80.1 |
| January to June 2012, postintervention | 73.8 (70.177.5) | 65.9 (63.168.6) | 87.8 |
| Change from 2011 to 2012, January to June | 8.1 | 1.5 | 7.7 |
| Change in UCLA IM minus change in all other UCLA adult departments, difference in differences | 6.6 | ||
| P value of difference in differences between IM and the rest of the hospital | 0.04 | ||
| % Patients who would definitely recommend this hospital to their friends and family | |||
| January to June 2011, preintervention (95% CI) | 82.7 (79.386.1) | 84.1 (81.586.6) | 68.8 |
| January to June 2012, postintervention | 89.8 (87.392.3) | 85.6 (83.587.7) | 71.2 |
| Change from 2011 to 2012, January to June | 7.1 | 1.5 | 2.4 |
| Change in UCLA IM minus change in all other UCLA adult departments, difference in differences | 5.6 | ||
| P value of difference in differences between IM and the rest of the hospital | 0.02 | ||
DISCUSSION
Our intervention, which included real‐time feedback to physicians on results of the patient survey, monthly recognition of physicians who stood out on this survey, and an educational conference, was associated with a clear improvement in patient satisfaction with physician‐patient communication and overall recommendation of the hospital. These results are significant because they demonstrate a cost‐effective intervention that can be applied to academic hospitals across the country with the use of nonmedically trained volunteers, such as the undergraduate volunteers involved in our program. The limited costs associated with the intervention were the time in managing the volunteers and movie package award ($20). To our knowledge, it is the first study published in a peer‐reviewed research journal that has demonstrated an intervention associated with significant improvements in HCAHPS scores, the standard by which CMS reimbursement will be affected.
The improvements associated with this intervention could be very valuable to hospitals and patient care. The positive correlation of higher patient satisfaction with improved outcomes suggests this intervention may have additional benefits.[4] Last, these improvements in patient satisfaction in the HCAHPS scores could minimize losses to hospital revenue, as hospitals with low patient‐satisfaction scores will be penalized.
There was a statistically significant improvement in adjusted scores for the question Did your physicians explain things understandably? with patients responding always to all 3 physician‐related HCAHPS questions and Would you recommend this hospital to friends and family. The results for the 2 other physician‐related questions (Did your doctor explain things understandably? and Did your doctor listen carefully?) did show a trend toward significance, with p values of <0.1, and a larger study may have been better powered to detect a statistically significant difference. The improvement in response to the adjusted scores for the question Did your physicians explain things understandably? was the primary driver in the improvement in the adjusted percentage of patients who responded always to all 3 physician‐related HCAHPS questions. This was likely because the IM cohort had the lowest score on this question, and so the feedback to the residents may have helped to address this area of weakness. The UCLA IM HCAHPS scores prior to 2012 have always been lower than other programs at UCLA. As a result, we do not believe the change was due to a regression to the mean.
We believe that the intervention had a positive effect on patient satisfaction for several reasons. The regular e‐mails with the results of the survey may have served as a reminder to residents that patient satisfaction was being monitored and linked to them. The immediate and individualized feedback also may have facilitated adjustments of clinical practice in real time. The residents were able to compare their own scores and comments to the anonymous results of their peers. The monthly department‐wide recognition for residents who excelled in patient communication may have created an incentive and competition among the residents. It is possible that there may be an element of the Hawthorne effect that explained the improvement in HCAHPS scores. However, all of the residents in the departments studied were already being measured through the ARC survey. The primary change was more frequent reporting of ARC survey results, and so we believe that perception of measurement alone was less likely driving the results. The findings from this study are similar to those from provider‐specific report cards, which have shown that outcomes can be improved by forcing greater accountability and competition among physicians.[19]
Brown et al. demonstrated that 2, 4‐hour physician communication workshops in their study had no impact on patient satisfaction, and so we believe that our 1‐hour workshop with only 50% attendance had minimal impact on the improved patient satisfaction scores in our study.[20] Our intervention also coincided with the implementation of the Accreditation Council for Graduate Medical Education (ACGME) work‐hour restrictions implemented in July 2011. These restrictions limited residents to 80 hours per week, intern duty periods were restricted to 16 hours and residents to 28 hours, and interns and residents required 8 to 10 hours free of duty between scheduled duty periods.[21] One of the biggest impacts of ACGME work‐hour restrictions was that interns were doing more day and night shifts rather than 28‐hour calls. However, these work‐hour restrictions were the same for all specialties and so were unlikely to explain the improved patient satisfaction associated with our intervention.
Our study has limitations. The study was a nonrandomized pre‐post study. We attempted to control for the differences in the cohorts with a multivariable regression analysis, but there may be unmeasured differences that we were unable to control for. Due to deidentification of the data, we could only control for patient health based on patient perceived health. In addition, the percentage of patients requiring ICU care in the IM cohort was higher in 2012 than in 2011. We did not identify differences in outcomes from analyses stratified by ICU or non‐ICU patients. In addition, patients who were excluded because of missing outcomes were more likely to be older and admitted through the ER. Further investigation would be needed to see if the findings of this study could be extended to other clinical situations.
In conclusion, our study found an intervention program that was associated with a significant improvement in patient satisfaction in the intervention cohort, even after adjusting for differences in the patient population, whereas there was no change in the control group. This intervention can serve as a model for academic hospitals to improve patient satisfaction, avoid revenue loss in the era of Hospital Value‐Based Purchasing, and to train the next generation of physicians on providing patient‐centered care.
Disclosure
This work was supported by the Beryl Institute and UCLA QI Initiative.
INTRODUCTION
Patient experience and satisfaction is intrinsically valued, as strong physician‐patient communication, empathy, and patient comfort require little justification. However, studies have also shown that patient satisfaction is associated with better health outcomes and greater compliance.[1, 2, 3] A systematic review of studies linking patient satisfaction to outcomes found that patient experience is positively associated with patient safety, clinical effectiveness, health outcomes, adherence, and lower resource utilization.[4] Of 378 associations studied between patient experience and health outcomes, there were 312 positive associations.[4] However, not all studies have shown a positive association between patient satisfaction and outcomes.
Nevertheless, hospitals now have to strive to improve patient satisfaction, as Centers for Medicare & Medicaid Services (CMS) has introduced Hospital Value‐Based Purchasing. CMS started to withhold Medicare Severity Diagnosis‐Related Groups payments, starting at 1.0% in 2013, 1.25% in 2014, and increasing to 2.0% in 2017. This money is redistributed based on performance on core quality measures, including patient satisfaction measured through the Hospital Consumer Assessment of Healthcare Providers and Systems (HCAHPS) survey.[5]
Various studies have evaluated interventions to improve patient satisfaction, but to our knowledge, no study published in a peer‐reviewed research journal has shown a significant improvement in HCAHPS scores.[6, 7, 8, 9, 10, 11, 12] Levinson et al. argue that physician communication skills should be taught during residency, and that individualized feedback is an effective way to allow physicians to track their progress over time and compared to their peers.[13] We thus aimed to evaluate an intervention to improve patient satisfaction designed by the Patient Affairs Department for Ronald Reagan University of California, Los Angeles (UCLA) Medical Center (RRUCLAMC) and the UCLA Department of Medicine.
METHODOLOGY
Design Overview
The intervention for the IM residents consisted of education on improving physician‐patient communication provided at a conference, frequent individualized patient feedback, and an incentive program in addition to existing patient satisfaction training. The results of the intervention were measured by comparing the postintervention HCAHPS scores in the Department of Medicine versus the rest of the hospital and the national averages.
Setting and Participants
The study setting was RRUCLAMC, a large university‐affiliated academic center. The internal medicine (IM) residents and patients in the Department of Medicine were in the intervention cohort. The residents in all other departments that were involved with direct adult patient care and their patients were the control cohort. Our intervention targeted resident physicians because they were most involved in the majority of direct patient care at RRUCLAMC. Residents are in house 24 hours a day, are the first line of contact for nurses and patients, and provide the most continuity, as attendings often rotate every 1 to 2 weeks, but residents are on service for at least 2 to 4 weeks for each rotation. IM residents are on all inpatient general medicine, critical care, and cardiology services at RRUCLAMC. RRUMCLA does not have a nonteaching service for adult IM patients.
Interventions
Since 2006, there has been a program at RRUCLAMC called Assessing Residents' CICARE (ARC). CICARE is an acronym that represents UCLA's patient communication model and training elements (Connect with patients, Introduce yourself and role, Communicate, Ask and anticipate, Respond, Exit courteously). The ARC program consists of trained undergraduate student volunteers surveying hospitalized patients with an optional and anonymous survey regarding specific resident physician's communication skills (see Supporting Information, Appendix A, in the online version of this article). Patients were randomly selected for the ARC and HCAHPS survey, but they were selected separately for each survey. There may have been some overlap between patients selected for ARC and HCAHPS surveys. Residents received feedback from 7 to 10 patients a year on average.
The volunteers show the patients a picture of individual resident physicians assigned to their care to confirm the resident's identity. The volunteer then asks 18 multiple‐choice questions about their physician‐patient communication skills. The patients are also asked to provide general comments regarding the resident physician.[14] The patients were interviewed in private hospital rooms by ARC volunteers. No information linking the patient to the survey is recorded. Survey data are entered into a database, and individual residents are assigned a code that links them to their patient feedback. These survey results and comments are sent to the program directors of the residency programs weekly. However, a review of the practice revealed that results were only reviewed semiannually by the residents with their program director.
Starting December 2011, the results of the ARC survey were directly e‐mailed to the interns and residents in the Department of Medicine in real time while they were on general medicine wards and the cardiology inpatient service at RRUCLAMC. Residents in other departments at RRUCLAMC continued to review the patient feedback with program directors at most biannually. This continued until June 2012 and had to be stopped during July 2012 because many of the CICARE volunteers were away on summer break.
Starting January 2012, IM residents who stood out in the ARC survey received a Commendation of Excellence. Each month, 3 residents were selected for this award based on their patient comments and if they had over 90% overall satisfaction on the survey questions. These residents received department‐wide recognition via e‐mail and a movie package (2 movie tickets, popcorn, and a drink) as a reward.
In January 2012, a 1‐hour lunchtime conference was held for IM residents to discuss best practices in physician‐patient communication, upcoming changes with Hospital Value‐Based Purchasing, and strengths and weaknesses of the Department of Medicine in patient communication. About 50% of the IM residents included in the study arm were not able to attend the education session and so no universal training was provided.
Outcomes
We analyzed the before and after intervention impact on the HCAHPS results. HCAHPS is a standardized national survey measuring patient perspectives after they are discharged from hospitals across the nation. The survey addresses communication with doctors and nurses, responsiveness of hospital staff, pain management, communication about medicines, discharge information, cleanliness of the hospital environment, and quietness of the hospital environment. The survey also includes demographic questions.[15]
Our analysis focused on the following specific questions: Would you recommend this hospital to your friends and family? During this hospital stay, how often did doctors: (1) treat you with courtesy and respect, (2) listen carefully to you, and (3) explain things in a way you could understand? Responders who did not answer all of the above questions were excluded.
Our outcomes focused on the change from January to June 2011 to January to June 2012, during which time the intervention was ongoing. We did not include data past July 2012 in the primary outcome, because the intervention did not continue due to volunteers being away for summer break. In addition, July also marks the time when the third‐year IM residents graduate and the new interns start. Thus, one‐third of the residents in the IM department had never been exposed to the intervention after June of 2012.
Statistical Analysis
We used a difference‐in‐differences regression analysis (DDRA) for these outcomes and controlled for other covariates in the patient populations to predict adjusted probabilities for each of the outcomes studied. The key predictors in the models were indicator variables for year (2011, 2012) and service (IM, all others) and an interaction between year and service. We controlled for perceived patient health, admission through emergency room (ER), age, race, patient education level, intensive care unit (ICU) stay, length of stay, and gender.[16] We calculated adjusted probabilities for each level of the interaction between service and year, holding all controls at their means. The 95% confidence intervals for these predictions were generated using the delta method.
We compared the changes in HCAHPS results for the RRUCLAMC Department of Medicine patients with all other RRUCLAMC department patients and to the national averages. We only had access to national average point estimates and not individual responses from the national sample and so were unable to do statistical analysis involving the national cohort. The prespecified significant P value was 0.05. Stata 13 (StataCorp, College Station, TX) was used for statistical analysis. The study received institutional review board exempt status.
RESULTS
Sample Size and Excluded Cases
There were initially 3637 HCAHPS patient cases. We dropped all HCAHPS cases that were missing values for outcome or demographic/explanatory variables. We dropped 226 cases due to 1 or more missing outcome variables, and we dropped 322 cases due to 1 or more missing demographic/explanatory variables. This resulted in 548 total dropped cases and a final sample size of 3089 (see Supporting Information, Appendix B, in the online version of this article). Of the 548 dropped cases, 228 cases were in the IM cohort and 320 cases from the rest of the hospital. There were 993 patients in the UCLA IM cohort and 2096 patients in the control cohort from all other UCLA adult departments. Patients excluded due to missing data were similar to the patients included in the final analysis except for 2 differences. Patients excluded were older (63 years vs 58 years, P<0.01) and more likely to have been admitted from the ER (57.4% vs 39.6%, P<0.01) than the patients we had included.
Patient Characteristics
The patient population demographics from all patients discharged from RRUCLAMC who completed HCAHPS surveys January to June 2011 and 2012 are displayed in Table 1. In both 2011 and 2012, the patients in the IM cohort were significantly older, more likely to be male, had lower perceived health, and more likely to be admitted through the emergency room than the HCAHPS patients in all other UCLA adult departments. In 2011, the IM cohort had a lower percentage of patients than the non‐IM cohort that required an ICU stay (8.0% vs 20.5%, P<0.01), but there was no statistically significant difference in 2012 (20.6% vs 20.8%, P=0.9). Other than differences in ICU stay, the demographic characteristics from 2011 to 2012 did not change in the intervention and control cohorts. The response rate for UCLA on HCAHPS during the study period was 29%, consistent with national results.[17, 18]
| 2011 | 2012 | |||||
|---|---|---|---|---|---|---|
| UCLA Internal Medicine | All Other UCLA Adult Departments | P | UCLA Internal Medicine | All Other UCLA Adult Departments | P | |
| ||||||
| Total no. | 465 | 865 | 528 | 1,231 | ||
| Age, y | 62.8 | 55.3 | <0.01 | 65.1 | 54.9 | <0.01 |
| Length of stay, d | 5.7 | 5.7 | 0.94 | 5.8 | 4.9 | 0.19 |
| Gender, male | 56.6 | 44.1 | <0.01 | 55.3 | 41.4 | <0.01 |
| Education (4 years of college or greater) | 47.3 | 49.3 | 0.5 | 47.3 | 51.3 | 0.13 |
| Patient‐perceived overall health (responding very good or excellent) | 30.5 | 55.0 | <0.01 | 27.5 | 58.2 | <0.01 |
| Admission through emergency room, yes | 75.5 | 23.8 | <0.01 | 72.4 | 23.1 | <0.01 |
| Intensive care unit, yes | 8.0 | 20.5 | <0.01 | 20.6 | 20.8 | 0.9 |
| Ethnicity (non‐Hispanic white) | 63.2 | 61.4 | 0.6 | 62.5 | 60.9 | 0.5 |
Difference‐in‐Differences Regression Analysis
The adjusted results of the DDRA for the physician‐related HCAHPS questions are presented in Table 2. The adjusted results for the percentage of patients responding positively to all 3 physician‐related HCAHPS questions in the DDRA increased by 8.1% in the IM cohort (from 65.7% to 73.8%) and by 1.5% in the control cohort (from 64.4% to 65.9%) (P=0.04). The adjusted results for the percentage of patients responding always to How often did doctors treat you with courtesy and respect? in the DDRA increased by 5.1% (from 83.8% to 88.9%) in the IM cohort and by 1.0% (from 83.3% to 84.3%) in the control cohort (P=0.09). The adjusted results for the percentage of patients responding always to Does your doctor listen carefully to you? in the DDRA increased by 6.0% in the IM department (75.6% to 81.6%) and by 1.2% (75.2% to 76.4%) in the control (P=0.1). The adjusted results for the percentage of patients responding always to Does your doctor explain things in a way you could understand? in the DDRA increased by 7.8% in the IM department (from 72.1% to 79.9%) and by 1.0% in the control cohort (from 72.2% to 73.2%) (P=0.03). There was no more than 3.1% absolute increase in any of the 4 questions in the national average. There was also a significant improvement in percentage of patients who would definitely recommend this hospital to their friends and family. The adjusted results in the DDRA for the percentage of patients responding that they would definitely recommend this hospital increased by 7.1% in the IM cohort (from 82.7% to 89.8%) and 1.5% in the control group (from 84.1% to 85.6%) (P=0.02).
| UCLA IM | All Other UCLA Adult Departments | National Average | |
|---|---|---|---|
| |||
| % Patients responding that their doctors always treated them with courtesy and respect | |||
| January to June 2011, preintervention (95% CI) | 83.8 (80.587.1) | 83.3 (80.785.9) | 82.4 |
| January to June 2012, postintervention | 88.9 (86.391.4) | 84.3 (82.186.5) | 85.5 |
| Change from 2011 to 2012, January to June | 5.1 | 1.0 | 3.1 |
| Change in UCLA IM minus change in all other UCLA adult departments, difference in differences | 4.1 | ||
| P value of difference in differences between IM and the rest of the hospital | 0.09 | ||
| % Patients responding that their doctors always listened carefully | |||
| January to June 2011, preintervention (95% CI) | 75.6 (71.779.5) | 75.2 (72.278.1) | 76.4 |
| January to June 2012, postintervention (95% CI) | 81.6 (78.484.8) | 76.4 (73.978.9) | 73.7 |
| Change from 2011 to 2012, January to June | 6.0 | 1.2 | 2.7 |
| Change in UCLA IM minus change in all other UCLA adult departments, difference in differences | 4.6 | ||
| P value of difference in differences between IM and the rest of the hospital | 0.1 | ||
| % Patients responding that their doctors always explained things in a way they could understand | |||
| January to June 2011, preintervention (95% CI) | 72.1 (6876.1) | 72.2 (69.275.4) | 70.1 |
| January to June 2012, postintervention | 79.9 (76.683.1) | 73.2 (70.675.8) | 72.2 |
| Change from 2011 to 2012, January to June | 7.8 | 1.0 | 2.1 |
| Change in UCLA IM minus change in all other UCLA adult departments, difference in differences | 6.8 | ||
| P value of difference in differences between IM and the rest of the hospital | 0.03 | ||
| % Patients responding "always" for all 3 physician‐related HCAHPS questions | |||
| January to June 2011, preintervention (95% CI) | 65.7 (61.370.1) | 64.4 (61.267.7) | 80.1 |
| January to June 2012, postintervention | 73.8 (70.177.5) | 65.9 (63.168.6) | 87.8 |
| Change from 2011 to 2012, January to June | 8.1 | 1.5 | 7.7 |
| Change in UCLA IM minus change in all other UCLA adult departments, difference in differences | 6.6 | ||
| P value of difference in differences between IM and the rest of the hospital | 0.04 | ||
| % Patients who would definitely recommend this hospital to their friends and family | |||
| January to June 2011, preintervention (95% CI) | 82.7 (79.386.1) | 84.1 (81.586.6) | 68.8 |
| January to June 2012, postintervention | 89.8 (87.392.3) | 85.6 (83.587.7) | 71.2 |
| Change from 2011 to 2012, January to June | 7.1 | 1.5 | 2.4 |
| Change in UCLA IM minus change in all other UCLA adult departments, difference in differences | 5.6 | ||
| P value of difference in differences between IM and the rest of the hospital | 0.02 | ||
DISCUSSION
Our intervention, which included real‐time feedback to physicians on results of the patient survey, monthly recognition of physicians who stood out on this survey, and an educational conference, was associated with a clear improvement in patient satisfaction with physician‐patient communication and overall recommendation of the hospital. These results are significant because they demonstrate a cost‐effective intervention that can be applied to academic hospitals across the country with the use of nonmedically trained volunteers, such as the undergraduate volunteers involved in our program. The limited costs associated with the intervention were the time in managing the volunteers and movie package award ($20). To our knowledge, it is the first study published in a peer‐reviewed research journal that has demonstrated an intervention associated with significant improvements in HCAHPS scores, the standard by which CMS reimbursement will be affected.
The improvements associated with this intervention could be very valuable to hospitals and patient care. The positive correlation of higher patient satisfaction with improved outcomes suggests this intervention may have additional benefits.[4] Last, these improvements in patient satisfaction in the HCAHPS scores could minimize losses to hospital revenue, as hospitals with low patient‐satisfaction scores will be penalized.
There was a statistically significant improvement in adjusted scores for the question Did your physicians explain things understandably? with patients responding always to all 3 physician‐related HCAHPS questions and Would you recommend this hospital to friends and family. The results for the 2 other physician‐related questions (Did your doctor explain things understandably? and Did your doctor listen carefully?) did show a trend toward significance, with p values of <0.1, and a larger study may have been better powered to detect a statistically significant difference. The improvement in response to the adjusted scores for the question Did your physicians explain things understandably? was the primary driver in the improvement in the adjusted percentage of patients who responded always to all 3 physician‐related HCAHPS questions. This was likely because the IM cohort had the lowest score on this question, and so the feedback to the residents may have helped to address this area of weakness. The UCLA IM HCAHPS scores prior to 2012 have always been lower than other programs at UCLA. As a result, we do not believe the change was due to a regression to the mean.
We believe that the intervention had a positive effect on patient satisfaction for several reasons. The regular e‐mails with the results of the survey may have served as a reminder to residents that patient satisfaction was being monitored and linked to them. The immediate and individualized feedback also may have facilitated adjustments of clinical practice in real time. The residents were able to compare their own scores and comments to the anonymous results of their peers. The monthly department‐wide recognition for residents who excelled in patient communication may have created an incentive and competition among the residents. It is possible that there may be an element of the Hawthorne effect that explained the improvement in HCAHPS scores. However, all of the residents in the departments studied were already being measured through the ARC survey. The primary change was more frequent reporting of ARC survey results, and so we believe that perception of measurement alone was less likely driving the results. The findings from this study are similar to those from provider‐specific report cards, which have shown that outcomes can be improved by forcing greater accountability and competition among physicians.[19]
Brown et al. demonstrated that 2, 4‐hour physician communication workshops in their study had no impact on patient satisfaction, and so we believe that our 1‐hour workshop with only 50% attendance had minimal impact on the improved patient satisfaction scores in our study.[20] Our intervention also coincided with the implementation of the Accreditation Council for Graduate Medical Education (ACGME) work‐hour restrictions implemented in July 2011. These restrictions limited residents to 80 hours per week, intern duty periods were restricted to 16 hours and residents to 28 hours, and interns and residents required 8 to 10 hours free of duty between scheduled duty periods.[21] One of the biggest impacts of ACGME work‐hour restrictions was that interns were doing more day and night shifts rather than 28‐hour calls. However, these work‐hour restrictions were the same for all specialties and so were unlikely to explain the improved patient satisfaction associated with our intervention.
Our study has limitations. The study was a nonrandomized pre‐post study. We attempted to control for the differences in the cohorts with a multivariable regression analysis, but there may be unmeasured differences that we were unable to control for. Due to deidentification of the data, we could only control for patient health based on patient perceived health. In addition, the percentage of patients requiring ICU care in the IM cohort was higher in 2012 than in 2011. We did not identify differences in outcomes from analyses stratified by ICU or non‐ICU patients. In addition, patients who were excluded because of missing outcomes were more likely to be older and admitted through the ER. Further investigation would be needed to see if the findings of this study could be extended to other clinical situations.
In conclusion, our study found an intervention program that was associated with a significant improvement in patient satisfaction in the intervention cohort, even after adjusting for differences in the patient population, whereas there was no change in the control group. This intervention can serve as a model for academic hospitals to improve patient satisfaction, avoid revenue loss in the era of Hospital Value‐Based Purchasing, and to train the next generation of physicians on providing patient‐centered care.
Disclosure
This work was supported by the Beryl Institute and UCLA QI Initiative.
- , , , , . Relationship between patient satisfaction with inpatient care and hospital readmission within 30 Days. Am J Manag Care. 2011;17:41–48.
- , , , . Patients' Perception of Hospital Care in the United States. N Engl J Med. 2008;359:1921–1931.
- , , , et al. Patient satisfaction and its relationship with clinical quality and inpatient mortality in acute myocardial infarction. Circ Cardiovasc Qual Outcomes. 2010;3:188–195.
- , , . A systematic review of evidence on the links between patient experience and clinical safety and effectiveness. BMJ Open. 2013;3(1).
- Centers for Medicare 70:729–732.
- , , , . Emergency department patient satisfaction: customer service training improves patient satisfaction and ratings of physician and nurse skill. J Healthc Manag. 1998;43:427–440; discussion 441–442.
- , , . Emergency department information: does it effect patients' perception and satisfaction about the care given in an emergency department? Eur J Emerg Med 1999;6:245–248.
- . Can communication skills workshops for emergency department doctors improve patient satisfaction? J Accid Emerg Med. 2000;17:251–253.
- , , , . Effects of a physician communication intervention on patient care outcomes. J Gen Intern Med. 1996;11:147–155.
- , , , , . Health‐related quality‐of‐life assessments and patient‐physician communication: a randomized controlled trial. JAMA. 2002;288:3027–3034.
- , , , . Modification of residents' behavior by preceptor feedback of patient satisfaction. J Gen Intern Med. 1986;1:394–398.
- , , . Developing physician communication skills for patient‐centered care. Health Aff (Millwood) 2010;29:1310–1318.
- ARC Medical Program @ UCLA. Available at: http://Arcmedicalprogram.Wordpress.com. Accessed July 1, 2013.
- Hospital Consumer Assessment of Healthcare Providers 12:151–162.
- Summary of HCAHPS survey results January 2010 to December 2010 discharges. Available at: http://Www.Hcahpsonline.Org/Files/Hcahps survey results table %28report_Hei_October_2011_States%29.Pdf. Accessed October 18, 2013.
- , , , et al. A randomized experiment investigating the suitability of speech‐enabled IVR and web modes for publicly reported surveys of patients' experience of hospital care. Med Care Res Rev. 2013;70:165–184.
- . Provider‐specific report cards: a tool for health sector accountability in developing countries. Health Policy Plan. 2006;21:101–109.
- , , , . Effect of clinician communication skills training on patient satisfaction: a randomized, controlled trial. Ann Intern Med. 1999;131:822–829.
- Frequently asked questions: ACGME common duty hour requirements. Available at: http://www.Acgme.Org/Acgmeweb/Portals/0/Pdfs/Dh‐Faqs2011.Pdf. Accessed January 3, 2015.
- , , , , . Relationship between patient satisfaction with inpatient care and hospital readmission within 30 Days. Am J Manag Care. 2011;17:41–48.
- , , , . Patients' Perception of Hospital Care in the United States. N Engl J Med. 2008;359:1921–1931.
- , , , et al. Patient satisfaction and its relationship with clinical quality and inpatient mortality in acute myocardial infarction. Circ Cardiovasc Qual Outcomes. 2010;3:188–195.
- , , . A systematic review of evidence on the links between patient experience and clinical safety and effectiveness. BMJ Open. 2013;3(1).
- Centers for Medicare 70:729–732.
- , , , . Emergency department patient satisfaction: customer service training improves patient satisfaction and ratings of physician and nurse skill. J Healthc Manag. 1998;43:427–440; discussion 441–442.
- , , . Emergency department information: does it effect patients' perception and satisfaction about the care given in an emergency department? Eur J Emerg Med 1999;6:245–248.
- . Can communication skills workshops for emergency department doctors improve patient satisfaction? J Accid Emerg Med. 2000;17:251–253.
- , , , . Effects of a physician communication intervention on patient care outcomes. J Gen Intern Med. 1996;11:147–155.
- , , , , . Health‐related quality‐of‐life assessments and patient‐physician communication: a randomized controlled trial. JAMA. 2002;288:3027–3034.
- , , , . Modification of residents' behavior by preceptor feedback of patient satisfaction. J Gen Intern Med. 1986;1:394–398.
- , , . Developing physician communication skills for patient‐centered care. Health Aff (Millwood) 2010;29:1310–1318.
- ARC Medical Program @ UCLA. Available at: http://Arcmedicalprogram.Wordpress.com. Accessed July 1, 2013.
- Hospital Consumer Assessment of Healthcare Providers 12:151–162.
- Summary of HCAHPS survey results January 2010 to December 2010 discharges. Available at: http://Www.Hcahpsonline.Org/Files/Hcahps survey results table %28report_Hei_October_2011_States%29.Pdf. Accessed October 18, 2013.
- , , , et al. A randomized experiment investigating the suitability of speech‐enabled IVR and web modes for publicly reported surveys of patients' experience of hospital care. Med Care Res Rev. 2013;70:165–184.
- . Provider‐specific report cards: a tool for health sector accountability in developing countries. Health Policy Plan. 2006;21:101–109.
- , , , . Effect of clinician communication skills training on patient satisfaction: a randomized, controlled trial. Ann Intern Med. 1999;131:822–829.
- Frequently asked questions: ACGME common duty hour requirements. Available at: http://www.Acgme.Org/Acgmeweb/Portals/0/Pdfs/Dh‐Faqs2011.Pdf. Accessed January 3, 2015.
© 2015 Society of Hospital Medicine
More Than a Mnemonic
A 51‐year‐old man presented to the emergency department after 1 day of progressive dyspnea and increasing confusion.
Acute dyspnea most commonly stems from a cardiac or pulmonary disorder such as heart failure, acute coronary syndrome, pneumonia, pulmonary embolism, or exacerbations of asthma or chronic obstructive pulmonary disease. Less frequent cardiopulmonary considerations include pericardial or pleural effusion, pneumothorax, aspiration, and upper airway obstruction. Dyspnea might also be the initial manifestation of profound anemia or metabolic acidosis.
The presence of confusion suggests either a severe presentation of any of the aforementioned possibilities (with confusion resulting from hypoxia, hypercapnia, or hypotension); a multiorgan illness such as sepsis, malignancy, thromboembolic disease, vasculitis, thyroid dysfunction, or toxic ingestion; or a metabolic derangement related to the underlying cause of dyspnea (for example, hypercalcemia or hyponatremia associated with lung cancer).
Twelve hours prior to presentation, he started to have visual hallucinations. He denied fever, chills, cough, chest discomfort, palpitations, weight gain, headache, neck pain, or weakness.
Visual hallucinations could result from a toxic‐metabolic encephalopathy, such as drug overdose or withdrawal, liver or kidney failure, or hypoxia. A structural brain abnormality may also manifest with visual hallucination. Acute onset at age 51 and the absence of auditory hallucinations argue against a neurodegenerative illness and a primary psychiatric disturbance, respectively.
Episodic hallucinations would support the possibility of seizures, monocular hallucinations would point to a retinal or ocular problem, and a description of yellow‐green hue would suggest a side effect of digoxin.
His past medical history was remarkable for diet‐controlled type 2 diabetes mellitus, hypertension, hyperlipidemia, and chronic low back pain. His medications included metoprolol tartrate 25 mg twice daily, omeprazole 40 mg daily, baclofen 15 mg twice daily, oxycodone 30 mg 3 times daily, and hydrocodone 10 mg/acetaminophen 325 mg, 2 tablets 3 times daily as needed for back pain. He was a smoker with a 30 pack‐year history. He had a history of alcohol and cocaine use, but denied any recent substance use. He had no known history of obstructive pulmonary disease.
The patient takes 3 medications well known to cause confusion and hallucinations (oxycodone, hydrocodone, and baclofen), especially when they accumulate due to excessive ingestion or impaired clearance. Although these medications may suppress ventilatory drive, dyspnea would not be a common presenting complaint. He has risk factors for ischemic heart disease and cardiomyopathy, and his smoking history raises the possibility of malignancy.
On exam, the patient's temperature was 94.4C, heart rate 128 beats per minute, respiration rate 28 breaths per minute, blood pressure 155/63 mm Hg, and oxygen saturation 100% while breathing ambient air. The patient was cachectic and appeared in moderate respiratory distress. His pupils were equal and reactive to light, and extraocular movements were intact. He did not have scleral icterus, or cervical or clavicular lymphadenopathy. His oropharynx was negative for erythema, edema, or exudate. His cardiovascular exam revealed a regular tachycardia without rubs or diastolic gallops. There was a 2/6 systolic murmur heard best at left sternal border, without radiation. He did not have jugular venous distention. His pulmonary exam was notable for tachypnea but with normal vesicular breath sounds throughout. He did not have stridor, wheezing, rhonchi, or rales. His abdomen had normal bowel tones and was soft without tenderness, distention, or organomegaly. His extremities were warm, revealed normal pulses, and no edema was present. His joints were cool to palpation, without effusion. On neurologic exam, he was oriented to person and place and able to answer yes/no questions, but unable to provide detailed history. His speech was fluent. His motor exam was without focal deficits. His skin was without any notable lesions.
The constellation of findings does not point to a specific toxidrome. The finding of warm extremities in a hypothermic patient suggests heat loss due to inappropriate peripheral vasodilation. In the absence of vasodilators or features of aortic insufficiency, sepsis becomes a leading consideration. Infection could result in hypothermia and altered sensorium, and accompanying lactic acidosis could trigger tachypnea.
Shortly after admission, he became more somnolent and developed progressive respiratory distress, requiring intubation. Arterial blood gas revealed a pH of 6.93, PaCO2 20 mm Hg, PaO2 127 mm Hg, and HCO3 5 mEq/L. Other laboratory results included a lactate of 4.1 mmol/L, blood urea nitrogen 49 mg/dL, creatinine 2.3 mg/dL (0.8 at 1 month prior), sodium level of 143 mmol/L, chloride of 106 mmol/L, and bicarbonate level of 5 mg/dL. His aspartate aminotransferase was 34 IU/L, alanine transaminase was 28 IU/L, total bilirubin was 0.6 mg/dL, International Normalized Ratio was 1.3. A complete blood count revealed a white blood cell count of 23,000/L, hemoglobin of 10.6 g/dL, and platelet count of 454,000/L. A urinalysis was unremarkable. Cultures of blood, urine, and sputum were collected. Head computed tomography was negative.
This patient has a combined anion gap and nongap metabolic acidosis, as well as respiratory alkalosis. Although his acute kidney failure could produce these 2 types of metabolic acidosis, the modest elevation of the serum creatinine is not commensurate with such profound acidosis. Similarly, sepsis without hypotension or more striking elevation in lactate levels would not account for the entirety of the acidosis. Severe diabetic ketoacidosis can result in profound metabolic acidosis, and marked hyperglycemia or hyperosmolarity could result in somnolence; however, his diabetes has been controlled without medication and there is no obvious precipitant for an episode of ketoacidosis.
Remaining causes of anion gap acidosis include ingestion of methanol, ethylene glycol, ethanol, or salicylates. A careful history of ingestions and medications from witnesses including any prehospital personnel might suggest a source of intoxication. Absent this information, the hypothermia favors an ingestion of an alcohol over salicylates, and the lack of urine crystals and the presence of prominent visual hallucinations would point more toward methanol poisoning than ethylene glycol. A serum osmolarity measurement would allow determination of the osmolar gap, which would be elevated in the setting of methanol or ethylene glycol poisoning. If he were this ill from ethanol, I would have expected to see evidence of hepatotoxicity.
I would administer sodium bicarbonate to reverse the acidosis and to promote renal clearance of salicylates, methanol, ethylene glycol, and their metabolites. Orogastric decontamination with activated charcoal should be considered. If the osmolar gap is elevated, I would also administer intravenous fomepizole to attempt to reverse methanol or ethylene glycol poisoning. I would not delay treatment while waiting for these serum levels to return.
Initial serologic toxicology performed in the emergency department revealed negative ethanol, salicylates, and ketones. His osmolar gap was 13 mOsm/kg. His acetaminophen level was 69 g/mL (normal 120 g/mL). A creatinine phosphokinase was 84 IU/L and myoglobin was 93 ng/mL. His subsequent serum toxicology screen was negative for methanol, ethylene glycol, isopropranol, and hippuric acid. Urine toxicology was positive for opiates, but negative for amphetamine, benzodiazepine, cannabinoid, and cocaine.
Serum and urine ketone assays typically involve the nitroprusside reaction and detect acetoacetate, but not ‐hydroxybutyrate, and can lead to negative test results early in diabetic or alcoholic ketoacidosis. However, the normal ethanol level argues against alcoholic ketoacidosis. Rare causes of elevated anion gap acidosis include toluene toxicity, acetaminophen poisoning, and ingestion of other alcohols. Toluene is metabolized to hippuric acid, and acetaminophen toxicity and associated glutathione depletion can lead to 5‐oxoproline accumulation, producing an anion gap. Patients who abuse alcohol are at risk for acetaminophen toxicity even at doses considered normal. However, this degree of encephalopathy would be unusual for acetaminophen toxicity unless liver failure had developed or unless there was another ingestion that might alter sensorium. Furthermore, the elevated osmolar gap is not a feature of acetaminophen poisoning. I would monitor liver enzyme tests and consider a serum ammonia level, but would not attribute the entire picture to acetaminophen.
The combination of elevated anion gap with an elevated osmolar gap narrows the diagnostic possibilities. Ingestion of several alcohols (ethanol, methanol, ethylene glycol, diethylene glycol) or toluene could produce these abnormalities. Of note, the osmolar gap is typically most markedly elevated early in methanol and ethylene glycol ingestions, and then as the parent compound is metabolized, the osmolar gap closes and the accumulation of metabolites produces the anion gap. Hallucinations are more common with methanol and toluene, and renal failure is more typical of ethylene glycol or toluene. The lack of oxalate crystalluria does not exclude ethylene glycol poisoning. Unfortunately, urine testing for oxalate crystals or fluorescein examination are neither sensitive nor specific enough to diagnosis ethylene glycol toxicity reliably. In most hospitals, assays used for serum testing for alcohols are insensitive, and require confirmation with gas chromatography performed at a specialty lab.
Additional history might reveal the likely culprit or culprits. Inhalant abuse including huffing would point to toluene or organic acid exposure. Solvent ingestion (eg, antifreeze, brake fluid) would suggest methanol or ethylene glycol. Absent this history, I remain suspicious for poisoning with methanol or ethylene glycol and would consider empiric treatment after urgent consultation with a medical toxicologist. A careful ophthalmologic exam might demonstrate characteristic features of methanol poisoning. Serum samples should be sent to a regional lab for analysis for alcohols and organic acids.
He was admitted to the intensive care unit, and empiric antibiotics started. He was empirically started on N‐acetylcysteine and sodium bicarbonate drips. However, his acidemia persisted and he required hemodialysis, which was initiated 12 hours after initial presentation. His acidemia and mental status quickly improved after hemodialysis. He was extubated on hospital day 2 and no longer required hemodialysis.
The differential diagnosis at this point consists of 3 main possibilities: ingestion of methanol, ethylene glycol, or inhalant abuse such as from toluene. The normal hippuric acid level points away from toluene, whereas serum levels can be misleading in the alcohol poisonings. Other discriminating features to consider include exposure history and unique clinical aspects. In this patient, an exposure history is lacking, but 4 clinical features stand out: visual hallucinations, acute kidney injury, mild lactic acidosis, and rapid improvement with hemodialysis. Both ethylene glycol and methanol toxicity may produce a mild lactic acidosis by increasing hepatic metabolism of pyruvate to lactate, and both are rapidly cleared by dialysis. Although it is tempting to place methanol at the top of the list of possibilities due to the report of visual hallucinations, the subjective visual complaints without objective exam corollaries (loss of visual acuity, abnormal pupillary reflexes, or optic disc hyperemia) are nonspecific and might be provoked by alcohol or an inhalant. Furthermore, the acute renal failure is much more typical of ethylene glycol, and thus I would consider ethylene glycol as being the more likely of the ingestions. Coingestion of multiple alcohols is a possibility, but it would be statistically less likely. Confirmation of ethylene glycol poisoning would consist of further insight into his exposures and measurement of levels using gas chromatography.
A urine sample from his emergency department presentation was sent to an outside lab for organic acid levels. Based on high clinical suspicion for 5‐oxoprolinemia (pyroglutamic acidemia) the patient was counseled to avoid any acetaminophen. His primary care provider was informed of this and acetaminophen was added as an adverse drug reaction. The patient left against medical advice soon after extubation. Following discharge, his 5‐oxoproline (pyroglutamic acid) level returned markedly elevated at greater than 10,000 mmol/mol creatinine (200 times the upper limit of normal).
Elevations in 5‐oxoproline levels in this patient most likely stem from glutathione depletion related to chronic acetaminophen use. Alcohol use and malnutrition may have heightened this patient's susceptibility. Despite the common occurrence of acetaminophen use in alcohol abusers or the malnourished, the rarity of severe 5‐oxoproline toxicity suggests unknown factors may be present in predisposed individuals, or under‐recognition. Although acetaminophen‐induced hepatotoxicity may occur along with 5‐oxoprolinemia, this does not always occur.
Several features led me away from this syndrome. First, its rarity lowered my pretest probability. Second, the lack of exposure history and details about the serum assays, specifically whether the measurements were confirmed by gas chromatography, reduced my confidence in eliminating more common ingestions. Third, several aspects proved to be less useful discriminating features: the mild elevation in osmolar gap, renal failure, and hallucinations, which in retrospect proved to be nonspecific.
The patient admitted that he had a longstanding use of acetaminophen in addition to using his girlfriend's acetaminophen‐hydrocodone. He had significant weight loss of over 50 pounds over the previous year, which he attributed to poor appetite. On further chart review, he had been admitted 3 times with a similar clinical presentation and recovered quickly with intensive and supportive care, with no etiology found at those times. He had 2 subsequent hospital admissions for altered mental status and respiratory failure, and his final hospitalization resulted in cardiac arrest and death.
DISCUSSION
5‐Oxoprolinemia is a rare, but potentially lethal cause of severe anion gap metabolic acidosis.[1, 2] The mechanism is thought to be impairment of glutathione metabolism, in the context of other predisposing factors. This can be a congenital error of metabolism, or can be acquired and exacerbated by acetaminophen use. Ingestion of acetaminophen leads to glutathione depletion, which in turn may precipitate accumulation of pyroglutamic acid and subsequent anion gap metabolic acidosis (Figure 1). Additional risk factors that may predispose patients to this condition include malnutrition, renal insufficiency, concurrent infection, and female gender.[1, 2, 3]
The diagnosis of 5‐oxoprolinemia is made via urine or serum organic acid analysis, testing routinely performed in pediatric populations when screening for congenital metabolic disorders. The pathophysiology suggests that obtaining a urine sample early in presentation, when acidosis is greatest, would lead to the highest 5‐oxoproline levels and best chance for diagnosis. Case patients have had normal levels prior to and in convalescent phases after the acute episode.[4] Given the long turnaround time for lab testing, presumptive diagnosis and treatment may be necessary.
Treatment of 5‐oxoprolinemia is primarily supportive, aimed at the metabolic acidosis. Fluid resuscitation and bicarbonate therapy are reasonable temporizing measures. Hemodialysis can clear 5‐oxoproline and may be indicated in severe acidosis.[5] Furthermore, the proposed pathophysiology suggests that administration of N‐acetylcysteine (NAC) may help to address the underlying process, but there are no trials to support a specific dosing regimen. However, given the fulminant presentation and common competing concern for acetaminophen toxicity, it is reasonable to initiate NAC aimed at treatment for possible acetaminophen overdose. Prevention of recurrence includes avoidance of acetaminophen, and counseling the patient to avoid acetaminophen in prescription combination medications and over‐the‐counter preparations.
Recent regulatory changes regarding acetaminophen/opioid combinations may reduce the incidence of 5‐oxoprolinemia. The US Food and Drug Administration has taken action to reduce adverse effects from acetaminophen exposure by limiting the amount of acetaminophen in opioid combination pills from 500 mg to a maximum of 325 mg per pill. This is aimed at preventing hepatotoxicity from ingestion of higher‐than‐recommended doses. However, clinicians should remember that 5‐oxoprolinemia can result from ingestion of acetaminophen at therapeutic levels.
Given its rare incidence, low clinical suspicion, and transient nature of confirmatory testing, it is likely this remains an underdiagnosed syndrome. In the case discussed, subsequent chart review demonstrated 5 previous admissions in multiple hospitals for severe transient anion gap acidosis. The likelihood that 5‐oxoprolinemia was missed in each of these cases supports a lack of awareness of this syndrome. In this patient, the discussant appropriately identified the possibility of 5‐oxoproline toxicity, but felt ethylene glycol ingestion was more likely. As this case underscores, a cornerstone in the management of suspected ingestions is empiric treatment for the most likely etiologies. Here, treatment for acetaminophen overdose and for methanol or ethylene glycol were warranted, and fortunately also addressed the rarer possibility of 5‐oxoproline toxicity.
The mnemonic MUDPILES is commonly used to identify possible causes of life‐threatening anion gap metabolic acidosis, as such heuristics have benefits in rapidly generating a differential diagnosis to guide initial evaluation. Given the fact that the traditional letter P (paraldehyde) in MUDPILES is no longer clinically utilized, some authors have suggested replacing this with pyroglutamic acid (a synonym of 5‐oxoproline). Such a change may help providers who have ruled out other causes of a high anion gap metabolic acidosis, facilitating diagnosis of this life‐threatening syndrome. In any case, clinicians must be mindful that simple memory aids may mislead clinicians, and a complete differential diagnosis may require more than a mnemonic.
TEACHING POINTS
- Acetaminophen use, even at therapeutic levels, can lead to 5‐oxoprolinemia, a potentially lethal anion gap metabolic acidosis.
- 5‐oxoprolinemia is likely related to glutathione depletion, worsened by acetaminophen, malnutrition, renal insufficiency, female gender, and infection. This implies theoretical benefit from administration of NAC for glutathione repletion.
- Mnemonics can be useful, but have limitations by way of oversimplification. This case suggests that changing the letter P in MUDPILES from paraldehyde to pyroglutamic acid could reduce underdiagnosis.
Disclosure: Nothing to report.
- , , , , . 5‐oxoprolinemia causing elevated anion gap metabolic acidosis in the setting of acetaminophen use. J Emerg Med. 2012;43(1):54–57.
- , , , . What is the clinical significance of 5‐oxoproline (pyroglutamic acid) in high anion gap metabolic acidosis following paracetamol (acetaminophen) exposure? Clin Toxicol (Phila). 2013;51(9):817–827.
- , , , , . Increased anion gap metabolic acidosis as a result of 5‐oxoproline (pyroglutamic acid): a role for acetaminophen. Clin J Am Soc Nephrol. 2006;1(3):441–447.
- , , , et al. Recurrent high anion gap metabolic acidosis secondary to 5‐oxoproline (pyroglutamic acid). Am J Kidney Dis. 2005;46(1):e4–e10.
- , , . Profound metabolic acidosis from pyroglutamic acidemia: an underappreciated cause of high anion gap metabolic acidosis. CJEM. 2010;12(5):449–452.
A 51‐year‐old man presented to the emergency department after 1 day of progressive dyspnea and increasing confusion.
Acute dyspnea most commonly stems from a cardiac or pulmonary disorder such as heart failure, acute coronary syndrome, pneumonia, pulmonary embolism, or exacerbations of asthma or chronic obstructive pulmonary disease. Less frequent cardiopulmonary considerations include pericardial or pleural effusion, pneumothorax, aspiration, and upper airway obstruction. Dyspnea might also be the initial manifestation of profound anemia or metabolic acidosis.
The presence of confusion suggests either a severe presentation of any of the aforementioned possibilities (with confusion resulting from hypoxia, hypercapnia, or hypotension); a multiorgan illness such as sepsis, malignancy, thromboembolic disease, vasculitis, thyroid dysfunction, or toxic ingestion; or a metabolic derangement related to the underlying cause of dyspnea (for example, hypercalcemia or hyponatremia associated with lung cancer).
Twelve hours prior to presentation, he started to have visual hallucinations. He denied fever, chills, cough, chest discomfort, palpitations, weight gain, headache, neck pain, or weakness.
Visual hallucinations could result from a toxic‐metabolic encephalopathy, such as drug overdose or withdrawal, liver or kidney failure, or hypoxia. A structural brain abnormality may also manifest with visual hallucination. Acute onset at age 51 and the absence of auditory hallucinations argue against a neurodegenerative illness and a primary psychiatric disturbance, respectively.
Episodic hallucinations would support the possibility of seizures, monocular hallucinations would point to a retinal or ocular problem, and a description of yellow‐green hue would suggest a side effect of digoxin.
His past medical history was remarkable for diet‐controlled type 2 diabetes mellitus, hypertension, hyperlipidemia, and chronic low back pain. His medications included metoprolol tartrate 25 mg twice daily, omeprazole 40 mg daily, baclofen 15 mg twice daily, oxycodone 30 mg 3 times daily, and hydrocodone 10 mg/acetaminophen 325 mg, 2 tablets 3 times daily as needed for back pain. He was a smoker with a 30 pack‐year history. He had a history of alcohol and cocaine use, but denied any recent substance use. He had no known history of obstructive pulmonary disease.
The patient takes 3 medications well known to cause confusion and hallucinations (oxycodone, hydrocodone, and baclofen), especially when they accumulate due to excessive ingestion or impaired clearance. Although these medications may suppress ventilatory drive, dyspnea would not be a common presenting complaint. He has risk factors for ischemic heart disease and cardiomyopathy, and his smoking history raises the possibility of malignancy.
On exam, the patient's temperature was 94.4C, heart rate 128 beats per minute, respiration rate 28 breaths per minute, blood pressure 155/63 mm Hg, and oxygen saturation 100% while breathing ambient air. The patient was cachectic and appeared in moderate respiratory distress. His pupils were equal and reactive to light, and extraocular movements were intact. He did not have scleral icterus, or cervical or clavicular lymphadenopathy. His oropharynx was negative for erythema, edema, or exudate. His cardiovascular exam revealed a regular tachycardia without rubs or diastolic gallops. There was a 2/6 systolic murmur heard best at left sternal border, without radiation. He did not have jugular venous distention. His pulmonary exam was notable for tachypnea but with normal vesicular breath sounds throughout. He did not have stridor, wheezing, rhonchi, or rales. His abdomen had normal bowel tones and was soft without tenderness, distention, or organomegaly. His extremities were warm, revealed normal pulses, and no edema was present. His joints were cool to palpation, without effusion. On neurologic exam, he was oriented to person and place and able to answer yes/no questions, but unable to provide detailed history. His speech was fluent. His motor exam was without focal deficits. His skin was without any notable lesions.
The constellation of findings does not point to a specific toxidrome. The finding of warm extremities in a hypothermic patient suggests heat loss due to inappropriate peripheral vasodilation. In the absence of vasodilators or features of aortic insufficiency, sepsis becomes a leading consideration. Infection could result in hypothermia and altered sensorium, and accompanying lactic acidosis could trigger tachypnea.
Shortly after admission, he became more somnolent and developed progressive respiratory distress, requiring intubation. Arterial blood gas revealed a pH of 6.93, PaCO2 20 mm Hg, PaO2 127 mm Hg, and HCO3 5 mEq/L. Other laboratory results included a lactate of 4.1 mmol/L, blood urea nitrogen 49 mg/dL, creatinine 2.3 mg/dL (0.8 at 1 month prior), sodium level of 143 mmol/L, chloride of 106 mmol/L, and bicarbonate level of 5 mg/dL. His aspartate aminotransferase was 34 IU/L, alanine transaminase was 28 IU/L, total bilirubin was 0.6 mg/dL, International Normalized Ratio was 1.3. A complete blood count revealed a white blood cell count of 23,000/L, hemoglobin of 10.6 g/dL, and platelet count of 454,000/L. A urinalysis was unremarkable. Cultures of blood, urine, and sputum were collected. Head computed tomography was negative.
This patient has a combined anion gap and nongap metabolic acidosis, as well as respiratory alkalosis. Although his acute kidney failure could produce these 2 types of metabolic acidosis, the modest elevation of the serum creatinine is not commensurate with such profound acidosis. Similarly, sepsis without hypotension or more striking elevation in lactate levels would not account for the entirety of the acidosis. Severe diabetic ketoacidosis can result in profound metabolic acidosis, and marked hyperglycemia or hyperosmolarity could result in somnolence; however, his diabetes has been controlled without medication and there is no obvious precipitant for an episode of ketoacidosis.
Remaining causes of anion gap acidosis include ingestion of methanol, ethylene glycol, ethanol, or salicylates. A careful history of ingestions and medications from witnesses including any prehospital personnel might suggest a source of intoxication. Absent this information, the hypothermia favors an ingestion of an alcohol over salicylates, and the lack of urine crystals and the presence of prominent visual hallucinations would point more toward methanol poisoning than ethylene glycol. A serum osmolarity measurement would allow determination of the osmolar gap, which would be elevated in the setting of methanol or ethylene glycol poisoning. If he were this ill from ethanol, I would have expected to see evidence of hepatotoxicity.
I would administer sodium bicarbonate to reverse the acidosis and to promote renal clearance of salicylates, methanol, ethylene glycol, and their metabolites. Orogastric decontamination with activated charcoal should be considered. If the osmolar gap is elevated, I would also administer intravenous fomepizole to attempt to reverse methanol or ethylene glycol poisoning. I would not delay treatment while waiting for these serum levels to return.
Initial serologic toxicology performed in the emergency department revealed negative ethanol, salicylates, and ketones. His osmolar gap was 13 mOsm/kg. His acetaminophen level was 69 g/mL (normal 120 g/mL). A creatinine phosphokinase was 84 IU/L and myoglobin was 93 ng/mL. His subsequent serum toxicology screen was negative for methanol, ethylene glycol, isopropranol, and hippuric acid. Urine toxicology was positive for opiates, but negative for amphetamine, benzodiazepine, cannabinoid, and cocaine.
Serum and urine ketone assays typically involve the nitroprusside reaction and detect acetoacetate, but not ‐hydroxybutyrate, and can lead to negative test results early in diabetic or alcoholic ketoacidosis. However, the normal ethanol level argues against alcoholic ketoacidosis. Rare causes of elevated anion gap acidosis include toluene toxicity, acetaminophen poisoning, and ingestion of other alcohols. Toluene is metabolized to hippuric acid, and acetaminophen toxicity and associated glutathione depletion can lead to 5‐oxoproline accumulation, producing an anion gap. Patients who abuse alcohol are at risk for acetaminophen toxicity even at doses considered normal. However, this degree of encephalopathy would be unusual for acetaminophen toxicity unless liver failure had developed or unless there was another ingestion that might alter sensorium. Furthermore, the elevated osmolar gap is not a feature of acetaminophen poisoning. I would monitor liver enzyme tests and consider a serum ammonia level, but would not attribute the entire picture to acetaminophen.
The combination of elevated anion gap with an elevated osmolar gap narrows the diagnostic possibilities. Ingestion of several alcohols (ethanol, methanol, ethylene glycol, diethylene glycol) or toluene could produce these abnormalities. Of note, the osmolar gap is typically most markedly elevated early in methanol and ethylene glycol ingestions, and then as the parent compound is metabolized, the osmolar gap closes and the accumulation of metabolites produces the anion gap. Hallucinations are more common with methanol and toluene, and renal failure is more typical of ethylene glycol or toluene. The lack of oxalate crystalluria does not exclude ethylene glycol poisoning. Unfortunately, urine testing for oxalate crystals or fluorescein examination are neither sensitive nor specific enough to diagnosis ethylene glycol toxicity reliably. In most hospitals, assays used for serum testing for alcohols are insensitive, and require confirmation with gas chromatography performed at a specialty lab.
Additional history might reveal the likely culprit or culprits. Inhalant abuse including huffing would point to toluene or organic acid exposure. Solvent ingestion (eg, antifreeze, brake fluid) would suggest methanol or ethylene glycol. Absent this history, I remain suspicious for poisoning with methanol or ethylene glycol and would consider empiric treatment after urgent consultation with a medical toxicologist. A careful ophthalmologic exam might demonstrate characteristic features of methanol poisoning. Serum samples should be sent to a regional lab for analysis for alcohols and organic acids.
He was admitted to the intensive care unit, and empiric antibiotics started. He was empirically started on N‐acetylcysteine and sodium bicarbonate drips. However, his acidemia persisted and he required hemodialysis, which was initiated 12 hours after initial presentation. His acidemia and mental status quickly improved after hemodialysis. He was extubated on hospital day 2 and no longer required hemodialysis.
The differential diagnosis at this point consists of 3 main possibilities: ingestion of methanol, ethylene glycol, or inhalant abuse such as from toluene. The normal hippuric acid level points away from toluene, whereas serum levels can be misleading in the alcohol poisonings. Other discriminating features to consider include exposure history and unique clinical aspects. In this patient, an exposure history is lacking, but 4 clinical features stand out: visual hallucinations, acute kidney injury, mild lactic acidosis, and rapid improvement with hemodialysis. Both ethylene glycol and methanol toxicity may produce a mild lactic acidosis by increasing hepatic metabolism of pyruvate to lactate, and both are rapidly cleared by dialysis. Although it is tempting to place methanol at the top of the list of possibilities due to the report of visual hallucinations, the subjective visual complaints without objective exam corollaries (loss of visual acuity, abnormal pupillary reflexes, or optic disc hyperemia) are nonspecific and might be provoked by alcohol or an inhalant. Furthermore, the acute renal failure is much more typical of ethylene glycol, and thus I would consider ethylene glycol as being the more likely of the ingestions. Coingestion of multiple alcohols is a possibility, but it would be statistically less likely. Confirmation of ethylene glycol poisoning would consist of further insight into his exposures and measurement of levels using gas chromatography.
A urine sample from his emergency department presentation was sent to an outside lab for organic acid levels. Based on high clinical suspicion for 5‐oxoprolinemia (pyroglutamic acidemia) the patient was counseled to avoid any acetaminophen. His primary care provider was informed of this and acetaminophen was added as an adverse drug reaction. The patient left against medical advice soon after extubation. Following discharge, his 5‐oxoproline (pyroglutamic acid) level returned markedly elevated at greater than 10,000 mmol/mol creatinine (200 times the upper limit of normal).
Elevations in 5‐oxoproline levels in this patient most likely stem from glutathione depletion related to chronic acetaminophen use. Alcohol use and malnutrition may have heightened this patient's susceptibility. Despite the common occurrence of acetaminophen use in alcohol abusers or the malnourished, the rarity of severe 5‐oxoproline toxicity suggests unknown factors may be present in predisposed individuals, or under‐recognition. Although acetaminophen‐induced hepatotoxicity may occur along with 5‐oxoprolinemia, this does not always occur.
Several features led me away from this syndrome. First, its rarity lowered my pretest probability. Second, the lack of exposure history and details about the serum assays, specifically whether the measurements were confirmed by gas chromatography, reduced my confidence in eliminating more common ingestions. Third, several aspects proved to be less useful discriminating features: the mild elevation in osmolar gap, renal failure, and hallucinations, which in retrospect proved to be nonspecific.
The patient admitted that he had a longstanding use of acetaminophen in addition to using his girlfriend's acetaminophen‐hydrocodone. He had significant weight loss of over 50 pounds over the previous year, which he attributed to poor appetite. On further chart review, he had been admitted 3 times with a similar clinical presentation and recovered quickly with intensive and supportive care, with no etiology found at those times. He had 2 subsequent hospital admissions for altered mental status and respiratory failure, and his final hospitalization resulted in cardiac arrest and death.
DISCUSSION
5‐Oxoprolinemia is a rare, but potentially lethal cause of severe anion gap metabolic acidosis.[1, 2] The mechanism is thought to be impairment of glutathione metabolism, in the context of other predisposing factors. This can be a congenital error of metabolism, or can be acquired and exacerbated by acetaminophen use. Ingestion of acetaminophen leads to glutathione depletion, which in turn may precipitate accumulation of pyroglutamic acid and subsequent anion gap metabolic acidosis (Figure 1). Additional risk factors that may predispose patients to this condition include malnutrition, renal insufficiency, concurrent infection, and female gender.[1, 2, 3]
The diagnosis of 5‐oxoprolinemia is made via urine or serum organic acid analysis, testing routinely performed in pediatric populations when screening for congenital metabolic disorders. The pathophysiology suggests that obtaining a urine sample early in presentation, when acidosis is greatest, would lead to the highest 5‐oxoproline levels and best chance for diagnosis. Case patients have had normal levels prior to and in convalescent phases after the acute episode.[4] Given the long turnaround time for lab testing, presumptive diagnosis and treatment may be necessary.
Treatment of 5‐oxoprolinemia is primarily supportive, aimed at the metabolic acidosis. Fluid resuscitation and bicarbonate therapy are reasonable temporizing measures. Hemodialysis can clear 5‐oxoproline and may be indicated in severe acidosis.[5] Furthermore, the proposed pathophysiology suggests that administration of N‐acetylcysteine (NAC) may help to address the underlying process, but there are no trials to support a specific dosing regimen. However, given the fulminant presentation and common competing concern for acetaminophen toxicity, it is reasonable to initiate NAC aimed at treatment for possible acetaminophen overdose. Prevention of recurrence includes avoidance of acetaminophen, and counseling the patient to avoid acetaminophen in prescription combination medications and over‐the‐counter preparations.
Recent regulatory changes regarding acetaminophen/opioid combinations may reduce the incidence of 5‐oxoprolinemia. The US Food and Drug Administration has taken action to reduce adverse effects from acetaminophen exposure by limiting the amount of acetaminophen in opioid combination pills from 500 mg to a maximum of 325 mg per pill. This is aimed at preventing hepatotoxicity from ingestion of higher‐than‐recommended doses. However, clinicians should remember that 5‐oxoprolinemia can result from ingestion of acetaminophen at therapeutic levels.
Given its rare incidence, low clinical suspicion, and transient nature of confirmatory testing, it is likely this remains an underdiagnosed syndrome. In the case discussed, subsequent chart review demonstrated 5 previous admissions in multiple hospitals for severe transient anion gap acidosis. The likelihood that 5‐oxoprolinemia was missed in each of these cases supports a lack of awareness of this syndrome. In this patient, the discussant appropriately identified the possibility of 5‐oxoproline toxicity, but felt ethylene glycol ingestion was more likely. As this case underscores, a cornerstone in the management of suspected ingestions is empiric treatment for the most likely etiologies. Here, treatment for acetaminophen overdose and for methanol or ethylene glycol were warranted, and fortunately also addressed the rarer possibility of 5‐oxoproline toxicity.
The mnemonic MUDPILES is commonly used to identify possible causes of life‐threatening anion gap metabolic acidosis, as such heuristics have benefits in rapidly generating a differential diagnosis to guide initial evaluation. Given the fact that the traditional letter P (paraldehyde) in MUDPILES is no longer clinically utilized, some authors have suggested replacing this with pyroglutamic acid (a synonym of 5‐oxoproline). Such a change may help providers who have ruled out other causes of a high anion gap metabolic acidosis, facilitating diagnosis of this life‐threatening syndrome. In any case, clinicians must be mindful that simple memory aids may mislead clinicians, and a complete differential diagnosis may require more than a mnemonic.
TEACHING POINTS
- Acetaminophen use, even at therapeutic levels, can lead to 5‐oxoprolinemia, a potentially lethal anion gap metabolic acidosis.
- 5‐oxoprolinemia is likely related to glutathione depletion, worsened by acetaminophen, malnutrition, renal insufficiency, female gender, and infection. This implies theoretical benefit from administration of NAC for glutathione repletion.
- Mnemonics can be useful, but have limitations by way of oversimplification. This case suggests that changing the letter P in MUDPILES from paraldehyde to pyroglutamic acid could reduce underdiagnosis.
Disclosure: Nothing to report.
A 51‐year‐old man presented to the emergency department after 1 day of progressive dyspnea and increasing confusion.
Acute dyspnea most commonly stems from a cardiac or pulmonary disorder such as heart failure, acute coronary syndrome, pneumonia, pulmonary embolism, or exacerbations of asthma or chronic obstructive pulmonary disease. Less frequent cardiopulmonary considerations include pericardial or pleural effusion, pneumothorax, aspiration, and upper airway obstruction. Dyspnea might also be the initial manifestation of profound anemia or metabolic acidosis.
The presence of confusion suggests either a severe presentation of any of the aforementioned possibilities (with confusion resulting from hypoxia, hypercapnia, or hypotension); a multiorgan illness such as sepsis, malignancy, thromboembolic disease, vasculitis, thyroid dysfunction, or toxic ingestion; or a metabolic derangement related to the underlying cause of dyspnea (for example, hypercalcemia or hyponatremia associated with lung cancer).
Twelve hours prior to presentation, he started to have visual hallucinations. He denied fever, chills, cough, chest discomfort, palpitations, weight gain, headache, neck pain, or weakness.
Visual hallucinations could result from a toxic‐metabolic encephalopathy, such as drug overdose or withdrawal, liver or kidney failure, or hypoxia. A structural brain abnormality may also manifest with visual hallucination. Acute onset at age 51 and the absence of auditory hallucinations argue against a neurodegenerative illness and a primary psychiatric disturbance, respectively.
Episodic hallucinations would support the possibility of seizures, monocular hallucinations would point to a retinal or ocular problem, and a description of yellow‐green hue would suggest a side effect of digoxin.
His past medical history was remarkable for diet‐controlled type 2 diabetes mellitus, hypertension, hyperlipidemia, and chronic low back pain. His medications included metoprolol tartrate 25 mg twice daily, omeprazole 40 mg daily, baclofen 15 mg twice daily, oxycodone 30 mg 3 times daily, and hydrocodone 10 mg/acetaminophen 325 mg, 2 tablets 3 times daily as needed for back pain. He was a smoker with a 30 pack‐year history. He had a history of alcohol and cocaine use, but denied any recent substance use. He had no known history of obstructive pulmonary disease.
The patient takes 3 medications well known to cause confusion and hallucinations (oxycodone, hydrocodone, and baclofen), especially when they accumulate due to excessive ingestion or impaired clearance. Although these medications may suppress ventilatory drive, dyspnea would not be a common presenting complaint. He has risk factors for ischemic heart disease and cardiomyopathy, and his smoking history raises the possibility of malignancy.
On exam, the patient's temperature was 94.4C, heart rate 128 beats per minute, respiration rate 28 breaths per minute, blood pressure 155/63 mm Hg, and oxygen saturation 100% while breathing ambient air. The patient was cachectic and appeared in moderate respiratory distress. His pupils were equal and reactive to light, and extraocular movements were intact. He did not have scleral icterus, or cervical or clavicular lymphadenopathy. His oropharynx was negative for erythema, edema, or exudate. His cardiovascular exam revealed a regular tachycardia without rubs or diastolic gallops. There was a 2/6 systolic murmur heard best at left sternal border, without radiation. He did not have jugular venous distention. His pulmonary exam was notable for tachypnea but with normal vesicular breath sounds throughout. He did not have stridor, wheezing, rhonchi, or rales. His abdomen had normal bowel tones and was soft without tenderness, distention, or organomegaly. His extremities were warm, revealed normal pulses, and no edema was present. His joints were cool to palpation, without effusion. On neurologic exam, he was oriented to person and place and able to answer yes/no questions, but unable to provide detailed history. His speech was fluent. His motor exam was without focal deficits. His skin was without any notable lesions.
The constellation of findings does not point to a specific toxidrome. The finding of warm extremities in a hypothermic patient suggests heat loss due to inappropriate peripheral vasodilation. In the absence of vasodilators or features of aortic insufficiency, sepsis becomes a leading consideration. Infection could result in hypothermia and altered sensorium, and accompanying lactic acidosis could trigger tachypnea.
Shortly after admission, he became more somnolent and developed progressive respiratory distress, requiring intubation. Arterial blood gas revealed a pH of 6.93, PaCO2 20 mm Hg, PaO2 127 mm Hg, and HCO3 5 mEq/L. Other laboratory results included a lactate of 4.1 mmol/L, blood urea nitrogen 49 mg/dL, creatinine 2.3 mg/dL (0.8 at 1 month prior), sodium level of 143 mmol/L, chloride of 106 mmol/L, and bicarbonate level of 5 mg/dL. His aspartate aminotransferase was 34 IU/L, alanine transaminase was 28 IU/L, total bilirubin was 0.6 mg/dL, International Normalized Ratio was 1.3. A complete blood count revealed a white blood cell count of 23,000/L, hemoglobin of 10.6 g/dL, and platelet count of 454,000/L. A urinalysis was unremarkable. Cultures of blood, urine, and sputum were collected. Head computed tomography was negative.
This patient has a combined anion gap and nongap metabolic acidosis, as well as respiratory alkalosis. Although his acute kidney failure could produce these 2 types of metabolic acidosis, the modest elevation of the serum creatinine is not commensurate with such profound acidosis. Similarly, sepsis without hypotension or more striking elevation in lactate levels would not account for the entirety of the acidosis. Severe diabetic ketoacidosis can result in profound metabolic acidosis, and marked hyperglycemia or hyperosmolarity could result in somnolence; however, his diabetes has been controlled without medication and there is no obvious precipitant for an episode of ketoacidosis.
Remaining causes of anion gap acidosis include ingestion of methanol, ethylene glycol, ethanol, or salicylates. A careful history of ingestions and medications from witnesses including any prehospital personnel might suggest a source of intoxication. Absent this information, the hypothermia favors an ingestion of an alcohol over salicylates, and the lack of urine crystals and the presence of prominent visual hallucinations would point more toward methanol poisoning than ethylene glycol. A serum osmolarity measurement would allow determination of the osmolar gap, which would be elevated in the setting of methanol or ethylene glycol poisoning. If he were this ill from ethanol, I would have expected to see evidence of hepatotoxicity.
I would administer sodium bicarbonate to reverse the acidosis and to promote renal clearance of salicylates, methanol, ethylene glycol, and their metabolites. Orogastric decontamination with activated charcoal should be considered. If the osmolar gap is elevated, I would also administer intravenous fomepizole to attempt to reverse methanol or ethylene glycol poisoning. I would not delay treatment while waiting for these serum levels to return.
Initial serologic toxicology performed in the emergency department revealed negative ethanol, salicylates, and ketones. His osmolar gap was 13 mOsm/kg. His acetaminophen level was 69 g/mL (normal 120 g/mL). A creatinine phosphokinase was 84 IU/L and myoglobin was 93 ng/mL. His subsequent serum toxicology screen was negative for methanol, ethylene glycol, isopropranol, and hippuric acid. Urine toxicology was positive for opiates, but negative for amphetamine, benzodiazepine, cannabinoid, and cocaine.
Serum and urine ketone assays typically involve the nitroprusside reaction and detect acetoacetate, but not ‐hydroxybutyrate, and can lead to negative test results early in diabetic or alcoholic ketoacidosis. However, the normal ethanol level argues against alcoholic ketoacidosis. Rare causes of elevated anion gap acidosis include toluene toxicity, acetaminophen poisoning, and ingestion of other alcohols. Toluene is metabolized to hippuric acid, and acetaminophen toxicity and associated glutathione depletion can lead to 5‐oxoproline accumulation, producing an anion gap. Patients who abuse alcohol are at risk for acetaminophen toxicity even at doses considered normal. However, this degree of encephalopathy would be unusual for acetaminophen toxicity unless liver failure had developed or unless there was another ingestion that might alter sensorium. Furthermore, the elevated osmolar gap is not a feature of acetaminophen poisoning. I would monitor liver enzyme tests and consider a serum ammonia level, but would not attribute the entire picture to acetaminophen.
The combination of elevated anion gap with an elevated osmolar gap narrows the diagnostic possibilities. Ingestion of several alcohols (ethanol, methanol, ethylene glycol, diethylene glycol) or toluene could produce these abnormalities. Of note, the osmolar gap is typically most markedly elevated early in methanol and ethylene glycol ingestions, and then as the parent compound is metabolized, the osmolar gap closes and the accumulation of metabolites produces the anion gap. Hallucinations are more common with methanol and toluene, and renal failure is more typical of ethylene glycol or toluene. The lack of oxalate crystalluria does not exclude ethylene glycol poisoning. Unfortunately, urine testing for oxalate crystals or fluorescein examination are neither sensitive nor specific enough to diagnosis ethylene glycol toxicity reliably. In most hospitals, assays used for serum testing for alcohols are insensitive, and require confirmation with gas chromatography performed at a specialty lab.
Additional history might reveal the likely culprit or culprits. Inhalant abuse including huffing would point to toluene or organic acid exposure. Solvent ingestion (eg, antifreeze, brake fluid) would suggest methanol or ethylene glycol. Absent this history, I remain suspicious for poisoning with methanol or ethylene glycol and would consider empiric treatment after urgent consultation with a medical toxicologist. A careful ophthalmologic exam might demonstrate characteristic features of methanol poisoning. Serum samples should be sent to a regional lab for analysis for alcohols and organic acids.
He was admitted to the intensive care unit, and empiric antibiotics started. He was empirically started on N‐acetylcysteine and sodium bicarbonate drips. However, his acidemia persisted and he required hemodialysis, which was initiated 12 hours after initial presentation. His acidemia and mental status quickly improved after hemodialysis. He was extubated on hospital day 2 and no longer required hemodialysis.
The differential diagnosis at this point consists of 3 main possibilities: ingestion of methanol, ethylene glycol, or inhalant abuse such as from toluene. The normal hippuric acid level points away from toluene, whereas serum levels can be misleading in the alcohol poisonings. Other discriminating features to consider include exposure history and unique clinical aspects. In this patient, an exposure history is lacking, but 4 clinical features stand out: visual hallucinations, acute kidney injury, mild lactic acidosis, and rapid improvement with hemodialysis. Both ethylene glycol and methanol toxicity may produce a mild lactic acidosis by increasing hepatic metabolism of pyruvate to lactate, and both are rapidly cleared by dialysis. Although it is tempting to place methanol at the top of the list of possibilities due to the report of visual hallucinations, the subjective visual complaints without objective exam corollaries (loss of visual acuity, abnormal pupillary reflexes, or optic disc hyperemia) are nonspecific and might be provoked by alcohol or an inhalant. Furthermore, the acute renal failure is much more typical of ethylene glycol, and thus I would consider ethylene glycol as being the more likely of the ingestions. Coingestion of multiple alcohols is a possibility, but it would be statistically less likely. Confirmation of ethylene glycol poisoning would consist of further insight into his exposures and measurement of levels using gas chromatography.
A urine sample from his emergency department presentation was sent to an outside lab for organic acid levels. Based on high clinical suspicion for 5‐oxoprolinemia (pyroglutamic acidemia) the patient was counseled to avoid any acetaminophen. His primary care provider was informed of this and acetaminophen was added as an adverse drug reaction. The patient left against medical advice soon after extubation. Following discharge, his 5‐oxoproline (pyroglutamic acid) level returned markedly elevated at greater than 10,000 mmol/mol creatinine (200 times the upper limit of normal).
Elevations in 5‐oxoproline levels in this patient most likely stem from glutathione depletion related to chronic acetaminophen use. Alcohol use and malnutrition may have heightened this patient's susceptibility. Despite the common occurrence of acetaminophen use in alcohol abusers or the malnourished, the rarity of severe 5‐oxoproline toxicity suggests unknown factors may be present in predisposed individuals, or under‐recognition. Although acetaminophen‐induced hepatotoxicity may occur along with 5‐oxoprolinemia, this does not always occur.
Several features led me away from this syndrome. First, its rarity lowered my pretest probability. Second, the lack of exposure history and details about the serum assays, specifically whether the measurements were confirmed by gas chromatography, reduced my confidence in eliminating more common ingestions. Third, several aspects proved to be less useful discriminating features: the mild elevation in osmolar gap, renal failure, and hallucinations, which in retrospect proved to be nonspecific.
The patient admitted that he had a longstanding use of acetaminophen in addition to using his girlfriend's acetaminophen‐hydrocodone. He had significant weight loss of over 50 pounds over the previous year, which he attributed to poor appetite. On further chart review, he had been admitted 3 times with a similar clinical presentation and recovered quickly with intensive and supportive care, with no etiology found at those times. He had 2 subsequent hospital admissions for altered mental status and respiratory failure, and his final hospitalization resulted in cardiac arrest and death.
DISCUSSION
5‐Oxoprolinemia is a rare, but potentially lethal cause of severe anion gap metabolic acidosis.[1, 2] The mechanism is thought to be impairment of glutathione metabolism, in the context of other predisposing factors. This can be a congenital error of metabolism, or can be acquired and exacerbated by acetaminophen use. Ingestion of acetaminophen leads to glutathione depletion, which in turn may precipitate accumulation of pyroglutamic acid and subsequent anion gap metabolic acidosis (Figure 1). Additional risk factors that may predispose patients to this condition include malnutrition, renal insufficiency, concurrent infection, and female gender.[1, 2, 3]
The diagnosis of 5‐oxoprolinemia is made via urine or serum organic acid analysis, testing routinely performed in pediatric populations when screening for congenital metabolic disorders. The pathophysiology suggests that obtaining a urine sample early in presentation, when acidosis is greatest, would lead to the highest 5‐oxoproline levels and best chance for diagnosis. Case patients have had normal levels prior to and in convalescent phases after the acute episode.[4] Given the long turnaround time for lab testing, presumptive diagnosis and treatment may be necessary.
Treatment of 5‐oxoprolinemia is primarily supportive, aimed at the metabolic acidosis. Fluid resuscitation and bicarbonate therapy are reasonable temporizing measures. Hemodialysis can clear 5‐oxoproline and may be indicated in severe acidosis.[5] Furthermore, the proposed pathophysiology suggests that administration of N‐acetylcysteine (NAC) may help to address the underlying process, but there are no trials to support a specific dosing regimen. However, given the fulminant presentation and common competing concern for acetaminophen toxicity, it is reasonable to initiate NAC aimed at treatment for possible acetaminophen overdose. Prevention of recurrence includes avoidance of acetaminophen, and counseling the patient to avoid acetaminophen in prescription combination medications and over‐the‐counter preparations.
Recent regulatory changes regarding acetaminophen/opioid combinations may reduce the incidence of 5‐oxoprolinemia. The US Food and Drug Administration has taken action to reduce adverse effects from acetaminophen exposure by limiting the amount of acetaminophen in opioid combination pills from 500 mg to a maximum of 325 mg per pill. This is aimed at preventing hepatotoxicity from ingestion of higher‐than‐recommended doses. However, clinicians should remember that 5‐oxoprolinemia can result from ingestion of acetaminophen at therapeutic levels.
Given its rare incidence, low clinical suspicion, and transient nature of confirmatory testing, it is likely this remains an underdiagnosed syndrome. In the case discussed, subsequent chart review demonstrated 5 previous admissions in multiple hospitals for severe transient anion gap acidosis. The likelihood that 5‐oxoprolinemia was missed in each of these cases supports a lack of awareness of this syndrome. In this patient, the discussant appropriately identified the possibility of 5‐oxoproline toxicity, but felt ethylene glycol ingestion was more likely. As this case underscores, a cornerstone in the management of suspected ingestions is empiric treatment for the most likely etiologies. Here, treatment for acetaminophen overdose and for methanol or ethylene glycol were warranted, and fortunately also addressed the rarer possibility of 5‐oxoproline toxicity.
The mnemonic MUDPILES is commonly used to identify possible causes of life‐threatening anion gap metabolic acidosis, as such heuristics have benefits in rapidly generating a differential diagnosis to guide initial evaluation. Given the fact that the traditional letter P (paraldehyde) in MUDPILES is no longer clinically utilized, some authors have suggested replacing this with pyroglutamic acid (a synonym of 5‐oxoproline). Such a change may help providers who have ruled out other causes of a high anion gap metabolic acidosis, facilitating diagnosis of this life‐threatening syndrome. In any case, clinicians must be mindful that simple memory aids may mislead clinicians, and a complete differential diagnosis may require more than a mnemonic.
TEACHING POINTS
- Acetaminophen use, even at therapeutic levels, can lead to 5‐oxoprolinemia, a potentially lethal anion gap metabolic acidosis.
- 5‐oxoprolinemia is likely related to glutathione depletion, worsened by acetaminophen, malnutrition, renal insufficiency, female gender, and infection. This implies theoretical benefit from administration of NAC for glutathione repletion.
- Mnemonics can be useful, but have limitations by way of oversimplification. This case suggests that changing the letter P in MUDPILES from paraldehyde to pyroglutamic acid could reduce underdiagnosis.
Disclosure: Nothing to report.
- , , , , . 5‐oxoprolinemia causing elevated anion gap metabolic acidosis in the setting of acetaminophen use. J Emerg Med. 2012;43(1):54–57.
- , , , . What is the clinical significance of 5‐oxoproline (pyroglutamic acid) in high anion gap metabolic acidosis following paracetamol (acetaminophen) exposure? Clin Toxicol (Phila). 2013;51(9):817–827.
- , , , , . Increased anion gap metabolic acidosis as a result of 5‐oxoproline (pyroglutamic acid): a role for acetaminophen. Clin J Am Soc Nephrol. 2006;1(3):441–447.
- , , , et al. Recurrent high anion gap metabolic acidosis secondary to 5‐oxoproline (pyroglutamic acid). Am J Kidney Dis. 2005;46(1):e4–e10.
- , , . Profound metabolic acidosis from pyroglutamic acidemia: an underappreciated cause of high anion gap metabolic acidosis. CJEM. 2010;12(5):449–452.
- , , , , . 5‐oxoprolinemia causing elevated anion gap metabolic acidosis in the setting of acetaminophen use. J Emerg Med. 2012;43(1):54–57.
- , , , . What is the clinical significance of 5‐oxoproline (pyroglutamic acid) in high anion gap metabolic acidosis following paracetamol (acetaminophen) exposure? Clin Toxicol (Phila). 2013;51(9):817–827.
- , , , , . Increased anion gap metabolic acidosis as a result of 5‐oxoproline (pyroglutamic acid): a role for acetaminophen. Clin J Am Soc Nephrol. 2006;1(3):441–447.
- , , , et al. Recurrent high anion gap metabolic acidosis secondary to 5‐oxoproline (pyroglutamic acid). Am J Kidney Dis. 2005;46(1):e4–e10.
- , , . Profound metabolic acidosis from pyroglutamic acidemia: an underappreciated cause of high anion gap metabolic acidosis. CJEM. 2010;12(5):449–452.