User login
Bob Wachter's New Book Examines Healthcare in Digital Age

This month, Bob Wachter, MD, MHM, chief of the division of hospital medicine at the University of California San Francisco Medical Center and well known for his work in patient safety and healthcare quality, debuts his latest book, The Digital Doctor: Hope, Hype, and Harm at the Dawn of Medicine’s Computer Age. The book explores the realities of U.S. efforts to bring healthcare into the digital age.
Dr. Wachter is especially concerned with the consequences—both intended and unintended—of health information technology. The Hospitalist spoke with Dr. Wachter about why he wrote the book and asked him about some of the burning issues facing hospitalists today.
Question: In the book’s introduction, you state that while computers are preventing medical errors, they are also causing new kinds of mistakes. One was a case at your hospital in which an adolescent was given a 39-fold overdose of a routine antibiotic. What was it about this case that galvanized you to write the book?
Answer: A few weeks after the error, I attended the root cause analysis, and my jaw just fell and fell. I was struck by the disconnect between what we’d been saying for years—‘When we finally get computers, we’re going to fix so many of these problems’—and the reality, that in about as wired an environment as you can imagine, we managed to give a kid 40 pills. [The patient had a seizure but survived.] Clearly, the case was partly about a glitchy computer system. But the larger problems related to the troubling people-computer interfaces. That’s what I wanted to address in the book.
Q: How did you secure buy-in from the hospital, the involved providers, and the family to write about the case?
A: In 2004, I wrote a book, Internal Bleeding, in which we presented many cases of medical mistakes, some of them fatal. We managed to keep the cases anonymous, and from this and similar projects, I developed a reputation for doing this kind of thing diplomatically and carefully. I think that’s why the risk manager didn’t reject the idea out of hand, and, ultimately, my CMO and CEO agreed to it as well. After that, I approached the involved clinicians and the patient and his mother. To everyone’s credit—the providers, the administrators, and the patient and family—they believed that this case was so important that we should be open and honest about it. My experience is that people are sometimes trying to find some meaning in a horrible event, and that meaning can come from helping to prevent a similar case in the future.

Q: What are some of the tensions that affect the interface between frontline providers and healthcare IT?
A: In the book, I contrast the way the healthcare IT companies build their systems—with relatively little input from clinicians—with the philosophy at Boeing, where they bring pilots into the process to develop cockpit computers. There is a powerful concept known as “adaptive change,” as contrasted with technical change. Technical change is like a cookbook: Put in a set of rules, have people follow them, and everything works out fine. Adaptive change is more complex and subtle; it requires the intense involvement of frontline workers.
We made the mistake of treating health IT as technical change, but it is probably the hardest adaptive change we’ve ever tried. My goal was to create a national conversation about this, which is what we need if we’re going to get it right.
Gretchen Henkel is a freelance writer in California.
This month, Bob Wachter, MD, MHM, chief of the division of hospital medicine at the University of California San Francisco Medical Center and well known for his work in patient safety and healthcare quality, debuts his latest book, The Digital Doctor: Hope, Hype, and Harm at the Dawn of Medicine’s Computer Age. The book explores the realities of U.S. efforts to bring healthcare into the digital age.
Dr. Wachter is especially concerned with the consequences—both intended and unintended—of health information technology. The Hospitalist spoke with Dr. Wachter about why he wrote the book and asked him about some of the burning issues facing hospitalists today.
Question: In the book’s introduction, you state that while computers are preventing medical errors, they are also causing new kinds of mistakes. One was a case at your hospital in which an adolescent was given a 39-fold overdose of a routine antibiotic. What was it about this case that galvanized you to write the book?
Answer: A few weeks after the error, I attended the root cause analysis, and my jaw just fell and fell. I was struck by the disconnect between what we’d been saying for years—‘When we finally get computers, we’re going to fix so many of these problems’—and the reality, that in about as wired an environment as you can imagine, we managed to give a kid 40 pills. [The patient had a seizure but survived.] Clearly, the case was partly about a glitchy computer system. But the larger problems related to the troubling people-computer interfaces. That’s what I wanted to address in the book.
Q: How did you secure buy-in from the hospital, the involved providers, and the family to write about the case?
A: In 2004, I wrote a book, Internal Bleeding, in which we presented many cases of medical mistakes, some of them fatal. We managed to keep the cases anonymous, and from this and similar projects, I developed a reputation for doing this kind of thing diplomatically and carefully. I think that’s why the risk manager didn’t reject the idea out of hand, and, ultimately, my CMO and CEO agreed to it as well. After that, I approached the involved clinicians and the patient and his mother. To everyone’s credit—the providers, the administrators, and the patient and family—they believed that this case was so important that we should be open and honest about it. My experience is that people are sometimes trying to find some meaning in a horrible event, and that meaning can come from helping to prevent a similar case in the future.
Q: What are some of the tensions that affect the interface between frontline providers and healthcare IT?
A: In the book, I contrast the way the healthcare IT companies build their systems—with relatively little input from clinicians—with the philosophy at Boeing, where they bring pilots into the process to develop cockpit computers. There is a powerful concept known as “adaptive change,” as contrasted with technical change. Technical change is like a cookbook: Put in a set of rules, have people follow them, and everything works out fine. Adaptive change is more complex and subtle; it requires the intense involvement of frontline workers.
We made the mistake of treating health IT as technical change, but it is probably the hardest adaptive change we’ve ever tried. My goal was to create a national conversation about this, which is what we need if we’re going to get it right.
Gretchen Henkel is a freelance writer in California.
Why Compassion in Patient Care Should Matter to Hospitalists
Hospitalists care for a variety of different types of patients, serving anyone and everyone in need of acute care. Because of the nature of our work, it is difficult to maintain empathy and compassion for all of our patients, especially in light of our unpredictable workload, long hours, and high stress. As such, all hospitalists need to be aware of what exactly compassion is, why it matters, and what we can do to guard against its natural erosion.
What Is Compassion? What Is Empathy?
Wikipedia defines compassion as “the emotion that one feels in response to the suffering of others that motivates a desire to help.” The Latin derivation of compassion is “co-suffering.” Empathy is the ability to see and understand another’s suffering. So compassion is more than just empathy or “co-suffering”; with compassion comes yearning and a motivation to alleviate suffering in others.
Many important pieces within the definition of compassion need more explanation. Notice the three distinct “parts” of the definition: “the emotion that one feels”… “in response to the suffering of others”…“that motivates a desire to help.”
The first part outlines the fact that we have to be willing and able to conjure up an emotion toward and with our patients. Although this may sound basic, some physicians purposefully guard themselves against forming emotional responses toward or with their patients. Some actually think it will make them better—and more “objective”—providers if they guard against the (potentially) painful burden of sharing such empathic emotions.
Social science research has found that providers’ concerns about becoming emotionally exhausted might lead them to reduce their compassion for entire groups of patients, such as mentally ill or drug-addicted patient populations. There is also evidence that your ability to have empathy or compassion for another correlates with the ability to picture yourself with the same issue the patient suffers. This causes a major obstacle for many providers, who find themselves unable to relate to patients with “self-inflicted” issues, such as habits that increase the likelihood of disease (e.g. smoking) or not participating in habits that decrease the likelihood of disease or successful treatments (e.g. not exercising or not taking medications correctly).
Providers are more likely to be compassionate toward patients with whom they can identify; I would have enormous compassion for a 43-year-old female with new-onset ovarian cancer but would have less compassion for a 43-year-old male with new-onset alcohol withdrawal seizures.
The second part of the definition brings up the need to acknowledge suffering, in whatever form it takes. When we think of suffering, we often connect the idea with physical pain. But there are innumerable forms of nonphysical human suffering, including psychological and social trauma; this includes the anxiety that arises from known and unknown diagnoses and treatments and the emotional exhaustion resulting from such diagnoses and treatments. We need to be able to acknowledge all forms of suffering, not just physical suffering.
The last part of the definition shows that after we have allowed ourselves to “feel” the emotion of others and to acknowledge all walks of suffering, we then need to be motivated to help. For a hospitalist, this would mean “going the extra mile” for patients, such as continuously checking and rechecking on how treatments are (or are not) working, keeping the patient and family informed (in their terms) about what is happening, or ensuring that transitions of care (to other services or in/out of the hospital) are done with keen attention to reduce the risk of “voltage drops” in information.
Two videos help illustrate the nature of compassion (see the video sidebar for URLs). Both depict young women who have been called upon to sing the national anthem before a large crowd at an athletic gathering. Both women are clearly excellent singers, and both have a similar outcome in mind: to sing the national anthem in a manner pleasing to everyone in the crowd. In both cases, they forgot the words of the song.
In the first scenario, the woman is heckled, literally “booed,” then quickly shuffled off the ice rink after falling backwards on the ice. In the second scenario, a similarly talented young woman starts out strong, then forgets the words. An unrelated gentleman comes to her aid, puts his arm around her, and sings the words with her. As he continues, he looks to the audience, making hand signals to encourage them to join in supporting her during this presumably highly anxious moment.
The second scenario exemplifies all three components of compassion: The gentleman feels the singer’s anxiety, he acknowledges her “suffering,” and he is motivated to help. What I noticed about his assistance is that he is not even a very good singer! But his kind persuasion and ability to motivate the entire crowd in assisting her remarkably transform the outcome for both the singer and the crowd.
Though both scenarios start quite similarly, they end remarkably differently; the second scenario was completely changed by the compassion of a single person and a simple act of human kindness.
Why It Matters, and How to Build It
As depicted in these short videos, compassion can completely change outcomes. You will not find placebo-controlled randomized trials to support what I just stated. But there are plenty of social science studies to support the notion that compassion is a learned trait that can be improved or eroded over time, depending on the willingness of the person to try.
Compassion is a learned behavior. It is not a personality trait that you either have or you don’t. It is a set of behaviors and actions that can be learned and practiced, and even perfected, for those willing.
The Cleveland Clinic has created several videos (see video info box) that help us consider how to think about the nature of compassion and how to learn and practice it. A hospital is ripe with emotion in all areas, from the elevators to the hallways to the cafeteria. Due to the nature of our work, we are all at risk of compassion erosion toward our patients.
We first have to acknowledge such a risk is present and actively seek out opportunities, as depicted in these videos, to learn and practice compassion. As the Dalai Lama once said, “Compassion is a necessity, not a luxury.” We should all learn, demonstrate, and live compassion as a necessity in our practice.

Compassion Scenarios
National anthem videos:


Cleveland Clinic training videos:
www.youtube.com/watch?v=cDDWvj_q-o8
www.youtube.com/watch?v=1e1JxPCDme4
Hospitalists care for a variety of different types of patients, serving anyone and everyone in need of acute care. Because of the nature of our work, it is difficult to maintain empathy and compassion for all of our patients, especially in light of our unpredictable workload, long hours, and high stress. As such, all hospitalists need to be aware of what exactly compassion is, why it matters, and what we can do to guard against its natural erosion.
What Is Compassion? What Is Empathy?
Wikipedia defines compassion as “the emotion that one feels in response to the suffering of others that motivates a desire to help.” The Latin derivation of compassion is “co-suffering.” Empathy is the ability to see and understand another’s suffering. So compassion is more than just empathy or “co-suffering”; with compassion comes yearning and a motivation to alleviate suffering in others.
Many important pieces within the definition of compassion need more explanation. Notice the three distinct “parts” of the definition: “the emotion that one feels”… “in response to the suffering of others”…“that motivates a desire to help.”
The first part outlines the fact that we have to be willing and able to conjure up an emotion toward and with our patients. Although this may sound basic, some physicians purposefully guard themselves against forming emotional responses toward or with their patients. Some actually think it will make them better—and more “objective”—providers if they guard against the (potentially) painful burden of sharing such empathic emotions.
Social science research has found that providers’ concerns about becoming emotionally exhausted might lead them to reduce their compassion for entire groups of patients, such as mentally ill or drug-addicted patient populations. There is also evidence that your ability to have empathy or compassion for another correlates with the ability to picture yourself with the same issue the patient suffers. This causes a major obstacle for many providers, who find themselves unable to relate to patients with “self-inflicted” issues, such as habits that increase the likelihood of disease (e.g. smoking) or not participating in habits that decrease the likelihood of disease or successful treatments (e.g. not exercising or not taking medications correctly).
Providers are more likely to be compassionate toward patients with whom they can identify; I would have enormous compassion for a 43-year-old female with new-onset ovarian cancer but would have less compassion for a 43-year-old male with new-onset alcohol withdrawal seizures.
The second part of the definition brings up the need to acknowledge suffering, in whatever form it takes. When we think of suffering, we often connect the idea with physical pain. But there are innumerable forms of nonphysical human suffering, including psychological and social trauma; this includes the anxiety that arises from known and unknown diagnoses and treatments and the emotional exhaustion resulting from such diagnoses and treatments. We need to be able to acknowledge all forms of suffering, not just physical suffering.
The last part of the definition shows that after we have allowed ourselves to “feel” the emotion of others and to acknowledge all walks of suffering, we then need to be motivated to help. For a hospitalist, this would mean “going the extra mile” for patients, such as continuously checking and rechecking on how treatments are (or are not) working, keeping the patient and family informed (in their terms) about what is happening, or ensuring that transitions of care (to other services or in/out of the hospital) are done with keen attention to reduce the risk of “voltage drops” in information.
Two videos help illustrate the nature of compassion (see the video sidebar for URLs). Both depict young women who have been called upon to sing the national anthem before a large crowd at an athletic gathering. Both women are clearly excellent singers, and both have a similar outcome in mind: to sing the national anthem in a manner pleasing to everyone in the crowd. In both cases, they forgot the words of the song.
In the first scenario, the woman is heckled, literally “booed,” then quickly shuffled off the ice rink after falling backwards on the ice. In the second scenario, a similarly talented young woman starts out strong, then forgets the words. An unrelated gentleman comes to her aid, puts his arm around her, and sings the words with her. As he continues, he looks to the audience, making hand signals to encourage them to join in supporting her during this presumably highly anxious moment.
The second scenario exemplifies all three components of compassion: The gentleman feels the singer’s anxiety, he acknowledges her “suffering,” and he is motivated to help. What I noticed about his assistance is that he is not even a very good singer! But his kind persuasion and ability to motivate the entire crowd in assisting her remarkably transform the outcome for both the singer and the crowd.
Though both scenarios start quite similarly, they end remarkably differently; the second scenario was completely changed by the compassion of a single person and a simple act of human kindness.
Why It Matters, and How to Build It
As depicted in these short videos, compassion can completely change outcomes. You will not find placebo-controlled randomized trials to support what I just stated. But there are plenty of social science studies to support the notion that compassion is a learned trait that can be improved or eroded over time, depending on the willingness of the person to try.
Compassion is a learned behavior. It is not a personality trait that you either have or you don’t. It is a set of behaviors and actions that can be learned and practiced, and even perfected, for those willing.
The Cleveland Clinic has created several videos (see video info box) that help us consider how to think about the nature of compassion and how to learn and practice it. A hospital is ripe with emotion in all areas, from the elevators to the hallways to the cafeteria. Due to the nature of our work, we are all at risk of compassion erosion toward our patients.
We first have to acknowledge such a risk is present and actively seek out opportunities, as depicted in these videos, to learn and practice compassion. As the Dalai Lama once said, “Compassion is a necessity, not a luxury.” We should all learn, demonstrate, and live compassion as a necessity in our practice.
Compassion Scenarios
National anthem videos:
Cleveland Clinic training videos:
www.youtube.com/watch?v=cDDWvj_q-o8
www.youtube.com/watch?v=1e1JxPCDme4
What Is the Appropriate Medical and Interventional Treatment for Hyperacute Ischemic Stroke?
Case
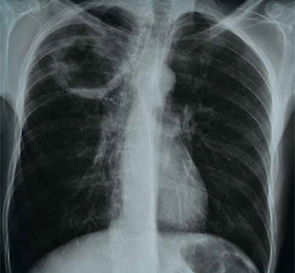
A 70-year-old woman was brought to the ED by ambulance with slurred speech after a fall. She arrived in the ED three hours and 29 minutes after the last time she was known to be normal. On initial examination, she had a National Institutes of Health Stroke Scale (NIHSS) score of 13, with a left facial droop, left hemiplegia, and right gaze deviation. Her acute noncontrast head computed tomography (CT), CT angiogram, and CT perfusion scans are shown in Figure 1.
How should this patient’s acute stroke be managed at this time?
Overview
Pathophysiology/Epidemiology: Stroke is the fourth most common cause of death in the United States and the main cause of disability, resulting in substantial healthcare expenditures.1 Ischemic stroke accounts for about 85% of all stroke cases and has several subtypes. The most common causes of ischemic stroke are small vessel thrombosis, large vessel thromboembolism, and cardioembolism. Both small vessel thrombosis and large vessel thromboembolism often are related to typical atherosclerotic risk factors, and cardioembolism is most often related to atrial fibrillation/flutter.
Minimizing death and disability from stroke is dependent on prevention measures, as well as early response to the onset of symptoms. The typical patient loses 1.9 million neurons for every minute a stroke is untreated—hence the popular adage “Time is Brain.”2 Although the appropriate management and time window of stroke treatment have been somewhat controversial, the acuity of treatment is now undisputed. Intravenous thrombolysis with tPA, also known as alteplase, has been an FDA-approved treatment for stroke since 1996, yet, as of 2006, only 2.4% of patients hospitalized for ischemic stroke were treated with IV tPA.3
The etiology of stroke, in most cases, does not change management in the hyperacute period, when thrombolysis is appropriate regardless of etiology.
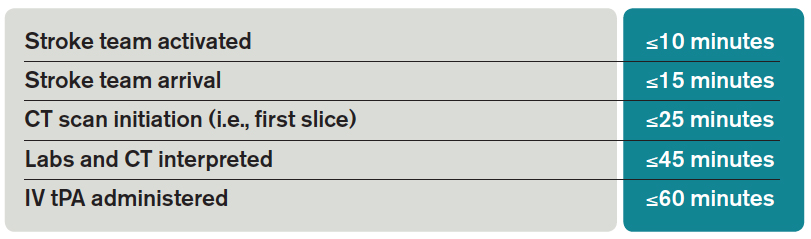
Timely evaluation: Although recognition of stroke symptoms by the public and pre-hospital management is a barrier in the treatment of acute stroke, this article will focus on appropriate ED and in-hospital treatment of stroke. Given the urgent need for management of acute ischemic stroke, it is critical that hospitals have an efficient process for identifying possible strokes and beginning treatment early. In order to accomplish these objectives, the National Institute of Neurological Disorders and Stroke (NINDS) has established goals for time frames of evaluation and management of patients with stroke in the ED (see Table 1).4
The role of the hospitalist: Hospitalists can play critical roles both as part of a primary stroke team and in identifying missed strokes. Some acute stroke teams have included hospitalists due to their ability to help with medical management, identify mimics, and assess medical contraindications to thrombolytic therapy. In addition, hospitalists may be the first to recognize a stroke in the ED when evaluating a patient with symptoms confused with a medical condition, or when a stroke occurs in an inpatient. In both of these situations, as first responders, hospitalists have knowledge of stroke evaluation and treatment that is crucial in beginning the evaluation and triggering a stroke alert.
Diagnostic tools: The initial evaluation of a patient with a possible stroke includes a brief but thorough history of current symptoms, as well as past medical and medication histories. The most critical piece of information to obtain from patients, family members, or bystanders is the time of symptom onset, or the time the patient was last known normal, so that the options for treatment can be evaluated early.
After basic stabilization of ABCs—airway maintenance, breathing and ventilation, and circulation— a brief but thorough neurologic examination is critical to define severity of neurologic injury and to help localize injury. Some standardized tools help with rapid assessment, including the NIHSS. The NIHSS is a standardized and reproducible evaluation that can be performed by many different specialties and levels of healthcare providers and provides information about stroke severity, localization, and prognosis.5 NIHSS offers free online certification.
Imaging: Early brain imaging and interpretation is another important piece of the acute evaluation of stroke. The most commonly used first-line imaging is noncontrast head CT, which is widely available and quickly performed. This type of imaging is sensitive for intracranial hemorrhage and can help distinguish nonvascular causes of symptoms such as tumor. CT is not sensitive for early signs of infarct, and, most often, initial CT findings are normal in early ischemic stroke. In patients who are candidates for intravenous fibrinolysis, ruling out hemorrhage is the main priority. Noncontrast head CT is the only imaging necessary to make decisions regarding IV thrombolytic treatment.
For further treatment decisions beyond IV tPA, intracranial and extracranial vascular imaging can help with decision making. All patients with stroke should have extracranial vascular imaging to help determine the etiology of stroke and evaluate the need for carotid endarterectomy or stenting for symptomatic stenosis in the days to weeks after stroke. More acutely, vascular imaging can be used to identify large vessel occlusions, in consideration of endovascular intervention (discussed in further detail below). CT angiography, magnetic resonance (MR) angiography, and conventional angiography are all options for evaluating the vasculature, though the first two are generally used as a noninvasive first step. Carotid ultrasound is often considered but only evaluates the extracranial anterior circulation; posterior circulation vessel abnormalities (like dissection) and intracranial abnormalities (like stenosis) may be missed. Although tPA decisions are not based upon these imaging modalities, secondary stroke prevention decisions may be altered by the findings.4
Perfusion imaging is the newest addition to acute stroke imaging, but its utility in guiding decision making remains unclear. Perfusion imaging provides hemodynamic information, ideally to identify areas of infarct versus ischemic penumbra, an area at risk of becoming ischemic. The use of perfusion imaging to identify good candidates for reperfusion (with IV tPA or with interventional techniques) is controversial.9 It is clear that perfusion imaging should not delay the time to treatment for IV tPA within the 4.5-hour window.
Windows: Current guidelines for administration of IV tPA for acute stroke are based in large part on two pivotal studies—the NINDS tPA Stroke Trial and the European Cooperative Acute Stroke Study III (ECASS III).6,7 IV alteplase for the treatment of acute stroke was approved by the FDA in 1996 following publication of the NINDS tPA Stroke Trial. This placebo-controlled randomized trial of 624 patients within three hours of ischemic stroke onset found that treatment with IV alteplase improved the odds of minimal or no disability at three months by approximately 30%. The rate of symptomatic intracranial hemorrhage was higher in the tPA group (6.4%) compared to the placebo group (0.6%), but mortality was not significantly different at three months. Though the benefit of IV tPA was clear in the three-hour window, subgroup analyses and further studies have clarified that treatment earlier in the window provides further benefit.
Given the difficulty of achieving treatment in short time windows, further studies have aimed to evaluate the utility of IV thrombolysis beyond the three-hour time window. While early studies found no clear benefit in extending the window, pooled analyses suggested a benefit in the three to 4.5-hour window, and ECASS III was designed to evaluate this window. This randomized placebo-controlled study used similar inclusion criteria to the NINDS study, with the exception of the time window, and excluded patients more than 80 years old, with large stroke (NIHSS score greater than 25), on anticoagulation (regardless of INR [international normalized ratio]), and with a history of prior stroke and diabetes. Again, in line with prior findings of time-dependent response to tPA, the study found that the IV tPA group were more likely than the placebo group to have good functional outcomes at three months, but the magnitude of this effect was lower than the one seen in the studies of the zero- to three-hour window. The rate of symptomatic intracranial hemorrhage in the 4.5-hour window was 7.9% using the NINDS tPA Stroke Trial criteria.
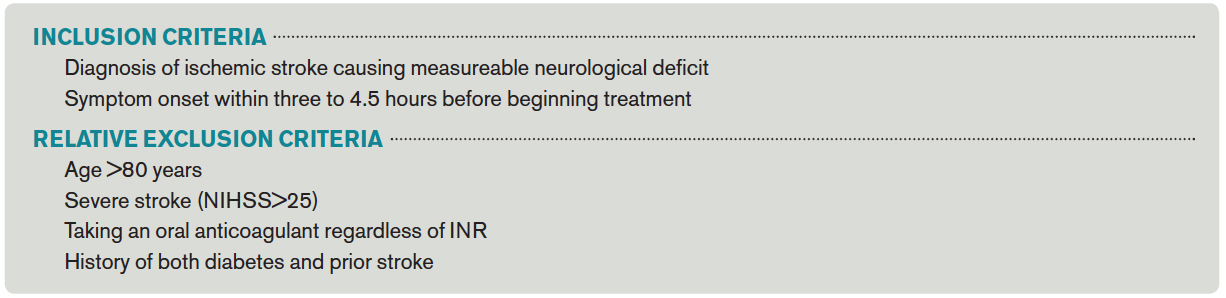
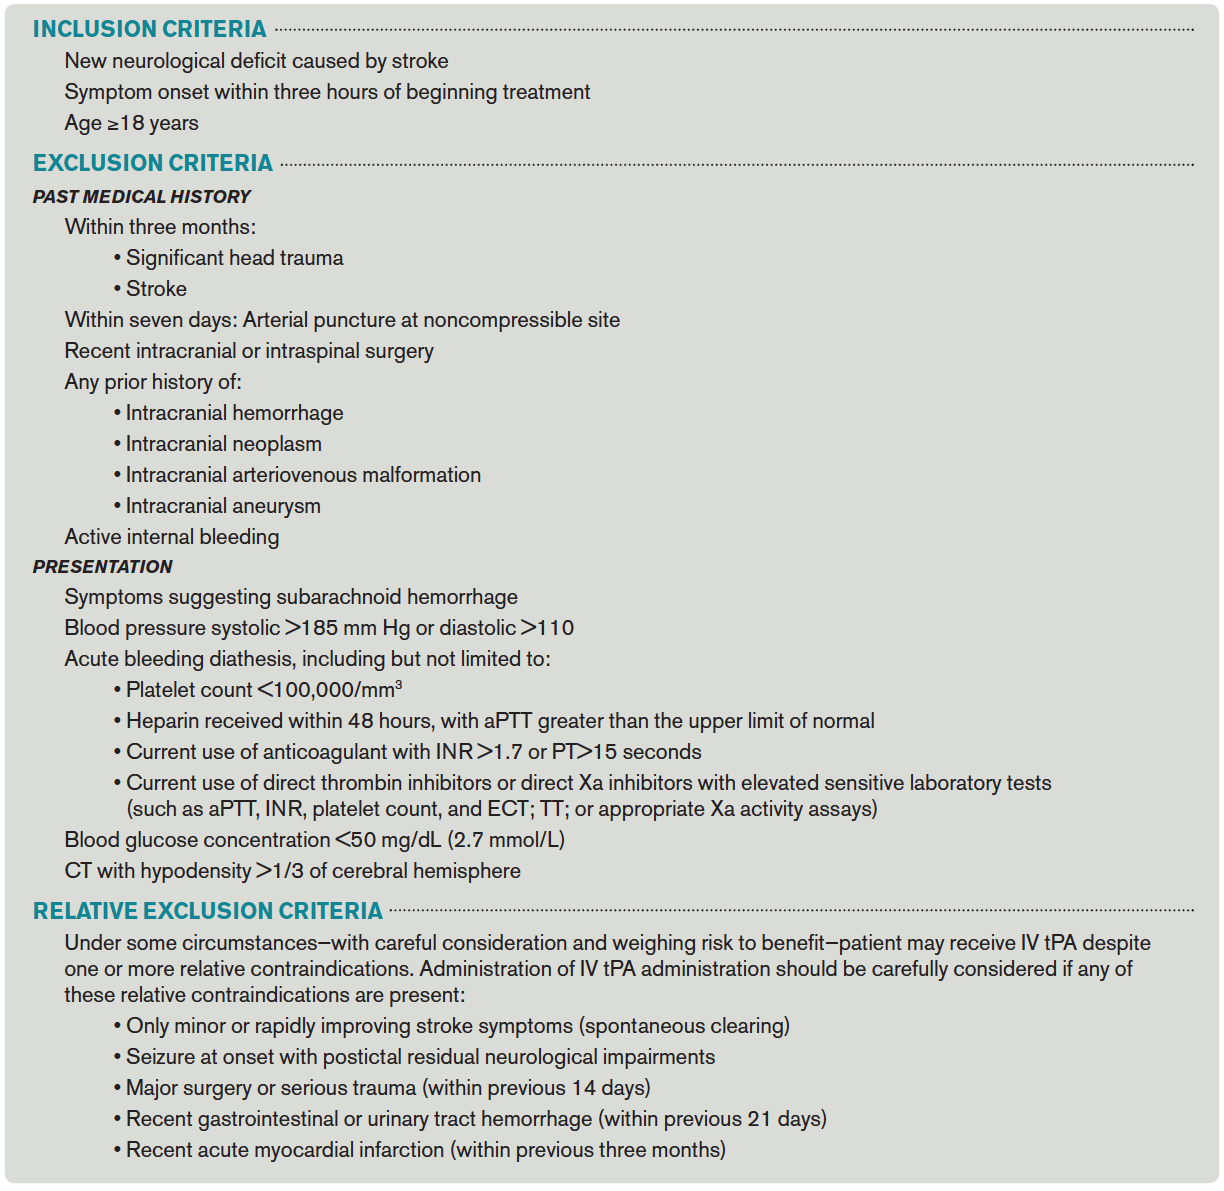
The American Heart Association/American Stroke Association (AHA/ASA) guidelines now recommend the use of IV tPA for patients within three hours of onset of ischemic stroke, with treatment initiated as quickly as possible (Class I; Level A). Although it has not been FDA approved, IV tPA treatment of eligible patients within the three to 4.5-hour window is recommended as Class I-Level B evidence with exclusions as in the ECASS study.4 Inclusion and exclusion criteria for tPA according to AHA/ASA guidelines can be found in Table 2.
IA thrombolysis/thrombectomy: Over the last two decades, there has been great interest in endovascular treatment of acute ischemic stroke and large advances in the numbers and types of treatments available. The FDA has approved multiple devices developed for mechanical thrombectomy based on their ability to recanalize vessels; however, to date, there is no clear evidence that thrombectomy improves patient outcomes. Several studies of endovascular therapy were recently published, including the Interventional Management of Stroke III (IMS 3) study, the Mechanical Retrieval and Recanalization of Stroke Clots using Embolectomy (MR RESCUE) study, and the SYNTHESIS Expansion study.8,9,10 None of these studies showed a benefit to endovascular treatment; however, critics have pointed out many flaws in these studies, including protracted time to treatment and patient selection. Furthermore, the most recent devices, like Solitaire and Trevo, were not used in most patients.
Three more recent trials found promising results for interventional treatment.11-13 The trials ranged from 70 to 500 patients with anterior circulation strokes with a large vessel occlusion; each study found a statistically significant improvement in functional independence at three months in the intervention group.12,13 Intravenous tPA was given in 72.7% to 100% of patients.11,12 Intervention to reperfusion was very quick in each study.
Some possible reasons for the more successful outcomes include the high proportion of newer devices for thrombectomy used and rapid treatment of symptoms, with symptom onset to groin puncture medians ranging from 185 minutes to 260 minutes.11,13 It remains clear that careful patient selection should occur, and those who are not candidates for intravenous therapy who present inside an appropriate time window could be considered. Time from symptom onset continues to be an important piece of making decisions about candidates for interventional treatment, but some advocate for the use of advanced imaging modalities, such as DWI imaging on MRI, or MR, or CT perfusion imaging, to help decide who could be a candidate.
Back to the Case
IV tPA was given to the patient 30 minutes after presentation. She met all inclusion and exclusion criteria for treatment and received the best-proven therapy for acute ischemic stroke. Due to her severe symptoms, the neurointerventional team was consulted for possible thrombectomy. This decision is controversial, as there is no proven benefit to intraarterial therapy. She was a possible candidate because of her time to presentation, large vessel occlusion, and substantial penumbra with CT imaging (see Figure 1).
About 20 minutes after treatment, she began to improve, now lifting her left arm and leg against gravity and showing less dysarthria. The decision was made to perform a conventional angiogram to reevaluate her blood vessels and to consider thrombectomy based upon the result. The majority of her middle cerebral artery had recanalized, so no further interventions were needed.
Bottom Line
Intravenous tPA (alteplase) is indicated for patients presenting within 4.5 hours of last known normal. Careful patient selection should occur if additional therapies are considered.
Drs. Poisson and Simpson are a neurohospitalists in the department of neurology at the University of Colorado Denver in Aurora.
References
- Go AS, Mozaffarian D, Roger VL, et al. Heart disease and stroke statistics–2014 update: a report from the American Heart Association. Circulation. 2014;129(3):e28-e292.
- Saver JL. Time is brain–quantified. Stroke. 2006;37(1):263-266.
- Fang MC, Cutler DM, Rosen AB. Trends in thrombolytic use for ischemic stroke in the United States. J Hosp Med. 2010;5(7):406-409.
- Jauch EC, Saver JL, Adams HP Jr, et al. Guidelines for the early management of patients with acute ischemic stroke: a guideline for healthcare professionals from the American Heart Association/American Stroke Association. Stroke. 2013;44(3):870-947. Lyden P, Raman R, Liu L, Emr M, Warren M, Marler
- J. National Institutes of Health Stroke Scale certification is reliable across multiple venues. Stroke. 2009;40(7):2507-2511.
- Tissue plasminogen activator for acute ischemic stroke. The National Institute of Neurological Disorders and Stroke rt-PA Stroke Study Group. N Engl J Med. 1995;333(24):1581-1587.
- Hacke W, Kaste M, Bluhmki E, et al. Thrombolysis with alteplase 3 to 4.5 hours after acute ischemic stroke. N Engl J Med. 2008;359(13):1317-1329. Broderick JP, Palesch YY, Demchuk AM, et al Endovascular therapy after intravenous t-PA versus t-PA alone for stroke. N Engl J Med. 2013;368(10):893-903.
- Kidwell CS, Jahan R, Gornbein J, et al. A trial of imaging selection and endovascular treatment for ischemic stroke. N Engl J Med. 2013;368(10):914-923.
- Ciccone A, Valvassori L, Nichelatti M, et al. SYNTHESIS Expansion Investigators. Endovascular treatment for acute ischemic stroke. N Engl J Med. 2013;368(10):904-913.
- Goyal M, Demchuk AM, Menon BK, et al. Randomized assessment of rapid endovascular treatment of ischemic stroke. N Engl J Med. 2015;372(11):1019-1030.
- Campbell BC, Mitchell PJ, Kleinig TJ, et al. Endovascular therapy for ischemic stroke with perfusion-imaging selection. N Engl J Med. 2015;372(11):1009-1018.
- Berkhemer OA, Fransen PS, Beumer D, et al. A randomized trial of intraarterial treatment for acute ischemic stroke. N Engl J Med. 2015;372(1):11-20.
Case
A 70-year-old woman was brought to the ED by ambulance with slurred speech after a fall. She arrived in the ED three hours and 29 minutes after the last time she was known to be normal. On initial examination, she had a National Institutes of Health Stroke Scale (NIHSS) score of 13, with a left facial droop, left hemiplegia, and right gaze deviation. Her acute noncontrast head computed tomography (CT), CT angiogram, and CT perfusion scans are shown in Figure 1.
How should this patient’s acute stroke be managed at this time?
Overview
Pathophysiology/Epidemiology: Stroke is the fourth most common cause of death in the United States and the main cause of disability, resulting in substantial healthcare expenditures.1 Ischemic stroke accounts for about 85% of all stroke cases and has several subtypes. The most common causes of ischemic stroke are small vessel thrombosis, large vessel thromboembolism, and cardioembolism. Both small vessel thrombosis and large vessel thromboembolism often are related to typical atherosclerotic risk factors, and cardioembolism is most often related to atrial fibrillation/flutter.
Minimizing death and disability from stroke is dependent on prevention measures, as well as early response to the onset of symptoms. The typical patient loses 1.9 million neurons for every minute a stroke is untreated—hence the popular adage “Time is Brain.”2 Although the appropriate management and time window of stroke treatment have been somewhat controversial, the acuity of treatment is now undisputed. Intravenous thrombolysis with tPA, also known as alteplase, has been an FDA-approved treatment for stroke since 1996, yet, as of 2006, only 2.4% of patients hospitalized for ischemic stroke were treated with IV tPA.3
The etiology of stroke, in most cases, does not change management in the hyperacute period, when thrombolysis is appropriate regardless of etiology.
Timely evaluation: Although recognition of stroke symptoms by the public and pre-hospital management is a barrier in the treatment of acute stroke, this article will focus on appropriate ED and in-hospital treatment of stroke. Given the urgent need for management of acute ischemic stroke, it is critical that hospitals have an efficient process for identifying possible strokes and beginning treatment early. In order to accomplish these objectives, the National Institute of Neurological Disorders and Stroke (NINDS) has established goals for time frames of evaluation and management of patients with stroke in the ED (see Table 1).4
The role of the hospitalist: Hospitalists can play critical roles both as part of a primary stroke team and in identifying missed strokes. Some acute stroke teams have included hospitalists due to their ability to help with medical management, identify mimics, and assess medical contraindications to thrombolytic therapy. In addition, hospitalists may be the first to recognize a stroke in the ED when evaluating a patient with symptoms confused with a medical condition, or when a stroke occurs in an inpatient. In both of these situations, as first responders, hospitalists have knowledge of stroke evaluation and treatment that is crucial in beginning the evaluation and triggering a stroke alert.
Diagnostic tools: The initial evaluation of a patient with a possible stroke includes a brief but thorough history of current symptoms, as well as past medical and medication histories. The most critical piece of information to obtain from patients, family members, or bystanders is the time of symptom onset, or the time the patient was last known normal, so that the options for treatment can be evaluated early.
After basic stabilization of ABCs—airway maintenance, breathing and ventilation, and circulation— a brief but thorough neurologic examination is critical to define severity of neurologic injury and to help localize injury. Some standardized tools help with rapid assessment, including the NIHSS. The NIHSS is a standardized and reproducible evaluation that can be performed by many different specialties and levels of healthcare providers and provides information about stroke severity, localization, and prognosis.5 NIHSS offers free online certification.
Imaging: Early brain imaging and interpretation is another important piece of the acute evaluation of stroke. The most commonly used first-line imaging is noncontrast head CT, which is widely available and quickly performed. This type of imaging is sensitive for intracranial hemorrhage and can help distinguish nonvascular causes of symptoms such as tumor. CT is not sensitive for early signs of infarct, and, most often, initial CT findings are normal in early ischemic stroke. In patients who are candidates for intravenous fibrinolysis, ruling out hemorrhage is the main priority. Noncontrast head CT is the only imaging necessary to make decisions regarding IV thrombolytic treatment.
For further treatment decisions beyond IV tPA, intracranial and extracranial vascular imaging can help with decision making. All patients with stroke should have extracranial vascular imaging to help determine the etiology of stroke and evaluate the need for carotid endarterectomy or stenting for symptomatic stenosis in the days to weeks after stroke. More acutely, vascular imaging can be used to identify large vessel occlusions, in consideration of endovascular intervention (discussed in further detail below). CT angiography, magnetic resonance (MR) angiography, and conventional angiography are all options for evaluating the vasculature, though the first two are generally used as a noninvasive first step. Carotid ultrasound is often considered but only evaluates the extracranial anterior circulation; posterior circulation vessel abnormalities (like dissection) and intracranial abnormalities (like stenosis) may be missed. Although tPA decisions are not based upon these imaging modalities, secondary stroke prevention decisions may be altered by the findings.4
Perfusion imaging is the newest addition to acute stroke imaging, but its utility in guiding decision making remains unclear. Perfusion imaging provides hemodynamic information, ideally to identify areas of infarct versus ischemic penumbra, an area at risk of becoming ischemic. The use of perfusion imaging to identify good candidates for reperfusion (with IV tPA or with interventional techniques) is controversial.9 It is clear that perfusion imaging should not delay the time to treatment for IV tPA within the 4.5-hour window.
Windows: Current guidelines for administration of IV tPA for acute stroke are based in large part on two pivotal studies—the NINDS tPA Stroke Trial and the European Cooperative Acute Stroke Study III (ECASS III).6,7 IV alteplase for the treatment of acute stroke was approved by the FDA in 1996 following publication of the NINDS tPA Stroke Trial. This placebo-controlled randomized trial of 624 patients within three hours of ischemic stroke onset found that treatment with IV alteplase improved the odds of minimal or no disability at three months by approximately 30%. The rate of symptomatic intracranial hemorrhage was higher in the tPA group (6.4%) compared to the placebo group (0.6%), but mortality was not significantly different at three months. Though the benefit of IV tPA was clear in the three-hour window, subgroup analyses and further studies have clarified that treatment earlier in the window provides further benefit.
Given the difficulty of achieving treatment in short time windows, further studies have aimed to evaluate the utility of IV thrombolysis beyond the three-hour time window. While early studies found no clear benefit in extending the window, pooled analyses suggested a benefit in the three to 4.5-hour window, and ECASS III was designed to evaluate this window. This randomized placebo-controlled study used similar inclusion criteria to the NINDS study, with the exception of the time window, and excluded patients more than 80 years old, with large stroke (NIHSS score greater than 25), on anticoagulation (regardless of INR [international normalized ratio]), and with a history of prior stroke and diabetes. Again, in line with prior findings of time-dependent response to tPA, the study found that the IV tPA group were more likely than the placebo group to have good functional outcomes at three months, but the magnitude of this effect was lower than the one seen in the studies of the zero- to three-hour window. The rate of symptomatic intracranial hemorrhage in the 4.5-hour window was 7.9% using the NINDS tPA Stroke Trial criteria.
The American Heart Association/American Stroke Association (AHA/ASA) guidelines now recommend the use of IV tPA for patients within three hours of onset of ischemic stroke, with treatment initiated as quickly as possible (Class I; Level A). Although it has not been FDA approved, IV tPA treatment of eligible patients within the three to 4.5-hour window is recommended as Class I-Level B evidence with exclusions as in the ECASS study.4 Inclusion and exclusion criteria for tPA according to AHA/ASA guidelines can be found in Table 2.
IA thrombolysis/thrombectomy: Over the last two decades, there has been great interest in endovascular treatment of acute ischemic stroke and large advances in the numbers and types of treatments available. The FDA has approved multiple devices developed for mechanical thrombectomy based on their ability to recanalize vessels; however, to date, there is no clear evidence that thrombectomy improves patient outcomes. Several studies of endovascular therapy were recently published, including the Interventional Management of Stroke III (IMS 3) study, the Mechanical Retrieval and Recanalization of Stroke Clots using Embolectomy (MR RESCUE) study, and the SYNTHESIS Expansion study.8,9,10 None of these studies showed a benefit to endovascular treatment; however, critics have pointed out many flaws in these studies, including protracted time to treatment and patient selection. Furthermore, the most recent devices, like Solitaire and Trevo, were not used in most patients.
Three more recent trials found promising results for interventional treatment.11-13 The trials ranged from 70 to 500 patients with anterior circulation strokes with a large vessel occlusion; each study found a statistically significant improvement in functional independence at three months in the intervention group.12,13 Intravenous tPA was given in 72.7% to 100% of patients.11,12 Intervention to reperfusion was very quick in each study.
Some possible reasons for the more successful outcomes include the high proportion of newer devices for thrombectomy used and rapid treatment of symptoms, with symptom onset to groin puncture medians ranging from 185 minutes to 260 minutes.11,13 It remains clear that careful patient selection should occur, and those who are not candidates for intravenous therapy who present inside an appropriate time window could be considered. Time from symptom onset continues to be an important piece of making decisions about candidates for interventional treatment, but some advocate for the use of advanced imaging modalities, such as DWI imaging on MRI, or MR, or CT perfusion imaging, to help decide who could be a candidate.
Back to the Case
IV tPA was given to the patient 30 minutes after presentation. She met all inclusion and exclusion criteria for treatment and received the best-proven therapy for acute ischemic stroke. Due to her severe symptoms, the neurointerventional team was consulted for possible thrombectomy. This decision is controversial, as there is no proven benefit to intraarterial therapy. She was a possible candidate because of her time to presentation, large vessel occlusion, and substantial penumbra with CT imaging (see Figure 1).
About 20 minutes after treatment, she began to improve, now lifting her left arm and leg against gravity and showing less dysarthria. The decision was made to perform a conventional angiogram to reevaluate her blood vessels and to consider thrombectomy based upon the result. The majority of her middle cerebral artery had recanalized, so no further interventions were needed.
Bottom Line
Intravenous tPA (alteplase) is indicated for patients presenting within 4.5 hours of last known normal. Careful patient selection should occur if additional therapies are considered.
Drs. Poisson and Simpson are a neurohospitalists in the department of neurology at the University of Colorado Denver in Aurora.
References
- Go AS, Mozaffarian D, Roger VL, et al. Heart disease and stroke statistics–2014 update: a report from the American Heart Association. Circulation. 2014;129(3):e28-e292.
- Saver JL. Time is brain–quantified. Stroke. 2006;37(1):263-266.
- Fang MC, Cutler DM, Rosen AB. Trends in thrombolytic use for ischemic stroke in the United States. J Hosp Med. 2010;5(7):406-409.
- Jauch EC, Saver JL, Adams HP Jr, et al. Guidelines for the early management of patients with acute ischemic stroke: a guideline for healthcare professionals from the American Heart Association/American Stroke Association. Stroke. 2013;44(3):870-947. Lyden P, Raman R, Liu L, Emr M, Warren M, Marler
- J. National Institutes of Health Stroke Scale certification is reliable across multiple venues. Stroke. 2009;40(7):2507-2511.
- Tissue plasminogen activator for acute ischemic stroke. The National Institute of Neurological Disorders and Stroke rt-PA Stroke Study Group. N Engl J Med. 1995;333(24):1581-1587.
- Hacke W, Kaste M, Bluhmki E, et al. Thrombolysis with alteplase 3 to 4.5 hours after acute ischemic stroke. N Engl J Med. 2008;359(13):1317-1329. Broderick JP, Palesch YY, Demchuk AM, et al Endovascular therapy after intravenous t-PA versus t-PA alone for stroke. N Engl J Med. 2013;368(10):893-903.
- Kidwell CS, Jahan R, Gornbein J, et al. A trial of imaging selection and endovascular treatment for ischemic stroke. N Engl J Med. 2013;368(10):914-923.
- Ciccone A, Valvassori L, Nichelatti M, et al. SYNTHESIS Expansion Investigators. Endovascular treatment for acute ischemic stroke. N Engl J Med. 2013;368(10):904-913.
- Goyal M, Demchuk AM, Menon BK, et al. Randomized assessment of rapid endovascular treatment of ischemic stroke. N Engl J Med. 2015;372(11):1019-1030.
- Campbell BC, Mitchell PJ, Kleinig TJ, et al. Endovascular therapy for ischemic stroke with perfusion-imaging selection. N Engl J Med. 2015;372(11):1009-1018.
- Berkhemer OA, Fransen PS, Beumer D, et al. A randomized trial of intraarterial treatment for acute ischemic stroke. N Engl J Med. 2015;372(1):11-20.
Expedited Multistate Medical Licensure Promises Efficiency for Physicians
For hospitalists who want to relocate to another state, practice in multiple states, provide telemedicine services, or take on some per diem work, this should be of interest. As part of the feasibility study on an Interstate Medical Licensure Compact, the Federation of State Medical Boards (FSMB) “allied in common purpose to develop a comprehensive process that complements the existing licensing and regulatory authority of state medical boards” and, therefore, to provide physicians with an efficient process to become licensed in multiple states.
Put simply, FSMB intends to work with the states to simplify and expedite state licensure.
The compact boasts of positively impacting physician shortage areas, leveraging the portability of care and expertise, and, in the end, not just making licensure much easier, but also favorably influencing patient safety. In a press release, the CEO of FSMB, Humayun Chaudhry, DO, MS, MACP, FACOI, stated that the compact “offers an effective solution to the question of how best to balance patient safety and quality care with the needs of a growing and changing healthcare market.” The compact promises to systematize the ability of physicians to obtain licensure in multiple states.
From a hospitalist’s perspective, the compact has a lot to offer. Hospitalists do not have a “panel” of patients that we will follow indefinitely. This allows for an enormous amount of flexibility to consider additional work, to take on per diem opportunities, and also to practice telemedicine as a “telehospitalist” in multiple states. Such flexibility would invariably mean getting licensed in several states. Getting a license in a newer state (one that takes part in the compact) should become easier once all of your credentials have been duly verified and are readily accessible. Essentially, there will be a repository of verified credentials and any disciplinary actions that will be promptly available, simplifying the process quite a bit for the applicant, as well as for the state boards. At the end of the day, the jurisdiction, execution, and authority to issue the license will always belong to the state medical boards, maintaining the integrity of the Medical Practice Act. From a physician’s perceptive, participation is entirely voluntary.
At the time of writing this, upwards of 25 states have shown enthusiasm towards this compact, 15 states have introduced a bill for the compact, including Alabama, Idaho, Illinois, Iowa, Maryland, Minnesota, Montana, Nebraska, Nevada, Oklahoma, Rhode Island, South Dakota, Texas, Utah, Vermont, West Virginia, and Wyoming, and the support continues to grow. The compact already has cleared legislative houses in Wyoming and South Dakota, and are now awaiting the governor’s signature.
For example, some argue that the high licensing fees on initial issuance and reissuance by the state medical boards may be hard to justify once a simplified licensing mechanism is in place; despite this concern, momentum and enthusiasm for the compact continue to grow. SHM, having applauded the FSMB’s efforts in its letter of support, will also likely be calling upon local chapters to promote these initiatives. Generally speaking, the interstate compact would be beneficial, offering a multistate licensure process that would be exponentially quicker than the one we currently have. I applaud the FSMB’s efforts in spearheading this endeavor.
Want to further discuss the Interstate Medical Licensure Compact? Add to my discussion on HMX.
For more information, visit the FSMB website.
Dr. Deepak Asudani, MD, MPH, FHM, is an academic hospitalist at the University of California San Diego, and is a member of the SHM Public Policy Committee. At UCSD Hospital Medicine, he directs Global Health Initiatives and is involved in developing educational programs for international students including their clinical training and simulation experiences.
HM15 Session Analysis: End-of-Life Discussions
Presenter: Julia Ragland, MD, FHM
Summation: Discussion of Prognosis in Advance Illness is a key component of informed decision-making and should be undertaken during a “Sentinel Hospitalization” and at times of other “triggers”. End-of-Life discussions are critical for providing the best care for patients with advanced diseases.
A Sentinel Hospitalization is a hospitalization in the patient’s disease course that heralds a need to reassess prognosis, patient understanding, treatment options and intensities, and goals of care.
Other triggers for discussing prognosis: new diagnosis of serious illness, major medical decision with uncertain outcome, frequent hospitalizations for advanced disease, patient/family query prognosis, patient/family request treatment inconsistent with good clinical judgment (futile care), patient actively dying, “No” answer to “Surprise Question” (“would you be surprised if this patient died in the next year?”)
How can we prognosticate? Data from studies, Clinical intuition and experience, Prognostic indices, Key indicators of worsening prognosis (declining functional status, weight loss/malnutrition, co-morbidities, frequent hospitalizations)
Resources for Prognostication: ePrognosis, Seattle Heart Failure Model, MELD, Charlson Comorbidity Index, MJHSpalliativeinstitute.org/e-learning, Palliative Care Fast Facts mobile app
Ask-Tell-Ask method for communicating prognosis
- ASK: if they want to talk about prognosis and what they already know
- TELL: give information in small amounts, build on what they already know, use simple straight-forward language
- ASK: repeat understanding of what has been said, if they would like to hear more
Key Points/HM Takeaways:
- Estimating and discussing prognosis are core competencies for hospitalists and should be utilized during a “sentinel hospitalization”
- Prognostic awareness in advanced illness is key for:
- Informed decision making (CPR, procedures, chemo, et al)
- Determining realistic goals of care
- Providing patient centered care
- Most patients and families want prognostic information, but not always- must ask to know. Give the patient the option not to discuss prognosis.
- Ask-Tell-Ask approach for discussing prognosis is effective
Lean Six Sigma Improves Pediatric Discharge Times
Research published online in the Journal of Hospital Medicine shows how quality improvement incorporating Lean Six Sigma, rigorous, problem-focused process improvement methodologies, improved pediatric hospital discharge times. Michael J. Beck, MD, FAAP, SSGB, chief of the division of pediatric hospital medicine at Penn State Hershey Children’s Hospital in Pa., and Kirk Gosik of the department of public health sciences at Penn State Hershey College of Medicine assessed the impact of these methods on times from placement of discharge orders to discharge from the hospital, along with secondary outcomes of length of stay and readmissions rates.
“In our hospital, we did not have enough beds for what we were being asked to accomplish,” Dr. Beck says. “The process and structure of going through rounds and discharging patients wasn’t working. Based on a lot of calls from the ER, we decided to try a one-month pilot of restructuring the daily rounds to improve throughput.”
Reengineering included reallocating staff and creating a standardized work flow and discharge checklist. The rounding team was split into two smaller teams, with patients planned for discharge that day seen first and the necessary discharge paperwork entered into the electronic health record during the rounding.
The new process resulted in significantly faster times for order entry and for actual patient discharge, with a larger proportion of patients discharged before noon and before 2 p.m. The project has continued, using a PDSA (plan/do/study/act) process to advance and consolidate its gains. It appears to be sustainable, Dr. Beck says, and 13 months of data were to be presented as an abstract at HM15 in National Harbor, Md.
Larry Beresford is a freelance writer in Alameda, Calif.
Good Hospital Discharge Summaries Identified
A Yale University research team has described what constitutes a good hospital discharge, based on its analysis of 1,500 discharge summaries from patients with exacerbations of heart failure at 46 hospitals enrolled in TeleMonitoring to Improve Heart Failure Outcomes (TELE-HF), a large multicenter study of patients hospitalized with heart failure.
“We consider a good discharge to be a three-legged stool composed of timeliness, transmission to the right person, and having the right components, as defined by The Joint Commission and the Transitions of Care Consensus Conference,” says co-author Leora Horwitz, MD, MHS, director of the Center for Healthcare Innovation and Delivery Science at New York University.
“This study tells us for the first time that it is actually worth spending the time and effort to improve discharge communication, and patients do seem to benefit.”—Leora Horwitz, MD, MHS
Historically, discharge summaries were used primarily for billing, but the medical community has not made full use of them as tools for transition or considered what was really needed by the physician who will see the patient next, Dr. Horwitz says. In a previous study at Yale, as many as a third of discharge summaries were never received by a follow-up physician, and only 15% included the patient’s discharge weight—an essential detail for managing their cardiac care.
A second study using the TELE-HF data found that when the quality of the discharge summary was improved, readmissions rates were lower.
“This study tells us for the first time that it is actually worth spending the time and effort to improve discharge communication, and patients do seem to benefit,” Dr. Horwitz says.
Individual physicians should feel empowered by the result to work on system change in their hospitals, she says.
Larry Beresford is a freelance writer in Alameda, Calif.
Data Show Medicare Readmission Penalties Unfair

In December, the Altarum Institute’s Center for Elder Care and Advanced Illness released data showing that while San Diego County hospitals do better than national averages in reducing readmissions rates, nearly all of the eligible hospitals are being penalized by Medicare’s hospital readmissions penalty program because their discharges are being reduced through best practices at about the same rate as their reductions in readmissions.
The American Hospital Association and America’s Essential Hospitals (representing public hospitals) have both provided evidence to press their claims that the government’s Hospital Readmissions Reduction Program is unfair for refusing to adjust readmissions penalties and other hospital quality measures based on socioeconomic factors that influence readmission risk. A recent JAMA Viewpoint discusses an expert panel’s review of the National Quality Forum’s long-standing policy of not adjusting quality measures for sociodemographic risk factors out of a concern that it could create lower standards of care for disadvantaged patients. The panel concluded that this policy needed to be revisited.
Larry Beresford is a freelance writer in Alameda, Calif.
Malpractice Claims For Hospitalists Average .52 Per 100 Physician Years
Number of malpractice claims per 100 physician coverage years for hospitalists, according to an analysis of 52,000 coded medical malpractice claims from 20 different malpractice insurance programs for injuries incurred between 1997 and 2011. Nonhospitalist internal medicine physicians had a rate 3.5 times greater, and emergency physicians had a rate seven times higher than hospitalists. An accompanying editorial in the Journal of Hospital Medicine calls this result, the first analysis of data specifically identifying hospitalists, surprising “because health systems utilizing hospitalists generally include features that might increase the risk for malpractice claims.”
Larry Beresford is a freelance writer in Alameda, Calif.
Art Helps Hospitalized Patients Manage Pain, Anxiety
A recent article in The North Jersey Record describes how art is being used to help manage hospitalized patients’ pain and anxiety.1 At Englewood (N.J.) Hospital and Medical Center, patients wheeled down a long corridor to the diagnostic testing department pass a dazzling array of 50 original art works—floral designs, landscapes, and abstracts—curated by the Art School at Old Church in Demarest.
Half of U.S. hospitals have some sort of art program, according to a 2009 report from the Society for the Arts in Healthcare. Although the research is still in its infancy, evidence suggests that programs incorporating art therapy can help reduce stress, anxiety, and pain in patients with cancer and other conditions, while increasing their satisfaction with their care.2,3,4
UK Arts in Healthcare at University of Kentucky HealthCare in Lexington brings the visual arts into health facilities and presents performing arts, music, and art therapies at Albert B. Chandler Hospital and other UK hospitals and clinics. Art in clinic waiting areas at UK improved patient satisfaction scores, which got the attention of hospital administrators, says Arts in Healthcare Program Director Jacqueline Hamilton.
Larry Beresford is a freelance writer in Alameda, Calif.
References
- Petrick J. Art is used to help healing process in hospitals. The North Jersey Record. January 25, 2015. Available at: http://www.northjersey.com/arts-and-entertainment/art/art-is-used-to-help-healing-process-in-hospitals-1.1251254. Accessed March 9, 2015.
- Puetz TW, Morley CA, Herring MP. Effects of creative arts therapies on psychological symptoms and quality of life in patients with cancer. JAMA Intern Med. 2013;173(11):960-969.
- Thyme KE, Sundin EC, Wiberg B, Öster I, Aström S, Lindh J. Individual brief art therapy can be helpful for women with breast cancer: a randomized controlled clinical study. Palliat Support Care. 2009;7(1):87-95.
- Wood MJM, Molassiotis A, Payne S. What research evidence is there for the use of art therapy in the management of symptoms in adults with cancer? A systematic review. Psychooncology. 2011;20(2):135-145.