User login
SCID may be more common than we thought

Credit: Vera Kratochvil
Severe combined immunodeficiency (SCID) may be nearly twice as common as we thought, new research suggests.
The study is the first combined analysis of more than 3 million infants screened for SCID in 10 US states and the Navajo Nation.
The results suggest SCID may affect as many as 1 in 58,000 infants. Previous estimates had indicated that 1 in 100,000 infants may be born with SCID.
This study and a related editorial were published in JAMA.
Jennifer Puck, MD, of the University of California, San Francisco, and her colleagues analyzed infants from 10 states and the Navajo Nation who were born from January 2008 through July 2013 and were screened for SCID.
The screening detected 52 cases of SCID among the 3,030,083 newborns, suggesting the disorder may affect roughly 1 in 58,000 infants.
The incidence of SCID was not significantly different in any state program, but it was higher in the Navajo Nation, where an ancestral trait is known to confer a higher risk of the disease.
Of the 52 infants who had SCID, 49 received therapies such as hematopoietic stem cell transplants, enzyme replacement therapy, and/or gene therapy. Three infants died before receiving treatment, and 4 children died after transplant, but the other 45 treated infants survived.
Of those 52 cases of SCID identified by newborn screening, 9 were considered “leaky SCID.” These infants had an incomplete mutation in a typical SCID gene, retaining small amounts of immune function that can actually be detrimental because the poorly regulated cells can attack the child’s own tissues.
“We’re finding that leaky SCID is more common than previously thought,” Dr Puck said. “Before screening, we’d typically not make the diagnosis for several months or even years, but because of newborn screening, they are being treated before they get into any trouble.”
The screening test detects more than a dozen genetic causes of SCID, in addition to other conditions with significantly low T cells. The researchers discovered that population-based testing uncovers a broader range of the underlying genetic causes for SCID than previously known.
For example, X-linked SCID, a form of the disorder caused by mutations in a gene on the X chromosome and affecting only males, was previously thought to account for half of SCID cases. But this study showed that only 19% of SCID infants had X-linked disease with a corresponding increase in other gene defects.
Moreover, the proportion of SCID infants without a known genetic defect (15%) was higher than anticipated, indicating that widespread screening presents opportunities to discover previously unknown genes implicated in SCID.
“The whole point of newborn screening is to identify conditions that are treatable, and for which early treatment saves lives,” Dr Puck said. “The excellent outcomes of SCID infants across the country reported in this study prove that SCID is such a condition.” ![]()
Rise of new anticoagulants means higher costs

Credit: CDC
A new study suggests the use of novel oral anticoagulants (NOACs) has surpassed warfarin use in the last few years, but the cost burden for NOACs is much higher than that of warfarin.
By mid-2013, the NOACs dabigatran, rivaroxaban, and apixaban accounted for 62% of all new anticoagulant prescriptions included in the study, but this represented 98% of the total anticoagulant costs.
These findings and a related commentary appear in The American Journal of Medicine.
NOAC use on the rise
To better understand NOAC use, researchers analyzed medical and prescription claims data from the insurance company Aetna. They identified 6893 patients with atrial fibrillation (AF) who were prescribed an oral anticoagulant from 2010 to 2013.
During that time, 45,472 anticoagulant prescriptions were filled—26,253 (57.7%) for warfarin, 14,922 (32.8%) for dabigatran, 4241 (9.3%) for rivaroxaban, and 56 (0.1%) for apixaban.
The researchers noted that the US Food and Drug Administration (FDA) approved dabigatran for use in AF patients in October 2010. And by October 2011, patients were as likely to receive dabigatran as warfarin.
Rivaroxaban was FDA-approved for AF in November 2011, and, by June 2013, the drug had overtaken both warfarin and dabigatran. Apixaban use increased the least, as the drug gained FDA approval for AF in December 2012.
Though NOACs appeared to be on the rise overall, the researchers found NOAC use was significantly less likely for women, patients living in lower income areas, and patients with higher CHADS2, CHA2DS2-VASC, and HAS-BLED scores (P<0.001 for each variable).
The team said this finding is significant because, in the clinical trials supporting NOAC approvals, most patients had CHADS2/CHA2DS2-VASC scores in the higher ranges.
“The greatest absolute benefit from novel anticoagulants has been shown in clinical trials to be among patients at highest baseline risk for stroke or systemic embolization,” said lead investigator Niteesh K. Choudhry, MD, PhD, of Brigham and Women’s Hospital in Boston.
“[This] is at odds with our observation of [physicians selecting] seemingly lower-risk patients for these drugs. Such a finding may reflect provider conservatism for new drug adoption, particularly given longitudinal experience with warfarin.”
Higher costs
Dr Choudhry and his colleagues also found that NOACs confer high healthcare cost consequences. The data revealed that NOACs represented 98% of the total dollars spent on anticoagulants from 2010 to 2013.
Over the first 6 months, the average combined patient and insurer cost associated with starting a NOAC was $900 greater than the cost of starting warfarin.
“Average patient out-of-pocket and insurance spending was more than 5-fold and 15-fold higher, respectively, for novel anticoagulants as compared with warfarin,” Dr Choudhry said. “A 6-month difference in total costs of $900 in our cohort translates into billions of dollars at a national level.”
Taking their findings together, the researchers said this study suggests more information may be needed to fully understand the implications of rising NOAC prescriptions.
“These findings point to the need to conduct ongoing surveillance of the adoption of new agents into clinical practice,” Dr Choudhry said, “as well as the need for robust, real-world comparative-effectiveness analyses of these medications, to enable patients and providers to make informed decisions about their relative benefit, safety, and cost-effectiveness.” ![]()
High aortic aneurysm dissection risk in giant-cell arteritis patients
PARIS – The usual rule that the larger an aortic aneurysm grows the greater the risk it will undergo dissection or rupture doesn’t work in patients with giant-cell arteritis. Their aortic aneurysms appear liable to dissect or rupture at any size after the diagnosis of giant-cell arteritis occurs, based on a retrospective study of 195 patients followed at a single U.S. center.
"Aortic size at diagnosis or last follow-up did not predict aortic dissection or rupture," Dr. Ashima Makol reported at the annual European Congress of Rheumatology, nor were linear, serial measurements of aortic size able to reliably predict risk for these complications in patients with GCA. Without a reliable way to identify patients with GCA at risk for dissection or rupture, the only management advice remaining is to follow GCA patients annually with imaging, said Dr. Makol, a rheumatologist at the Mayo Clinic in Rochester, Minn.
Positron emission tomography, CT angiography, or MR angiography seem to be the best ways to follow these patients, but if those are too costly to do annually, then transesophageal echocardiography or a chest x-ray are other options, Dr. Makol said in an interview.
Although 30% of patients with GCA have a vasculitis that involves the aorta and its branches and an increased risk for developing aortic aneurysms, the way these aneurysms change over time and the relationship between aneurysm size and the risk for dissection or rupture in GCA patients were not previously reported. To address this, Dr. Makol and her associates reviewed 195 patients with GCA and an aortic aneurysm seen at the Mayo Clinic during 2000-2012.
The aneurysms occurred in the ascending thoracic aorta in 161 patients (83%), the descending thoracic aorta in 21 (11%), and the abdominal aorta in the remaining 13 patients (7%). (Percentages total 101% because of rounding.) The patients averaged 74 years old, 62% were women, and 49% had a history of smoking.
During follow-up, 14 patients (7%) had an aneurysm dissection, and 1 patient (1%) had an aneurysm rupture, the investigators reported. All of the dissections and the rupture occurred in thoracic aorta aneurysms.
At the time of GCA diagnosis, the average aneurysm size in the 15 patients who developed an aneurysm complication was 51 mm, which was very similar to the average size of 49 mm in the 180 patients who did not have an aneurysm dissection or rupture during follow-up.
Patients also showed no clear link between aneurysm size at the time of dissection or rupture and the aneurysm size during follow-up of patients without these complications. The average maximum aneurysm diameter among the 15 patients with a complication at the time of their event was 54 mm, while the average aneurysm size at last follow-up among those without a dissection or rupture during follow-up was 50 mm, a difference that was not statistically significant, Dr. Makol said.
The average rate of aneurysm growth during 3 years of follow-up for all the GCA patients in the analysis was 1.59 mm/year, a rate "somewhat higher" than the average annual growth rate of 1 mm/year reported for aortic aneurysms in patients without inflammatory disease. The 54-mm average aneurysm diameter at the time of dissection or rupture in the CGA patients was "somewhat lower" than the 65-mm average aneurysm diameter seen at the time of dissection or rupture in patients without inflammatory disease, she noted.
The study is the first reported to look at the pattern of aneurysm growth and complications in GCA patients, although it is limited to the retrospective experience at one tertiary referral center and so may reflect a referral bias, Dr. Makol said. But the inability of the analysis to identify aneurysm characteristics in GCA patients that can telegraph an increased risk for complications means that all GCA patients with an aortic aneurysm need careful surveillance by annual imaging, she advised.
Dr. Makol said that she had no disclosures.
The take home message from this article can be summed up in this manner: Aneurysms in patients with, or that are the result of, giant-cell arteritis (GCA) may be at increased risk for a catastrophic event at an earlier, or at least more unpredictable point, than aneurysms that are not associated with GCA. As the article states, "the usual rule that the larger an aortic aneurysm grows the greater the risk" may not hold in this small subset of patients with GCA. Further interpretation of this article leads me to conclude, however, that the discussion centers (nearly) exclusively on pathology involving the ascending aorta. Only a very small percentage of the cohort that was studied had aneurysms distal to the subclavian artery and none of the fifteen catastrophic events that were noted occurred below the diaphragm. While not clear from the article, it is quite likely all of the catastrophic events, rupture or dissection, occurred in association with disease involving the ascending aorta. As such, the article’s content may be more appropriate for those who routinely treat patients with ascending aortic pathology and not so much for vascular surgeons who traditionally treat aortic pathology from the transverse arch down. In addition, there seems to be the inference in the article that this data can be directly translated to disease affecting the infra-renal aorta which is a conclusion that I would hold, is premature, at best. I, for one, must admit that while I have seen a number of patients with GCA, I have never had the occasion to treat an aneurysm in one of them. While this may be true for many of us, the point of the article does have merit and the information should be stored somewhere in our memory banks. Who knows, perhaps someday we may see it pop up on some board question.
Dr. Mark D. Morasch is a vascular surgeon at St Vincent Healthcare Heart and Vascular, Billings, Montana, and an associate medical editor for Vascular Specialist.
PARIS – The usual rule that the larger an aortic aneurysm grows the greater the risk it will undergo dissection or rupture doesn’t work in patients with giant-cell arteritis. Their aortic aneurysms appear liable to dissect or rupture at any size after the diagnosis of giant-cell arteritis occurs, based on a retrospective study of 195 patients followed at a single U.S. center.
"Aortic size at diagnosis or last follow-up did not predict aortic dissection or rupture," Dr. Ashima Makol reported at the annual European Congress of Rheumatology, nor were linear, serial measurements of aortic size able to reliably predict risk for these complications in patients with GCA. Without a reliable way to identify patients with GCA at risk for dissection or rupture, the only management advice remaining is to follow GCA patients annually with imaging, said Dr. Makol, a rheumatologist at the Mayo Clinic in Rochester, Minn.
Positron emission tomography, CT angiography, or MR angiography seem to be the best ways to follow these patients, but if those are too costly to do annually, then transesophageal echocardiography or a chest x-ray are other options, Dr. Makol said in an interview.
Although 30% of patients with GCA have a vasculitis that involves the aorta and its branches and an increased risk for developing aortic aneurysms, the way these aneurysms change over time and the relationship between aneurysm size and the risk for dissection or rupture in GCA patients were not previously reported. To address this, Dr. Makol and her associates reviewed 195 patients with GCA and an aortic aneurysm seen at the Mayo Clinic during 2000-2012.
The aneurysms occurred in the ascending thoracic aorta in 161 patients (83%), the descending thoracic aorta in 21 (11%), and the abdominal aorta in the remaining 13 patients (7%). (Percentages total 101% because of rounding.) The patients averaged 74 years old, 62% were women, and 49% had a history of smoking.
During follow-up, 14 patients (7%) had an aneurysm dissection, and 1 patient (1%) had an aneurysm rupture, the investigators reported. All of the dissections and the rupture occurred in thoracic aorta aneurysms.
At the time of GCA diagnosis, the average aneurysm size in the 15 patients who developed an aneurysm complication was 51 mm, which was very similar to the average size of 49 mm in the 180 patients who did not have an aneurysm dissection or rupture during follow-up.
Patients also showed no clear link between aneurysm size at the time of dissection or rupture and the aneurysm size during follow-up of patients without these complications. The average maximum aneurysm diameter among the 15 patients with a complication at the time of their event was 54 mm, while the average aneurysm size at last follow-up among those without a dissection or rupture during follow-up was 50 mm, a difference that was not statistically significant, Dr. Makol said.
The average rate of aneurysm growth during 3 years of follow-up for all the GCA patients in the analysis was 1.59 mm/year, a rate "somewhat higher" than the average annual growth rate of 1 mm/year reported for aortic aneurysms in patients without inflammatory disease. The 54-mm average aneurysm diameter at the time of dissection or rupture in the CGA patients was "somewhat lower" than the 65-mm average aneurysm diameter seen at the time of dissection or rupture in patients without inflammatory disease, she noted.
The study is the first reported to look at the pattern of aneurysm growth and complications in GCA patients, although it is limited to the retrospective experience at one tertiary referral center and so may reflect a referral bias, Dr. Makol said. But the inability of the analysis to identify aneurysm characteristics in GCA patients that can telegraph an increased risk for complications means that all GCA patients with an aortic aneurysm need careful surveillance by annual imaging, she advised.
Dr. Makol said that she had no disclosures.
AT THE EULAR CONGRESS 2014
Key clinical point: Risk for aortic aneurysm dissection in patients with giant-cell arteritis showed no link to aneurysm size.
Major finding: GCA patients with dissection or rupture of an aortic aneurysm had aneurysms that were similar in size to those of GCA patients without these complications.
Data source: Retrospective study of 195 patients with GCA at one U.S. center.
Disclosures: Dr. Makol said that she had no disclosures.
HCV infection raises risk of death after kidney transplant
SAN FRANCISCO – Infection with hepatitis C virus is a risk factor for poor outcomes after kidney transplantation, but infection with human immunodeficiency virus is not, finds a cohort study reported at the 2014 World Transplant Congress.
"Centers should be more selective in transplanting HCV-positive kidney transplant candidates. But controlled HIV infection should no longer be perceived as a barrier to kidney transplantation," said first author Dr. Deirdre L. Sawinski of the University of Pennsylvania in Philadelphia.

Further, control of hepatitis C with treatment should be a priority in hopes of improving outcomes, she added.
Researchers studied 111,990 patients from the United Network for Organ Sharing (UNOS) database who had a known serostatus and underwent kidney transplantation in 1996 or later when highly active antiretroviral therapy became widespread. Overall, 4.6% were infected with HCV alone, 0.4% were infected with HIV alone, and 0.1% were coinfected.
Multivariate analyses adjusted for a variety of donor and recipient characteristics, and included a variable for transplant after 2001. This time point "reflects both the year in which more than half of patients were discharged on tacrolimus maintenance therapy as well as the year in which interferon therapy was approved for treatment for hepatitis C," Dr. Sawinski said.
HCV-infected patients and especially HCV and HIV-coinfected patients had significantly higher risks of death (hazard ratio, 1.52 and 3.83, respectively) and of graft loss (HR, 1.48 and 3.40, respectively), compared with uninfected patients. In contrast, patients infected with HIV alone were not at higher risk of death or graft loss.
"The main cause of death for the reference [uninfected] group and the hep C–positive patients was listed as cardiovascular disease, whereas the HIV-positive and coinfected patients most often had infection as their causes of death," Dr. Sawinski said. "However, you have to take that with a grain of salt as 40% of patients across all four groups had missing data [regarding] cause of death."
The risk persisted even after researchers corrected for the impact of antibody-depleting therapy during transplantation on graft survival. However, the UNOS database does not provide information about treatment with interferon before and after direct-acting antiretroviral drugs became available. Additionally, Dr. Sawinski noted, "the UNOS data set does not identify which patients are actually viremic vs. antibody positive." Data are similarly nonspecific for deceased donors but are detailed (antibody positive vs. viremic) for living donors.
A secondary analysis considered a cohort of 180,177 patients with unknown serostatus. In this analysis, the risks of death and graft loss were elevated among patients with dual unknown status relative to those known to be dually uninfected (HR, 1.06 and 1.02), according to data reported at the 2014 World Transplant Congress, which was sponsored by the American Society of Transplant Surgeons. However, these small elevations of risk are "probably not clinically meaningful," commented Dr. Sawinski, who disclosed no relevant conflicts of interest. Risks were not significantly elevated for HCV-positive patients vs. HCV-positive, HIV-unknown patients, or for HIV-positive patients vs. HIV-positive, HCV-unknown patients.
Additionally, main study findings were essentially the same when the cohort with known serostatus and the cohort with an unknown serostatus were combined and the researchers assumed the unknown status patients were uninfected.
This study was selected for a plenary session because it provides information about coinfected patients. Yet, reporting of hepatitis C status was missing in quite a number of patients. Hence, they had to be excluded from this study, which was retrospective in nature. In spite of this, the results do make one think hard about transplanting a coinfected patient. This could all change with the new hepatitis-C therapies, and make outcomes better.
Dr. Roslyn B. Mannon was the session cochair at the meeting and is a professor of medicine and surgery and director of research at the Comprehensive Transplant Institute, University of Alabama, Birmingham. She made her remarks in an interview after the meeting. She has no financial conflicts.
SAN FRANCISCO – Infection with hepatitis C virus is a risk factor for poor outcomes after kidney transplantation, but infection with human immunodeficiency virus is not, finds a cohort study reported at the 2014 World Transplant Congress.
"Centers should be more selective in transplanting HCV-positive kidney transplant candidates. But controlled HIV infection should no longer be perceived as a barrier to kidney transplantation," said first author Dr. Deirdre L. Sawinski of the University of Pennsylvania in Philadelphia.
Further, control of hepatitis C with treatment should be a priority in hopes of improving outcomes, she added.
Researchers studied 111,990 patients from the United Network for Organ Sharing (UNOS) database who had a known serostatus and underwent kidney transplantation in 1996 or later when highly active antiretroviral therapy became widespread. Overall, 4.6% were infected with HCV alone, 0.4% were infected with HIV alone, and 0.1% were coinfected.
Multivariate analyses adjusted for a variety of donor and recipient characteristics, and included a variable for transplant after 2001. This time point "reflects both the year in which more than half of patients were discharged on tacrolimus maintenance therapy as well as the year in which interferon therapy was approved for treatment for hepatitis C," Dr. Sawinski said.
HCV-infected patients and especially HCV and HIV-coinfected patients had significantly higher risks of death (hazard ratio, 1.52 and 3.83, respectively) and of graft loss (HR, 1.48 and 3.40, respectively), compared with uninfected patients. In contrast, patients infected with HIV alone were not at higher risk of death or graft loss.
"The main cause of death for the reference [uninfected] group and the hep C–positive patients was listed as cardiovascular disease, whereas the HIV-positive and coinfected patients most often had infection as their causes of death," Dr. Sawinski said. "However, you have to take that with a grain of salt as 40% of patients across all four groups had missing data [regarding] cause of death."
The risk persisted even after researchers corrected for the impact of antibody-depleting therapy during transplantation on graft survival. However, the UNOS database does not provide information about treatment with interferon before and after direct-acting antiretroviral drugs became available. Additionally, Dr. Sawinski noted, "the UNOS data set does not identify which patients are actually viremic vs. antibody positive." Data are similarly nonspecific for deceased donors but are detailed (antibody positive vs. viremic) for living donors.
A secondary analysis considered a cohort of 180,177 patients with unknown serostatus. In this analysis, the risks of death and graft loss were elevated among patients with dual unknown status relative to those known to be dually uninfected (HR, 1.06 and 1.02), according to data reported at the 2014 World Transplant Congress, which was sponsored by the American Society of Transplant Surgeons. However, these small elevations of risk are "probably not clinically meaningful," commented Dr. Sawinski, who disclosed no relevant conflicts of interest. Risks were not significantly elevated for HCV-positive patients vs. HCV-positive, HIV-unknown patients, or for HIV-positive patients vs. HIV-positive, HCV-unknown patients.
Additionally, main study findings were essentially the same when the cohort with known serostatus and the cohort with an unknown serostatus were combined and the researchers assumed the unknown status patients were uninfected.
2014 WORLD TRANSPLANT CONGRESS
Key clinical point: Centers should be selective when kidney transplant candidates are HCV positive, but controlled HIV infection should no longer be perceived as a barrier.
Major finding: Relative to uninfected peers, HCV-infected patients and HIV/HCV-coinfected patients had higher risks of death (HR, 1.52 and 3.83) and graft loss (HR, 1.48 and 3.40), but HIV-infected patients did not.
Data source: Cohort study of 111,990 patients from the UNOS database who underwent kidney transplant.
Disclosures: Dr. Sawinski disclosed no relevant conflicts of interest.

Help your patient with hoarding disorder move the clutter to the curb
Hoarding disorder (HD), categorized in DSM-5 under obsessive-compulsive and related disorders, is defined as the “persistent difficulty discarding or parting with possessions, regardless of their actual value.”1 Hoarders feel that they need to save items, and experience distress when discarding them. Prevalence of HD among the general population is 2% to 5%.
Compulsive hoarders usually keep old items in their home that they do not intend to use. In severe cases, the clutter is so great that areas of the home cannot be used or entered. Hoarders tend to isolate themselves and usually do not invite people home, perhaps because they are embarrassed about the clutter or anxious that someone might try to clean the house. Hoarders may travel long distances to collect items others have discarded.
Hoarding can lead to psychiatric disorders and social problems. Hoarders tend to not develop attachment with people because they are more attached to their possessions. They may avoid social interactions; in turn, others avoid them. This isolation can lead to depression, anxiety, and substance abuse. Hoarders may be evicted from their home if the clutter makes the house dangerous or unfit to live in it. Compulsive hoarding is detrimental to the hoarder and the health and well-being of family members. Hoarding can coexist or can be result of other psychiatric disorders (Table). 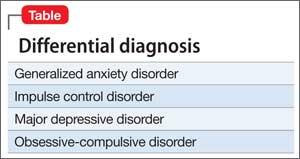
Neural mechanism in hoarding
Hoarders may start to accumulate and store large quantities of items because of a cognitive deficit, such as trouble making decisions or poor recognition or acknowledgement of the situation, or maladaptive thoughts. Tolin et al1 found the anterior cingulate cortex and insula was stimulus-dependent in patients with HD. Functional MRI showed when patients with HD were shown an item that was their possession, they exhibited an abnormal brain activity, compared with low activity when the items shown were not theirs.
Interventions
Choice of treatment depends on the age of the patient and severity of illness: behavioral, medical, or a combination of both. For an uncomplicated case, management can begin with behavioral modification.
Behavioral modifications. HD can stem from any of several variables, including greater response latency for decision-making about possessions and maladaptive beliefs about, and emotional attachment to, possessions, which can lead to intense emotional experiences about the prospect of losing those possessions.2 Cognitive-behavioral therapy has shown promising results for treating HD by addressing the aforementioned factors. A step-by-step approach usually is feasible and convenient for the therapist and patient. It involves gradual mental detachment from items to accommodate the patient’s pace.2
Pharmacotherapy. There is no clear evidence for treating HD with any particular drug. Hoarders are less likely to use psychotropics, possibly because of poor insight (eg, they do not realize the potentially dangerous living conditions hoarding creates).3 Because HD is related to obsessive-compulsive disorder, it is intuitive to consider a selective serotonin reuptake inhibitor.
There is still a need for more research on management of HD.
Disclosure
Dr. Silman reports no financial relationship with any company whose products are mentioned in this article or with manufacturers of competing products.
1. Tolin DF, Stevens MC, Villavicencio AL, et al. Neural mechanism of decision making in hoarding disorder. Arch Gen Psychiatry. 2012;69(8):832-841.
2. Tolin DF, Frost RO, Steketee G. An open trial of cognitivebehavioral therapy for compulsive hoarding. Behav Res Ther. 2007;45(7):1461-1470.
3. Brakoulias V, Starcevic V, Berle D, et al. The use of psychotropic agents for the symptoms of obsessivecompulsive disorder. Australas Psychiatry. 2013;21(2): 117-121.
Hoarding disorder (HD), categorized in DSM-5 under obsessive-compulsive and related disorders, is defined as the “persistent difficulty discarding or parting with possessions, regardless of their actual value.”1 Hoarders feel that they need to save items, and experience distress when discarding them. Prevalence of HD among the general population is 2% to 5%.
Compulsive hoarders usually keep old items in their home that they do not intend to use. In severe cases, the clutter is so great that areas of the home cannot be used or entered. Hoarders tend to isolate themselves and usually do not invite people home, perhaps because they are embarrassed about the clutter or anxious that someone might try to clean the house. Hoarders may travel long distances to collect items others have discarded.
Hoarding can lead to psychiatric disorders and social problems. Hoarders tend to not develop attachment with people because they are more attached to their possessions. They may avoid social interactions; in turn, others avoid them. This isolation can lead to depression, anxiety, and substance abuse. Hoarders may be evicted from their home if the clutter makes the house dangerous or unfit to live in it. Compulsive hoarding is detrimental to the hoarder and the health and well-being of family members. Hoarding can coexist or can be result of other psychiatric disorders (Table).
Neural mechanism in hoarding
Hoarders may start to accumulate and store large quantities of items because of a cognitive deficit, such as trouble making decisions or poor recognition or acknowledgement of the situation, or maladaptive thoughts. Tolin et al1 found the anterior cingulate cortex and insula was stimulus-dependent in patients with HD. Functional MRI showed when patients with HD were shown an item that was their possession, they exhibited an abnormal brain activity, compared with low activity when the items shown were not theirs.
Interventions
Choice of treatment depends on the age of the patient and severity of illness: behavioral, medical, or a combination of both. For an uncomplicated case, management can begin with behavioral modification.
Behavioral modifications. HD can stem from any of several variables, including greater response latency for decision-making about possessions and maladaptive beliefs about, and emotional attachment to, possessions, which can lead to intense emotional experiences about the prospect of losing those possessions.2 Cognitive-behavioral therapy has shown promising results for treating HD by addressing the aforementioned factors. A step-by-step approach usually is feasible and convenient for the therapist and patient. It involves gradual mental detachment from items to accommodate the patient’s pace.2
Pharmacotherapy. There is no clear evidence for treating HD with any particular drug. Hoarders are less likely to use psychotropics, possibly because of poor insight (eg, they do not realize the potentially dangerous living conditions hoarding creates).3 Because HD is related to obsessive-compulsive disorder, it is intuitive to consider a selective serotonin reuptake inhibitor.
There is still a need for more research on management of HD.
Disclosure
Dr. Silman reports no financial relationship with any company whose products are mentioned in this article or with manufacturers of competing products.
1. Tolin DF, Stevens MC, Villavicencio AL, et al. Neural mechanism of decision making in hoarding disorder. Arch Gen Psychiatry. 2012;69(8):832-841.
2. Tolin DF, Frost RO, Steketee G. An open trial of cognitivebehavioral therapy for compulsive hoarding. Behav Res Ther. 2007;45(7):1461-1470.
3. Brakoulias V, Starcevic V, Berle D, et al. The use of psychotropic agents for the symptoms of obsessivecompulsive disorder. Australas Psychiatry. 2013;21(2): 117-121.
Responding to the heroin epidemic one patient at a time
Once regarded as a curse of the urban poor, heroin now has a stronghold on many suburban, middle class communities.I was stunned to learn that heroin use is so prevalent in the quiet Baltimore suburb where I work that our local police officers carry Narcan kits. Use has become so ubiquitous in our country that U.S. Attorney General Eric Holder has said law enforcement officials should consider carrying heroin’s antidote. From Smalltown U.S.A. to booming metropolises, this inexpensive narcotic is wreaking havoc on individuals and their families.
Sure, I admit an occasional patient with "a history of heroin abuse" who takes methadone. Rarely, I may see physical evidence of heroin use. But in most cases, patients who use heroin present as overdose cases in the ED, where they are discharged home when they are stable or admitted directly to the intensive care unit. Sadly, I recently received from the ICU a transfer of a heroin overdose patient – a handsome young man in his 20s, his entire life ahead of him, loving parents and siblings at his bedside. He was completely oblivious to everything around him – comatose, on hospice, dying before he had a real chance to live.
There was nothing I could do for him or his family other than to provide comfort. But perhaps I can do more for future potential overdose victims. You know, the heroin users admitted for a skin abscess after missing a vein or for DKA because they were too high to remember to take their insulin. Yes, we are busy; but we need to take 5-10 minutes to address the issue, to listen to the user’s story and encourage them, uplift them. Substance abuse counselors are invaluable, but by taking the time to care about our patients as individuals, hospitalists might just be the straw to break the camel’s back of heroin use for someone. Considering that most heroin addicts these days are young adults, a 10 minute investment of our time now may help buy those patients back another 40 or 50 years of their lives.
Dr. Hester is a hospitalist at Baltimore-Washington Medical Center in Glen Burnie, Md. She is the creator of the Patient Whiz, a patient-engagement app for iOS. Reach her at [email protected].

What are your responsibilities after a screening call?
Dear Dr. Mossman,
When I take a call from a treatment-seeker at our outpatient clinic, I ask brief screening questions to determine whether our services would be appropriate. Shortly after I screened one caller, Ms. C, she called back requesting a medication refill and asking about her diagnosis.
What obligation do I have to Ms. C? Is she my patient? Would I be liable if I didn’t help her out and something bad happened to her?
Submitted by “Dr. S”
Office and hospital Web sites, LinkedIn profiles, and Facebook pages are just a few of the ways that people find physicians and learn about their services. But most 21st century doctor-patient relationships still start with 19th century technology: a telephone call.
Talking with prospective patients before setting up an appointment makes sense. A short conversation can clarify whether you offer the services that a caller needs and increases the show-up rate for initial appointments.1
But if you ask for some personal history and information about symptoms in a screening interview, does that make the caller your patient? Ms. C seemed to have thought so. To find out whether Ms. C was right and to learn how Dr. S should handle initial telephone calls, we’ll look at:
• the rationale for screening callers before initiating treatment
• features of screening that can create a doctor-patient relationship
• how to fulfill duties that result from screening.
Why screen prospective patients?
Mental health treatment has become more diversified and specialized over the past 30 years. No psychiatrist nowadays has all the therapeutic skills that all potential patients might need.
Before speaking to you, a treatment-seeker often won’t know whether your practice style will fit his (her) needs. You might prefer not to provide medication management for another clinician’s psychotherapy patient or, if you’re like most psychiatrists, you might not offer psychotherapy.
In the absence of prior obligation (eg, agreeing to provide coverage for an emergency room), physicians may structure their practices and contract for their services as they see fit2—but this leaves you with some obligation to screen potential patients for appropriate mutual fit. In years past, some psychiatrists saw potential patients for an in-office evaluation to decide whether to provide treatment—a practicethat remains acceptable if the person is told, when the appointment is made, that the first meeting is “to meet each other and see if you want to establish a treatment relationship.”3
Good treatment plans take into account patients’ temperament, emotional state, cognitive capacity, culture, family circumstances, substance use, and medical history.4 Common mental conditions often can be identified in a telephone call.5,6 Although the diagnostic accuracy of such efforts is uncertain,7 such calls can help practitioners determine whether they offer the right services for callers. Good decisions about initiating care always take financial pressures and constraints into account,8 and a pre-appointment telephone call can address those issues, too.
For all these reasons, talking to a prospective patient before he comes to see you makes sense. Screening lets you decide:
• whether you’re the right clinician for his needs
• who the right clinician is if you are not
• whether he should seek emergency evaluation when the situation sounds urgent.
Do phone calls start treatment?
As Dr. S’s questions show, telephone screenings might leave some callers thinking that treatment has started, even before their first office appointment. Having a treatment relationship is a prerequisite to malpractice liability,9 and courts have concluded that, under the right circumstances, telephone assessments do create physician-patient relationships.
Creating a physician-patient relationship
How or when might telephone screening make someone your patient? This question doesn’t have a precise answer, but how courts decided similar questions has depended on the questions the physician asked and whether the physician offered what sounded like medical advice.10,11 A physician-patient relationship forms when the physician takes some implied or affirmative action to treat, see, examine, care for, or offer a diagnosis to the patient,9,12,13 such as:
• knowingly accepting someone as a patient14
• explicitly agreeing to treat a person
• “acting in some other way such that the patient might reasonably be led to assume a doctor-patient relationship has been established.”15
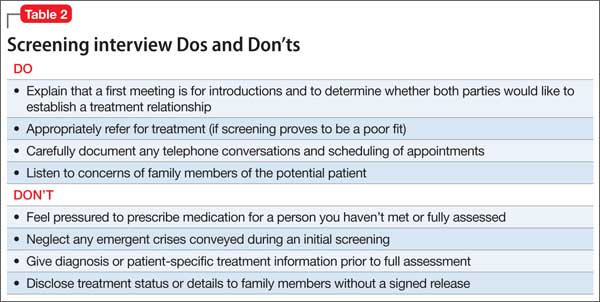
Also, the “fact that a physician does not deal directly with a patient does not necessarily preclude the existence of a physician-patient relationship,”12 so a telephone conversation can create such a relationship if it contains the right elements. Table 116 highlights actions that, during the course of screening, might constitute initiation of a physician-patient relationship. Table 2 offers suggestions for managing initial telephone contacts to reduce the chance of inadvertently creating a physician-patient relationship.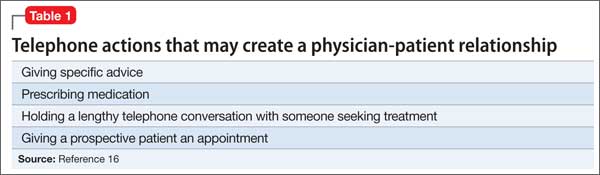
In the eyes of the law, whether a physician-patient relationship was formed depends on specific facts of the situation and may be decided by a jury.13,14 In the case of Ms. C, Dr. S might avoid premature creation of a physician-patient relationship by refraining from offering a diagnosis at the conclusion of the screening call.17
Prescribing
Although features of the original screening interview indicated that Ms. C was not yet Dr. S’s patient, prescribing certainly would commence a physician-patient relationship.18 But even if the screening had made Ms. C a patient, refilling her prescription now probably is a bad idea.
Assuming that a physician-patient relationship exists, it is unlikely that a short telephone interview gave Dr. S enough information about Ms. C’s medical history and present mental status to ensure that his diagnostic reasoning would not be faulty. It also is unlikely that telephone screening allowed Dr. S to meet the standard of care for prescribing—a process that involves choosing medications suitable to the patient’s clinical needs, checking the results of any necessary lab tests, and obtaining appropriate informed consent.19
Satisfying duties
Outpatient facilities can instruct telephone screeners to conduct interviews in ways that reduce inadvertent establishment of a treatment relationship, but establishing such a relationship cannot be avoided in all cases. If a caller is distraught or in crisis, for example, compassion dictates helping him, and some callers (eg, Ms. C) may feel they have a firmer treatment relationship than actually exists.
Once you have created a physician-patient relationship, you must continue that relationship until you end it appropriately.3 That does not mean you have to provide definitive treatment; you simply need to exercise “reasonable care according to the standards of the profession.”16,20 If a caller telephones in an emergency situation, for example, the screening clinician should take appropriate steps to ensure safety, which might include calling law enforcement or facilitating hospitalization.3
One way to fulfill the duties of a physician-patient relationship inadvertently established during initial screening is through explicit discharge (if medically appropriate) or transfer of care to another physician.15 A prudent clinic or practitioner will describe other mental health resources in the community and sometimes assist with referral if the inquiring potential patient needs services that the provider does not offer.
In many communities, finding appropriate mental health resources is difficult. Creative approaches to this problem include transitional psychiatry or crisis support clinics that serve as a “bridge” to longer-term services,21,22 preliminary process groups,23 and telepsychiatry transitional clinics.24 When a clinic does not accept a person as a patient, the clinic should clearly document 1) key features of the contact and 2) the rationale for that decision
Bottom Line
You have a right and a responsibility to screen prospective patients for good fit to your treatment services. In doing so, however, you might inadvertently create a physician-patient relationship. If this happens, you should fulfill your clinical responsibilities, as you would for any patient, by helping the patient get appropriate care from you or another provider.
Disclosures
The authors report no financial relationship with any company whose products are mentioned in this article or with manufacturers of competing products.
1. Shoffner J, Staudt M, Marcus S, et al. Using telephone reminders to increase attendance at psychiatric appointments: findings of a pilot study in rural Appalachia. Psychiatr Serv. 2007;58(6):872-875.
2. Hiser v Randolph, 1980 617 P2d 774 (Ariz App).
3. American Psychiatric Association. Practice management for early career psychiatrists: a reference guide, 6th edition. http://www.psych.org/practice/managing-a-practice/ starting-a-practice. Published October 16, 2006. Accessed July 8, 2014.
4. Delgado SV, Strawn JR. Difficult psychiatric consultations: an integrated approach. New York, NY: Springer; 2014.
5. Aziz MA, Kenford S. Comparability of telephone and face-to-face interviews in assessing patients with posttraumatic stress disorder. J Psychiatric Pract. 2004;10(5): 307-313.
6. Michel C, Schimmelmann BG, Kupferschmid S, et al. Reliability of telephone assessments of at-risk criteria of psychosis: a comparison to face-to-face interviews. Schizophr Res. 2014;153(1-3):251-253.
7. Muskens EM, Lucassen P, Groenleer W, et al. Psychiatric diagnosis by telephone: is it an opportunity [published online March 15, 2014]? Soc Psychiatry Psychiatr Epidemiol. doi: 10.1007/s00127-014-0861-9.
8. Cassel CK, Guest JA. Choosing wisely: helping physicians and patients make smart decisions about their care. JAMA. 2012;307(17):1801-1802.
9. Roberts v Sankey, 2004 813 NE2d 1195 (Ind App).
10. O’Neill v Montefiore Hospital, 1960 202 NYS 2d 436 (NY App).
11. McKinney v Schlatter, 1997 692 NE2d 1045 (Ohio App).
12. Dehn v Edgecombe, 865 A2d 603 (Md 2005).
13. Kelley v Middle Tennessee Emergency Physicians, 133 SW3d 587 (Tenn 2004).
14. Oliver v Brock, 342 So2d 1 (Ala 1976).
15. Appelbaum PS, Gutheil TG. Malpractice and other forms of liability. In: Appelbaum PS, Gutheil TG, eds. Clinical Handbook of Psychiatry and the Law, 4th ed. Philadelphia, PA: Lippincott Williams and Wilkins; 2007:115-116.
16. Simon RI, Shuman DW. The doctor-patient relationship. Focus. 2007;5(4):423-431.
17. Torres A, Wagner R. Establishing the physician-patient relationship. J Dermatol Surg Oncol. 1993;19(2):147-149.
18. Aboff BM, Collier VU, Farber NJ, et al. Residents’ prescription writing for nonpatients. JAMA. 2002;288(3):381-385.
19. Edersheim JG, Stern TA. Liability associated with prescribing medications. Prim Care Companion J Clin Psychiatry. 2009;11(3):115-119.
20. Brown v Koulizakis, 331 SE2d 440 (Va 1985).
21. University of Michigan Department of Psychiatry. Crisis support clinic. http://www.psych.med.umich.edu/patient-care/crisis-support-clinic. Accessed July 9, 2014.
22. UAB Department of Psychiatry. http://www.uab.edu/ medicine/psychiatry. Accessed July 9, 2014.
23. Stone WN, Klein EB. The waiting-list group. Int J Group Psychother. 1999;49(4):417-428.
24. Detweiler MB, Arif S, Candelario J, et al. A telepsychiatry transition clinic: the first 12 months experience. J Telemed Telecare. 2011;17(6):293-297.
Dear Dr. Mossman,
When I take a call from a treatment-seeker at our outpatient clinic, I ask brief screening questions to determine whether our services would be appropriate. Shortly after I screened one caller, Ms. C, she called back requesting a medication refill and asking about her diagnosis.
What obligation do I have to Ms. C? Is she my patient? Would I be liable if I didn’t help her out and something bad happened to her?
Submitted by “Dr. S”
Office and hospital Web sites, LinkedIn profiles, and Facebook pages are just a few of the ways that people find physicians and learn about their services. But most 21st century doctor-patient relationships still start with 19th century technology: a telephone call.
Talking with prospective patients before setting up an appointment makes sense. A short conversation can clarify whether you offer the services that a caller needs and increases the show-up rate for initial appointments.1
But if you ask for some personal history and information about symptoms in a screening interview, does that make the caller your patient? Ms. C seemed to have thought so. To find out whether Ms. C was right and to learn how Dr. S should handle initial telephone calls, we’ll look at:
• the rationale for screening callers before initiating treatment
• features of screening that can create a doctor-patient relationship
• how to fulfill duties that result from screening.
Why screen prospective patients?
Mental health treatment has become more diversified and specialized over the past 30 years. No psychiatrist nowadays has all the therapeutic skills that all potential patients might need.
Before speaking to you, a treatment-seeker often won’t know whether your practice style will fit his (her) needs. You might prefer not to provide medication management for another clinician’s psychotherapy patient or, if you’re like most psychiatrists, you might not offer psychotherapy.
In the absence of prior obligation (eg, agreeing to provide coverage for an emergency room), physicians may structure their practices and contract for their services as they see fit2—but this leaves you with some obligation to screen potential patients for appropriate mutual fit. In years past, some psychiatrists saw potential patients for an in-office evaluation to decide whether to provide treatment—a practicethat remains acceptable if the person is told, when the appointment is made, that the first meeting is “to meet each other and see if you want to establish a treatment relationship.”3
Good treatment plans take into account patients’ temperament, emotional state, cognitive capacity, culture, family circumstances, substance use, and medical history.4 Common mental conditions often can be identified in a telephone call.5,6 Although the diagnostic accuracy of such efforts is uncertain,7 such calls can help practitioners determine whether they offer the right services for callers. Good decisions about initiating care always take financial pressures and constraints into account,8 and a pre-appointment telephone call can address those issues, too.
For all these reasons, talking to a prospective patient before he comes to see you makes sense. Screening lets you decide:
• whether you’re the right clinician for his needs
• who the right clinician is if you are not
• whether he should seek emergency evaluation when the situation sounds urgent.
Do phone calls start treatment?
As Dr. S’s questions show, telephone screenings might leave some callers thinking that treatment has started, even before their first office appointment. Having a treatment relationship is a prerequisite to malpractice liability,9 and courts have concluded that, under the right circumstances, telephone assessments do create physician-patient relationships.
Creating a physician-patient relationship
How or when might telephone screening make someone your patient? This question doesn’t have a precise answer, but how courts decided similar questions has depended on the questions the physician asked and whether the physician offered what sounded like medical advice.10,11 A physician-patient relationship forms when the physician takes some implied or affirmative action to treat, see, examine, care for, or offer a diagnosis to the patient,9,12,13 such as:
• knowingly accepting someone as a patient14
• explicitly agreeing to treat a person
• “acting in some other way such that the patient might reasonably be led to assume a doctor-patient relationship has been established.”15
Also, the “fact that a physician does not deal directly with a patient does not necessarily preclude the existence of a physician-patient relationship,”12 so a telephone conversation can create such a relationship if it contains the right elements. Table 116 highlights actions that, during the course of screening, might constitute initiation of a physician-patient relationship. Table 2 offers suggestions for managing initial telephone contacts to reduce the chance of inadvertently creating a physician-patient relationship.
In the eyes of the law, whether a physician-patient relationship was formed depends on specific facts of the situation and may be decided by a jury.13,14 In the case of Ms. C, Dr. S might avoid premature creation of a physician-patient relationship by refraining from offering a diagnosis at the conclusion of the screening call.17
Prescribing
Although features of the original screening interview indicated that Ms. C was not yet Dr. S’s patient, prescribing certainly would commence a physician-patient relationship.18 But even if the screening had made Ms. C a patient, refilling her prescription now probably is a bad idea.
Assuming that a physician-patient relationship exists, it is unlikely that a short telephone interview gave Dr. S enough information about Ms. C’s medical history and present mental status to ensure that his diagnostic reasoning would not be faulty. It also is unlikely that telephone screening allowed Dr. S to meet the standard of care for prescribing—a process that involves choosing medications suitable to the patient’s clinical needs, checking the results of any necessary lab tests, and obtaining appropriate informed consent.19
Satisfying duties
Outpatient facilities can instruct telephone screeners to conduct interviews in ways that reduce inadvertent establishment of a treatment relationship, but establishing such a relationship cannot be avoided in all cases. If a caller is distraught or in crisis, for example, compassion dictates helping him, and some callers (eg, Ms. C) may feel they have a firmer treatment relationship than actually exists.
Once you have created a physician-patient relationship, you must continue that relationship until you end it appropriately.3 That does not mean you have to provide definitive treatment; you simply need to exercise “reasonable care according to the standards of the profession.”16,20 If a caller telephones in an emergency situation, for example, the screening clinician should take appropriate steps to ensure safety, which might include calling law enforcement or facilitating hospitalization.3
One way to fulfill the duties of a physician-patient relationship inadvertently established during initial screening is through explicit discharge (if medically appropriate) or transfer of care to another physician.15 A prudent clinic or practitioner will describe other mental health resources in the community and sometimes assist with referral if the inquiring potential patient needs services that the provider does not offer.
In many communities, finding appropriate mental health resources is difficult. Creative approaches to this problem include transitional psychiatry or crisis support clinics that serve as a “bridge” to longer-term services,21,22 preliminary process groups,23 and telepsychiatry transitional clinics.24 When a clinic does not accept a person as a patient, the clinic should clearly document 1) key features of the contact and 2) the rationale for that decision
Bottom Line
You have a right and a responsibility to screen prospective patients for good fit to your treatment services. In doing so, however, you might inadvertently create a physician-patient relationship. If this happens, you should fulfill your clinical responsibilities, as you would for any patient, by helping the patient get appropriate care from you or another provider.
Disclosures
The authors report no financial relationship with any company whose products are mentioned in this article or with manufacturers of competing products.
1. Shoffner J, Staudt M, Marcus S, et al. Using telephone reminders to increase attendance at psychiatric appointments: findings of a pilot study in rural Appalachia. Psychiatr Serv. 2007;58(6):872-875.
2. Hiser v Randolph, 1980 617 P2d 774 (Ariz App).
3. American Psychiatric Association. Practice management for early career psychiatrists: a reference guide, 6th edition. http://www.psych.org/practice/managing-a-practice/ starting-a-practice. Published October 16, 2006. Accessed July 8, 2014.
4. Delgado SV, Strawn JR. Difficult psychiatric consultations: an integrated approach. New York, NY: Springer; 2014.
5. Aziz MA, Kenford S. Comparability of telephone and face-to-face interviews in assessing patients with posttraumatic stress disorder. J Psychiatric Pract. 2004;10(5): 307-313.
6. Michel C, Schimmelmann BG, Kupferschmid S, et al. Reliability of telephone assessments of at-risk criteria of psychosis: a comparison to face-to-face interviews. Schizophr Res. 2014;153(1-3):251-253.
7. Muskens EM, Lucassen P, Groenleer W, et al. Psychiatric diagnosis by telephone: is it an opportunity [published online March 15, 2014]? Soc Psychiatry Psychiatr Epidemiol. doi: 10.1007/s00127-014-0861-9.
8. Cassel CK, Guest JA. Choosing wisely: helping physicians and patients make smart decisions about their care. JAMA. 2012;307(17):1801-1802.
9. Roberts v Sankey, 2004 813 NE2d 1195 (Ind App).
10. O’Neill v Montefiore Hospital, 1960 202 NYS 2d 436 (NY App).
11. McKinney v Schlatter, 1997 692 NE2d 1045 (Ohio App).
12. Dehn v Edgecombe, 865 A2d 603 (Md 2005).
13. Kelley v Middle Tennessee Emergency Physicians, 133 SW3d 587 (Tenn 2004).
14. Oliver v Brock, 342 So2d 1 (Ala 1976).
15. Appelbaum PS, Gutheil TG. Malpractice and other forms of liability. In: Appelbaum PS, Gutheil TG, eds. Clinical Handbook of Psychiatry and the Law, 4th ed. Philadelphia, PA: Lippincott Williams and Wilkins; 2007:115-116.
16. Simon RI, Shuman DW. The doctor-patient relationship. Focus. 2007;5(4):423-431.
17. Torres A, Wagner R. Establishing the physician-patient relationship. J Dermatol Surg Oncol. 1993;19(2):147-149.
18. Aboff BM, Collier VU, Farber NJ, et al. Residents’ prescription writing for nonpatients. JAMA. 2002;288(3):381-385.
19. Edersheim JG, Stern TA. Liability associated with prescribing medications. Prim Care Companion J Clin Psychiatry. 2009;11(3):115-119.
20. Brown v Koulizakis, 331 SE2d 440 (Va 1985).
21. University of Michigan Department of Psychiatry. Crisis support clinic. http://www.psych.med.umich.edu/patient-care/crisis-support-clinic. Accessed July 9, 2014.
22. UAB Department of Psychiatry. http://www.uab.edu/ medicine/psychiatry. Accessed July 9, 2014.
23. Stone WN, Klein EB. The waiting-list group. Int J Group Psychother. 1999;49(4):417-428.
24. Detweiler MB, Arif S, Candelario J, et al. A telepsychiatry transition clinic: the first 12 months experience. J Telemed Telecare. 2011;17(6):293-297.
A young man with psychosis whose heart is racing
Case Agitated and violent
Mr. C, age 19, presents with anxiety, agitation, isolation, social withdrawal, and paranoia. He is admitted to the inpatient unit after attempting to punch his father and place him in a headlock. Mr. C has no history of mental illness, no significant medical history, and no significant family history of mental illness.
The treatment team determines that this is Mr. C’s first psychotic break. He is given a diagnosis of psychosis, not otherwise specified and started on risperidone, titrated to 2 mg/d, later discontinued secondary to tachycardia. He is then started on haloperidol, 5 mg/d titrated to 10 mg/d, and psychotic symptoms abate. Mr. C is discharged with a plan to receive follow-up care at an outpatient mental health center.
One year later, Mr. C is readmitted with a similar presentation: paranoia, agitation, anxiety, and isolation. After discharge, he starts an intensive outpatient program (IOP) for long-term treatment of adults who have a diagnosis of a schizophrenia spectrum disorder.
Several medication trials ensue, including risperidone, escitalopram, citalopram, fluphenazine, lorazepam, quetiapine, and haloperidol. Despite these trials over the course of 2 years, Mr. C continues to display paranoia and agitation, and is unable to resume academic and community activities. Within the IOP, Mr. C is placed in a vocational training program and struggles to remain stable enough to continue his job at a small greenhouse.
Concurrently, Mr. C is noted to be abusing alcohol. After the IOP treatment team expresses concern about his abuse, he reduces alcohol intake and he and his parents are educated on the impact of alcohol use on schizophrenia.
Which treatment option would you choose next?
a) initiate a trial of clozapine
b) try a long-acting injectable antipsychotic
c) recommend inpatient treatment
The authors’ observations
Clozapine is an atypical antipsychotic that is FDA-approved for treatment-resistant schizophrenia; it also helps reduce recurrent suicidal behavior in patients with schizophrenia or schizoaffective disorder.
Clozapine works by blocking D2 receptors, thereby reducing positive symptoms. It also blocks serotonin 2A receptors, which enhances dopamine release in certain brain regions, thereby reducing motor side effects. Interactions at 5-HT2C and 5-HT1A receptors may address cognitive and affective symptoms. Clozapine can help relieve negative symptoms and can decrease aggression. Because it has a low risk of tardive dyskinesia, clozapine is useful when treating patients with treatment-resistant schizophrenia.1-3
Treatment Quick heart rate
Mr. C’s IOP treatment team considers a clozapine trial because previous medication trials failed. All paperwork for the registry and screening labs are completed and Mr. C is started on clozapine.
Mr. C’s clozapine dosages are:
• Days 1 to 9: 25 mg/d
• Days 10 to 16: 50 mg/d
• Days 17 to 23: 75 mg/d
• Days 24 to 32: 100 mg/d
• Days 33 to 37: 125 mg/d
• Day 38: 150 mg/d.
On Day 45 of the clozapine trial, Mr. C is increasingly paranoid toward his father and thinks that his father is controlling his thoughts. Mr. C tells the attending psychiatrist that he ingested a handful of clonazepam and considered putting a bag over his head with the intent to commit suicide. Mr. C is admitted to the inpatient unit.
Admission vitals recorded a heart rate of 72 beats per minute but, later that day, the rate was recorded in the vital sign book as 137 beats per minute. The treatment team considers dehydration, anxiety, and staff error; Mr. C is observed carefully. Over the next 2 days, heart rate remains between 102 and 119 beats per minute.
Because of persistent tachycardia, the team orders lab studies, a medical consult, and an electrocardiogram (ECG). Thyroid panel, electrolytes, and clozapine level are within normal limits; ECG is unremarkable.
Although tachycardia is a known side effect of clozapine,3,4 we order an echocardiogram because of Mr. C’s young age and non-diagnostic laboratory workup. The echo study demonstrates reduced left-ventricular ejection fraction (LVEF) of 45%. Tests for HIV infection and Lyme disease are negative. The cardiology team diagnoses cardiomyopathy of unknown origin.
Although Mr. C has a history of alcohol abuse, the cardiology team believes that alcohol consumption does not adequately explain the cardiomyopathy, given his young age and the limited number of lifetime drinking-years (approximately 4 or 5); the team determines that clozapine is causing secondary cardiomyopathy and tachycardia, leading to reduced LVEF. Clozapine is stopped because the recommended treatment for toxic secondary cardiomyopathy is to remove the offending agent. At this point, the clozapine dosage is 250 mg/d.
At the medical team’s recommendation, Mr. C is started on metoprolol, a beta blocker, at 25 mg/d.
The etiology of secondary cardiomyopathy includes all of the following except:
a) tachycardia-induced
b) autoimmune
c) radiation-induced
d) infiltrative
e) endomyocardial
The authors’ observations
Cardiomyopathies are diseases of the heart muscle causing mechanical and electrical dysfunction. This group of diseases has a range of symptoms, causes, and treatments. Disease manifests typically as arrhythmia, systolic dysfunction, or diastolic dysfunction. Classification systems are based on origin, anatomy, physiology, primary treatments, method of diagnosis, biopsy, histopathology, and symptomatic state.
The American Heart Association Scientific Statement5 distinguishes cardiomyopathies by degree of organ involvement. Diseases confined to the heart are defined as primary cardiomyopathy, which may have a genetic, acquired, or mixed cause. Acquired causes include inflammatory (myocarditis), stress (Takotsubo), peripartum, and tachycardia. Cardiomyopathies that are part of generalized systemic disorders are defined as secondary cardiomyopathy (Table 1).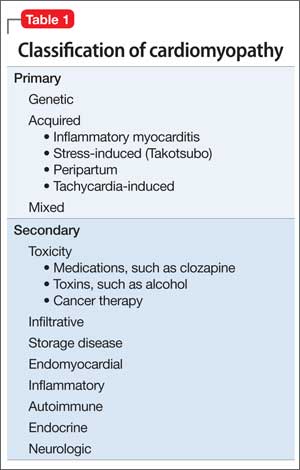
Secondary cardiomyopathies have many causes. These include toxicity (medications or alcohol), cancer therapy, infiltrative, storage disease, and endomyocardial, inflammatory, autoimmune, endocrine, and neurologic diseases.5
Evaluation of suspected cardiomyopathy begins with a history and physical focused on identifying causative factors. Selective testing, based on pretest probabilities, might include lab testing, ECG, and echocardiography, and can narrow the differential diagnosis. When toxin-induced cardiomyopathy is suspected, withdrawing the toxin and monitoring for improvement is recommended. The treatment and prognosis for cardiomyopathies vary, based on the cause.6
Review of the literature
After 23 cases of fatal and non-fatal myocarditis were found in a study of 8,000 patients starting clozapine,7 manufacturers in Australia introduced clinical guidelines. Before initiating clozapine, they recommended, clinicians should:
• screen for cardiac symptoms
• screen for a family history of heart disease
• obtain baseline ECG
• obtain baseline markers of myocardial damage (troponin assay and serum creatinine)
• obtain baseline echocardiogram
• repeat cardiac monitoring after the first and second week and then repeat in 6 months
• maintain a high degree of vigilance for signs and symptoms of cardiac toxicity throughout clozapine treatment.8,9
After studying 38 cases of clozapine-induced myocarditis—3 fatal— Ronaldson et al10 listed primary diagnostic features as:
• tachycardia (heart rate >100 beats per minute)
• heart rate >120 beats per minute
• temperature >37°C
• chest pain
• troponin I/T level >2 ng/mL
• C-reactive protein (CRP) > 100 mg/L
• erythrocyte sedimentation rate >50 mm/h.
Among non-fatal cases, symptoms abated after clozapine was discontinued. In 36 of the 38 cases, symptoms emerged 14 to 22 days after clozapine was started. For tachycardia to be considered a diagnostic feature, it must persist for at least 24 hours; if the heart rate is ≥120 beats per minute, however, persistence is not a criterion. It was thought that elevated CRP might herald disease onset; the authors suggest that CRP >50 mg/L should warrant increased monitoring with daily ECG and troponin levels.
Authors’ recommendations include:
• measuring troponin and CRP and order an ECG at baseline and at 7, 14, 21, and 28 days
• examining patient for signs and symptoms of illness at these same intervals
• considering chest pain or fever as an indicator of cardiomyopathy
• asking patients to report any illness during this 4-week period
• if ECG is abnormal or troponin elevated, decreasing clozapine pending further investigation.10
When medications fail
We had to discontinue Mr. C’s clozapine, which meant that the therapeutic relationship established between him and the psychology fellow became an important and, at times, the only bond between him and the medical team while olanzapine was initiated. The alliance between patient and clinician is an important factor for positive prognosis in mental health treatment.11-13 Priebe and McCabe14 asked if the therapeutic relationship in psychiatry is “the basis of therapy or therapy itself?” In a review of studies that used an operationalized measurement of the therapeutic relationship in treating severe mental illness, the authors concluded that the therapeutic relationship is a reliable predictor of outcome.15
In Mr. C’s case, the psychology fellow, who also works with the Partial Hospitalization Program/Intensive Outpatient Program (PHP/IOP), joined the treatment team on the inpatient unit a few days into hospitalization. Eleven meetings, including a discharge session, were held between the psychology fellow and the patient during the inpatient hospitalization. Mr. C also participated in a daily group session, facilitated by the psychology fellow.
Maintaining recognition of the boundary disturbance that characterizes schizophrenic psychoses was important for Mr. C. As Auerhahn and Moskowitz16 wrote, the inpatient therapist can be transformed by the schizophrenia patient into the all-knowing, all-powerful early mother, which could contribute to substantial improvement in the patient’s functioning and report of symptoms, only to have the patient’s symptoms return after discharge.
In an effort to evaluate the duration, frequency, and intensity of Mr. C’s symptom experience, a goal of Mr. C’s hospitalization was to attach words to his internal states, including mood and intensity of paranoid ideation. We showed Mr. C directly and indirectly that reporting intensification of symptoms and decreased functioning would not result in abandonment or punishment, and worked to demonstrate through our actions that the treatment team differs from Mr. C’s view of the world as dangerous and others as hostile and omnipotent.
Treatment Developing language
Initially, Mr. C gives a number (from 1 to 10) to describe his mood, 10 being the happiest he has ever felt and 1 being the most depressed. The treatment team discusses how important it is that Mr. C know his feelings and be able to convey to others how he feels.
Over time, Mr. C is encouraged to attach a feeling word to the number, and by discharge, he stops using numbers and responds to inquiries about his feelings with a mood word. This practice has been reinforced with the patient in the IOP program, allowing him to continue practicing linking his internal state with feeling words.
During hospitalization, Mr. C becomes more vocal about his level of paranoia and is now more likely to seek support when he first experiences a paranoid thought, rather than waiting until after he is paranoid and agitated. Mr. C is encouraged to monitor his thoughts and feelings, and to practice coping strategies he has identified as helpful, including deep breathing, meditation, listening to music, and reminding himself that he is safe.
The treatment team responds to Mr. C’s reports of paranoid ideation (eg, “Some of the other patients were talking about me today”) by processing the affect, and hypothesizing other explanations for these events to slow down “jumping to conclusions,” which is a common part of the paranoid experience.17 Additionally, all meetings with the cardiology team are processed and Mr. C receives psychoeducation about his heart function. Joint sessions with the psychiatry resident and psychology fellow allow Mr. C to ask medical questions and immediately process his reactions, which likely ameliorated his anxiety and allowed him to continue connecting with, identifying, and verbalizing his internal experiences. Given his history of paranoia, sessions also showed that Mr. C is an active participant in his treatment, with the hope of lessening his belief that bad things happen to him and that they are out of his control.
We maintain frequent contact with Mr. C’s parents to update them on their son’s functioning and to discuss treatment interventions that were helpful and the family could implement when Mr. C returns home. Discharge medications are discussed.
After 24 days in the inpatient unit, Mr. C is discharged to the IOP program. The psychology fellow walks Mr. C to the IOP program, where he transitioned immediately from inpatient to the IOP daily schedule of groups and an appointment with the program psychiatrist. The psychology fellow also arranged for and participated in the family meeting with Mr. C’s parents, sister, and treatment providers in the IOP program after his first day back at the IOP.
Throughout his hospitalization, Mr. C had no symptoms of cardiomyopathy, without exercise intolerance, shortness of breath, fatigue, or fever. He is discharged with follow-up care at his outpatient program at the PHP level of care and a follow-up echocardiogram and cardiology appointment are scheduled for 6 weeks later.
The authors' observations
Throughout Mr. C’s hospitalization, the intersections among psychiatry, psychology, cardiology, and internal medicine were apparent and necessary for treatment. No one specialty was able to completely direct this patient’s care without the expertise of, and input from, others. When it looked like all medications had failed, the relationship between the patient and the psychology fellow and the application of previously learned coping strategies prevented acute decompensation.
Clozapine is FDA-approved for treatment-resistant schizophrenia and often is a last resort to help patients remain stable. When clozapine is chosen, it is important to be aware of its side-effect profile (Table 2,1 and Table 3,1-3) and the need for monitoring. The importance of relying on colleagues from other specialties to assist in the effective monitoring process cannot be overstated. This multidisciplinary team ensured that Mr. C did not experience acute decompensation during this process. Cardiac function improved, with an LVEF of 50% after clozapine was discontinued. Mr. C has not needed hospitalization again.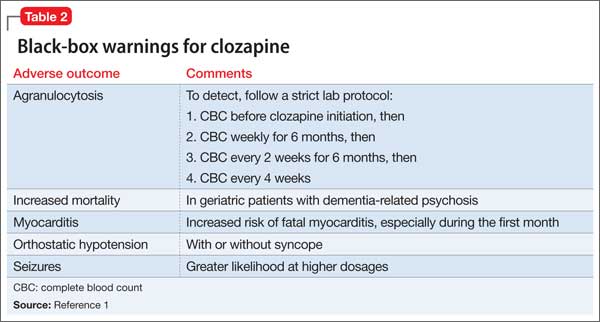
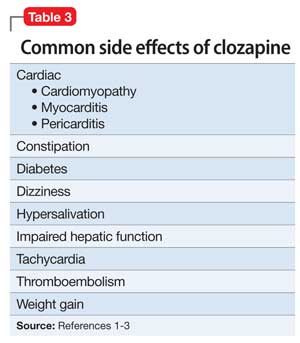
Outcome Stability achieved
Mr. C is successfully discharged from the inpatient service after 24 days in the hospital on the following regimen: olanzapine, 20 mg/d; duloxetine 60 mg/d; benztropine, 0.5 mg/d; haloperidol, 20 mg/d; metoprolol, 25 mg/d; clonazepam, 0.25 mg/d; quetiapine, 50 mg/d; and chlorpromazine, 50 mg as needed for agitation and paranoia. He is given a diagnosis of toxic secondary cardiomyopathy due to clozapine, and remains asymptomatic from a cardiac perspective after discontinuing clozapine.
Follow-up appointment with cardiology and repeat echocardiography were scheduled for 6 weeks after discharge. The follow-up echocardiogram showed improvement (LVEF, 50%). Mr. C continues to do well and remains a client at the IOP program.
Bottom Line
Clozapine often is used as a last resort for patients with treatment-resistant schizophrenia, but its side-effect profile requires careful management and monitoring. If a patient taking clozapine shows tachycardia, consider cardiomyopathy. Evaluation might include lab testing, electrocardiography, and echocardiography. Symptoms often resolve when clozapine is discontinued.
Related Resources
• Citrome L. Clozapine for schizophrenia: life-threatening or life-saving treatment? Current Psychiatry. 2009;8(12):56-63.
• Layland JJ, Liew D, Prior DL. Clozapine-induced cardiotoxicity: a clinical update. Med J Aust. 2009;190(4):190-192.
Drug Brand Names
Benztropine • Cogentin Fluphenazine • Prolixin
Chlorpromazine • Thorazine Haloperidol • Haldol
Citalopram • Celexa Lorazepam • Ativan
Clonazepam • Klonopin Metoprolol • Lopressor
Clozapine • Clozaril Olanzapine • Zyprexa
Duloxetine • Cymbalta Quetiapine • Seroquel
Escitalopram • Lexapro Risperidone • Risperdal
Disclosure
The authors report no financial relationship with any company whose products are mentioned in this article or with manufacturers of competing products.
1. Clozaril [package insert]. East Hanover, NJ: Novartis Pharmaceuticals Corporation; 2013.
2. Stahl SM. Clozapine. In: Stahl SM. The prescriber’s guide: Stahl’s essential psychopharmacology. 3rd ed. New York, NY: Cambridge University Press; 2009:113-118.
3. Young CR, Bowers MB Jr, Mazure CM. Management of the adverse effects of clozapine. Schizophr Bull. 1998;24(3):381-388.
4. Lang UE, Willbring M, von Golitschek R, et al. Clozapine-induced myocarditis after long-term treatment: case presentation and clinical perspectives. J Psychopharmacol. 2008;22(5):576-580.
5. Maron BJ, Towbin JA, Thiene G, et al; American Heart Association; Council on Clinical Cardiology, Heart Failure and Transplantation Committee; Quality of Care and Outcomes Research and Functional Genomics and Translational Biology Interdisciplinary Working Groups; Council on Epidemiology and Prevention. Contemporary definitions and classification of the cardiomyopathies: an American Heart Association scientific statement from the Council on Clinical Cardiology, Heart Failure and Transplantation Committee; Quality of Care and Outcomes Research and Functional Genomics and Translational Biology Interdisciplinary Working Groups; and Council on Epidemiology and Prevention. Circulation. 2006;113(14):1807-1816.
6. Hare JM. The dilated, restrictive, and infiltrative cardiomyopathies. In: Braunwald’s heart disease: a textbook of cardiovascular medicine. 9th ed. Bonow RO, Mann DL, Zipes DP, eds. New York, NY: Elsevier; 2012:1561-1581.
7. Kilian JG, Kerr K, Lawrence C, et al. Myocarditis and cardiomyopathy associated with clozapine. Lancet. 1999;354(9193):1841-1845.
8. Clopine [package insert]. Aukland, New Zealand: Douglas Pharmaceuticals; 2014.
9. Killian JG, Kerr K, Lawrence C, et al. Myocarditis and cardiomyopathy associated with clozapine. Lancet. 1999; 354(9193):1841-1845.
10. Ronaldson KJ, Taylor AJ, Fitzgerald PB, et al. Diagnostic characteristics of clozapine-induced myocarditis identified by an analysis of 38 cases and 47 controls. J Clin Psychiatry. 2010;71(8):976-981.
11. Rogers CR. On becoming a person: a therapist’s view of psychotherapy. New York, NY: Houghton Mifflin; 1961.
12. Horvath AO, Symonds BD. Relation between a working alliance and outcome in psychotherapy: a meta-analysis. Journal of Counseling Psychology. 1991;38(2):139-149.
13. Krupnick JL, Sotsky SM, Simmens S, et al. The role of the therapeutic alliance in psychotherapy and pharmacotherapy outcome: Findings in the National Institute of Mental Health Treatment of Depression Collaborative Research Program. Journal of Consulting and Clinical Psychology. 1996;64(3):532-539.
14. Priebe S, McCabe R. Therapeutic relationships in psychiatry: the basis of therapy or therapy in itself? Int Rev Psychiatry. 2008;20(6):521-526.
15. McCabe R, Priebe S. The therapeutic relationship in the treatment of severe mental illness: a review of methods and findings. Int J Soc Psychiatry. 2004;50(2):115-128.
16. Auerhahn NC, Moskowitz MB. Merger fantasies in individual inpatient therapy with schizophrenic patient. Psychoanalytic Psychology. 1984;1(2):131-148.
17. Penn DL, Roberts DL, Combs D, et al. Best practices: The development of the Social Cognition and Interaction Training program for schizophrenia spectrum disorders. Psychiatr Serv. 2007;58(4):449-451.
Case Agitated and violent
Mr. C, age 19, presents with anxiety, agitation, isolation, social withdrawal, and paranoia. He is admitted to the inpatient unit after attempting to punch his father and place him in a headlock. Mr. C has no history of mental illness, no significant medical history, and no significant family history of mental illness.
The treatment team determines that this is Mr. C’s first psychotic break. He is given a diagnosis of psychosis, not otherwise specified and started on risperidone, titrated to 2 mg/d, later discontinued secondary to tachycardia. He is then started on haloperidol, 5 mg/d titrated to 10 mg/d, and psychotic symptoms abate. Mr. C is discharged with a plan to receive follow-up care at an outpatient mental health center.
One year later, Mr. C is readmitted with a similar presentation: paranoia, agitation, anxiety, and isolation. After discharge, he starts an intensive outpatient program (IOP) for long-term treatment of adults who have a diagnosis of a schizophrenia spectrum disorder.
Several medication trials ensue, including risperidone, escitalopram, citalopram, fluphenazine, lorazepam, quetiapine, and haloperidol. Despite these trials over the course of 2 years, Mr. C continues to display paranoia and agitation, and is unable to resume academic and community activities. Within the IOP, Mr. C is placed in a vocational training program and struggles to remain stable enough to continue his job at a small greenhouse.
Concurrently, Mr. C is noted to be abusing alcohol. After the IOP treatment team expresses concern about his abuse, he reduces alcohol intake and he and his parents are educated on the impact of alcohol use on schizophrenia.
Which treatment option would you choose next?
a) initiate a trial of clozapine
b) try a long-acting injectable antipsychotic
c) recommend inpatient treatment
The authors’ observations
Clozapine is an atypical antipsychotic that is FDA-approved for treatment-resistant schizophrenia; it also helps reduce recurrent suicidal behavior in patients with schizophrenia or schizoaffective disorder.
Clozapine works by blocking D2 receptors, thereby reducing positive symptoms. It also blocks serotonin 2A receptors, which enhances dopamine release in certain brain regions, thereby reducing motor side effects. Interactions at 5-HT2C and 5-HT1A receptors may address cognitive and affective symptoms. Clozapine can help relieve negative symptoms and can decrease aggression. Because it has a low risk of tardive dyskinesia, clozapine is useful when treating patients with treatment-resistant schizophrenia.1-3
Treatment Quick heart rate
Mr. C’s IOP treatment team considers a clozapine trial because previous medication trials failed. All paperwork for the registry and screening labs are completed and Mr. C is started on clozapine.
Mr. C’s clozapine dosages are:
• Days 1 to 9: 25 mg/d
• Days 10 to 16: 50 mg/d
• Days 17 to 23: 75 mg/d
• Days 24 to 32: 100 mg/d
• Days 33 to 37: 125 mg/d
• Day 38: 150 mg/d.
On Day 45 of the clozapine trial, Mr. C is increasingly paranoid toward his father and thinks that his father is controlling his thoughts. Mr. C tells the attending psychiatrist that he ingested a handful of clonazepam and considered putting a bag over his head with the intent to commit suicide. Mr. C is admitted to the inpatient unit.
Admission vitals recorded a heart rate of 72 beats per minute but, later that day, the rate was recorded in the vital sign book as 137 beats per minute. The treatment team considers dehydration, anxiety, and staff error; Mr. C is observed carefully. Over the next 2 days, heart rate remains between 102 and 119 beats per minute.
Because of persistent tachycardia, the team orders lab studies, a medical consult, and an electrocardiogram (ECG). Thyroid panel, electrolytes, and clozapine level are within normal limits; ECG is unremarkable.
Although tachycardia is a known side effect of clozapine,3,4 we order an echocardiogram because of Mr. C’s young age and non-diagnostic laboratory workup. The echo study demonstrates reduced left-ventricular ejection fraction (LVEF) of 45%. Tests for HIV infection and Lyme disease are negative. The cardiology team diagnoses cardiomyopathy of unknown origin.
Although Mr. C has a history of alcohol abuse, the cardiology team believes that alcohol consumption does not adequately explain the cardiomyopathy, given his young age and the limited number of lifetime drinking-years (approximately 4 or 5); the team determines that clozapine is causing secondary cardiomyopathy and tachycardia, leading to reduced LVEF. Clozapine is stopped because the recommended treatment for toxic secondary cardiomyopathy is to remove the offending agent. At this point, the clozapine dosage is 250 mg/d.
At the medical team’s recommendation, Mr. C is started on metoprolol, a beta blocker, at 25 mg/d.
The etiology of secondary cardiomyopathy includes all of the following except:
a) tachycardia-induced
b) autoimmune
c) radiation-induced
d) infiltrative
e) endomyocardial
The authors’ observations
Cardiomyopathies are diseases of the heart muscle causing mechanical and electrical dysfunction. This group of diseases has a range of symptoms, causes, and treatments. Disease manifests typically as arrhythmia, systolic dysfunction, or diastolic dysfunction. Classification systems are based on origin, anatomy, physiology, primary treatments, method of diagnosis, biopsy, histopathology, and symptomatic state.
The American Heart Association Scientific Statement5 distinguishes cardiomyopathies by degree of organ involvement. Diseases confined to the heart are defined as primary cardiomyopathy, which may have a genetic, acquired, or mixed cause. Acquired causes include inflammatory (myocarditis), stress (Takotsubo), peripartum, and tachycardia. Cardiomyopathies that are part of generalized systemic disorders are defined as secondary cardiomyopathy (Table 1).
Secondary cardiomyopathies have many causes. These include toxicity (medications or alcohol), cancer therapy, infiltrative, storage disease, and endomyocardial, inflammatory, autoimmune, endocrine, and neurologic diseases.5
Evaluation of suspected cardiomyopathy begins with a history and physical focused on identifying causative factors. Selective testing, based on pretest probabilities, might include lab testing, ECG, and echocardiography, and can narrow the differential diagnosis. When toxin-induced cardiomyopathy is suspected, withdrawing the toxin and monitoring for improvement is recommended. The treatment and prognosis for cardiomyopathies vary, based on the cause.6
Review of the literature
After 23 cases of fatal and non-fatal myocarditis were found in a study of 8,000 patients starting clozapine,7 manufacturers in Australia introduced clinical guidelines. Before initiating clozapine, they recommended, clinicians should:
• screen for cardiac symptoms
• screen for a family history of heart disease
• obtain baseline ECG
• obtain baseline markers of myocardial damage (troponin assay and serum creatinine)
• obtain baseline echocardiogram
• repeat cardiac monitoring after the first and second week and then repeat in 6 months
• maintain a high degree of vigilance for signs and symptoms of cardiac toxicity throughout clozapine treatment.8,9
After studying 38 cases of clozapine-induced myocarditis—3 fatal— Ronaldson et al10 listed primary diagnostic features as:
• tachycardia (heart rate >100 beats per minute)
• heart rate >120 beats per minute
• temperature >37°C
• chest pain
• troponin I/T level >2 ng/mL
• C-reactive protein (CRP) > 100 mg/L
• erythrocyte sedimentation rate >50 mm/h.
Among non-fatal cases, symptoms abated after clozapine was discontinued. In 36 of the 38 cases, symptoms emerged 14 to 22 days after clozapine was started. For tachycardia to be considered a diagnostic feature, it must persist for at least 24 hours; if the heart rate is ≥120 beats per minute, however, persistence is not a criterion. It was thought that elevated CRP might herald disease onset; the authors suggest that CRP >50 mg/L should warrant increased monitoring with daily ECG and troponin levels.
Authors’ recommendations include:
• measuring troponin and CRP and order an ECG at baseline and at 7, 14, 21, and 28 days
• examining patient for signs and symptoms of illness at these same intervals
• considering chest pain or fever as an indicator of cardiomyopathy
• asking patients to report any illness during this 4-week period
• if ECG is abnormal or troponin elevated, decreasing clozapine pending further investigation.10
When medications fail
We had to discontinue Mr. C’s clozapine, which meant that the therapeutic relationship established between him and the psychology fellow became an important and, at times, the only bond between him and the medical team while olanzapine was initiated. The alliance between patient and clinician is an important factor for positive prognosis in mental health treatment.11-13 Priebe and McCabe14 asked if the therapeutic relationship in psychiatry is “the basis of therapy or therapy itself?” In a review of studies that used an operationalized measurement of the therapeutic relationship in treating severe mental illness, the authors concluded that the therapeutic relationship is a reliable predictor of outcome.15
In Mr. C’s case, the psychology fellow, who also works with the Partial Hospitalization Program/Intensive Outpatient Program (PHP/IOP), joined the treatment team on the inpatient unit a few days into hospitalization. Eleven meetings, including a discharge session, were held between the psychology fellow and the patient during the inpatient hospitalization. Mr. C also participated in a daily group session, facilitated by the psychology fellow.
Maintaining recognition of the boundary disturbance that characterizes schizophrenic psychoses was important for Mr. C. As Auerhahn and Moskowitz16 wrote, the inpatient therapist can be transformed by the schizophrenia patient into the all-knowing, all-powerful early mother, which could contribute to substantial improvement in the patient’s functioning and report of symptoms, only to have the patient’s symptoms return after discharge.
In an effort to evaluate the duration, frequency, and intensity of Mr. C’s symptom experience, a goal of Mr. C’s hospitalization was to attach words to his internal states, including mood and intensity of paranoid ideation. We showed Mr. C directly and indirectly that reporting intensification of symptoms and decreased functioning would not result in abandonment or punishment, and worked to demonstrate through our actions that the treatment team differs from Mr. C’s view of the world as dangerous and others as hostile and omnipotent.
Treatment Developing language
Initially, Mr. C gives a number (from 1 to 10) to describe his mood, 10 being the happiest he has ever felt and 1 being the most depressed. The treatment team discusses how important it is that Mr. C know his feelings and be able to convey to others how he feels.
Over time, Mr. C is encouraged to attach a feeling word to the number, and by discharge, he stops using numbers and responds to inquiries about his feelings with a mood word. This practice has been reinforced with the patient in the IOP program, allowing him to continue practicing linking his internal state with feeling words.
During hospitalization, Mr. C becomes more vocal about his level of paranoia and is now more likely to seek support when he first experiences a paranoid thought, rather than waiting until after he is paranoid and agitated. Mr. C is encouraged to monitor his thoughts and feelings, and to practice coping strategies he has identified as helpful, including deep breathing, meditation, listening to music, and reminding himself that he is safe.
The treatment team responds to Mr. C’s reports of paranoid ideation (eg, “Some of the other patients were talking about me today”) by processing the affect, and hypothesizing other explanations for these events to slow down “jumping to conclusions,” which is a common part of the paranoid experience.17 Additionally, all meetings with the cardiology team are processed and Mr. C receives psychoeducation about his heart function. Joint sessions with the psychiatry resident and psychology fellow allow Mr. C to ask medical questions and immediately process his reactions, which likely ameliorated his anxiety and allowed him to continue connecting with, identifying, and verbalizing his internal experiences. Given his history of paranoia, sessions also showed that Mr. C is an active participant in his treatment, with the hope of lessening his belief that bad things happen to him and that they are out of his control.
We maintain frequent contact with Mr. C’s parents to update them on their son’s functioning and to discuss treatment interventions that were helpful and the family could implement when Mr. C returns home. Discharge medications are discussed.
After 24 days in the inpatient unit, Mr. C is discharged to the IOP program. The psychology fellow walks Mr. C to the IOP program, where he transitioned immediately from inpatient to the IOP daily schedule of groups and an appointment with the program psychiatrist. The psychology fellow also arranged for and participated in the family meeting with Mr. C’s parents, sister, and treatment providers in the IOP program after his first day back at the IOP.
Throughout his hospitalization, Mr. C had no symptoms of cardiomyopathy, without exercise intolerance, shortness of breath, fatigue, or fever. He is discharged with follow-up care at his outpatient program at the PHP level of care and a follow-up echocardiogram and cardiology appointment are scheduled for 6 weeks later.
The authors' observations
Throughout Mr. C’s hospitalization, the intersections among psychiatry, psychology, cardiology, and internal medicine were apparent and necessary for treatment. No one specialty was able to completely direct this patient’s care without the expertise of, and input from, others. When it looked like all medications had failed, the relationship between the patient and the psychology fellow and the application of previously learned coping strategies prevented acute decompensation.
Clozapine is FDA-approved for treatment-resistant schizophrenia and often is a last resort to help patients remain stable. When clozapine is chosen, it is important to be aware of its side-effect profile (Table 2,1 and Table 3,1-3) and the need for monitoring. The importance of relying on colleagues from other specialties to assist in the effective monitoring process cannot be overstated. This multidisciplinary team ensured that Mr. C did not experience acute decompensation during this process. Cardiac function improved, with an LVEF of 50% after clozapine was discontinued. Mr. C has not needed hospitalization again.
Outcome Stability achieved
Mr. C is successfully discharged from the inpatient service after 24 days in the hospital on the following regimen: olanzapine, 20 mg/d; duloxetine 60 mg/d; benztropine, 0.5 mg/d; haloperidol, 20 mg/d; metoprolol, 25 mg/d; clonazepam, 0.25 mg/d; quetiapine, 50 mg/d; and chlorpromazine, 50 mg as needed for agitation and paranoia. He is given a diagnosis of toxic secondary cardiomyopathy due to clozapine, and remains asymptomatic from a cardiac perspective after discontinuing clozapine.
Follow-up appointment with cardiology and repeat echocardiography were scheduled for 6 weeks after discharge. The follow-up echocardiogram showed improvement (LVEF, 50%). Mr. C continues to do well and remains a client at the IOP program.
Bottom Line
Clozapine often is used as a last resort for patients with treatment-resistant schizophrenia, but its side-effect profile requires careful management and monitoring. If a patient taking clozapine shows tachycardia, consider cardiomyopathy. Evaluation might include lab testing, electrocardiography, and echocardiography. Symptoms often resolve when clozapine is discontinued.
Related Resources
• Citrome L. Clozapine for schizophrenia: life-threatening or life-saving treatment? Current Psychiatry. 2009;8(12):56-63.
• Layland JJ, Liew D, Prior DL. Clozapine-induced cardiotoxicity: a clinical update. Med J Aust. 2009;190(4):190-192.
Drug Brand Names
Benztropine • Cogentin Fluphenazine • Prolixin
Chlorpromazine • Thorazine Haloperidol • Haldol
Citalopram • Celexa Lorazepam • Ativan
Clonazepam • Klonopin Metoprolol • Lopressor
Clozapine • Clozaril Olanzapine • Zyprexa
Duloxetine • Cymbalta Quetiapine • Seroquel
Escitalopram • Lexapro Risperidone • Risperdal
Disclosure
The authors report no financial relationship with any company whose products are mentioned in this article or with manufacturers of competing products.
1. Clozaril [package insert]. East Hanover, NJ: Novartis Pharmaceuticals Corporation; 2013.
2. Stahl SM. Clozapine. In: Stahl SM. The prescriber’s guide: Stahl’s essential psychopharmacology. 3rd ed. New York, NY: Cambridge University Press; 2009:113-118.
3. Young CR, Bowers MB Jr, Mazure CM. Management of the adverse effects of clozapine. Schizophr Bull. 1998;24(3):381-388.
4. Lang UE, Willbring M, von Golitschek R, et al. Clozapine-induced myocarditis after long-term treatment: case presentation and clinical perspectives. J Psychopharmacol. 2008;22(5):576-580.
5. Maron BJ, Towbin JA, Thiene G, et al; American Heart Association; Council on Clinical Cardiology, Heart Failure and Transplantation Committee; Quality of Care and Outcomes Research and Functional Genomics and Translational Biology Interdisciplinary Working Groups; Council on Epidemiology and Prevention. Contemporary definitions and classification of the cardiomyopathies: an American Heart Association scientific statement from the Council on Clinical Cardiology, Heart Failure and Transplantation Committee; Quality of Care and Outcomes Research and Functional Genomics and Translational Biology Interdisciplinary Working Groups; and Council on Epidemiology and Prevention. Circulation. 2006;113(14):1807-1816.
6. Hare JM. The dilated, restrictive, and infiltrative cardiomyopathies. In: Braunwald’s heart disease: a textbook of cardiovascular medicine. 9th ed. Bonow RO, Mann DL, Zipes DP, eds. New York, NY: Elsevier; 2012:1561-1581.
7. Kilian JG, Kerr K, Lawrence C, et al. Myocarditis and cardiomyopathy associated with clozapine. Lancet. 1999;354(9193):1841-1845.
8. Clopine [package insert]. Aukland, New Zealand: Douglas Pharmaceuticals; 2014.
9. Killian JG, Kerr K, Lawrence C, et al. Myocarditis and cardiomyopathy associated with clozapine. Lancet. 1999; 354(9193):1841-1845.
10. Ronaldson KJ, Taylor AJ, Fitzgerald PB, et al. Diagnostic characteristics of clozapine-induced myocarditis identified by an analysis of 38 cases and 47 controls. J Clin Psychiatry. 2010;71(8):976-981.
11. Rogers CR. On becoming a person: a therapist’s view of psychotherapy. New York, NY: Houghton Mifflin; 1961.
12. Horvath AO, Symonds BD. Relation between a working alliance and outcome in psychotherapy: a meta-analysis. Journal of Counseling Psychology. 1991;38(2):139-149.
13. Krupnick JL, Sotsky SM, Simmens S, et al. The role of the therapeutic alliance in psychotherapy and pharmacotherapy outcome: Findings in the National Institute of Mental Health Treatment of Depression Collaborative Research Program. Journal of Consulting and Clinical Psychology. 1996;64(3):532-539.
14. Priebe S, McCabe R. Therapeutic relationships in psychiatry: the basis of therapy or therapy in itself? Int Rev Psychiatry. 2008;20(6):521-526.
15. McCabe R, Priebe S. The therapeutic relationship in the treatment of severe mental illness: a review of methods and findings. Int J Soc Psychiatry. 2004;50(2):115-128.
16. Auerhahn NC, Moskowitz MB. Merger fantasies in individual inpatient therapy with schizophrenic patient. Psychoanalytic Psychology. 1984;1(2):131-148.
17. Penn DL, Roberts DL, Combs D, et al. Best practices: The development of the Social Cognition and Interaction Training program for schizophrenia spectrum disorders. Psychiatr Serv. 2007;58(4):449-451.
PTSD ‘updates’ in DSM-5 concerning
As a seasoned psychiatrist, I try to take most events in stride. My main reaction to unsettling events is to flatten down and take my own pulse.
However, when I saw the article in the Lancet Psychiatry (2014 Aug. 14 [doi:10.1016/S2215-0366(14)70235-4]) by my longtime colleague, Col. (Ret.) Charles W. Hoge, M.D., and his coauthors, my pulse went way up, and "Oh, my God" was my very unscientific reaction.

As readers may recall, the new definition of posttraumatic stress disorder raises the number of symptoms from 17 to 20, and 8 of those original symptoms were substantially reworded. In addition, PTSD was moved in the new manual from an anxiety disorder to disorders related to trauma and stressors.
In their study, Dr. Hoge and his coauthors administered surveys to soldiers looking at DSM-IV-TR and DSM-5 criteria. In brief, about a third of soldiers who met DSM-IV-TR criteria for PTSD did not meet DSM-5 criteria. Almost a third were in the opposite camp, meeting DSM-5 but not the older criteria, wrote Dr. Hoge of the Center for Psychiatry and Neuroscience at the Walter Reed Army Institute of Research in Silver Spring, Md. The main issue is about criterion C and the splitting up of avoidance symptoms from depressive symptoms.
Why was my reaction so strong? I had thought that the new criteria would widen those eligible for the diagnosis. Instead, it eliminates almost a third of them, mainly because they did not meet the avoidant criteria. (Please read the article for the full complex details.)
In the disability system in the military and Veterans Affairs system, the diagnosis of PTSD carries major weight. So what will happen if the criteria exclude them?

The good news is that both Veterans Affairs and the Department of Defense have made it clear that service members and veterans who already have the diagnosis according to the DSM-IV will not have it changed as a result of DSM-5, so the new definition mostly pertains to those newly seeking care or benefits now. It remains unclear what diagnosis should be used for those veterans who clearly would have met the previous definition (which has been used for more than 25 years), but not the new one. The DSM-5 recommends the use of adjustment disorder in this case, but some experts are concerned that the use of this diagnosis for this purpose will have negative effects. A major issue is that service members can be separated without benefits for an adjustment disorder. Questions also remain about whether adjustment disorder should have even been paired with PTSD in the same chapter in the new DSM-5.
In the accompanying commentary, Dr. Alexander C. McFarlane, of the Centre for Traumatic Studies at the University of Adelaide, Australia, warns about the negative consequences of the change in definition (Lancet Psychiatry 2014 Aug. 14 [doi:10.1016/S2215-0366(14)70321-9]. He also urges caution when the new diagnosis is used in forensic or disability evaluations.
I recommend that readers review this important article and commentary, and that the military and the VA also take a cautious approach.
Dr. Ritchie is former chief of psychiatry for the U.S. Army and current chief clinical officer in the behavioral health department for the District of Columbia.
As a seasoned psychiatrist, I try to take most events in stride. My main reaction to unsettling events is to flatten down and take my own pulse.
However, when I saw the article in the Lancet Psychiatry (2014 Aug. 14 [doi:10.1016/S2215-0366(14)70235-4]) by my longtime colleague, Col. (Ret.) Charles W. Hoge, M.D., and his coauthors, my pulse went way up, and "Oh, my God" was my very unscientific reaction.
As readers may recall, the new definition of posttraumatic stress disorder raises the number of symptoms from 17 to 20, and 8 of those original symptoms were substantially reworded. In addition, PTSD was moved in the new manual from an anxiety disorder to disorders related to trauma and stressors.
In their study, Dr. Hoge and his coauthors administered surveys to soldiers looking at DSM-IV-TR and DSM-5 criteria. In brief, about a third of soldiers who met DSM-IV-TR criteria for PTSD did not meet DSM-5 criteria. Almost a third were in the opposite camp, meeting DSM-5 but not the older criteria, wrote Dr. Hoge of the Center for Psychiatry and Neuroscience at the Walter Reed Army Institute of Research in Silver Spring, Md. The main issue is about criterion C and the splitting up of avoidance symptoms from depressive symptoms.
Why was my reaction so strong? I had thought that the new criteria would widen those eligible for the diagnosis. Instead, it eliminates almost a third of them, mainly because they did not meet the avoidant criteria. (Please read the article for the full complex details.)
In the disability system in the military and Veterans Affairs system, the diagnosis of PTSD carries major weight. So what will happen if the criteria exclude them?
The good news is that both Veterans Affairs and the Department of Defense have made it clear that service members and veterans who already have the diagnosis according to the DSM-IV will not have it changed as a result of DSM-5, so the new definition mostly pertains to those newly seeking care or benefits now. It remains unclear what diagnosis should be used for those veterans who clearly would have met the previous definition (which has been used for more than 25 years), but not the new one. The DSM-5 recommends the use of adjustment disorder in this case, but some experts are concerned that the use of this diagnosis for this purpose will have negative effects. A major issue is that service members can be separated without benefits for an adjustment disorder. Questions also remain about whether adjustment disorder should have even been paired with PTSD in the same chapter in the new DSM-5.
In the accompanying commentary, Dr. Alexander C. McFarlane, of the Centre for Traumatic Studies at the University of Adelaide, Australia, warns about the negative consequences of the change in definition (Lancet Psychiatry 2014 Aug. 14 [doi:10.1016/S2215-0366(14)70321-9]. He also urges caution when the new diagnosis is used in forensic or disability evaluations.
I recommend that readers review this important article and commentary, and that the military and the VA also take a cautious approach.
Dr. Ritchie is former chief of psychiatry for the U.S. Army and current chief clinical officer in the behavioral health department for the District of Columbia.

Autologous NK cells can fight ALL

Credit: Bjorn Onfelt/Dan Davis
In vitro experiments suggest a patient’s own natural killer (NK) cells can be expanded and modified to fight acute lymphoblastic leukemia (ALL).
Researchers successfully expanded CD56+ cells isolated from the bone marrow and peripheral blood of ALL patients.
And these cells exhibited cytotoxicity against the patients’ own ALL cells. The effect was enhanced by the addition of IL-15 and a monoclonal antibody (mAb) targeting BAFF-R.
Hisham Abdel-Azim, MD, of Children’s Hospital Los Angeles, and his colleagues reported these results in Leukemia.
The researchers first used flow cytometry to detect CD56+ cells in bone marrow and peripheral blood samples from ALL patients. The team discovered these cells were detectable at diagnosis, post-induction, and relapse.
To expand the cells, the researchers cocultured them with artificial antigen-presenting K562 clone 9.mbIL-21 cells. The expanded CD56+ cells demonstrated allogeneic cytotoxicity against ALL cells, even in the absence of antibody.
The addition of a mAb targeting BAFF-R enhanced CD56+ cells’ cytotoxicity against ALL cells. The activity of these CD56+ cells was comparable to that of NK cells derived from healthy patients.
The researchers also compared CD56+CD3- cells to CD56+CD3+ cells and found the CD3- cells exhibited increased levels of activation in antibody-mediated cellular cytotoxicity reactions. The CD56+CD3+ cells were not stimulated by BAFF-R mAbs.
The team then tested the NK cells’ autologous cytotoxicity. And, as in previous experiments, the CD56+ cells from ALL samples demonstrated nonantibody-dependent cytotoxicity and enhanced cytotoxicity in the presence of BAFF-R mAbs.
Finally, the researchers decided to investigate whether the addition of IL-2 or IL-15 could further stimulate CD56+ cells’ cytotoxicity. And while they found that both cytokines did the job, IL-15 proved more successful.
“These results are very promising, with potential as a part of first-line therapy and also as a treatment for eliminating any remaining cancer cells . . . following standard chemotherapy,” Dr Abdel-Azim said. “We anticipate additional preclinical testing and then a clinical trial to evaluate the therapy in children with leukemia.” ![]()