User login
Improved Mortality with CABG vs PCI in Multivessel Disease
Clinical question
For patients with multivessel disease, which is the better approach for reducing long-term mortality: coronary artery bypass grafting or percutaneous coronary intervention?
Bottom line
When compared with percutaneous coronary intervention (PCI), coronary artery bypass grafting (CABG) reduces overall mortality and myocardial infarctions (MIs) in patients with multivessel disease. You would need to treat 37 patients with CABG to prevent one death, and 26 patients with CABG to prevent one MI over an average follow-up of 4 years. This is compared with a number needed to treat to harm of 105 to cause one additional stroke with CABG. (LOE = 1a)
Reference
Sipahi I, Akay H, Dagdelen S, Blitz A, Alhan C. Coronary artery bypass grafting vs percutaneous coronary intervention and long-term mortality and morbidity in multivessel disease: meta-analysis of randomized clinical trials of the arterial grafting and stenting era. JAMA Intern Med 2014;174(2):223-230.
Study design
Meta-analysis (randomized controlled trials)
Funding source
Unknown/not stated
Allocation
Uncertain
Setting
Various (meta-analysis)
Synopsis
Existing trials that compare CABG with PCI are underpowered to detect a difference in long-term mortality or MI. To study these outcomes, these investigators searched multiple databases, including MEDLINE and the Cochrane Central Register of Controlled Trials, to find randomized controlled trials that compared the 2 approaches over an average follow-up of at least 1 year in patients with multivessel disease. To ensure that these trials reflected contemporary practice, the authors only included trials in which arterial grafts were used in 90% of the CABG cases and trials in which stents were used in 70% of the PCI cases. Two investigators independently extracted data from the 6 included trials. No formal quality assessment was performed. No publication bias was detected. When taken together, data from the 6 trials (N = 6055) showed that the use of CABG as compared with PCI resulted in a 27% reduction in mortality (relative risk [RR] = 0.73; 95% CI, 0.62-0.86) and a 42% reduction in MI (RR = 0.58; 0.48-0.72). Although there was a nonsignificant trend toward increased strokes in the CABG group (likely related to periprocedural events), this approach also led to fewer repeat revascularizations (number needed to treat [NNT] = 7), as well as fewer overall major adverse cardiac and cerebrovascular events (NNT = 10).
Dr. Kulkarni is an assistant professor of hospital medicine at Northwestern University in Chicago.
2014 Update on cervical disease
Advances in cervical cancer screening continue apace. We are fortunate that these advances are based on a substantial amount of high-quality prospective evidence. Many of these advances are designed to target the women who have clinically relevant disease while minimizing harm and anxiety caused by unnecessary procedures related to cervical screening test abnormalities that have little clinical relevance.
With clinicians being regularly judged on performance and outcomes, adoption of advances and new guidelines should be considered relatively quickly by women’s health providers.
In this article, I focus on two significant advances of the past (and coming) year:
- recent application and unanimous approval by a Food and Drug Administration (FDA) expert panel for the use of the cobas human papillomavirus (HPV) DNA test as a primary cervical cancer screen
- the latest update of guidelines on the management of abnormal cervical screening tests from the American Society for Colposcopy and Cervical Pathology (ASCCP).
cobas HPV TEST IS POISED FOR FDA APPROVAL AS A PRIMARY SCREEN FOR CERVICAL CANCER
Wright TC Jr, Stoler MH, Behrens CM, Apple R, Derion T, Wright TL. The ATHENA human papillomavirus study: design, methods, and baseline results. Am J Obstet Gynecol. 2012;206(1):46.e1–e11.
An FDA expert panel unanimously approved the cobas (Roche Molecular Diagnostics; Pleasanton, California) HPV DNA test on March 12, 2014. The FDA will decide on potential approval within the coming months. Although the FDA sometimes reaches a different decision from one of its advisory committees when it comes to a final vote on a product or device, most often the FDA concurs with the committee’s judgment. Therefore, approval of the cobas HPV test as a primary screen is likely.
Related article: FDA Advisory Committee recommends HPV test as primary screening tool for cervical cancer Deborah Reale (News for your Practice, March 2014)
The cobas HPV test yields a pooled result for 12 high-risk HPV types (hrHPV 31, 33, 35, 39, 45, 51, 52, 56, 58, 59, 66, and 68), as well as individual results for types 16 and 18; it also has an internal control for specimen adequacy. HPV 16 and 18 account for roughly 70% of all cases of cervical cancer, and infection with both types are known to place women at high risk for having clinically relevant disease—more so than the other hrHPV types.
COMMITTEE REVIEWED DATA FROM ATHENA IN VOTING FOR APPROVAL
In considering the cobas HPV test, the advisory committee reviewed data from the Addressing the Need for Advanced HPV Diagnostics (ATHENA) trial, a prospective, multicenter, US-based study of 47,208 women aged 21 and older. These women were recruited at the time of undergoing routine screening for cervical cancer; only 2.6% had been vaccinated against HPV. All were screened by liquid-based cytology and an HPV test. Those who had abnormal cytology or a positive test for a high-risk HPV type underwent colposcopy, as did a randomly selected group of women aged 25 or older who tested negative on both tests.
The prevalence of abnormal findings was:
- 7.1% for liquid-based cytology
- 12.6% for pooled high-risk HPV
- 2.8% for HPV 16
- 1.0% for HPV 18.
As expected, cytologic abnormalities and infection with high-risk HPV types declined with increasing age. The adjusted prevalence of cervical intraepithelial neoplasia (CIN) grade 2 or higher in women aged 25 to 34 years was 2.3%; it declined to 1.5% among women older than age 34. Of note, approximately 500,000 US women are given a diagnosis of CIN 2 or CIN 3 each year in the United States.
WHY ATHENA IS IMPORTANT
This US-based trial was designed to assess the medical utility of pooled high-risk HPV DNA in addition to genotyping for HPV 16 and 18 in three populations:
- women aged 21 and older with a cytologic finding of atypical squamous cells of undetermined significance (ASC-US)
- women aged 30 and older with normal cytology
- women aged 25 and older in the overall screening population with any cytologic finding.
Investigators were particularly interested in the use of the HPV test as:
- a triage for women with abnormal cytologic findings
- an adjunct to guide clinical management of women with negative cytology results
- a potential front-line test in the screening of women aged 25 and older.
Related article: Endometrial cancer update: The move toward personalized cancer care Lindsay M. Kuroki, MD, and David G. Mutch, MD (October 2013)
The participants of the ATHENA trial were representative of women undergoing screening for cervical cancer in the United States—both in terms of demographics and in the distribution of cytologic findings. For example, recent US census data indicate that the female population is 79% white, 13% black, and 16% Hispanic or Latino—figures comparable to the breakdown of race/ethnicity in the ATHENA trial.
The trial was conducted in a baseline phase (published in 2012) and a 3-year follow-up phase (not yet published). The 3-year data were reviewed by the FDA advisory committee during its consideration of the cobas HPV test as a primary screen.
DESPITE PROBABLE APPROVAL, INCREMENTAL CHANGE IS LIKELY
Although a move to the HPV test as the primary screen is a definite paradigm shift for what has been cytology-based screening since the initiation of cervical cancer screening, the changeover from primary cytology to primary HPV testing likely will be slow. It will require education of clinicians as well as patients, and a shift in many internal procedures for pathology laboratories.
The ATHENA trial also leaves some intriguing questions unanswered:
- How do we transition women into the new screening strategy? Many women today still undergo cytology screening with reflex HPV testing, as appropriate, and an increasing number of women aged 30 and older undergo cotesting with both cytology and HPV testing. When should they begin screening in a primary HPV testing setting? And what screening intervals will be recommended? If a woman already has been screened with cytology, how should she transition into and at what interval should she begin primary HPV screening?
- How should we manage women’s care after the first round of primary HPV testing? The ATHENA trial so far only has outcomes data after one round of HPV testing. While some data are available from Europe, we do not know what happens after two or three rounds of screening with primary HPV testing in a large US-based cohort. We clearly will be identifying and treating many women with preinvasive disease from screening after one round of testing, at a rate likely higher than with cytology alone—a good thing. We also likely will be reducing the number of unnecessary colposcopies for cytology that are not related to hrHPV.
What this EVIDENCE means for practice
Screening women using the cobas HPV test as a primary screen will require considerable education of providers and patients to explain how this change will affect how a woman will be managed after being screened for cervical cancer. Though much remains to be determined about this new cervical cancer screening paradigm (eg, logistics, timing, use of secondary tests), it should reduce the number of screening tests and colposcopies necessary to detect clinically relevant disease.
UPDATED ASCCP GUIDELINES EMPHASIZE EQUAL MANAGEMENT FOR EQUAL RISK
Massad LS, Einstein MH, Huh WK, et al; 2012 ASCCP Consensus Guidelines Conference. 2012 updated consensus guidelines for the management of abnormal cervical cancer screening tests and cancer precursors. J Low Genit Tract Dis. 2013;17(5 Suppl 1):S1–S27.
In formulating this latest set of guidelines for the management of abnormal cervical cancer screening tests and cancer precursors, the ASCCP led a conference consisting of scientific stakeholders to perform a comprehensive review of the literature. Also, with study investigators at Kaiser Permanente Northern California (KPNC) and the National Cancer Institute, the guidelines panel also modeled and assessed data on risk after abnormal tests from almost 1.4 million women followed over 8 years in the KPNC Medical Care Plan—this cohort has provided us with “big data.”
The sheer size of the Kaiser Permanente population made it possible for the ASCCP-led panel to validate its previous guidelines or to modify them, where needed. It also made risk-based stratification possible for even rare abnormalities and clinical outcomes.
Although findings from the KPNC population may not be fully generalizable to the US population as a whole, they enhance our understanding of the optimal management of abnormal cervical cancer screening tests and cancer precursors. More widely dispersed study cohorts on a similar scale in the United States are unlikely in the near future.
Related article: Update on cervical disease Mark H. Einstein, MD, MS, and J. Thomas Cox, MD (May 2013)
SEVERAL SIGNIFICANT MODIFICATIONS
Although the ASCCP reaffirmed most elements of its 2006 consensus management guidelines, it did make a number of changes:
- Women who have ASC-US cytology but test HPV-negative now should be followed with cotesting at 3 years rather than 5 years before they return to routine screening.
- Women near age 65 who have a negative finding on ASC-US cytology and HPV testing should not exit screening.
- Women who have ASC-US cytology and test HPV-positive should go to immediate colposcopy, regardless of hrHPV results, including genotyping.
- Women who test positive for HPV 16 or 18 but have negative cytology should undergo immediate colposcopy.
- Women aged 21 to 24 years should be managed as conservatively and minimally invasively as possible, especially when an abnormality is minor.
- Endocervical curettage reported as CIN 1 should be managed as CIN 1, not as a positive endocervical curettage.
- When a cytologic sample is unsatisfactory, sampling usually should be repeated, even when HPV cotesting results are known. However, negative cytology that lacks sufficient endocervical cells or a transformation zone component usually can be managed without frequent follow-up.
Related article: New cervical Ca screening guidelines recommend less frequent assessment Janelle Yates (News for your Practice; April 2012)
EQUAL MANAGEMENT SHOULD BE PERFORMED FOR ABNORMAL TESTS THAT INDICATE EQUAL RISK
The ASCCP-led management panel unanimously agreed to several basic assumptions in formulating the updated guidelines. For example, they concurred that achieving zero risk for cancer is impossible and that attempts to achieve zero risk (which typically means more frequent testing) may cause harm. They also cited the 2011 American Cancer Society/ASCCP/American Society for Clinical Pathology consensus screening document, which stated: “Optimal prevention strategies should identify those HPV-related abnormalities likely to progress to invasive cancers while avoiding destructive treatment of abnormalities not destined to become cancerous.”1
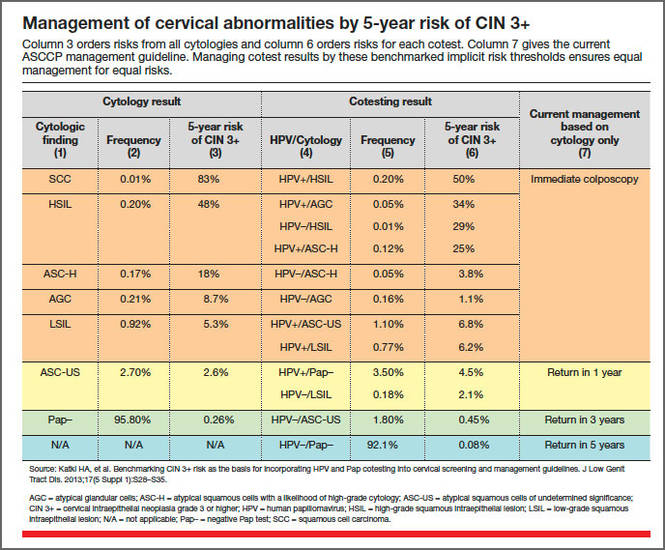
The panel also agreed that CIN 3+ is a “reasonable proxy for cancer risk.” When calculating risk, the KPNC data were modeled for all combinations of cytology and HPV testing, using CIN 3+ for many of the outcomes, and when outcomes were rare, using CIN 2+. The theme of equal management for equal risk was the rationale behind the management approaches detailed in the TABLE. Risks were deemed to be low and return to normal screening was recommended when the risks were similar to the rate of CIN 3+ 3 years after negative cytology or 5 years after negative cotesting. However, immediate colposcopy was recommended when the 5-year risk of CIN 3+ for the combination of cytology and hrHPV testing, when indicated, exceeded 5%. A 6-month to 12-month return (intermediate risk) is indicated with a risk of CIN3+ of 2% to 5%.
An emphasis on avoiding harms
Abnormal findings at the time of cervical cancer screening can lead to a number of harms for the patient, including anxiety and emotional distress, particularly when colposcopy is necessary, as well as time lost from home and work life. For this reason, the guidelines panel emphasized that colposcopy and other interventions should be avoided when the risk of CIN 3+ is low and when the cervical screening abnormalities are likely to resolve without treatment.
However, women who experience postcoital bleeding, unexplained abnormal vaginal bleeding, pelvic pain, abnormal discharge, or a visible lesion should be managed promptly on an individualized basis.
Long-term effects of HPV vaccination are unknown
Among the areas that remain to be addressed are the unknown effects of widespread prophylactic HPV vaccination over the long term. We also lack full understanding of whether and how HPV vaccination will alter the incidence and management of cytologic and histologic abnormalities. Given the low rates of vaccination against HPV in the United States at present, this will need to be re-evaluated in the future.
What this EVIDENCE means for practice
The updated ASCCP guidelines are inherently complex, but their complexity arises from a large body of high-quality prospective data from a large population of women. Equal risk should result in equal management of cervical screening test abnormalities. Practitioners need not feel obligated to memorize the guidelines, owing to the availability of algorithms for specific findings in specific populations at the ASCCP Web site (www.asccp.org/consensus2012). Apps also are available for the iPhone, iPad, and Android.
WE WANT TO HEAR FROM YOU!
Share your thoughts on this article or on any topic relevant to ObGyns and women’s health practitioners. Tell us which topics you’d like to see covered in future issues, and what challenges you face in daily practice. We will consider publishing your letter and in a future issue. Send your letter to: [email protected] Please include the city and state in which you practice. Stay in touch! Your feedback is important to us!
Reference
- Saslow D, Solomon D, Lawson HW, et al;ACS-ASCCP-ASCP Cervical Cancer Guideline Committee. American Cancer Society, American Society for Colposcopy and Cervical Pathology, and American Society for Clinical Pathology screening guidelines for the prevention and early detection of cervical cancer. CA Cancer J Clin. 2012;62(3):147–172.

Mark H. Einstein, MD, MS, is Professor of Obstetrics & Gynecology and Women’s Health and Professor of Epidemiology and Population Health at Albert Einstein College of Medicine and Montefiore Medical Center, Bronx, New York. He is also Vice Chair for Research in the Department of Obstetrics & Gynecology and Women’s Health.
Dr. Einstein reports that the hospital where he is employed, Montefiore Medical Center, has received research support from Roche, Hologic, and BD.
Advances in cervical cancer screening continue apace. We are fortunate that these advances are based on a substantial amount of high-quality prospective evidence. Many of these advances are designed to target the women who have clinically relevant disease while minimizing harm and anxiety caused by unnecessary procedures related to cervical screening test abnormalities that have little clinical relevance.
With clinicians being regularly judged on performance and outcomes, adoption of advances and new guidelines should be considered relatively quickly by women’s health providers.
In this article, I focus on two significant advances of the past (and coming) year:
- recent application and unanimous approval by a Food and Drug Administration (FDA) expert panel for the use of the cobas human papillomavirus (HPV) DNA test as a primary cervical cancer screen
- the latest update of guidelines on the management of abnormal cervical screening tests from the American Society for Colposcopy and Cervical Pathology (ASCCP).
cobas HPV TEST IS POISED FOR FDA APPROVAL AS A PRIMARY SCREEN FOR CERVICAL CANCER
Wright TC Jr, Stoler MH, Behrens CM, Apple R, Derion T, Wright TL. The ATHENA human papillomavirus study: design, methods, and baseline results. Am J Obstet Gynecol. 2012;206(1):46.e1–e11.
An FDA expert panel unanimously approved the cobas (Roche Molecular Diagnostics; Pleasanton, California) HPV DNA test on March 12, 2014. The FDA will decide on potential approval within the coming months. Although the FDA sometimes reaches a different decision from one of its advisory committees when it comes to a final vote on a product or device, most often the FDA concurs with the committee’s judgment. Therefore, approval of the cobas HPV test as a primary screen is likely.
Related article: FDA Advisory Committee recommends HPV test as primary screening tool for cervical cancer Deborah Reale (News for your Practice, March 2014)
The cobas HPV test yields a pooled result for 12 high-risk HPV types (hrHPV 31, 33, 35, 39, 45, 51, 52, 56, 58, 59, 66, and 68), as well as individual results for types 16 and 18; it also has an internal control for specimen adequacy. HPV 16 and 18 account for roughly 70% of all cases of cervical cancer, and infection with both types are known to place women at high risk for having clinically relevant disease—more so than the other hrHPV types.
COMMITTEE REVIEWED DATA FROM ATHENA IN VOTING FOR APPROVAL
In considering the cobas HPV test, the advisory committee reviewed data from the Addressing the Need for Advanced HPV Diagnostics (ATHENA) trial, a prospective, multicenter, US-based study of 47,208 women aged 21 and older. These women were recruited at the time of undergoing routine screening for cervical cancer; only 2.6% had been vaccinated against HPV. All were screened by liquid-based cytology and an HPV test. Those who had abnormal cytology or a positive test for a high-risk HPV type underwent colposcopy, as did a randomly selected group of women aged 25 or older who tested negative on both tests.
The prevalence of abnormal findings was:
- 7.1% for liquid-based cytology
- 12.6% for pooled high-risk HPV
- 2.8% for HPV 16
- 1.0% for HPV 18.
As expected, cytologic abnormalities and infection with high-risk HPV types declined with increasing age. The adjusted prevalence of cervical intraepithelial neoplasia (CIN) grade 2 or higher in women aged 25 to 34 years was 2.3%; it declined to 1.5% among women older than age 34. Of note, approximately 500,000 US women are given a diagnosis of CIN 2 or CIN 3 each year in the United States.
WHY ATHENA IS IMPORTANT
This US-based trial was designed to assess the medical utility of pooled high-risk HPV DNA in addition to genotyping for HPV 16 and 18 in three populations:
- women aged 21 and older with a cytologic finding of atypical squamous cells of undetermined significance (ASC-US)
- women aged 30 and older with normal cytology
- women aged 25 and older in the overall screening population with any cytologic finding.
Investigators were particularly interested in the use of the HPV test as:
- a triage for women with abnormal cytologic findings
- an adjunct to guide clinical management of women with negative cytology results
- a potential front-line test in the screening of women aged 25 and older.
Related article: Endometrial cancer update: The move toward personalized cancer care Lindsay M. Kuroki, MD, and David G. Mutch, MD (October 2013)
The participants of the ATHENA trial were representative of women undergoing screening for cervical cancer in the United States—both in terms of demographics and in the distribution of cytologic findings. For example, recent US census data indicate that the female population is 79% white, 13% black, and 16% Hispanic or Latino—figures comparable to the breakdown of race/ethnicity in the ATHENA trial.
The trial was conducted in a baseline phase (published in 2012) and a 3-year follow-up phase (not yet published). The 3-year data were reviewed by the FDA advisory committee during its consideration of the cobas HPV test as a primary screen.
DESPITE PROBABLE APPROVAL, INCREMENTAL CHANGE IS LIKELY
Although a move to the HPV test as the primary screen is a definite paradigm shift for what has been cytology-based screening since the initiation of cervical cancer screening, the changeover from primary cytology to primary HPV testing likely will be slow. It will require education of clinicians as well as patients, and a shift in many internal procedures for pathology laboratories.
The ATHENA trial also leaves some intriguing questions unanswered:
- How do we transition women into the new screening strategy? Many women today still undergo cytology screening with reflex HPV testing, as appropriate, and an increasing number of women aged 30 and older undergo cotesting with both cytology and HPV testing. When should they begin screening in a primary HPV testing setting? And what screening intervals will be recommended? If a woman already has been screened with cytology, how should she transition into and at what interval should she begin primary HPV screening?
- How should we manage women’s care after the first round of primary HPV testing? The ATHENA trial so far only has outcomes data after one round of HPV testing. While some data are available from Europe, we do not know what happens after two or three rounds of screening with primary HPV testing in a large US-based cohort. We clearly will be identifying and treating many women with preinvasive disease from screening after one round of testing, at a rate likely higher than with cytology alone—a good thing. We also likely will be reducing the number of unnecessary colposcopies for cytology that are not related to hrHPV.
What this EVIDENCE means for practice
Screening women using the cobas HPV test as a primary screen will require considerable education of providers and patients to explain how this change will affect how a woman will be managed after being screened for cervical cancer. Though much remains to be determined about this new cervical cancer screening paradigm (eg, logistics, timing, use of secondary tests), it should reduce the number of screening tests and colposcopies necessary to detect clinically relevant disease.
UPDATED ASCCP GUIDELINES EMPHASIZE EQUAL MANAGEMENT FOR EQUAL RISK
Massad LS, Einstein MH, Huh WK, et al; 2012 ASCCP Consensus Guidelines Conference. 2012 updated consensus guidelines for the management of abnormal cervical cancer screening tests and cancer precursors. J Low Genit Tract Dis. 2013;17(5 Suppl 1):S1–S27.
In formulating this latest set of guidelines for the management of abnormal cervical cancer screening tests and cancer precursors, the ASCCP led a conference consisting of scientific stakeholders to perform a comprehensive review of the literature. Also, with study investigators at Kaiser Permanente Northern California (KPNC) and the National Cancer Institute, the guidelines panel also modeled and assessed data on risk after abnormal tests from almost 1.4 million women followed over 8 years in the KPNC Medical Care Plan—this cohort has provided us with “big data.”
The sheer size of the Kaiser Permanente population made it possible for the ASCCP-led panel to validate its previous guidelines or to modify them, where needed. It also made risk-based stratification possible for even rare abnormalities and clinical outcomes.
Although findings from the KPNC population may not be fully generalizable to the US population as a whole, they enhance our understanding of the optimal management of abnormal cervical cancer screening tests and cancer precursors. More widely dispersed study cohorts on a similar scale in the United States are unlikely in the near future.
Related article: Update on cervical disease Mark H. Einstein, MD, MS, and J. Thomas Cox, MD (May 2013)
SEVERAL SIGNIFICANT MODIFICATIONS
Although the ASCCP reaffirmed most elements of its 2006 consensus management guidelines, it did make a number of changes:
- Women who have ASC-US cytology but test HPV-negative now should be followed with cotesting at 3 years rather than 5 years before they return to routine screening.
- Women near age 65 who have a negative finding on ASC-US cytology and HPV testing should not exit screening.
- Women who have ASC-US cytology and test HPV-positive should go to immediate colposcopy, regardless of hrHPV results, including genotyping.
- Women who test positive for HPV 16 or 18 but have negative cytology should undergo immediate colposcopy.
- Women aged 21 to 24 years should be managed as conservatively and minimally invasively as possible, especially when an abnormality is minor.
- Endocervical curettage reported as CIN 1 should be managed as CIN 1, not as a positive endocervical curettage.
- When a cytologic sample is unsatisfactory, sampling usually should be repeated, even when HPV cotesting results are known. However, negative cytology that lacks sufficient endocervical cells or a transformation zone component usually can be managed without frequent follow-up.
Related article: New cervical Ca screening guidelines recommend less frequent assessment Janelle Yates (News for your Practice; April 2012)
EQUAL MANAGEMENT SHOULD BE PERFORMED FOR ABNORMAL TESTS THAT INDICATE EQUAL RISK
The ASCCP-led management panel unanimously agreed to several basic assumptions in formulating the updated guidelines. For example, they concurred that achieving zero risk for cancer is impossible and that attempts to achieve zero risk (which typically means more frequent testing) may cause harm. They also cited the 2011 American Cancer Society/ASCCP/American Society for Clinical Pathology consensus screening document, which stated: “Optimal prevention strategies should identify those HPV-related abnormalities likely to progress to invasive cancers while avoiding destructive treatment of abnormalities not destined to become cancerous.”1
The panel also agreed that CIN 3+ is a “reasonable proxy for cancer risk.” When calculating risk, the KPNC data were modeled for all combinations of cytology and HPV testing, using CIN 3+ for many of the outcomes, and when outcomes were rare, using CIN 2+. The theme of equal management for equal risk was the rationale behind the management approaches detailed in the TABLE. Risks were deemed to be low and return to normal screening was recommended when the risks were similar to the rate of CIN 3+ 3 years after negative cytology or 5 years after negative cotesting. However, immediate colposcopy was recommended when the 5-year risk of CIN 3+ for the combination of cytology and hrHPV testing, when indicated, exceeded 5%. A 6-month to 12-month return (intermediate risk) is indicated with a risk of CIN3+ of 2% to 5%.
An emphasis on avoiding harms
Abnormal findings at the time of cervical cancer screening can lead to a number of harms for the patient, including anxiety and emotional distress, particularly when colposcopy is necessary, as well as time lost from home and work life. For this reason, the guidelines panel emphasized that colposcopy and other interventions should be avoided when the risk of CIN 3+ is low and when the cervical screening abnormalities are likely to resolve without treatment.
However, women who experience postcoital bleeding, unexplained abnormal vaginal bleeding, pelvic pain, abnormal discharge, or a visible lesion should be managed promptly on an individualized basis.
Long-term effects of HPV vaccination are unknown
Among the areas that remain to be addressed are the unknown effects of widespread prophylactic HPV vaccination over the long term. We also lack full understanding of whether and how HPV vaccination will alter the incidence and management of cytologic and histologic abnormalities. Given the low rates of vaccination against HPV in the United States at present, this will need to be re-evaluated in the future.
What this EVIDENCE means for practice
The updated ASCCP guidelines are inherently complex, but their complexity arises from a large body of high-quality prospective data from a large population of women. Equal risk should result in equal management of cervical screening test abnormalities. Practitioners need not feel obligated to memorize the guidelines, owing to the availability of algorithms for specific findings in specific populations at the ASCCP Web site (www.asccp.org/consensus2012). Apps also are available for the iPhone, iPad, and Android.
WE WANT TO HEAR FROM YOU!
Share your thoughts on this article or on any topic relevant to ObGyns and women’s health practitioners. Tell us which topics you’d like to see covered in future issues, and what challenges you face in daily practice. We will consider publishing your letter and in a future issue. Send your letter to: [email protected] Please include the city and state in which you practice. Stay in touch! Your feedback is important to us!
Reference
- Saslow D, Solomon D, Lawson HW, et al;ACS-ASCCP-ASCP Cervical Cancer Guideline Committee. American Cancer Society, American Society for Colposcopy and Cervical Pathology, and American Society for Clinical Pathology screening guidelines for the prevention and early detection of cervical cancer. CA Cancer J Clin. 2012;62(3):147–172.
Dr. Mark Einstein anticipated final FDA approval of the first HPV test for primary cervical cancer screening and, in this UPDATE ON CERVICAL DISEASE, expands on the data behind the approval and how your practice could change

VIDEO: Laser's novel effect improves restrictive burn scars
PHOENIX – New techniques using very-low-density, very-high-energy ablative fractional carbon dioxide laser are helping thousands of patients – mostly soldiers – with restrictive scars from bombs or burns.
It’s a treatment to which the far larger number of civilian burn patients should have access, but few do, explained Dr. Nathan S. Uebelhoer, who received an award and a standing ovation at the annual meeting of the American Society for Laser Medicine and Surgery for his work in this area.
In an interview, Dr. Uebelhoer of Aroostook Medical Center, Presque Isle, Maine, describes the techniques used to achieve such promising results with restrictive scars, and he discusses what might be necessary to make the treatment more widely available.
The video associated with this article is no longer available on this site. Please view all of our videos on the MDedge YouTube channel
On Twitter @sherryboschert
AT LASER 2014

Potential for flawed research prompts new guidelines

Credit: Rhoda Baer
Worried about the potential for false conclusions in genomics research, a group of scientists created guidelines for distinguishing disease-causing sequence variants from potentially functional variants in the human genome.
In addition to helping researchers confirm variant-disease causality, the guidelines provide recommendations pertaining to genomic study design, databases, and disease diagnosis.
The guidelines are published in Nature.
They were born out of discussions at a 2012 workshop sponsored by the National Human Genome Research Institute.
“Several of us had noticed that studies were coming out with wrong conclusions about the relationship between a specific sequence and disease, and we were extremely concerned that this would translate into inappropriate clinical decisions,” said guideline author Chris Gunter, PhD, of Marcus Autism Center in Atlanta.
In other words, the authors were worried that, based on flawed results, physicians might order additional testing or treatments that are not truly supported by a link between a genetic variant and disease.
As an example, Dr Gunter and her colleagues cited autism research. Investigators found 4 independent variations in the gene TTN when they compared genomes between individuals with and without autism.
However, the TTN gene encodes titin, the largest known protein. So variations are simply more likely in TTN than in other genes. Without applying the proper statistical corrections, researchers may have falsely concluded that TTN was worthy of further investigation in autism studies.
But Dr Gunter believes the new guidelines could help prevent such false conclusions and, therefore, inappropriate medical decisions.
She and her colleagues proposed that researchers do 2 things before concluding that a genetic variation causes a disease. First, they should perform detailed statistical analyses. Then, they should assess evidence from all sources supporting a role for the variant in that specific disease or condition.
The authors said many DNA variants “may suggest a potentially convincing story about how the variant may influence the trait,” but few will actually have causal effects. So using evidence-based guidelines is crucial.
The authors’ guidelines also highlight priorities for research and infrastructure development, including added incentives for researchers to share genetic and clinical data.
“We believe that these guidelines will be particularly useful to scientists and clinicians in other areas who want to do human genomic studies and need a defined starting point for investigating genetic effects,” Dr Gunter said. ![]()
Bortezomib available for newly diagnosed MM patients

Credit: CDC
Patients with newly diagnosed multiple myeloma (MM) will now be guaranteed access to bortezomib (Velcade) through the National Health Service (NHS), according to the UK’s National Institute for Health and Care Excellence (NICE).
NICE has issued a guidance recommending bortezomib (given with dexamethasone or dexamethasone and thalidomide) as induction treatment for adults with newly diagnosed MM who are eligible for high-dose chemotherapy and stem cell transplant.
Bortezomib should be available on the NHS within 3 months.
The current standard induction therapy for MM patients in the UK is the combination of cyclophosphamide, thalidomide, and dexamethasone.
“We are pleased to recommend bortezomib as a first treatment for people with multiple myeloma before bone marrow transplant,” said Carole Longson, director of the NICE center for health technology evaluation.
“The evidence presented to our independent committee showed that having bortezomib at this stage will help more patients go on to a bone marrow transplant and, consequently, prevent the disease from progressing for longer.”
The committee concluded that, although there was uncertainty in the magnitude of overall survival gain associated with bortezomib, it was plausible that bortezomib’s impact on induction response could be associated with improved overall survival.
The cost of bortezomib is £762.38 per 3.5-mg vial. The average cost of a course of bortezomib given with dexamethasone is estimated to be £12,260.91. And the average cost of a course of bortezomib given with dexamethasone and thalidomide is estimated to be £24,840.10.
The cost of bortezomib, thalidomide, and dexamethasone compared with thalidomide and dexamethasone was likely to be below £30,000 per quality-adjusted life-year gained.
The same was true for bortezomib and dexamethasone compared with cyclophosphamide, thalidomide, and dexamethasone or with vincristine, doxorubicin, and dexamethasone. Therefore, bortezomib was considered an acceptable use of NHS resources.
NICE already recommends bortezomib monotherapy to treat progressive MM in patients at first relapse who have undergone, or are unsuitable for, stem cell transplant. ![]()
Study shows how age can affect WBCs, HSCs

in the bone marrow
Whole-genome sequencing has revealed hundreds of somatic mutations in healthy white blood cells (WBCs) from a 115-year-old woman, but the mutations appear to be harmless.
The research also suggests that most of the woman’s peripheral WBCs originated from 2 related hematopoietic stem cell (HSC) clones.
And the WBCs had telomeres that were significantly shorter than telomeres from other tissues.
Study investigators said these findings indicate that the finite lifespan of HSCs, rather than the effects of somatic mutations, may lead to hematopoietic clonal evolution at “extreme ages.”
Henne Holstege, PhD, of VU University Medical Center in Amsterdam, The Netherlands, and her colleagues detailed these findings in Genome Research.
The team conducted this study to determine if, over a long lifetime, mutations can accumulate in healthy WBCs. The WBCs were donated by a supercentenarian woman, who, at the time of her death in 2005, was the oldest person in the world.
The investigators performed deep whole-genome sequencing of the woman’s WBCs. And, based on the results, they estimated that about 450 somatic mutations accumulated in the non-repetitive genome within the healthy blood compartment, which suggests that about 600 somatic mutations accumulated in the whole genome of the HSC clone.
The mutations were not tumor-derived, and only a few were detected at minimal frequencies in other tissues. The team did not detect these mutations in the brain, which rarely undergoes cell division after birth.
In addition, the mutations appeared to be tolerated by the body. And they resided primarily in non-coding regions of the genome not previously associated with disease. This included sites that are especially mutation-prone, such as methylated cytosine DNA bases and solvent-accessible stretches of DNA.
Another key finding of this research was that about 65% of the healthy blood compartment was populated by the offspring of 2 HSC clones, and 1 of these was likely derived from the other.
The investigators said a possible explanation for this oligoclonality might be found in the extremely short telomere lengths of the woman’s WBCs. The WBC telomeres were 17 times shorter than telomeres in the brain.
“Because these blood cells had extremely short telomeres, we speculate that most hematopoietic stem cells may have died from stem cell exhaustion, reaching the upper limit of stem cell divisions,” Dr Holstege said.
So the team believes the oligoclonality they observed may be a consequence of HSCs’ finite lifespan. ![]()
FDA approves first drug for multicentric Castleman’s disease

Credit: Janssen Biotech, Inc.
The US Food and Drug Administration (FDA) has authorized marketing of siltuximab (Sylvant), the first drug approved to treat patients with multicentric Castleman’s disease (MCD) who are negative for human immunodeficiency virus (HIV) and human herpes virus 8 (HHV-8).
Siltuximab is a chimeric monoclonal antibody that binds to interleukin-6 (IL-6). Dysregulated overproduction of IL-6 has been implicated in the pathogenesis of MCD.
Siltuximab has not been studied in MCD patients who are HIV- or HHV-8 positive because the drug did not bind to virally produced IL-6 in a nonclinical study.
MCD is a rare blood disorder in which lymphocytes are overproduced, leading to enlarged lymph nodes. MCD can also affect lymphoid tissue of internal organs, causing enlargement of the liver, spleen, or other organs.
Patients with MCD have a high risk of death. Infections, multisystem organ failure, and malignancies such as lymphoma are common causes of death in patients with MCD.
“There has been a serious need for treatment options for patients with MCD,” said Frits van Rhee, MD, PhD, a professor at the University of Arkansas for Medical Sciences and lead investigator of the MCD2001 study.
“MCD is a complex disease, and, up until this point, physicians have tried to reduce lymph node masses and put the disease in remission through a combination of treatments, but MCD often returns. [The approval of siltuximab] gives physicians a long-awaited treatment option for [patients] suffering with this chronic, serious, and debilitating disease.”
The FDA reviewed siltuximab under its priority review program, which provides an expedited review for drugs that demonstrate the potential to be a significant improvement in safety or effectiveness in the treatment of a serious condition. The drug was also granted orphan designation, as it is intended to treat a rare disease.
MCD2001: A phase 2 study of siltuximab
The FDA approval of siltuximab is based on results of the phase 2 MCD2001 trial. This randomized, double-blind, placebo-controlled study enrolled 79 patients with symptomatic MCD that was HIV- and HHV-8 negative.
Fifty-three patients were randomized to receive siltuximab at a dose of 11 mg/kg, plus best supportive care. The remaining 26 patients were randomized to receive placebo plus best supportive care.
The researchers defined a durable response as a tumor and symptomatic response that persisted for a minimum of 18 weeks without treatment failure. Thirty-four percent of patients in the siltuximab arm achieved this endpoint, but none of the patients in the placebo arm did (P=0.0012).
On the other hand, 4% of patients in the placebo arm experienced a tumor response, as did 38% of patients in the siltuximab arm (P<0.05).
The median time to treatment failure was not reached for patients in the siltuximab arm. But patients in the placebo arm experienced treatment failure at a median of 134 days (P<0.05).
The most frequent adverse events in siltuximab-treated patients (greater than 10% compared to placebo) were rash (28%), pruritus (28%), upper respiratory tract infection (26%), weight gain (19%), and hyperuricemia (11%).
Results of this study were presented at the 2013 ASH Annual Meeting and published in Blood. The study was sponsored by Janssen Research & Development, the company developing siltuximab.
Access to siltuximab
Siltuximab is marketed as Sylvant by Janssen Biotech Inc., which is based in Horsham, Pennsylvania. To promote access to the drug, Janssen has created the SylvantOne™ Support program.
The program offers services for providers and patients that can help assess insurance coverage and identify cost support options, such as the SylvantOne™ Patient Rebate Program for eligible commercial patients, as well as a potential option for those who are uninsured.
Patients and providers can contact SylvantOne™ Support by calling 1-855-299-8844.
Siltuximab is available in a 100-mg, single-use vial of lyophilized powder and a 400-mg, single-use vial of lyophilized powder. The recommended dose of siltuximab is 11 mg/kg given over 1 hour, via intravenous infusion, every 3 weeks.
For more information on siltuximab, see the full prescribing information. ![]()
Cutaneous erythema predicted low-dose alemtuzumab response in leukemic cutaneous T-cell lymphoma
In patients with leukemic cutaneous T-cell lymphoma, diffuse cutaneous erythema without plaques or tumors predicted complete remission with low-dose alemtuzumab therapy, investigators reported online April 23 in a JAMA Dermatology research letter.
"Initial clinical presentation was more predictive of response than was complex cellular phenotyping of T cells from blood and skin," wrote Dr. Rei Watanabe at Brigham and Women’s Hospital in Boston and associates. "In other words, the eyes of a well-trained dermatologist were more powerful than a comprehensive translational research program in identifying complete responders to LDA [low-dose alemtuzumab] therapy."
The researchers treated 23 patients with leukemic cutaneous T-cell lymphoma with 10 mg subcutaneous LDA three times weekly. Seventeen patients presented with diffuse erythema without superimposed plaques or tumors, of whom 13 experienced complete remission after LDA treatment and 4 had residual or emergent disease that could be controlled with skin-directed therapy (JAMA Dermatol. 2014 [doi:10.1001/jamadermatol.2013.10099]).
However, none of the six patients who presented with discrete patches, plaques, or tumors experienced full remission with LDA, the researchers reported. One patient later remitted with electron beam therapy, while five had their disease recur or progress, including two who developed large cell transformation.
Patients also were more likely to respond to LDA if more than 80% of their malignant T cells had TCM markers (CCR7+/L-selectin+), but clinical presentation better predicted response, the investigators reported.
"On a scientific level, diffuse erythema is likely caused by migrating T cells, and only T cells that migrate into blood are cleared by LDA," noted Dr. Watanabe and her associates. "Fixed skin lesions are more likely to be caused by TRM [nonmigratory skin resident memory T cells], cells that escape LDA clearance by remaining long-term in skin."
Based on the findings, the investigators recommended using LDA with or without adjuvant skin-directed treatments in patients who present with diffuse cutaneous erythema. But "we caution against its use in patients with preexisting plaques and/or tumors," the researchers said.
The Leukemia & Lymphoma Society, the National Institutes of Health, the Damon Runyon Cancer Research Foundation, and a private contribution from Edward P. Lawrence, Esq., funded the study. Coauthor Dr. Clark reported receiving honoraria from Novartis and Stiefel Laboratories. The authors disclosed no other conflicts of interest.
FROM JAMA DERMATOLOGY
Major finding: Of 17 patients who presented with diffuse cutaneous erythema without superimposed plaques or tumors, 13 fully remitted on low-dose alemtuzumab LDA and 4 had disease that was controllable with skin-directed therapy. None of the six patients who presented with discrete patches, plaques, or tumors experienced full remission with LDA.
Data source: A study of 23 patients with leukemic cutaneous T-cell lymphoma.
Disclosures: The Leukemia & Lymphoma Society, the National Institutes of Health, the Damon Runyon Cancer Research Foundation, and a private contribution from Edward P. Lawrence, Esq., funded the study. Coauthor Dr. Clark reported receiving honoraria from Novartis and Stiefel Laboratories. The authors disclosed no other conflicts of interest.
Marriage protects against vascular disease
WASHINGTON - Being married is independently associated with a significantly reduced rate of vascular disease across all arterial beds, according to a population-based study of more than 3.5 million subjects, Dr. Carlos L. Alviar reported at the annual meeting of the American College of Cardiology.
This apparent protective effect was strongest in younger individuals. In a multivariate regression analysis adjusted for demographics and cardiovascular risk factors, married subjects under age 50 years were 12% less likely to have prevalent vascular disease than were those who were single. The risk advantage shrank with advancing age such that married participants above age 70 years had a 4% lower risk of vascular disease than did those who were single, a difference that was statistically significant because of the huge size of the study population. And those who were single were at lower risk than were widowed or divorced subjects.
He presented an analysis of slightly more than 3.5 million participants in the Life Line Screening Diabetes Mellitus and Vascular Disease survey conducted during 2003-2008. Unlike most other studies of the relationship between marital status and health, which have focused on the risk of coronary disease, this study also included screening for peripheral artery disease, abdominal aortic aneurysm, and cerebrovascular disease.
Among participants of all ages, the risk of prevalent vascular disease was 5% less in those who were married than in those who were single. The risk was 3.2% greater in subjects who were divorced than in those who were single, and 5.1% greater in subjects who were widowed, according to Dr. Alviar of New York University.
The mean age of the study population was 63.7 years. Among women, 63.4% were married, 8.1% were single, 10.5% divorced, and 18% widowed. The male demographics were somewhat different: 80.4% of the men were married, 8.8% single, 6.1% divorced, and 4.7% were widowed.
Being widowed was associated with a higher prevalence of diabetes, hypertension, physical inactivity, and dyslipidemia, although investigators adjusted for that in their multivariate analysis. Divorced subjects were more likely to be smokers and have a family history of premature cardiovascular disease.
Dr. Alviar proposed as potential explanations for the reduced prevalence of vascular disease among married individuals their possibly lower levels of psychologic and physical stress, better access to medical care, and improved adherence to medication.
He reported having no financial disclosures regarding this study.
My group runs a course every October where we help vascular fellows learn how to run a successful practice, be it academic or community oriented. One of the most popular lectures is by a renowned lawyer. His take home message is "You will retire rich if you don’t buy a big house, don’t buy a fancy car and don’t get divorced." After reading this news item we can now add one other reason to follow his advice.
Dr. Russell Samson, Medical Editor, Vascular Specialist.
WASHINGTON - Being married is independently associated with a significantly reduced rate of vascular disease across all arterial beds, according to a population-based study of more than 3.5 million subjects, Dr. Carlos L. Alviar reported at the annual meeting of the American College of Cardiology.
This apparent protective effect was strongest in younger individuals. In a multivariate regression analysis adjusted for demographics and cardiovascular risk factors, married subjects under age 50 years were 12% less likely to have prevalent vascular disease than were those who were single. The risk advantage shrank with advancing age such that married participants above age 70 years had a 4% lower risk of vascular disease than did those who were single, a difference that was statistically significant because of the huge size of the study population. And those who were single were at lower risk than were widowed or divorced subjects.
He presented an analysis of slightly more than 3.5 million participants in the Life Line Screening Diabetes Mellitus and Vascular Disease survey conducted during 2003-2008. Unlike most other studies of the relationship between marital status and health, which have focused on the risk of coronary disease, this study also included screening for peripheral artery disease, abdominal aortic aneurysm, and cerebrovascular disease.
Among participants of all ages, the risk of prevalent vascular disease was 5% less in those who were married than in those who were single. The risk was 3.2% greater in subjects who were divorced than in those who were single, and 5.1% greater in subjects who were widowed, according to Dr. Alviar of New York University.
The mean age of the study population was 63.7 years. Among women, 63.4% were married, 8.1% were single, 10.5% divorced, and 18% widowed. The male demographics were somewhat different: 80.4% of the men were married, 8.8% single, 6.1% divorced, and 4.7% were widowed.
Being widowed was associated with a higher prevalence of diabetes, hypertension, physical inactivity, and dyslipidemia, although investigators adjusted for that in their multivariate analysis. Divorced subjects were more likely to be smokers and have a family history of premature cardiovascular disease.
Dr. Alviar proposed as potential explanations for the reduced prevalence of vascular disease among married individuals their possibly lower levels of psychologic and physical stress, better access to medical care, and improved adherence to medication.
He reported having no financial disclosures regarding this study.
Major finding: Married men under age 50 years were 14.4% less likely than their single counterparts were to have vascular disease, and married women were 10.7% less likely. This advantage remained significant, albeit attenuated, in older married individuals.
Data source: This was an analysis of 3,532,189 adult participants in the Life Line Screening Diabetes Mellitus and Vascular Disease survey.
Disclosures: The study presenter reported having no financial conflicts of interest.
Mediterranean diet may also prevent peripheral artery disease
Two variations of the Mediterranean diet were associated with a lower risk of peripheral artery disease, compared with a control diet, in a secondary analysis of the PREDIMED randomized clinical trial, as reported in a Research Letter to the editor in JAMA.
Among older adults at high cardiovascular risk, following a Mediterranean diet supplemented by extra virgin olive oil (EVOO) for a median of five years was associated with a reduced risk of PAD (hazard ratio, 0.34), compared with the control diet. Similarly, following a Mediterranean diet supplemented with extra nuts was associated with a reduced risk of PAD (HR, 0.50), said Miguel Ruiz-Canela, Ph.D., of the department of preventive medicine and public health, University of Navarra, Pamplona (Spain), and his associates in the PREDIMED (Prevencion con Dieta Mediterranea) trial.

The number needed to treat to prevent one case of PAD was 336 for the Mediterranean diet plus EVOO and 448 for the Mediterranean diet plus extra nuts, they said (JAMA 2014;311:415-7).
The PREDIMED investigators enrolled men aged 55-80 years and women aged 60-80 years without clinical PAD or baseline cardiovascular disease but with type 2 diabetes mellitus or at least three cardiovascular risk factors. Those patients were randomly assigned to follow a Mediterranean diet supplemented with EVOO (1,154 patients), a Mediterranean diet supplemented with mixed walnuts, almonds, and hazelnuts (1,240 patients), or a diet advising reduced intake of all types of fat (1,147 control patients).
PREDIMED’s primary endpoint was a composite of myocardial infarction, stroke, and death from cardiovascular causes. The hazard ratios were 0.70 and 0.72 for the Mediterranean diet with EVOO and the Mediterranean diet with nuts, respectively, compared with controls (N. Engl. J. Med. 2013;368:1279-90).
The investigators cautioned that this must be considered an exploratory analysis, because PAD wasn’t a prespecified endpoint of PREDIMED. “Replication by another randomized controlled trial with PAD as a prespecified end point is needed before causal conclusions can be drawn,” they noted.
“We cannot ascertain whether the observed association is due to a reduced incidence of asymptomatic PAD (true primary prevention) or to a reduced conversion from this early stage of PAD to symptomatic and clinically meaningful PAD,” they added.
This study was supported by numerous government and university sources in Spain. Supplemental foods used in the study were donated by Patrimonio Comunal Olivarero and Hojiblanca, the California Walnut Commission, Borges S. A., and LaMorella Nuts. Dr. Ruiz-Canela reported no financial conflicts of interest; one of his associates reported receiving funding from and serving as a consultant to the International Nut Council.
Two variations of the Mediterranean diet were associated with a lower risk of peripheral artery disease, compared with a control diet, in a secondary analysis of the PREDIMED randomized clinical trial, as reported in a Research Letter to the editor in JAMA.
Among older adults at high cardiovascular risk, following a Mediterranean diet supplemented by extra virgin olive oil (EVOO) for a median of five years was associated with a reduced risk of PAD (hazard ratio, 0.34), compared with the control diet. Similarly, following a Mediterranean diet supplemented with extra nuts was associated with a reduced risk of PAD (HR, 0.50), said Miguel Ruiz-Canela, Ph.D., of the department of preventive medicine and public health, University of Navarra, Pamplona (Spain), and his associates in the PREDIMED (Prevencion con Dieta Mediterranea) trial.
The number needed to treat to prevent one case of PAD was 336 for the Mediterranean diet plus EVOO and 448 for the Mediterranean diet plus extra nuts, they said (JAMA 2014;311:415-7).
The PREDIMED investigators enrolled men aged 55-80 years and women aged 60-80 years without clinical PAD or baseline cardiovascular disease but with type 2 diabetes mellitus or at least three cardiovascular risk factors. Those patients were randomly assigned to follow a Mediterranean diet supplemented with EVOO (1,154 patients), a Mediterranean diet supplemented with mixed walnuts, almonds, and hazelnuts (1,240 patients), or a diet advising reduced intake of all types of fat (1,147 control patients).
PREDIMED’s primary endpoint was a composite of myocardial infarction, stroke, and death from cardiovascular causes. The hazard ratios were 0.70 and 0.72 for the Mediterranean diet with EVOO and the Mediterranean diet with nuts, respectively, compared with controls (N. Engl. J. Med. 2013;368:1279-90).
The investigators cautioned that this must be considered an exploratory analysis, because PAD wasn’t a prespecified endpoint of PREDIMED. “Replication by another randomized controlled trial with PAD as a prespecified end point is needed before causal conclusions can be drawn,” they noted.
“We cannot ascertain whether the observed association is due to a reduced incidence of asymptomatic PAD (true primary prevention) or to a reduced conversion from this early stage of PAD to symptomatic and clinically meaningful PAD,” they added.
This study was supported by numerous government and university sources in Spain. Supplemental foods used in the study were donated by Patrimonio Comunal Olivarero and Hojiblanca, the California Walnut Commission, Borges S. A., and LaMorella Nuts. Dr. Ruiz-Canela reported no financial conflicts of interest; one of his associates reported receiving funding from and serving as a consultant to the International Nut Council.
FROM JAMA