User login
VIDEO: Generational dermatology teaches patients to think long term
CHAMPIONSGATE, FLA. – "Aging doesn’t happen overnight," according to Dr. Wendy Roberts, medical director of Desert Dermatology in Rancho Mirage, Calif.
In a video interview at the Orlando Dermatology Aesthetic and Clinical Conference, Dr. Roberts explained the concept of "generational dermatology" and how dermatologists are uniquely qualified to educate patients about taking a long-term, preventative approach to skin care.
The video associated with this article is no longer available on this site. Please view all of our videos on the MDedge YouTube channel
EXPERT ANALYSIS FROM THE ODAC CONFERENCE
VIDEO: Try ‘restaurant menu’ approach to laser treatment of scars
CHAMPIONSGATE, FLA. – Patients seeking treatment for scars can benefit from a "restaurant menu" approach that involves using a series of techniques in a single visit, according to Dr. Jill Waibel, medical director of the Miami Dermatology and Laser Institute. At the Orlando Dermatology Aesthetic and Clinical Conference, Dr. Waibel spoke to us about one of her favorite strategies for scar treatment: a multiprocedure, multilaser protocol in a single visit that includes an "appetizer," such as a pulsed dye laser; followed by the "main course" of scar treatment, a fractional ablative device; and then "dessert" of adjunctive and topical therapies.
CHAMPIONSGATE, FLA. – Patients seeking treatment for scars can benefit from a "restaurant menu" approach that involves using a series of techniques in a single visit, according to Dr. Jill Waibel, medical director of the Miami Dermatology and Laser Institute. At the Orlando Dermatology Aesthetic and Clinical Conference, Dr. Waibel spoke to us about one of her favorite strategies for scar treatment: a multiprocedure, multilaser protocol in a single visit that includes an "appetizer," such as a pulsed dye laser; followed by the "main course" of scar treatment, a fractional ablative device; and then "dessert" of adjunctive and topical therapies.
CHAMPIONSGATE, FLA. – Patients seeking treatment for scars can benefit from a "restaurant menu" approach that involves using a series of techniques in a single visit, according to Dr. Jill Waibel, medical director of the Miami Dermatology and Laser Institute. At the Orlando Dermatology Aesthetic and Clinical Conference, Dr. Waibel spoke to us about one of her favorite strategies for scar treatment: a multiprocedure, multilaser protocol in a single visit that includes an "appetizer," such as a pulsed dye laser; followed by the "main course" of scar treatment, a fractional ablative device; and then "dessert" of adjunctive and topical therapies.
EXPERT ANALYSIS FROM THE ODAC CONFERENCE
Cell adherence linked to treatment resistance in CML
Credit: UC San Diego
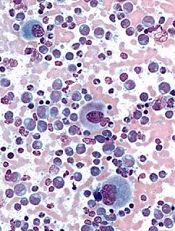
Preclinical research in chronic myeloid leukemia (CML) has pointed to a relationship between cell adherence and treatment resistance.
Investigators found that a population of plastic-adherent K562 cells with increased expression of BCR-ABL exhibited greater resistance to the tyrosine kinase inhibitor imatinib than nonadherent K562 cells.
“Previous studies have linked high levels of the BCR-ABL mutation with drug resistance,” said Richard Byers, PhD, of The University of Manchester in the UK.
“We wanted to see how expression of BCR-ABL differed across groups of CML cells and, in particular, whether there were differences between adherent and nonadherent populations.”
Dr Byers and his colleagues described this investigation in Experimental Hematology.
The researchers evaluated the heterogeneity of BCR-ABL expression at DNA, messenger RNA, and protein levels, using the CML-derived K562 cell line.
They grew cells in suspension and found that some cells adhered to the plastic dish. The investigators then separated the plastic-adherent and nonadherent cell populations and studied them as single cells and in bulk.
The first discovery was that adherent and nonadherent cells had similar BCR-ABL fusion gene copy numbers.
In bulk-cell analysis, the mean relative normalized ratio for genomic ABL DNA copy number was 47.73 for adherent cells and 53.40 for nonadherent cells (P=0.11). In single-cell analysis, the mean copy numbers were 13.83 and 14.22, respectively (P=0.63).
On the other hand, there was a significant difference in BCR-ABL messenger RNA expression between adherent and nonadherent cells.
In bulk cells, the level of BCR-ABL messenger RNA transcripts was 11-fold higher in adherent cells than in nondherent cells (P=0.022). And single-cell analysis revealed the mean BCR-ABL copy number was 53.11 for adherent cells and 14.06 for nonadherent cells (P=0.0013).
Adherent cells also exhibited significantly upregulated phosphorylation of BCR protein compared to nonadherent cells.
Flow cytometry showed that a mean of 61.9% of adherent cells were positive for phosphor-BCR, compared to 14.5% of nonadherent cells (P=0.0074). And single-cell analysis revealed a mean signal number per cell of 8.23 among adherent cells and 3.02 among nonadherent cells (P<0.0001).
In addition, whole-genome microRNA profiling showed that adherent and nonadherent cell populations expressed significantly different microRNA species.
Finally, the researchers found that treatment with imatinib reduced cell viability more rapidly in nonadherent cells than in adherent cells (P<0.005). The adherent cells showed a decrease in cell viability at 24 hours, compared to 4 hours for nonadherent cells.
The investigators said this research suggests that CML patients may have a similar adherent cell population that mediates resistance to imatinib. And the study highlights the importance of single-cell analysis.
“The small number of cells that show high levels of BCR-ABL may not be detectable through bulk analysis of large samples,” Dr Byers said. “It looks like it is important to look at protein levels in single cells.”
“In future, it may be possible to measure BCR-ABL levels in individual cells in the clinic. This will help us identify the resistant, high-BCR-ABL cells and better understand how patients develop resistance to imatinib treatment, with the aim of combating this resistance to make response more durable and the treatment more effective.” ![]()
Credit: UC San Diego
Preclinical research in chronic myeloid leukemia (CML) has pointed to a relationship between cell adherence and treatment resistance.
Investigators found that a population of plastic-adherent K562 cells with increased expression of BCR-ABL exhibited greater resistance to the tyrosine kinase inhibitor imatinib than nonadherent K562 cells.
“Previous studies have linked high levels of the BCR-ABL mutation with drug resistance,” said Richard Byers, PhD, of The University of Manchester in the UK.
“We wanted to see how expression of BCR-ABL differed across groups of CML cells and, in particular, whether there were differences between adherent and nonadherent populations.”
Dr Byers and his colleagues described this investigation in Experimental Hematology.
The researchers evaluated the heterogeneity of BCR-ABL expression at DNA, messenger RNA, and protein levels, using the CML-derived K562 cell line.
They grew cells in suspension and found that some cells adhered to the plastic dish. The investigators then separated the plastic-adherent and nonadherent cell populations and studied them as single cells and in bulk.
The first discovery was that adherent and nonadherent cells had similar BCR-ABL fusion gene copy numbers.
In bulk-cell analysis, the mean relative normalized ratio for genomic ABL DNA copy number was 47.73 for adherent cells and 53.40 for nonadherent cells (P=0.11). In single-cell analysis, the mean copy numbers were 13.83 and 14.22, respectively (P=0.63).
On the other hand, there was a significant difference in BCR-ABL messenger RNA expression between adherent and nonadherent cells.
In bulk cells, the level of BCR-ABL messenger RNA transcripts was 11-fold higher in adherent cells than in nondherent cells (P=0.022). And single-cell analysis revealed the mean BCR-ABL copy number was 53.11 for adherent cells and 14.06 for nonadherent cells (P=0.0013).
Adherent cells also exhibited significantly upregulated phosphorylation of BCR protein compared to nonadherent cells.
Flow cytometry showed that a mean of 61.9% of adherent cells were positive for phosphor-BCR, compared to 14.5% of nonadherent cells (P=0.0074). And single-cell analysis revealed a mean signal number per cell of 8.23 among adherent cells and 3.02 among nonadherent cells (P<0.0001).
In addition, whole-genome microRNA profiling showed that adherent and nonadherent cell populations expressed significantly different microRNA species.
Finally, the researchers found that treatment with imatinib reduced cell viability more rapidly in nonadherent cells than in adherent cells (P<0.005). The adherent cells showed a decrease in cell viability at 24 hours, compared to 4 hours for nonadherent cells.
The investigators said this research suggests that CML patients may have a similar adherent cell population that mediates resistance to imatinib. And the study highlights the importance of single-cell analysis.
“The small number of cells that show high levels of BCR-ABL may not be detectable through bulk analysis of large samples,” Dr Byers said. “It looks like it is important to look at protein levels in single cells.”
“In future, it may be possible to measure BCR-ABL levels in individual cells in the clinic. This will help us identify the resistant, high-BCR-ABL cells and better understand how patients develop resistance to imatinib treatment, with the aim of combating this resistance to make response more durable and the treatment more effective.” ![]()
Team finds hidden reservoir of HCMV
Credit: Chad McNeeley
Researchers have found evidence suggesting that perivascular mesenchymal stromal cells (MSCs) are a reservoir of human cytomegalovirus (HCMV).
This opens up the possibility of therapeutically targeting these cells, which surround blood vessels in the organs and can be found in the bone marrow.
If effective, such a treatment method could prove life-saving for individuals who experience HCMV reactivation, such as transplant recipients and patients receiving chemotherapy.
“There are antiviral medications designed to prevent HCMV from re-activating, but HCMV infection remains one of the major complications after both organ and bone marrow transplants,” said study author Graca Almeida-Porada, MD, PhD, of Wake Forest Baptist Medical Center in Winston-Salem, North Carolina.
“The question scientists have been asking for years is, ‘Where does the virus hide when it is latent?’ Maybe if we knew, we could target it.”
Previous research showed that hematopoietic stem cells can harbor HCMV. Dr Almeida-Porada and her colleagues hypothesized that other cell populations may also harbor the virus, and they suspected that perivascular MSCs were a likely culprit.
The team’s suspicions were confirmed when testing revealed that perivascular MSCs are susceptible to HCMV infection and that the virus can grow within these cells.
The researchers also compared the susceptibility of perivascular MSCs from the liver, brain, lung, and bone marrow. And they found the highest rate of HCMV infection in cells from the lung.
“This may explain why pneumonia is the primary manifestation of the HCMV infection in bone marrow transplant recipients,” Dr Almeida-Porada said.
To expand upon these findings, she and her colleagues analyzed bone marrow samples from 19 healthy individuals who had tested positive for HCMV. Quantitative PCR revealed HCMV DNA in perivascular MSCs from 7 of the subjects.
This suggests bone marrow-derived perivascular MSCs may be a natural HCMV reservoir, according to the researchers.
“We have found another source of cells that can harbor HCMV virus,” Dr Almeida-Porada concluded. “Knowing the identity of the cells opens the possibility of targeting treatments to stop its re-activation.”
Dr Almeida-Porada and her colleagues recounted their discoveries in the American Journal of Transplantation. ![]()
Analysis details effects of HLA mismatch
GRAPEVINE, TEXAS—An analysis of more than 8000 patients provides insights regarding HLA disparity that may help optimize outcomes in individuals undergoing unrelated-donor hematopoietic stem cell transplant.
The study showed that a single allele- or antigen-level HLA mismatch (7/8) increased the risk for acute and chronic graft-vs-host disease (GVHD) and worsened survival rates.
However, there were no locus-specific effects on survival, and there was no impact of allele- vs antigen-level mismatch on survival.
In addition, patients with an 8/8 matched graft had an increased risk of acute GVHD if they had a DQB1 mismatch or a DPB1 mismatch. DPB1 mismatch also decreased the risk of relapse, and nonpermissive DPB1 mismatch was associated with worse survival.
“Thus, we believe that consideration of DPB1 in donor selection may permit skewing toward donors with permissive DPB1 mismatch and may improve outcomes,” said study investigator Joseph Pidala, MD, of the H. Lee Moffitt Cancer Center in Tampa, Florida.
He presented these findings at the 2014 BMT Tandem Meetings as abstract 5, which was designated one of the meeting’s “Best Abstracts.”
Patient characteristics
Dr Pidala and his colleagues evaluated data from 8003 adult and pediatric patients who had undergone their first myeloablative, unrelated transplant between 1999 and 2011. The patients had been diagnosed with acute myeloid leukemia, acute lymphoblastic leukemia, chronic myeloid leukemia, or myelodysplastic syndrome.
Patients and their donors had high-resolution typing for HLA-A, -B, -C, -DRB1, -DQB1, and -DPB1. Most cases were 8/8 matched (n=5449), followed by 7/8 (n=2071) and 6/8 (n=483).
“Those with a greater extent of HLA mismatch were younger, less likely to be Caucasian, they differed according to disease indication for transplant, and had a greater proportion of advanced disease stage,” Dr Pidala noted.
“Additionally, those with a greater extent of HLA mismatch were more likely to receive bone marrow grafts in comparison to peripheral blood, total body irradiation, and also to receive in vivo T-cell depletion.”
Furthermore, there was a declining proportion of 6/8 match over time. It decreased from 49% (1999-2002) to 37% (2003-2006) to 14% (2007-2011).
Effects of HLA mismatch
In all analyses, the researchers considered findings significant if the P value was less than 0.01.
Compared to an 8/8 matched graft, receiving a 7/8 graft was significantly associated with an increase in acute grade 2-4, acute grade 3-4, and chronic GVHD; higher transplant-related mortality (TRM); lower disease-free survival (DFS) among patients with early stage or intermediate (but not advanced) disease; and lower overall survival (OS) regardless of disease stage.
Receiving a 6/8 graft was significantly associated with an increase in acute grade 2-4 and 3-4 GVHD, increased TRM, decreased DFS (early stage or intermediate disease), and decreased OS (early stage or intermediate disease).
“In no cases did we find [that mismatch had] an impact on the incidence of primary disease relapse,” Dr Pidala said. “Comparing 7/8 to 6/8 cases, we found that those with 7/8 had improved transplant-related mortality and disease-free and overall survival [only] in the context of early stage disease.”
The team also confirmed these findings in an analysis of 5846 unique cases. In this cohort, 2528 patients were 8/8 matched, 882 were 7/8, and 157 were 6/8.
Locus-specific effects
Mismatch at HLA-A (n=743) was significantly associated with an increase in acute grade 2-4/3-4 and chronic GVHD, increased TRM, decreased DFS, and decreased OS.
Mismatch at HLA-B (n=345) was significantly associated with an increase in grade 2-4/3-4 acute GHVD, chronic GVHD, and TRM. And mismatch at HLA-C (n=766) was significantly associated with an increase in acute grade 3-4 GVHD and TRM and a decrease in DFS and OS.
There were no significant differences in the case of DRB1 mismatch. However, Dr Pidala noted that this group had the smallest number of patients, at 217.
“I’d also like to point out that in direct, pair-wise comparisons across the mismatched loci, we did not observe any significant differences in overall survival,” Dr Pidala said. “Similarly, we found no impact of allele- vs antigen-level mismatch on overall survival.”
DP and DQ mismatch
Among 8/8 matched cases, DPB1 mismatch led to a significantly increased risk for acute grade 2-4 and 3-4 GHVD, as well as a significant reduction in the risk of relapse. This was the case whether patients had a single- or double-allele mismatch.
The addition of DQB1 mismatch significantly increased the risk of grade 2-4 acute GVHD among 8/8 matched cases only if it was a single-antigen mismatch.
Neither DPB1 nor DQB1 mismatch had a significant effect on OS, DFS, or TRM in 8/8 matched cases. And neither DPB1 nor DQB1 mismatch had a significant effect on outcomes of patients who received 7/8 matched grafts.
Among 8/8 matched cases, those with permissive DPB1 mismatch had a significantly lower risk of acute grade 2-4 and 3-4 GVHD and a significantly higher risk of relapse than patients with nonpermissive DPB1 mismatch. Patients with nonpermissive mismatch also had significantly higher TRM and significantly lower DFS and OS.
However, there were no significant differences between permissive and nonpermissive mismatches for patients with 7/8 matched grafts.
Treatment implications
Based on these results and those of previous studies, Dr Pidala said we can conclude that 8/8 matched grafts confer better survival than mismatched grafts. And a permissive DPB1 mismatch can further improve survival in 8/8 cases.
Among patients receiving a 7/8 matched graft, it is preferable to identify those with HLA-C 03:03/03:04 mismatches, as these patients appear to have mortality rates comparable to 8/8 matched cases.
Among 7/8 matched cases, we should avoid nonpermissive DPB1 mismatch, having 3 or more low-expression loci mismatches (DP, DQ, DRB3/4/5), and nonpermissive allele combinations and amino acid substitutions. ![]()
Mouse model allows tracking of cells, drug activity

Scientists have created a mouse that expresses a fluorescing biosensor in every cell of its body, allowing diseased cells and drugs to be tracked and evaluated in real time.
The biosensor is a single-molecule probe called Raichu-Rac, which was invented in 2002.
Although Raichu-Rac has been used by many research groups since then, this is the first time researchers have successfully modified a mouse to express the molecule throughout the body without affecting cell function.
The team described this work in Cell Reports.
Raichu-Rac mimics the action of the protein Rac, which drives cell movement and oscillates between active and inactive states. When Rac is active, Raichu-Rac picks up chemical cues and glows blue. When Rac is inactive, the molecule glows yellow.
Researchers found they could use imaging techniques to follow Rac activation in any organ at any time. They could watch moment-by-moment oscillation of Rac activity at the front or back of cells as they moved in the body. And they used the technology to monitor Rac activity in response to treatment.
“It allows us to watch and map, in real time, parts of a cell or organ where Rac is active and driving invasion,” said study author Paul Timpson, PhD, of the Garvan Institute of Medical Research in Darlinghurst, New South Wales, Australia.
“In cancers, a lot of blue indicates an aggressive tumor that is in the process of spreading. You can literally watch parts of a tumor turn from blue to yellow as a drug hits its target. This can be an hour or more after the drug is administered, and the effect can wane quickly or slowly. Drug companies need to know these details—specifically, how much, how often, and how long to administer drugs.”
The researchers said the mouse can be used to study any cancer type by crossing it with other models, limiting expression of Raichu-Rac to specific cell or tissue types. And the mouse can be adapted to study other diseases by expressing Raichu-Rac in different disease models.
“The great thing about this mouse is its flexibility and potential for looking at a broad range of diseases and molecular targets,” Dr Timpson said.
The mouse was created by Heidi Welch, PhD, of the Babraham Institute in Cambridge, UK, although she said she cannot take all the credit.
“The credit must go to Professor Miki Matsuda, the genius who invented [Raichu-Rac] in the first place 12 years ago,” Dr Welch said. “He made his discovery freely available to the scientific community and has been very open about his findings since.”
“Miki Matsuda was super helpful in suggesting the expression levels we should be looking for and in recommending the exact biosensor we should use, out of many he developed.” ![]()
STS Resident Symposium 2014
The 2014 Residents’ Symposium at the STS 50th Annual Meeting in Orlando was heavily attended and greatly appreciated by current thoracic surgical trainees.
This outstanding forum boasted several experienced and informative speakers, with the overall goals of helping residents to find the right job and transition to practice.
Moderated by Dr. Sidhu Gangadharan, Dr. Sandra Starnes, and Dr. Ara A. Vaporciyan, this session addressed several key foci, specifically aiming to help residents plan a successful job search, negotiate important elements of a contract, plan for ways to bring new technologies into a practice, recognize the legal issues of billing and coding, and identify the important aspects of early career development. This phenomenal collection of talks featured a number of key speakers, who provided tips and recommendations received with great interest by the resident participants.
The symposium was kicked off by Dr. Danny Chu of the University of Pittsburgh Medical Center, who spoke on how to find a job position. He shared his personal experiences and gave attendees an overview of the actual job-search process. He provided several tips for finding the best job. He stated that since, "good positions are almost never advertised until they are filled, it helps to have a big network." He explained that, "in such a small community, there are literally 3 degrees of separation, and everyone knows everyone. In addition to being a good surgeon, being a nice and affable person will get you a good position." His top tips for finding a job are to "Work hard, be nice, and be social." Dr. Chu concluded his presentation by explaining that there’s no magic formula for finding a job, but that it’s very much like dating. He warns that money is not everything, details are all negotiable, and one should be cautious in trusting others. In the end, he believes that "nice guys will win," and tells the group despite much anxiety, it will work out in the end.
This was followed by a talk from Dr. Christine Lau of the University of Virginia, Charlottesville, on interviewing and self-marketing. Dr. Lau provided her insights on how to best represent yourself in the interview process, with a number of great points about putting your best foot forward. She emphasized the importance of being prepared, and she strongly advised that, prior to going on an interview, you do your homework. "Know what the position entails," explained Dr. Lau, "and have a well-thought-out plan regarding what you uniquely bring to it."
She advised speaking to a number of people in advance in order to elucidate the specific needs of the group. And, while Dr. Lau encourages you to have a clear explanation as to how you might meet the expectations of the job, she offered a reminder of the importance of being honest. "Yes, you want to explain how you fit into the spot; however, if it’s not a good fit, don’t try to be something that you’re not. You won’t be happy in the long run, and neither will they." Dr. Lau also offered some advice regarding the concept of specialization.
"Everybody wants to have a niche. But you don’t need to force yourself to differentiate early on." She continued, "If your interests and skills are broad at this point, that’s not a bad thing. You can always morph later."
Dr. Faiz Bhora of Columbia University, N.Y., wrapped up the first session with a discussion of contract negotiations – helping attendees prioritize what’s worth fighting for, how to fight for it, and how to avoid going so far as to negotiate oneself out of a job.
After the opportunity to partake in both small and large group sessions and a short break, the symposium resumed, with the second half focusing on the transition from trainee to attending surgeon.
Dr. Edward Chen of Emory University in Atlanta provided suggestions for adding new technologies to one’s practice and the effective team interactions required to do so. He listed several key strategies that he feels are critical to a successful transition. Communication, communication, and communication were at the top of his list. He advised that it’s a two-way street and that ample meetings may be necessary regarding one’s needs and expectations. He warned not to make any assumptions and to be flexible about adapting to the system that is in place. He also stressed the importance of a willingness to educate the staff about specific technology – in the ICU, in the OR, and on the ward. Dr. Chen also spoke about professional behavior and team building once one is out in the real world.
His advice to trainees entering practice entails the following three recommendations: "1) Make patient care your absolute top priority. 2) Treat everyone around you with utmost respect and dignity. Care about and find value in all team members, even those who are not the strongest members. Always have your team member’s back and never openly criticize anyone. And 3) embrace your new institution and new team members." These suggestions are useful for trainees entering their first job; however, they are also incredibly practical advice for anybody working on a medical team, regardless of the environment or their role on the team.
Dr. Francis C. Nichols, from the Mayo Clinic, in Rochester, Minn., gave a great update on the new ICD-10, explaining key differences between previous coding systems and the new one.
He provided attendees with a helpful understanding of the importance of appropriate coding and billing strategies, and offered tips for accurately optimizing one’s ability to bill for provided services.
Finally, this wonderful series of brief lectures was finished off with a top-notch presentation from Dr. Elizabeth A. David of the University of California, Davis, who spoke about the various means of developing your career in the early years. She provided insight and details about developing reasonable, achievable 5- and 10-year plans; finding mentors (both within and outside of one’s institution); and how not to fail as a junior attending. The most important thing that you should do as a junior attending, according to Dr. David, is to make sure that your patients do well. She recommends, "Check everything, be vigilant, make sure your outcomes are yours, and be available to your patients and your referring physicians."
When asked what she wishes she’d known before venturing into practice, Dr. David states, "I wish I had known how hard I was going to work as a junior faculty member. People had told me that the first year would be a hard year, but it never really sunk in until I was experiencing it." She continues, "my first year was definitely a challenging year, but like all things you work hard for – it was very rewarding!"
Likewise, the symposium was incredibly rewarding. States Dr. Michelle Ellis, a finishing fellow at the University of Michigan, Ann Arbor, "I enjoyed the symposium very much. It was timely and relevant. I would definitely recommend it to other residents and fellows. I especially liked the break-out sessions which allowed for detailed discussion."
Dr. Antonoff is a second-year, thoracic-track trainee at Washington University in St Louis.

Take care to care for the poor
I’m guilty. I feel a sense of entitlement, as many of us do. I have always had access to the best health care available. Even as a child, whenever I had a runny nose, my parents not only knew what to do but could afford whatever it took to make me feel better. And vaccine-preventable illnesses? They didn’t stand a chance at my house. I remember the day when I was a little girl and my father, a general practitioner, figured out my plan to wait him out as he stood patiently outside the bathroom door, vaccine in hand. He eventually got tired of waiting, barged in, oblivious to the fact that I was sitting on the potty (twiddling my fingers), and shot me right in arm. The nerve!
Many of us have no concept of what it is like to be ill. I mean really ill with no one to help, and no way to pay for that help even if we could find it. In the March 6, 2014, issue of the New England Journal of Medicine, authors of "Global Supply of Health Professionals" note that there’s a worldwide crisis of severe shortages, as well as maldistribution of health care professionals intensified by three global transitions: redistribution of the disability burden, demographic changes, and epidemiologic shifts. An estimated 25% of physicians in America come from other countries. Naturally, in some cases the countries of origin have their own health care challenges, so the trend to immigrate to America has significant potential to exacerbate an already critical shortage.

Of the estimated 9.2 million doctors worldwide, 8% reside in the United States. Of the 18.1 million nurses, 17% are in here. To put it in perspective, only 4% of the world’s population lives in the United States, yet we command a lion’s share of the global health care workforce, leaving the citizens of many other countries vulnerable to excessive suffering, premature death, and preventable diseases.
With all that America has to offer, I don’t see the pendulum shifting back in the other direction any time soon, but many of us are in a position to provide much needed health care to our brothers and sisters in even the most remote areas of the world.
As squeamish as I am about charting unknown territory, even I went on a medical missions trip to Nicaragua a few years ago and I will never forget it. We had to climb up the side of a mountain to get to a clearing that would hold the makeshift medical clinic. Of course, the locals came out in large numbers to receive much-needed medical care.
On the way back to the hotel I noticed some little boys tossing an object back and forth in the street. It seemed like pleasant fun until we got closer and I saw the object they were tossing was a dead rat. Even what we consider an inexpensive child’s toy is a luxury for many. If you consider salary and benefits, we hospitalists make more, on average, in a single shift than many Nicaraguans make in an entire year.
Every physician should spend some time caring for the poorest of the poor, whether it be in a needy foreign country, Appalachia or rural America, or in the inner city, often just 30 minutes from our homes.
Surely it will help or change the patient’s life. But, too, it just might change your perspective, forever, and renew your passion for what we do – help others.
Dr. Hester is a hospitalist with Baltimore-Washington Medical Center who has a passion for empowering patients to partner in their health care. She is the creator of the Patient Whiz, a patient-engagement app for iOS.
I’m guilty. I feel a sense of entitlement, as many of us do. I have always had access to the best health care available. Even as a child, whenever I had a runny nose, my parents not only knew what to do but could afford whatever it took to make me feel better. And vaccine-preventable illnesses? They didn’t stand a chance at my house. I remember the day when I was a little girl and my father, a general practitioner, figured out my plan to wait him out as he stood patiently outside the bathroom door, vaccine in hand. He eventually got tired of waiting, barged in, oblivious to the fact that I was sitting on the potty (twiddling my fingers), and shot me right in arm. The nerve!
Many of us have no concept of what it is like to be ill. I mean really ill with no one to help, and no way to pay for that help even if we could find it. In the March 6, 2014, issue of the New England Journal of Medicine, authors of "Global Supply of Health Professionals" note that there’s a worldwide crisis of severe shortages, as well as maldistribution of health care professionals intensified by three global transitions: redistribution of the disability burden, demographic changes, and epidemiologic shifts. An estimated 25% of physicians in America come from other countries. Naturally, in some cases the countries of origin have their own health care challenges, so the trend to immigrate to America has significant potential to exacerbate an already critical shortage.
Of the estimated 9.2 million doctors worldwide, 8% reside in the United States. Of the 18.1 million nurses, 17% are in here. To put it in perspective, only 4% of the world’s population lives in the United States, yet we command a lion’s share of the global health care workforce, leaving the citizens of many other countries vulnerable to excessive suffering, premature death, and preventable diseases.
With all that America has to offer, I don’t see the pendulum shifting back in the other direction any time soon, but many of us are in a position to provide much needed health care to our brothers and sisters in even the most remote areas of the world.
As squeamish as I am about charting unknown territory, even I went on a medical missions trip to Nicaragua a few years ago and I will never forget it. We had to climb up the side of a mountain to get to a clearing that would hold the makeshift medical clinic. Of course, the locals came out in large numbers to receive much-needed medical care.
On the way back to the hotel I noticed some little boys tossing an object back and forth in the street. It seemed like pleasant fun until we got closer and I saw the object they were tossing was a dead rat. Even what we consider an inexpensive child’s toy is a luxury for many. If you consider salary and benefits, we hospitalists make more, on average, in a single shift than many Nicaraguans make in an entire year.
Every physician should spend some time caring for the poorest of the poor, whether it be in a needy foreign country, Appalachia or rural America, or in the inner city, often just 30 minutes from our homes.
Surely it will help or change the patient’s life. But, too, it just might change your perspective, forever, and renew your passion for what we do – help others.
Dr. Hester is a hospitalist with Baltimore-Washington Medical Center who has a passion for empowering patients to partner in their health care. She is the creator of the Patient Whiz, a patient-engagement app for iOS.

Doxorubicin, ifosfamide combination touted for advanced sarcomas
MILAN – The combination of doxorubicin and ifosfamide is the best treatment for most patients with a sarcoma that does not have a proven targeted therapy, although a recent report from a large randomized study failed to prove that the combination surpassed doxorubicin alone for improving overall survival, said Dr. Robert S. Benjamin.
"From my point of view, this was clearly a positive study, but it was interpreted as a negative study" by the investigators who ran it, Dr. Benjamin said at Sarcoma and GIST 2014, hosted by the European Society for Medical Oncology.
Among patients who received doxorubicin (Adriamycin) plus ifosfamide (Ifex), compared with those randomized to doxorubicin only, "the incidence of progressive disease was cut by more than half, the objective response rate was twice as high, and the time to progression was increased by more than 50%. Overall survival was also better" but did not reach statistical significance. "It was supposed to be 10% better for overall survival [based on the study’s design], but it was only 9% better and they considered that the same as zero," noted Dr. Benjamin, professor and chairman of sarcoma medical oncology at the University of Texas M.D. Anderson Cancer Center, Houston.

"Overall survival is a lousy endpoint," he said. "It measures everything that happens when you treat, but also everything that happens after" treatment is finished. Dr. Benjamin said his center was invited by the organizers of this phase III trial to participate, but he declined because the trial used overall survival as its primary endpoint.
The trial enrolled 455 patients with a locally-advanced, unresectable, or metastatic high-grade soft-tissue sarcoma, aged 18-60 years at 38 centers in nine European countries and Canada. It included patients with more than 10 different sarcoma types including liposarcomas, synovial sarcomas, leiomyosarcomas, undifferentiated pleomorphic sarcomas, and unclassified high-grade sarcomas. The study randomized patients to either doxorubicin alone or intensified doxorubicin plus ifosfamide as first-line treatment. Patients were treated every 3 weeks for up to six cycles and were followed for a median of 56-59 months (Lancet Oncol. 2014 [doi:10.1016/S1470-2045(14)70063-4]).
The study’s primary endpoint, overall survival, averaged 12.8 months in the monotherapy arm and 14.3 months in the dual-agent arm, a hazard ratio of 0.83 that failed to meet statistical significance (P =.076), reported Dr. Ian Judson, professor and head of the sarcoma unit at the Royal Marsden Hospital in London, and his associates. However, median progression-free survival was 4.6 months in the doxorubicin-only arm and 7.4 months for the combined-treatment arm, a statistically significant difference (P = .003). Progressive disease occurred in 32% of the patients on monotherapy and in 13% of those on combined treatment.
The study’s authors concluded that if chemotherapy is used palliatively to relieve acute symptoms, then sequential treatment with single drugs would probably be less toxic without significantly impairing survival. For patients in whom symptoms could be relieved by tumor shrinkage, or if debulking of the tumor before surgery or radiotherapy is the goal, or if delaying disease progression as long as possible is the goal, then combination treatment is justified. They also cautioned against extrapolating the findings to patients older than 60 years, a limitation seconded by Dr. Benjamin. He cautioned against administering the combination to any patient older than 65 years or to patients with substantially impaired renal function.
But he disagreed with using doxorubicin as monotherapy unless tolerance was an issue. "Doxorubicin is a very good drug; it just shouldn’t be used by itself," he said.
Dr. Benjamin offered a few tips for using the doxorubicin and ifosfamide combination in practice: It’s important to use doxorubicin at the recommended dosage of 75 mg/m2. If a patient cannot tolerate that dosage in combination with ifosfamide then the best option is to change to doxorubicin monotherapy to be sure the patient receives 75 mg/m2. He recommended starting patients first on the doxorubicin and ifosfamide combination because it is the most toxic, with a less toxic pairing like gemcitabine (Gemzar) and docetaxel (Dosefirez) as second-line therapy because it’s harder for patients to switch to a more toxic regimen, he said. Dacarbazine also can pair effectively with doxorubicin. This combination is "almost as good as doxorubicin plus ifosfamide and is less toxic." He also noted the efficacy of trabectedin (Yondelis), which is available in European countries but not in the United States.
"These drugs all work, and the patient will need everything you have. You need to put it all together," Dr. Benjamin advised. "All the chemotherapy we currently have is grossly inadequate, but given what we have, use doxorubicin and ifosfamide for most patients with soft tissue sarcomas."
On Twitter @mitchelzoler
MILAN – The combination of doxorubicin and ifosfamide is the best treatment for most patients with a sarcoma that does not have a proven targeted therapy, although a recent report from a large randomized study failed to prove that the combination surpassed doxorubicin alone for improving overall survival, said Dr. Robert S. Benjamin.
"From my point of view, this was clearly a positive study, but it was interpreted as a negative study" by the investigators who ran it, Dr. Benjamin said at Sarcoma and GIST 2014, hosted by the European Society for Medical Oncology.
Among patients who received doxorubicin (Adriamycin) plus ifosfamide (Ifex), compared with those randomized to doxorubicin only, "the incidence of progressive disease was cut by more than half, the objective response rate was twice as high, and the time to progression was increased by more than 50%. Overall survival was also better" but did not reach statistical significance. "It was supposed to be 10% better for overall survival [based on the study’s design], but it was only 9% better and they considered that the same as zero," noted Dr. Benjamin, professor and chairman of sarcoma medical oncology at the University of Texas M.D. Anderson Cancer Center, Houston.
"Overall survival is a lousy endpoint," he said. "It measures everything that happens when you treat, but also everything that happens after" treatment is finished. Dr. Benjamin said his center was invited by the organizers of this phase III trial to participate, but he declined because the trial used overall survival as its primary endpoint.
The trial enrolled 455 patients with a locally-advanced, unresectable, or metastatic high-grade soft-tissue sarcoma, aged 18-60 years at 38 centers in nine European countries and Canada. It included patients with more than 10 different sarcoma types including liposarcomas, synovial sarcomas, leiomyosarcomas, undifferentiated pleomorphic sarcomas, and unclassified high-grade sarcomas. The study randomized patients to either doxorubicin alone or intensified doxorubicin plus ifosfamide as first-line treatment. Patients were treated every 3 weeks for up to six cycles and were followed for a median of 56-59 months (Lancet Oncol. 2014 [doi:10.1016/S1470-2045(14)70063-4]).
The study’s primary endpoint, overall survival, averaged 12.8 months in the monotherapy arm and 14.3 months in the dual-agent arm, a hazard ratio of 0.83 that failed to meet statistical significance (P =.076), reported Dr. Ian Judson, professor and head of the sarcoma unit at the Royal Marsden Hospital in London, and his associates. However, median progression-free survival was 4.6 months in the doxorubicin-only arm and 7.4 months for the combined-treatment arm, a statistically significant difference (P = .003). Progressive disease occurred in 32% of the patients on monotherapy and in 13% of those on combined treatment.
The study’s authors concluded that if chemotherapy is used palliatively to relieve acute symptoms, then sequential treatment with single drugs would probably be less toxic without significantly impairing survival. For patients in whom symptoms could be relieved by tumor shrinkage, or if debulking of the tumor before surgery or radiotherapy is the goal, or if delaying disease progression as long as possible is the goal, then combination treatment is justified. They also cautioned against extrapolating the findings to patients older than 60 years, a limitation seconded by Dr. Benjamin. He cautioned against administering the combination to any patient older than 65 years or to patients with substantially impaired renal function.
But he disagreed with using doxorubicin as monotherapy unless tolerance was an issue. "Doxorubicin is a very good drug; it just shouldn’t be used by itself," he said.
Dr. Benjamin offered a few tips for using the doxorubicin and ifosfamide combination in practice: It’s important to use doxorubicin at the recommended dosage of 75 mg/m2. If a patient cannot tolerate that dosage in combination with ifosfamide then the best option is to change to doxorubicin monotherapy to be sure the patient receives 75 mg/m2. He recommended starting patients first on the doxorubicin and ifosfamide combination because it is the most toxic, with a less toxic pairing like gemcitabine (Gemzar) and docetaxel (Dosefirez) as second-line therapy because it’s harder for patients to switch to a more toxic regimen, he said. Dacarbazine also can pair effectively with doxorubicin. This combination is "almost as good as doxorubicin plus ifosfamide and is less toxic." He also noted the efficacy of trabectedin (Yondelis), which is available in European countries but not in the United States.
"These drugs all work, and the patient will need everything you have. You need to put it all together," Dr. Benjamin advised. "All the chemotherapy we currently have is grossly inadequate, but given what we have, use doxorubicin and ifosfamide for most patients with soft tissue sarcomas."
On Twitter @mitchelzoler
EXPERT ANALYSIS FROM SARCOMA AND GIST 2014
FDA places imetelstat trials on hold
The US Food and Drug Administration (FDA) has issued a full clinical hold for the telomerase inhibitor imetelstat, citing concerns that long-term exposure to the drug may pose a risk of chronic liver injury.
The hold temporarily suspends all ongoing clinical trials of imetelstat sponsored by the drug’s maker, Geron Corporation.
It’s possible that other studies of imetelstat, such as ongoing investigator-sponsored trials, may be placed on hold as well.
At present, the hold affects the remaining 8 patients enrolled on Geron’s phase 2 study of imetelstat in essential thrombocythemia and polycythemia vera.
It also affects the remaining 2 patients in the company’s phase 2 study of the drug in previously treated multiple myeloma. And Geron believes its planned phase 2 trial of imetelstat in myelofibrosis will likely be delayed as well.
The FDA has not yet issued a written notice of the hold but has given Geron verbal notice.
The agency indicated that the hold is due to persistent low-grade liver function test abnormalities observed in the study of imetelstat in patients with essential thrombocythemia or polycythemia vera and the potential risk of chronic liver injury following long-term exposure to imetelstat.
The FDA expressed concerns about whether these abnormalities are reversible. Geron said it plans to work with the FDA to put an end to the hold. ![]()