User login
Stiff, numb hands
To the Editor: Regarding the case of tetany presented by Drs. Shaheen and Merugu in the June 2013 issue of Cleveland Clinic Journal of Medicine (pages 360–362), their clinical discussion was right on, but they did not mention the clinical use of and need for ionized calcium levels in a case like this and the follow-up to confirm this was not a patient with latent hypoparathyroidism.
There is often a major discrepancy between the total calcium (no matter how it is “corrected”) and the free (ionized) calcium value, and the need to follow it during the correction phase of both hypercalcemia and hypocalcemia is critical.
In reply: Stiff, numb hands
In Reply: Generally, it is preferable to measure the ionized calcium directly, particularly if there is uncertainty about whether the corrected serum calcium is reflective of the ionized calcium, if the patient’s symptoms are atypical, or if a reliable laboratory is available to measure ionized calcium.
Direct measurement of the ionized calcium concentration could be favored compared with measuring the corrected calcium in patients with symptoms of hypocalcemia in the setting of a normal total calcium concentration. Symptomatic hypocalcemia with normal total calcium but low ionized calcium can occasionally occur in patients with acute respiratory alkalosis due to increased binding of calcium to albumin. Thus, respiratory alkalosis may cause an acute decrease in ionized calcium. Furthermore, the ionized fraction can change without an alteration in the total serum calcium concentration, as with hyperparathyroidism, which increases the ionized calcium at the expense of that bound to albumin, and hyperphosphatemia, which increases the fraction bound to inorganic anions, decreasing ionized calcium. In patients who have chronic kidney disease and a low serum bicarbonate or a low serum albumin, or both, measuring the ionized calcium is preferable to measuring the total calcium in order to diagnose hypocalcemia or hypercalcemia.
The patient was given oral magnesium, potassium, calcium, and vitamin D to continue at home. In addition, she was advised to avoid excessive alcohol consumption, and she was followed by her primary care doctor. All the laboratory values normalized within 1 month of abstinence from alcohol, and she has been well since. We agree regarding the importance of checking on the ionized calcium to confirm the hypocalcemia and normalization after treatment as stated above. Ionized calcium was never checked during the hospital stay or during the follow-up after the discharge.
Canagliflozin
To the Editor: We found Dr. Vouyiouklis’s article about the recently approved sodium-glucose cotransport 2 (SGLT) inhibitor canagliflozin very useful. However, we strongly believe there are some issues that should be addressed.
In discussing the canagliflozin trials, Dr. Vouyiouklis did not mention a phase III randomized, double-blind, double-arm study, in which canagliflozin (100 and 300 mg) in addition to metformin was compared with placebo and sitagliptin (100 mg) in patients with type 2 diabetes.1 This study recruited 1,284 participants in 22 countries. At week 52, hemoglobin A1c levels had declined by 0.73% in the sitagliptin group, 0.73% in the canagliflozin 100 mg group, and 0.88% in the canagliflozin 300 mg group. Thus, canagliflozin 100 mg demonstrated noninferiority, and canagliflozin 300 mg demonstrated superiority. In addition, as previously described by other trials, a significant statistical reduction was observed in weight and blood pressure with modest elevations in LDL cholesterol and the incidence of mycotic urinary infections.
Current guidelines and recommendations give a wide variety of therapeutic options as the second step if lifestyle interventions and metformin fail to achieve glycemic control.2 The best combination regimen is still debated and, because of their excellent side-effect profile, dipeptidyl peptidase-4 inhibitors (gliptins) are one of the most used therapeutic classes. We believe this study adds important evidence that could help with decision-making in routine clinical practice.
Also, canagliflozin’s favorable effects on weight and blood pressure inevitably lead to the question, Are the weight loss and decreased systolic blood pressure due to osmotic diuresis or to lean or body fat weight loss? The mechanism of action of SGLT2 inhibitors, per se, favors osmotic diuresis, and several trials have demonstrated this same effect, as well as postural dizziness and orthostatic hypotension.3,4 Until now, the exact cause of this weight loss has not been elucidated, and no trial has demonstrated with precision a reduction in lean or fat body weight as a direct effect of SGLT2 inhibitors. This, in addition to LDL elevation, could have important clinical implications, as diuretic osmosis will subsequently activate the renin-angiotensin-aldosterone system. This might initially blunt this blood pressure reduction and promote parasympathetic inhibition, sympathetic activation, and myocardial and vascular fibrosis that can potentially lead in the long term to adverse cardiovascular outcomes.5
- Lavalle-González FJ, Januszewicz A, Davidson J, et al. Efficacy and safety of canagliflozin compared with placebo and sitagliptin in patients with type 2 diabetes on background metformin monotherapy: a randomized trial. Diabetologia 2013; 56:2582–2592.
- Inzucchi SE, Bergenstal RM, Buse JB, et al. Management of hyperglycemia in type 2 diabetes: a patient-centered approach: position statement of the American Diabetes Association (ADA) and the European Association for the Study of Diabetes (EASD). Diabetes Care 2012; 35:1364–1379.
- Stenlöf K, Cefalu WT, Kim KA, et al. Efficacy and safety of canagliflozin monotherapy in subjects with type 2 diabetes mellitus inadequately controlled with diet and exercise. Diabetes Obes Metab 2013; 15:372–382.
- INVOKANA (canagliflozin) tablets, for oral use. Prescribing Information. Janssen Pharmaceuticals, Inc. www.janssenpharmaceuticalsinc.com/assets/invokana_prescribing_info.pdf. Accessed January 12, 2014.
- MacFadyen RJ, Barr CS, Struthers AD. Aldosterone blockade reduces vascular collagen turnover, improves heart rate variability and reduces early morning rise in heart rate in heart failure patients. Cardiovasc Res 1997; 35:30–34.
To the Editor: We found Dr. Vouyiouklis’s article about the recently approved sodium-glucose cotransport 2 (SGLT) inhibitor canagliflozin very useful. However, we strongly believe there are some issues that should be addressed.
In discussing the canagliflozin trials, Dr. Vouyiouklis did not mention a phase III randomized, double-blind, double-arm study, in which canagliflozin (100 and 300 mg) in addition to metformin was compared with placebo and sitagliptin (100 mg) in patients with type 2 diabetes.1 This study recruited 1,284 participants in 22 countries. At week 52, hemoglobin A1c levels had declined by 0.73% in the sitagliptin group, 0.73% in the canagliflozin 100 mg group, and 0.88% in the canagliflozin 300 mg group. Thus, canagliflozin 100 mg demonstrated noninferiority, and canagliflozin 300 mg demonstrated superiority. In addition, as previously described by other trials, a significant statistical reduction was observed in weight and blood pressure with modest elevations in LDL cholesterol and the incidence of mycotic urinary infections.
Current guidelines and recommendations give a wide variety of therapeutic options as the second step if lifestyle interventions and metformin fail to achieve glycemic control.2 The best combination regimen is still debated and, because of their excellent side-effect profile, dipeptidyl peptidase-4 inhibitors (gliptins) are one of the most used therapeutic classes. We believe this study adds important evidence that could help with decision-making in routine clinical practice.
Also, canagliflozin’s favorable effects on weight and blood pressure inevitably lead to the question, Are the weight loss and decreased systolic blood pressure due to osmotic diuresis or to lean or body fat weight loss? The mechanism of action of SGLT2 inhibitors, per se, favors osmotic diuresis, and several trials have demonstrated this same effect, as well as postural dizziness and orthostatic hypotension.3,4 Until now, the exact cause of this weight loss has not been elucidated, and no trial has demonstrated with precision a reduction in lean or fat body weight as a direct effect of SGLT2 inhibitors. This, in addition to LDL elevation, could have important clinical implications, as diuretic osmosis will subsequently activate the renin-angiotensin-aldosterone system. This might initially blunt this blood pressure reduction and promote parasympathetic inhibition, sympathetic activation, and myocardial and vascular fibrosis that can potentially lead in the long term to adverse cardiovascular outcomes.5
- Lavalle-González FJ, Januszewicz A, Davidson J, et al. Efficacy and safety of canagliflozin compared with placebo and sitagliptin in patients with type 2 diabetes on background metformin monotherapy: a randomized trial. Diabetologia 2013; 56:2582–2592.
- Inzucchi SE, Bergenstal RM, Buse JB, et al. Management of hyperglycemia in type 2 diabetes: a patient-centered approach: position statement of the American Diabetes Association (ADA) and the European Association for the Study of Diabetes (EASD). Diabetes Care 2012; 35:1364–1379.
- Stenlöf K, Cefalu WT, Kim KA, et al. Efficacy and safety of canagliflozin monotherapy in subjects with type 2 diabetes mellitus inadequately controlled with diet and exercise. Diabetes Obes Metab 2013; 15:372–382.
- INVOKANA (canagliflozin) tablets, for oral use. Prescribing Information. Janssen Pharmaceuticals, Inc. www.janssenpharmaceuticalsinc.com/assets/invokana_prescribing_info.pdf. Accessed January 12, 2014.
- MacFadyen RJ, Barr CS, Struthers AD. Aldosterone blockade reduces vascular collagen turnover, improves heart rate variability and reduces early morning rise in heart rate in heart failure patients. Cardiovasc Res 1997; 35:30–34.
Canagliflozin
To the Editor: In a recent CCJM review of canagliflozin,1 this novel antihyperglycemic medication was noted to be associated with a dose-dependent increase in low-density lipoprotein (LDL) cholesterol, with an increase in LDL of 8.3 mg/dL (0.215 mmol/L) seen with the 300-mg/day dose of canagliflozin.
The Cholesterol Treatment Trialists’ (CTT) meta-analysis2 showed a significant 21% proportional reduction in major vascular events per 1.0 mmol/L reduction in LDL cholesterol in people with diabetes treated with statins over an average of 4.3 years. If we assume that raising LDL cholesterol by 1.0 mmol/L has the opposite effect, then patients taking 300 mg per day of canagliflozin would be expected to suffer an increase in major vascular events of about 4.5% over 4.3 years. Put another way, for every 22 diabetic patients treated with canagliflozin over 4.3 years, one additional major vascular event would be expected on the basis of the associated increase in LDL cholesterol.
The CTT data also showed a significant 9% decrease in all-cause mortality for every 1.0 mmol/L decrease in LDL cholesterol. Again, assuming that raising LDL has the opposite effect of lowering it, then we should expect an additional death for each 52 diabetic patients treated with 300 mg/day of canagliflozin per day for 4.3 years.
The hypotensive side effect of canagliflozin might tend to mitigate some of the above adverse effects, as might its antihyperglycemic effect. Still, it would seem prudent to use this novel agent only as a second- or third-line choice, particularly in diabetic patients who have already suffered a major vascular event.
- Vouyiouklis M. Canagliflozin: improving diabetes by making urine sweet. Cleve Clin J Med 2013; 80:683–687.
- Cholesterol Treatment Trialists’ (CTT) Collaborators; Kearney PM, Blackwell L, Collins R, et al. Efficacy of cholesterol-lowering therapy in 18,686 people with diabetes in 14 randomised trials of statins: a meta-analysis. Lancet 2008; 371:117–125.
To the Editor: In a recent CCJM review of canagliflozin,1 this novel antihyperglycemic medication was noted to be associated with a dose-dependent increase in low-density lipoprotein (LDL) cholesterol, with an increase in LDL of 8.3 mg/dL (0.215 mmol/L) seen with the 300-mg/day dose of canagliflozin.
The Cholesterol Treatment Trialists’ (CTT) meta-analysis2 showed a significant 21% proportional reduction in major vascular events per 1.0 mmol/L reduction in LDL cholesterol in people with diabetes treated with statins over an average of 4.3 years. If we assume that raising LDL cholesterol by 1.0 mmol/L has the opposite effect, then patients taking 300 mg per day of canagliflozin would be expected to suffer an increase in major vascular events of about 4.5% over 4.3 years. Put another way, for every 22 diabetic patients treated with canagliflozin over 4.3 years, one additional major vascular event would be expected on the basis of the associated increase in LDL cholesterol.
The CTT data also showed a significant 9% decrease in all-cause mortality for every 1.0 mmol/L decrease in LDL cholesterol. Again, assuming that raising LDL has the opposite effect of lowering it, then we should expect an additional death for each 52 diabetic patients treated with 300 mg/day of canagliflozin per day for 4.3 years.
The hypotensive side effect of canagliflozin might tend to mitigate some of the above adverse effects, as might its antihyperglycemic effect. Still, it would seem prudent to use this novel agent only as a second- or third-line choice, particularly in diabetic patients who have already suffered a major vascular event.
- Vouyiouklis M. Canagliflozin: improving diabetes by making urine sweet. Cleve Clin J Med 2013; 80:683–687.
- Cholesterol Treatment Trialists’ (CTT) Collaborators; Kearney PM, Blackwell L, Collins R, et al. Efficacy of cholesterol-lowering therapy in 18,686 people with diabetes in 14 randomised trials of statins: a meta-analysis. Lancet 2008; 371:117–125.
In reply: Canagliflozin
In Reply: I would like to thank these readers very much for their response and comments.
Additional data provided from the study conducted by Lavalle-González et al evaluating the efficacy and safety of canagliflozin (100-mg and 300-mg doses) vs placebo and sitagliptin in patients with type 2 diabetes showed similar findings in weight and blood pressure reduction with slight LDL elevation with the studies mentioned in my article.1 At 52 weeks, as noted, canagliflozin 100 mg demonstrated noninferiority, and canagliflozin 300 mg showed a statistically significant superiority to sitagliptin in lowering hemoglobin A1c (a change of −0.73% with canagliflozin 100 mg, −0.88% with canagliflozin 300 mg, and −0.73% with sitagliptin), which may be considered in treatment decisions along with the other possible effects of this drug.1
The decision to use canagliflozin as second-or third-line therapy should be individualized after considering all of the patient’s risk factors as well as the potential benefit vs side effectsof this drug. Metformin remains my first-line choice in the management of type 2 diabetes. In my clinical practice, thus far, I have not used canagliflozin in patients with known coronary disease or a history of cardiovascular events. I have ensured that the LDL is certainly below goal before starting any patient on this drug, and I have followed the LDL closely, without hesitating to increase the statin drug to keep the LDL below goal. I agree that the slight increase of LDL is of concern, and certainly long-term studies are necessary to see whether there will be any increase in cardiovascular events from the use of canagliflozin.
- Lavalle-González FJ, Januszewicz A, Davidson J, et al. Efficacy and safety of canagliflozin compared with placebo and sitagliptin in patients with type 2 diabetes on background metformin monotherapy: a randomized trial. Diabetologia 2013; 56:2582–2592.
In Reply: I would like to thank these readers very much for their response and comments.
Additional data provided from the study conducted by Lavalle-González et al evaluating the efficacy and safety of canagliflozin (100-mg and 300-mg doses) vs placebo and sitagliptin in patients with type 2 diabetes showed similar findings in weight and blood pressure reduction with slight LDL elevation with the studies mentioned in my article.1 At 52 weeks, as noted, canagliflozin 100 mg demonstrated noninferiority, and canagliflozin 300 mg showed a statistically significant superiority to sitagliptin in lowering hemoglobin A1c (a change of −0.73% with canagliflozin 100 mg, −0.88% with canagliflozin 300 mg, and −0.73% with sitagliptin), which may be considered in treatment decisions along with the other possible effects of this drug.1
The decision to use canagliflozin as second-or third-line therapy should be individualized after considering all of the patient’s risk factors as well as the potential benefit vs side effectsof this drug. Metformin remains my first-line choice in the management of type 2 diabetes. In my clinical practice, thus far, I have not used canagliflozin in patients with known coronary disease or a history of cardiovascular events. I have ensured that the LDL is certainly below goal before starting any patient on this drug, and I have followed the LDL closely, without hesitating to increase the statin drug to keep the LDL below goal. I agree that the slight increase of LDL is of concern, and certainly long-term studies are necessary to see whether there will be any increase in cardiovascular events from the use of canagliflozin.
- Lavalle-González FJ, Januszewicz A, Davidson J, et al. Efficacy and safety of canagliflozin compared with placebo and sitagliptin in patients with type 2 diabetes on background metformin monotherapy: a randomized trial. Diabetologia 2013; 56:2582–2592.
- Lavalle-González FJ, Januszewicz A, Davidson J, et al. Efficacy and safety of canagliflozin compared with placebo and sitagliptin in patients with type 2 diabetes on background metformin monotherapy: a randomized trial. Diabetologia 2013; 56:2582–2592.
Compliance with HAI policies varies across US

Credit: Rhoda Baer
An analysis of US intensive care units (ICUs) shows uneven compliance with policies for preventing healthcare-associated infections (HAIs).
The survey of more than 1500 ICUs showed that a majority of hospitals had prevention policies in place for central line-associated bloodstream infections (CLABSIs). But adherence to these policies ranged from 37% to 71%.
And both the prevalence of and adherence to policies was even lower for 2 other common HAIs.
Patricia W. Stone PhD, of the Columbia University School of Nursing in New York, and her colleagues shared these results in the American Journal of Infection Control.
The researchers surveyed 1534 ICUs at 975 hospitals. They assessed the implementation of 16 prescribed infection-prevention measures, as well as clinician adherence to these policies for the prevention of CLABSIs, ventilator-associated pneumonia (VAP), and catheter-associated urinary tract infections (CAUTIs).
The survey revealed that most hospitals had policies in place to prevent CLABSIs. Prevalence ranged from 87% for checking lines daily to 97% for applying chlorhexidine at catheter insertion sites.
This was followed by VAP prevention policies, which ranged from 69% for providing chlorhexidine mouth care to 91% for raising the head of the bed.
And finally, the presence of CAUTI policies ranged from 27% for nurse-initiated urinary catheterization to 68% for portable bladder ultrasounds. The researchers said it was surprising that evidence-based practices related to CAUTI prevention have not been well implemented, as CAUTIs are the most frequent HAI.
The survey also showed that many of the ICUs fell short in adhering to infection-prevention policies. Adherence ranged from 37% to 71% for CLABSIs, 45% to 55% for VAP, and 6% to 27% for CAUTIs.
The researchers analyzed other characteristics of the hospitals and their infection-prevention programs as well. The hospitals had an average of 52,578 annual patient-days, with 11,377 admissions, 32 ICU beds, 12 specialty beds, and 182 other beds.
Roughly a third of the departments (34%) had an electronic surveillance system, and most were commercially developed (86%).
Eighty-four percent of the institutions used hospitalists, 49% used intensivists, and 50% had a physician hospital epidemiologist. The average number of infection preventionists per 100 beds was 1.2, but certification of these staff members varied.
Having gained new insight into infection-prevention policies at hospitals across the US, the researchers are now planning to analyze the associations between HAI rates and characteristics of infection-prevention programs. They also plan to look at the relationship between HAI rates and adherence to evidence-based policies. ![]()
von Willebrand Disease: Approach to Diagnosis and Management
von Willebrand disease (VWD) is an inherited bleeding disorder caused by deficient or defective plasma von Willebrand factor (VWF). VWF is an adhesive multimeric plasma glycoprotein that performs 2 major functions in hemostasis: it mediates platelet adhesion to injured subendothelium via glycoprotein 1bα (GPIbα), and it binds and stabilizes factor VIII (FVIII) in circulation, protecting it from proteolytic degradation by enzymes. The current VWD classification recognizes 3 types. In order to understand the role of the numerous laboratory investigations as well as the classification of VWD, it is important to review the structure and function of the VWF subunit. Bleeding symptoms reflect the defect in primary hemostasis: mucocutaneous bleeding and excessive bleeding after surgery or trauma. Treatment focuses on increasing VWF levels with desmopressin (1-deamino-8-D-arginine vasopressin, DDAVP) or clotting factor concentrates containing both VWF and FVIII (VWF/FVIII concentrate). Nonspecific treatment options include antifibrinolytic agents (tranexamic acid) and hormone therapy (oral contraceptive pill).
To read the full article in PDF:
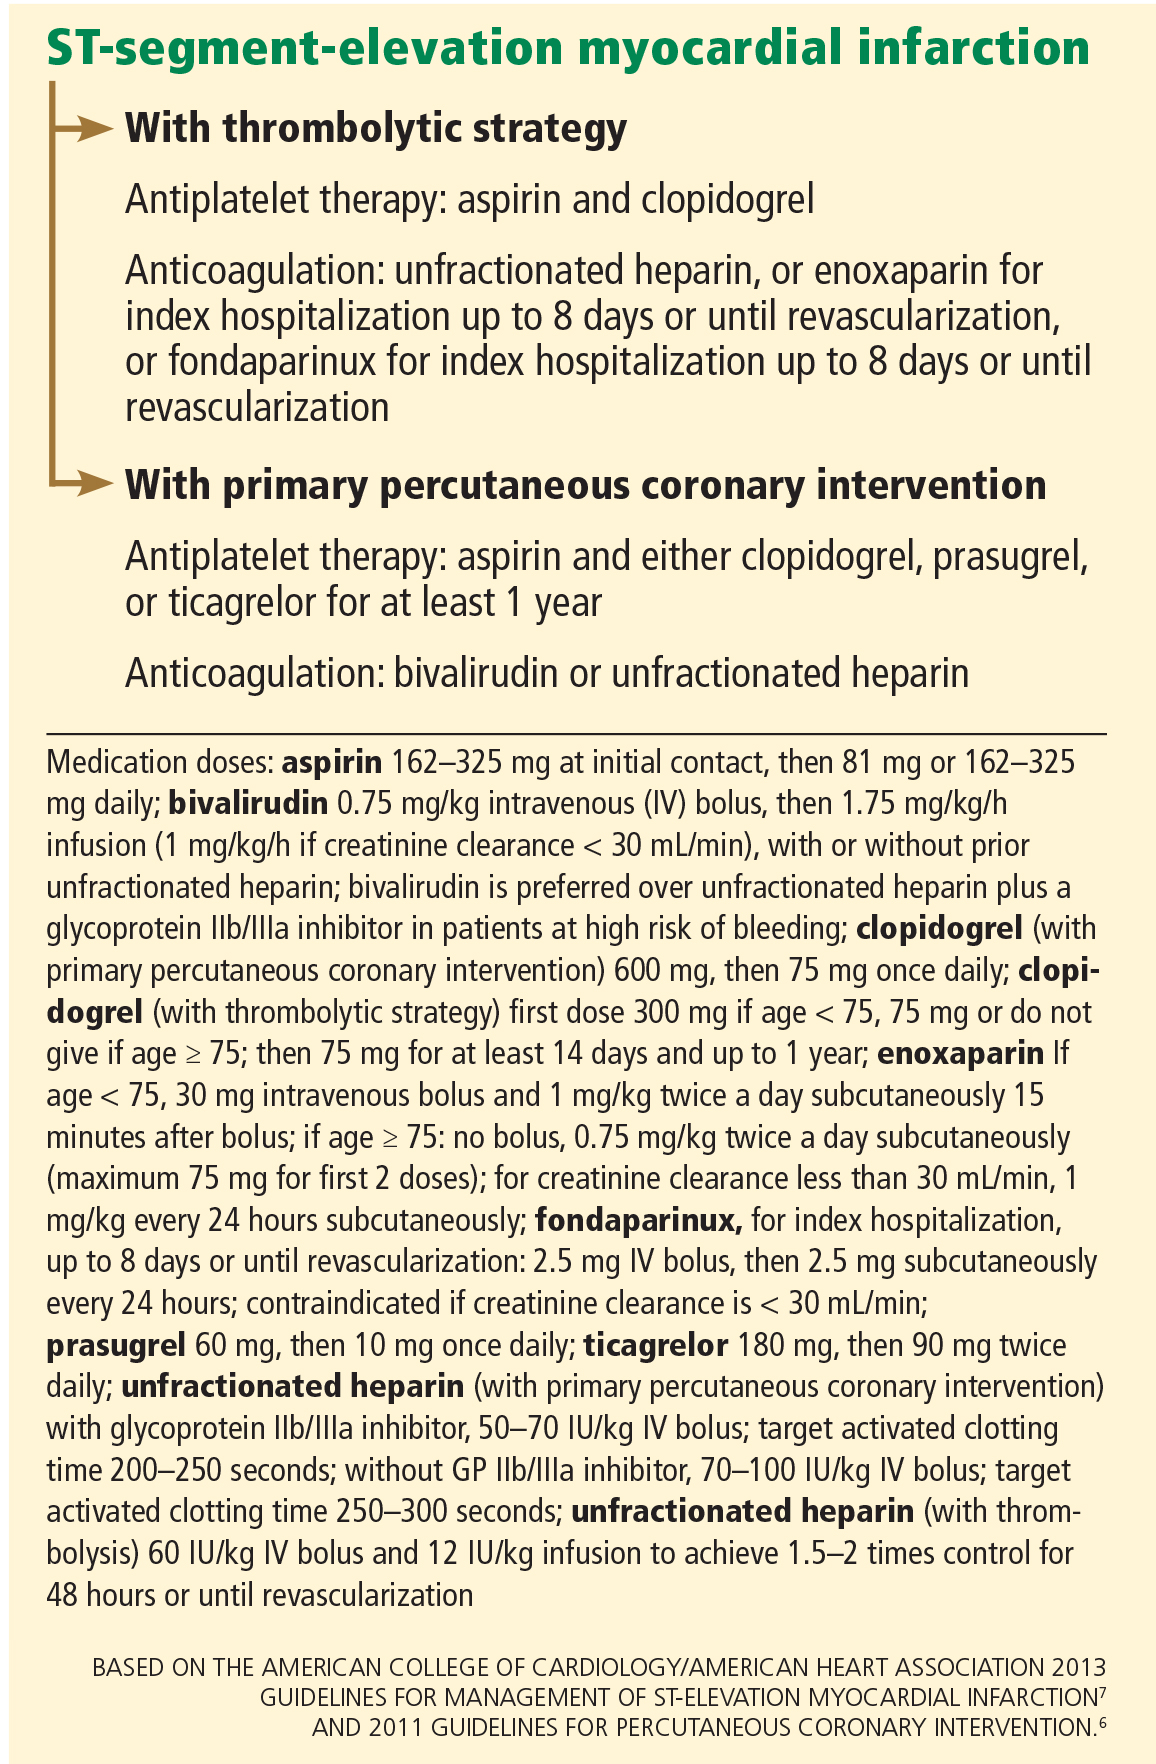
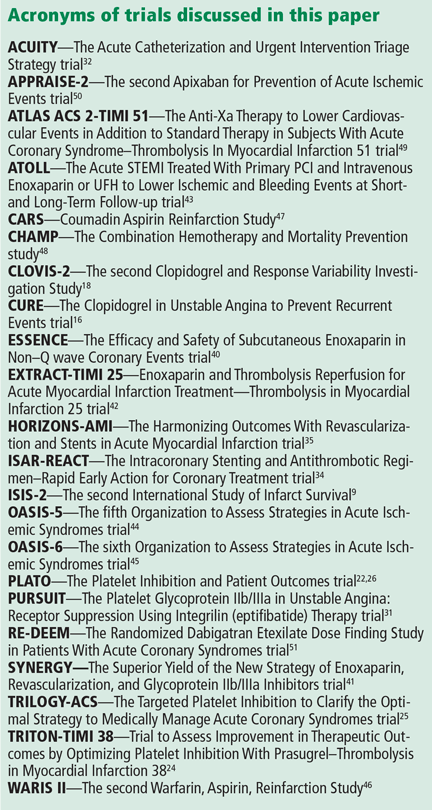
Anticoagulation and antiplatelet therapy in acute coronary syndromes
Antiplatelet and anticoagulant drugs are a cornerstone of the medical treatment of acute coronary syndrome (ACS), reducing the rates of both morbidity and death.1–4 However, reductions in ischemic events with these drugs have uniformly been accompanied by increases in bleeding complications, which reduce the net benefit.5 Thus, clinical research has been exploring ways to maximize the benefit while minimizing the risk.
Here, we review the guidelines and evidence supporting the use of antiplatelet and anticoagulant drugs in ACS.
ACUTE CORONARY SYNDROMES WITH OR WITHOUT ST ELEVATION
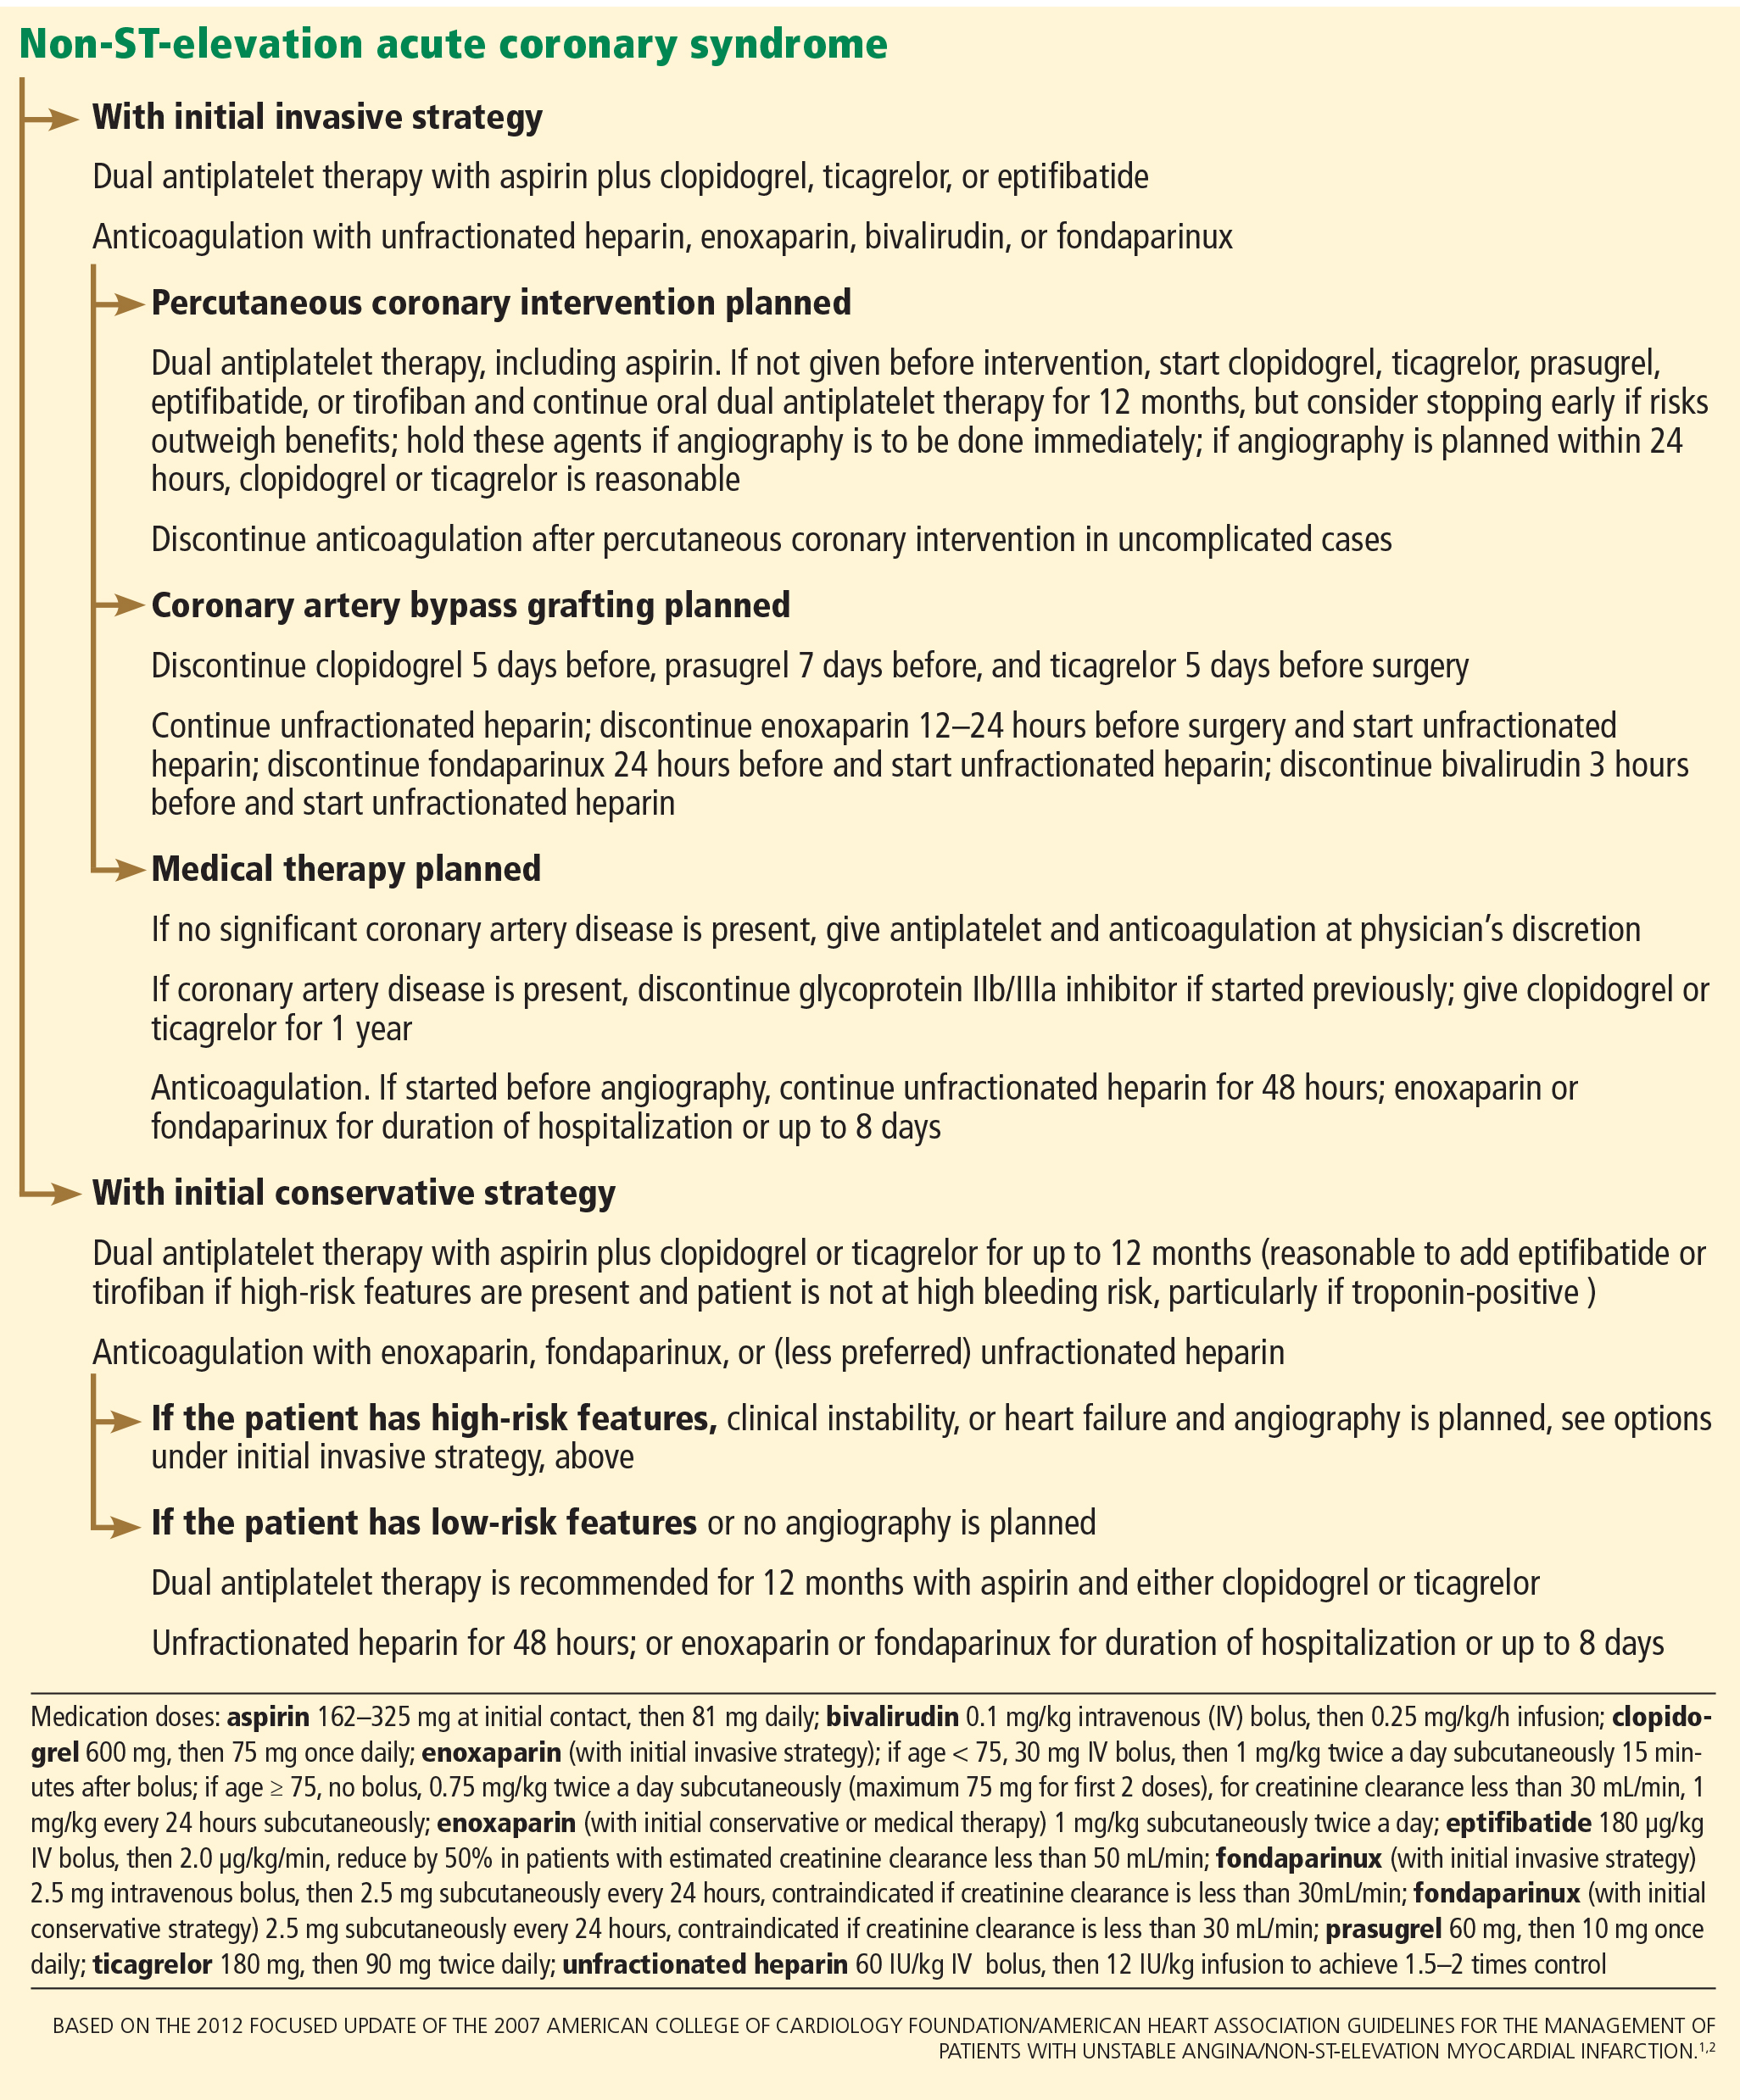
A key distinction when treating ACS is whether the electrocardiogram shows ST-segment elevation. In cases of non-ST-elevation ACS (ie, unstable angina or non-ST-elevation myocardial infarction), a second key question is whether the initial strategy will be invasive (with angiography performed urgently) or conservative (with angiography performed later). In ST-elevation myocardial infarction, another distinction is how perfusion is to be restored, ie, with primary percutaneous coronary intervention or with thrombolysis. All these questions affect the choice of antiplatelet and anticoagulant therapy.
Figure 1 and Figure 2 summarize the guidelines of the American College of Cardiology Foundation and American Heart Association.1,2,6,7
ANTIPLATELET THERAPY
Aspirin for all
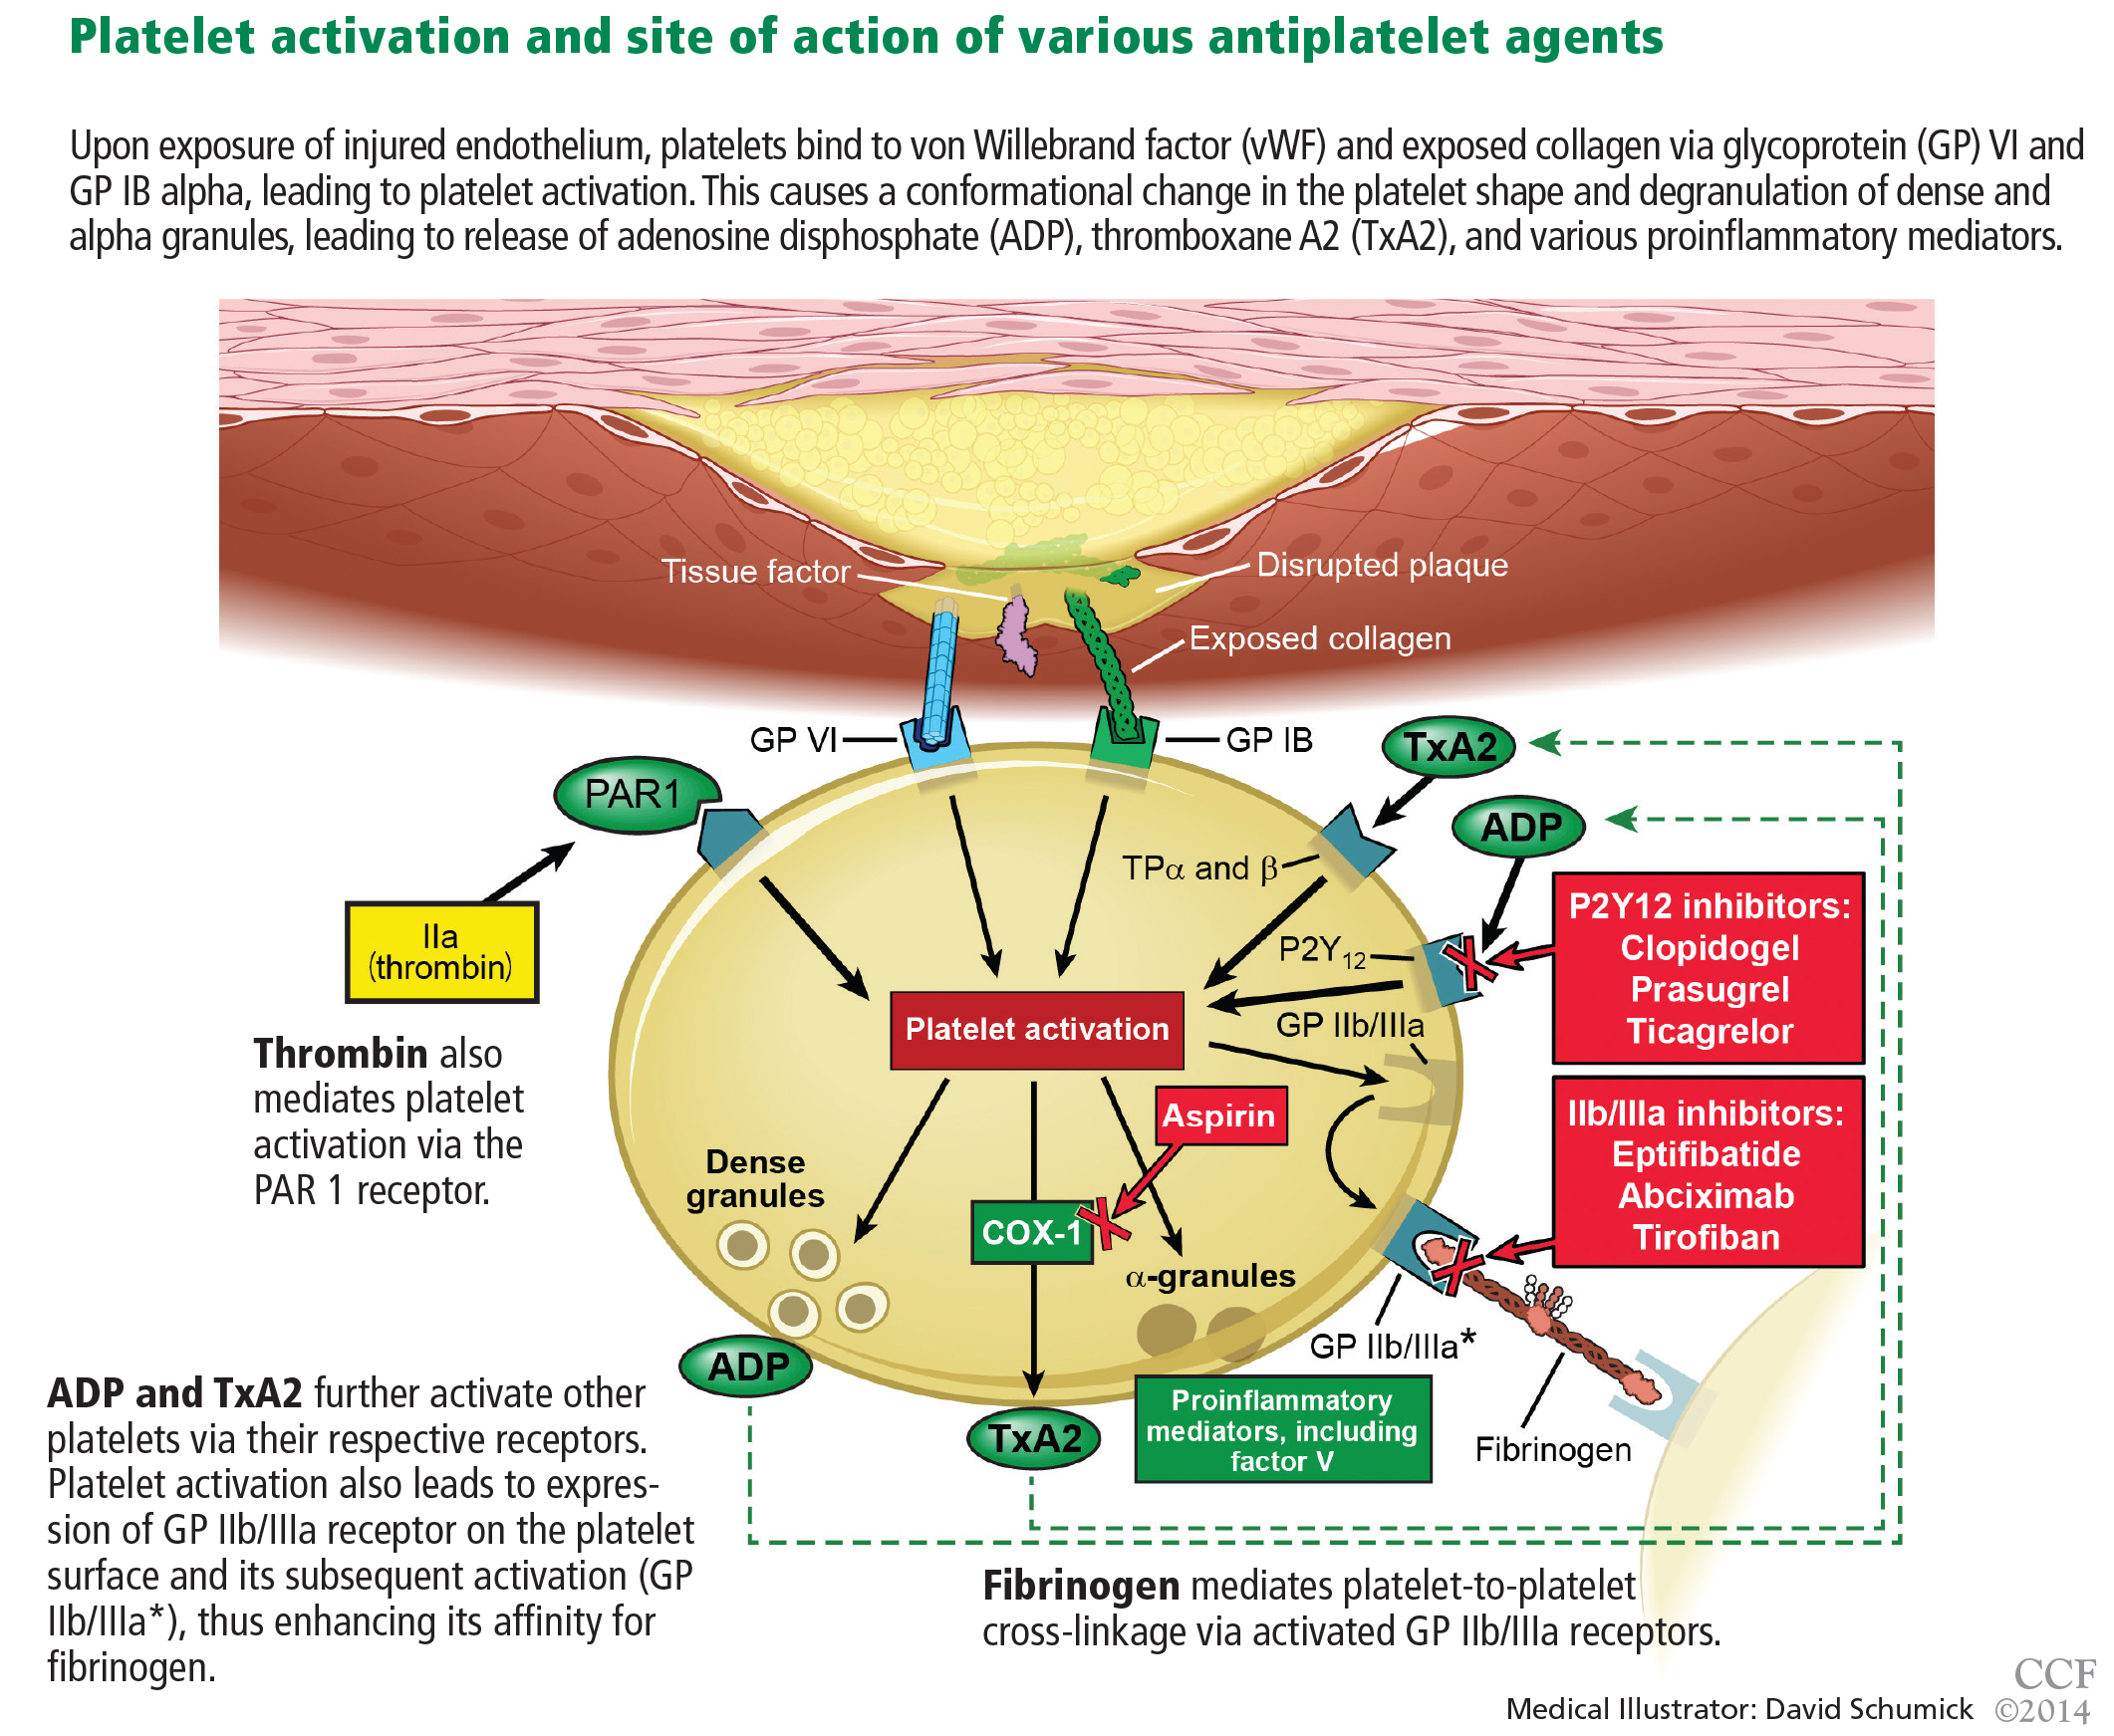
Aspirin irreversibly acetylates the enzyme cyclooxygenase-1, blocking intraplatelet formation of thromboxane A2 (Figure 3), a potent platelet aggregator and endothelial vasoconstrictor. Large clinical trials have confirmed that aspirin reduces morbidity and mortality rates by as much as 50% in patients with ACS.8
The ISIS-2 trial9 found that giving aspirin early in the emergency department significantly reduced the mortality rate.
The Antithrombotic Trialists’ Collaboration,10 in a meta-analysis of randomized controlled trials comparing different doses of aspirin in high-risk ACS patients, found no greater benefit for doses of aspirin higher than 162 mg per day when used long-term.
How to use. During an ACS, the patient should receive one dose of aspirin 325 mg (the standard high-dose pill in the United States). This dose should be chewed, as buccal absorption results in more rapid systemic effects.11
Thereafter, the patient should take 81 mg per day, continued indefinitely. The 81-mg dose also applies to patients who undergo a percutaneous coronary intervention with a drug-eluting stent.7 Previous recommendations called for higher doses, but studies have shown that higher doses pose a higher risk of bleeding without additional clinical benefit. The use of enteric-coated aspirin does not reduce this risk,12 and its delayed release may in fact cause aspirin “pseudoresistance.”13
The concurrent use of nonsteroidal anti-inflammatory drugs (NSAIDs) should be avoided, as NSAIDs reversibly bind to platelets, thus preventing aspirin from binding.14 As aspirin washes out of the body, NSAIDs may then become unbound from platelets, leaving platelets activated.
P2Y12 receptor inhibitors: Clopidogrel, prasugrel, ticagrelor
These agents bind to P2Y12 receptors on platelets to inhibit adenosine diphosphate-mediated platelet activation (Figure 3). Clopidogrel and prasugrel are irreversible prodrugs, whereas ticagrelor binds reversibly.
Clopidogrel, a prodrug
Clopidogrel has a half-life of 8 hours and a time to peak concentration of 4 hours. Eighty-five percent of a dose is inactivated by gut esterases. The remainder is metabolized primarily by the cytochrome P4502C19 enzyme system into its active metabolite.
How to use. The recommended dosage is a 600-mg bolus early in the course of ACS. This is associated with a lower rate of cardiovascular events than a 300-mg dose,2,15 although no trial has rigorously compared 300-mg vs 600-mg doses using major clinical end points. In patients presenting with ACS who cannot tolerate aspirin because of hypersensitivity or major gastrointestinal contraindication, clopidogrel is an alternative.1
The CURE trial16 randomized 12,526 patients with non-ST-elevation ACS to receive clopidogrel or placebo in addition to standard therapy. Clopidogrel was associated with a 20% lower rate of cardiovascular death, myocardial infarction, or stroke in both low- and high-risk patients regardless of whether an invasive or conservative strategy was pursued.
However, patients who underwent coronary artery bypass grafting (CABG) had a 53% higher risk of bleeding (an absolute risk of 3.3%) if they received clopidogrel within 5 days of the surgery. This has led to the practice in some centers of delaying giving clopidogrel until after the coronary anatomy has been defined. This deprives the patient of the anti-ischemic benefits conferred by giving clopidogrel early and remains a contentious issue, with most suggesting that the risk-benefit ratio still favors giving clopidogrel early, before angiography, unless there is a high likelihood that surgery will ultimately be required.17 Alternatively, one could consider using a shorter-acting intravenous glycoprotein IIb/IIIa inhibitor such as eptifibatide as a “bridge” until a definitive reperfusion strategy is chosen.
Effect of CYP2C19 variants. The CLOVIS-2 study18 assessed the effects of genetic variants on the clopidogrel concentration in 106 patients who had had a myocardial infarction. The study confirmed that patients who carry certain variants of the CYP2C19 gene attain lower plasma concentrations of clopidogrel after receiving this drug.19 This accounts for its delayed onset of action as well as its variability in response in patients who have reduced expression or inhibition of this enzyme system. Doubling the standard dose in patients who carry these variants does not appear to provide clinical benefit.20
Thus, the thought is emerging that one should consider using prasugrel or ticagrelor instead of clopidogrel in patients who have these polymorphisms, though this is yet to be backed by robust clinical evidence.
Possible interaction with proton pump inhibitors. Controversy exists about whether proton pump inhibitors inhibit clopidogrel’s action. Although the US Food and Drug Administration continues to warn against the concurrent use of omeprazole and clopidogrel,21 an analysis of the PLATO trial22 concluded that patients with ACS who were taking proton pump inhibitors were at higher risk of ischemic events regardless of whether they had been randomized to clopidogrel or ticagrelor (a drug that acts independently of the cytochrome P450 system). This observation suggests that patients on proton pump inhibitors are generally sicker and at higher risk of ischemic events regardless of the choice of antiplatelet therapy. The use of other gastroprotective agents did not appear to mitigate these risks.
Prasugrel: Faster metabolism to active drug
Prasugrel is an irreversible P2Y12 receptor antagonist (Figure 3) that is metabolized into its active metabolite faster and in a more predictable fashion than clopidogrel.23
The TRITON-TIMI 38 study24 included 13,608 ACS patients in whom an early invasive strategy was planned and who were pretreated with prasugrel or clopidogrel in addition to standard treatment. The rate of the primary efficacy end point of death, myocardial infarction, or stroke was 19% lower in the prasugrel group. In those who underwent percutaneous coronary intervention, the incidence of in-stent thrombosis was more than 50% lower in the prasugrel group regardless of whether bare metal stents or drug-eluting stents were used.
Greater platelet inhibition came at the price of a higher incidence of serious bleeding, particularly in the subgroups of patients who were over age 75, had a history of stroke or transient ischemic attack, or weighed less than 60 kg. Prasugrel is therefore contraindicated in patients with a history of transient ischemic attack or stroke. Some suggest that a 5-mg dose can be used with caution (rather than the usual 10-mg dose) in patients over age 75 years or those who have low body weight.
The TRILOGY-ACS trial25 compared prasugrel and clopidogrel in medically managed patients with high-risk non-ST-elevation ACS. It found no difference in the rates of the primary end points of cardiovascular death, myocardial infarction, or stroke at 1 year. In the prespecified subset of patients over age 75 years, the rate of bleeding end points was no higher with prasugrel 5 mg once daily than with clopidogrel.
Prasugrel’s half-life is 7 hours, and its peak antiplatelet effect is within 30 minutes after an oral dose, compared with 4 hours with clopidogrel. Therefore, if a patient with non-ST-elevation ACS is going to go to the catheterization laboratory soon, he or she should not receive prasugrel beforehand, and should receive it later only if the results of angiography indicate that CABG will not be needed urgently. This is an important consideration when using prasugrel, as the rate of surgery-related bleeding was four times higher than with clopidogrel. If possible, this drug should be withheld for at least 7 days before CABG.
Ticagrelor, a direct P2Y12 receptor inhibitor
Ticagrelor, a reversible direct inhibitor of the P2Y12 receptor, inhibits adenosine diphosphate-mediated activation and aggregation (Figure 3). It has a median time to peak concentration of 1.3 to 2 hours and a half-life of 9 hours.
The PLATO trial26 enrolled 18,624 patients with ACS who were given either ticagrelor or clopidogrel in addition to standard therapy. At 12 months, the composite primary end point of myocardial infarction, death, or stroke had occurred in 16% fewer patients receiving ticagrelor than in the clopidogrel group. Analyzed separately, there were 16% fewer myocardial infarctions, 21% fewer cardiovascular deaths, and 22% fewer deaths from any cause, regardless of whether an invasive or conservative strategy was used, and with or without prior clopidogrel use. Fewer cases of stent thrombosis occurred in the ticagrelor group, and the rate of major bleeding was the same.
In a prospectively defined subgroup analysis,27 ticagrelor was beneficial only in patients who received lower doses of aspirin (< 100 mg daily): the hazard ratio for the primary end point was 0.79 (95% confidence interval [CI] 0.71–0.88) in ticagrelor recipients who received low-dose aspirin and 1.45 (95% CI 1.01–2.09) in those who received high-dose aspirin.
Although this analysis is underpowered and controversial, the current evidence suggests that when used in combination with ticagrelor, the aspirin dose should be 81 mg.
Ticagrelor was also associated with a 19% higher incidence of non-CABG- or procedure-related major bleeding, more nonfatal and fatal intracranial bleeding, a higher incidence of dyspnea, and significantly more ventricular pauses.
Although ticagrelor carries no black-box warning about its use in patients with prior stroke or transient ischemic attack, the number of such patients in PLATO was small. Thus, caution should still be used in these patients.28
Ticagrelor should preferably be discontinued 5 days before CABG.
Glycoprotein IIb/IIIa inhibitors: Eptifibatide, tirofiban, abciximab
Glycoprotein IIb/IIIa inhibitors are intravenous agents that act by inhibiting fibrinogen-and von Willebrand factor-mediated platelet-to-platelet cross-linkage, the final pathway of platelet aggregation (Figure 3).
Use of these agents in ACS has been decreasing, as evidence supporting their use was largely established before the era of dual antiplatelet therapy.
A meta-analysis29 of 46,374 patients with non-ST-elevation ACS found that routinely adding a glycoprotein IIb/IIIa inhibitor “upstream” as a third agent in patients receiving dual antiplatelet therapy bought only a modest (11%) reduction in death or myocardial infarction at 30 days, at the price of a 23% increase in major bleeding and no decrease in the overall rate of death. Roughly 70% of the patients were receiving dual antiplatelet therapy before cardiac catheterization.
These agents can be considered in high-risk ACS patients, such as those with ST-segment changes or elevated troponin concentrations, and in diabetic patients, on the assumption that these patients likely have a high intracoronary thrombus burden and are at higher risk of microvascular embolization.6,30 They can also be considered at the time of primary percutaneous coronary intervention in selected patients receiving heparin.7
Eptifibatide
Eptifibatide is a small-molecule, short-acting glycoprotein IIb/IIIa inhibitor with a half-life of 2.5 hours. Its inhibition of platelet aggregation is reversible by stopping the drug infusion and is thought to be a result of dissociation of the drug from platelets.
The PURSUIT trial31 studied 10,948 patients presenting with non-ST-elevation ACS randomized to placebo, eptifibatide in a 180-μg/kg bolus followed by a 2.0-μg/kg/min infusion, or eptifibatide in a 180-μg/kg bolus followed by a 1.3-μg/kg/min infusion. Both eptifibatide groups had a 1.5% absolute reduction in the incidence of the primary end point of death or myocardial infarction, a benefit that was apparent at 96 hours and that persisted through 30 days. Bleeding was more common in the eptifibatide groups, but there was no increase in the rate of hemorrhagic stroke.
The ACUITY trial32 found that early use of eptifibatide or tirofiban had no effect on the primary outcome. (See the section below on bivalirudin for more information about the ACUITY trial.)
PARENTERAL ANTICOAGULANTS
Unfractionated heparin: A declining role
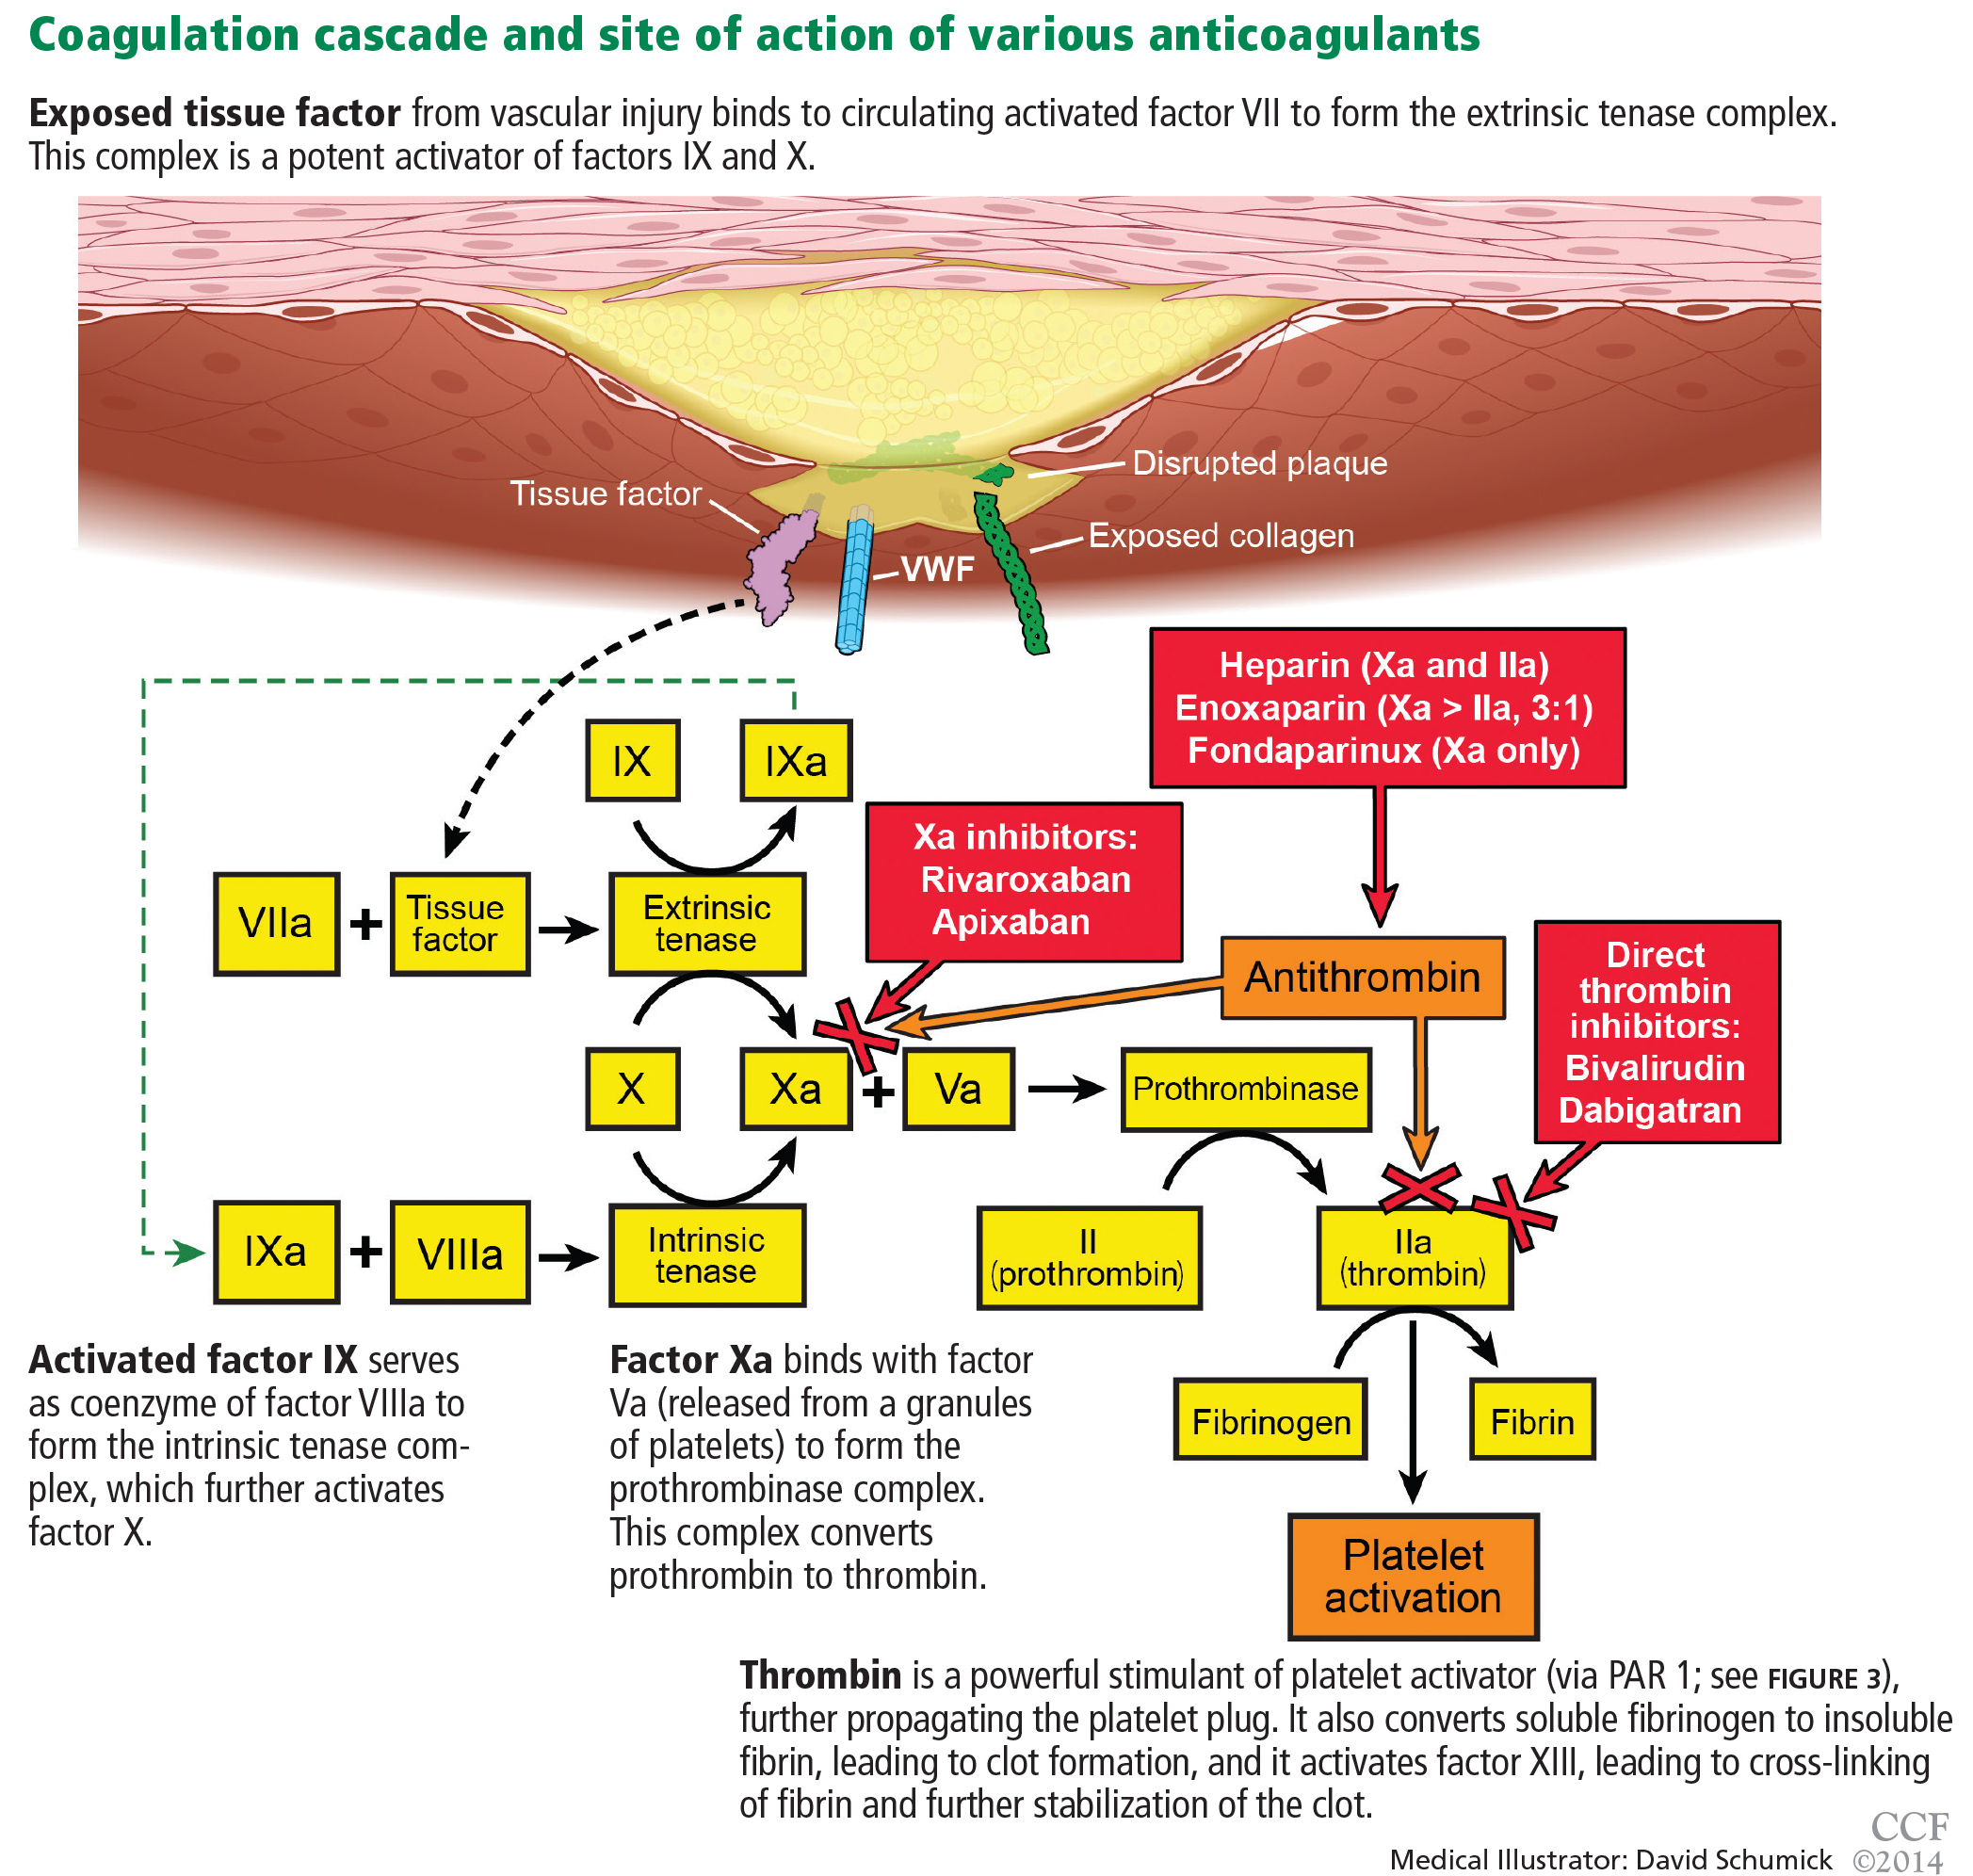
Heparin binds to antithrombin and induces a conformational change, causing rapid inhibition of factor IIa (thrombin), factor IXa, and factor Xa, thus preventing further thrombus propagation (Figure 4). An intravenous bolus of 60 units/kg produces a time to peak of 5 to 10 minutes and a half-life of 30 to 60 minutes.
Heparin can be reversed by giving protamine sulfate (1 mg per 100 units of heparin). For ACS, it is given in a bolus of 60 units/kg not exceeding 4,000 units, followed by an infusion of 12 units/kg/hour, with monitoring of the activated partial thromboplastin time every 6 hours with a goal value of 50 to 70 seconds or 1.5 to 2.5 times control.
Side effects include thrombocytopenia, heparin-induced thrombocytopenia (a distinct condition), and bleeding.
The use of unfractionated heparin was tested in ACS in the early 1990s. Oler et al33 performed a meta-analysis of six randomized trials and found a 33% lower rate of death in patients treated with heparin in addition to aspirin in ACS, as well less reported ischemic pain.
Advantages of unfractionated heparin are that it has stood the test of time, is inexpensive, and can be rapidly reversed. The disadvantages are that it can have serious side effects, including heparin-induced thrombocytopenia, and is more likely to cause bleeding than the newer intravenous anticoagulants discussed below. Thus, its position as the main anticoagulant in ACS is being challenged.
Bivalirudin, a direct thrombin inhibitor
Bivalirudin is a synthetic direct thrombin inhibitor of fluid-phase and clot-bound thrombin (Figure 4). It also inhibits platelets directly.
The ACUITY trial32 randomized 13,819 patients with moderate to high-risk ACS scheduled for invasive treatment into three treatment groups:
- Heparin (either unfractionated heparin or enoxaparin) plus a glycoprotein IIb/IIIa inhibitor (either eptifibatide, tirofiban, or abciximab)
- Bivalirudin plus a glycoprotein IIb/IIIa inhibitor
- Bivalirudin alone.
The bivalirudin-alone treatment was as sociated with noninferior rates of composite ischemia end points and significantly lower rates of major bleeding, adding up to a significant reduction in the net clinical outcome end point. An important caveat is that bivalirudin’s noninferiority was mostly in the group of patients already receiving a thienopyridine before angiography and percutaneous coronary intervention (RR 0.97 vs 1.27, P = .054). There was less major, nonmajor, minor, CABG-related, and non-CABG-related bleeding as well as need for transfusion in the bivalirudin-alone group, making bivalirudin monotherapy an attractive option in ACS patients with or without ST-segment elevation undergoing a percutaneous coronary intervention.1,31
The ISAR-REACT trial34 later compared bivalirudin alone vs unfractionated heparin and abciximab in patients with non-ST-elevation myocardial infarction undergoing percutaneous coronary intervention pretreated with aspirin and clopidogrel. The composite rate of ischemia was similar in the two treatment groups, with significantly lower rates of bleeding in the bivalirudin group.
HORIZONS-AMI35 randomized 3,602 patients with ST-elevation myocardial infarction receiving aspirin and clopidogrel either to unfractionated heparin and a glycoprotein IIb/IIIa inhibitor or to bivalirudin. As in the ACUITY trial, there was no difference in ischemic end points and a 40% to 45% lower rate of major bleeding end points in the bivalirudin group, translating into an overall lower rate of death.
Enoxaparin, a low-molecular weight heparin
Enoxaparin is a low-molecular-weight heparin that inhibits factor IIa and factor Xa via antithrombin, roughly in a ratio of 1:3 (Figure 4). It has a time to peak effect of 10 minutes when given intravenously36 and 3 to 5 hours when given subcutaneously.37 Its half-life is 4.5 hours, but it is longer in patients with renal dysfunction, requiring dose adjustments in this population.
Its anticoagulant effect is partially reversible. If it is to be reversed between 0 and 8 hours after dosing, the recommended reversal regimen is 1 mg of protamine sulfate for every 1 mg of enoxaparin used. At 8 to 12 hours, it is 0.5 mg of protamine for every 1 mg of enoxaparin. After 12 hours, no protamine is required.
Compared with unfractionated heparin, enoxaparin has less plasma protein binding and a more consistent anticoagulant effect. Its high bioavailability also allows for subcutaneous dosing. Its greater anti-Xa activity inhibits thrombin generation more effectively, and it causes lower rates of thrombocytopenia and heparin-induced thrombocytopenia.
de Lemos et al38 found that, in ACS patients in whom an early conservative approach of medical management was planned, enoxaparin was more efficacious than unfractionated heparin and caused a similar rate of bleeding.
Murphy et al,39 in a meta-analysis of 12 trials in 49,088 ACS patients, also found that enoxaparin had a net clinical benefit compared with unfractionated heparin in reducing rates of myocardial infarction and death despite more bleeding.
The ESSENCE trial40 compared enoxaparin vs unfractionated heparin in 3,171 patients with ACS. It found fewer ischemic events with enoxaparin in the early phase, more minor bleeding, but no increase in major bleeding.
The SYNERGY trial,41 in 10,027 patients with high-risk non-ST-elevation ACS undergoing percutaneous coronary intervention, compared subcutaneous enoxaparin with intravenous heparin. Enoxaparin was found to be noninferior to heparin but caused more bleeding, including major bleeding, drops in hemoglobin, and intracranial hemorrhage.
The EXTRACT-TIMI 25 trial.42 In patients with ST-elevation myocardial infarction, enoxaparin has been shown to be beneficial both in patients treated with fibrinolysis and in those who underwent primary percutaneous coronary intervention. The EXTRACT-TIMI 25 trial randomized 20,749 patients to receive either enoxaparin (an intravenous bolus and maintenance subcutaneous dosing based on renal function) or intravenous heparin in addition to thrombolysis within 6 hours of the diagnosis of ST-elevation myocardial infarction. Although the enoxaparin group had more bleeding end points, they had fewer primary and secondary efficacy end points, translating into an overall net clinical benefit in favor of enoxaparin.
The ATOLL trial43 examined the use of enoxaparin (0.5 mg/kg intravenously) or unfractionated heparin in 910 patients with ST-elevation myocardial infarction undergoing primary percutaneous coronary intervention (via the radial artery in 66% to 69%). Although there was a trend towards benefit in terms of the primary end point of death, myocardial infarction complications, procedure failure, and major bleeding favoring enoxaparin, it was not statistically significant (95% CI 0.68–1.01, P = .06).
However, there was a 37% to 42% lower rate of the secondary end point of death, recurrent myocardial infarction or ACS, or urgent target-vessel revascularization in the enoxaparin group, with a 40% reduction in death from any cause, death from a cardiac cause, or shock. The safety profiles of the two drugs were similar, and the net clinical benefit significantly favored enoxaparin.
Fondaparinux, a factor Xa inhibitor
Fondaparinux is a synthetic pentasaccharide that indirectly inhibits factor Xa through the action of antithrombin (Figure 4). After a 2.5-mg subcutaneous dose, it has a time to peak concentration of 2 hours and a half-life of 17 to 21 hours.
The OASIS-5 trial44 compared fondaparinux and enoxaparin in 20,078 patients treated for non-ST-elevation ACS. Although the rates of death, myocardial infarction, and refractory ischemia at 9 days were similar for both drugs, the fondaparinux group had a significantly (almost 50%) lower rate of bleeding at 30 days, translating into significantly fewer deaths at 30 days. However, patients receiving fondaparinux who underwent percutaneous coronary intervention had a threefold higher rate of catheter-related thrombosis.
The OASIS-6 trial45 compared fondaparinux vs usual care (placebo in those in whom unfractionated heparin was not indicated or unfractionated heparin for up to 48 hours followed by placebo for up to 8 days) in 12,092 patients with ST-elevation myocardial infarction. There was a 1.5% absolute risk reduction in death and reinfarction without an increase in bleeding at 30 days, with trends persisting 6 months into the study. However, fondaparinux was not superior to heparin in the 3% of patients who underwent primary percutaneous coronary intervention. As in OASIS-5, there was more catheter-related thrombosis in the fondaparinux group.
Although the use of supplemental unfractionated heparin appears to have mitigated this risk, fondaparinux remains a less-than-ideal option in the era of primary percutaneous coronary intervention for ST-elevation myocardial infarction and has therefore found limited use in this group of patients. It should, however, be considered in patients for whom a conservative strategy is planned, especially if bleeding risk is deemed to be high.
ORAL ANTICOAGULANTS
Oral anticoagulants provide ischemic benefit in selected patients with ACS—at the price of a higher risk of significant bleeding.
Warfarin
Warfarin was investigated after myocardial infarction in the WARIS II,46 CARS,47 and CHAMP48 trials.
WARIS II46 looked at the use of aspirin alone, warfarin alone, and aspirin and warfarin in combination. The rates of the primary end points of stroke, nonfatal infarction, and death were lower in the warfarin group.
CARS47 found no difference in the rate of the primary end point of fatal infarction, nonfatal ischemic stroke, or cardiovascular death with aspirin vs warfarin plus aspirin.
CHAMP48 saw similar trends, ie, no difference in the rate of death, recurrent myocardial infarction, or stroke with warfarin plus aspirin vs aspirin alone.
All three studies showed increases in major bleeding with warfarin use.
Putting these trials into context, the significant net clinical benefit of dual antiplatelet therapy in the current era compared with the significant bleeding and questionable conflicting evidence supporting benefit with warfarin has limited its use in ACS patients.
Rivaroxaban, an oral factor Xa inhibitor
Rivaroxaban is a novel oral direct reversible factor Xa inhibitor.
The ATLAS ACS 2-TIMI 51 trial49 found rivaroxaban 2.5 mg or 5 mg to yield a significantly lower rate of the primary outcome of cardiovascular death, myocardial infarction, ischemic stroke, and in-stent thrombosis compared with placebo, but significantly more major non-CABG bleeding and intracranial hemorrhage.
The dose used in this trial was much lower than the dose used in trials investigating the role of this drug in stroke prophylaxis in atrial fibrillation.
Apixaban, an oral factor Xa inhibitor
Apixaban is another direct factor Xa inhibitor.
The APPRAISE-2 trial50 compared apixaban 5 mg twice daily vs placebo in ACS. There was no difference in the rate of cardiovascular death, myocardial infarction, or stroke, but there was significantly more bleeding in the apixaban group, prompting early termination of this study.
Dabigatran, an oral thrombin inhibitor
Dabigatran is an oral direct thrombin inhibitor.
The RE-DEEM trial51 compared four doses of dabigatran (50, 75, 110, and 150 mg twice daily) and placebo in ACS patients. The dabigatran groups had more major and minor bleeding, and the higher the dose, the higher the incidence of bleeding. In addition, the rates of ischemic end points were no lower with dabigatran, although this trial was not powered to show differences in clinical events.
REDUCING THE RISK OF BLEEDING
In the treatment of ACS, the benefits of restoring perfusion by preventing further propagation of thrombus and platelet aggregation come at a significant price of higher bleeding risk. This in turn increases the risk of death through various mechanisms, including shock, worsening ischemia, discontinuation of antiplatelet and anticoagulation therapy causing stent thrombosis, and anemia leading to transfusion, which propagates the underlying inflammatory milieu.52
Giugliano and Braunwald53 provide practical suggestions to reduce this risk, advising physicians to:
- Avoid inappropriately high dosing, particularly in patients with renal insufficiency
- Preferentially use agents that cause less bleeding (eg, bivalirudin, fondaparinux) without compromising anti-ischemic efficacy
- Minimize the concomitant use of other drugs that cause bleeding (eg, NSAIDs)
- Use drugs that protect against bleeding (eg, proton pump inhibitors) in patients at high risk
- Prevent access-site bleeding by using the radial artery, smaller sheaths, and appropriate sheath and closure device management. Indeed, the use of radial interventions in ACS has been shown to reduce access-site-related bleeding, even in patients at high risk.54
The reduction in bleeding risk may provide future trials the opportunity to increase antithrombotic efficacy of different agents with goals of reducing ischemic end points.
- Wright RS, Anderson JL, Adams CD, et al; American College of Cardiology Foundation/American Heart Association Task Force on Practice Guidelines. 2011 ACCF/AHA focused update incorporated into the ACC/AHA 2007 Guidelines for the Management of Patients with Unstable Angina/Non-ST-Elevation Myocardial Infarction. J Am Coll Cardiol 2011; 57:e215–e367.
- Jneid H, Anderson JL, Wright RS, et al. 2012 ACCF/AHA focused update of the guideline for the management of patients with unstable angina/non-ST-elevation myocardial infarction (updating the 2007 guideline and replacing the 2011 focused update): a report of the American College of Cardiology Foundation/American Heart Association Task Force on Practice Guidelines. J Am Coll Cardiol 2012; 60:645–681.
- CAPRIE Steering Committee. A randomised, blinded, trial of clopidogrel versus aspirin in patients at risk of ischaemic events (CAPRIE). CAPRIE Steering Committee. Lancet 1996; 348:1329–1339.
- Cohen M, Adams PC, Parry G, et al. Combination antithrombotic therapy in unstable rest angina and non-Q-wave infarction in nonprior aspirin users. Primary end points analysis from the ATACS trial. Antithrombotic Therapy in Acute Coronary Syndromes Research Group. Circulation 1994; 89:81–88.
- Moscucci M, Fox KA, Cannon CP, et al. Predictors of major bleeding in acute coronary syndromes: the Global Registry of Acute Coronary Events (GRACE). Eur Heart J 2003; 24:1815–1823.
- Levine GN, Bates ER, Blankenship JC, et al; American College of Cardiology Foundation; American Heart Association Task Force on Practice Guidelines; Society for Cardiovascular Angiography and Interventions. 2011 ACCF/AHA/SCAI Guideline for Percutaneous Coronary Intervention. A report of the American College of Cardiology Foundation/American Heart Association Task Force on Practice Guidelines and the Society for Cardiovascular Angiography and Interventions. J Am Coll Cardiol 2011; 58:e44–e122.
- American College of Emergency Physicians; Society for Cardiovascular Angiography and Interventions; O’Gara PT, Kushner FG, Ascheim DD, et al. 2013 ACCF/AHA guideline for the management of ST-elevation myocardial infarction: executive summary: a report of the American College of Cardiology Foundation/American Heart Association Task Force on Practice Guidelines. J Am Coll Cardiol 2013; 61:485–510.
- Lewis HD, Davis JW, Archibald DG, et al. Protective effects of aspirin against acute myocardial infarction and death in men with unstable angina. Results of a Veterans Administration Cooperative Study. N Engl J Med 1983; 309:396–403.
- ISIS-2 (Second International Study of Infarct Survival) Collaborative Group. Randomised trial of intravenous streptokinase, oral aspirin, both, or neither among 17,187 cases of suspected acute myocardial infarction: ISIS-2. Lancet 1988; 2:349–360.
- Antithrombotic Trialists’ Collaboration. Collaborative meta-analysis of randomised trials of antiplatelet therapy for prevention of death, myocardial infarction, and stroke in high risk patients. BMJ 2002; 324:71–86.
- Sweeny JM, Gorog DA, Fuster V. Antiplatelet drug ‘resistance’. Part 1: mechanisms and clinical measurements. Nat Rev Cardiol 2009; 6:273–282.
- Kelly JP, Kaufman DW, Jurgelon JM, Sheehan J, Koff RS, Shapiro S. Risk of aspirin-associated major upper-gastrointestinal bleeding with enteric-coated or buffered product. Lancet 1996; 348:1413–1416.
- Grosser T, Fries S, Lawson JA, Kapoor SC, Grant GR, FitzGerald GA. Drug resistance and pseudoresistance: an unintended consequence of enteric coating aspirin. Circulation 2013; 127:377–385.
- US Food and Drug Administration (FDA). Concomitant use of ibuprofen and aspirin: potential for attenuation of the anti-platelet effect of aspirin. http://www.fda.gov/downloads/drugs/drugsafety/postmarketdrugsafetyinformationforpatientsandproviders/ucm161282.pdf. Accessed November 30, 2013.
- Patti G, Colonna G, Pasceri V, Pepe LL, Montinaro A, Di Sciascio G. Randomized trial of high loading dose of clopidogrel for reduction of periprocedural myocardial infarction in patients undergoing coronary intervention: results from the ARMYDA-2 (Antiplatelet therapy for Reduction of MYocardial Damage during Angioplasty) study. Circulation 2005; 111:2099–2106.
- Yusuf S, Zhao F, Mehta SR, Chrolavicius S, Tognoni G, Fox KK; Clopidogrel in Unstable Angina to Prevent Recurrent Events Trial Investigators. Effects of clopidogrel in addition to aspirin in patients with acute coronary syndromes without ST-segment elevation. N Engl J Med 2001; 345:494–502.
- Bavry AA, Lincoff AM. Is clopidogrel cardiovascular medicine’s double-edged sword? Circulation 2006; 113:1638–1640.
- Collet JP, Hulot JS, Anzaha G, et al; CLOVIS-2 Investigators. High doses of clopidogrel to overcome genetic resistance: the randomized crossover CLOVIS-2 (Clopidogrel and Response Variability Investigation Study 2). JACC Cardiovasc Interv 2011; 4:392–402.
- Hulot JS, Collet JP, Cayla G, et al. CYP2C19 but not PON1 genetic variants influence clopidogrel pharmacokinetics, pharmacodynamics, and clinical efficacy in post-myocardial infarction patients. Circ Cardiovasc Interv 2011; 4:422–428.
- Cuisset T, Quilici J, Cohen W, et al. Usefulness of high clopidogrel maintenance dose according to CYP2C19 genotypes in clopidogrel low responders undergoing coronary stenting for non ST elevation acute coronary syndrome. Am J Cardiol 2011; 108:760–765.
- US Food and Drug Administration (FDA). FDA reminder to avoid concomitant use of Plavix (clopidogrel) and omeprazole. http://www.fda.gov/Drugs/DrugSafety/ucm231161.htm. Accessed November 30, 2013.
- Goodman SG, Clare R, Pieper KS, et al; Platelet Inhibition and Patient Outcomes Trial Investigators. Association of proton pump inhibitor use on cardiovascular outcomes with clopidogrel and ticagrelor: insights from the platelet inhibition and patient outcomes trial. Circulation 2012; 125:978–986.
- Solomon S, Vacek JL. Reducing cardiac ischemic events in patients with ACS: prasugrel versus clopidogrel. Commentary. Postgrad Med 2010; 122:198–200.
- Wiviott SD, Braunwald E, McCabe CH, et al; TRITON-TIMI 38 Investigators. Prasugrel versus clopidogrel in patients with acute coronary syndromes. N Engl J Med 2007; 357:2001–2015.
- Roe MT, Armstrong PW, Fox KA, et al; TRILOGY ACS Investigators. Prasugrel versus clopidogrel for acute coronary syndromes without revascularization. N Engl J Med 2012; 367:1297–1309.
- Wallentin L, Becker RC, Budaj A, et al; PLATO Investigators. Ticagrelor versus clopidogrel in patients with acute coronary syndromes. N Engl J Med 2009; 361:1045–1057.
- Mahaffey KW, Wojdyla DM, Carroll K, et al; PLATO Investigators. Ticagrelor compared with clopidogrel by geographic region in the Platelet Inhibition and Patient Outcomes (PLATO) trial. Circulation 2011; 124:544–554.
- Verheugt FW. Beware of novel antiplatelet therapy in acute coronary syndrome patients with previous stroke. Circulation 2012; 125:2821–2823.
- Tricoci P, Newby LK, Hasselblad V, et al. Upstream use of small-molecule glycoprotein iib/iiia inhibitors in patients with non-ST-segment elevation acute coronary syndromes: a systematic overview of randomized clinical trials. Circ Cardiovasc Qual Outcomes 2011; 4:448–458.
- Kastrati A, Mehilli J, Neumann FJ, et al; Intracoronary Stenting and Antithrombotic: Regimen Rapid Early Action for Coronary Treatment 2 (ISAR-REACT 2) Trial Investigators. Abciximab in patients with acute coronary syndromes undergoing percutaneous coronary intervention after clopidogrel pretreatment: the ISAR-REACT 2 randomized trial. JAMA 2006; 295:1531–1538.
- Inhibition of platelet glycoprotein IIb/IIIa with eptifibatide in patients with acute coronary syndromes. The PURSUIT Trial Investigators. Platelet Glycoprotein IIb/IIIa in Unstable Angina: Receptor Suppression Using Integrilin Therapy. N Engl J Med 1998; 339:436–443.
- Stone GW, McLaurin BT, Cox DA, et al; ACUITY Investigators. Bivalirudin for patients with acute coronary syndromes. N Engl J Med 2006; 355:2203–2216.
- Oler A, Whooley MA, Oler J, Grady D. Adding heparin to aspirin reduces the incidence of myocardial infarction and death in patients with unstable angina. A meta-analysis. JAMA 1996; 276:811–815.
- Kastrati A, Neumann FJ, Schulz S, et al; ISAR-REACT 4 Trial Investigators. Abciximab and heparin versus bivalirudin for non-ST-elevation myocardial infarction. N Engl J Med 2011; 365:1980–1989.
- Stone GW, Witzenbichler B, Guagliumi G, et al; HORIZONS-AMI Trial Investigators. Bivalirudin during primary PCI in acute myocardial infarction. N Engl J Med 2008; 358:2218–2230.
- Aslam MS, Sundberg S, Sabri MN, Cooke D, Lakier JB. Pharmacokinetics of intravenous/subcutaneous enoxaparin in patients with acute coronary syndrome undergoing percutaneous coronary interventions. Catheter Cardiovasc Interv 2002; 57:187–190.
- Sanofi-Aventis US. Lovenox (enoxaparin sodium injection) product information. http://www.lovenox.com/hcp/clinical-data.aspx. Accessed December 1, 2013.
- de Lemos JA, Blazing MA, Wiviott SD, et al. Enoxaparin versus unfractionated heparin in patients treated with tirofiban, aspirin and an early conservative initial management strategy: results from the A phase of the A-to-Z trial. Eur Heart J 2004; 25:1688–1694.
- Murphy SA, Gibson CM, Morrow DA, et al. Efficacy and safety of the low-molecular weight heparin enoxaparin compared with unfractionated heparin across the acute coronary syndrome spectrum: a meta-analysis. Eur Heart J 2007; 28:2077–2086.
- Cohen M, Demers C, Gurfinkel EP, et al. A comparison of low-molecular-weight heparin with unfractionated heparin for unstable coronary artery disease. Efficacy and Safety of Subcutaneous Enoxaparin in Non-Q-Wave Coronary Events Study Group. N Engl J Med 1997; 337:447–452.
- Ferguson JJ, Califf RM, Antman EM, et al; SYNERGY Trial Investigators. Enoxaparin vs unfractionated heparin in high-risk patients with non-ST-segment elevation acute coronary syndromes managed with an intended early invasive strategy: primary results of the SYNERGY randomized trial. JAMA 2004; 292:45–54.
- Antman EM, Morrow DA, McCabe CH, et al; ExTRACT-TIMI 25 Investigators. Enoxaparin versus unfractionated heparin with fibrinolysis for ST-elevation myocardial infarction. N Engl J Med 2006; 354:1477–1488.
- Montalescot G, Zeymer U, Silvain J, et al; ATOLL Investigators. Intravenous enoxaparin or unfractionated heparin in primary percutaneous coronary intervention for ST-elevation myocardial infarction: the international randomised open-label ATOLL trial. Lancet 2011; 378:693–703.
- Yusuf S, Mehta SR, Chrolavicius S, et al; Fifth Organization to Assess Strategies in Acute Ischemic Syndromes Investigators. Comparison of fondaparinux and enoxaparin in acute coronary syndromes. N Engl J Med 2006; 354:1464–1476.
- Yusuf S, Mehta SR, Chrolavicius S, et al; OASIS-6 Trial Group. Effects of fondaparinux on mortality and reinfarction in patients with acute ST-segment elevation myocardial infarction: the OASIS-6 randomized trial. JAMA 2006; 295:1519–1530.
- Hurlen M, Abdelnoor M, Smith P, Erikssen J, Arnesen H. Warfarin, aspirin, or both after myocardial infarction. N Engl J Med 2002; 347:969–974.
- Coumadin Aspirin Reinfarction Study (CARS) Investigators. Randomised double-blind trial of fixed low-dose warfarin with aspirin after myocardial infarction. Lancet 1997; 350:389–396.
- Fiore LD, Ezekowitz MD, Brophy MT, Lu D, Sacco J, Peduzzi P; Combination Hemotherapy and Mortality Prevention (CHAMP) Study Group. Department of Veterans Affairs Cooperative Studies Program Clinical Trial comparing combined warfarin and aspirin with aspirin alone in survivors of acute myocardial infarction: primary results of the CHAMP study. Circulation 2002; 105:557–563.
- Mega JL, Braunwald E, Wiviott SD, et al; ATLAS ACS 2–TIMI 51 Investigators. Rivaroxaban in patients with a recent acute coronary syndrome. N Engl J Med 2012; 366:9–19.
- Alexander JH, Lopes RD, James S, et al; APPRAISE-2 Investigators. Apixaban with antiplatelet therapy after acute coronary syndrome. N Engl J Med 2011; 365:699–708.
- Oldgren J, Budaj A, Granger CB, et al; RE-DEEM Investigators. Dabigatran vs placebo in patients with acute coronary syndromes on dual antiplatelet therapy: a randomized, double-blind, phase II trial. Eur Heart J 2011; 32:2781–2789.
- Steg PG, Huber K, Andreotti F, et al. Bleeding in acute coronary syndromes and percutaneous coronary interventions: position paper by the Working Group on Thrombosis of the European Society of Cardiology. Eur Heart J 2011; 32:1854–1864.
- Giugliano RP, Braunwald E. The year in non-ST-segment elevation acute coronary syndrome. J Am Coll Cardiol 2012; 60:2127–039.
- Rao SV, Ou FS, Wang TY, et al. Trends in the prevalence and outcomes of radial and femoral approaches to percutaneous coronary intervention: a report from the National Cardiovascular Data Registry. JACC Cardiovasc Interv 2008; 1:379–386.
Antiplatelet and anticoagulant drugs are a cornerstone of the medical treatment of acute coronary syndrome (ACS), reducing the rates of both morbidity and death.1–4 However, reductions in ischemic events with these drugs have uniformly been accompanied by increases in bleeding complications, which reduce the net benefit.5 Thus, clinical research has been exploring ways to maximize the benefit while minimizing the risk.
Here, we review the guidelines and evidence supporting the use of antiplatelet and anticoagulant drugs in ACS.
ACUTE CORONARY SYNDROMES WITH OR WITHOUT ST ELEVATION
A key distinction when treating ACS is whether the electrocardiogram shows ST-segment elevation. In cases of non-ST-elevation ACS (ie, unstable angina or non-ST-elevation myocardial infarction), a second key question is whether the initial strategy will be invasive (with angiography performed urgently) or conservative (with angiography performed later). In ST-elevation myocardial infarction, another distinction is how perfusion is to be restored, ie, with primary percutaneous coronary intervention or with thrombolysis. All these questions affect the choice of antiplatelet and anticoagulant therapy.
Figure 1 and Figure 2 summarize the guidelines of the American College of Cardiology Foundation and American Heart Association.1,2,6,7
ANTIPLATELET THERAPY
Aspirin for all
Aspirin irreversibly acetylates the enzyme cyclooxygenase-1, blocking intraplatelet formation of thromboxane A2 (Figure 3), a potent platelet aggregator and endothelial vasoconstrictor. Large clinical trials have confirmed that aspirin reduces morbidity and mortality rates by as much as 50% in patients with ACS.8
The ISIS-2 trial9 found that giving aspirin early in the emergency department significantly reduced the mortality rate.
The Antithrombotic Trialists’ Collaboration,10 in a meta-analysis of randomized controlled trials comparing different doses of aspirin in high-risk ACS patients, found no greater benefit for doses of aspirin higher than 162 mg per day when used long-term.
How to use. During an ACS, the patient should receive one dose of aspirin 325 mg (the standard high-dose pill in the United States). This dose should be chewed, as buccal absorption results in more rapid systemic effects.11
Thereafter, the patient should take 81 mg per day, continued indefinitely. The 81-mg dose also applies to patients who undergo a percutaneous coronary intervention with a drug-eluting stent.7 Previous recommendations called for higher doses, but studies have shown that higher doses pose a higher risk of bleeding without additional clinical benefit. The use of enteric-coated aspirin does not reduce this risk,12 and its delayed release may in fact cause aspirin “pseudoresistance.”13
The concurrent use of nonsteroidal anti-inflammatory drugs (NSAIDs) should be avoided, as NSAIDs reversibly bind to platelets, thus preventing aspirin from binding.14 As aspirin washes out of the body, NSAIDs may then become unbound from platelets, leaving platelets activated.
P2Y12 receptor inhibitors: Clopidogrel, prasugrel, ticagrelor
These agents bind to P2Y12 receptors on platelets to inhibit adenosine diphosphate-mediated platelet activation (Figure 3). Clopidogrel and prasugrel are irreversible prodrugs, whereas ticagrelor binds reversibly.
Clopidogrel, a prodrug
Clopidogrel has a half-life of 8 hours and a time to peak concentration of 4 hours. Eighty-five percent of a dose is inactivated by gut esterases. The remainder is metabolized primarily by the cytochrome P4502C19 enzyme system into its active metabolite.
How to use. The recommended dosage is a 600-mg bolus early in the course of ACS. This is associated with a lower rate of cardiovascular events than a 300-mg dose,2,15 although no trial has rigorously compared 300-mg vs 600-mg doses using major clinical end points. In patients presenting with ACS who cannot tolerate aspirin because of hypersensitivity or major gastrointestinal contraindication, clopidogrel is an alternative.1
The CURE trial16 randomized 12,526 patients with non-ST-elevation ACS to receive clopidogrel or placebo in addition to standard therapy. Clopidogrel was associated with a 20% lower rate of cardiovascular death, myocardial infarction, or stroke in both low- and high-risk patients regardless of whether an invasive or conservative strategy was pursued.
However, patients who underwent coronary artery bypass grafting (CABG) had a 53% higher risk of bleeding (an absolute risk of 3.3%) if they received clopidogrel within 5 days of the surgery. This has led to the practice in some centers of delaying giving clopidogrel until after the coronary anatomy has been defined. This deprives the patient of the anti-ischemic benefits conferred by giving clopidogrel early and remains a contentious issue, with most suggesting that the risk-benefit ratio still favors giving clopidogrel early, before angiography, unless there is a high likelihood that surgery will ultimately be required.17 Alternatively, one could consider using a shorter-acting intravenous glycoprotein IIb/IIIa inhibitor such as eptifibatide as a “bridge” until a definitive reperfusion strategy is chosen.
Effect of CYP2C19 variants. The CLOVIS-2 study18 assessed the effects of genetic variants on the clopidogrel concentration in 106 patients who had had a myocardial infarction. The study confirmed that patients who carry certain variants of the CYP2C19 gene attain lower plasma concentrations of clopidogrel after receiving this drug.19 This accounts for its delayed onset of action as well as its variability in response in patients who have reduced expression or inhibition of this enzyme system. Doubling the standard dose in patients who carry these variants does not appear to provide clinical benefit.20
Thus, the thought is emerging that one should consider using prasugrel or ticagrelor instead of clopidogrel in patients who have these polymorphisms, though this is yet to be backed by robust clinical evidence.
Possible interaction with proton pump inhibitors. Controversy exists about whether proton pump inhibitors inhibit clopidogrel’s action. Although the US Food and Drug Administration continues to warn against the concurrent use of omeprazole and clopidogrel,21 an analysis of the PLATO trial22 concluded that patients with ACS who were taking proton pump inhibitors were at higher risk of ischemic events regardless of whether they had been randomized to clopidogrel or ticagrelor (a drug that acts independently of the cytochrome P450 system). This observation suggests that patients on proton pump inhibitors are generally sicker and at higher risk of ischemic events regardless of the choice of antiplatelet therapy. The use of other gastroprotective agents did not appear to mitigate these risks.
Prasugrel: Faster metabolism to active drug
Prasugrel is an irreversible P2Y12 receptor antagonist (Figure 3) that is metabolized into its active metabolite faster and in a more predictable fashion than clopidogrel.23
The TRITON-TIMI 38 study24 included 13,608 ACS patients in whom an early invasive strategy was planned and who were pretreated with prasugrel or clopidogrel in addition to standard treatment. The rate of the primary efficacy end point of death, myocardial infarction, or stroke was 19% lower in the prasugrel group. In those who underwent percutaneous coronary intervention, the incidence of in-stent thrombosis was more than 50% lower in the prasugrel group regardless of whether bare metal stents or drug-eluting stents were used.
Greater platelet inhibition came at the price of a higher incidence of serious bleeding, particularly in the subgroups of patients who were over age 75, had a history of stroke or transient ischemic attack, or weighed less than 60 kg. Prasugrel is therefore contraindicated in patients with a history of transient ischemic attack or stroke. Some suggest that a 5-mg dose can be used with caution (rather than the usual 10-mg dose) in patients over age 75 years or those who have low body weight.
The TRILOGY-ACS trial25 compared prasugrel and clopidogrel in medically managed patients with high-risk non-ST-elevation ACS. It found no difference in the rates of the primary end points of cardiovascular death, myocardial infarction, or stroke at 1 year. In the prespecified subset of patients over age 75 years, the rate of bleeding end points was no higher with prasugrel 5 mg once daily than with clopidogrel.
Prasugrel’s half-life is 7 hours, and its peak antiplatelet effect is within 30 minutes after an oral dose, compared with 4 hours with clopidogrel. Therefore, if a patient with non-ST-elevation ACS is going to go to the catheterization laboratory soon, he or she should not receive prasugrel beforehand, and should receive it later only if the results of angiography indicate that CABG will not be needed urgently. This is an important consideration when using prasugrel, as the rate of surgery-related bleeding was four times higher than with clopidogrel. If possible, this drug should be withheld for at least 7 days before CABG.
Ticagrelor, a direct P2Y12 receptor inhibitor
Ticagrelor, a reversible direct inhibitor of the P2Y12 receptor, inhibits adenosine diphosphate-mediated activation and aggregation (Figure 3). It has a median time to peak concentration of 1.3 to 2 hours and a half-life of 9 hours.
The PLATO trial26 enrolled 18,624 patients with ACS who were given either ticagrelor or clopidogrel in addition to standard therapy. At 12 months, the composite primary end point of myocardial infarction, death, or stroke had occurred in 16% fewer patients receiving ticagrelor than in the clopidogrel group. Analyzed separately, there were 16% fewer myocardial infarctions, 21% fewer cardiovascular deaths, and 22% fewer deaths from any cause, regardless of whether an invasive or conservative strategy was used, and with or without prior clopidogrel use. Fewer cases of stent thrombosis occurred in the ticagrelor group, and the rate of major bleeding was the same.
In a prospectively defined subgroup analysis,27 ticagrelor was beneficial only in patients who received lower doses of aspirin (< 100 mg daily): the hazard ratio for the primary end point was 0.79 (95% confidence interval [CI] 0.71–0.88) in ticagrelor recipients who received low-dose aspirin and 1.45 (95% CI 1.01–2.09) in those who received high-dose aspirin.
Although this analysis is underpowered and controversial, the current evidence suggests that when used in combination with ticagrelor, the aspirin dose should be 81 mg.
Ticagrelor was also associated with a 19% higher incidence of non-CABG- or procedure-related major bleeding, more nonfatal and fatal intracranial bleeding, a higher incidence of dyspnea, and significantly more ventricular pauses.
Although ticagrelor carries no black-box warning about its use in patients with prior stroke or transient ischemic attack, the number of such patients in PLATO was small. Thus, caution should still be used in these patients.28
Ticagrelor should preferably be discontinued 5 days before CABG.
Glycoprotein IIb/IIIa inhibitors: Eptifibatide, tirofiban, abciximab
Glycoprotein IIb/IIIa inhibitors are intravenous agents that act by inhibiting fibrinogen-and von Willebrand factor-mediated platelet-to-platelet cross-linkage, the final pathway of platelet aggregation (Figure 3).
Use of these agents in ACS has been decreasing, as evidence supporting their use was largely established before the era of dual antiplatelet therapy.
A meta-analysis29 of 46,374 patients with non-ST-elevation ACS found that routinely adding a glycoprotein IIb/IIIa inhibitor “upstream” as a third agent in patients receiving dual antiplatelet therapy bought only a modest (11%) reduction in death or myocardial infarction at 30 days, at the price of a 23% increase in major bleeding and no decrease in the overall rate of death. Roughly 70% of the patients were receiving dual antiplatelet therapy before cardiac catheterization.
These agents can be considered in high-risk ACS patients, such as those with ST-segment changes or elevated troponin concentrations, and in diabetic patients, on the assumption that these patients likely have a high intracoronary thrombus burden and are at higher risk of microvascular embolization.6,30 They can also be considered at the time of primary percutaneous coronary intervention in selected patients receiving heparin.7
Eptifibatide
Eptifibatide is a small-molecule, short-acting glycoprotein IIb/IIIa inhibitor with a half-life of 2.5 hours. Its inhibition of platelet aggregation is reversible by stopping the drug infusion and is thought to be a result of dissociation of the drug from platelets.
The PURSUIT trial31 studied 10,948 patients presenting with non-ST-elevation ACS randomized to placebo, eptifibatide in a 180-μg/kg bolus followed by a 2.0-μg/kg/min infusion, or eptifibatide in a 180-μg/kg bolus followed by a 1.3-μg/kg/min infusion. Both eptifibatide groups had a 1.5% absolute reduction in the incidence of the primary end point of death or myocardial infarction, a benefit that was apparent at 96 hours and that persisted through 30 days. Bleeding was more common in the eptifibatide groups, but there was no increase in the rate of hemorrhagic stroke.
The ACUITY trial32 found that early use of eptifibatide or tirofiban had no effect on the primary outcome. (See the section below on bivalirudin for more information about the ACUITY trial.)
PARENTERAL ANTICOAGULANTS
Unfractionated heparin: A declining role
Heparin binds to antithrombin and induces a conformational change, causing rapid inhibition of factor IIa (thrombin), factor IXa, and factor Xa, thus preventing further thrombus propagation (Figure 4). An intravenous bolus of 60 units/kg produces a time to peak of 5 to 10 minutes and a half-life of 30 to 60 minutes.
Heparin can be reversed by giving protamine sulfate (1 mg per 100 units of heparin). For ACS, it is given in a bolus of 60 units/kg not exceeding 4,000 units, followed by an infusion of 12 units/kg/hour, with monitoring of the activated partial thromboplastin time every 6 hours with a goal value of 50 to 70 seconds or 1.5 to 2.5 times control.
Side effects include thrombocytopenia, heparin-induced thrombocytopenia (a distinct condition), and bleeding.
The use of unfractionated heparin was tested in ACS in the early 1990s. Oler et al33 performed a meta-analysis of six randomized trials and found a 33% lower rate of death in patients treated with heparin in addition to aspirin in ACS, as well less reported ischemic pain.
Advantages of unfractionated heparin are that it has stood the test of time, is inexpensive, and can be rapidly reversed. The disadvantages are that it can have serious side effects, including heparin-induced thrombocytopenia, and is more likely to cause bleeding than the newer intravenous anticoagulants discussed below. Thus, its position as the main anticoagulant in ACS is being challenged.
Bivalirudin, a direct thrombin inhibitor
Bivalirudin is a synthetic direct thrombin inhibitor of fluid-phase and clot-bound thrombin (Figure 4). It also inhibits platelets directly.
The ACUITY trial32 randomized 13,819 patients with moderate to high-risk ACS scheduled for invasive treatment into three treatment groups:
- Heparin (either unfractionated heparin or enoxaparin) plus a glycoprotein IIb/IIIa inhibitor (either eptifibatide, tirofiban, or abciximab)
- Bivalirudin plus a glycoprotein IIb/IIIa inhibitor
- Bivalirudin alone.
The bivalirudin-alone treatment was as sociated with noninferior rates of composite ischemia end points and significantly lower rates of major bleeding, adding up to a significant reduction in the net clinical outcome end point. An important caveat is that bivalirudin’s noninferiority was mostly in the group of patients already receiving a thienopyridine before angiography and percutaneous coronary intervention (RR 0.97 vs 1.27, P = .054). There was less major, nonmajor, minor, CABG-related, and non-CABG-related bleeding as well as need for transfusion in the bivalirudin-alone group, making bivalirudin monotherapy an attractive option in ACS patients with or without ST-segment elevation undergoing a percutaneous coronary intervention.1,31
The ISAR-REACT trial34 later compared bivalirudin alone vs unfractionated heparin and abciximab in patients with non-ST-elevation myocardial infarction undergoing percutaneous coronary intervention pretreated with aspirin and clopidogrel. The composite rate of ischemia was similar in the two treatment groups, with significantly lower rates of bleeding in the bivalirudin group.
HORIZONS-AMI35 randomized 3,602 patients with ST-elevation myocardial infarction receiving aspirin and clopidogrel either to unfractionated heparin and a glycoprotein IIb/IIIa inhibitor or to bivalirudin. As in the ACUITY trial, there was no difference in ischemic end points and a 40% to 45% lower rate of major bleeding end points in the bivalirudin group, translating into an overall lower rate of death.
Enoxaparin, a low-molecular weight heparin
Enoxaparin is a low-molecular-weight heparin that inhibits factor IIa and factor Xa via antithrombin, roughly in a ratio of 1:3 (Figure 4). It has a time to peak effect of 10 minutes when given intravenously36 and 3 to 5 hours when given subcutaneously.37 Its half-life is 4.5 hours, but it is longer in patients with renal dysfunction, requiring dose adjustments in this population.
Its anticoagulant effect is partially reversible. If it is to be reversed between 0 and 8 hours after dosing, the recommended reversal regimen is 1 mg of protamine sulfate for every 1 mg of enoxaparin used. At 8 to 12 hours, it is 0.5 mg of protamine for every 1 mg of enoxaparin. After 12 hours, no protamine is required.
Compared with unfractionated heparin, enoxaparin has less plasma protein binding and a more consistent anticoagulant effect. Its high bioavailability also allows for subcutaneous dosing. Its greater anti-Xa activity inhibits thrombin generation more effectively, and it causes lower rates of thrombocytopenia and heparin-induced thrombocytopenia.
de Lemos et al38 found that, in ACS patients in whom an early conservative approach of medical management was planned, enoxaparin was more efficacious than unfractionated heparin and caused a similar rate of bleeding.
Murphy et al,39 in a meta-analysis of 12 trials in 49,088 ACS patients, also found that enoxaparin had a net clinical benefit compared with unfractionated heparin in reducing rates of myocardial infarction and death despite more bleeding.
The ESSENCE trial40 compared enoxaparin vs unfractionated heparin in 3,171 patients with ACS. It found fewer ischemic events with enoxaparin in the early phase, more minor bleeding, but no increase in major bleeding.
The SYNERGY trial,41 in 10,027 patients with high-risk non-ST-elevation ACS undergoing percutaneous coronary intervention, compared subcutaneous enoxaparin with intravenous heparin. Enoxaparin was found to be noninferior to heparin but caused more bleeding, including major bleeding, drops in hemoglobin, and intracranial hemorrhage.
The EXTRACT-TIMI 25 trial.42 In patients with ST-elevation myocardial infarction, enoxaparin has been shown to be beneficial both in patients treated with fibrinolysis and in those who underwent primary percutaneous coronary intervention. The EXTRACT-TIMI 25 trial randomized 20,749 patients to receive either enoxaparin (an intravenous bolus and maintenance subcutaneous dosing based on renal function) or intravenous heparin in addition to thrombolysis within 6 hours of the diagnosis of ST-elevation myocardial infarction. Although the enoxaparin group had more bleeding end points, they had fewer primary and secondary efficacy end points, translating into an overall net clinical benefit in favor of enoxaparin.
The ATOLL trial43 examined the use of enoxaparin (0.5 mg/kg intravenously) or unfractionated heparin in 910 patients with ST-elevation myocardial infarction undergoing primary percutaneous coronary intervention (via the radial artery in 66% to 69%). Although there was a trend towards benefit in terms of the primary end point of death, myocardial infarction complications, procedure failure, and major bleeding favoring enoxaparin, it was not statistically significant (95% CI 0.68–1.01, P = .06).
However, there was a 37% to 42% lower rate of the secondary end point of death, recurrent myocardial infarction or ACS, or urgent target-vessel revascularization in the enoxaparin group, with a 40% reduction in death from any cause, death from a cardiac cause, or shock. The safety profiles of the two drugs were similar, and the net clinical benefit significantly favored enoxaparin.
Fondaparinux, a factor Xa inhibitor
Fondaparinux is a synthetic pentasaccharide that indirectly inhibits factor Xa through the action of antithrombin (Figure 4). After a 2.5-mg subcutaneous dose, it has a time to peak concentration of 2 hours and a half-life of 17 to 21 hours.
The OASIS-5 trial44 compared fondaparinux and enoxaparin in 20,078 patients treated for non-ST-elevation ACS. Although the rates of death, myocardial infarction, and refractory ischemia at 9 days were similar for both drugs, the fondaparinux group had a significantly (almost 50%) lower rate of bleeding at 30 days, translating into significantly fewer deaths at 30 days. However, patients receiving fondaparinux who underwent percutaneous coronary intervention had a threefold higher rate of catheter-related thrombosis.
The OASIS-6 trial45 compared fondaparinux vs usual care (placebo in those in whom unfractionated heparin was not indicated or unfractionated heparin for up to 48 hours followed by placebo for up to 8 days) in 12,092 patients with ST-elevation myocardial infarction. There was a 1.5% absolute risk reduction in death and reinfarction without an increase in bleeding at 30 days, with trends persisting 6 months into the study. However, fondaparinux was not superior to heparin in the 3% of patients who underwent primary percutaneous coronary intervention. As in OASIS-5, there was more catheter-related thrombosis in the fondaparinux group.
Although the use of supplemental unfractionated heparin appears to have mitigated this risk, fondaparinux remains a less-than-ideal option in the era of primary percutaneous coronary intervention for ST-elevation myocardial infarction and has therefore found limited use in this group of patients. It should, however, be considered in patients for whom a conservative strategy is planned, especially if bleeding risk is deemed to be high.
ORAL ANTICOAGULANTS
Oral anticoagulants provide ischemic benefit in selected patients with ACS—at the price of a higher risk of significant bleeding.
Warfarin
Warfarin was investigated after myocardial infarction in the WARIS II,46 CARS,47 and CHAMP48 trials.
WARIS II46 looked at the use of aspirin alone, warfarin alone, and aspirin and warfarin in combination. The rates of the primary end points of stroke, nonfatal infarction, and death were lower in the warfarin group.
CARS47 found no difference in the rate of the primary end point of fatal infarction, nonfatal ischemic stroke, or cardiovascular death with aspirin vs warfarin plus aspirin.
CHAMP48 saw similar trends, ie, no difference in the rate of death, recurrent myocardial infarction, or stroke with warfarin plus aspirin vs aspirin alone.
All three studies showed increases in major bleeding with warfarin use.
Putting these trials into context, the significant net clinical benefit of dual antiplatelet therapy in the current era compared with the significant bleeding and questionable conflicting evidence supporting benefit with warfarin has limited its use in ACS patients.
Rivaroxaban, an oral factor Xa inhibitor
Rivaroxaban is a novel oral direct reversible factor Xa inhibitor.
The ATLAS ACS 2-TIMI 51 trial49 found rivaroxaban 2.5 mg or 5 mg to yield a significantly lower rate of the primary outcome of cardiovascular death, myocardial infarction, ischemic stroke, and in-stent thrombosis compared with placebo, but significantly more major non-CABG bleeding and intracranial hemorrhage.
The dose used in this trial was much lower than the dose used in trials investigating the role of this drug in stroke prophylaxis in atrial fibrillation.
Apixaban, an oral factor Xa inhibitor
Apixaban is another direct factor Xa inhibitor.
The APPRAISE-2 trial50 compared apixaban 5 mg twice daily vs placebo in ACS. There was no difference in the rate of cardiovascular death, myocardial infarction, or stroke, but there was significantly more bleeding in the apixaban group, prompting early termination of this study.
Dabigatran, an oral thrombin inhibitor
Dabigatran is an oral direct thrombin inhibitor.
The RE-DEEM trial51 compared four doses of dabigatran (50, 75, 110, and 150 mg twice daily) and placebo in ACS patients. The dabigatran groups had more major and minor bleeding, and the higher the dose, the higher the incidence of bleeding. In addition, the rates of ischemic end points were no lower with dabigatran, although this trial was not powered to show differences in clinical events.
REDUCING THE RISK OF BLEEDING
In the treatment of ACS, the benefits of restoring perfusion by preventing further propagation of thrombus and platelet aggregation come at a significant price of higher bleeding risk. This in turn increases the risk of death through various mechanisms, including shock, worsening ischemia, discontinuation of antiplatelet and anticoagulation therapy causing stent thrombosis, and anemia leading to transfusion, which propagates the underlying inflammatory milieu.52
Giugliano and Braunwald53 provide practical suggestions to reduce this risk, advising physicians to:
- Avoid inappropriately high dosing, particularly in patients with renal insufficiency
- Preferentially use agents that cause less bleeding (eg, bivalirudin, fondaparinux) without compromising anti-ischemic efficacy
- Minimize the concomitant use of other drugs that cause bleeding (eg, NSAIDs)
- Use drugs that protect against bleeding (eg, proton pump inhibitors) in patients at high risk
- Prevent access-site bleeding by using the radial artery, smaller sheaths, and appropriate sheath and closure device management. Indeed, the use of radial interventions in ACS has been shown to reduce access-site-related bleeding, even in patients at high risk.54
The reduction in bleeding risk may provide future trials the opportunity to increase antithrombotic efficacy of different agents with goals of reducing ischemic end points.
- Wright RS, Anderson JL, Adams CD, et al; American College of Cardiology Foundation/American Heart Association Task Force on Practice Guidelines. 2011 ACCF/AHA focused update incorporated into the ACC/AHA 2007 Guidelines for the Management of Patients with Unstable Angina/Non-ST-Elevation Myocardial Infarction. J Am Coll Cardiol 2011; 57:e215–e367.
- Jneid H, Anderson JL, Wright RS, et al. 2012 ACCF/AHA focused update of the guideline for the management of patients with unstable angina/non-ST-elevation myocardial infarction (updating the 2007 guideline and replacing the 2011 focused update): a report of the American College of Cardiology Foundation/American Heart Association Task Force on Practice Guidelines. J Am Coll Cardiol 2012; 60:645–681.
- CAPRIE Steering Committee. A randomised, blinded, trial of clopidogrel versus aspirin in patients at risk of ischaemic events (CAPRIE). CAPRIE Steering Committee. Lancet 1996; 348:1329–1339.
- Cohen M, Adams PC, Parry G, et al. Combination antithrombotic therapy in unstable rest angina and non-Q-wave infarction in nonprior aspirin users. Primary end points analysis from the ATACS trial. Antithrombotic Therapy in Acute Coronary Syndromes Research Group. Circulation 1994; 89:81–88.
- Moscucci M, Fox KA, Cannon CP, et al. Predictors of major bleeding in acute coronary syndromes: the Global Registry of Acute Coronary Events (GRACE). Eur Heart J 2003; 24:1815–1823.
- Levine GN, Bates ER, Blankenship JC, et al; American College of Cardiology Foundation; American Heart Association Task Force on Practice Guidelines; Society for Cardiovascular Angiography and Interventions. 2011 ACCF/AHA/SCAI Guideline for Percutaneous Coronary Intervention. A report of the American College of Cardiology Foundation/American Heart Association Task Force on Practice Guidelines and the Society for Cardiovascular Angiography and Interventions. J Am Coll Cardiol 2011; 58:e44–e122.
- American College of Emergency Physicians; Society for Cardiovascular Angiography and Interventions; O’Gara PT, Kushner FG, Ascheim DD, et al. 2013 ACCF/AHA guideline for the management of ST-elevation myocardial infarction: executive summary: a report of the American College of Cardiology Foundation/American Heart Association Task Force on Practice Guidelines. J Am Coll Cardiol 2013; 61:485–510.
- Lewis HD, Davis JW, Archibald DG, et al. Protective effects of aspirin against acute myocardial infarction and death in men with unstable angina. Results of a Veterans Administration Cooperative Study. N Engl J Med 1983; 309:396–403.
- ISIS-2 (Second International Study of Infarct Survival) Collaborative Group. Randomised trial of intravenous streptokinase, oral aspirin, both, or neither among 17,187 cases of suspected acute myocardial infarction: ISIS-2. Lancet 1988; 2:349–360.
- Antithrombotic Trialists’ Collaboration. Collaborative meta-analysis of randomised trials of antiplatelet therapy for prevention of death, myocardial infarction, and stroke in high risk patients. BMJ 2002; 324:71–86.
- Sweeny JM, Gorog DA, Fuster V. Antiplatelet drug ‘resistance’. Part 1: mechanisms and clinical measurements. Nat Rev Cardiol 2009; 6:273–282.
- Kelly JP, Kaufman DW, Jurgelon JM, Sheehan J, Koff RS, Shapiro S. Risk of aspirin-associated major upper-gastrointestinal bleeding with enteric-coated or buffered product. Lancet 1996; 348:1413–1416.
- Grosser T, Fries S, Lawson JA, Kapoor SC, Grant GR, FitzGerald GA. Drug resistance and pseudoresistance: an unintended consequence of enteric coating aspirin. Circulation 2013; 127:377–385.
- US Food and Drug Administration (FDA). Concomitant use of ibuprofen and aspirin: potential for attenuation of the anti-platelet effect of aspirin. http://www.fda.gov/downloads/drugs/drugsafety/postmarketdrugsafetyinformationforpatientsandproviders/ucm161282.pdf. Accessed November 30, 2013.
- Patti G, Colonna G, Pasceri V, Pepe LL, Montinaro A, Di Sciascio G. Randomized trial of high loading dose of clopidogrel for reduction of periprocedural myocardial infarction in patients undergoing coronary intervention: results from the ARMYDA-2 (Antiplatelet therapy for Reduction of MYocardial Damage during Angioplasty) study. Circulation 2005; 111:2099–2106.
- Yusuf S, Zhao F, Mehta SR, Chrolavicius S, Tognoni G, Fox KK; Clopidogrel in Unstable Angina to Prevent Recurrent Events Trial Investigators. Effects of clopidogrel in addition to aspirin in patients with acute coronary syndromes without ST-segment elevation. N Engl J Med 2001; 345:494–502.
- Bavry AA, Lincoff AM. Is clopidogrel cardiovascular medicine’s double-edged sword? Circulation 2006; 113:1638–1640.
- Collet JP, Hulot JS, Anzaha G, et al; CLOVIS-2 Investigators. High doses of clopidogrel to overcome genetic resistance: the randomized crossover CLOVIS-2 (Clopidogrel and Response Variability Investigation Study 2). JACC Cardiovasc Interv 2011; 4:392–402.
- Hulot JS, Collet JP, Cayla G, et al. CYP2C19 but not PON1 genetic variants influence clopidogrel pharmacokinetics, pharmacodynamics, and clinical efficacy in post-myocardial infarction patients. Circ Cardiovasc Interv 2011; 4:422–428.
- Cuisset T, Quilici J, Cohen W, et al. Usefulness of high clopidogrel maintenance dose according to CYP2C19 genotypes in clopidogrel low responders undergoing coronary stenting for non ST elevation acute coronary syndrome. Am J Cardiol 2011; 108:760–765.
- US Food and Drug Administration (FDA). FDA reminder to avoid concomitant use of Plavix (clopidogrel) and omeprazole. http://www.fda.gov/Drugs/DrugSafety/ucm231161.htm. Accessed November 30, 2013.
- Goodman SG, Clare R, Pieper KS, et al; Platelet Inhibition and Patient Outcomes Trial Investigators. Association of proton pump inhibitor use on cardiovascular outcomes with clopidogrel and ticagrelor: insights from the platelet inhibition and patient outcomes trial. Circulation 2012; 125:978–986.
- Solomon S, Vacek JL. Reducing cardiac ischemic events in patients with ACS: prasugrel versus clopidogrel. Commentary. Postgrad Med 2010; 122:198–200.
- Wiviott SD, Braunwald E, McCabe CH, et al; TRITON-TIMI 38 Investigators. Prasugrel versus clopidogrel in patients with acute coronary syndromes. N Engl J Med 2007; 357:2001–2015.
- Roe MT, Armstrong PW, Fox KA, et al; TRILOGY ACS Investigators. Prasugrel versus clopidogrel for acute coronary syndromes without revascularization. N Engl J Med 2012; 367:1297–1309.
- Wallentin L, Becker RC, Budaj A, et al; PLATO Investigators. Ticagrelor versus clopidogrel in patients with acute coronary syndromes. N Engl J Med 2009; 361:1045–1057.
- Mahaffey KW, Wojdyla DM, Carroll K, et al; PLATO Investigators. Ticagrelor compared with clopidogrel by geographic region in the Platelet Inhibition and Patient Outcomes (PLATO) trial. Circulation 2011; 124:544–554.
- Verheugt FW. Beware of novel antiplatelet therapy in acute coronary syndrome patients with previous stroke. Circulation 2012; 125:2821–2823.
- Tricoci P, Newby LK, Hasselblad V, et al. Upstream use of small-molecule glycoprotein iib/iiia inhibitors in patients with non-ST-segment elevation acute coronary syndromes: a systematic overview of randomized clinical trials. Circ Cardiovasc Qual Outcomes 2011; 4:448–458.
- Kastrati A, Mehilli J, Neumann FJ, et al; Intracoronary Stenting and Antithrombotic: Regimen Rapid Early Action for Coronary Treatment 2 (ISAR-REACT 2) Trial Investigators. Abciximab in patients with acute coronary syndromes undergoing percutaneous coronary intervention after clopidogrel pretreatment: the ISAR-REACT 2 randomized trial. JAMA 2006; 295:1531–1538.
- Inhibition of platelet glycoprotein IIb/IIIa with eptifibatide in patients with acute coronary syndromes. The PURSUIT Trial Investigators. Platelet Glycoprotein IIb/IIIa in Unstable Angina: Receptor Suppression Using Integrilin Therapy. N Engl J Med 1998; 339:436–443.
- Stone GW, McLaurin BT, Cox DA, et al; ACUITY Investigators. Bivalirudin for patients with acute coronary syndromes. N Engl J Med 2006; 355:2203–2216.
- Oler A, Whooley MA, Oler J, Grady D. Adding heparin to aspirin reduces the incidence of myocardial infarction and death in patients with unstable angina. A meta-analysis. JAMA 1996; 276:811–815.
- Kastrati A, Neumann FJ, Schulz S, et al; ISAR-REACT 4 Trial Investigators. Abciximab and heparin versus bivalirudin for non-ST-elevation myocardial infarction. N Engl J Med 2011; 365:1980–1989.
- Stone GW, Witzenbichler B, Guagliumi G, et al; HORIZONS-AMI Trial Investigators. Bivalirudin during primary PCI in acute myocardial infarction. N Engl J Med 2008; 358:2218–2230.
- Aslam MS, Sundberg S, Sabri MN, Cooke D, Lakier JB. Pharmacokinetics of intravenous/subcutaneous enoxaparin in patients with acute coronary syndrome undergoing percutaneous coronary interventions. Catheter Cardiovasc Interv 2002; 57:187–190.
- Sanofi-Aventis US. Lovenox (enoxaparin sodium injection) product information. http://www.lovenox.com/hcp/clinical-data.aspx. Accessed December 1, 2013.
- de Lemos JA, Blazing MA, Wiviott SD, et al. Enoxaparin versus unfractionated heparin in patients treated with tirofiban, aspirin and an early conservative initial management strategy: results from the A phase of the A-to-Z trial. Eur Heart J 2004; 25:1688–1694.
- Murphy SA, Gibson CM, Morrow DA, et al. Efficacy and safety of the low-molecular weight heparin enoxaparin compared with unfractionated heparin across the acute coronary syndrome spectrum: a meta-analysis. Eur Heart J 2007; 28:2077–2086.
- Cohen M, Demers C, Gurfinkel EP, et al. A comparison of low-molecular-weight heparin with unfractionated heparin for unstable coronary artery disease. Efficacy and Safety of Subcutaneous Enoxaparin in Non-Q-Wave Coronary Events Study Group. N Engl J Med 1997; 337:447–452.
- Ferguson JJ, Califf RM, Antman EM, et al; SYNERGY Trial Investigators. Enoxaparin vs unfractionated heparin in high-risk patients with non-ST-segment elevation acute coronary syndromes managed with an intended early invasive strategy: primary results of the SYNERGY randomized trial. JAMA 2004; 292:45–54.
- Antman EM, Morrow DA, McCabe CH, et al; ExTRACT-TIMI 25 Investigators. Enoxaparin versus unfractionated heparin with fibrinolysis for ST-elevation myocardial infarction. N Engl J Med 2006; 354:1477–1488.
- Montalescot G, Zeymer U, Silvain J, et al; ATOLL Investigators. Intravenous enoxaparin or unfractionated heparin in primary percutaneous coronary intervention for ST-elevation myocardial infarction: the international randomised open-label ATOLL trial. Lancet 2011; 378:693–703.
- Yusuf S, Mehta SR, Chrolavicius S, et al; Fifth Organization to Assess Strategies in Acute Ischemic Syndromes Investigators. Comparison of fondaparinux and enoxaparin in acute coronary syndromes. N Engl J Med 2006; 354:1464–1476.
- Yusuf S, Mehta SR, Chrolavicius S, et al; OASIS-6 Trial Group. Effects of fondaparinux on mortality and reinfarction in patients with acute ST-segment elevation myocardial infarction: the OASIS-6 randomized trial. JAMA 2006; 295:1519–1530.
- Hurlen M, Abdelnoor M, Smith P, Erikssen J, Arnesen H. Warfarin, aspirin, or both after myocardial infarction. N Engl J Med 2002; 347:969–974.
- Coumadin Aspirin Reinfarction Study (CARS) Investigators. Randomised double-blind trial of fixed low-dose warfarin with aspirin after myocardial infarction. Lancet 1997; 350:389–396.
- Fiore LD, Ezekowitz MD, Brophy MT, Lu D, Sacco J, Peduzzi P; Combination Hemotherapy and Mortality Prevention (CHAMP) Study Group. Department of Veterans Affairs Cooperative Studies Program Clinical Trial comparing combined warfarin and aspirin with aspirin alone in survivors of acute myocardial infarction: primary results of the CHAMP study. Circulation 2002; 105:557–563.
- Mega JL, Braunwald E, Wiviott SD, et al; ATLAS ACS 2–TIMI 51 Investigators. Rivaroxaban in patients with a recent acute coronary syndrome. N Engl J Med 2012; 366:9–19.
- Alexander JH, Lopes RD, James S, et al; APPRAISE-2 Investigators. Apixaban with antiplatelet therapy after acute coronary syndrome. N Engl J Med 2011; 365:699–708.
- Oldgren J, Budaj A, Granger CB, et al; RE-DEEM Investigators. Dabigatran vs placebo in patients with acute coronary syndromes on dual antiplatelet therapy: a randomized, double-blind, phase II trial. Eur Heart J 2011; 32:2781–2789.
- Steg PG, Huber K, Andreotti F, et al. Bleeding in acute coronary syndromes and percutaneous coronary interventions: position paper by the Working Group on Thrombosis of the European Society of Cardiology. Eur Heart J 2011; 32:1854–1864.
- Giugliano RP, Braunwald E. The year in non-ST-segment elevation acute coronary syndrome. J Am Coll Cardiol 2012; 60:2127–039.
- Rao SV, Ou FS, Wang TY, et al. Trends in the prevalence and outcomes of radial and femoral approaches to percutaneous coronary intervention: a report from the National Cardiovascular Data Registry. JACC Cardiovasc Interv 2008; 1:379–386.
KEY POINTS
- Although antiplatelet and anticoagulant drugs reduce the risk of ischemic events, including coronary death, they also increase the risk of bleeding, reducing their net benefit. But the risk of bleeding can be managed.
- All patients experiencing an ACS should receive a single dose of aspirin 325 mg and should be instructed to chew it; this should be followed by 81 mg daily.
- Patients who are not expected to undergo coronary artery bypass grafting on an urgent basis should also receive clopidogrel, prasugrel, or ticagrelor.
- Glycoprotein IIb/IIIa inhibitors are being used less now than in the past.
- The use of unfractionated heparin is being challenged by newer parenteral anticoagulants, ie, bivalirudin, enoxaparin, and fondaparinux.
- The role of oral anticoagulants (warfarin, rivaroxaban, apixaban, and dabigatran) in ACS is uncertain.

Clinical update in sexually transmitted diseases 2014
With nearly 20 million new infections annually, sexually transmitted diseases (STDs) are very common in the United States.1,2 And with recent changes to the national health care landscape, including the passage of the Affordable Care Act and state budget cuts resulting in the closure of STD and human immunodeficiency virus (HIV) clinics, primary care providers can expect to encounter more patients with STDs.
For women and infants, STDs can have serious and long-term consequences, including infertility, facilitation of HIV infection, reproductive tract cancer, pelvic inflammatory disease, and poor perinatal outcomes.2 STDs cost the US health care system nearly $16 billion every year.3
STD prevention and control strategies traditionally include surveillance, screening, behavioral interventions, treatment, and partner management.4 This paper will review patient management by syndrome and provide guidance to clinicians to facilitate timely diagnosis and treatment, important components of any effective STD prevention strategy.
ANYONE CAN HAVE AN STD
STDs affect people of all races, ages, and sexual orientations. That said, some groups are at greater risk:
Adolescents and young adults. Persons ages 15 through 24 represent 25% of the sexually experienced population in the United States but account for nearly half of all incident STDs.1
Racial and ethnic minorities. STD disparities are one of the five greatest health disparities for African American communities.4
Men who have sex with men number approximately 2% to 4% of the US male population, yet account for approximately 70% of reported cases of primary and secondary syphilis and more than 50% of persons with HIV infection.3,5,6
HIGH-RISK BEHAVIOR AND SCREENING
A thorough sexual history will reveal behaviors that place a person at risk of infection. The US Preventive Services Task Force (USPSTF) defines high-risk sexual behavior as having multiple current partners, having a new partner, using condoms inconsistently, having sex while under the influence of alcohol or drugs, or exchanging sex for money or drugs.7
An effective strategy for obtaining a sexual history is the “five Ps”8:
- Partners (eg, Do you have sex with men, women, or both?)
- Prevention of pregnancy (eg, What are you doing to prevent pregnancy?)
- Protection from STDs (eg, What do you do to protect yourself from STDs?)
- Practices (eg, To understand your risks for STDs, I need to understand the kind of sex you have had recently.)
- Past history of STDs (eg, Have you ever had an STD?).8
The USPSTF and the US Centers for Disease Control and Prevention (CDC) recommend certain populations be screened for STDs.7,8
Everyone age 13 through 64 should be tested for HIV at least once, per CDC recommendation.8
Sexually active females up to age 24 should routinely be screened for chlamydia every year.7,8
Nonpregnant women at higher risk of infection should be screened for gonorrhea and syphilis.
Pregnant women, regardless of risk, should be screened for chlamydia, hepatitis B, HIV, and syphilis; pregnant women at higher risk of infection should also be screened for gonorrhea and hepatitis C.7,9
Men should be screened for HIV, and men at higher risk should also be screened for syphilis.8
Men who have sex with men should be screened at least annually for HIV and syphilis and undergo a test for urethral chlamydia and gonorrhea infection. Men who participate in receptive anal intercourse should be tested for rectal chlamydia and gonorrhea and, in those who participate in oral intercourse, for pharyngeal gonorrhea.8
PREVENTION
Vaccination against HPV, hepatitis A and B
Preexposure vaccination is one of the most effective ways to prevent human papillomavirus (HPV), hepatitis A, and hepatitis B infection.10
HPV vaccination. The Advisory Committee on Immunization Practices recommends routine HPV vaccination of female patients at age 11 or 12, or through age 26 if not previously vaccinated.11,12 Routine vaccination is also recommended for males at age 11 or 12 and through age 21, if not previously vaccinated.12 The upper age is extended through age 26 for men who have sex with men and for immunocompromised patients.12
Two HPV vaccines are available for females; one is quadrivalent and the other is bivalent. Both protect against two HPV types that cause cervical and other HPV-associated cancers.11 The quadrivalent vaccine also protects against the two types that cause 90% of genital warts.13 Only the quadrivalent vaccine is licensed for use in males.12
Hepatitis A and B vaccination. Hepatitis B vaccination is recommended for all unvaccinated, uninfected patients being evaluated for an STD.8,14
Vaccinating for hepatitis A and hepatitis B is important for men who have sex with men, who have a higher risk of acquiring and transmitting these infections.15
Other preventive practices
Male circumcision has been shown to reduce the risk of HIV infection, high-risk genital HPV infection, and genital herpes in heterosexual men.10,16,17
Male condoms, when used consistently and correctly, can reduce the risk of chlamydia, gonorrhea, and trichomoniasis.8 The risk of transmission of syphilis, genital HPV, and genital herpes can also be reduced by correctly and consistently using condoms when the infected area of exposure is covered.8
Microbiocides not recommended. Topical microbiocides do not have not enough evidence to recommend them for STD prevention. However, limited data suggest that tenofovir 1% vaginal gel may reduce the risk of acquiring genital herpes simplex virus type 2 (HSV-2) infection in women.18,19
GENITAL ULCERATIVE DISEASE: HERPES, SYPHILIS, OTHERS
The risk of acquiring HIV is two to five times higher if one is exposed to it when a genital ulcerative disease is present.20,21
In the United States, most cases of genital, anal, or perianal ulcers in sexually active persons are due to genital herpes or syphilis.8 Other causes include chancroid, granuloma inguinale, lymphogranuloma venereum, and noninfectious causes.
Although the frequency of these conditions varies by geographic area and demographic profile, herpes is the most prevalent of them.8 HSV-2 infection is one of the most prevalent STDs in the United States, with approximately 17% of all adolescents and adults infected,1,22 and a much higher prevalence in persons who use drugs.23
A thorough medical history and physical examination should be conducted. In addition, an accurate diagnosis requires specific tests: syphilis serology, dark field microscopy (if available), and culture or polymerase chain reaction (PCR) testing for herpes.8 A positive serologic test for HSV-1 or HSV-2 is enough to make the diagnosis in a patient whose symptoms suggest herpes, even if PCR and culture are negative.
GENITAL HERPES: MOSTLY ASYMPTOMATIC
Genital herpes is caused by HSV-1 or HSV-2. Of these, HSV-1 is on the rise, causing an increasing proportion of first episodes of genital herpes in some populations. It may now account for most new genital herpes infections in young women and in men who have sex with men.8,24
Most people infected with HSV-1 or HSV-2 have no symptoms or have subclinical disease. When symptoms do occur, one or more vesicles may appear on or around the genitals, rectum, or mouth. The average incubation period after exposure is 4 days (range 2–12).25 The first episode of genital herpes is often associated with systemic symptoms (eg, fever, headache, myalgia, and malaise) and local symptoms (eg, dysuria, vaginal or urethral discharge, and inguinal adenopathy).26,27
Genital herpes often recurs, especially during the first year. Recurrences are less frequent with HSV-1 than with HSV-2.
Diagnosing genital herpes requires laboratory testing
Diagnosing genital herpes by clinical signs and symptoms is both insensitive and nonspecific. Therefore, laboratory testing should be performed for patients who present with genital ulcerative disease.
Virologic tests. Viral culture and nucleic acid amplification methods, including PCR assays, are the preferred virologic tests for herpes.8 Although viral culture is widely available, its sensitivity depends on the stage of the lesion and rapidly declines as lesions begin to heal. PCR assays are more sensitive than viral culture, can be done in automated systems, and are increasingly being used in clinical settings.26 However, if the patient has no active lesions at the time of testing, failure to detect herpes by culture or PCR does not guarantee that the patient is not infected, as viral shedding is intermittent.
Serologic tests. Type-specific antibodies to HSV develop during the first several weeks following infection and persist indefinitely. Providers should specifically request serologic type-specific immunoglobulin G (IgG) assays. IgM testing for HSV should not be used, as IgM testing is not type-specific. Moreover, although some clinicians believe IgM is a good test for early infection because levels rise early and then decline, IgM may be positive during recurrent episodes.8
Both laboratory-based assays and point-of-care tests for HSV-2 are available. They are performed on capillary blood or serum and have sensitivities that range from 80% to 100% and specificities greater than 96%, compared with HSV-2 immunoblot and Western blot testing as the standard.28,29
False-negative results may be more frequent in the early stages of infection. HSV-2 antibody indicates anogenital infection, while HSV-1 antibody might also be due to orolabial infection, which is something to keep in mind in a patient without genital symptoms.8
Treatment can control herpes but not eradicate it
Several herpes vaccines have undergone clinical trials, but an effective one remains elusive.30,31
Antiviral therapy is used to control signs and symptoms of clinical disease but does not eradicate latent virus. For initial clinical episodes of genital herpes, the CDC recommends acyclovir, valacyclovir, or famciclovir for 7 to 10 days.8 In patients with established genital herpes, daily suppressive antiviral therapy can reduce recurrences, subclinical shedding, and the likelihood of transmission to partners; famciclovir is somewhat less efficacious for suppressing viral shedding.8
A diagnosis of herpes can carry considerable stigma, which can substantially interfere with a patient’s current and future relationships.25,32,33 Sex partners of patients with genital herpes may benefit from evaluation and counseling. Clinicians should appreciate the psychological impact of a genital herpes diagnosis and address these concerns by providing education, counseling, and support while encouraging patients to recognize that herpes is a manageable condition.34
SYPHILIS IS INCREASING IN MEN WHO HAVE SEX WITH MEN
Since 2001, rates of syphilis, a systemic disease caused by Treponema pallidum, have been increasing in men who have sex with men.3,35 As of 2011, this group accounts for approximately 72% of all cases of primary and secondary syphilis in the United States.3
Primary syphilis is characterized by a firm, painless chancre at the site of inoculation. The chancre lasts 3 to 6 weeks and heals regardless of treatment. However, if the infected person does not receive adequate treatment, the infection progresses to the secondary stage.26
Secondary syphilis typically starts with a nonpruritic rash, usually macular or papular, on the trunk and extremities, classically including the palms and soles. Other symptoms may include alopecia, lymphadenopathy, condylomata, and systemic symptoms.
Without treatment, the infection can progress to latent syphilis, which is further categorized as early (acquired during the preceding year), late latent, or of unknown duration.26
Practical diagnosis of syphilis relies on serologic testing
Definitive diagnosis of early syphilis requires dark field microscopy or PCR to detect T pallidum in lesion exudate or tissue.8 However, because there are no commercially available tests for T pallidum, serologic testing is the mainstay.
Two types of serologic tests must be performed to diagnose syphilis: a nontreponemal test and a treponemal test.8
Nontreponemal tests:
- The Venereal Disease Research Laboratory (VDRL) test
- The rapid plasma reagin (RPR) test.
Treponemal tests:
- T pallidum passive particle agglutination (TP-PA) assay
- Fluorescent treponemal antibody absorbed (FTA-ABS) test
- Enzyme immunoassay (EIA)
- Chemiluminescence immunoassay (CIA).
Using only one type of serologic test is in-sufficient for diagnosis because each type has limitations, including the possibility of false-positive results.
Nontreponemal test results may correlate with disease activity, and results should be reported quantitatively; a fourfold change in titer, equivalent to a change of two dilutions, is needed to demonstrate a clinically significant difference between two nontreponemal test results using the same serologic test.8
Which order of testing for syphilis is best?
The CDC recommends that nontreponemal tests be used to screen for syphilis and treponemal tests be used to confirm the diagnosis.36 This traditional algorithm performs well in identifying persons with active infection who require further evaluation and treatment, while minimizing false-positive results in low-prevalence populations.
However, some clinical laboratories have adopted the reverse sequence, using treponemal tests (usually an EIA or a CIA) to screen for syphilis, followed by a nontreponemal test to confirm active infection.36–38 This reverse-sequence testing may result in overdiagnosis and overtreatment of syphilis in some clinical settings.37 When reverse-sequence syphilis screening is used, the CDC recommends reflexively testing all sera that produce reactive EIA or CIA results with a quantitative nontreponemal test and reflexively testing sera with discordant results (ie, a reactive EIA or CIA and a nonreactive RPR or VDRL test) with a different treponemal test.36
Traditionally, the FTA-ABS test had been considered the gold standard treponemal test; however, it has lower specificity than other treponemal tests. Accordingly, TP-PA is the recommended confirmatory treponemal test.8,39 False-negative results, although rare, may occur for biological or technical reasons, such as the prozone phenomenon, resulting in a missed diagnosis. The prozone phenomenon occurs when the antibody titer is high and antigen binding sites are saturated, preventing the cross-linking reaction between antigens and antibodies. In this instance, when syphilis is suspected clinically and the RPR assay is nonreactive, the clinician can request RPR testing at dilutions of sera, ie, diluting the patient’s serum to bring the antibody concentration into the zone equivalence.40
Suspect neurosyphilis if neurologic symptoms arise
Central nervous system involvement can occur at any stage of syphilis. If clinical evidence of neurologic involvement (meningitis, stroke, cranial nerve dysfunction, or auditory or ophthalmic abnormalities) is observed in any patient with syphilis, regardless of stage, a cerebrospinal fluid examination should be performed.8 Laboratory testing can support the diagnosis of neurosyphilis; however, no single laboratory test can be used to diagnose it.
Cerebrospinal fluid abnormalities (ie, mononuclear pleocytosis, increased protein) are common in patients with early syphilis even in the absence of clinical neurologic findings. There is no firm evidence to support diverging from recommended treatment for early syphilis in these patients.35
Cerebrospinal fluid examination is recommended for all patients with serologic evidence of syphilis infection and neurologic symptoms and for patients who do not achieve an adequate serologic decline with stage-appropriate treatment.8
Penicillin is still the mainstay of syphilis treatment
Penicillin is still the mainstay of syphilis treatment.
- Patients with early syphilis (primary, secondary, or early latent) should receive a single intramuscular dose of benzathine penicillin G (2.4 million units).8,35
- Patients with late latent syphilis should receive three intramuscular doses of benzathine penicillin G (2.4 million units each) at 1-week intervals.
- Neurosyphilis should be treated with aqueous crystalline penicillin G 18 to 24 million units daily for 10 to 14 days.8
Doxycycline is the preferred alternative in nonpregnant patients who are allergic to penicillin. The dosage is 100 mg orally twice a day for 14 days (for primary, secondary, or early latent infections) or for 28 days (for late latent infections or those of unknown duration).35,41
Ceftriaxone (1–2 g daily) may be effective for treating early syphilis. However, data are limited, and the optimal dose and duration of therapy are not defined.8,42
Azithromycin in a single 2-g oral dose is effective for treating early syphilis. However, T pallidum chromosomal mutations associated with macrolide resistance are being detected.35,43 In view of this, azithromycin should not be used in men who have sex with men or in pregnant women.
Follow-up of syphilis patients and partners
Close clinical and serologic follow-up is strongly advised in persons who receive an alternate regimen to evaluate for treatment failure.8
Sex partners of patients with primary syphilis should be considered at risk and given treatment if they had sexual contact with the patient within 3 months plus the duration of symptoms, within 6 months plus the duration of symptoms for those with secondary syphilis, or 1 year for patients with early latent syphilis.8
Serologic and clinical evaluation should be repeated at 6, 12, and 24 months after treatment. HIV-infected patients should receive closer follow-up, ie, at 3, 6, 9, 12, and 24 months. The same quantitative nontreponemal serologic test should be used at each visit, with at least a fourfold decrease in titer representing an appropriate serologic decline.
Failure to achieve an appropriate serologic decline in 6 to 12 months may represent treatment failure.8 Optimal management in this instance is unclear; at a minimum, additional clinical and serologic follow-up should be performed.8 If additional follow-up cannot be ensured, retreatment (weekly intramuscular injections of benzathine penicillin G 2.4 million units for 3 weeks) is recommended. Cerebrospinal fluid examination can be considered to exclude unrecognized neurosyphilis.8
URETHRITIS: GONORRHEA, CHLAMYDIA TOP THE LIST
Symptoms of urethritis can include dysuria, discharge (purulent or mucopurulent), and urethral pruritus.26 However, asymptomatic infections are common.8
Several organisms are associated with infectious urethritis, including26:
- Neisseria gonorrhoeae
- Chlamydia trachomatis
- Mycoplasma genitalium
- Trichomonas vaginalis
- Ureaplasma urealyticum.
Diagnosing urethritis: Try to identify the agent
The clinician should attempt to obtain objective evidence of urethral inflammation. Urethral discharge should be examined with microscopy using Gram stain or methylene blue, or a first-void urine sample should be tested with microscopy and leukocyte esterase.26 If clinic-based diagnostic testing is not available, testing for N gonorrhoeae and C trachomatis using nucleic acid amplification can identify additional infections.8
During the clinic visit, either Gram-stain microscopy of a urethral swab or microscopic examination of a first-catch urine sample may identify the causative agent. If gram-negative intracellular diplococci are seen on urethral smear, gonorrhea infection is diagnosed. Nongonococcal urethritis is diagnosed when microscopy or urinalysis displays evidence of inflammation (positive leukocyte esterase or at least 10 white blood cells per high-power field) without gram-negative intracellular diplococci.8
Testing should be performed to determine the specific cause of urethritis, because both chlamydia and gonorrhea are reportable diseases. Nucleic acid amplification tests are the most sensitive tests for C trachomatis and N gonorrhoeae and can be performed on urethral swabs or urine.44 If clinic-based diagnostic tools are unavailable, patients should receive empiric treatment for chlamydia and gonorrhea.8
Treatment of urethritis, by organism
Urethral gonorrhea should be treated with dual therapy: ceftriaxone 250 mg in a single intramuscular dose and either azithromycin 1 g orally as a single dose or doxycycline 100 mg orally twice a day for 7 days. Oral cephalosporins are no longer recommended as first-line treatment of gonorrhea.45
Chlamydial urethritis is treated with azithromycin 1 g in a single oral dose or doxycycline 100 mg orally twice a day for 7 days. Although azithromycin provides the advantages of a single-dose regimen administered and directly observed by the provider, some evidence suggests that doxycycline may be more effective than azithromycin for symptomatic chlamydial urethritis.46
All sex partners within the preceding 60 days should be referred for evaluation, testing, and empiric treatment with a drug regimen effective against chlamydia (if nongonococcal urethritis or only C trachomatis was identified) and gonorrhea (if N gonorrhoeae was identified). When patients diagnosed with chlamydia or gonorrhea indicate that their partners are unlikely to seek evaluation, providers can offer patient-delivered partner therapy, a form of expedited partner therapy in which partners of infected persons are treated without previous medical evaluation. Providers should visit www.cdc.gov/std/ept for updated information for their individual jurisdiction, as expedited partner therapy is prohibited in some states. No studies have been published involving patient-delivered partner therapy for chlamydia or gonorrhea in men who have sex with men.8
Patients with recurrent or persistent urethritis can be retreated with the initial regimen if they did not comply with treatment or were reexposed to an untreated sex partner. However, persistent urethritis after doxycycline therapy may suggest the presence of doxycycline-resistant M genitalium or U urealyticum. T vaginalis may also cause urethritis in men. Diagnostic evaluation may include culture or nucleic acid amplification testing of a urethral swab or urine (ie, PCR [Amplicor] or transcription-mediated amplification).8
M genitalium or U urealyticum urethritis. Currently, no commercially available diagnostic test exists for M genitalium or U urealyticum, so clinicians must choose a treatment regimen on the basis of objective evidence of inflammation in the absence of an etiologic agent. If azithromycin was not given during the initial course, metronidazole 2 g orally or tinidazole 2 g orally in a single dose plus azithromycin 1 g orally should be considered.8
M genitalium is one of the most common pathogens in men with persistent urethritis, accounting for 15% to 25% of cases. Several studies have shown that moxifloxacin 400 mg orally daily for 7 days is effective against M genitalium.46–48 Therefore, men for whom an initial regimen of azithromycin fails should be retreated with moxifloxacin 400 mg orally once daily for 7 days.
If men require treatment with a new antibiotic regimen for persistent urethritis and a sexually transmitted agent is the suspected cause, all partners in the past 60 days before the initial diagnosis and any interim partners should be referred for evaluation and appropriate treatment.
CERVICITIS: CHLAMYDIA, GONORRHEA, OTHERS
Cervicitis is frequently asymptomatic, but signs on pelvic examination may include purulent or mucopurulent endocervical exudate and sustained endocervical bleeding easily induced by passage of a cotton swab through the cervical os.26
In most cases, the pathogen cannot be identified.49 When an organism is isolated, it is typically C trachomatis or N gonorrhoeae. Others that may cause cervicitis include the organisms responsible for bacterial vaginosis, T vaginalis, HSV, and possibly M genitalium.50
Diagnostic workup for cervicitis
Diagnostic workup for cervicitis should include microscopic evaluation of an endocervical specimen and testing for C trachomatis and N gonorrhoeae. A finding of leukorrhea (> 10 white blood cells per high-power field on microscopic examination of vaginal fluid) has been associated with chlamydial and gonococcal infection of the cervix.8 In the absence of inflammatory vaginitis, leukorrhea might be a sensitive indicator of cervical inflammation, with a high negative predictive value.
Nucleic acid amplification testing for C trachomatis and N gonorrhoeae can be performed on urine, endocervical, or vaginal swab specimens collected by the clinician or self-collected.51 The performance of C trachomatis nucleic acid amplification testing on patient-collected vaginal swab specimens has similar sensitivity and specificity to those performed on cervical and first-void urine samples.26,44,52
Women with cervicitis also should be evaluated for bacterial vaginosis and trichomoniasis, and if the organisms that cause these conditions are detected, treatment is advised. Microscopy has a low sensitivity (approximately 50%) for detecting T vaginalis; if the organism is not identified, further testing such as culture may be performed to exclude it as the pathogen.
Women with cervicitis should also be evaluated for clinical signs of pelvic inflammatory disease, including uterine, adnexal, and cervical motion tenderness, and fever.
Cervicitis can be treated presumptively
Women with cervicitis who should receive presumptive therapy include those at higher risk of chlamydial infection (ie, those with new or multiple sex partners, those age 25 or younger, and those who engage in unprotected intercourse, especially if follow-up cannot be ensured).8
Recommended therapy is either azithromycin 1 g orally in a single dose or doxycycline 100 mg orally twice a day for 7 days. The clinician should consider dual therapy to cover gonorrhea if the prevalence of gonorrhea is more than 5% (ie, in younger patients).8 If bacterial vaginosis or T vaginalis infection is diagnosed, these conditions should be treated at the time of clinical evaluation (see vaginitis section for more detail). For women in whom presumptive therapy is deferred, the results of diagnostic testing should guide appropriate treatment.
Repeat testing 3 to 6 months after treatment is recommended for all women diagnosed with chlamydia or gonorrhea,53 and all sex partners in the past 60 days should be referred for evaluation and receive treatment for the STDs for which the index patient received treatment. In states where it is allowed, patient-delivered partner therapy should be considered if the patient indicates her partner is unlikely to seek medical evaluation.
VAGINITIS: NOT JUST YEAST
Women with vaginitis may present with complaints of discharge, pruritus, or a bad vaginal odor. A careful medical history, including information on sexual behaviors and vaginal hygiene practices (ie, douching), should be conducted in addition to physical examination and diagnostic testing.
The most common conditions associated with vaginitis are bacterial vaginosis, trichomoniasis, and candidiasis. However, vulvovaginal candidiasis, most often caused by Candida albicans, is not transmitted sexually and will not be reviewed further here. Although bacterial vaginosis is associated with known risk factors for STDs (eg, new or multiple sex partners), the cause of the microbial alteration that precipitates it is not known.44 Co-infection with T vaginalis is extremely common.54
BACTERIAL VAGINOSIS: VERY COMMON
Bacterial vaginosis is the most common genital infection in reproductive-age women.55 It is a polymicrobial syndrome in which anaerobic bacteria (Prevotella and Mobiluncus species), Gardnerella vaginalis, Ureaplasma, and Mycoplasma replace the normal vaginal flora.
Diagnosis of bacterial vaginosis
Bacterial vaginosis can be diagnosed by clinical criteria or Gram staining. Clinical diagnosis requires three of the following clinical criteria proposed by Amsel et al56:
- Clue cells
- Vaginal fluid pH > 4.5
- Fishy odor before or after addition of 10% potassium hydroxide
- Thin, homogeneous, white discharge that smoothly coats the vaginal walls.
The clinical utility of PCR for diagnosing G vaginalis remains unclear, and culture is not recommended because it has low specificity. Gram staining can be used to determine the concentration of lactobacilli, small gram-negative or variable rods (G vaginalis and anaerobic rods), and curved gram-negative rods (ie, Mobiluncus species).
Treatment of bacterial vaginosis: Metronidazole or clindamycin
Treatment is recommended to relieve vaginal symptoms, with the potential benefit of reducing the risk of acquiring chlamydia, gonorrhea, and HIV and other viral STDs.8
Recommended treatment is with metronidazole 500 mg orally twice a day for 7 days, metronidazole gel 0.75% vaginal suppository once a day for 5 days, or clindamycin cream 2% vaginal suppository once a day for 7 days.44 A meta-analysis of several trials found that clindamycin and metronidazole have equivalent effectiveness for eradicating bacterial vaginosis symptoms.57 Accordingly, providers can consider patient preference, co-infections, and possible side effects when selecting a regimen. Alternative regimens include tinidazole or clindamycin orally or in vaginal ovules.
Women should be advised to refrain from sexual intercourse during treatment. Routine treatment of male or female sexual partners is not warranted.
Bacterial vaginosis commonly recurs, and limited data exist regarding optimal management of recurrences. Using a different treatment regimen may be an option in patients who have a recurrence; however, re-treatment with the same topical regimen is an acceptable approach for treating recurrent bacterial vaginosis during the early stages of infection.58 One study suggests that metronidazole for 7 days, followed by intravaginal boric acid for 21 days, and then, for those in remission, suppressive metronidazole gel for 16 weeks may be another option.59 For women with multiple recurrences, metronidazole gel twice weekly for 4 to 6 months has been shown to reduce recurrences, although its benefit may not persist after it is stopped. The therapeutic role for probiotics remains unclear.60
TRICHOMONIASIS: TREAT PARTNERS
Although most women with trichomoniasis have few or no symptoms, some have vaginal discharge that may be diffuse, malodorous, and yellow-greenish, and some have vulvar irritation.
Diagnosis of trichomoniasis: Microscopy is first-line but insensitive
The most common method for diagnosing T vaginalis infection remains microscopic evaluation of wet preparations of genital secretions, because of its convenience and relatively low cost. This may demonstrate the motile, flagellated protozoa T vaginalis and many white blood cells. Slides of vaginal fluid specimens should be examined immediately after collection to maximize performance. Unfortunately, the sensitivity of wet preparation is 44% to 80% in vaginal specimens.61
Culture is still considered the gold standard for diagnosing trichomoniasis and, if available, should be performed when direct microscopy is unrevealing.
Point-of-care diagnostic tests for T vaginalis infection include the OSOM Trichomonas Rapid Test (Sekisui Diagnostics, San Diego, CA), which is an immunochromatographic capillary flow dipstick test, and the Affirm VPIII (Becton, Dickinson and Company, Franklin Lakes, NJ), a nucleic acid probe-hydridization test that identifies T vaginalis, G vaginalis, and C albicans.44,62 Liquid-based Pap tests may demonstrate T vaginalis, although they should not be performed exclusively for this purpose. Among women, nucleic acid amplification tests may detect a prevalence three to five times higher than indicated by wet mount microscopy. The APTIMA Trichomonas vaginalis assay (Hologic Gen-Probe, San Diego, CA) was the most sensitive test for trichomonas detection in this study.63
Extragenital testing with nucleic acid amplification tests is not recommended for T vaginalis, as it remains unclear if the rectum can serve as a reservoir for infection, and T vaginalis has not been found to infect oral sites.8
Treatment of trichomoniasis: Metronidazole or tinidazole
Nitroimidazoles, ie, metronidazole and tinidazole, are the only class of drugs available to treat trichomoniasis. The recommended regimen is metronidazole or tinidazole 2 g orally in a single dose. Studies suggest that tinidazole may be superior to metronidazole, with higher cure rates due to its longer half-life and higher tissue concentrations.64
Low-level metronidazole resistance is estimated to occur in 2% to 5% of trichomoniasis infections65; high-level resistance occurs rarely. If a single dose of metronidazole 2 g fails to cure the infection and reinfection is ruled out, the patient should be treated with metronidazole 500 mg orally twice a day for 7 days. If this regimen is not effective, providers can consider tinidazole or metronidazole 2 g orally for 7 days.44,62,64 Consultation and susceptibility testing for T vaginalis is available from the CDC if these alternative regimens are ineffective.
T vaginalis infection has a high rate of transmission to sexual partners,66 and all partners should be treated. Male sexual partners should be treated with metronidazole 500 mg twice a day orally for 7 days, tinidazole 2 g orally in a single dose, or tinidazole 500 mg twice a day for 7 days. Patient-delivered partner therapy may have a role in partner management for trichomoniasis.67
PROCTITIS: SUSPECT LYMPHOGRANULOMA VENEREUM
Acute proctitis in men and women who practice receptive anal intercourse is usually sexually acquired. The most common causative organisms are N gonorrhoeae, C trachomatis (serotypes associated with or not associated with lymphogranuloma venereum), and HSV; T pallidum is less common.68 Co-infections are not uncommon in this setting.69
Symptoms of proctitis may include anal discharge, rectal ulcers and bleeding, anorectal pain, tenesmus, and constipation. Patients with lymphogranuloma venereum may also present with tender, fluctuant inguinal or femoral lymphadenopathy (buboes), or herpetiform genital ulcers or papules.
Diagnosis of proctitis
Clinical evaluation should include digital rectal examination and anoscopy (if possible) to look for abnormalities such as ulcerations, hemorrhoids, anal fissures, condylomas, strictures, exudate, and bleeding.
Appropriate diagnostic testing includes Gram staining and culture of discharge, herpes viral culture or PCR, and nucleic acid amplification testing for chlamydia and gonorrhea (in laboratories with Clinical Laboratory Improvement Amendments validation).8
Nucleic acid amplification tests detect C trachomatis serotypes L1–L3, responsible for lymphogranuloma venereum, and non-lymphogranuloma venereum serotypes A–K, but cannot distinguish between the two, whereas PCR-based genotyping can.8,26 Although this distinction is important to ensure appropriate evaluation and management of sex partners, empiric treatment for lymphogranuloma venereum (doxycycline 100 mg orally twice a day for 21 days) should be provided to patients at high risk, including men who have sex with men and who have anorectal chlamydia, HIV infection, or bloody discharge and perianal or mucosal ulcers.8
Treatment of proctitis
Patients with painful perianal or mucosal ulceration should receive presumptive treatment for lymphogranuloma venereum and HSV while awaiting results of diagnostic testing. If rectal discharge is detected or Gram staining of anorectal secretions detects polymorphonuclear leukocytes, treatment should include ceftriaxone 250 mg intramuscularly and doxycycline 100 mg orally twice a day for 7 days.8 Additional testing for syphilis and HIV should also be performed.
All sexual partners should be evaluated for any disease diagnosed in the index patient.
- Satterwhite CL, Torrone E, Meites E, et al. Sexually transmitted infections among US women and men: prevalence and incidence estimates, 2008. Sex Transm Dis 2013; 40:187–193.
- Institute of Medicine (US); Committee on Prevention and Control of Sexually Transmitted Diseases. The hidden epidemic: confronting sexually transmitted diseases. Washington, DC: National Academy Press; 1997.
- Centers for Disease Control and Prevention (CDC). 2011 Sexually Transmitted Disease Surveillance. http://www.cdc.gov/std/stats11/toc.htm. Accessed January 10, 2014.
- Barrow RY, Newman LM, Douglas JM. Taking positive steps to address STD disparities for African-American communities. Sex Transm Dis 2008; 35(suppl 12):S1–S3.
- Mitchell JW, Petroll AE. Patterns of HIV and sexually transmitted infection testing among men who have sex with men couples in the United States. Sex Transm Dis 2012; 39:871–876.
- Centers for Disease Control and Prevention (CDC). HIV testing among men who have sex with men—21 cities, United States, 2008. MMWR Morb Mortal Wkly Rep 2011; 60:694–699.
- Meyers D, Wolff T, Gregory K, et al., USPSTF. USPSTF recommendations for STI screening. Am Fam Physician 2008; 77:819–824.
- Workowski KA, Berman S; Centers for Disease Control and Prevention (CDC). Sexually transmitted diseases treatment guidelines, 2010. MMWR Recomm Rep 2010; 59:1–110.
- Summaries for patients. Screening for chlamydial infection: recommendations from the US Preventive Services Task Force. Ann Intern Med 2007; 147:I44.
- Marrazzo JM, Cates W. Interventions to prevent sexually transmitted infections, including HIV infection. Clin Infect Dis 2011; 53(suppl 3):S64–S78.
- Markowitz LE, Dunne EF, Saraiya M, Lawson HW, Chesson H, Unger ER; Centers for Disease Control and Prevention (CDC); Advisory Committee on Immunization Practices (ACIP). Quadrivalent Human Papillomavirus Vaccine: Recommendations of the Advisory Committee on Immunization Practices (ACIP). MMWR Recomm Rep 2007; 56:1–24.
- Centers for Disease Control and Prevention (CDC). Recommendations on the use of quadrivalent human papillomavirus vaccine in males—Advisory Committee on Immunization Practices (ACIP), 2011. MMWR Morb Mortal Wkly Rep 2011; 60:1705–1708.
- Paavonen J, Jenkins D, Bosch FX, et al; HPV PATRICIA study group. Efficacy of a prophylactic adjuvanted bivalent L1 virus-like-particle vaccine against infection with human papillomavirus types 16 and 18 in young women: an interim analysis of a phase III double-blind, randomised controlled trial. Lancet 2007; 369:2161–2170.
- Mast EE, Weinbaum CM, Fiore AE, et al; Advisory Committee on Immunization Practices (ACIP); Centers for Disease Control and Prevention (CDC). A comprehensive immunization strategy to eliminate transmission of hepatitis B virus infection in the United States: recommendations of the Advisory Committee on Immunization Practices (ACIP) Part II: immunization of adults. MMWR Recomm Rep 2006; 55:1–33.
- Mayer KH. Sexually transmitted diseases in men who have sex with men. Clin Infect Dis 2011; 53(suppl 3):S79–S83.
- Tobian AA, Serwadda D, Quinn TC, et al. Male circumcision for the prevention of HSV-2 and HPV infections and syphilis. N Engl J Med 2009; 360:1298–1309.
- Auvert B, Sobngwi-Tambekou J, Cutler E, et al. Effect of male circumcision on the prevalence of high-risk human papillomavirus in young men: results of a randomized controlled trial conducted in Orange Farm, South Africa. J Infect Dis 2009; 199:14–19.
- Obiero J, Mwethera PG, Wiysonge CS. Topical microbicides for prevention of sexually transmitted infections. Cochrane Database Syst Rev 2012; 6:CD007961.
- Abdool Karim Q, Abdool Karim SS, Frohlich JA, et al; CAPRISA 004 Trial Group. Effectiveness and safety of tenofovir gel, an antiretroviral microbicide, for the prevention of HIV infection in women. Science 2010; 329:1168–1174.
- HIV prevention through early detection and treatment of other sexually transmitted diseases—United States. Recommendations of the Advisory Committee for HIV and STD prevention. MMWR Recomm Rep 1998; 47:1–24.
- Fleming DT, Wasserheit JN. From epidemiological synergy to public health policy and practice: the contribution of other sexually transmitted diseases to sexual transmission of HIV infection. Sex Transm Infect 1999; 75:3–17.
- Centers for Disease Control and Prevention (CDC). Seroprevalence of herpes simplex virus type 2 among persons aged 14–49 years—United States, 2005–2008. MMWR Morb Mortal Wkly Rep 2010; 59:456–459.
- Semaan S, Leinhos M, Neumann MS. Public health strategies for prevention and control of HSV-2 in persons who use drugs in the United States. Drug Alcohol Depend 2013; 131:182–197.
- Bernstein DI, Bellamy AR, Hook EW, et al. Epidemiology, clinical presentation, and antibody response to primary infection with herpes simplex virus type 1 and type 2 in young women. Clin Infect Dis 2013; 56:344–351.
- Kimberlin DW, Rouse DJ. Clinical practice. Genital herpes. N Engl J Med 2004; 350:1970–1977.
- Sexually Transmitted Diseases. 4th ed. New York, NY: McGraw-Hill Professional Publishing; 2007.
- Johnston C, Magaret A, Selke S, Remington M, Corey L, Wald A. Herpes simplex virus viremia during primary genital infection. J Infect Dis 2008; 198:31–34.
- Laderman EI, Whitworth E, Dumaual E, et al. Rapid, sensitive, and specific lateral-flow immunochromatographic point-of-care device for detection of herpes simplex virus type 2-specific immunoglobulin G antibodies in serum and whole blood. Clin Vaccine Immunol 2008; 15:159–163.
- Philip SS, Ahrens K, Shayevich C, et al. Evaluation of a new point-of-care serologic assay for herpes simplex virus type 2 infection. Clin Infect Dis 2008; 47:e79–e82.
- Belshe RB, Leone PA, Bernstein DI, et al; Herpevac Trial for Women. Efficacy results of a trial of a herpes simplex vaccine. N Engl J Med 2012; 366:34–43.
- Stanberry LR, Spruance SL, Cunningham AL, et al; GlaxoSmithKline Herpes Vaccine Efficacy Study Group. Glycoprotein-D-adjuvant vaccine to prevent genital herpes. N Engl J Med 2002; 347:1652–1661.
- Mark H, Gilbert L, Nanda J. Psychosocial well-being and quality of life among women newly diagnosed with genital herpes. J Obstet Gynecol Neonatal Nurs 2009; 38:320–326.
- Gilbert LK, Omisore F. Common questions about herpes: analysis of chat-room transcripts. Herpes 2009; 15:57–61.
- Alexander L, Naisbett B. Patient and physician partnerships in managing genital herpes. J Infect Dis 2002; 186(suppl 1):S57–S65.
- Ghanem KG, Workowski KA. Management of adult syphilis. Clin Infect Dis 2011; 53(suppl 3):S110–S128.
- Centers for Disease Control and Prevention (CDC). Discordant results from reverse sequence syphilis screening—five laboratories, United States, 2006–2010. MMWR Morb Mortal Wkly Rep 2011; 60:133–137.
- Centers for Disease Control and Prevention (CDC). Syphilis testing algorithms using treponemal tests for initial screening—four laboratories, New York City, 2005–2006. MMWR Morb Mortal Wkly Rep 2008; 57:872–875.
- Seña AC, White BL, Sparling PF. Novel Treponema pallidum serologic tests: a paradigm shift in syphilis screening for the 21st century. Clin Infect Dis 2010; 51:700–708.
- Marangoni A, Sambri V, Storni E, D’Antuono A, Negosanti M, Cevenini R. Treponema pallidum surface immunofluorescence assay for serologic diagnosis of syphilis. Clin Diagn Lab Immunol 2000; 7:417–421.
- Post JJ, Khor C, Furner V, Smith DE, Whybin LR, Robertson PW. Case report and evaluation of the frequency of the prozone phenomenon in syphilis serology—an infrequent but important laboratory phenomenon. Sex Health 2012; 9:488–490.
- Ghanem KG, Erbelding EJ, Cheng WW, Rompalo AM. Doxycycline compared with benzathine penicillin for the treatment of early syphilis. Clin Infect Dis 2006; 42:e45–e49.
- Hook EW, Roddy RE, Handsfield HH. Ceftriaxone therapy for incubating and early syphilis. J Infect Dis 1988; 158:881–884.
- A2058G Prevalence Workgroup. Prevalence of the 23S rRNA A2058G point mutation and molecular subtypes in Treponema pallidum in the United States, 2007 to 2009. Sex Transm Dis 2012; 39:794–798.
- Workowski KA, Berman SM. Centers for Disease Control and Prevention Sexually Transmitted Disease Treatment Guidelines. Clin Infect Dis 2011; 53(suppl 3):S59–S63.
- Kirkcaldy RD, Bolan GA, Wasserheit JN. Cephalosporin-resistant gonorrhea in North America. JAMA 2013; 309:185–187.
- Seña AC, Lensing S, Rompalo A, et al. Chlamydia trachomatis, Mycoplasma genitalium, and Trichomonas vaginalis infections in men with nongonococcal urethritis: predictors and persistence after therapy. J Infect Dis 2012; 206:357–365.
- Manhart LE, Broad JM, Golden MR. Mycoplasma genitalium: should we treat and how? Clin Infect Dis 2011; 53(suppl 3):S129–S142.
- Jernberg E, Moghaddam A, Moi H. Azithromycin and moxifloxacin for microbiological cure of Mycoplasma genitalium infection: an open study. Int J STD AIDS 2008; 19:676–679.
- Taylor SN, Lensing S, Schwebke J, et al. Prevalence and treatment outcome of cervicitis of unknown etiology. Sex Transm Dis 2013; 40:379–385.
- Lusk MJ, Konecny P. Cervicitis: a review. Curr Opin Infect Dis 2008; 21:49–55.
- Geisler WM. Diagnosis and management of uncomplicated Chlamydia trachomatis infections in adolescents and adults: summary of evidence reviewed for the 2010 Centers for Disease Control and Prevention Sexually Transmitted Diseases Treatment Guidelines. Clin Infect Dis 2011; 53(suppl 3):S92–S98.
- Schachter J, Chernesky MA, Willis DE, et al. Vaginal swabs are the specimens of choice when screening for Chlamydia trachomatis and Neisseria gonorrhoeae: results from a multicenter evaluation of the APTIMA assays for both infections. Sex Transm Dis 2005; 32:725–728.
- Hosenfeld CB, Workowski KA, Berman S, et al. Repeat infection with Chlamydia and gonorrhea among females: a systematic review of the literature. Sex Transm Dis 2009; 36:478–489.
- Sobel JD, Subramanian C, Foxman B, Fairfax M, Gygax SE. Mixed vaginitis-more than coinfection and with therapeutic implications. Curr Infect Dis Rep 2013; 15:104–108.
- Taylor BD, Darville T, Haggerty CL. Does bacterial vaginosis cause pelvic inflammatory disease? Sex Transm Dis 2013; 40:117–122.
- Amsel R, Totten PA, Spiegel CA, Chen KC, Eschenbach D, Holmes KK. Nonspecific vaginitis. Diagnostic criteria and microbial and epidemiologic associations. Am J Med 1983; 74:14–22.
- Oduyebo OO, Anorlu RI, Ogunsola FT. The effects of antimicrobial therapy on bacterial vaginosis in non-pregnant women. Cochrane Database Syst Rev 2009; ( 3):CD006055.
- Bunge KE, Beigi RH, Meyn LA, Hillier SL. The efficacy of retreatment with the same medication for early treatment failure of bacterial vaginosis. Sex Transm Dis 2009; 36:711–713.
- Reichman O, Akins R, Sobel JD. Boric acid addition to suppressive antimicrobial therapy for recurrent bacterial vaginosis. Sex Transm Dis 2009; 36:732–734.
- Senok AC, Verstraelen H, Temmerman M, Botta GA. Probiotics for the treatment of bacterial vaginosis. Cochrane Database Syst Rev 2009; (4):CD006289.
- Nye MB, Schwebke JR, Body BA. Comparison of APTIMA Trichomonas vaginalis transcription-mediated amplification to wet mount microscopy, culture, and polymerase chain reaction for diagnosis of trichomoniasis in men and women. Am J Obstet Gynecol 2009; 200:188.e1–188.e7.
- Bachmann LH, Hobbs MM, Seña AC, et al. Trichomonas vaginalis genital infections: progress and challenges. Clin Infect Dis 2011; 53(suppl 3):S160–S172.
- Schwebke JR, Hobbs MM, Taylor SN, et al. Molecular testing for Trichomonas vaginalis in women: results from a prospective US clinical trial. J Clin Microbiol 2011; 49:4106–4111.
- Coleman JS, Gaydos CA, Witter F. Trichomonas vaginalis vaginitis in obstetrics and gynecology practice: new concepts and controversies. Obstet Gynecol Surv 2013; 68:43–50.
- Kirkcaldy RD, Augostini P, Asbel LE, et al. Trichomonas vaginalis antimicrobial drug resistance in 6 US cities, STD Surveillance Network, 2009–2010. Emerg Infect Dis 2012; 18:939–943.
- Hoots BE, Peterman TA, Torrone EA, Weinstock H, Meites E, Bolan GA. A Trich-y question: should Trichomonas vaginalis infection be reportable? Sex Transm Dis 2013; 40:113–116.
- Schwebke JR, Desmond RA. A randomized controlled trial of partner notification methods for prevention of trichomoniasis in women. Sex Transm Dis 2010; 37:392–396.
- Studemeister A. Cytomegalovirus proctitis: a rare and disregarded sexually transmitted disease. Sex Transm Dis 2011; 38:876–878.
- Hoentjen F, Rubin DT. Infectious proctitis: when to suspect it is not inflammatory bowel disease. Dig Dis Sci 2012; 57:269–273.
With nearly 20 million new infections annually, sexually transmitted diseases (STDs) are very common in the United States.1,2 And with recent changes to the national health care landscape, including the passage of the Affordable Care Act and state budget cuts resulting in the closure of STD and human immunodeficiency virus (HIV) clinics, primary care providers can expect to encounter more patients with STDs.
For women and infants, STDs can have serious and long-term consequences, including infertility, facilitation of HIV infection, reproductive tract cancer, pelvic inflammatory disease, and poor perinatal outcomes.2 STDs cost the US health care system nearly $16 billion every year.3
STD prevention and control strategies traditionally include surveillance, screening, behavioral interventions, treatment, and partner management.4 This paper will review patient management by syndrome and provide guidance to clinicians to facilitate timely diagnosis and treatment, important components of any effective STD prevention strategy.
ANYONE CAN HAVE AN STD
STDs affect people of all races, ages, and sexual orientations. That said, some groups are at greater risk:
Adolescents and young adults. Persons ages 15 through 24 represent 25% of the sexually experienced population in the United States but account for nearly half of all incident STDs.1
Racial and ethnic minorities. STD disparities are one of the five greatest health disparities for African American communities.4
Men who have sex with men number approximately 2% to 4% of the US male population, yet account for approximately 70% of reported cases of primary and secondary syphilis and more than 50% of persons with HIV infection.3,5,6
HIGH-RISK BEHAVIOR AND SCREENING
A thorough sexual history will reveal behaviors that place a person at risk of infection. The US Preventive Services Task Force (USPSTF) defines high-risk sexual behavior as having multiple current partners, having a new partner, using condoms inconsistently, having sex while under the influence of alcohol or drugs, or exchanging sex for money or drugs.7
An effective strategy for obtaining a sexual history is the “five Ps”8:
- Partners (eg, Do you have sex with men, women, or both?)
- Prevention of pregnancy (eg, What are you doing to prevent pregnancy?)
- Protection from STDs (eg, What do you do to protect yourself from STDs?)
- Practices (eg, To understand your risks for STDs, I need to understand the kind of sex you have had recently.)
- Past history of STDs (eg, Have you ever had an STD?).8
The USPSTF and the US Centers for Disease Control and Prevention (CDC) recommend certain populations be screened for STDs.7,8
Everyone age 13 through 64 should be tested for HIV at least once, per CDC recommendation.8
Sexually active females up to age 24 should routinely be screened for chlamydia every year.7,8
Nonpregnant women at higher risk of infection should be screened for gonorrhea and syphilis.
Pregnant women, regardless of risk, should be screened for chlamydia, hepatitis B, HIV, and syphilis; pregnant women at higher risk of infection should also be screened for gonorrhea and hepatitis C.7,9
Men should be screened for HIV, and men at higher risk should also be screened for syphilis.8
Men who have sex with men should be screened at least annually for HIV and syphilis and undergo a test for urethral chlamydia and gonorrhea infection. Men who participate in receptive anal intercourse should be tested for rectal chlamydia and gonorrhea and, in those who participate in oral intercourse, for pharyngeal gonorrhea.8
PREVENTION
Vaccination against HPV, hepatitis A and B
Preexposure vaccination is one of the most effective ways to prevent human papillomavirus (HPV), hepatitis A, and hepatitis B infection.10
HPV vaccination. The Advisory Committee on Immunization Practices recommends routine HPV vaccination of female patients at age 11 or 12, or through age 26 if not previously vaccinated.11,12 Routine vaccination is also recommended for males at age 11 or 12 and through age 21, if not previously vaccinated.12 The upper age is extended through age 26 for men who have sex with men and for immunocompromised patients.12
Two HPV vaccines are available for females; one is quadrivalent and the other is bivalent. Both protect against two HPV types that cause cervical and other HPV-associated cancers.11 The quadrivalent vaccine also protects against the two types that cause 90% of genital warts.13 Only the quadrivalent vaccine is licensed for use in males.12
Hepatitis A and B vaccination. Hepatitis B vaccination is recommended for all unvaccinated, uninfected patients being evaluated for an STD.8,14
Vaccinating for hepatitis A and hepatitis B is important for men who have sex with men, who have a higher risk of acquiring and transmitting these infections.15
Other preventive practices
Male circumcision has been shown to reduce the risk of HIV infection, high-risk genital HPV infection, and genital herpes in heterosexual men.10,16,17
Male condoms, when used consistently and correctly, can reduce the risk of chlamydia, gonorrhea, and trichomoniasis.8 The risk of transmission of syphilis, genital HPV, and genital herpes can also be reduced by correctly and consistently using condoms when the infected area of exposure is covered.8
Microbiocides not recommended. Topical microbiocides do not have not enough evidence to recommend them for STD prevention. However, limited data suggest that tenofovir 1% vaginal gel may reduce the risk of acquiring genital herpes simplex virus type 2 (HSV-2) infection in women.18,19
GENITAL ULCERATIVE DISEASE: HERPES, SYPHILIS, OTHERS
The risk of acquiring HIV is two to five times higher if one is exposed to it when a genital ulcerative disease is present.20,21
In the United States, most cases of genital, anal, or perianal ulcers in sexually active persons are due to genital herpes or syphilis.8 Other causes include chancroid, granuloma inguinale, lymphogranuloma venereum, and noninfectious causes.
Although the frequency of these conditions varies by geographic area and demographic profile, herpes is the most prevalent of them.8 HSV-2 infection is one of the most prevalent STDs in the United States, with approximately 17% of all adolescents and adults infected,1,22 and a much higher prevalence in persons who use drugs.23
A thorough medical history and physical examination should be conducted. In addition, an accurate diagnosis requires specific tests: syphilis serology, dark field microscopy (if available), and culture or polymerase chain reaction (PCR) testing for herpes.8 A positive serologic test for HSV-1 or HSV-2 is enough to make the diagnosis in a patient whose symptoms suggest herpes, even if PCR and culture are negative.
GENITAL HERPES: MOSTLY ASYMPTOMATIC
Genital herpes is caused by HSV-1 or HSV-2. Of these, HSV-1 is on the rise, causing an increasing proportion of first episodes of genital herpes in some populations. It may now account for most new genital herpes infections in young women and in men who have sex with men.8,24
Most people infected with HSV-1 or HSV-2 have no symptoms or have subclinical disease. When symptoms do occur, one or more vesicles may appear on or around the genitals, rectum, or mouth. The average incubation period after exposure is 4 days (range 2–12).25 The first episode of genital herpes is often associated with systemic symptoms (eg, fever, headache, myalgia, and malaise) and local symptoms (eg, dysuria, vaginal or urethral discharge, and inguinal adenopathy).26,27
Genital herpes often recurs, especially during the first year. Recurrences are less frequent with HSV-1 than with HSV-2.
Diagnosing genital herpes requires laboratory testing
Diagnosing genital herpes by clinical signs and symptoms is both insensitive and nonspecific. Therefore, laboratory testing should be performed for patients who present with genital ulcerative disease.
Virologic tests. Viral culture and nucleic acid amplification methods, including PCR assays, are the preferred virologic tests for herpes.8 Although viral culture is widely available, its sensitivity depends on the stage of the lesion and rapidly declines as lesions begin to heal. PCR assays are more sensitive than viral culture, can be done in automated systems, and are increasingly being used in clinical settings.26 However, if the patient has no active lesions at the time of testing, failure to detect herpes by culture or PCR does not guarantee that the patient is not infected, as viral shedding is intermittent.
Serologic tests. Type-specific antibodies to HSV develop during the first several weeks following infection and persist indefinitely. Providers should specifically request serologic type-specific immunoglobulin G (IgG) assays. IgM testing for HSV should not be used, as IgM testing is not type-specific. Moreover, although some clinicians believe IgM is a good test for early infection because levels rise early and then decline, IgM may be positive during recurrent episodes.8
Both laboratory-based assays and point-of-care tests for HSV-2 are available. They are performed on capillary blood or serum and have sensitivities that range from 80% to 100% and specificities greater than 96%, compared with HSV-2 immunoblot and Western blot testing as the standard.28,29
False-negative results may be more frequent in the early stages of infection. HSV-2 antibody indicates anogenital infection, while HSV-1 antibody might also be due to orolabial infection, which is something to keep in mind in a patient without genital symptoms.8
Treatment can control herpes but not eradicate it
Several herpes vaccines have undergone clinical trials, but an effective one remains elusive.30,31
Antiviral therapy is used to control signs and symptoms of clinical disease but does not eradicate latent virus. For initial clinical episodes of genital herpes, the CDC recommends acyclovir, valacyclovir, or famciclovir for 7 to 10 days.8 In patients with established genital herpes, daily suppressive antiviral therapy can reduce recurrences, subclinical shedding, and the likelihood of transmission to partners; famciclovir is somewhat less efficacious for suppressing viral shedding.8
A diagnosis of herpes can carry considerable stigma, which can substantially interfere with a patient’s current and future relationships.25,32,33 Sex partners of patients with genital herpes may benefit from evaluation and counseling. Clinicians should appreciate the psychological impact of a genital herpes diagnosis and address these concerns by providing education, counseling, and support while encouraging patients to recognize that herpes is a manageable condition.34
SYPHILIS IS INCREASING IN MEN WHO HAVE SEX WITH MEN
Since 2001, rates of syphilis, a systemic disease caused by Treponema pallidum, have been increasing in men who have sex with men.3,35 As of 2011, this group accounts for approximately 72% of all cases of primary and secondary syphilis in the United States.3
Primary syphilis is characterized by a firm, painless chancre at the site of inoculation. The chancre lasts 3 to 6 weeks and heals regardless of treatment. However, if the infected person does not receive adequate treatment, the infection progresses to the secondary stage.26
Secondary syphilis typically starts with a nonpruritic rash, usually macular or papular, on the trunk and extremities, classically including the palms and soles. Other symptoms may include alopecia, lymphadenopathy, condylomata, and systemic symptoms.
Without treatment, the infection can progress to latent syphilis, which is further categorized as early (acquired during the preceding year), late latent, or of unknown duration.26
Practical diagnosis of syphilis relies on serologic testing
Definitive diagnosis of early syphilis requires dark field microscopy or PCR to detect T pallidum in lesion exudate or tissue.8 However, because there are no commercially available tests for T pallidum, serologic testing is the mainstay.
Two types of serologic tests must be performed to diagnose syphilis: a nontreponemal test and a treponemal test.8
Nontreponemal tests:
- The Venereal Disease Research Laboratory (VDRL) test
- The rapid plasma reagin (RPR) test.
Treponemal tests:
- T pallidum passive particle agglutination (TP-PA) assay
- Fluorescent treponemal antibody absorbed (FTA-ABS) test
- Enzyme immunoassay (EIA)
- Chemiluminescence immunoassay (CIA).
Using only one type of serologic test is in-sufficient for diagnosis because each type has limitations, including the possibility of false-positive results.
Nontreponemal test results may correlate with disease activity, and results should be reported quantitatively; a fourfold change in titer, equivalent to a change of two dilutions, is needed to demonstrate a clinically significant difference between two nontreponemal test results using the same serologic test.8
Which order of testing for syphilis is best?
The CDC recommends that nontreponemal tests be used to screen for syphilis and treponemal tests be used to confirm the diagnosis.36 This traditional algorithm performs well in identifying persons with active infection who require further evaluation and treatment, while minimizing false-positive results in low-prevalence populations.
However, some clinical laboratories have adopted the reverse sequence, using treponemal tests (usually an EIA or a CIA) to screen for syphilis, followed by a nontreponemal test to confirm active infection.36–38 This reverse-sequence testing may result in overdiagnosis and overtreatment of syphilis in some clinical settings.37 When reverse-sequence syphilis screening is used, the CDC recommends reflexively testing all sera that produce reactive EIA or CIA results with a quantitative nontreponemal test and reflexively testing sera with discordant results (ie, a reactive EIA or CIA and a nonreactive RPR or VDRL test) with a different treponemal test.36
Traditionally, the FTA-ABS test had been considered the gold standard treponemal test; however, it has lower specificity than other treponemal tests. Accordingly, TP-PA is the recommended confirmatory treponemal test.8,39 False-negative results, although rare, may occur for biological or technical reasons, such as the prozone phenomenon, resulting in a missed diagnosis. The prozone phenomenon occurs when the antibody titer is high and antigen binding sites are saturated, preventing the cross-linking reaction between antigens and antibodies. In this instance, when syphilis is suspected clinically and the RPR assay is nonreactive, the clinician can request RPR testing at dilutions of sera, ie, diluting the patient’s serum to bring the antibody concentration into the zone equivalence.40
Suspect neurosyphilis if neurologic symptoms arise
Central nervous system involvement can occur at any stage of syphilis. If clinical evidence of neurologic involvement (meningitis, stroke, cranial nerve dysfunction, or auditory or ophthalmic abnormalities) is observed in any patient with syphilis, regardless of stage, a cerebrospinal fluid examination should be performed.8 Laboratory testing can support the diagnosis of neurosyphilis; however, no single laboratory test can be used to diagnose it.
Cerebrospinal fluid abnormalities (ie, mononuclear pleocytosis, increased protein) are common in patients with early syphilis even in the absence of clinical neurologic findings. There is no firm evidence to support diverging from recommended treatment for early syphilis in these patients.35
Cerebrospinal fluid examination is recommended for all patients with serologic evidence of syphilis infection and neurologic symptoms and for patients who do not achieve an adequate serologic decline with stage-appropriate treatment.8
Penicillin is still the mainstay of syphilis treatment
Penicillin is still the mainstay of syphilis treatment.
- Patients with early syphilis (primary, secondary, or early latent) should receive a single intramuscular dose of benzathine penicillin G (2.4 million units).8,35
- Patients with late latent syphilis should receive three intramuscular doses of benzathine penicillin G (2.4 million units each) at 1-week intervals.
- Neurosyphilis should be treated with aqueous crystalline penicillin G 18 to 24 million units daily for 10 to 14 days.8
Doxycycline is the preferred alternative in nonpregnant patients who are allergic to penicillin. The dosage is 100 mg orally twice a day for 14 days (for primary, secondary, or early latent infections) or for 28 days (for late latent infections or those of unknown duration).35,41
Ceftriaxone (1–2 g daily) may be effective for treating early syphilis. However, data are limited, and the optimal dose and duration of therapy are not defined.8,42
Azithromycin in a single 2-g oral dose is effective for treating early syphilis. However, T pallidum chromosomal mutations associated with macrolide resistance are being detected.35,43 In view of this, azithromycin should not be used in men who have sex with men or in pregnant women.
Follow-up of syphilis patients and partners
Close clinical and serologic follow-up is strongly advised in persons who receive an alternate regimen to evaluate for treatment failure.8
Sex partners of patients with primary syphilis should be considered at risk and given treatment if they had sexual contact with the patient within 3 months plus the duration of symptoms, within 6 months plus the duration of symptoms for those with secondary syphilis, or 1 year for patients with early latent syphilis.8
Serologic and clinical evaluation should be repeated at 6, 12, and 24 months after treatment. HIV-infected patients should receive closer follow-up, ie, at 3, 6, 9, 12, and 24 months. The same quantitative nontreponemal serologic test should be used at each visit, with at least a fourfold decrease in titer representing an appropriate serologic decline.
Failure to achieve an appropriate serologic decline in 6 to 12 months may represent treatment failure.8 Optimal management in this instance is unclear; at a minimum, additional clinical and serologic follow-up should be performed.8 If additional follow-up cannot be ensured, retreatment (weekly intramuscular injections of benzathine penicillin G 2.4 million units for 3 weeks) is recommended. Cerebrospinal fluid examination can be considered to exclude unrecognized neurosyphilis.8
URETHRITIS: GONORRHEA, CHLAMYDIA TOP THE LIST
Symptoms of urethritis can include dysuria, discharge (purulent or mucopurulent), and urethral pruritus.26 However, asymptomatic infections are common.8
Several organisms are associated with infectious urethritis, including26:
- Neisseria gonorrhoeae
- Chlamydia trachomatis
- Mycoplasma genitalium
- Trichomonas vaginalis
- Ureaplasma urealyticum.
Diagnosing urethritis: Try to identify the agent
The clinician should attempt to obtain objective evidence of urethral inflammation. Urethral discharge should be examined with microscopy using Gram stain or methylene blue, or a first-void urine sample should be tested with microscopy and leukocyte esterase.26 If clinic-based diagnostic testing is not available, testing for N gonorrhoeae and C trachomatis using nucleic acid amplification can identify additional infections.8
During the clinic visit, either Gram-stain microscopy of a urethral swab or microscopic examination of a first-catch urine sample may identify the causative agent. If gram-negative intracellular diplococci are seen on urethral smear, gonorrhea infection is diagnosed. Nongonococcal urethritis is diagnosed when microscopy or urinalysis displays evidence of inflammation (positive leukocyte esterase or at least 10 white blood cells per high-power field) without gram-negative intracellular diplococci.8
Testing should be performed to determine the specific cause of urethritis, because both chlamydia and gonorrhea are reportable diseases. Nucleic acid amplification tests are the most sensitive tests for C trachomatis and N gonorrhoeae and can be performed on urethral swabs or urine.44 If clinic-based diagnostic tools are unavailable, patients should receive empiric treatment for chlamydia and gonorrhea.8
Treatment of urethritis, by organism
Urethral gonorrhea should be treated with dual therapy: ceftriaxone 250 mg in a single intramuscular dose and either azithromycin 1 g orally as a single dose or doxycycline 100 mg orally twice a day for 7 days. Oral cephalosporins are no longer recommended as first-line treatment of gonorrhea.45
Chlamydial urethritis is treated with azithromycin 1 g in a single oral dose or doxycycline 100 mg orally twice a day for 7 days. Although azithromycin provides the advantages of a single-dose regimen administered and directly observed by the provider, some evidence suggests that doxycycline may be more effective than azithromycin for symptomatic chlamydial urethritis.46
All sex partners within the preceding 60 days should be referred for evaluation, testing, and empiric treatment with a drug regimen effective against chlamydia (if nongonococcal urethritis or only C trachomatis was identified) and gonorrhea (if N gonorrhoeae was identified). When patients diagnosed with chlamydia or gonorrhea indicate that their partners are unlikely to seek evaluation, providers can offer patient-delivered partner therapy, a form of expedited partner therapy in which partners of infected persons are treated without previous medical evaluation. Providers should visit www.cdc.gov/std/ept for updated information for their individual jurisdiction, as expedited partner therapy is prohibited in some states. No studies have been published involving patient-delivered partner therapy for chlamydia or gonorrhea in men who have sex with men.8
Patients with recurrent or persistent urethritis can be retreated with the initial regimen if they did not comply with treatment or were reexposed to an untreated sex partner. However, persistent urethritis after doxycycline therapy may suggest the presence of doxycycline-resistant M genitalium or U urealyticum. T vaginalis may also cause urethritis in men. Diagnostic evaluation may include culture or nucleic acid amplification testing of a urethral swab or urine (ie, PCR [Amplicor] or transcription-mediated amplification).8
M genitalium or U urealyticum urethritis. Currently, no commercially available diagnostic test exists for M genitalium or U urealyticum, so clinicians must choose a treatment regimen on the basis of objective evidence of inflammation in the absence of an etiologic agent. If azithromycin was not given during the initial course, metronidazole 2 g orally or tinidazole 2 g orally in a single dose plus azithromycin 1 g orally should be considered.8
M genitalium is one of the most common pathogens in men with persistent urethritis, accounting for 15% to 25% of cases. Several studies have shown that moxifloxacin 400 mg orally daily for 7 days is effective against M genitalium.46–48 Therefore, men for whom an initial regimen of azithromycin fails should be retreated with moxifloxacin 400 mg orally once daily for 7 days.
If men require treatment with a new antibiotic regimen for persistent urethritis and a sexually transmitted agent is the suspected cause, all partners in the past 60 days before the initial diagnosis and any interim partners should be referred for evaluation and appropriate treatment.
CERVICITIS: CHLAMYDIA, GONORRHEA, OTHERS
Cervicitis is frequently asymptomatic, but signs on pelvic examination may include purulent or mucopurulent endocervical exudate and sustained endocervical bleeding easily induced by passage of a cotton swab through the cervical os.26
In most cases, the pathogen cannot be identified.49 When an organism is isolated, it is typically C trachomatis or N gonorrhoeae. Others that may cause cervicitis include the organisms responsible for bacterial vaginosis, T vaginalis, HSV, and possibly M genitalium.50
Diagnostic workup for cervicitis
Diagnostic workup for cervicitis should include microscopic evaluation of an endocervical specimen and testing for C trachomatis and N gonorrhoeae. A finding of leukorrhea (> 10 white blood cells per high-power field on microscopic examination of vaginal fluid) has been associated with chlamydial and gonococcal infection of the cervix.8 In the absence of inflammatory vaginitis, leukorrhea might be a sensitive indicator of cervical inflammation, with a high negative predictive value.
Nucleic acid amplification testing for C trachomatis and N gonorrhoeae can be performed on urine, endocervical, or vaginal swab specimens collected by the clinician or self-collected.51 The performance of C trachomatis nucleic acid amplification testing on patient-collected vaginal swab specimens has similar sensitivity and specificity to those performed on cervical and first-void urine samples.26,44,52
Women with cervicitis also should be evaluated for bacterial vaginosis and trichomoniasis, and if the organisms that cause these conditions are detected, treatment is advised. Microscopy has a low sensitivity (approximately 50%) for detecting T vaginalis; if the organism is not identified, further testing such as culture may be performed to exclude it as the pathogen.
Women with cervicitis should also be evaluated for clinical signs of pelvic inflammatory disease, including uterine, adnexal, and cervical motion tenderness, and fever.
Cervicitis can be treated presumptively
Women with cervicitis who should receive presumptive therapy include those at higher risk of chlamydial infection (ie, those with new or multiple sex partners, those age 25 or younger, and those who engage in unprotected intercourse, especially if follow-up cannot be ensured).8
Recommended therapy is either azithromycin 1 g orally in a single dose or doxycycline 100 mg orally twice a day for 7 days. The clinician should consider dual therapy to cover gonorrhea if the prevalence of gonorrhea is more than 5% (ie, in younger patients).8 If bacterial vaginosis or T vaginalis infection is diagnosed, these conditions should be treated at the time of clinical evaluation (see vaginitis section for more detail). For women in whom presumptive therapy is deferred, the results of diagnostic testing should guide appropriate treatment.
Repeat testing 3 to 6 months after treatment is recommended for all women diagnosed with chlamydia or gonorrhea,53 and all sex partners in the past 60 days should be referred for evaluation and receive treatment for the STDs for which the index patient received treatment. In states where it is allowed, patient-delivered partner therapy should be considered if the patient indicates her partner is unlikely to seek medical evaluation.
VAGINITIS: NOT JUST YEAST
Women with vaginitis may present with complaints of discharge, pruritus, or a bad vaginal odor. A careful medical history, including information on sexual behaviors and vaginal hygiene practices (ie, douching), should be conducted in addition to physical examination and diagnostic testing.
The most common conditions associated with vaginitis are bacterial vaginosis, trichomoniasis, and candidiasis. However, vulvovaginal candidiasis, most often caused by Candida albicans, is not transmitted sexually and will not be reviewed further here. Although bacterial vaginosis is associated with known risk factors for STDs (eg, new or multiple sex partners), the cause of the microbial alteration that precipitates it is not known.44 Co-infection with T vaginalis is extremely common.54
BACTERIAL VAGINOSIS: VERY COMMON
Bacterial vaginosis is the most common genital infection in reproductive-age women.55 It is a polymicrobial syndrome in which anaerobic bacteria (Prevotella and Mobiluncus species), Gardnerella vaginalis, Ureaplasma, and Mycoplasma replace the normal vaginal flora.
Diagnosis of bacterial vaginosis
Bacterial vaginosis can be diagnosed by clinical criteria or Gram staining. Clinical diagnosis requires three of the following clinical criteria proposed by Amsel et al56:
- Clue cells
- Vaginal fluid pH > 4.5
- Fishy odor before or after addition of 10% potassium hydroxide
- Thin, homogeneous, white discharge that smoothly coats the vaginal walls.
The clinical utility of PCR for diagnosing G vaginalis remains unclear, and culture is not recommended because it has low specificity. Gram staining can be used to determine the concentration of lactobacilli, small gram-negative or variable rods (G vaginalis and anaerobic rods), and curved gram-negative rods (ie, Mobiluncus species).
Treatment of bacterial vaginosis: Metronidazole or clindamycin
Treatment is recommended to relieve vaginal symptoms, with the potential benefit of reducing the risk of acquiring chlamydia, gonorrhea, and HIV and other viral STDs.8
Recommended treatment is with metronidazole 500 mg orally twice a day for 7 days, metronidazole gel 0.75% vaginal suppository once a day for 5 days, or clindamycin cream 2% vaginal suppository once a day for 7 days.44 A meta-analysis of several trials found that clindamycin and metronidazole have equivalent effectiveness for eradicating bacterial vaginosis symptoms.57 Accordingly, providers can consider patient preference, co-infections, and possible side effects when selecting a regimen. Alternative regimens include tinidazole or clindamycin orally or in vaginal ovules.
Women should be advised to refrain from sexual intercourse during treatment. Routine treatment of male or female sexual partners is not warranted.
Bacterial vaginosis commonly recurs, and limited data exist regarding optimal management of recurrences. Using a different treatment regimen may be an option in patients who have a recurrence; however, re-treatment with the same topical regimen is an acceptable approach for treating recurrent bacterial vaginosis during the early stages of infection.58 One study suggests that metronidazole for 7 days, followed by intravaginal boric acid for 21 days, and then, for those in remission, suppressive metronidazole gel for 16 weeks may be another option.59 For women with multiple recurrences, metronidazole gel twice weekly for 4 to 6 months has been shown to reduce recurrences, although its benefit may not persist after it is stopped. The therapeutic role for probiotics remains unclear.60
TRICHOMONIASIS: TREAT PARTNERS
Although most women with trichomoniasis have few or no symptoms, some have vaginal discharge that may be diffuse, malodorous, and yellow-greenish, and some have vulvar irritation.
Diagnosis of trichomoniasis: Microscopy is first-line but insensitive
The most common method for diagnosing T vaginalis infection remains microscopic evaluation of wet preparations of genital secretions, because of its convenience and relatively low cost. This may demonstrate the motile, flagellated protozoa T vaginalis and many white blood cells. Slides of vaginal fluid specimens should be examined immediately after collection to maximize performance. Unfortunately, the sensitivity of wet preparation is 44% to 80% in vaginal specimens.61
Culture is still considered the gold standard for diagnosing trichomoniasis and, if available, should be performed when direct microscopy is unrevealing.
Point-of-care diagnostic tests for T vaginalis infection include the OSOM Trichomonas Rapid Test (Sekisui Diagnostics, San Diego, CA), which is an immunochromatographic capillary flow dipstick test, and the Affirm VPIII (Becton, Dickinson and Company, Franklin Lakes, NJ), a nucleic acid probe-hydridization test that identifies T vaginalis, G vaginalis, and C albicans.44,62 Liquid-based Pap tests may demonstrate T vaginalis, although they should not be performed exclusively for this purpose. Among women, nucleic acid amplification tests may detect a prevalence three to five times higher than indicated by wet mount microscopy. The APTIMA Trichomonas vaginalis assay (Hologic Gen-Probe, San Diego, CA) was the most sensitive test for trichomonas detection in this study.63
Extragenital testing with nucleic acid amplification tests is not recommended for T vaginalis, as it remains unclear if the rectum can serve as a reservoir for infection, and T vaginalis has not been found to infect oral sites.8
Treatment of trichomoniasis: Metronidazole or tinidazole
Nitroimidazoles, ie, metronidazole and tinidazole, are the only class of drugs available to treat trichomoniasis. The recommended regimen is metronidazole or tinidazole 2 g orally in a single dose. Studies suggest that tinidazole may be superior to metronidazole, with higher cure rates due to its longer half-life and higher tissue concentrations.64
Low-level metronidazole resistance is estimated to occur in 2% to 5% of trichomoniasis infections65; high-level resistance occurs rarely. If a single dose of metronidazole 2 g fails to cure the infection and reinfection is ruled out, the patient should be treated with metronidazole 500 mg orally twice a day for 7 days. If this regimen is not effective, providers can consider tinidazole or metronidazole 2 g orally for 7 days.44,62,64 Consultation and susceptibility testing for T vaginalis is available from the CDC if these alternative regimens are ineffective.
T vaginalis infection has a high rate of transmission to sexual partners,66 and all partners should be treated. Male sexual partners should be treated with metronidazole 500 mg twice a day orally for 7 days, tinidazole 2 g orally in a single dose, or tinidazole 500 mg twice a day for 7 days. Patient-delivered partner therapy may have a role in partner management for trichomoniasis.67
PROCTITIS: SUSPECT LYMPHOGRANULOMA VENEREUM
Acute proctitis in men and women who practice receptive anal intercourse is usually sexually acquired. The most common causative organisms are N gonorrhoeae, C trachomatis (serotypes associated with or not associated with lymphogranuloma venereum), and HSV; T pallidum is less common.68 Co-infections are not uncommon in this setting.69
Symptoms of proctitis may include anal discharge, rectal ulcers and bleeding, anorectal pain, tenesmus, and constipation. Patients with lymphogranuloma venereum may also present with tender, fluctuant inguinal or femoral lymphadenopathy (buboes), or herpetiform genital ulcers or papules.
Diagnosis of proctitis
Clinical evaluation should include digital rectal examination and anoscopy (if possible) to look for abnormalities such as ulcerations, hemorrhoids, anal fissures, condylomas, strictures, exudate, and bleeding.
Appropriate diagnostic testing includes Gram staining and culture of discharge, herpes viral culture or PCR, and nucleic acid amplification testing for chlamydia and gonorrhea (in laboratories with Clinical Laboratory Improvement Amendments validation).8
Nucleic acid amplification tests detect C trachomatis serotypes L1–L3, responsible for lymphogranuloma venereum, and non-lymphogranuloma venereum serotypes A–K, but cannot distinguish between the two, whereas PCR-based genotyping can.8,26 Although this distinction is important to ensure appropriate evaluation and management of sex partners, empiric treatment for lymphogranuloma venereum (doxycycline 100 mg orally twice a day for 21 days) should be provided to patients at high risk, including men who have sex with men and who have anorectal chlamydia, HIV infection, or bloody discharge and perianal or mucosal ulcers.8
Treatment of proctitis
Patients with painful perianal or mucosal ulceration should receive presumptive treatment for lymphogranuloma venereum and HSV while awaiting results of diagnostic testing. If rectal discharge is detected or Gram staining of anorectal secretions detects polymorphonuclear leukocytes, treatment should include ceftriaxone 250 mg intramuscularly and doxycycline 100 mg orally twice a day for 7 days.8 Additional testing for syphilis and HIV should also be performed.
All sexual partners should be evaluated for any disease diagnosed in the index patient.
- Satterwhite CL, Torrone E, Meites E, et al. Sexually transmitted infections among US women and men: prevalence and incidence estimates, 2008. Sex Transm Dis 2013; 40:187–193.
- Institute of Medicine (US); Committee on Prevention and Control of Sexually Transmitted Diseases. The hidden epidemic: confronting sexually transmitted diseases. Washington, DC: National Academy Press; 1997.
- Centers for Disease Control and Prevention (CDC). 2011 Sexually Transmitted Disease Surveillance. http://www.cdc.gov/std/stats11/toc.htm. Accessed January 10, 2014.
- Barrow RY, Newman LM, Douglas JM. Taking positive steps to address STD disparities for African-American communities. Sex Transm Dis 2008; 35(suppl 12):S1–S3.
- Mitchell JW, Petroll AE. Patterns of HIV and sexually transmitted infection testing among men who have sex with men couples in the United States. Sex Transm Dis 2012; 39:871–876.
- Centers for Disease Control and Prevention (CDC). HIV testing among men who have sex with men—21 cities, United States, 2008. MMWR Morb Mortal Wkly Rep 2011; 60:694–699.
- Meyers D, Wolff T, Gregory K, et al., USPSTF. USPSTF recommendations for STI screening. Am Fam Physician 2008; 77:819–824.
- Workowski KA, Berman S; Centers for Disease Control and Prevention (CDC). Sexually transmitted diseases treatment guidelines, 2010. MMWR Recomm Rep 2010; 59:1–110.
- Summaries for patients. Screening for chlamydial infection: recommendations from the US Preventive Services Task Force. Ann Intern Med 2007; 147:I44.
- Marrazzo JM, Cates W. Interventions to prevent sexually transmitted infections, including HIV infection. Clin Infect Dis 2011; 53(suppl 3):S64–S78.
- Markowitz LE, Dunne EF, Saraiya M, Lawson HW, Chesson H, Unger ER; Centers for Disease Control and Prevention (CDC); Advisory Committee on Immunization Practices (ACIP). Quadrivalent Human Papillomavirus Vaccine: Recommendations of the Advisory Committee on Immunization Practices (ACIP). MMWR Recomm Rep 2007; 56:1–24.
- Centers for Disease Control and Prevention (CDC). Recommendations on the use of quadrivalent human papillomavirus vaccine in males—Advisory Committee on Immunization Practices (ACIP), 2011. MMWR Morb Mortal Wkly Rep 2011; 60:1705–1708.
- Paavonen J, Jenkins D, Bosch FX, et al; HPV PATRICIA study group. Efficacy of a prophylactic adjuvanted bivalent L1 virus-like-particle vaccine against infection with human papillomavirus types 16 and 18 in young women: an interim analysis of a phase III double-blind, randomised controlled trial. Lancet 2007; 369:2161–2170.
- Mast EE, Weinbaum CM, Fiore AE, et al; Advisory Committee on Immunization Practices (ACIP); Centers for Disease Control and Prevention (CDC). A comprehensive immunization strategy to eliminate transmission of hepatitis B virus infection in the United States: recommendations of the Advisory Committee on Immunization Practices (ACIP) Part II: immunization of adults. MMWR Recomm Rep 2006; 55:1–33.
- Mayer KH. Sexually transmitted diseases in men who have sex with men. Clin Infect Dis 2011; 53(suppl 3):S79–S83.
- Tobian AA, Serwadda D, Quinn TC, et al. Male circumcision for the prevention of HSV-2 and HPV infections and syphilis. N Engl J Med 2009; 360:1298–1309.
- Auvert B, Sobngwi-Tambekou J, Cutler E, et al. Effect of male circumcision on the prevalence of high-risk human papillomavirus in young men: results of a randomized controlled trial conducted in Orange Farm, South Africa. J Infect Dis 2009; 199:14–19.
- Obiero J, Mwethera PG, Wiysonge CS. Topical microbicides for prevention of sexually transmitted infections. Cochrane Database Syst Rev 2012; 6:CD007961.
- Abdool Karim Q, Abdool Karim SS, Frohlich JA, et al; CAPRISA 004 Trial Group. Effectiveness and safety of tenofovir gel, an antiretroviral microbicide, for the prevention of HIV infection in women. Science 2010; 329:1168–1174.
- HIV prevention through early detection and treatment of other sexually transmitted diseases—United States. Recommendations of the Advisory Committee for HIV and STD prevention. MMWR Recomm Rep 1998; 47:1–24.
- Fleming DT, Wasserheit JN. From epidemiological synergy to public health policy and practice: the contribution of other sexually transmitted diseases to sexual transmission of HIV infection. Sex Transm Infect 1999; 75:3–17.
- Centers for Disease Control and Prevention (CDC). Seroprevalence of herpes simplex virus type 2 among persons aged 14–49 years—United States, 2005–2008. MMWR Morb Mortal Wkly Rep 2010; 59:456–459.
- Semaan S, Leinhos M, Neumann MS. Public health strategies for prevention and control of HSV-2 in persons who use drugs in the United States. Drug Alcohol Depend 2013; 131:182–197.
- Bernstein DI, Bellamy AR, Hook EW, et al. Epidemiology, clinical presentation, and antibody response to primary infection with herpes simplex virus type 1 and type 2 in young women. Clin Infect Dis 2013; 56:344–351.
- Kimberlin DW, Rouse DJ. Clinical practice. Genital herpes. N Engl J Med 2004; 350:1970–1977.
- Sexually Transmitted Diseases. 4th ed. New York, NY: McGraw-Hill Professional Publishing; 2007.
- Johnston C, Magaret A, Selke S, Remington M, Corey L, Wald A. Herpes simplex virus viremia during primary genital infection. J Infect Dis 2008; 198:31–34.
- Laderman EI, Whitworth E, Dumaual E, et al. Rapid, sensitive, and specific lateral-flow immunochromatographic point-of-care device for detection of herpes simplex virus type 2-specific immunoglobulin G antibodies in serum and whole blood. Clin Vaccine Immunol 2008; 15:159–163.
- Philip SS, Ahrens K, Shayevich C, et al. Evaluation of a new point-of-care serologic assay for herpes simplex virus type 2 infection. Clin Infect Dis 2008; 47:e79–e82.
- Belshe RB, Leone PA, Bernstein DI, et al; Herpevac Trial for Women. Efficacy results of a trial of a herpes simplex vaccine. N Engl J Med 2012; 366:34–43.
- Stanberry LR, Spruance SL, Cunningham AL, et al; GlaxoSmithKline Herpes Vaccine Efficacy Study Group. Glycoprotein-D-adjuvant vaccine to prevent genital herpes. N Engl J Med 2002; 347:1652–1661.
- Mark H, Gilbert L, Nanda J. Psychosocial well-being and quality of life among women newly diagnosed with genital herpes. J Obstet Gynecol Neonatal Nurs 2009; 38:320–326.
- Gilbert LK, Omisore F. Common questions about herpes: analysis of chat-room transcripts. Herpes 2009; 15:57–61.
- Alexander L, Naisbett B. Patient and physician partnerships in managing genital herpes. J Infect Dis 2002; 186(suppl 1):S57–S65.
- Ghanem KG, Workowski KA. Management of adult syphilis. Clin Infect Dis 2011; 53(suppl 3):S110–S128.
- Centers for Disease Control and Prevention (CDC). Discordant results from reverse sequence syphilis screening—five laboratories, United States, 2006–2010. MMWR Morb Mortal Wkly Rep 2011; 60:133–137.
- Centers for Disease Control and Prevention (CDC). Syphilis testing algorithms using treponemal tests for initial screening—four laboratories, New York City, 2005–2006. MMWR Morb Mortal Wkly Rep 2008; 57:872–875.
- Seña AC, White BL, Sparling PF. Novel Treponema pallidum serologic tests: a paradigm shift in syphilis screening for the 21st century. Clin Infect Dis 2010; 51:700–708.
- Marangoni A, Sambri V, Storni E, D’Antuono A, Negosanti M, Cevenini R. Treponema pallidum surface immunofluorescence assay for serologic diagnosis of syphilis. Clin Diagn Lab Immunol 2000; 7:417–421.
- Post JJ, Khor C, Furner V, Smith DE, Whybin LR, Robertson PW. Case report and evaluation of the frequency of the prozone phenomenon in syphilis serology—an infrequent but important laboratory phenomenon. Sex Health 2012; 9:488–490.
- Ghanem KG, Erbelding EJ, Cheng WW, Rompalo AM. Doxycycline compared with benzathine penicillin for the treatment of early syphilis. Clin Infect Dis 2006; 42:e45–e49.
- Hook EW, Roddy RE, Handsfield HH. Ceftriaxone therapy for incubating and early syphilis. J Infect Dis 1988; 158:881–884.
- A2058G Prevalence Workgroup. Prevalence of the 23S rRNA A2058G point mutation and molecular subtypes in Treponema pallidum in the United States, 2007 to 2009. Sex Transm Dis 2012; 39:794–798.
- Workowski KA, Berman SM. Centers for Disease Control and Prevention Sexually Transmitted Disease Treatment Guidelines. Clin Infect Dis 2011; 53(suppl 3):S59–S63.
- Kirkcaldy RD, Bolan GA, Wasserheit JN. Cephalosporin-resistant gonorrhea in North America. JAMA 2013; 309:185–187.
- Seña AC, Lensing S, Rompalo A, et al. Chlamydia trachomatis, Mycoplasma genitalium, and Trichomonas vaginalis infections in men with nongonococcal urethritis: predictors and persistence after therapy. J Infect Dis 2012; 206:357–365.
- Manhart LE, Broad JM, Golden MR. Mycoplasma genitalium: should we treat and how? Clin Infect Dis 2011; 53(suppl 3):S129–S142.
- Jernberg E, Moghaddam A, Moi H. Azithromycin and moxifloxacin for microbiological cure of Mycoplasma genitalium infection: an open study. Int J STD AIDS 2008; 19:676–679.
- Taylor SN, Lensing S, Schwebke J, et al. Prevalence and treatment outcome of cervicitis of unknown etiology. Sex Transm Dis 2013; 40:379–385.
- Lusk MJ, Konecny P. Cervicitis: a review. Curr Opin Infect Dis 2008; 21:49–55.
- Geisler WM. Diagnosis and management of uncomplicated Chlamydia trachomatis infections in adolescents and adults: summary of evidence reviewed for the 2010 Centers for Disease Control and Prevention Sexually Transmitted Diseases Treatment Guidelines. Clin Infect Dis 2011; 53(suppl 3):S92–S98.
- Schachter J, Chernesky MA, Willis DE, et al. Vaginal swabs are the specimens of choice when screening for Chlamydia trachomatis and Neisseria gonorrhoeae: results from a multicenter evaluation of the APTIMA assays for both infections. Sex Transm Dis 2005; 32:725–728.
- Hosenfeld CB, Workowski KA, Berman S, et al. Repeat infection with Chlamydia and gonorrhea among females: a systematic review of the literature. Sex Transm Dis 2009; 36:478–489.
- Sobel JD, Subramanian C, Foxman B, Fairfax M, Gygax SE. Mixed vaginitis-more than coinfection and with therapeutic implications. Curr Infect Dis Rep 2013; 15:104–108.
- Taylor BD, Darville T, Haggerty CL. Does bacterial vaginosis cause pelvic inflammatory disease? Sex Transm Dis 2013; 40:117–122.
- Amsel R, Totten PA, Spiegel CA, Chen KC, Eschenbach D, Holmes KK. Nonspecific vaginitis. Diagnostic criteria and microbial and epidemiologic associations. Am J Med 1983; 74:14–22.
- Oduyebo OO, Anorlu RI, Ogunsola FT. The effects of antimicrobial therapy on bacterial vaginosis in non-pregnant women. Cochrane Database Syst Rev 2009; ( 3):CD006055.
- Bunge KE, Beigi RH, Meyn LA, Hillier SL. The efficacy of retreatment with the same medication for early treatment failure of bacterial vaginosis. Sex Transm Dis 2009; 36:711–713.
- Reichman O, Akins R, Sobel JD. Boric acid addition to suppressive antimicrobial therapy for recurrent bacterial vaginosis. Sex Transm Dis 2009; 36:732–734.
- Senok AC, Verstraelen H, Temmerman M, Botta GA. Probiotics for the treatment of bacterial vaginosis. Cochrane Database Syst Rev 2009; (4):CD006289.
- Nye MB, Schwebke JR, Body BA. Comparison of APTIMA Trichomonas vaginalis transcription-mediated amplification to wet mount microscopy, culture, and polymerase chain reaction for diagnosis of trichomoniasis in men and women. Am J Obstet Gynecol 2009; 200:188.e1–188.e7.
- Bachmann LH, Hobbs MM, Seña AC, et al. Trichomonas vaginalis genital infections: progress and challenges. Clin Infect Dis 2011; 53(suppl 3):S160–S172.
- Schwebke JR, Hobbs MM, Taylor SN, et al. Molecular testing for Trichomonas vaginalis in women: results from a prospective US clinical trial. J Clin Microbiol 2011; 49:4106–4111.
- Coleman JS, Gaydos CA, Witter F. Trichomonas vaginalis vaginitis in obstetrics and gynecology practice: new concepts and controversies. Obstet Gynecol Surv 2013; 68:43–50.
- Kirkcaldy RD, Augostini P, Asbel LE, et al. Trichomonas vaginalis antimicrobial drug resistance in 6 US cities, STD Surveillance Network, 2009–2010. Emerg Infect Dis 2012; 18:939–943.
- Hoots BE, Peterman TA, Torrone EA, Weinstock H, Meites E, Bolan GA. A Trich-y question: should Trichomonas vaginalis infection be reportable? Sex Transm Dis 2013; 40:113–116.
- Schwebke JR, Desmond RA. A randomized controlled trial of partner notification methods for prevention of trichomoniasis in women. Sex Transm Dis 2010; 37:392–396.
- Studemeister A. Cytomegalovirus proctitis: a rare and disregarded sexually transmitted disease. Sex Transm Dis 2011; 38:876–878.
- Hoentjen F, Rubin DT. Infectious proctitis: when to suspect it is not inflammatory bowel disease. Dig Dis Sci 2012; 57:269–273.
KEY POINTS
- Anyone can have an STD, although the prevalence is higher in some groups, such as younger sexually active people, certain racial and ethnic minorities, men who have sex with men, and people who engage in risky sexual behavior.
- Preexposure vaccination is one of the most effective ways to prevent human papillomavirus, hepatitis A virus, and hepatitis B virus infections.
- The risk of acquiring human immunodeficiency virus is two to five times higher if the patient has a genital ulcerative disease such as syphilis or herpes at the time of exposure.
- Chlamydia trachomatis and Neisseria gonorrhoeae are major players in urethritis, cervicitis, and proctitis.
- The most common conditions associated with vaginitis include bacterial vaginosis, trichomoniasis, and candidiasis.
Should patients with gout avoid thiazides for hypertension?
The decision should be individualized, taking into consideration the degree to which the thiazide increases the serum urate level, whether this increase can be managed without overly complicating the patient’s hypouricemic therapy, and, most importantly, what effect switching to another drug will have on the control of the patient’s hypertension. No study has directly addressed this issue.
My practice in most patients, for reasons I explain below, is to use a thiazide if it helps to control the blood pressure and to adjust the dose of the hypouricemic therapy as needed to reduce the serum urate to the desired level.
THIAZIDES REMAIN IMPORTANT IN ANTIHYPERTENSIVE THERAPY
Many patients with gout also have hypertension, perhaps due in part to the same hyperuricemia that caused their gouty arthritis. It is well documented that thiazide diuretics can raise the serum urate level.1 In some studies2 (but not all3), patients using thiazides had a higher incidence of gouty arthritis. Thus, it is reasonable to ask if we should avoid thiazides in patients with coexistent gout and hypertension.
Many hypertensive patients fail to reach their target blood pressures (although with the “looser” recommendations in the latest guidelines,4 we may appear to be doing a better job). The reasons for failing to reach target pressures are complex and many: physicians may simply not be aggressive enough in pursuing a target blood pressure; patients cannot tolerate the drugs or cannot afford the drugs; and many patients need two or more antihypertensive drugs to achieve adequate control. Thiazides are cheap and effective5 and work synergistically with angiotensin-converting enzyme inhibitors and angiotensin receptor blockers.6
Thus, in many patients, avoiding or discontinuing a thiazide may inhibit our ability to control their hypertension, which is a key contributor to cardiovascular events and chronic kidney injury in patients with gout. Since other diuretics (eg, loop diuretics, which can lower blood pressure but often require split doses) also raise the serum urate level, switching to one of them will not eliminate concern over hyperuricemia.
Thiazides and serum urate
Thiazides slightly increase the serum urate level and in a dose-dependent manner. At the doses commonly used in treating hypertension (12.5 or 25 mg once a day), hydrochlorothiazide increases the serum urate level by 0.8 mg/dL or less in patients with normal renal function, as shown in a number of older hypertension treatment trials and in a recent prospective study.1 The effect of chlorthalidone is similar.
In patients with chronic gout treated with a xanthine oxidase inhibitor (allopurinol or febuxostat) to lower the serum urate to the American College of Rheumatology’s recommended target level7 of less than 6.0 mg/dL (or < 5 mg/dL in the British Rheumatology guidelines), this small elevation in serum urate is unlikely to negate the clinical efficacy of these drugs when dosing is optimized. Small studies have demonstrated a clinically insignificant pharmacodynamic interaction between thiazides and xanthine oxidase inhibitors.8,9 When I add a thiazide to a patient’s regimen, I do not usually need to increase the dose of allopurinol significantly to keep the serum urate level below the desired target.
Switch antihypertensive therapy
Occasionally, in a patient with chronic gout and mild hypertension who has a serum urate level marginally above the estimated precipitation threshold of 6.7 mg/dL, it is reasonable to simply switch the thiazide to another antihypertensive, such as losartan. Losartan is a weak uricosuric and can lower the serum urate level slightly, possibly making the addition of another hypouricemic agent unnecessary, while still controlling the blood pressure with a single pill. This decision must be individualized, taking into consideration the efficacy and cost of the alternative antihypertensive drug, as well as the potential but as yet unproven cardiovascular and renal benefits of lowering the serum urate with a more potent hypouricemic to a degree not likely to be attained with losartan alone.
Continue thiazide, adjust gout therapy
Discontinuing a thiazide or switching to another antihypertensive drug may increase the cost and decrease the efficacy of hypertensive therapy. Continuing thiazide therapy and, if necessary, adjusting hypouricemic therapy will not worsen the control of the serum urate level or gouty arthritis, and in most patients will not complicate the management of gout.
ASPIRIN AND HYPERURICEMIA
In answer to a separate but related question, aspirin in low doses for cardioprotection (81 mg daily) also need not be stopped in patients with hyperuricemia or gout in an effort to better control the serum urate level. Low-dose aspirin increases the serum urate level by about 0.3 mg/dL. Since patients with gout have a higher risk of having cardiovascular disease, metabolic syndrome, and chronic kidney disease, many will benefit from low-dose aspirin therapy.
- McAdams DeMarco MA, Maynard JW, Baer AN, et al. Diuretic use, increased serum urate levels, and risk of incident gout in a population-based study of adults with hypertension: the Atherosclerosis Risk in Communities cohort study. Arthritis Rheum 2012; 64:121–129.
- Choi HK, Soriano LC, Zhang Y, Rodríguez LA. Antihypertensive drugs and risk of incident gout among patients with hypertension: population based case-control study. BMJ 2012; 344:d8190.
- Hueskes BA, Roovers EA, Mantel-Teeuwisse AK, Janssens HJ, van de Lisdonk EH, Janssen M. Use of diuretics and the risk of gouty arthritis: a systematic review. Semin Arthritis Rheum 2012; 41:879–889.
- James PA, Oparil S, Carter BL, et al. 2014 Evidence-based guideline for the management of high blood pressure in adults. Report from the panel members appointed to the Eighth Joint National Committee (JNC 8). JAMA 2013; doi: 10.1001/jama2013.284427
- Fuchs FD. Diuretics: still essential drugs for the management of hypertension. Expert Rev Cardiovasc Ther 2009; 7:591–598.
- Sood N, Reinhart KM, Baker WL. Combination therapy for the management of hypertension: a review of the evidence. Am J Health Syst Pharm 2010; 67:885–894.
- Khanna D, Fitzgerald JD, Khanna PP, et al; American College of Rheumatology. 2012 American College of Rheumatology guidelines for management of gout. Part 1: systematic nonpharmacologic and pharmacologic therapeutic approaches to hyperuricemia. Arthritis Care Res (Hoboken) 2012; 64:1431–1446.
- Löffler W, Landthaler R, de Vries JX, et al. Interaction of allopurinol and hydrochlorothiazide during prolonged oral administration of both drugs in normal subjects. I. Uric acid kinetics. Clin Investig 1994; 72:1071–1075.
- Grabowski B, Khosravan R, Wu JT, Vernillet L, Lademacher C. Effect of hydrochlorothiazide on the pharmacokinetics and pharmacodynamics of febuxostat, a non-purine selective inhibitor of xanthine oxidase. Br J Clin Pharmacol 2010; 70:57–64.
The decision should be individualized, taking into consideration the degree to which the thiazide increases the serum urate level, whether this increase can be managed without overly complicating the patient’s hypouricemic therapy, and, most importantly, what effect switching to another drug will have on the control of the patient’s hypertension. No study has directly addressed this issue.
My practice in most patients, for reasons I explain below, is to use a thiazide if it helps to control the blood pressure and to adjust the dose of the hypouricemic therapy as needed to reduce the serum urate to the desired level.
THIAZIDES REMAIN IMPORTANT IN ANTIHYPERTENSIVE THERAPY
Many patients with gout also have hypertension, perhaps due in part to the same hyperuricemia that caused their gouty arthritis. It is well documented that thiazide diuretics can raise the serum urate level.1 In some studies2 (but not all3), patients using thiazides had a higher incidence of gouty arthritis. Thus, it is reasonable to ask if we should avoid thiazides in patients with coexistent gout and hypertension.
Many hypertensive patients fail to reach their target blood pressures (although with the “looser” recommendations in the latest guidelines,4 we may appear to be doing a better job). The reasons for failing to reach target pressures are complex and many: physicians may simply not be aggressive enough in pursuing a target blood pressure; patients cannot tolerate the drugs or cannot afford the drugs; and many patients need two or more antihypertensive drugs to achieve adequate control. Thiazides are cheap and effective5 and work synergistically with angiotensin-converting enzyme inhibitors and angiotensin receptor blockers.6
Thus, in many patients, avoiding or discontinuing a thiazide may inhibit our ability to control their hypertension, which is a key contributor to cardiovascular events and chronic kidney injury in patients with gout. Since other diuretics (eg, loop diuretics, which can lower blood pressure but often require split doses) also raise the serum urate level, switching to one of them will not eliminate concern over hyperuricemia.
Thiazides and serum urate
Thiazides slightly increase the serum urate level and in a dose-dependent manner. At the doses commonly used in treating hypertension (12.5 or 25 mg once a day), hydrochlorothiazide increases the serum urate level by 0.8 mg/dL or less in patients with normal renal function, as shown in a number of older hypertension treatment trials and in a recent prospective study.1 The effect of chlorthalidone is similar.
In patients with chronic gout treated with a xanthine oxidase inhibitor (allopurinol or febuxostat) to lower the serum urate to the American College of Rheumatology’s recommended target level7 of less than 6.0 mg/dL (or < 5 mg/dL in the British Rheumatology guidelines), this small elevation in serum urate is unlikely to negate the clinical efficacy of these drugs when dosing is optimized. Small studies have demonstrated a clinically insignificant pharmacodynamic interaction between thiazides and xanthine oxidase inhibitors.8,9 When I add a thiazide to a patient’s regimen, I do not usually need to increase the dose of allopurinol significantly to keep the serum urate level below the desired target.
Switch antihypertensive therapy
Occasionally, in a patient with chronic gout and mild hypertension who has a serum urate level marginally above the estimated precipitation threshold of 6.7 mg/dL, it is reasonable to simply switch the thiazide to another antihypertensive, such as losartan. Losartan is a weak uricosuric and can lower the serum urate level slightly, possibly making the addition of another hypouricemic agent unnecessary, while still controlling the blood pressure with a single pill. This decision must be individualized, taking into consideration the efficacy and cost of the alternative antihypertensive drug, as well as the potential but as yet unproven cardiovascular and renal benefits of lowering the serum urate with a more potent hypouricemic to a degree not likely to be attained with losartan alone.
Continue thiazide, adjust gout therapy
Discontinuing a thiazide or switching to another antihypertensive drug may increase the cost and decrease the efficacy of hypertensive therapy. Continuing thiazide therapy and, if necessary, adjusting hypouricemic therapy will not worsen the control of the serum urate level or gouty arthritis, and in most patients will not complicate the management of gout.
ASPIRIN AND HYPERURICEMIA
In answer to a separate but related question, aspirin in low doses for cardioprotection (81 mg daily) also need not be stopped in patients with hyperuricemia or gout in an effort to better control the serum urate level. Low-dose aspirin increases the serum urate level by about 0.3 mg/dL. Since patients with gout have a higher risk of having cardiovascular disease, metabolic syndrome, and chronic kidney disease, many will benefit from low-dose aspirin therapy.
- McAdams DeMarco MA, Maynard JW, Baer AN, et al. Diuretic use, increased serum urate levels, and risk of incident gout in a population-based study of adults with hypertension: the Atherosclerosis Risk in Communities cohort study. Arthritis Rheum 2012; 64:121–129.
- Choi HK, Soriano LC, Zhang Y, Rodríguez LA. Antihypertensive drugs and risk of incident gout among patients with hypertension: population based case-control study. BMJ 2012; 344:d8190.
- Hueskes BA, Roovers EA, Mantel-Teeuwisse AK, Janssens HJ, van de Lisdonk EH, Janssen M. Use of diuretics and the risk of gouty arthritis: a systematic review. Semin Arthritis Rheum 2012; 41:879–889.
- James PA, Oparil S, Carter BL, et al. 2014 Evidence-based guideline for the management of high blood pressure in adults. Report from the panel members appointed to the Eighth Joint National Committee (JNC 8). JAMA 2013; doi: 10.1001/jama2013.284427
- Fuchs FD. Diuretics: still essential drugs for the management of hypertension. Expert Rev Cardiovasc Ther 2009; 7:591–598.
- Sood N, Reinhart KM, Baker WL. Combination therapy for the management of hypertension: a review of the evidence. Am J Health Syst Pharm 2010; 67:885–894.
- Khanna D, Fitzgerald JD, Khanna PP, et al; American College of Rheumatology. 2012 American College of Rheumatology guidelines for management of gout. Part 1: systematic nonpharmacologic and pharmacologic therapeutic approaches to hyperuricemia. Arthritis Care Res (Hoboken) 2012; 64:1431–1446.
- Löffler W, Landthaler R, de Vries JX, et al. Interaction of allopurinol and hydrochlorothiazide during prolonged oral administration of both drugs in normal subjects. I. Uric acid kinetics. Clin Investig 1994; 72:1071–1075.
- Grabowski B, Khosravan R, Wu JT, Vernillet L, Lademacher C. Effect of hydrochlorothiazide on the pharmacokinetics and pharmacodynamics of febuxostat, a non-purine selective inhibitor of xanthine oxidase. Br J Clin Pharmacol 2010; 70:57–64.