User login
Society of Hospital Medicine Debuts New Educational Tracks, Pre-Courses at HM14
SHM’s annual meeting offers something new each year. For HM14, a timely new track dubbed “Bending the Cost Curve” will focus on hospitalists’ role in improving cost effectiveness for the healthcare system as a whole.
“The value equation has always been something that’s near and dear to us,” says HM14 course director Daniel Brotman, MD, SFHM. “What’s different now is that cost shifting to the outpatient setting is something that is now being recognized as a potential unintended consequence of rushing through hospitalizations. And as we’re moving into the accountable-care world, making sure that the cost shifting does not occur…is really important.
“That means that hospitalists need to own the care transition.”

–Leslie Flores, MHA, a partner in Nelson Flores Hospital Medicine Consultants, a member of SHM’s Practice Analysis Committee, and co-director for the practice management pre-course
The debut offerings don’t stop there. Three new pre-courses are on this year’s agenda: “Cardiology: What Hospitalists Need to Know as Front-Line Providers,” “Efficient High-Value Evidence-Based Medicine for the Practicing Hospitalist,” and “NP/PA Playbook for Hospital Medicine.”
“As a pre-course director, I think the educational aspect is what sets the tone for the whole meeting,” says Leslie Flores, MHA, a partner in Nelson Flores Hospital Medicine Consultants, a member of SHM’s Practice Analysis Committee, and co-director for the practice management pre-course, “Where the Rubber Meets the Road: Managing in the Era of Healthcare Reform. “People come looking to improve their clinical skills and their hospitalist groups.”
Pre-courses are critical to the meeting’s educational offerings. In that vein, HM14 is keeping pace with generational reform in care delivery and payment methodologies.
“The educational component—particularly the practice management track—is increasingly important in this era of rapid change,” Flores adds. “I don’t think any hospitalist anywhere in the country can afford to put his or her head in the sand and pretend it’s business as usual.”
To that end, another new feature at HM14 is a panel discussion titled, “Obamacare Is Here: What Does It Mean for You and Your Hospital?” The participants are a who’s who of the specialty’s thought leaders: Centers for Medicare & Medicaid Services chief medical officer Patrick Conway, MD, MSc, FAAP, SFHM; executive director and CEO of the Medical University of South Carolina and former SHM president Patrick Cawley, MD, MHM, FACP; veteran healthcare executive Patrick Courneya, MD; and American Enterprise Institute resident fellow Scott Gottlieb, MD.
“The SHM annual meeting is pretty much the only place a hospitalist can go to learn about these changes,” Flores says, “and how to cope with them from a hospitalist’s perspective.”
Richard Quinn is a freelance writer in New Jersey.
SHM’s annual meeting offers something new each year. For HM14, a timely new track dubbed “Bending the Cost Curve” will focus on hospitalists’ role in improving cost effectiveness for the healthcare system as a whole.
“The value equation has always been something that’s near and dear to us,” says HM14 course director Daniel Brotman, MD, SFHM. “What’s different now is that cost shifting to the outpatient setting is something that is now being recognized as a potential unintended consequence of rushing through hospitalizations. And as we’re moving into the accountable-care world, making sure that the cost shifting does not occur…is really important.
“That means that hospitalists need to own the care transition.”
–Leslie Flores, MHA, a partner in Nelson Flores Hospital Medicine Consultants, a member of SHM’s Practice Analysis Committee, and co-director for the practice management pre-course
The debut offerings don’t stop there. Three new pre-courses are on this year’s agenda: “Cardiology: What Hospitalists Need to Know as Front-Line Providers,” “Efficient High-Value Evidence-Based Medicine for the Practicing Hospitalist,” and “NP/PA Playbook for Hospital Medicine.”
“As a pre-course director, I think the educational aspect is what sets the tone for the whole meeting,” says Leslie Flores, MHA, a partner in Nelson Flores Hospital Medicine Consultants, a member of SHM’s Practice Analysis Committee, and co-director for the practice management pre-course, “Where the Rubber Meets the Road: Managing in the Era of Healthcare Reform. “People come looking to improve their clinical skills and their hospitalist groups.”
Pre-courses are critical to the meeting’s educational offerings. In that vein, HM14 is keeping pace with generational reform in care delivery and payment methodologies.
“The educational component—particularly the practice management track—is increasingly important in this era of rapid change,” Flores adds. “I don’t think any hospitalist anywhere in the country can afford to put his or her head in the sand and pretend it’s business as usual.”
To that end, another new feature at HM14 is a panel discussion titled, “Obamacare Is Here: What Does It Mean for You and Your Hospital?” The participants are a who’s who of the specialty’s thought leaders: Centers for Medicare & Medicaid Services chief medical officer Patrick Conway, MD, MSc, FAAP, SFHM; executive director and CEO of the Medical University of South Carolina and former SHM president Patrick Cawley, MD, MHM, FACP; veteran healthcare executive Patrick Courneya, MD; and American Enterprise Institute resident fellow Scott Gottlieb, MD.
“The SHM annual meeting is pretty much the only place a hospitalist can go to learn about these changes,” Flores says, “and how to cope with them from a hospitalist’s perspective.”
Richard Quinn is a freelance writer in New Jersey.
Hospital Medicine Pioneer Bob Wachter, MD, MHM, Twitters Insights on HM14 Address

Bob Wachter, MD, MHM, the dean of hospital medicine, is pretty much the first to do anything in the field. First, he helped name it. Then, he helped it stand out. Now, he’s the first to give The Hospitalist a Twitter interview, a fitting nod to his technological prowess and knowledge of what’s what in the field. On stage at HM14 next month in Las Vegas, Dr. Wachter will give his 10th annual closing address, appropriately titled “10 Years of Wachter Keynotes: And Now for Something Completely Different.”
“I don’t know if he’s going to dress in something Vegas-esque,” says HM14 course director Daniel Brotman, MD, FACP, SFHM. “Who knows?”
QUESTION: How do you get excited for these end-of-meeting addresses year after year after year after—well, more than a few years now?
ANSWER: I build 1 big new tlk a yr:mtg gives me chnce 2 do so, takng some risks w/ frndly crowd. Speakng to >1K #hospitalists:how could tht get old?
Q: What is your talk-building process? As the veritable father of the field, how do you decide what you want to impart?
A: I try to pick one big topic/yr: doc of the future, changes in pt safety, how IT is transformng HC. Which one? Tickles my fancy, emergng trend.
Q: And what’s most important for this year, as the winds of the ACA, Obamacare exchanges, and pay for performance blow stronger?
A: Still musing. The uber-trends–the ones that’ll have legs ovr decades–are push to population health, wiring of HC system, and cost pressures.
Q: Those are terms HM docs didn’t learn in med school. How do they adjust to this new world of costs and wiring and population, oh my?
A: Remember, we’re 1 of th key disruptv inovatns of th pst 20 yrs. If we stop changng, we’ll be lapped by thos who fix probms. & we’ll deserv it.
Q: What changes do you see coming in the next year as the morass of ACA, ACO, VBP becomes more and more important?
A: ACA: fix the website. ACOs: hosps/med grps/insurrs scramblng to forge partnerships. VBP: move frm process 2 outcomes, new efficiency measurs & the fix of the SGR will entail some new, creative quality measures 4 docs: you’ll get your money but some will be at risk based on quality.
Q: You seem like an optimist on HM’s ability lead this change. What, specifically, makes u c the specialty as uniquely suited to the challenge?
A: HM is the 1st specialty 2 brand itself as being about both pt care AND systems improvement. Ths allows us 2 welcome change & lead the charge.
Q: What do you say to docs who say they’re so busy with pt care that systems change is a back burner issue for them?
A: I feel their pain; burnout & change fatigue r real. But I dont see a choice: we need 2 fix systems to ultimatly allow us 2 do our work, & well.
Q: Does systems change make the job any easier for HM docs, in addition to improving efficiency? How so?
A: Devil’s truly in the details, 2 simplistc 2 say it always does. Systems need 2 balance needs of pts, org, & wrkrs. Hard 2 always improv all 3.
Q: Last question: will this year’s talk have Vegas flair (shimmering outfits, hairpieces, or dancers) to entertain your fans?
A: Not quite that, but something in that genre... we’ll have to leave it at that. I figure for my 10th anniversary, what the hell. It’s Vegas.
–Richard Quinn
Health Strategist Ian Morrison, PhD, To Deliver Keynote Speech at HM14

Mix the insights of a policy wonk and the accent of Sean Connery, and you have Ian Morrison, PhD, one of the keynote speakers at SHM’s annual meeting this spring.
A native of Scotland, Dr. Morrison is a well-known author, consultant, and futurist who often lectures on where healthcare is headed in this country. Appropriately, his address is titled, “The Future of the Healthcare Marketplace: Playing the New Game.”
A second-time annual meeting speaker, who last addressed HM attendees in 2008, Dr. Morrison is a founding partner in Strategic Health Perspectives (SHP), a forecasting service for the healthcare industry that includes joint venture partners Harris Interactive and the Harvard School of Public Health’s Department of Health Policy and Management. Dr. Morrison is also president emeritus of the Institute for the Future (IFTF).
Dr. Morrison spoke at length with The Hospitalist about his speech next month in Las Vegas.
Question: What do you want a room full of hospitalists to know about what they should be doing?
Answer: What I’ve been urging groups to think about is to take the longer view. I think we all get caught up in the disaster of the moment, and it’s amplified by the ideological divide over healthcare and the politicization and partisanship over it. But I think what we’ve got to do is think about the one-, three-, and five-year time horizon, about the pace of change and what we’re trying to do here. Don’t conflate the future into a blur of simultaneous change. Some of these things are going to take time.
Q: How do you rise above that fray that is “the blur of simultaneous events?”
A: If you take the longer view, there are some things that are happening, no matter what, that will not be undone by even the politics of Washington, D.C. That is the massive consolidation in the delivery system—the fact that doctors are increasingly employed by hospital systems in the main. Now, this has always been true of hospitalists, but it’s increasingly true of cardiologists and everybody else. And those trends I don’t think are going to abate. The other “megatrend” that I think is over a longer time horizon is the increasing focus on reimbursement reform to reward quality and value, particularly on a population health basis. That, I think, has so much momentum that it’s unlikely to be undone. I urge people to think about the Wright Brothers as a metaphor, rather than the Indianapolis 500; let’s just get this sucker off the ground before we declare that flying is a bad idea.
Q: How do you tailor that message to hospitalists?
A: In this new environment, hospitalists are seen as one of the specialties that have got it, in terms of patient safety, quality, and care coordination. In my rattling around the country, I see hospitalists playing a pretty critical role in things like care transitions and readmission redesign. They are trying to limit readmissions to hospitals where there are certainly financial incentives, and increasing senior management’s attention on that question. So I think hospitalists are in the center of all of those kinds of discussions, at the ground level.

–Dr. Morrison
Q: Being at the eye of a storm isn’t always the best place to be. How do hospitalists navigate this landscape, both to address patient care challenges and to deal with the shift that’s going to take place over the next five to 10 years, regardless of how fumbled anything is politically?
A: The specialty may transform itself into more of a hospital-based care management specialty. In other words, just simply discharging patients and saying “My job is over” doesn’t seem to me to be the future of this particular discipline. I think they are going to be the hospital-based voice for redesigning care processes across the continuum of care. And they may find themselves reaching out, maybe not physically, but electronically and digitally, to patients as they leave the hospital and migrate back into their homes and into their other settings, like skilled nursing facilities and home care and long-term care. They’re having a more involved role in care coordination after the patient is gone, not necessarily on a routine basis, looking and seeing how they’re doing, but designing care processes across that system of care and monitoring their effectiveness.
Q: How does the healthcare system view hospital medicine?
A: Well, certainly among hospital CEOs and leaders, and I’m not just talking about ones that have medical training, I think they see [HM] as a critical asset. Hospitalists are actually in the vanguard of this transformation effect; they’re not the victims of it.
Richard Quinn is a freelance author in New Jersey.
Mix the insights of a policy wonk and the accent of Sean Connery, and you have Ian Morrison, PhD, one of the keynote speakers at SHM’s annual meeting this spring.
A native of Scotland, Dr. Morrison is a well-known author, consultant, and futurist who often lectures on where healthcare is headed in this country. Appropriately, his address is titled, “The Future of the Healthcare Marketplace: Playing the New Game.”
A second-time annual meeting speaker, who last addressed HM attendees in 2008, Dr. Morrison is a founding partner in Strategic Health Perspectives (SHP), a forecasting service for the healthcare industry that includes joint venture partners Harris Interactive and the Harvard School of Public Health’s Department of Health Policy and Management. Dr. Morrison is also president emeritus of the Institute for the Future (IFTF).
Dr. Morrison spoke at length with The Hospitalist about his speech next month in Las Vegas.
Question: What do you want a room full of hospitalists to know about what they should be doing?
Answer: What I’ve been urging groups to think about is to take the longer view. I think we all get caught up in the disaster of the moment, and it’s amplified by the ideological divide over healthcare and the politicization and partisanship over it. But I think what we’ve got to do is think about the one-, three-, and five-year time horizon, about the pace of change and what we’re trying to do here. Don’t conflate the future into a blur of simultaneous change. Some of these things are going to take time.
Q: How do you rise above that fray that is “the blur of simultaneous events?”
A: If you take the longer view, there are some things that are happening, no matter what, that will not be undone by even the politics of Washington, D.C. That is the massive consolidation in the delivery system—the fact that doctors are increasingly employed by hospital systems in the main. Now, this has always been true of hospitalists, but it’s increasingly true of cardiologists and everybody else. And those trends I don’t think are going to abate. The other “megatrend” that I think is over a longer time horizon is the increasing focus on reimbursement reform to reward quality and value, particularly on a population health basis. That, I think, has so much momentum that it’s unlikely to be undone. I urge people to think about the Wright Brothers as a metaphor, rather than the Indianapolis 500; let’s just get this sucker off the ground before we declare that flying is a bad idea.
Q: How do you tailor that message to hospitalists?
A: In this new environment, hospitalists are seen as one of the specialties that have got it, in terms of patient safety, quality, and care coordination. In my rattling around the country, I see hospitalists playing a pretty critical role in things like care transitions and readmission redesign. They are trying to limit readmissions to hospitals where there are certainly financial incentives, and increasing senior management’s attention on that question. So I think hospitalists are in the center of all of those kinds of discussions, at the ground level.
–Dr. Morrison
Q: Being at the eye of a storm isn’t always the best place to be. How do hospitalists navigate this landscape, both to address patient care challenges and to deal with the shift that’s going to take place over the next five to 10 years, regardless of how fumbled anything is politically?
A: The specialty may transform itself into more of a hospital-based care management specialty. In other words, just simply discharging patients and saying “My job is over” doesn’t seem to me to be the future of this particular discipline. I think they are going to be the hospital-based voice for redesigning care processes across the continuum of care. And they may find themselves reaching out, maybe not physically, but electronically and digitally, to patients as they leave the hospital and migrate back into their homes and into their other settings, like skilled nursing facilities and home care and long-term care. They’re having a more involved role in care coordination after the patient is gone, not necessarily on a routine basis, looking and seeing how they’re doing, but designing care processes across that system of care and monitoring their effectiveness.
Q: How does the healthcare system view hospital medicine?
A: Well, certainly among hospital CEOs and leaders, and I’m not just talking about ones that have medical training, I think they see [HM] as a critical asset. Hospitalists are actually in the vanguard of this transformation effect; they’re not the victims of it.
Richard Quinn is a freelance author in New Jersey.
Hospitalist Reviews of New Research on Antibiotic-Resistant Bacteria, Pressure Ulcers, Severe Alcoholic Hepatitis, and More
In This Edition
Literature At A Glance
A guide to this month’s studies
- Antibiotic resistance threats in the United States
- Turning for ulcer reduction: A multi-site, randomized, clinical trial in nursing homes
- Prednisolone with or without pentoxfylline, and survival of patients with severe alcoholic hepatitis
- Characteristics and impact of a hospitalist-staffed, post-discharge clinic
- Higher continuity of care results in lower rate of preventable hospitalizations
- Variation in surgical readmission rates depends on volume, mortality rates
- Patients prefer inpatient boarding to ED boarding
Antibiotic Resistance Threats in the United States, 2013
Clinical question: What antibiotic-resistant bacteria are the greatest threats for the next 10 years?
Background: Two million people suffer antibiotic-resistant infections yearly, and 23,000 die each year as a result. Most of these infections occur in the community, but deaths usually occur in healthcare settings. Cost estimates vary but may be as high as $20 billion in excess direct healthcare costs.
Study design: The CDC used several different surveys and databanks, including the National Antimicrobial Resistance Monitoring System, to collect data. The threat level for antibiotic-resistant bacteria was determined using several factors: clinical impact, economic impact, incidence, 10-year projection of incidence, transmissibility, availability of effective antibiotics, and barriers to prevention.
Setting: United States.
Synopsis: The CDC has three classifications of antibiotic-resistant bacteria: urgent, serious, and concerning. Urgent threats are high-consequence, antibiotic-resistant threats because of significant risks identified across several criteria. These threats might not currently be widespread but have the potential to become so and require urgent public health attention to identify infections and to limit transmission. They include carbapenem-resistant Enterobacteriaceae, drug-resistant Neisseria gonorrhoeae, and Clostridium difficile (does not have true resistance, but is a consequence of antibiotic overuse).
Serious threats are significant antibiotic-resistant threats. These threats will worsen and might become urgent without ongoing public health monitoring and prevention activities. They include multidrug-resistant Acinetobacter, drug-resistant Campylobacter, fluconazole-resistant Candida (a fungus), extended-spectrum β-lactamase-producing Enterobacteriaceae, vancomycin-resistant Enterococcus, multidrug-resistant Pseudomonas aeruginosa, drug-resistant non-typhoidal Salmonella, drug-resistant Salmonella Typhimurium, drug-resistant Shigella, methicillin-resistant Staphylococcus aureus, drug-resistant Streptococcus pneumonia, and drug-resistant tuberculosis.
Concerning threats are bacteria for which the threat of antibiotic resistance is low, and/ or there are multiple therapeutic options for resistant infections. These bacterial pathogens cause severe illness. Threats in this category require monitoring and, in some cases, rapid incident or outbreak response. These include vancomycin-resistant Staphylococcus aureus, erythromycin-resistant Group A Streptococcus, and clindamycin-resistant Group B Streptococcus. Research has shown patients with resistant infections have significantly longer hospital stays, delayed recuperation, long-term disability, and higher mortality. As resistance to current antibiotics occurs, providers are forced to use antibiotics that are more toxic, more expensive, and less effective.
The CDC recommends four core actions to fight antibiotic resistance:
- Preventing infections from occurring and preventing resistant bacteria from spreading (immunization, infection control, screening, treatment, and education);
- Tracking resistant bacteria;
- Improving the use of antibiotics (antibiotic stewardship); and
- Promoting the development of new antibiotics and new diagnostic tests for resistant bacteria.
Bottom line: Antibiotics are a limited resource. The more antibiotics are used today, the less likely they will continue to be effective in the future. The CDC lists 18 antibiotic-resistant organisms as urgent, serious, or concerning and recommends actions to combat the spread of current organisms and emergence of new antibiotic organisms.
Citation: Centers for Disease Control and Prevention. Antibiotic resistance threats in the United States, 2013. CDC website. September 16, 2013. Available at: www.cdc.gov/drugresistance/threat-report-2013. Accessed Nov. 30, 2013.
Turning for Ulcer Reduction: A Multi-Site Randomized Clinical Trial in Nursing Homes
Clinical question: Is there a difference between repositioning intervals of two, three, or four hours in pressure ulcer formation in nursing home residents on high-density foam mattresses?
Background: Pressure ulcer formation in nursing home residents is a common problem. Current standard of care requires repositioning every two hours in patients who are at risk for pressure ulcer formation. Few studies have been performed to assess a difference in repositioning interval. This study was conducted to see if there is a difference in pressure ulcer formation among residents on high-density foam mattresses at moderate to high risk (according to the Braden scale).
Study design: Multi-site, randomized, clinical trial.
Setting: Twenty U.S. and seven Canadian nursing homes using high-density foam mattresses.
Synopsis: A multi-site, randomized clinical trial was executed in 20 U.S. and seven Canadian nursing homes. More than 900 residents were randomized to two-, three-, or four-hour intervals for repositioning. All participants were at either moderate (13-14) or high (10-12) risk on the Braden scale for pressure ulcer formation. All facilities used high-density foam mattresses. All participants were monitored for pressure ulcer formation on the sacrum/coccyx, heel, or trochanter for three consecutive weeks.
There was no significant difference in pressure ulcer formation between the two-, three-, or four-hour interval repositioning groups. There was no significant difference in pressure ulcer formation between the moderate or high-risk groups. Only 2% of participants developed a pressure ulcer, all stage I or II.
It is not clear if the outcomes were purely related to the repositioning intervals, as this study group had a much lower rate of pressure ulcer formation compared to national averages and previous studies. The high-density foam mattress might have improved outcomes by evenly redistributing pressure so that less frequent repositioning was required. The level of documentation may have led to earlier recognition of early stage pressure ulcers as well. This study also was limited to nursing home residents at moderate to high risk of pressure ulcer development.
Bottom line: There is no significant difference in pressure ulcer formation between repositioning intervals of two, three, or four hours among moderate and high-risk nursing home residents using high-density foam mattresses.
Citation: Bergstrom N, Horn SD, Rapp MP, Stern A, Barrett R, Watkiss M. Turning for ulcer reduction: a multisite randomized clinical trial in nursing homes. 2013;61(10):1705-1713.
Prednisolone, Pentoxifylline, and Survival of Patients with Severe Alcoholic Hepatitis
Clinical question: Does the addition of pentoxifylline to prednisolone improve six-month mortality compared to prednisolone alone in patients with severe alcoholic hepatitis?
Background: Prednisolone improves liver function and reduces inflammation in patients with alcoholic hepatitis. Pentoxifylline appears to have a protective effect against hepatorenal syndrome in patients with severe alcoholic hepatitis. The medications have different mechanisms of action; therefore, the researchers hypothesized that the combination of medication would improve outcomes.
Study design: Multi-center, randomized, double-blinded clinical trial.
Setting: One Belgian and 23 French hospitals, from December 2007 to October 2010.
Synopsis: This study randomized 270 patients to receive either prednisolone and pentoxifylline or prednisolone and placebo for 28 days. Acute alcoholic hepatitis was defined by a positive biopsy, onset of jaundice three months prior to the study, and a Maddrey’s discriminant function score of >32. All patients were assessed for response to treatment using the Lille model at seven days of treatment, occurrence of hepatorenal syndrome, and survival at six months.
Results showed no significant difference in treatment response, alcohol relapse, death, time to death, or occurrence of hepatorenal syndrome between the two treatment groups; however, there were fewer episodes of hepatorenal syndrome in the pentoxifylline group.
Patients considered responders by the Lille model and those with lower Model for End-Stage Liver Disease scores had improved mortality. Patients treated with pentoxifylline had lower rates of hepatorenal syndrome at one month but no difference by six months. Patients with a lower Lille score had significantly less incidence of hepatorenal syndrome. The study may be underpowered to accurately determine outcomes other than six-month survival.
Bottom line: Adding pentoxifylline to prednisolone does not improve six-month survival in severe alcoholic hepatitis compared to prednisolone alone.
Citation: Mathurin P, Louvet A, Duhamel A, et al. Prednisolone with vs without pentoxifylline and survival of patients with severe alcoholic hepatitis: a randomized clinical trial. 2013;310(10):1033-1041.
Characteristics and Impact of Hospitalist-Staffed, Post-Discharge Clinic
Clinical question: What effect does a hospitalist-staffed, post-discharge clinic have on time to first post-hospitalization visit?
Background: Hospital discharge is a well-recognized care transition that can leave patients vulnerable to morbidity and re-hospitalization. Limited primary care access can hamper complex post-hospital follow-up. Discharge clinic models staffed by hospitalists have been developed to mitigate access issues, but research is lacking to describe their characteristics and benefits.
Study design: Single-center, prospective, observational database review.
Setting: Large, academic primary care practice affiliated with an academic medical center.
Synopsis: Between 2009 and 2011, this hospitalist-staffed, post-discharge clinic saw 596 patients, while the affiliated, large primary care practice saw 10,839 patients. Patients utilizing the hospitalist discharge clinic were more likely to be black (39% vs. 29%, <0.001) and to receive primary care from resident clinics (40% vs. 21%, <0.001). The median duration from hospital discharge to the first clinic visit was shorter for the post-discharge clinic (8.45 ± 0.43 days, <0.001).
The number of radiology and laboratory tests performed at the first post-discharge clinic visit showed similar patterns between the hospitalist discharge clinic and the primary care practice. Study design and size did not permit comparisons of readmission rates or mortality from time of discharge and also precluded evaluation of interventions on discharge-related medication errors or response time to outstanding test results.
Bottom line: A hospitalist-staffed, post-discharge clinic was associated with shorter time to first post-discharge visit, especially for patients who are black and receive primary care from resident clinics.
Citation: Doctoroff L, Nijhawan A, McNally D, Vanka A, Yu R, Mukamal KJ. The characteristics and impact of a hospitalist-staffed post-discharge clinic. 2013;126(11):1016.e9-1016.e15.
Higher Continuity of Care Results in Lower Rate of Preventable Hospitalizations
Clinical question: Is continuity of care related to preventable hospitalizations among older adults?
Background: Preventable hospitalizations cost approximately $25 billion annually in the U.S. The relationship between continuity of care and the risk of preventable hospitalization is unknown.
Study design: Retrospective cohort study.
Setting: Random sample of fee-for-service Medicare beneficiaries, for ambulatory visits and hospital admissions.
Synopsis: This study examined 3.2 million Medicare beneficiaries using 2008-2010 claims data to measure continuity and the first preventable hospitalization. The Prevention Quality Indicators definitions and technical specifications from the Agency for Healthcare Research and Quality were used to identify preventable hospitalizations. Both the continuity of care score and usual provider continuity score were used to calculate continuity metrics. Baseline risk of preventable hospitalization included age, sex, race, Medicaid dual-eligible status, and residential zip code.
During a two-year period, 12.6% of patients had a preventable hospitalization. After adjusting for variables, a 0.1 increase in continuity of care was associated with about a 2% lower rate of preventable hospitalization. Interestingly, continuity of care was not related to mortality rates.
This study extends prior research associating continuity of care with reduced rate of hospitalization; however, the associations found cannot assert a causal relationship. This study used coding practices that vary throughout the country, included only older fee-for-service Medicare beneficiaries, and could not verify why some patients had higher continuity of care. The authors suggest that efforts to strengthen physician-patient relationships through high-quality primary care will deter some hospital admissions.
Bottom line: Higher continuity of ambulatory care is associated with lower preventable hospitalizations in Medicare beneficiaries.
Citation: Nyweide DJ, Anthony DL, Bynum JP, et al. Continuity of care and the risk of preventable hospitalization in older adults. 2013;173(20):1879-1885.
Surgical Readmission Rate Variation Dependent on Surgical Volume, Surgical Mortality Rates
Clinical question: What factors determine rates of readmission after major surgery?
Background: Reducing hospital readmission rates has become a national priority. The U.S. patterns for surgical readmissions are unknown, as are the specific structural and quality characteristics of hospitals associated with lower surgical readmission rates.
Study design: Retrospective study of national Medicare data was used to calculate 30-day readmission rates for six major surgical procedures.
Setting: U.S. Hospitals, 2009-2010.
Synopsis: Six major surgical procedures were tracked by Medicare data, with 479,471 discharges from 3,004 hospitals. Structural characteristics included hospital size, teaching status, region, ownership, and proportion of patients living below the federal poverty line. Three well-established measures of surgical quality were used: the HQA surgical score, procedure volume, and 30-day mortality.
Hospitals in the highest quartile for surgical volume had a significantly lower readmission rate. Additionally, hospitals with the lowest surgical mortality rates had significantly lower readmission rates. Interestingly, high adherence to reported surgical process measures was only marginally associated with reduced admission rates. Prior studies have also shown inconsistent relationship between HQA surgical score and mortality.
Limitations to this study include inability to account for factors not captured by billing codes and the focus on a Medicare population.
Bottom line: Surgical readmission rates are associated with measures of surgical quality, specifically procedural volume and mortality.
Citation: Tsai TC, Joynt KE, Orav EJ, Gawande AA, Jha AK. Variation in surgical-readmission rates and quality of hospital care. 2013;369(12):1134-1142.
Patients Overwhelmingly Prefer Inpatient Boarding to ED Boarding
Clinical question: When hallway boarding is required, do patients prefer inpatient units over the ED?
Background: ED crowding is associated with patient dissatisfaction, ambulance diversion, delays in care, medical errors, and higher mortality rates. Strategies to alleviate the problem of boarding admitted patients in the ED can include relocation to inpatient hallways while awaiting a regular hospital bed. Traditional objections to inpatient hallway boarding include concerns regarding patient satisfaction and safety.
Study design: Structured telephone survey.
Setting: Suburban, university-based, teaching hospital.
Synopsis: Patients who required boarding in the ED hallway after hospital admission were eligible for inpatient hallway boarding according to the institutional protocol, which screens for those with only mild to moderate comorbidities. Of 110 consecutive patients contacted who experienced both ED and inpatient hallway boarding, 105 consented to participate in a tested telephone survey instrument.
The overall preferred location was inpatient hallways for 85% (95% CI 75-90) of respondents. Comparing ED boarding to inpatient hallway boarding, respondents preferred inpatient boarding with regard to staff availability (84%), safety (83%), confidentiality (82%), and comfort (79%).
Study results were subject to non-response bias, because working telephone numbers were required for study inclusion, as well as recall bias, because the survey was conducted within several months after discharge. This study’s results are based on actual patient experiences, whereas prior literature relied on patients to hypothesize the preferred environment after experiencing only ED hallway boarding to predict satisfaction.
Bottom line: Boarding in inpatient hallways was associated with higher patient satisfaction compared with ED hallway boarding.
Citation: Viccellio P, Zito JA, Sayage V, et al. Patients overwhelmingly prefer inpatient boarding to emergency department boarding [published online ahead of print September 21, 2013].
Society of Hospital Medicine's Annual Meeting Heads to Las Vegas

HM14 is expected to be the largest annual meeting yet, with nearly 3,000 projected attendees. The four-day meeting, March 24-27, has three new continuing medical courses (see “Debut,” on p. 16), a new “Bending the Cost Curve” track, and a panel discussion of Obamacare populated by four national thought leaders.
The meeting also serves up a bevy of perennial favorites: breakout sessions, practice management strategies, awards ceremonies, special interest forums, the popular Research, Innovation, and Clinical Vignette (RIV) poster competition, and a trio of keynote addresses.
For HM14 course director Daniel Brotman, MD, FACP, SFHM, and assistant course director Efren Manjarrez, MD, SFHM, crafting the convention is as much about taking a step back as it is about immersing oneself in the specialty.
“To really be able to take a step back and think about how we fit into that big picture may make you feel small and insignificant in the same way that thinking about the cosmos might,” says Dr. Brotman, director of the hospitalist program at Johns Hopkins Hospital in Baltimore. “But it certainly makes me feel like I’m part of a bigger goal and a grand vision for where we need to go as a medical society, as a field, and as practitioners in a world that needs change.”
–Dr. Brotman, director of the hospitalist program at Johns Hopkins Hospital in Baltimore.
SHM President Eric Howell, MD, SFHM, chief of hospital medicine at Johns Hopkins Bayview Medical Center in Baltimore, couldn’t agree more.
“Like many physicians, we’re busy doing our job day in and day out,” he says. “We lose [sight of] the fact that we’re privileged and lucky to be in a specialty that’s growing and makes the world a better place.”
For Darren Swenson, MD, a regional medical advisor for IPC The Hospitalist Co. in Las Vegas, who founded SHM’s society chapter there about a decade ago, the meeting is a chance to view his specialty from the proverbial 30,000 feet and to get policy updates and clinical information while reconnecting with old friends and colleagues. In recent years, he has had to choose between SHM’s annual event and the yearly meeting of the American College of Physician Executives.
This year, he’s doing both. And Dr. Swenson notes that the allure of SHM’s convention is not just the detail of each of its offerings. It’s all of them.
“It’s essential, because what you’re getting is those thought leaders, as well as the academics, as well as real life business education—all in one area,” Dr. Swenson says. “And when you’re able to choose your tracks to identify those programs that are of interest to you at that point in your career, it makes it very attractive.”
Richard Quinn is a freelance writer in New Jersey.
The new cardiovascular disease prevention guidelines: What you need to know
A significant milestone in evidence-based practice was reached in November 2013, when the American Heart Association and American College of Cardiology (AHA/ACC) published 4 clinical practice guidelines on the prevention of cardiovascular disease.1-4 These guidelines—on obesity, lifestyle management, cardiovascular disease (CVD) risk assessment, and cholesterol—were developed under the auspices of the National Heart, Lung, and Blood Institute (NHLBI) to update its prior guidelines on the treatment of hypertension, high cholesterol, and obesity that were published more than a decade ago.5-7 After the NHLBI had organized the respective guideline panels and progressed through most of the guideline development process (which lasted several years each), it arranged for the AHA/ACC to assume sponsorship and publication of the guidelines. The NHLBI decided its role should be to develop evidence reports, leaving the development of guidelines to professional organizations.
While the prior guidelines on hypertension and hypercholesterolemia were influential and widely cited as the standard of care, they were heavily influenced by expert opinion and were not strictly evidence based. The NHLBI sought to develop the new guidelines using more contemporary and rigorous evidence-based processes to meet standards set by the Institute of Medicine (IOM). The group started with key clinical questions, conducted comprehensive systematic reviews of the evidence, and then rated the quality of the evidence and assigned strength of recommendation ratings.8 The guidelines and evidence reports are lengthy, and are summarized below.
In December 2013, the Eighth Joint National Committee (the 5th panel organized by the NHLBI to address CVD prevention) published its updated guideline on the treatment of hypertension, which has also generated controversy. Visit www.jfponline.com to listen to an audiocast summary of these recommendations.9
Obesity and overweight
The guideline on managing obesity and overweight adults has 17 recommendations, only 3 of which are based on expert opinion.1 (TABLE 1 summarizes the strong [A] and moderate [B] recommendations.) The recommendations stress screening, diagnosis, and treatment using diet, exercise, and lifestyle modification. They also address bariatric surgery for those with a body mass index (BMI) ≥40 or a persisting BMI ≥35 despite weight loss interventions. This set of recommendations, like those of the United States Preventive Services Task Force, advises intensive interventions for weight management and additionally offers much more detail on recommended diet and exercise.
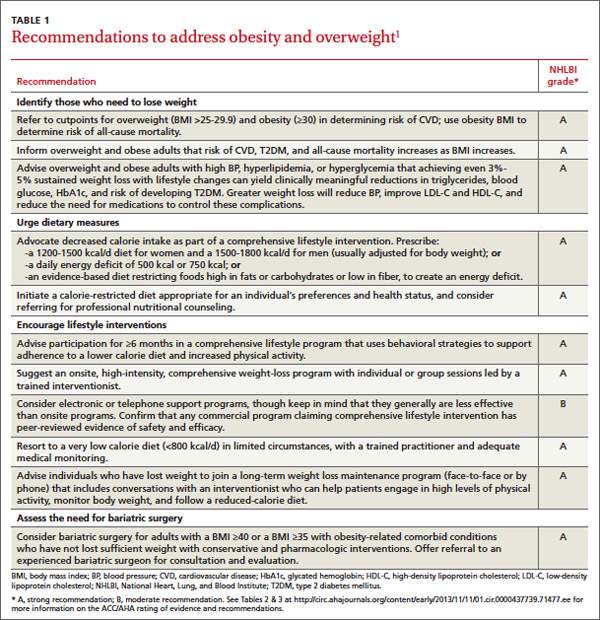
Lifestyle management
The 10 recommendations on lifestyle management to reduce cardiovascular risk, all evidence based, are limited to diet and exercise as a means to control hypertension and hypercholesterolemia.2 They do not cover other important lifestyle modifications for preventing CVD, such as smoking cessation. The guideline panel acknowledged that the interventions are aimed at those with high blood pressure and elevated cholesterol, but they encourage all adults to follow them. Although these recommendations are not particularly controversial, the 2 recommendations to reduce sodium intake are said to be based on strong or moderate strength evidence, in contrast to a recent IOM report that concluded evidence for the health benefits of salt intake <2.3 g/d is weak.10 This illustrates how separate authoritative groups can rate the strength of the same evidence differently.
Summary highlights:
• Encourage adults who would benefit from lowering either blood pressure (BP) or low-density lipoprotein cholesterol (LDL-C) to eat a diet that emphasizes vegetables, fruits, whole grains, low-fat dairy products, and other notably healthful foods, and to cut down on products high in sugar content and on red meats.
• Review, as appropriate, such options as the DASH (dietary approaches to stop hypertension) eating plan, US Department of Agriculture Food Patterns, or the American Heart Association’s diet.
• Establish a dietary plan that also incorporates nutritional requirements for an existing comorbidity, such as type 2 diabetes mellitus (T2DM).
• Lower saturated-fat intake to 5% to 6% of total calories, and reduce trans fats.
• Advise patients with high BP to reduce sodium consumption to ≤2400 mg/d; or, at the very least, to reduce daily consumption by 1000 mg.
• Promote aerobic activity to reduce either LDL-C or BP, at moderate or vigorous intensity 3 to 4 times a week with 40-minute sessions.

CVD risk assessment
The CVD risk assessment guideline3 has generated a lot of controversy. It proposes a new tool for assessing an individual’s 10-year risk of developing an atherosclerotic cardiovascular disease (ASCVD) event, defined as a fatal or nonfatal heart attack or stroke. While the tool is new, the risk factor categories it uses have been known for decades: age, gender, race, lipid levels, diabetes, smoking status, and BP. It has not performed better in validation studies than other existing tools (all of which are suboptimal), and it may be worse.11,12 Moreover, this new tool has been tested only in African Americans and non-Hispanic whites. Using it could classify 33 million adults age 40 to 79 years as having a 10-year risk of 7.5%, and 13 million a risk between 5% and 7.5%.12 The significance of this is discussed in the next section on the management of high cholesterol levels.
Summary highlights:
• Use race- and sex-specific Pooled Cohort Equations to predict 10-year risk for a first hard ASCVD event (nonfatalmyocardial infarction, coronary death, or nonfatal or fatal stroke) in non-Hispanic African Americans and non-Hispanic Whites, 40 to 79 years of age.
• Consider assessing a patient’s family history, high-sensitivity C-reactive protein, coronary artery calcium, or anklebrachial index to help guide treatment decisions if quantitative risk assessment has led to uncertainty. (This recommendation is based on expert opinion.)
• Consider evaluating ASCVD risk factors every 4 to 6 years in individuals 20 to 79 years of age who do not have ASCVD, and calculating the 10-year risk of an ASCVD event in those 40 to 79 years of age.
• Consider evaluating 30-year or lifetime ASCVD risk using traditional risk factors in individuals 20 to 59 years of age who do not have ASCVD and have no high short-term risk. (This is based on low-level evidence.)
Cholesterol management
The guideline on lowering blood cholesterol4 is a significant departure from the previous one.6 It contains 54 recommendations, 21 based on expert opinion. Using an unusual methodology that considered only randomized controlled trials in the evidence report, the guideline panel stated that the evidence demonstrates that 4 groups will benefit from treatment with statins:
• patients with established ASCVD
• individuals whose LDL-C is ≥190 mg/dL
• patients with diabetes and no established ASCVD who are 40 to 75 years of age and have an LDL-C between 70 and 189 mg/dL
• anyone with an estimated 10-year ASCVD risk of ≥7.5% (based on the new risk-assessment tool) and an LDL-C of 70 to 189 mg/dL.
The major departure from the old guideline is an abandonment of “treating to target” that attempts to lower LDL-C to a specified level. The panel concluded that the evidence does not show any benefit in achieving a specified level of LDL-C and that this approach can lead to either over- or under-treatment. The proposed new approach is to use high-, moderate-, or low-intensity statin treatment based on a patient’s age and reason for treatment, and the dose that they can tolerate (TABLE 2).4
Absent any contraindications, high-intensity treatment is indicated for:
• patients ≤75 years old with established ASCVD
• patients with an LDL-C level ≥190mg/dL
• patients 40 to 75 years old with diabetes and a ≥7.5% 10-year risk of ASCVD. z
Moderate-intensity treatment is indicated for those who cannot tolerate a high-intensity regimen, and for those ages 40 to 75 with diabetes and <7.5% 10-year ASCVD risk.
Low-intensity treatment is recommended for those who should receive moderate-intensity treatment but cannot tolerate it.
For those >75 years of age, the guideline makes only 2 recommendations:
• Prescribe a statin at the highest tolerable intensity for an LDL-C ≥190mg/dL.
• Assess those with established ASCVD for potential benefits and risks of moderate to high-intensity statin treatment. (It is reasonable to continue statin therapy for those already on it and tolerating it.)
Value of nonstatin drugs is questionable. In another significant departure from the previous guideline, the panel said that other cholesterol-lowering drugs can be considered when LDL-C remains high after statin treatment, but the benefit of these agents in preventing ASCVD is not proven.
Several objections to the new guideline have been raised in the short time since its release. Criticisms center on the large number of adults who would now qualify for statin treatment based on the new risk-assessment tool. Using the 7.5% 10-year risk cutoff, the number needed to treat to prevent one ASCVD event over 10 years would be 67. Also of concern to many is the fact that 7 out of 16 members of the guideline panel had financial ties to the pharmaceutical industry.12
Commentary
The new guidelines reflect a more rigorous evidence-based approach than those of the past. That some of them diverge significantly from previous recommendations that relied heavily on expert opinion reveals the pitfalls of making authoritative recommendations based on weak evidence. Such recommendations, especially those emerging from the National Institutes of Health, are used as national and international standards and serve as the basis of performance measures. When they do not stand the test of time because of a weak evidence base, medicine’s reputation is damaged. Notably, the new set of cholesterol recommendations, while an improvement from an evidentiary perspective, is founded partly on a questionable risk-assessment tool, and it is possible it will suffer the same long-term fate as its predecessor. (For more on these guidelines, see “The new cholesterol guideline: Beyond the headlines,” [J Fam Pract. 2013;62:730.])
1. Jensen MD, Ryan DH, Apovian CM, et al. 2013 AHA/ACC/TOS Guideline for the management of overweight and obesity in adults: a report of the American College of Cardiology/American Heart Association Task Force on Practice Guidelines and The Obesity Society. Circulation. 2013 Nov 12. [Epub ahead of print].
2. Eckel RH, Jakicic JM, Ard JD, et al. 2013 AHA/ACC Guideline on lifestyle management to reduce cardiovascular risk: a report of the American College of Cardiology/American Heart Association Task Force on Practice Guidelines. Circulation. 2013 Nov 12. [Epub ahead of print].
3. Goff DC Jr, Lloyd-Jones DM, Bennett G, et al. 2013 ACC/AHA Guideline on the assessment of cardiovascular risk: a report of the American College of Cardiology/American Heart Association Task Force on Practice Guidelines. Circulation. 2013 Nov 12. [Epub ahead of print].
4. Stone NJ, Robinson J, Lichtenstein AH, et al. 2013 ACC/AHA Guideline on the treatment of blood cholesterol to reduce atherosclerotic cardiovascular risk in adults: a report of the American College of Cardiology/American Heart Association Task Force on Practice Guidelines. Circulation. 2013 Nov 12. [Epub ahead of print].
5. National Cholesterol Education Program (NCEP) Expert Panel on Detection, Evaluation, and Treatment of High Blood Cholesterol in Adults (Adult Treatment Panel III). Third report of the National Cholesterol Education Program (NCEP) Expert Panel on Detection, Evaluation and Treatment of High Blood Cholesterol in Adults (Adult Treatment Panel III) final report. Circulation. 2002;106:3143-3421.
6. Chobanian AV, Bakris GL, Black HR, et al; Joint National Committee on Prevention Detection, Evaluation, and Treatment of High Blood Pressure. National Heart, Lung, and Blood Institute; National High Blood Pressure Education Program Coordinating Committee. The seventh report of the Joint National Committee on Prevention, Detection, Evaluation, and Treatment of High Blood Pressure: The JNC 7 report. JAMA. 2003;289:2560-2572.
7. Clinical guidelines on the identification, evaluation and treatment of overweight and obesity in adults—the evidence report. National Institutes of Health. Obes Res. 1998;6(Suppl 2):51S-209S.
8. Institute of Medicine. Clinical Practice Guidelines we can trust. Washington, DC: National Academy of Sciences; 2011.
9. James PA, Oparil S, Carter BL, et al. 2014 Evidence-based guideline for the management of high blood pressure in adults. Report from the panel members appointed to the Eighth Joint National Committee (JNC 8). JAMA. 2013 Dec 18. [Epub ahead of print].
10. Institute of Medicine. Sodium intake in populations: assessment of evidence. Washington, DC: National Academy of Sciences; 2013.
11. Siontis GC, Tzoulaki I, Siontis KC, et al. Comparisons of established risk prediction models for cardiovascular disease: systematic review. BMJ. 2012;344:e3318.
12. Ioannidis JP. More than a billion people taking statins? Potential political implications of the new cardiovascular guidelines. JAMA. 2013 Dec 2. [Epub ahead of print].
A significant milestone in evidence-based practice was reached in November 2013, when the American Heart Association and American College of Cardiology (AHA/ACC) published 4 clinical practice guidelines on the prevention of cardiovascular disease.1-4 These guidelines—on obesity, lifestyle management, cardiovascular disease (CVD) risk assessment, and cholesterol—were developed under the auspices of the National Heart, Lung, and Blood Institute (NHLBI) to update its prior guidelines on the treatment of hypertension, high cholesterol, and obesity that were published more than a decade ago.5-7 After the NHLBI had organized the respective guideline panels and progressed through most of the guideline development process (which lasted several years each), it arranged for the AHA/ACC to assume sponsorship and publication of the guidelines. The NHLBI decided its role should be to develop evidence reports, leaving the development of guidelines to professional organizations.
While the prior guidelines on hypertension and hypercholesterolemia were influential and widely cited as the standard of care, they were heavily influenced by expert opinion and were not strictly evidence based. The NHLBI sought to develop the new guidelines using more contemporary and rigorous evidence-based processes to meet standards set by the Institute of Medicine (IOM). The group started with key clinical questions, conducted comprehensive systematic reviews of the evidence, and then rated the quality of the evidence and assigned strength of recommendation ratings.8 The guidelines and evidence reports are lengthy, and are summarized below.
In December 2013, the Eighth Joint National Committee (the 5th panel organized by the NHLBI to address CVD prevention) published its updated guideline on the treatment of hypertension, which has also generated controversy. Visit www.jfponline.com to listen to an audiocast summary of these recommendations.9
Obesity and overweight
The guideline on managing obesity and overweight adults has 17 recommendations, only 3 of which are based on expert opinion.1 (TABLE 1 summarizes the strong [A] and moderate [B] recommendations.) The recommendations stress screening, diagnosis, and treatment using diet, exercise, and lifestyle modification. They also address bariatric surgery for those with a body mass index (BMI) ≥40 or a persisting BMI ≥35 despite weight loss interventions. This set of recommendations, like those of the United States Preventive Services Task Force, advises intensive interventions for weight management and additionally offers much more detail on recommended diet and exercise.
Lifestyle management
The 10 recommendations on lifestyle management to reduce cardiovascular risk, all evidence based, are limited to diet and exercise as a means to control hypertension and hypercholesterolemia.2 They do not cover other important lifestyle modifications for preventing CVD, such as smoking cessation. The guideline panel acknowledged that the interventions are aimed at those with high blood pressure and elevated cholesterol, but they encourage all adults to follow them. Although these recommendations are not particularly controversial, the 2 recommendations to reduce sodium intake are said to be based on strong or moderate strength evidence, in contrast to a recent IOM report that concluded evidence for the health benefits of salt intake <2.3 g/d is weak.10 This illustrates how separate authoritative groups can rate the strength of the same evidence differently.
Summary highlights:
• Encourage adults who would benefit from lowering either blood pressure (BP) or low-density lipoprotein cholesterol (LDL-C) to eat a diet that emphasizes vegetables, fruits, whole grains, low-fat dairy products, and other notably healthful foods, and to cut down on products high in sugar content and on red meats.
• Review, as appropriate, such options as the DASH (dietary approaches to stop hypertension) eating plan, US Department of Agriculture Food Patterns, or the American Heart Association’s diet.
• Establish a dietary plan that also incorporates nutritional requirements for an existing comorbidity, such as type 2 diabetes mellitus (T2DM).
• Lower saturated-fat intake to 5% to 6% of total calories, and reduce trans fats.
• Advise patients with high BP to reduce sodium consumption to ≤2400 mg/d; or, at the very least, to reduce daily consumption by 1000 mg.
• Promote aerobic activity to reduce either LDL-C or BP, at moderate or vigorous intensity 3 to 4 times a week with 40-minute sessions.
CVD risk assessment
The CVD risk assessment guideline3 has generated a lot of controversy. It proposes a new tool for assessing an individual’s 10-year risk of developing an atherosclerotic cardiovascular disease (ASCVD) event, defined as a fatal or nonfatal heart attack or stroke. While the tool is new, the risk factor categories it uses have been known for decades: age, gender, race, lipid levels, diabetes, smoking status, and BP. It has not performed better in validation studies than other existing tools (all of which are suboptimal), and it may be worse.11,12 Moreover, this new tool has been tested only in African Americans and non-Hispanic whites. Using it could classify 33 million adults age 40 to 79 years as having a 10-year risk of 7.5%, and 13 million a risk between 5% and 7.5%.12 The significance of this is discussed in the next section on the management of high cholesterol levels.
Summary highlights:
• Use race- and sex-specific Pooled Cohort Equations to predict 10-year risk for a first hard ASCVD event (nonfatalmyocardial infarction, coronary death, or nonfatal or fatal stroke) in non-Hispanic African Americans and non-Hispanic Whites, 40 to 79 years of age.
• Consider assessing a patient’s family history, high-sensitivity C-reactive protein, coronary artery calcium, or anklebrachial index to help guide treatment decisions if quantitative risk assessment has led to uncertainty. (This recommendation is based on expert opinion.)
• Consider evaluating ASCVD risk factors every 4 to 6 years in individuals 20 to 79 years of age who do not have ASCVD, and calculating the 10-year risk of an ASCVD event in those 40 to 79 years of age.
• Consider evaluating 30-year or lifetime ASCVD risk using traditional risk factors in individuals 20 to 59 years of age who do not have ASCVD and have no high short-term risk. (This is based on low-level evidence.)
Cholesterol management
The guideline on lowering blood cholesterol4 is a significant departure from the previous one.6 It contains 54 recommendations, 21 based on expert opinion. Using an unusual methodology that considered only randomized controlled trials in the evidence report, the guideline panel stated that the evidence demonstrates that 4 groups will benefit from treatment with statins:
• patients with established ASCVD
• individuals whose LDL-C is ≥190 mg/dL
• patients with diabetes and no established ASCVD who are 40 to 75 years of age and have an LDL-C between 70 and 189 mg/dL
• anyone with an estimated 10-year ASCVD risk of ≥7.5% (based on the new risk-assessment tool) and an LDL-C of 70 to 189 mg/dL.
The major departure from the old guideline is an abandonment of “treating to target” that attempts to lower LDL-C to a specified level. The panel concluded that the evidence does not show any benefit in achieving a specified level of LDL-C and that this approach can lead to either over- or under-treatment. The proposed new approach is to use high-, moderate-, or low-intensity statin treatment based on a patient’s age and reason for treatment, and the dose that they can tolerate (TABLE 2).4
Absent any contraindications, high-intensity treatment is indicated for:
• patients ≤75 years old with established ASCVD
• patients with an LDL-C level ≥190mg/dL
• patients 40 to 75 years old with diabetes and a ≥7.5% 10-year risk of ASCVD. z
Moderate-intensity treatment is indicated for those who cannot tolerate a high-intensity regimen, and for those ages 40 to 75 with diabetes and <7.5% 10-year ASCVD risk.
Low-intensity treatment is recommended for those who should receive moderate-intensity treatment but cannot tolerate it.
For those >75 years of age, the guideline makes only 2 recommendations:
• Prescribe a statin at the highest tolerable intensity for an LDL-C ≥190mg/dL.
• Assess those with established ASCVD for potential benefits and risks of moderate to high-intensity statin treatment. (It is reasonable to continue statin therapy for those already on it and tolerating it.)
Value of nonstatin drugs is questionable. In another significant departure from the previous guideline, the panel said that other cholesterol-lowering drugs can be considered when LDL-C remains high after statin treatment, but the benefit of these agents in preventing ASCVD is not proven.
Several objections to the new guideline have been raised in the short time since its release. Criticisms center on the large number of adults who would now qualify for statin treatment based on the new risk-assessment tool. Using the 7.5% 10-year risk cutoff, the number needed to treat to prevent one ASCVD event over 10 years would be 67. Also of concern to many is the fact that 7 out of 16 members of the guideline panel had financial ties to the pharmaceutical industry.12
Commentary
The new guidelines reflect a more rigorous evidence-based approach than those of the past. That some of them diverge significantly from previous recommendations that relied heavily on expert opinion reveals the pitfalls of making authoritative recommendations based on weak evidence. Such recommendations, especially those emerging from the National Institutes of Health, are used as national and international standards and serve as the basis of performance measures. When they do not stand the test of time because of a weak evidence base, medicine’s reputation is damaged. Notably, the new set of cholesterol recommendations, while an improvement from an evidentiary perspective, is founded partly on a questionable risk-assessment tool, and it is possible it will suffer the same long-term fate as its predecessor. (For more on these guidelines, see “The new cholesterol guideline: Beyond the headlines,” [J Fam Pract. 2013;62:730.])
1. Jensen MD, Ryan DH, Apovian CM, et al. 2013 AHA/ACC/TOS Guideline for the management of overweight and obesity in adults: a report of the American College of Cardiology/American Heart Association Task Force on Practice Guidelines and The Obesity Society. Circulation. 2013 Nov 12. [Epub ahead of print].
2. Eckel RH, Jakicic JM, Ard JD, et al. 2013 AHA/ACC Guideline on lifestyle management to reduce cardiovascular risk: a report of the American College of Cardiology/American Heart Association Task Force on Practice Guidelines. Circulation. 2013 Nov 12. [Epub ahead of print].
3. Goff DC Jr, Lloyd-Jones DM, Bennett G, et al. 2013 ACC/AHA Guideline on the assessment of cardiovascular risk: a report of the American College of Cardiology/American Heart Association Task Force on Practice Guidelines. Circulation. 2013 Nov 12. [Epub ahead of print].
4. Stone NJ, Robinson J, Lichtenstein AH, et al. 2013 ACC/AHA Guideline on the treatment of blood cholesterol to reduce atherosclerotic cardiovascular risk in adults: a report of the American College of Cardiology/American Heart Association Task Force on Practice Guidelines. Circulation. 2013 Nov 12. [Epub ahead of print].
5. National Cholesterol Education Program (NCEP) Expert Panel on Detection, Evaluation, and Treatment of High Blood Cholesterol in Adults (Adult Treatment Panel III). Third report of the National Cholesterol Education Program (NCEP) Expert Panel on Detection, Evaluation and Treatment of High Blood Cholesterol in Adults (Adult Treatment Panel III) final report. Circulation. 2002;106:3143-3421.
6. Chobanian AV, Bakris GL, Black HR, et al; Joint National Committee on Prevention Detection, Evaluation, and Treatment of High Blood Pressure. National Heart, Lung, and Blood Institute; National High Blood Pressure Education Program Coordinating Committee. The seventh report of the Joint National Committee on Prevention, Detection, Evaluation, and Treatment of High Blood Pressure: The JNC 7 report. JAMA. 2003;289:2560-2572.
7. Clinical guidelines on the identification, evaluation and treatment of overweight and obesity in adults—the evidence report. National Institutes of Health. Obes Res. 1998;6(Suppl 2):51S-209S.
8. Institute of Medicine. Clinical Practice Guidelines we can trust. Washington, DC: National Academy of Sciences; 2011.
9. James PA, Oparil S, Carter BL, et al. 2014 Evidence-based guideline for the management of high blood pressure in adults. Report from the panel members appointed to the Eighth Joint National Committee (JNC 8). JAMA. 2013 Dec 18. [Epub ahead of print].
10. Institute of Medicine. Sodium intake in populations: assessment of evidence. Washington, DC: National Academy of Sciences; 2013.
11. Siontis GC, Tzoulaki I, Siontis KC, et al. Comparisons of established risk prediction models for cardiovascular disease: systematic review. BMJ. 2012;344:e3318.
12. Ioannidis JP. More than a billion people taking statins? Potential political implications of the new cardiovascular guidelines. JAMA. 2013 Dec 2. [Epub ahead of print].
When you suspect ACS, which serologic marker is best?
Measurement of troponin levels provides the most sensitive and accurate serologic information in evaluating a patient with acute coronary syndrome (ACS); troponin elevations are more sensitive than elevations of creatine kinase-MB (CK-MB). Isolated elevation of troponin levels increases the likelihood of myocardial infarction (MI) or death, whereas isolated elevation of CK-MB levels doesn’t. (Strength of recommendation [SOR] for all statements: A, multiple, large prospective cohort studies.)
Repeated measurement of troponin levels at presentation and then 3 and 6 hours afterward increases the diagnostic sensitivity for acute myocardial infarction (AMI) (SOR: A, multiple, small prospective studies).
EVIDENCE SUMMARY
Troponin I and T proteins are specific to cardiac myocytes and, unlike CK-MB, aren’t elevated by damage to skeletal muscle.
Measuring troponin levels increased the number of patients diagnosed with AMI
A multinational prospective cohort study of patients with suspected ACS (N=10,719) found that measuring troponin levels in addition to CK-MB levels improved the diagnosis of AMI.1 Investigators used elevation of any biomarker (CK, CK-MB, or troponin I or T) above the upper limit of normal as their diagnostic criterion. They found that measuring troponin increased the number of patients diagnosed with AMI by 10.4% over patients diagnosed using CK and CK-MB levels. Elevated troponin levels were associated with an inpatient mortality rate 1.5 to 3 times higher, regardless of the patient’s CK-MB status.
Troponin levels are more sensitive and specific than CK-MB
A prospective cohort study of 718 patients with suspected AMI calculated the area under curve (AUC) of the receiver operator curve—a measure of diagnostic accuracy in which an AUC value of 1 indicates 100% sensitivity and specificity—for troponin and CK-MB levels at initial presentation.2 Two independent cardiologists reviewed all available medical records and made the final diagnosis. The AUCs for troponin levels ranged from 0.94 to 0.96 compared with 0.88 for CK-MB.
Troponin levels and odds of MI or death
A prospective study of 1852 patients with suspected ACS from 3 trial populations evaluated the prognostic value of increased troponin levels vs CK-MB levels at initial presentation, compared with a reference group with normal troponin and CK-MB levels.3 Patients with isolated troponin elevation had an increased odds of MI or death at 24 hours (odds ratio [OR]=5.2; 95% confidence interval [CI], 2.2-11.9) and 30 days (OR=2.1; 95% CI, 1.4-3.0), whereas patients with isolated CK-MB elevations didn't. At 30 days, patients with isolated CK-MB elevations equaled the reference group odds for MI and death (OR=1.0; 95% CI, 0.6-1.6).
Serial troponin assessment boosts diagnostic sensitivity
A prospective cohort study found that serial measurements of troponin increased the diagnostic sensitivity for AMI.4 Investigators evaluated 1818 consecutive patients with new onset chest pain in 3 German chest-pain units with troponin levels on admission and at 3 and 6 hours later. The gold standard was diagnosis of AMI by 2 independent cardiologists. Troponin measurement produced an AUC of 0.96 at admission, increasing to 0.98 and 0.99 at 3 and 6 hours after admission, respectively.
RECOMMENDATIONS
The American College of Cardiology and American Heart Association recommend measuring biomarkers of cardiac injury in all patients who present with chest discomfort consistent with ACS.5 A cardiac-specific troponin is the preferred marker and should be measured in all patients. If troponin is not available, CK-MB is the best alternative. Cardiac biomarkers should be repeated 6 to 9 hours after presentation and, in patients with a high clinical suspicion of AMI, at 12 to 24 hours.6,7
1. Goodman SG, Steg PG, Eagle KA, et al; GRACE Investigators. The diagnostic and prognostic impact of the redefinition of acute myocardial infarction: lessons from the global registry of acute coronary events (GRACE). Am Heart J. 2006;151:654-660.
2. Reichlin T, Hochholzer W, Bassetti S, et al. Early diagnosis of myocardial infarction with sensitive cardiac troponin assays. N Engl J Med. 2009;361:858-867.
3. Rao SV, Ohman EM, Granger CB, et al. Prognostic value of isolated troponin elevation across the spectrum of chest pain syndromes. Am J Cardiol. 2003;91:936-940.
4. Keller T, Zeller T, Peetz D, et al. Sensitive troponin I assay in early diagnosis of acute myocardial infarction. N Engl J Med. 2009;361:868-877.
5. Anderson JL, Adams CD, Antman EM, et al. American College of Cardiology, American Heart Association Task Force on Practice Guidelines (Writing Committee, American College of Emergency Physicians, Society for Cardiovascular Angiography and Interventions, Society of Thoracic Surgeons, American Association of Cardiovascular and Pulmonary Rehabilitation, Society for Academic Emergency Medicine). ACC/AHA 2007 guidelines for the management of patients with unstable angina/non-ST-elevation myocardial infarction: a report of the American College of Cardiology. J Am Coll Cardiol. 2007;50:e1-e157.
6. Morrow DA, Cannon CP, Jesse RL, et al; National Academy of Clinical Biochemistry. National Academy of Clinical Biochemistry Laboratory Medicine practice guidelines: clinical characteristics and utilization of biochemical markers in acute coronary syndromes. Clin Chem. 2007;53:552-574.
7. Thygesen K, Alpert JS, White HD, et al. Universal definition of myocardial infarction. Circulation. 2007;116:2634-2653.
Measurement of troponin levels provides the most sensitive and accurate serologic information in evaluating a patient with acute coronary syndrome (ACS); troponin elevations are more sensitive than elevations of creatine kinase-MB (CK-MB). Isolated elevation of troponin levels increases the likelihood of myocardial infarction (MI) or death, whereas isolated elevation of CK-MB levels doesn’t. (Strength of recommendation [SOR] for all statements: A, multiple, large prospective cohort studies.)
Repeated measurement of troponin levels at presentation and then 3 and 6 hours afterward increases the diagnostic sensitivity for acute myocardial infarction (AMI) (SOR: A, multiple, small prospective studies).
EVIDENCE SUMMARY
Troponin I and T proteins are specific to cardiac myocytes and, unlike CK-MB, aren’t elevated by damage to skeletal muscle.
Measuring troponin levels increased the number of patients diagnosed with AMI
A multinational prospective cohort study of patients with suspected ACS (N=10,719) found that measuring troponin levels in addition to CK-MB levels improved the diagnosis of AMI.1 Investigators used elevation of any biomarker (CK, CK-MB, or troponin I or T) above the upper limit of normal as their diagnostic criterion. They found that measuring troponin increased the number of patients diagnosed with AMI by 10.4% over patients diagnosed using CK and CK-MB levels. Elevated troponin levels were associated with an inpatient mortality rate 1.5 to 3 times higher, regardless of the patient’s CK-MB status.
Troponin levels are more sensitive and specific than CK-MB
A prospective cohort study of 718 patients with suspected AMI calculated the area under curve (AUC) of the receiver operator curve—a measure of diagnostic accuracy in which an AUC value of 1 indicates 100% sensitivity and specificity—for troponin and CK-MB levels at initial presentation.2 Two independent cardiologists reviewed all available medical records and made the final diagnosis. The AUCs for troponin levels ranged from 0.94 to 0.96 compared with 0.88 for CK-MB.
Troponin levels and odds of MI or death
A prospective study of 1852 patients with suspected ACS from 3 trial populations evaluated the prognostic value of increased troponin levels vs CK-MB levels at initial presentation, compared with a reference group with normal troponin and CK-MB levels.3 Patients with isolated troponin elevation had an increased odds of MI or death at 24 hours (odds ratio [OR]=5.2; 95% confidence interval [CI], 2.2-11.9) and 30 days (OR=2.1; 95% CI, 1.4-3.0), whereas patients with isolated CK-MB elevations didn't. At 30 days, patients with isolated CK-MB elevations equaled the reference group odds for MI and death (OR=1.0; 95% CI, 0.6-1.6).
Serial troponin assessment boosts diagnostic sensitivity
A prospective cohort study found that serial measurements of troponin increased the diagnostic sensitivity for AMI.4 Investigators evaluated 1818 consecutive patients with new onset chest pain in 3 German chest-pain units with troponin levels on admission and at 3 and 6 hours later. The gold standard was diagnosis of AMI by 2 independent cardiologists. Troponin measurement produced an AUC of 0.96 at admission, increasing to 0.98 and 0.99 at 3 and 6 hours after admission, respectively.
RECOMMENDATIONS
The American College of Cardiology and American Heart Association recommend measuring biomarkers of cardiac injury in all patients who present with chest discomfort consistent with ACS.5 A cardiac-specific troponin is the preferred marker and should be measured in all patients. If troponin is not available, CK-MB is the best alternative. Cardiac biomarkers should be repeated 6 to 9 hours after presentation and, in patients with a high clinical suspicion of AMI, at 12 to 24 hours.6,7
1. Goodman SG, Steg PG, Eagle KA, et al; GRACE Investigators. The diagnostic and prognostic impact of the redefinition of acute myocardial infarction: lessons from the global registry of acute coronary events (GRACE). Am Heart J. 2006;151:654-660.
2. Reichlin T, Hochholzer W, Bassetti S, et al. Early diagnosis of myocardial infarction with sensitive cardiac troponin assays. N Engl J Med. 2009;361:858-867.
3. Rao SV, Ohman EM, Granger CB, et al. Prognostic value of isolated troponin elevation across the spectrum of chest pain syndromes. Am J Cardiol. 2003;91:936-940.
4. Keller T, Zeller T, Peetz D, et al. Sensitive troponin I assay in early diagnosis of acute myocardial infarction. N Engl J Med. 2009;361:868-877.
5. Anderson JL, Adams CD, Antman EM, et al. American College of Cardiology, American Heart Association Task Force on Practice Guidelines (Writing Committee, American College of Emergency Physicians, Society for Cardiovascular Angiography and Interventions, Society of Thoracic Surgeons, American Association of Cardiovascular and Pulmonary Rehabilitation, Society for Academic Emergency Medicine). ACC/AHA 2007 guidelines for the management of patients with unstable angina/non-ST-elevation myocardial infarction: a report of the American College of Cardiology. J Am Coll Cardiol. 2007;50:e1-e157.
6. Morrow DA, Cannon CP, Jesse RL, et al; National Academy of Clinical Biochemistry. National Academy of Clinical Biochemistry Laboratory Medicine practice guidelines: clinical characteristics and utilization of biochemical markers in acute coronary syndromes. Clin Chem. 2007;53:552-574.
7. Thygesen K, Alpert JS, White HD, et al. Universal definition of myocardial infarction. Circulation. 2007;116:2634-2653.
Evidence-based answers from the Family Physicians Inquiries Network
Which drugs are most effective for recurrent herpes labialis?
Daily oral acyclovir or valacyclovir may help prevent herpes simplex labialis (HSL) recurrences (strength of recommendation [SOR]: B, meta-analysis of randomized controlled trials [RCTs] with heterogeneous results).
No trials compare oral or topical treatments for HSL outbreaks against each other. Oral antivirals modestly reduce healing time and duration of pain, varying according to the agent used: valacyclovir reduces both healing time and duration of pain, famciclovir reduces both in one dosage form but not another, and acyclovir reduces only pain duration (SOR: B, single RCTs).
Several topical medications (acyclovir, penciclovir, docosanol) modestly decrease healing time and pain duration—typically by less than a day—and require multiple doses per day (SOR: B, multiple RCTs).
EVIDENCE SUMMARY
A systematic review and meta-analysis of the effectiveness of oral and topical nucleoside antiviral agents to prevent recurrent HSL in immunocompetent people found 11 RCTs with a total of 1250 patients that compared an active drug against placebo.1 The medications were topical 5% acyclovir, topical 1% penciclovir, and oral acyclovir, valacyclovir, or famciclovir in various doses. The primary outcome was recurrence of herpes simplex virus type 1 lesions during the treatment period. The relative risk (RR) of recurrence ranged from 0.22 to 1.22. Pooled results found a benefit favoring antiviral agents (RR of recurrence=0.70; 95% confidence interval [CI], 0.55-0.89).
Seven of the trials looked at acyclovir (5 oral, 2 topical). A subgroup analysis demonstrated that oral acyclovir (800-1000 mg/d) was more effective than placebo (RR=0.51; 95% CI, 0.29-0.88), whereas topical acyclovir wasn’t. Oral valacyclovir (2 studies; 500 mg/d for 4 months) also reduced recurrence (RR=0.65; 95% CI, 0.43-0.91). The authors of the meta-analysis noted that although 9 studies favored the use of an antiviral drug, only 4 showed statistically significant differences when compared with placebo, and none of them had a low risk of bias. They concluded that the review supported using oral acyclovir and valacyclovir to prevent recurrent HSL.1
Oral antivirals produce variable treatment results
Three RCTs evaluated oral antiviral medications against placebo to treat recurrent HSL, with mixed results. The largest RCT found that valacyclovir (2000 mg twice in 24 hours, with or without an additional 1000 mg twice in another 24 hours) modestly but significantly reduced both healing time and duration of pain (by 0.5-0.8 day).2 The second RCT showed that a higher, single dose of famciclovir (1500 mg) reduced healing time (by 1.8 days) and pain duration (by 1.2 days) and that a smaller, repeated dose (750 mg twice in 24 hours) reduced healing time alone (by 2.2 days).3
The third RCT demonstrated that acyclovir (400 mg 5 times a day for 5 days) reduced pain duration (by 0.9 day) but didn’t shorten healing time. If acyclovir was started during the prodrome, it decreased the time to disappearance of the lesion’s hard crust (2.1 days’ less time; P=.03), but the clinical significance of this finding is unclear.4
Topical treatment shows modest success
Two trials demonstrated that topical acyclovir (5% cream) modestly improved healing time and duration of pain (by as much as half a day). Patients in the first trial (paired RCTs reported together) began treatment within an hour of prodromal symptoms or signs, applying the medication 5 times daily for 4 days.5
Patients in the second trial used ME-609 cream (5% acyclovir plus 1% hydrocortisone), 5% acyclovir cream, or placebo, all applied 5 times daily for 5 days.6 Although the cream with acyclovir and hydrocortisone showed a slight benefit compared with placebo (lessening healing time by 0.8 day and pain duration by 1 day), it didn’t improve healing more than acyclovir alone. Other topical agents (penciclovir 1%; docosanol 10%) produced results similar to topical acyclovir.7,8
RECOMMENDATIONS
No national guidelines on this topic exist. An online resource notes that most patients don’t require treatment for mild self-limited HSL.9 For patients with prodromal symptoms, the authors recommend episodic oral antiviral therapy. Patients who have no prodome but multiple painful or disfiguring lesions may choose to use chronic suppressive therapy with an oral antiviral drug.
1. Rahimi H, Mara T, Costella J, et al. Effectiveness of antiviral agents for the prevention of recurrent herpes labialis: a systematic review and meta-analysis. Oral Surg Oral Med Oral Pathol Oral Radiol. 2012;113:618-627.
2. Spruance SL, Jones TM, Blatter MM, et al. High-dose, short-duration, early valacyclovir therapy for episodic treatment of cold sores: results of two randomized, placebo-controlled, multicenter studies. Antimicrob Agents Chemother. 2003;47:1072-1080.
3. Spruance SL, Bodsworth N, Resnick H, et al. Single-dose, patient-initiated famciclovir: a randomized, double-blind, placebo-controlled trial for episodic treatment of herpes labialis. J Am Acad Dermatol. 2006;55:47-53.
4. Spruance SL, Stewart JC, Rowe NH, et al. Treatment of recurrent herpes simplex labialis with oral acyclovir. J Infect Dis. 1990;161:185-190.
5. Spruance SL, Nett R, Marbury T, et al. Acyclovir cream for treatment of herpes simplex labialis: results of two randomized, double-blind, vehicle-controlled, multicenter clinical trials. Antimicrob Agents Chemother. 2002;46:2238-2243.
6. Hull CM, Harmenberg J, Arlander E, et al; ME-609 Studt Group. Early treatment of cold sores with topical ME-609 decreases the frequency of ulcerative lesions: a randomized, doubleblind, placebo-controlled, patient-initiated clinical trial. J Am Acad Dermatol. 2011;64:696.e1-696.e11.
7. Raborn GW, Martel AY, Lassonde M, et al; Worldwide Topical Penciclovir Collaborative Study Group. Effective treatment of herpes simplex labialis with penciclovir cream: combined results of two trials. J Am Dent Assoc. 2002;133:303-309.
8. Sacks SL, Thisted RA, Jones TM, et al; Docosanol 10% Cream Study Group. Clinical efficacy of topical docosanol 10% cream for herpes simplex labialis: a multicenter, randomized, placebo-controlled trial. J Am Acad Dermatol. 2001;45:222-230.
9. Klein RS. Treatment of herpes simplex virus type 1 infection in immunocompetent patients. Waltham, MA: UpToDate; 2012. Available at: www.uptodate.com/contents/treatment-of-herpessimplex-virus-type-1-infection-in-immunocompetentpatients. Accessed January 19, 2012.
Daily oral acyclovir or valacyclovir may help prevent herpes simplex labialis (HSL) recurrences (strength of recommendation [SOR]: B, meta-analysis of randomized controlled trials [RCTs] with heterogeneous results).
No trials compare oral or topical treatments for HSL outbreaks against each other. Oral antivirals modestly reduce healing time and duration of pain, varying according to the agent used: valacyclovir reduces both healing time and duration of pain, famciclovir reduces both in one dosage form but not another, and acyclovir reduces only pain duration (SOR: B, single RCTs).
Several topical medications (acyclovir, penciclovir, docosanol) modestly decrease healing time and pain duration—typically by less than a day—and require multiple doses per day (SOR: B, multiple RCTs).
EVIDENCE SUMMARY
A systematic review and meta-analysis of the effectiveness of oral and topical nucleoside antiviral agents to prevent recurrent HSL in immunocompetent people found 11 RCTs with a total of 1250 patients that compared an active drug against placebo.1 The medications were topical 5% acyclovir, topical 1% penciclovir, and oral acyclovir, valacyclovir, or famciclovir in various doses. The primary outcome was recurrence of herpes simplex virus type 1 lesions during the treatment period. The relative risk (RR) of recurrence ranged from 0.22 to 1.22. Pooled results found a benefit favoring antiviral agents (RR of recurrence=0.70; 95% confidence interval [CI], 0.55-0.89).
Seven of the trials looked at acyclovir (5 oral, 2 topical). A subgroup analysis demonstrated that oral acyclovir (800-1000 mg/d) was more effective than placebo (RR=0.51; 95% CI, 0.29-0.88), whereas topical acyclovir wasn’t. Oral valacyclovir (2 studies; 500 mg/d for 4 months) also reduced recurrence (RR=0.65; 95% CI, 0.43-0.91). The authors of the meta-analysis noted that although 9 studies favored the use of an antiviral drug, only 4 showed statistically significant differences when compared with placebo, and none of them had a low risk of bias. They concluded that the review supported using oral acyclovir and valacyclovir to prevent recurrent HSL.1
Oral antivirals produce variable treatment results
Three RCTs evaluated oral antiviral medications against placebo to treat recurrent HSL, with mixed results. The largest RCT found that valacyclovir (2000 mg twice in 24 hours, with or without an additional 1000 mg twice in another 24 hours) modestly but significantly reduced both healing time and duration of pain (by 0.5-0.8 day).2 The second RCT showed that a higher, single dose of famciclovir (1500 mg) reduced healing time (by 1.8 days) and pain duration (by 1.2 days) and that a smaller, repeated dose (750 mg twice in 24 hours) reduced healing time alone (by 2.2 days).3
The third RCT demonstrated that acyclovir (400 mg 5 times a day for 5 days) reduced pain duration (by 0.9 day) but didn’t shorten healing time. If acyclovir was started during the prodrome, it decreased the time to disappearance of the lesion’s hard crust (2.1 days’ less time; P=.03), but the clinical significance of this finding is unclear.4
Topical treatment shows modest success
Two trials demonstrated that topical acyclovir (5% cream) modestly improved healing time and duration of pain (by as much as half a day). Patients in the first trial (paired RCTs reported together) began treatment within an hour of prodromal symptoms or signs, applying the medication 5 times daily for 4 days.5
Patients in the second trial used ME-609 cream (5% acyclovir plus 1% hydrocortisone), 5% acyclovir cream, or placebo, all applied 5 times daily for 5 days.6 Although the cream with acyclovir and hydrocortisone showed a slight benefit compared with placebo (lessening healing time by 0.8 day and pain duration by 1 day), it didn’t improve healing more than acyclovir alone. Other topical agents (penciclovir 1%; docosanol 10%) produced results similar to topical acyclovir.7,8
RECOMMENDATIONS
No national guidelines on this topic exist. An online resource notes that most patients don’t require treatment for mild self-limited HSL.9 For patients with prodromal symptoms, the authors recommend episodic oral antiviral therapy. Patients who have no prodome but multiple painful or disfiguring lesions may choose to use chronic suppressive therapy with an oral antiviral drug.
1. Rahimi H, Mara T, Costella J, et al. Effectiveness of antiviral agents for the prevention of recurrent herpes labialis: a systematic review and meta-analysis. Oral Surg Oral Med Oral Pathol Oral Radiol. 2012;113:618-627.
2. Spruance SL, Jones TM, Blatter MM, et al. High-dose, short-duration, early valacyclovir therapy for episodic treatment of cold sores: results of two randomized, placebo-controlled, multicenter studies. Antimicrob Agents Chemother. 2003;47:1072-1080.
3. Spruance SL, Bodsworth N, Resnick H, et al. Single-dose, patient-initiated famciclovir: a randomized, double-blind, placebo-controlled trial for episodic treatment of herpes labialis. J Am Acad Dermatol. 2006;55:47-53.
4. Spruance SL, Stewart JC, Rowe NH, et al. Treatment of recurrent herpes simplex labialis with oral acyclovir. J Infect Dis. 1990;161:185-190.
5. Spruance SL, Nett R, Marbury T, et al. Acyclovir cream for treatment of herpes simplex labialis: results of two randomized, double-blind, vehicle-controlled, multicenter clinical trials. Antimicrob Agents Chemother. 2002;46:2238-2243.
6. Hull CM, Harmenberg J, Arlander E, et al; ME-609 Studt Group. Early treatment of cold sores with topical ME-609 decreases the frequency of ulcerative lesions: a randomized, doubleblind, placebo-controlled, patient-initiated clinical trial. J Am Acad Dermatol. 2011;64:696.e1-696.e11.
7. Raborn GW, Martel AY, Lassonde M, et al; Worldwide Topical Penciclovir Collaborative Study Group. Effective treatment of herpes simplex labialis with penciclovir cream: combined results of two trials. J Am Dent Assoc. 2002;133:303-309.
8. Sacks SL, Thisted RA, Jones TM, et al; Docosanol 10% Cream Study Group. Clinical efficacy of topical docosanol 10% cream for herpes simplex labialis: a multicenter, randomized, placebo-controlled trial. J Am Acad Dermatol. 2001;45:222-230.
9. Klein RS. Treatment of herpes simplex virus type 1 infection in immunocompetent patients. Waltham, MA: UpToDate; 2012. Available at: www.uptodate.com/contents/treatment-of-herpessimplex-virus-type-1-infection-in-immunocompetentpatients. Accessed January 19, 2012.
Evidence-based answers from the Family Physicians Inquiries Network
How best to treat UTIs in women who breastfeed?
It’s unclear, as no studies have specifically evaluated therapies for uncomplicated urinary tract infections (UTIs) in breastfeeding women. However, trimethoprim/sulfamethoxazole (TMP/ SMX), β-lactam antibiotics, nitrofurantoin, and fluoroquinolones all produce cure rates of 78% to 95% for uncomplicated UTIs in women who aren’t breastfeeding, and all appear to be equivalent (strength of recommendation [SOR]: A, a systematic review).
Women who take TMP/SMX develop drug concentrations in breast milk that are below recommended maximum safe levels for infants who don’t have glucose-6-phosphate dehydrogenase (G6PD) deficiency (SOR: B, a small observational study and expert opinion); treatment with nitrofurantoin and ciprofloxacin also produces low levels in breast milk (SOR: C, extrapolations from small observational studies and expert opinion). (Though in the case of nitrofurantoin, this does not include patients with G6PD deficiency.)
Some antibiotics taken by breastfeeding mothers may occasionally be associated with adverse effects in their infants: TMP/SMX may cause poor feeding; amoxicillin and cephalexin may cause diarrhea; nitrofurantoin may cause diarrhea or, in infants with G6PD deficiency, hemolytic anemia; and ciprofloxacin may cause pseudomembranous colitis in infants and green teeth in neonates (SOR: C, case reports and expert opinion).
EVIDENCE SUMMARY
Because no randomized controlled trials have evaluated the efficacy of UTI treatment in lactating women, recommendations are extrapolated from studies in other populations and case reports.
Antibiotics: Comparable and effective
A 2010 Cochrane review examined 21 good-quality randomized trials that compared the effectiveness of TMP-SMX, β-lactam antibiotics, nitrofurantoin, and fluoroquinolones for uncomplicated UTIs in 6016 women.1 The authors found no significant differences in short-term symptom cure rates: all antibiotics were very effective. Seven studies reported mixed (clinical and bacteriologic) cure rates.
Symptom cure rates for patients followed for as long as 2 weeks ranged from 78% to 95%; longer-term (as long as 8 weeks) symptom cure rates ranged from 82% to 91%. The review suggested that TMP-SMX may be slightly more likely to cause a rash than other antibiotics.1
Antibiotic concentrations in breast milk
In a case series, TMP/SMX, 160/800 mg, given to 50 lactating women 2 times (40 women) or 3 times (10 women) daily resulted in an average breast milk concentration of 2 μg/mL of TMP and 4.6 μg/mL of SMX, corresponding to respective doses of 0.3 and 0.7 mg/kg/d for infants taking 150 mL breast milk/kg/d.2 The authors state that this dose is safe for infants without G6PD deficiency. The study included only women with UTIs or other infections requiring antibiotic treatment.
A case series of 4 lactating mothers who received a single 100-mg oral dose of nitrofurantoin found that peak breast milk concentration occurred 4 hours later and averaged 2.4 μg/mL (standard deviation=1.7-3.2 μg/mL).3 The authors calculated a mean concentration over 12 hours of 1.3 μg nitrofurantoin/mL breast milk. This level would correspond to an estimated dose of 0.2 mg/kg/d for an infant consuming 150 mL/kg/d of breast milk whose mother takes 100 mg nitrofurantoin twice daily, much lower than the recommended pediatric dose of 5 to 7 mg/kg/d.
Data from a case series and a case report suggest the amount of ciprofloxacin transferred to breastfed infants is low. In the case series, researchers gave 10 lactating women 3 oral doses of ciprofloxacin, 750 mg, at 12-hour intervals and then measured ciprofloxacin levels in breast milk.4 The highest levels occurred 2 hours after the third dose and averaged 3.79 μg/mL. Average levels fell gradually to 0.02 μg/mL 24 hours after the third dose. Assuming a milk intake of 150 mL/kg/d, a breastfed infant would consume approximately 0.3 mg/kg/d, much lower than the 10 to 40 mg/kg/d dose recommended for treating sick infants.
A case report of a woman who took oral ciprofloxacin 500 mg/d for 10 days noted a breast milk ciprofloxacin concentration of 0.98 mg/L at 10.7 hours after the last dose.5 Ofloxacin, norfloxacin, and levofloxacin have been associated with lower milk concentrations than ciprofloxacin.6
Adverse effects
In a cohort study of 838 women from a program for pregnant and lactating women exposed to drugs and other substances, 2 of 12 mothers taking TMP/SMX reported poor feeding in their infants.7
The same program received reports of infants with diarrhea from mothers taking amoxicillin (3 of 25 infants), nitrofurantoin (2 of 6 infants), and cephalexin (2 of 7 infants), but no reports of other adverse effects. Another study demonstrated that nitrofurantoin is actively transported into the mother’s milk, making hemolytic anemia a possibility in G6PD-deficient infants.3
Studies indicate that adverse effects of fluoroquinolones in children are similar to those in adults despite a contraindication in children because of reports of arthropathy in young animals. One case of pseudomembranous colitis in a breastfeeding infant and 2 cases of green teeth in neonates have been reported with ciprofloxacin use.6,8,9
RECOMMENDATIONS
The Infectious Disease Society of America recommends nitrofurantoin, TMP/SMX, or fosfomycin for first-line treatment of uncomplicated UTIs in women, although fosfomycin appears to be inferior to other standard short-course antibiotics based on FDA data. Fluoroquinolones and β-lactams are recommended alternative treatments.10
The American Academy of Pediatrics’ Committee on Drugs says that TMP/SMX (unless G6PD deficiency is present), amoxicillin, nitrofurantoin, ciprofloxacin, and ofloxacin usually are compatible with breastfeeding.11
1. Zalmanovici Trestioreanu A, Green H, Paul M, et al. Antimicrobial agents for treating uncomplicated urinary tract infection in women. Cochrane Database of Syst Rev. 2010;(10):CD007182.
2. Miller RD, Salter AJ. The passage of trimethoprim/sulfamethoxazole into breast milk and its significance. Proceedings of the 8th International Congress of Chemotherapy, Athens. Hellenic Soc Chemother. 1974;1:687-691.
3. Gerk PM, Kuhn RJ, Desai NS, et al. Active transport of nitrofurantoin into human milk. Pharmacotherapy. 2001;21:669-675.
4. Giamarellou H, Kolokythas E, Petrikkos G, et al. Pharmacokinetics of three newer quinolones in pregnant and lactating women. Am J Med. 1989;87:49S-51S.
5. Gardner DK, Gabbe SG, Harter C. Simultaneous concentrations of ciprofloxacin in breast milk and in serum in mother and breast-fed infant. Clin Pharm. 1992;11:352-354.
6. Bar-Oz B, Bulkowstein M, Benyamini L, et al. Use of antibiotic and analgesic drugs during lactation. Drug Safety. 2003;26:925-935.
7. Ito S, Blajchman A, Stephenson M, et al. Prospective followup of breast-fed infants exposed to maternal medication. Am J Obstet Gynecol.1993;168:1393-1399.
8. Harmon T, Burkhart G, Applebaum H. Perforated pseudomembranous colitis in the breast-fed infant. J Pediatr Surg. 1992;27:744-746.
9. Briggs GG, Freeman RK, Yaffe SJ. Drugs in pregnancy and lactation. 8th ed. Philadelphia, PA: Lippincott, Williams & Wilkins; 2008.
10. Gupta K, Hooton TM, Naber KG, et al; Infectious Diseases Society of America; European Society for Microbiology and Infectious Diseases. International Clinical practice guidelines for the treatment of acute uncomplicated cystitis and pyelonephritis in women: a 2010 update by the Infectious Diseases Society of America and the European Society for Microbiology and Infectious Diseases. Clin Infect Dis. 2011;52:e103-e120.
11. American Academy of Pediatrics Committee on Drugs. The transfer of drugs and other chemical into human milk. Pediatrics. 2001;108:776-789.
It’s unclear, as no studies have specifically evaluated therapies for uncomplicated urinary tract infections (UTIs) in breastfeeding women. However, trimethoprim/sulfamethoxazole (TMP/ SMX), β-lactam antibiotics, nitrofurantoin, and fluoroquinolones all produce cure rates of 78% to 95% for uncomplicated UTIs in women who aren’t breastfeeding, and all appear to be equivalent (strength of recommendation [SOR]: A, a systematic review).
Women who take TMP/SMX develop drug concentrations in breast milk that are below recommended maximum safe levels for infants who don’t have glucose-6-phosphate dehydrogenase (G6PD) deficiency (SOR: B, a small observational study and expert opinion); treatment with nitrofurantoin and ciprofloxacin also produces low levels in breast milk (SOR: C, extrapolations from small observational studies and expert opinion). (Though in the case of nitrofurantoin, this does not include patients with G6PD deficiency.)
Some antibiotics taken by breastfeeding mothers may occasionally be associated with adverse effects in their infants: TMP/SMX may cause poor feeding; amoxicillin and cephalexin may cause diarrhea; nitrofurantoin may cause diarrhea or, in infants with G6PD deficiency, hemolytic anemia; and ciprofloxacin may cause pseudomembranous colitis in infants and green teeth in neonates (SOR: C, case reports and expert opinion).
EVIDENCE SUMMARY
Because no randomized controlled trials have evaluated the efficacy of UTI treatment in lactating women, recommendations are extrapolated from studies in other populations and case reports.
Antibiotics: Comparable and effective
A 2010 Cochrane review examined 21 good-quality randomized trials that compared the effectiveness of TMP-SMX, β-lactam antibiotics, nitrofurantoin, and fluoroquinolones for uncomplicated UTIs in 6016 women.1 The authors found no significant differences in short-term symptom cure rates: all antibiotics were very effective. Seven studies reported mixed (clinical and bacteriologic) cure rates.
Symptom cure rates for patients followed for as long as 2 weeks ranged from 78% to 95%; longer-term (as long as 8 weeks) symptom cure rates ranged from 82% to 91%. The review suggested that TMP-SMX may be slightly more likely to cause a rash than other antibiotics.1
Antibiotic concentrations in breast milk
In a case series, TMP/SMX, 160/800 mg, given to 50 lactating women 2 times (40 women) or 3 times (10 women) daily resulted in an average breast milk concentration of 2 μg/mL of TMP and 4.6 μg/mL of SMX, corresponding to respective doses of 0.3 and 0.7 mg/kg/d for infants taking 150 mL breast milk/kg/d.2 The authors state that this dose is safe for infants without G6PD deficiency. The study included only women with UTIs or other infections requiring antibiotic treatment.
A case series of 4 lactating mothers who received a single 100-mg oral dose of nitrofurantoin found that peak breast milk concentration occurred 4 hours later and averaged 2.4 μg/mL (standard deviation=1.7-3.2 μg/mL).3 The authors calculated a mean concentration over 12 hours of 1.3 μg nitrofurantoin/mL breast milk. This level would correspond to an estimated dose of 0.2 mg/kg/d for an infant consuming 150 mL/kg/d of breast milk whose mother takes 100 mg nitrofurantoin twice daily, much lower than the recommended pediatric dose of 5 to 7 mg/kg/d.
Data from a case series and a case report suggest the amount of ciprofloxacin transferred to breastfed infants is low. In the case series, researchers gave 10 lactating women 3 oral doses of ciprofloxacin, 750 mg, at 12-hour intervals and then measured ciprofloxacin levels in breast milk.4 The highest levels occurred 2 hours after the third dose and averaged 3.79 μg/mL. Average levels fell gradually to 0.02 μg/mL 24 hours after the third dose. Assuming a milk intake of 150 mL/kg/d, a breastfed infant would consume approximately 0.3 mg/kg/d, much lower than the 10 to 40 mg/kg/d dose recommended for treating sick infants.
A case report of a woman who took oral ciprofloxacin 500 mg/d for 10 days noted a breast milk ciprofloxacin concentration of 0.98 mg/L at 10.7 hours after the last dose.5 Ofloxacin, norfloxacin, and levofloxacin have been associated with lower milk concentrations than ciprofloxacin.6
Adverse effects
In a cohort study of 838 women from a program for pregnant and lactating women exposed to drugs and other substances, 2 of 12 mothers taking TMP/SMX reported poor feeding in their infants.7
The same program received reports of infants with diarrhea from mothers taking amoxicillin (3 of 25 infants), nitrofurantoin (2 of 6 infants), and cephalexin (2 of 7 infants), but no reports of other adverse effects. Another study demonstrated that nitrofurantoin is actively transported into the mother’s milk, making hemolytic anemia a possibility in G6PD-deficient infants.3
Studies indicate that adverse effects of fluoroquinolones in children are similar to those in adults despite a contraindication in children because of reports of arthropathy in young animals. One case of pseudomembranous colitis in a breastfeeding infant and 2 cases of green teeth in neonates have been reported with ciprofloxacin use.6,8,9
RECOMMENDATIONS
The Infectious Disease Society of America recommends nitrofurantoin, TMP/SMX, or fosfomycin for first-line treatment of uncomplicated UTIs in women, although fosfomycin appears to be inferior to other standard short-course antibiotics based on FDA data. Fluoroquinolones and β-lactams are recommended alternative treatments.10
The American Academy of Pediatrics’ Committee on Drugs says that TMP/SMX (unless G6PD deficiency is present), amoxicillin, nitrofurantoin, ciprofloxacin, and ofloxacin usually are compatible with breastfeeding.11
1. Zalmanovici Trestioreanu A, Green H, Paul M, et al. Antimicrobial agents for treating uncomplicated urinary tract infection in women. Cochrane Database of Syst Rev. 2010;(10):CD007182.
2. Miller RD, Salter AJ. The passage of trimethoprim/sulfamethoxazole into breast milk and its significance. Proceedings of the 8th International Congress of Chemotherapy, Athens. Hellenic Soc Chemother. 1974;1:687-691.
3. Gerk PM, Kuhn RJ, Desai NS, et al. Active transport of nitrofurantoin into human milk. Pharmacotherapy. 2001;21:669-675.
4. Giamarellou H, Kolokythas E, Petrikkos G, et al. Pharmacokinetics of three newer quinolones in pregnant and lactating women. Am J Med. 1989;87:49S-51S.
5. Gardner DK, Gabbe SG, Harter C. Simultaneous concentrations of ciprofloxacin in breast milk and in serum in mother and breast-fed infant. Clin Pharm. 1992;11:352-354.
6. Bar-Oz B, Bulkowstein M, Benyamini L, et al. Use of antibiotic and analgesic drugs during lactation. Drug Safety. 2003;26:925-935.
7. Ito S, Blajchman A, Stephenson M, et al. Prospective followup of breast-fed infants exposed to maternal medication. Am J Obstet Gynecol.1993;168:1393-1399.
8. Harmon T, Burkhart G, Applebaum H. Perforated pseudomembranous colitis in the breast-fed infant. J Pediatr Surg. 1992;27:744-746.
9. Briggs GG, Freeman RK, Yaffe SJ. Drugs in pregnancy and lactation. 8th ed. Philadelphia, PA: Lippincott, Williams & Wilkins; 2008.
10. Gupta K, Hooton TM, Naber KG, et al; Infectious Diseases Society of America; European Society for Microbiology and Infectious Diseases. International Clinical practice guidelines for the treatment of acute uncomplicated cystitis and pyelonephritis in women: a 2010 update by the Infectious Diseases Society of America and the European Society for Microbiology and Infectious Diseases. Clin Infect Dis. 2011;52:e103-e120.
11. American Academy of Pediatrics Committee on Drugs. The transfer of drugs and other chemical into human milk. Pediatrics. 2001;108:776-789.
Evidence-based answers from the Family Physicians Inquiries Network
Reducing hospital readmissions through primary care practice transformation
ABSTRACT
Purpose To assess the impact of a multicomponent intervention on 30-day hospital readmissions in a group of primary care practices that undertook practice transformation, compared with rates in usual-care practices that admitted patients to the same hospital service.
Methods Four primary care clinics enhanced patient care coordination with care managers and inpatient care teams, and developed and used hospital readmission reports to monitor readmission rates. Patient readmissions to the hospital were analyzed over a 12-month period from May 2012 through April 2013, among patients who fell into 2 groups. Group 1 patients were those cared for by the primary care clinics that implemented transformation activities and who were admitted to the hospital associated with the practices. Group 2 patients were seen at clinics in the same catchment area that did not undertake any known practice redesign activities (usual care group).
Results A total of 961 patients were included in analyses; 685 (71.3%) were in Group 1, and 276 (28.7%) were in Group 2. Readmissions among Group 1 patients decreased from 27% to 7.1% (P=.02), and readmissions in Group 2 were variable with a nonsignificant trend (P=.53). The unadjusted regression model that compared the interaction between Group 1 and Group 2 patients found a significant difference in readmissions (P=.05).
Conclusion Developing a multicomponent intervention appears to have a significant impact on reducing hospital readmissions. Primary care groups seeking to reduce hospital readmissions should consider implementing similar processes.
An analysis of Medicare claims data between 2003 and 2004 found that nearly 20% of the >11 million Medicare patients who had been discharged from a hospital were readmitted within 30 days, at a cost of $17.4 billion.1 Certain patient subgroups were especially worrisome. Of those with congestive heart failure, for example, 50% were typically readmitted within 6 months of initial hospitalization.2
A longstanding issue comes to the fore. Concerns about hospital readmissions appeared in the literature nearly 40 years ago.3 In the 1990s, with the advent of managed care, organizations began “case management” to reduce preventable readmissions using several approaches, including enhanced primary care access.4 A meta-analysis at that time demonstrated some reduction in hospital readmissions associated with hospital-based case management interventions.5 Though quality improvement programs and case management have been assumed to reduce hospital readmissions, some studies have actually found the opposite,6,7 or have yielded conflicting evidence.8-13 Skyrocketing costs of health care have brought hospital readmissions to the forefront of health system redesign efforts.14-16
Section 3025 of the Affordable Care Act added section 1886(q) to the Social Security Act establishing the Hospital Readmissions Reduction Program, which requires Centers for Medicare & Medicaid Services to reduce payments to hospitals with excess readmissions.17 This change was introduced on October 1, 2012 and has precipitated discussion across the country about the prevention of unnecessary hospital readmissions.18,19
Patient factors contributing to hospital readmissions. Concerns patients cite most frequently as contributors to relapse and readmission are 1) feeling unprepared for discharge; 2) difficulty performing activities of daily living; 3) trouble adhering to discharge medications; 4) difficulty accessing discharge medications; and 5) lack of social support.20 While multiple tools have been developed to better assess unplanned readmissions—including the Identification of Seniors at Risk, the Flemish version of the Triage Risk Screening Tool, and Variable Indicative of Placement risk—none of these have accurately predicted unplanned readmission in older, hospitalized patients.21 Predicting which patients will require readmission remains elusive,22 though some new models show promise.23 z
Targeted interventions that show promise. Postdischarge telephone follow-up has been shown to reduce hospital readmissions,24,25 and a direct correlation has been observed between the timing of the intervention and readmission rates, with interventions implemented closer to the date of discharge being associated with greater reductions in the number of readmissions.26 Additionally, multicomponent interventions with both pre- and postdischarge elements that specifically target high-risk populations appear to be more effective in reducing readmissions than single-component interventions.27
Hansen et al28 identified a number of predischarge, postdischarge, and bridging interventions that could potentially reduce hospital readmissions (TABLE 1). No single intervention implemented alone consistently reduced the risk for 30-day rehospitalization.28 One multicomponent intervention that has reduced readmissions for patients with heart failure or acute myocardial infarction is a transition coach, who visits patients in the hospital and sees them again in clinic for follow-up appointments. The coach also calls patients between face-to-face visits to review treatment plans and answer questions.29
The impetus for our study. The patient-centered medical home (PCMH) has been gaining traction as a mechanism to improve patient care while reducing health care spending.30,31 An intensive multidimensional medical home model introduced into 11 primary care practices proved capable of significantly reducing admissions and readmissions for Medicare Advantage members.32 Additionally, intelligently leveraging clinical information technology is likely to be critical in reducing readmissions.33 The purpose of our observational study was to examine the impact of a multicomponent intervention on 30-day hospital readmissions over 12 months.
METHODS
Study setting and preintervention practice routines in 2 patient groups
The study setting for Group 1 involved patients with assigned primary care providers (PCPs) in a university-based practice group at 4 outpatient clinics. The study setting for Group 2 included patients with assigned PCPs from county and community health centers, involving 12 primary care clinics in total. While the groups’ patient populations were distinguished for descriptive purposes, in practice the patients were admitted to the same inpatient treatment teams and university-based hospital in a metropolitan setting. For both groups, the primary care practices admitted patients to the hospital directly from clinic or through the emergency department (ED).
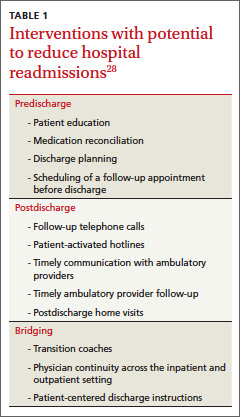
An admitting team from one of the inpatient services completed the admission, initiated treatment, and discharged patients. Preintervention, limited discharge case management occurred at the hospital, driven primarily by the treating team’s requests. The admitting team also attempted to schedule outpatient follow-up appointments with an available PCP at the patient’s primary clinic after discharge. Obstacles to successful appointment scheduling prior to discharge included but were not limited to discharges over weekends or holidays or after clinic hours. Additionally, for both groups, discharge summaries were sent to the PCP either electronically via the electronic medical record (EMR) or via system-generated automated fax.
Creating a culture of continuity in Group 1
Transformation of outpatient activities. We developed several important processes to transform the patient experience through hospitalization and discharge. Together, these processes created a “culture of continuity” to prevent avoidable readmissions. We introduced an innovative, systematic approach to notifying the clinic and primary care clinician about initial admission. We also gave notification immediately upon discharge, rather than waiting until after discharge, as had been occurring. This patient-centered change engaged the primary care team in the care of the patient while hospitalized and during discharge planning; it actively ensured that follow-up appointments occurred within 1 week after discharge. Prior to this intervention, there was no system for ensuring timely follow-up after hospital discharge. The new expectation for the ambulatory clinics was that clinic staff could “reach in” to the patient during the hospital stay and actively contact the patient before discharge to schedule a postdischarge appointment at the patient’s convenience.
The 4 practices had embraced and implemented the PCMH model, a core component of which is care coordination.34,35 Each clinic appointed a registered nurse (RN) to serve as a team-based care manager (CM) for patients being discharged from the hospital. Responsibilities included fielding calls or electronic communications from the inpatient team, developing a hospital follow-up workflow, developing a standardized list of questions to ask each patient after discharge, and calling patients to ensure a follow-up appointment was scheduled, ideally within 2 to 3 days and at least within 7 days of discharge. The CM prioritized scheduling follow-up appointments with the patient’s PCP to ensure the highest level of continuity.
In addition to patient-specific documents, CMs received electronic reports from inpatient teams (including from the ED, medical and surgical intensive care units, and surgery) listing all Group 1 patients discharged from the hospital. Reports were run daily and allowed the outpatient clinic staff and CMs to verify patients against previous lists of anticipated discharges, and to generate their own lists. The CMs would then make follow-up phone calls and ensure that appointments were scheduled for these patients.
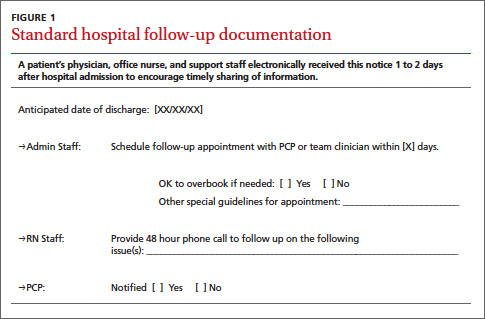
Medical directors at the 4 clinics received monthly summary reports profiling clinical activities related to hospitalizations. A data team (led by author SF) created the reports, which initially focused on care delivered in ambulatory settings (and included the development of a “balanced scorecard” to assess quality of care, financial productivity, and operational efficiency36). The data team developed new reports specifically for hospital admissions, discharges, and readmissions, identifying:
• all patients admitted by inpatient team
• the number and percentage of patients who were readmitted within 30 days
• the number and percentage of patients who had received a follow-up phone call or electronic communication from the outpatient team
• the number of patients who had follow-up visits after discharge within 7 and 30 days
• the number of patients who had clinic visits prior to readmission
• all patients discharged from any service within the prior 24 hours.
These reports, which had patient drilldown capability, were forwarded to all providers and teams at each clinic by the medical director. Teams at each clinic were then charged with analyzing the readmissions, identifying high-risk patients, and improving the coordination of care for these patients, including the use of RN/clinician co-visits and proactive outreach from the team-based nurses and staff.
Transformation of inpatient activities. We reorganized inpatient teams to include clinician representatives from the clinics whose patients were being treated. This process ensured better continuity of experience and familiarity with the environment of care and discharge/follow-up processes for both patients and all providers.
Additionally, inpatient teams developed new workflows to ensure that all involved members of the outpatient team were well informed of the hospitalization process. On the first or second day of admission, a hospital follow-up document was electronically routed to the administrative support staff, the PCP team nurse, and the PCP (FIGURE 1). An integrated EMR created a link between the hospital and all ambulatory practices that allowed for real-time transmission of patient information. The document identified the timing of a follow-up appointment and requested a 48-hour phone call from the team nurse after hospital discharge. The inpatient team also included a concise summary of the hospitalization for the PCP, to aid in anticipating patient discharge and any impending needs. The document was retrievable and traceable in the EMR.
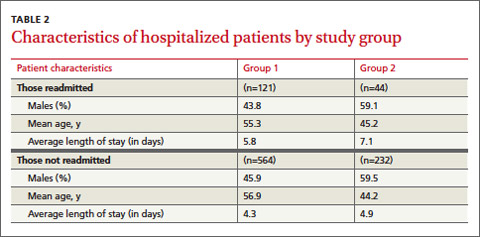
Study groups and statistical analysis
The Oregon Health & Science University’s Institutional Review Board (IRB#9768) determined this study was not human subjects research because the proposed activity did not meet the definition of human subject per 45 CFR 46.102(f). The board made this determination because our analysis file included only hospital readmission rates and no patient-level data.
Adult patients admitted by the inpatient teams consisted of 2 distinct populations: patients whose PCP practiced at one of the 4 outpatient clinics (Group 1 patients); and patients admitted from other, unaffiliated clinics (Group 2 patients). In contrast to the transformations in patient care described in Group 1, care provided to Group 2 patients was considered usual care, as there was no interface between outpatient and inpatient teams to revise operations. Patients in either group were excluded from analyses if they died during the hospitalization. Maternity patients were also excluded.
We identified the percentage of patients readmitted within 30 days of a hospital admission using administrative data sources, which underwent careful data checking and validation, and were sub-grouped according to whether the patients were in Group 1 or Group 2. We used group-specific and overall linear regression to examine the changes in percentage of readmission within 30 days of discharge in the 2 study groups over 12 months, including a model that specifically assessed the interaction between Group 1 readmission percentages and those in Group 2. We considered a P-value ≤.05 to be significant in this exploratory study.
RESULTS
Patient readmissions decreased significantly
Our analysis included 961 patients; 685 patients (71.3%) were in Group 1, and 276 (28.7%) were in Group 2 (Table 2). The distribution of patient gender and mean age was similar within groups for patients readmitted and not readmitted during the study period. Among patients readmitted, the mean hospital length of stay was 5.8 days and 7.1 days for Group 1 and Group 2, respectively. Among those not readmitted, the mean hospital length of stay was 4.3 and 4.9 in Group 1 and 2, respectively.
The percentage of patients readmitted per month ranged from 28.1% to 7.1% in Group 1 and 27.8% to 5.9% in Group 2 (Figure 2). Patient readmissions in Group 1 decreased significantly from 27% in May 2012 to 7.1% in April 2013 with an R2 of 0.43 (P=.02). Readmissions of patients in Group 2 were more variable; 26.1% in May 2012 and 25.9% in April 2013 with a non-significant R2 of 0.04 (P=.53). The regression model (unadjusted) that compared the interaction between Group 1 and Group 2 readmissions over the study period was significant, indicating a decrease in readmissions in Group 1 and no strong correlation between usual care and readmissions over time in Group 2 (P=.05).
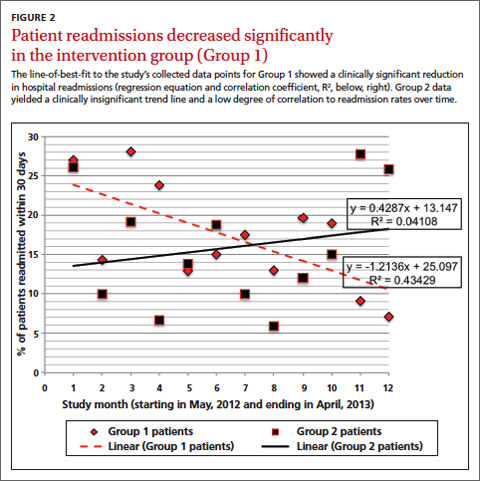
DISCUSSION
Implementing intensive coordinated care management and transition processes in a group of primary care clinics appears to significantly decrease hospital readmissions for patients in Group 1, compared with those in Group 2 who received usual care. While it is possible that some of the ambulatory practices in Group 2 admitting patients to the inpatient services were using or developing care coordination programs including hospital follow-up, none of these providers or groups interfaced with the inpatient teams in this study. We are, therefore, confident that Group 2 providers were not undertaking any new or novel activities that reached in to hospital inpatient services to improve care coordination.
Our findings are consistent with the literature review conducted by Scott et al,27 which found that multicomponent interventions are more successful at reducing readmissions than single-component interventions. In our Group 1 clinics, we implemented 8 of the 12 predischarge, postdischarge, and bridging interventions identified by Hansen et al28 (medication reconciliation, discharge planning, scheduling of a follow-up appointment before discharge, follow-up telephone calls, timely communication with ambulatory providers, timely ambulatory provider follow-up, physician continuity across the inpatient and outpatient setting, and patient-centered discharge instructions).
Study strengths and weaknesses. The strengths of this study include means and quality of data capture for hospital readmission rates in the study setting. Limitations include the small sample sizes, which did not allow us to conduct a multivariable adjusted analysis that would have taken into account patient characteristics, seasons, and temporal correlations. These covariates might drive study findings in a way that results in us drawing inaccurate conclusions—the analysis we conducted (unadjusted) assumed that the events that occurred in each month were unrelated to what might have occurred in the prior month or subsequent month.
Patients in the 2 study groups did exhibit differences that could have contributed to our findings. For example, the average length of stay for Group 2 patients was longer by just over 1 day compared with that in Group 1. This may suggest Group 2 patients were sicker, and thus may have needed to be readmitted within 30 days of their discharge. We cannot know for certain that patients in Group 1 were less ill, as this would require a more discriminating study design. As with many studies, additional questions arise, but these serve to further a line of research that is vitally important.
Another factor that could have affected our findings is that Group 1 patient readmission rates started off higher than the Group 2 patients, so there is a chance that regression to the mean rather than changes in clinical care could have contributed to some of the decrease in Group 1 readmission rates. There are potential subject-level, provider-level, and clinic-level factors that could have been used to adjust for potential confounding. Future studies could address these factors. Longer study follow-up would provide an even better picture of the difference between the groups.
A multicomponent intervention works. Creating a culture of continuity is an important aspect of PCMH. Not all primary care clinics or PCMHs may have built-in relationships for inpatient care of their patients. We would argue that outpatient adoption of the enhanced “reaching in” and a multicomponent intervention would have a significant positive impact on patient care and improve the transition from in- to outpatient care, and likely reduce readmissions.
CORRESPONDENCE
Brett White, MD, 4411 SW Vermont St, Portland, OR 97219; [email protected]
The authors gratefully acknowledge the clinic and inpatient physicians and staffs as well as the Research Program in the Department of Family Medicine, Oregon Health & Science University.
1. Jencks SF, Williams MV, Coleman EA. Rehospitalizations among patients in the Medicare fee-for-service program. N Engl J Med. 2009;360:1418-1428.
2. Zaya M, Phan A, Schwarz ER. The dilemma, causes and approaches to avoid recurrent hospital readmissions for patients with chronic heart failure. Heart Fail Rev. 2012;17:345-353.
3. Marriott PF, Grigor JM, Hiep A. Reducing hospital readmission rates among schizophrenics. Med J Aust. 1976;2:897-898.
4. Fitzgerald JF, Smith DM, Martin DK, et al. A case manager intervention to reduce readmissions. Arch Intern Med. 1994;154:1721-1729.
5. Kim YJ, Soeken KL. A meta-analysis of the effect of hospital-based case management on hospital length-of-stay and readmission. Nurs Res. 2005;54:255-264.
6. Weinberger M, Oddone EZ, Henderson WG. Does increased access to primary care reduce hospital readmissions? Veterans Affairs Cooperative Study Group on Primary Care and Hospital Readmission. N Engl J Med. 1996;334:1441-1447.
7. Mudge A, Denaro C, Scott I, et al. The paradox of readmission: effect of a quality improvement program in hospitalized patients with heart failure. J Hosp Med. 2010;5:148-153.
8. Mistiaen P, Francke AL, Poot E. Interventions aimed at reducing problems in adult patients discharged from hospital to home: a systematic meta-review. BMC Health Serv Res. 2007;7:47.
9. Linertová R, García-Pérez L, Vázquez-Díaz JR, et al. Interventions to reduce hospital readmissions in the elderly: in-hospital or home care. A systematic review. J Eval Clin Pract. 2011;17:1167-1175.
10. Shepperd S, Parkes J, McClaren J, et al. Discharge planning from hospital to home. Cochrane Database Syst Rev. 2004;(1):CD000313. Review. Update in: Cochrane Database Syst Rev. 2010;(1):CD000313.
11. Huntley AL, Thomas R, Mann M, et al. Is case management effective in reducing the risk of unplanned hospital admissions for older people? A systematic review and meta-analysis. Fam Pract. 2013;30:266-275.
12. Crocker JB, Crocker JT, Greenwald JL. Telephone follow-up as a primary care intervention for postdischarge outcomes improvement: a systematic review. Am J Med. 2012;125:915-921.
13. Mistiaen P, Poot E. Telephone follow-up, initiated by a hospital-based health professional, for postdischarge problems in patients discharged from hospital to home. Cochrane Database Syst Rev. 2006;(4):CD004510.
14. Jack B, Paasche-Orlow M, Mitchell S, et al. An overview of the Re-Engineered Discharge (RED) toolkit. AHRQ Publication No.12(13)-0084. Rockville, MD: Agency for Healthcare Research and Quality; March 2013. 15. Berwick DM, Nolan TW, Whittington J. The triple aim: care, health, and cost. Health Aff (Millwood). 2008;27:759-769.
16. Greenwald J, Denham C, Jack B. The hospital discharge: A review of a high risk care transition with highlights of a reengineered discharge process. J Patient Saf. 2007;3:97-106.
17. Centers for Medicare & Medicaid Services. Readmissions Reduction Program. Available at: http://www.cms.gov/Medicare/Medicare-Fee-for-Service-Payment/AcuteInpatientPPS/Readmissions-Reduction-Program.html. Accessed June 18, 2013.
18. Joynt KE, Jha AK. A path forward on Medicare readmissions. N Engl J Med. 2013;368:1175-1177.
19. Joynt KE, Jha AK. Characteristics of hospitals receiving penalties under the Hospital Readmissions Reduction Program. JAMA. 2013;309:342-343.
20. Kangovi S, Grande D, Meehan P, et al. Perceptions of readmitted patients on the transition from hospital to home. J Hosp Med. 2012;7:709-712.
21. Braes T, Moons P, Lipkens P, et al. Screening for risk of unplanned readmission in older patients admitted to hospital: predictive accuracy of three instruments. Aging Clin Exp Res. 2010;22:345-351.
22. Allaudeen N, Schnipper JL, Orav EJ, et al. Inability of providers to predict unplanned readmissions. J Gen Intern Med. 2011;26:771-776.
23. Gruneir A, Dhalla IA, van Walraven C, et al. Unplanned readmissions after hospital discharge among patients identified as being at high risk for readmission using a validated predictive algorithm. Open Med. 2011;5:e104-e111.
24. Harrison PL, Hara PA, Pope JE, et al. The impact of postdischarge telephonic follow-up on hospital readmissions. Popul Health Manag. 2011;14:27-32.
25. Herrera-Espiñeira C, Rodríguez del Águila Mdel M, Navarro Espigares JL, et al. [Effect of a telephone care program after hospital discharge from a trauma surgery unit]. Gac Sanit. 2011;25:133-138.
26. Costantino ME, Frey B, Hall B, et al. The influence of a postdischarge intervention on reducing hospital readmissions in a Medicare population. Popul Health Manag. 2013;16:310-316.
27. Scott IA. Preventing the rebound: improving care transition in hospital discharge processes. Aust Health Rev. 2010;34:445-451.
28. Hansen LO, Young RS, Hinami K, et al. Interventions to reduce 30-day rehospitalization: a systematic review. Ann Intern Med. 2011;155:520-528.
29. Coaching helps cut readmissions. Hosp Case Manag. 2011;19:155-156.
30. DeVries A, Li CH, Sridhar G, et al. Impact of medical homes on quality, healthcare utilization, and costs. Am J Manag Care. 2012;18:534-544.
31. Paustian ML, Alexander JA, El Reda DK, et al. Partial and incremental PCMH practice transformation: implications for quality and costs. Health Serv Res. 2013 Jul 5. [Epub ahead of print].
32. Gilfillan RJ, Tomcavage J, Rosenthal MB, et al. Value and the medical home: effects of transformed primary care. Am J Manag Care. 2010;16:607-614.
33. Haglund M. Mastering readmissions: laying the foundation for change. Post-healthcare reform, pioneers are laying the foundation for serious readmissions-reduction work. Healthc Inform. 2011;28:10-13,16.
34. Meyers D, Peikes D, Genevro J, et al. The roles of patient-centered medical homes and accountable care organizations in coordinating patient care. AHRQ Publication No. 11-M005-EF. Rockville, MD: Agency for Healthcare Research and Quality; December 2010.
35. Ferrante JM, Balasubramanian BA, Hudson SV, et al. Principles of the patient-centered medical home and preventive services delivery. Ann Fam Med. 2010;8:108-116.
36. Fields SA, Cohen D. Performance enhancement using a balanced scorecard in a patient-centered medical home. Fam Med. 2011;43:735-739.
ABSTRACT
Purpose To assess the impact of a multicomponent intervention on 30-day hospital readmissions in a group of primary care practices that undertook practice transformation, compared with rates in usual-care practices that admitted patients to the same hospital service.
Methods Four primary care clinics enhanced patient care coordination with care managers and inpatient care teams, and developed and used hospital readmission reports to monitor readmission rates. Patient readmissions to the hospital were analyzed over a 12-month period from May 2012 through April 2013, among patients who fell into 2 groups. Group 1 patients were those cared for by the primary care clinics that implemented transformation activities and who were admitted to the hospital associated with the practices. Group 2 patients were seen at clinics in the same catchment area that did not undertake any known practice redesign activities (usual care group).
Results A total of 961 patients were included in analyses; 685 (71.3%) were in Group 1, and 276 (28.7%) were in Group 2. Readmissions among Group 1 patients decreased from 27% to 7.1% (P=.02), and readmissions in Group 2 were variable with a nonsignificant trend (P=.53). The unadjusted regression model that compared the interaction between Group 1 and Group 2 patients found a significant difference in readmissions (P=.05).
Conclusion Developing a multicomponent intervention appears to have a significant impact on reducing hospital readmissions. Primary care groups seeking to reduce hospital readmissions should consider implementing similar processes.
An analysis of Medicare claims data between 2003 and 2004 found that nearly 20% of the >11 million Medicare patients who had been discharged from a hospital were readmitted within 30 days, at a cost of $17.4 billion.1 Certain patient subgroups were especially worrisome. Of those with congestive heart failure, for example, 50% were typically readmitted within 6 months of initial hospitalization.2
A longstanding issue comes to the fore. Concerns about hospital readmissions appeared in the literature nearly 40 years ago.3 In the 1990s, with the advent of managed care, organizations began “case management” to reduce preventable readmissions using several approaches, including enhanced primary care access.4 A meta-analysis at that time demonstrated some reduction in hospital readmissions associated with hospital-based case management interventions.5 Though quality improvement programs and case management have been assumed to reduce hospital readmissions, some studies have actually found the opposite,6,7 or have yielded conflicting evidence.8-13 Skyrocketing costs of health care have brought hospital readmissions to the forefront of health system redesign efforts.14-16
Section 3025 of the Affordable Care Act added section 1886(q) to the Social Security Act establishing the Hospital Readmissions Reduction Program, which requires Centers for Medicare & Medicaid Services to reduce payments to hospitals with excess readmissions.17 This change was introduced on October 1, 2012 and has precipitated discussion across the country about the prevention of unnecessary hospital readmissions.18,19
Patient factors contributing to hospital readmissions. Concerns patients cite most frequently as contributors to relapse and readmission are 1) feeling unprepared for discharge; 2) difficulty performing activities of daily living; 3) trouble adhering to discharge medications; 4) difficulty accessing discharge medications; and 5) lack of social support.20 While multiple tools have been developed to better assess unplanned readmissions—including the Identification of Seniors at Risk, the Flemish version of the Triage Risk Screening Tool, and Variable Indicative of Placement risk—none of these have accurately predicted unplanned readmission in older, hospitalized patients.21 Predicting which patients will require readmission remains elusive,22 though some new models show promise.23 z
Targeted interventions that show promise. Postdischarge telephone follow-up has been shown to reduce hospital readmissions,24,25 and a direct correlation has been observed between the timing of the intervention and readmission rates, with interventions implemented closer to the date of discharge being associated with greater reductions in the number of readmissions.26 Additionally, multicomponent interventions with both pre- and postdischarge elements that specifically target high-risk populations appear to be more effective in reducing readmissions than single-component interventions.27
Hansen et al28 identified a number of predischarge, postdischarge, and bridging interventions that could potentially reduce hospital readmissions (TABLE 1). No single intervention implemented alone consistently reduced the risk for 30-day rehospitalization.28 One multicomponent intervention that has reduced readmissions for patients with heart failure or acute myocardial infarction is a transition coach, who visits patients in the hospital and sees them again in clinic for follow-up appointments. The coach also calls patients between face-to-face visits to review treatment plans and answer questions.29
The impetus for our study. The patient-centered medical home (PCMH) has been gaining traction as a mechanism to improve patient care while reducing health care spending.30,31 An intensive multidimensional medical home model introduced into 11 primary care practices proved capable of significantly reducing admissions and readmissions for Medicare Advantage members.32 Additionally, intelligently leveraging clinical information technology is likely to be critical in reducing readmissions.33 The purpose of our observational study was to examine the impact of a multicomponent intervention on 30-day hospital readmissions over 12 months.
METHODS
Study setting and preintervention practice routines in 2 patient groups
The study setting for Group 1 involved patients with assigned primary care providers (PCPs) in a university-based practice group at 4 outpatient clinics. The study setting for Group 2 included patients with assigned PCPs from county and community health centers, involving 12 primary care clinics in total. While the groups’ patient populations were distinguished for descriptive purposes, in practice the patients were admitted to the same inpatient treatment teams and university-based hospital in a metropolitan setting. For both groups, the primary care practices admitted patients to the hospital directly from clinic or through the emergency department (ED).
An admitting team from one of the inpatient services completed the admission, initiated treatment, and discharged patients. Preintervention, limited discharge case management occurred at the hospital, driven primarily by the treating team’s requests. The admitting team also attempted to schedule outpatient follow-up appointments with an available PCP at the patient’s primary clinic after discharge. Obstacles to successful appointment scheduling prior to discharge included but were not limited to discharges over weekends or holidays or after clinic hours. Additionally, for both groups, discharge summaries were sent to the PCP either electronically via the electronic medical record (EMR) or via system-generated automated fax.
Creating a culture of continuity in Group 1
Transformation of outpatient activities. We developed several important processes to transform the patient experience through hospitalization and discharge. Together, these processes created a “culture of continuity” to prevent avoidable readmissions. We introduced an innovative, systematic approach to notifying the clinic and primary care clinician about initial admission. We also gave notification immediately upon discharge, rather than waiting until after discharge, as had been occurring. This patient-centered change engaged the primary care team in the care of the patient while hospitalized and during discharge planning; it actively ensured that follow-up appointments occurred within 1 week after discharge. Prior to this intervention, there was no system for ensuring timely follow-up after hospital discharge. The new expectation for the ambulatory clinics was that clinic staff could “reach in” to the patient during the hospital stay and actively contact the patient before discharge to schedule a postdischarge appointment at the patient’s convenience.
The 4 practices had embraced and implemented the PCMH model, a core component of which is care coordination.34,35 Each clinic appointed a registered nurse (RN) to serve as a team-based care manager (CM) for patients being discharged from the hospital. Responsibilities included fielding calls or electronic communications from the inpatient team, developing a hospital follow-up workflow, developing a standardized list of questions to ask each patient after discharge, and calling patients to ensure a follow-up appointment was scheduled, ideally within 2 to 3 days and at least within 7 days of discharge. The CM prioritized scheduling follow-up appointments with the patient’s PCP to ensure the highest level of continuity.
In addition to patient-specific documents, CMs received electronic reports from inpatient teams (including from the ED, medical and surgical intensive care units, and surgery) listing all Group 1 patients discharged from the hospital. Reports were run daily and allowed the outpatient clinic staff and CMs to verify patients against previous lists of anticipated discharges, and to generate their own lists. The CMs would then make follow-up phone calls and ensure that appointments were scheduled for these patients.
Medical directors at the 4 clinics received monthly summary reports profiling clinical activities related to hospitalizations. A data team (led by author SF) created the reports, which initially focused on care delivered in ambulatory settings (and included the development of a “balanced scorecard” to assess quality of care, financial productivity, and operational efficiency36). The data team developed new reports specifically for hospital admissions, discharges, and readmissions, identifying:
• all patients admitted by inpatient team
• the number and percentage of patients who were readmitted within 30 days
• the number and percentage of patients who had received a follow-up phone call or electronic communication from the outpatient team
• the number of patients who had follow-up visits after discharge within 7 and 30 days
• the number of patients who had clinic visits prior to readmission
• all patients discharged from any service within the prior 24 hours.
These reports, which had patient drilldown capability, were forwarded to all providers and teams at each clinic by the medical director. Teams at each clinic were then charged with analyzing the readmissions, identifying high-risk patients, and improving the coordination of care for these patients, including the use of RN/clinician co-visits and proactive outreach from the team-based nurses and staff.
Transformation of inpatient activities. We reorganized inpatient teams to include clinician representatives from the clinics whose patients were being treated. This process ensured better continuity of experience and familiarity with the environment of care and discharge/follow-up processes for both patients and all providers.
Additionally, inpatient teams developed new workflows to ensure that all involved members of the outpatient team were well informed of the hospitalization process. On the first or second day of admission, a hospital follow-up document was electronically routed to the administrative support staff, the PCP team nurse, and the PCP (FIGURE 1). An integrated EMR created a link between the hospital and all ambulatory practices that allowed for real-time transmission of patient information. The document identified the timing of a follow-up appointment and requested a 48-hour phone call from the team nurse after hospital discharge. The inpatient team also included a concise summary of the hospitalization for the PCP, to aid in anticipating patient discharge and any impending needs. The document was retrievable and traceable in the EMR.
Study groups and statistical analysis
The Oregon Health & Science University’s Institutional Review Board (IRB#9768) determined this study was not human subjects research because the proposed activity did not meet the definition of human subject per 45 CFR 46.102(f). The board made this determination because our analysis file included only hospital readmission rates and no patient-level data.
Adult patients admitted by the inpatient teams consisted of 2 distinct populations: patients whose PCP practiced at one of the 4 outpatient clinics (Group 1 patients); and patients admitted from other, unaffiliated clinics (Group 2 patients). In contrast to the transformations in patient care described in Group 1, care provided to Group 2 patients was considered usual care, as there was no interface between outpatient and inpatient teams to revise operations. Patients in either group were excluded from analyses if they died during the hospitalization. Maternity patients were also excluded.
We identified the percentage of patients readmitted within 30 days of a hospital admission using administrative data sources, which underwent careful data checking and validation, and were sub-grouped according to whether the patients were in Group 1 or Group 2. We used group-specific and overall linear regression to examine the changes in percentage of readmission within 30 days of discharge in the 2 study groups over 12 months, including a model that specifically assessed the interaction between Group 1 readmission percentages and those in Group 2. We considered a P-value ≤.05 to be significant in this exploratory study.
RESULTS
Patient readmissions decreased significantly
Our analysis included 961 patients; 685 patients (71.3%) were in Group 1, and 276 (28.7%) were in Group 2 (Table 2). The distribution of patient gender and mean age was similar within groups for patients readmitted and not readmitted during the study period. Among patients readmitted, the mean hospital length of stay was 5.8 days and 7.1 days for Group 1 and Group 2, respectively. Among those not readmitted, the mean hospital length of stay was 4.3 and 4.9 in Group 1 and 2, respectively.
The percentage of patients readmitted per month ranged from 28.1% to 7.1% in Group 1 and 27.8% to 5.9% in Group 2 (Figure 2). Patient readmissions in Group 1 decreased significantly from 27% in May 2012 to 7.1% in April 2013 with an R2 of 0.43 (P=.02). Readmissions of patients in Group 2 were more variable; 26.1% in May 2012 and 25.9% in April 2013 with a non-significant R2 of 0.04 (P=.53). The regression model (unadjusted) that compared the interaction between Group 1 and Group 2 readmissions over the study period was significant, indicating a decrease in readmissions in Group 1 and no strong correlation between usual care and readmissions over time in Group 2 (P=.05).
DISCUSSION
Implementing intensive coordinated care management and transition processes in a group of primary care clinics appears to significantly decrease hospital readmissions for patients in Group 1, compared with those in Group 2 who received usual care. While it is possible that some of the ambulatory practices in Group 2 admitting patients to the inpatient services were using or developing care coordination programs including hospital follow-up, none of these providers or groups interfaced with the inpatient teams in this study. We are, therefore, confident that Group 2 providers were not undertaking any new or novel activities that reached in to hospital inpatient services to improve care coordination.
Our findings are consistent with the literature review conducted by Scott et al,27 which found that multicomponent interventions are more successful at reducing readmissions than single-component interventions. In our Group 1 clinics, we implemented 8 of the 12 predischarge, postdischarge, and bridging interventions identified by Hansen et al28 (medication reconciliation, discharge planning, scheduling of a follow-up appointment before discharge, follow-up telephone calls, timely communication with ambulatory providers, timely ambulatory provider follow-up, physician continuity across the inpatient and outpatient setting, and patient-centered discharge instructions).
Study strengths and weaknesses. The strengths of this study include means and quality of data capture for hospital readmission rates in the study setting. Limitations include the small sample sizes, which did not allow us to conduct a multivariable adjusted analysis that would have taken into account patient characteristics, seasons, and temporal correlations. These covariates might drive study findings in a way that results in us drawing inaccurate conclusions—the analysis we conducted (unadjusted) assumed that the events that occurred in each month were unrelated to what might have occurred in the prior month or subsequent month.
Patients in the 2 study groups did exhibit differences that could have contributed to our findings. For example, the average length of stay for Group 2 patients was longer by just over 1 day compared with that in Group 1. This may suggest Group 2 patients were sicker, and thus may have needed to be readmitted within 30 days of their discharge. We cannot know for certain that patients in Group 1 were less ill, as this would require a more discriminating study design. As with many studies, additional questions arise, but these serve to further a line of research that is vitally important.
Another factor that could have affected our findings is that Group 1 patient readmission rates started off higher than the Group 2 patients, so there is a chance that regression to the mean rather than changes in clinical care could have contributed to some of the decrease in Group 1 readmission rates. There are potential subject-level, provider-level, and clinic-level factors that could have been used to adjust for potential confounding. Future studies could address these factors. Longer study follow-up would provide an even better picture of the difference between the groups.
A multicomponent intervention works. Creating a culture of continuity is an important aspect of PCMH. Not all primary care clinics or PCMHs may have built-in relationships for inpatient care of their patients. We would argue that outpatient adoption of the enhanced “reaching in” and a multicomponent intervention would have a significant positive impact on patient care and improve the transition from in- to outpatient care, and likely reduce readmissions.
CORRESPONDENCE
Brett White, MD, 4411 SW Vermont St, Portland, OR 97219; [email protected]
The authors gratefully acknowledge the clinic and inpatient physicians and staffs as well as the Research Program in the Department of Family Medicine, Oregon Health & Science University.
1. Jencks SF, Williams MV, Coleman EA. Rehospitalizations among patients in the Medicare fee-for-service program. N Engl J Med. 2009;360:1418-1428.
2. Zaya M, Phan A, Schwarz ER. The dilemma, causes and approaches to avoid recurrent hospital readmissions for patients with chronic heart failure. Heart Fail Rev. 2012;17:345-353.
3. Marriott PF, Grigor JM, Hiep A. Reducing hospital readmission rates among schizophrenics. Med J Aust. 1976;2:897-898.
4. Fitzgerald JF, Smith DM, Martin DK, et al. A case manager intervention to reduce readmissions. Arch Intern Med. 1994;154:1721-1729.
5. Kim YJ, Soeken KL. A meta-analysis of the effect of hospital-based case management on hospital length-of-stay and readmission. Nurs Res. 2005;54:255-264.
6. Weinberger M, Oddone EZ, Henderson WG. Does increased access to primary care reduce hospital readmissions? Veterans Affairs Cooperative Study Group on Primary Care and Hospital Readmission. N Engl J Med. 1996;334:1441-1447.
7. Mudge A, Denaro C, Scott I, et al. The paradox of readmission: effect of a quality improvement program in hospitalized patients with heart failure. J Hosp Med. 2010;5:148-153.
8. Mistiaen P, Francke AL, Poot E. Interventions aimed at reducing problems in adult patients discharged from hospital to home: a systematic meta-review. BMC Health Serv Res. 2007;7:47.
9. Linertová R, García-Pérez L, Vázquez-Díaz JR, et al. Interventions to reduce hospital readmissions in the elderly: in-hospital or home care. A systematic review. J Eval Clin Pract. 2011;17:1167-1175.
10. Shepperd S, Parkes J, McClaren J, et al. Discharge planning from hospital to home. Cochrane Database Syst Rev. 2004;(1):CD000313. Review. Update in: Cochrane Database Syst Rev. 2010;(1):CD000313.
11. Huntley AL, Thomas R, Mann M, et al. Is case management effective in reducing the risk of unplanned hospital admissions for older people? A systematic review and meta-analysis. Fam Pract. 2013;30:266-275.
12. Crocker JB, Crocker JT, Greenwald JL. Telephone follow-up as a primary care intervention for postdischarge outcomes improvement: a systematic review. Am J Med. 2012;125:915-921.
13. Mistiaen P, Poot E. Telephone follow-up, initiated by a hospital-based health professional, for postdischarge problems in patients discharged from hospital to home. Cochrane Database Syst Rev. 2006;(4):CD004510.
14. Jack B, Paasche-Orlow M, Mitchell S, et al. An overview of the Re-Engineered Discharge (RED) toolkit. AHRQ Publication No.12(13)-0084. Rockville, MD: Agency for Healthcare Research and Quality; March 2013. 15. Berwick DM, Nolan TW, Whittington J. The triple aim: care, health, and cost. Health Aff (Millwood). 2008;27:759-769.
16. Greenwald J, Denham C, Jack B. The hospital discharge: A review of a high risk care transition with highlights of a reengineered discharge process. J Patient Saf. 2007;3:97-106.
17. Centers for Medicare & Medicaid Services. Readmissions Reduction Program. Available at: http://www.cms.gov/Medicare/Medicare-Fee-for-Service-Payment/AcuteInpatientPPS/Readmissions-Reduction-Program.html. Accessed June 18, 2013.
18. Joynt KE, Jha AK. A path forward on Medicare readmissions. N Engl J Med. 2013;368:1175-1177.
19. Joynt KE, Jha AK. Characteristics of hospitals receiving penalties under the Hospital Readmissions Reduction Program. JAMA. 2013;309:342-343.
20. Kangovi S, Grande D, Meehan P, et al. Perceptions of readmitted patients on the transition from hospital to home. J Hosp Med. 2012;7:709-712.
21. Braes T, Moons P, Lipkens P, et al. Screening for risk of unplanned readmission in older patients admitted to hospital: predictive accuracy of three instruments. Aging Clin Exp Res. 2010;22:345-351.
22. Allaudeen N, Schnipper JL, Orav EJ, et al. Inability of providers to predict unplanned readmissions. J Gen Intern Med. 2011;26:771-776.
23. Gruneir A, Dhalla IA, van Walraven C, et al. Unplanned readmissions after hospital discharge among patients identified as being at high risk for readmission using a validated predictive algorithm. Open Med. 2011;5:e104-e111.
24. Harrison PL, Hara PA, Pope JE, et al. The impact of postdischarge telephonic follow-up on hospital readmissions. Popul Health Manag. 2011;14:27-32.
25. Herrera-Espiñeira C, Rodríguez del Águila Mdel M, Navarro Espigares JL, et al. [Effect of a telephone care program after hospital discharge from a trauma surgery unit]. Gac Sanit. 2011;25:133-138.
26. Costantino ME, Frey B, Hall B, et al. The influence of a postdischarge intervention on reducing hospital readmissions in a Medicare population. Popul Health Manag. 2013;16:310-316.
27. Scott IA. Preventing the rebound: improving care transition in hospital discharge processes. Aust Health Rev. 2010;34:445-451.
28. Hansen LO, Young RS, Hinami K, et al. Interventions to reduce 30-day rehospitalization: a systematic review. Ann Intern Med. 2011;155:520-528.
29. Coaching helps cut readmissions. Hosp Case Manag. 2011;19:155-156.
30. DeVries A, Li CH, Sridhar G, et al. Impact of medical homes on quality, healthcare utilization, and costs. Am J Manag Care. 2012;18:534-544.
31. Paustian ML, Alexander JA, El Reda DK, et al. Partial and incremental PCMH practice transformation: implications for quality and costs. Health Serv Res. 2013 Jul 5. [Epub ahead of print].
32. Gilfillan RJ, Tomcavage J, Rosenthal MB, et al. Value and the medical home: effects of transformed primary care. Am J Manag Care. 2010;16:607-614.
33. Haglund M. Mastering readmissions: laying the foundation for change. Post-healthcare reform, pioneers are laying the foundation for serious readmissions-reduction work. Healthc Inform. 2011;28:10-13,16.
34. Meyers D, Peikes D, Genevro J, et al. The roles of patient-centered medical homes and accountable care organizations in coordinating patient care. AHRQ Publication No. 11-M005-EF. Rockville, MD: Agency for Healthcare Research and Quality; December 2010.
35. Ferrante JM, Balasubramanian BA, Hudson SV, et al. Principles of the patient-centered medical home and preventive services delivery. Ann Fam Med. 2010;8:108-116.
36. Fields SA, Cohen D. Performance enhancement using a balanced scorecard in a patient-centered medical home. Fam Med. 2011;43:735-739.