User login
Mohs surgery site, not type, predicts risk of suture contamination
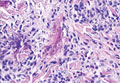
CHICAGO – Bacterial contamination of sutures is surprisingly common, and periorificial sites have a suture contamination rate of nearly 100%, according to a study of sutures collected during Mohs micrographic surgeries in 182 patients.
There’s no direct correlation between suture contamination and surgery site infection, said Dr. Jeremy Sunseri of Brown University, Providence, R.I., who presented the unpublished study at the annual meeting of the American Society of Dermatologic Surgery. However, knowing the risk factors for suture contamination can help reduce the risk of infections and potential antibiotic overuse, he noted.
"For instance, the use of antibiotic-coated sutures in high-risk contamination sites, or variations on draping techniques in these areas, may prove beneficial," Dr. Sunseri noted.
The investigators removed 338 sutures directly from their sterile surgery sites, and placed them in Petri dishes with a growth medium used for the isolation of gram-positive organisms.
They further classified the sutures based on anatomic locations (17), type of surgical closure (5), and suture type (7).
More than 57% of all sutures had bacterial growth, and almost all of those collected from the nose, mouth/lip, eye/orbit were contaminated.
Sutures collected from the scalp, neck, trunk, and upper and lower extremities had significantly lower risk of contamination, ranging from 0% to 20%, with the exception of the groin, which showed a 100% contamination rate.
Sutures from flap repairs were the most frequently contaminated (71%). Sutures collected from complex closures also had a relatively high rate of contamination (68%).
Sutures from intermediate repairs had a contamination rate of 47%, while grafts, purse string closures, and incomplete closures had a 44% rate.
Staphylococci were the most commonly identified bacteria, notably isolates of of Propionibacterium acnes, Corynebacterium sp., and Rothia dentocariosa.
There were no significant differences in the contamination rates of the seven different types of sutures studied.
"The take-home message is that the suture is long and patients are dirty, so be careful where you put that suture," Dr. Sunseri said during his presentation.
Dr. Sunseri had no financial conflicts to disclose.
On Twitter @NaseemSMiller
AT THE ASDS ANNUAL MEETING
Major finding: Nearly 100% of sutures removed from periorificial surfaces showed bacterial contamination.
Data source: Analysis of bacterial growth from 338 sutures removed directly from the sterile surgery site in 182 patients.
Disclosures: Dr. Sunseri had no financial conflicts to disclose.
Wells Syndrome
Consensus Recommendations From the American Acne & Rosacea Society on the Management of Rosacea, Part 3: A Status Report on Systemic Therapies
Psychoanalytic theory and the young child
I recently ran into a colleague who asked me whether I was still writing my column. I said yes and that I was currently writing an article on Selma H. Fraiberg. His response, "You don’t hear that name very much anymore," disappointed me. I responded by saying whenever a colleague, friend, or family member is having a baby, I send them a copy of "The Magic Years" with a clear statement that both parents must read it. It is clearly the best book on child rearing ever written in my opinion.
Ms. Fraiberg, creator of "The Magic Years," was a master’s in social work–trained psychoanalyst affiliated with the department of psychiatry at the University of California, San Francisco, who translated numerous concepts about babies, parents, and the first few years of life with wonderful examples of the type of incidents that every parent faces. She was highly regarded 50 years ago and received a great deal of praise for her book. But, at that time, there was a lot of prejudice against nonmedical degree psychoanalysts, and her book was not regarded as highly as I believe it should have been.

When I was a resident, I was required to read "The Magic Years," understand it, and be able to discuss it. Our teachers were concerned that we were busy being residents but also having children, and we really had to understand child rearing so that we could serve as resources for our residents and our analytic trainees.
Ms. Fraiberg translated psychoanalytic theory into child-rearing guidance in the book by looking at three age ranges: the first 18 months, 18 months to 3 years, and 3-6 years. Some of the examples are still fresh today, even though the book was published originally in 1959.
Dr. T. Berry Brazelton, the renowned pediatrician, wrote an introduction to the 50th anniversary of the book (New York: Scribner, 2008) saying that Ms. Fraiberg "makes each stage of emotional and mental development come alive!" I agree wholeheartedly. Furthermore, I would say that the concepts in the book can inform psychiatrists in our efforts to help our patients. After all, raising children (and growing up) is fraught with pitfalls. As Freud said early in his career, there are three impossible professions: governing nations, raising children, and psychoanalysis.
How the magic unfolds
Parents are often confused by things that children do or say, imaginary friends and animals – frustrating the child by pointing out reality when the child needs that imaginary friend or animal to survive. To the child, these imaginary friends and animals are not silly at all. A good example is what a niece of Ms. Fraiberg’s called the "Laughing Tiger."
Her niece, who was 2 years, 8 months old at the time, created the Laughing Tiger and many other imaginary companions at a time when she was afraid of ferocious animals. The niece’s "imaginary tiger gives her a kind of control over a danger which earlier had left her helpless and anxious," Ms. Fraiberg wrote. Instead of viewing this companion as problematic, it makes more sense to see this use of imagination as a healthy sign. Indeed, the child "can maintain his human ties and his good contact with reality while he maintains his imaginary world," she writes. "Moreover, it can be demonstrated that the child’s contact with the real world is strengthened by his periodic excursions into fantasy."
Virtually every chapter of the book is filled with insights that explain how young children interpret their world, which makes it invaluable for new parents. As we all know too well, the pitfalls in raising a child and growing up are many. I have not referred back to it for personal reasons in recent years. After all, my children are 54, 52, and 50 years old. But my wife and I did make very liberal use of the book throughout the years – while all of our friends were using Dr. Spock to help them navigate the waters of child rearing.
Mastering fear
Ms. Fraiberg gently guides the reader in an understanding of the child’s developing mind, why they cry, why they have tantrums, why they use imagination and how to help mom deal with the child’s anxiety. Take the example of a 2-year-old who was afraid of the family vacuum cleaner. Some young children control their fear of what must seem like loud monsters to them by learning to control the switch. But this toddler, who was known for his tendency to carry around a pocket-size screwdriver, was not satisfied with that solution. He had another idea: "Tiny screws and wheels were removed and lost in this frantic search," Ms. Fraiberg wrote. "...Finally, this limping monster issued its dying croak and succumbed without giving up its secret."
After a couple of years, the youngster’s "drive to investigate" was motivated by factors other than anxiety. Instead, he found investigation, discovery, and reconstruction to be pleasures in themselves. Interestingly, this child grew up to be a physicist.
There are many lessons here for psychoanalysts and our patients. One is that children experience things in which adults have no conscious memory. This means that we can help patients become better parents if we can get them to empathize with the child’s fears and frustrations.
Attachment, active handling
Ms. Fraiberg tells the story of an infant who developed an extremely severe sleep disturbance when she was 8 months old. Around 11 p.m. nightly, the infant woke up screaming, despite her parents’ efforts to calm her down. When her parents checked on her, the baby clung to her mother.
The episodes started after the baby woke up one night when the parents were out and had left her in the care of a babysitter. These meltdowns came in contrast to the child’s earlier reactions to her parents’ absence: "She never seemed to mind before if she wakened and saw a babysitter instead of us," Ms. Fraiberg quotes the parents as saying. "We just didn’t expect anything like this." What might explain this sudden new reaction?
"We know that the attachment to the mother is especially strong at this stage of development and a strange face may disturb the child at this age, even when encountered in the daytime," she writes. "The reaction to the strange face, as we have seen, is an indication of the discrimination of the mother as a person and the recognition of her as the person who gives satisfactions and protection. The stranger’s face that appears when mother’s face is expected produces anxiety because it symbolizes the absence or loss of the mother."
As you can see from that scenario, Ms. Fraiberg lets the mother know how essential she is and how early the child is distressed by the mother’s disappearance. In general, some people argue that they have to go on with their lives and that the baby will have to learn to be away from their mothers. We have to help our patients understand that the learning process is a burden for the infant. Some kids take a long time to learn how to separate from mom. Ms. Fraiberg helped the baby under discussion overcome her anxiety through nursery games in which her mother would hide her face one minute and return the next. She said the game allowed the baby to "work out the problem in her waking hours so that gradually the sleep disturbance disappeared."
Ms. Fraiberg also applies psychoanalytic theory to explain why a 9-month-old with a healthy appetite stopped eating and went on what she calls a "food strike" that lasted for 3 days. The child’s mother – who wanted the meals to be neat and orderly events – had been feeding the baby. So what brought the strike to an end?
One day the child’s father took over the feeding, and to the parents’ surprise, the baby started eating again. The mother immediately blamed herself, but the child’s behavior had nothing to do with her, per se. When the baby’s father tried to feed him, he grabbed the spoon and "plastered his face with strained carrots. Papa seemed quite unconcerned." When the baby turned his cup upside down, allowing his milk to spill all over the floor, the father took the messiness in stride.
This scenario was in stark contrast to those that emerged when the baby’s mother was in charge. When the baby tried to snatch the spoon from his mother, she got an extra spoon. When he tried to play with his milk cup, she moved it out of reach. As soon as the baby’s father allowed him to have freedom in feeding himself, the strike ended.
The explanation for the baby’s behavior changes is rooted in child development theory, Ms. Fraiberg writes. "...A certain amount of active handling of objects is absolutely necessary for the child in discovering and learning about the world around him," she says.
The period of 18 months to 3 years is dominated by words. If the child wishes something, he will use whatever words he has learned up until then, not knowing that they might not have any relationship to what he’s wishing for. If he wants something, he demands it or screams. He does not have language that is precise in any way. He uses words that he hopes will satisfy his wishes.
When the child acquires the word "bye-bye," he "begins to take the departures of his parents with more grace." The acquisition of language also makes it possible for the child to show more self-control and plays a role in the formation of his conscience.
I consider myself a developmental psychiatrist, an area in which child development is essential to all therapeutic engagement. Much can be learned about the patient if we know about his childhood and parents. I often see the patient doing to his child what his parents did to him. Patients are always shocked when I point this out to them, and the process of understanding how they got to where they are occurs. I call it therapeutic living. The book is so important because it tries to help parents learn how to handle tough developmental moments and periods. The section on toilet training is classic.
Please read "The Magic Years," and get your colleagues and students to read it as well. Ms. Fraiberg was a true master of the analytic method.
Dr. Fink is a psychiatrist and consultant, and professor of psychiatry at Temple University, Philadelphia.
I recently ran into a colleague who asked me whether I was still writing my column. I said yes and that I was currently writing an article on Selma H. Fraiberg. His response, "You don’t hear that name very much anymore," disappointed me. I responded by saying whenever a colleague, friend, or family member is having a baby, I send them a copy of "The Magic Years" with a clear statement that both parents must read it. It is clearly the best book on child rearing ever written in my opinion.
Ms. Fraiberg, creator of "The Magic Years," was a master’s in social work–trained psychoanalyst affiliated with the department of psychiatry at the University of California, San Francisco, who translated numerous concepts about babies, parents, and the first few years of life with wonderful examples of the type of incidents that every parent faces. She was highly regarded 50 years ago and received a great deal of praise for her book. But, at that time, there was a lot of prejudice against nonmedical degree psychoanalysts, and her book was not regarded as highly as I believe it should have been.
When I was a resident, I was required to read "The Magic Years," understand it, and be able to discuss it. Our teachers were concerned that we were busy being residents but also having children, and we really had to understand child rearing so that we could serve as resources for our residents and our analytic trainees.
Ms. Fraiberg translated psychoanalytic theory into child-rearing guidance in the book by looking at three age ranges: the first 18 months, 18 months to 3 years, and 3-6 years. Some of the examples are still fresh today, even though the book was published originally in 1959.
Dr. T. Berry Brazelton, the renowned pediatrician, wrote an introduction to the 50th anniversary of the book (New York: Scribner, 2008) saying that Ms. Fraiberg "makes each stage of emotional and mental development come alive!" I agree wholeheartedly. Furthermore, I would say that the concepts in the book can inform psychiatrists in our efforts to help our patients. After all, raising children (and growing up) is fraught with pitfalls. As Freud said early in his career, there are three impossible professions: governing nations, raising children, and psychoanalysis.
How the magic unfolds
Parents are often confused by things that children do or say, imaginary friends and animals – frustrating the child by pointing out reality when the child needs that imaginary friend or animal to survive. To the child, these imaginary friends and animals are not silly at all. A good example is what a niece of Ms. Fraiberg’s called the "Laughing Tiger."
Her niece, who was 2 years, 8 months old at the time, created the Laughing Tiger and many other imaginary companions at a time when she was afraid of ferocious animals. The niece’s "imaginary tiger gives her a kind of control over a danger which earlier had left her helpless and anxious," Ms. Fraiberg wrote. Instead of viewing this companion as problematic, it makes more sense to see this use of imagination as a healthy sign. Indeed, the child "can maintain his human ties and his good contact with reality while he maintains his imaginary world," she writes. "Moreover, it can be demonstrated that the child’s contact with the real world is strengthened by his periodic excursions into fantasy."
Virtually every chapter of the book is filled with insights that explain how young children interpret their world, which makes it invaluable for new parents. As we all know too well, the pitfalls in raising a child and growing up are many. I have not referred back to it for personal reasons in recent years. After all, my children are 54, 52, and 50 years old. But my wife and I did make very liberal use of the book throughout the years – while all of our friends were using Dr. Spock to help them navigate the waters of child rearing.
Mastering fear
Ms. Fraiberg gently guides the reader in an understanding of the child’s developing mind, why they cry, why they have tantrums, why they use imagination and how to help mom deal with the child’s anxiety. Take the example of a 2-year-old who was afraid of the family vacuum cleaner. Some young children control their fear of what must seem like loud monsters to them by learning to control the switch. But this toddler, who was known for his tendency to carry around a pocket-size screwdriver, was not satisfied with that solution. He had another idea: "Tiny screws and wheels were removed and lost in this frantic search," Ms. Fraiberg wrote. "...Finally, this limping monster issued its dying croak and succumbed without giving up its secret."
After a couple of years, the youngster’s "drive to investigate" was motivated by factors other than anxiety. Instead, he found investigation, discovery, and reconstruction to be pleasures in themselves. Interestingly, this child grew up to be a physicist.
There are many lessons here for psychoanalysts and our patients. One is that children experience things in which adults have no conscious memory. This means that we can help patients become better parents if we can get them to empathize with the child’s fears and frustrations.
Attachment, active handling
Ms. Fraiberg tells the story of an infant who developed an extremely severe sleep disturbance when she was 8 months old. Around 11 p.m. nightly, the infant woke up screaming, despite her parents’ efforts to calm her down. When her parents checked on her, the baby clung to her mother.
The episodes started after the baby woke up one night when the parents were out and had left her in the care of a babysitter. These meltdowns came in contrast to the child’s earlier reactions to her parents’ absence: "She never seemed to mind before if she wakened and saw a babysitter instead of us," Ms. Fraiberg quotes the parents as saying. "We just didn’t expect anything like this." What might explain this sudden new reaction?
"We know that the attachment to the mother is especially strong at this stage of development and a strange face may disturb the child at this age, even when encountered in the daytime," she writes. "The reaction to the strange face, as we have seen, is an indication of the discrimination of the mother as a person and the recognition of her as the person who gives satisfactions and protection. The stranger’s face that appears when mother’s face is expected produces anxiety because it symbolizes the absence or loss of the mother."
As you can see from that scenario, Ms. Fraiberg lets the mother know how essential she is and how early the child is distressed by the mother’s disappearance. In general, some people argue that they have to go on with their lives and that the baby will have to learn to be away from their mothers. We have to help our patients understand that the learning process is a burden for the infant. Some kids take a long time to learn how to separate from mom. Ms. Fraiberg helped the baby under discussion overcome her anxiety through nursery games in which her mother would hide her face one minute and return the next. She said the game allowed the baby to "work out the problem in her waking hours so that gradually the sleep disturbance disappeared."
Ms. Fraiberg also applies psychoanalytic theory to explain why a 9-month-old with a healthy appetite stopped eating and went on what she calls a "food strike" that lasted for 3 days. The child’s mother – who wanted the meals to be neat and orderly events – had been feeding the baby. So what brought the strike to an end?
One day the child’s father took over the feeding, and to the parents’ surprise, the baby started eating again. The mother immediately blamed herself, but the child’s behavior had nothing to do with her, per se. When the baby’s father tried to feed him, he grabbed the spoon and "plastered his face with strained carrots. Papa seemed quite unconcerned." When the baby turned his cup upside down, allowing his milk to spill all over the floor, the father took the messiness in stride.
This scenario was in stark contrast to those that emerged when the baby’s mother was in charge. When the baby tried to snatch the spoon from his mother, she got an extra spoon. When he tried to play with his milk cup, she moved it out of reach. As soon as the baby’s father allowed him to have freedom in feeding himself, the strike ended.
The explanation for the baby’s behavior changes is rooted in child development theory, Ms. Fraiberg writes. "...A certain amount of active handling of objects is absolutely necessary for the child in discovering and learning about the world around him," she says.
The period of 18 months to 3 years is dominated by words. If the child wishes something, he will use whatever words he has learned up until then, not knowing that they might not have any relationship to what he’s wishing for. If he wants something, he demands it or screams. He does not have language that is precise in any way. He uses words that he hopes will satisfy his wishes.
When the child acquires the word "bye-bye," he "begins to take the departures of his parents with more grace." The acquisition of language also makes it possible for the child to show more self-control and plays a role in the formation of his conscience.
I consider myself a developmental psychiatrist, an area in which child development is essential to all therapeutic engagement. Much can be learned about the patient if we know about his childhood and parents. I often see the patient doing to his child what his parents did to him. Patients are always shocked when I point this out to them, and the process of understanding how they got to where they are occurs. I call it therapeutic living. The book is so important because it tries to help parents learn how to handle tough developmental moments and periods. The section on toilet training is classic.
Please read "The Magic Years," and get your colleagues and students to read it as well. Ms. Fraiberg was a true master of the analytic method.
Dr. Fink is a psychiatrist and consultant, and professor of psychiatry at Temple University, Philadelphia.
Resident Handoff Program Reduces Medical Errors at Pediatric Hospital
A standardized handoff program can reduce medical errors and can be replicated at hospitals across the country, says the lead researcher of a new study published in JAMA.
Researchers reviewed the medical literature for successful handoff-intervention programs that they could teach to residents and senior interns working within two units at Boston Children’s Hospital. They ultimately settled on a bundle that included standardized communication and handoff training, a verbal mnemonic to help staff members remember what information to pass off to the next team, and a handoff structure that involved junior and senior physicians meeting in a quiet room to discuss the handoff. In addition, on one unit, residents used a computerized tool linked to the electronic medical record that made it easier for them to pass along important information about the patient.
The analysis included 642 handoffs that occurred before the intervention and 613 that happened afterwards. Researchers found that medical errors decreased from 33.8 per 100 admissions (95% CI, 27.3–40.3) prior to the intervention to 18.3 per 100 admissions (95% CI, 14.7–21.9; P?P=0.04).
Amy Starmer, MD, MPH, associate scientific researcher at Boston Children’s Hospital and lecturer in pediatrics at Harvard Medical School in Boston, says that when implementing an intervention program, it’s important to involve staff from all levels of the hospital.
“We thought carefully about who should be able to make transformational change happen,” says Dr. Starmer. “That included resident program directors, educators, attending physicians who help observe the residents, and senior administrative people in the hospital who knew this was going on and were supportive. Even the technology team was able to devote programming support and resources to allow the development of a computerized tool.”
Visit our website for more information on hospital handoff programs.
Side Effects of Synthetic Marijuana Blamed for Thousands of ED Visits
A report outlining the alarming side effects of synthetic marijuana use in young adults acts as a call to attention for hospitalists, as thousands of patients per year are exposed to the chemicals found in the cannabinoid.
The report from the federal Substance Abuse and Mental Health Services Administration shows that synthetic marijuana was responsible for 11,400 ED visits in one year, with brain and kidney damage, hallucinations, and violent behavior among the severe reactions found in users.
Synthetic marijuana is herbs sprayed or soaked in chemicals, making it difficult for drug tests to detect and more dangerous to consume. Some of the chemicals are found in fertilizers, painkillers, and cancer treatments, creating an unsafe and potentially deadly concoction. It is inexpensive, available online or in convenience stores sold under such brand names as “potpourri,” “K2,” and “spice,” and labeled “not for human consumption.”
The multiple reasons why patients may be having psychoactive effects could be a daunting mystery to solve. However, two hospitalists provide insight on possible treatment options. Scott Carney, MD, FAAP, assistant professor and program director at University of South Carolina School of Medicine in Columbia, and Melissa Schafer, MD, assistant professor of pediatrics at SUNY Upstate Medical University in Syracuse, N.Y., advise hospitalists to treat these patients with IV fluids and close monitoring while they metabolize. A toxicology consultation and psychological evaluation should be ordered, and Dr. Schafer suggests poison control can “help with knowing what is on the streets in your area and what to expect.”
Visit our website for more information on treating symptoms of drug overdose.
How Many Americans Will Remain Uninsured?
The question of whether health insurance equals healthcare access is complicated in the roughly two dozen states that have chosen not to expand Medicaid—an option granted by the U.S. Supreme Court in its June 2012 decision that upheld the law’s main tenets. Even with the federal government paying the full cost for the first three years (decreasing to 90% by 2020), some states have argued that the economic burden will be too great.
According to a recent analysis by the Kaiser Family Foundation, roughly five million uninsured adults may now fall into a “coverage gap” as a result. In essence, they will earn too much to be covered under the highly variable Medicaid caps established by individual states but too little to receive any federal tax credits to help pay for insurance in the exchanges. With limited options, the report suggests, they are likely to remain uninsured.
Safety net hospitals also may be squeezed between conflicting state and federal Medicaid priorities. During the initial Affordable Care Act (ACA) negotiations, hospitals agreed to $155 billion in cuts over 10 years, including sharp reductions in Disproportionate Share Hospital (DSH) payments, in anticipation of seeing a significant decrease in uninsured patients. Despite lower DSH payments, the hospitals expected to recoup the money through more Medicaid or private insurance reimbursements.
"The Medicaid expansion being optional throws a kink in all of that,” says Leighton Ku, PhD, MPH, director of the Center for Health Policy Research at George Washington University School of Public Health and Health Services in Washington, D.C.
The ongoing open enrollment in insurance exchanges will make up part of the total. But in states that are not expanding Medicaid, the number of newly insured patients may not compensate for the DSH reductions. Robert Berenson, MD, a senior fellow at the Washington, D.C.-based Urban Institute, a nonpartisan think tank focused on social and economic policy, says the resulting net loss could put some hospitals under additional financial strain.
"There will be pressure within the states from hospitals and from the business community to expand Medicaid because, otherwise, they’re bearing the burden of it,” he says.
Bryn Nelson is a freelance medical writer in Seattle.
Hospitalist Joshua Lenchus, DO, RPh, SFHM, Says Obamacare Might Impact Patient Access, Physician Workload
Click here to listen to more of our interview with Dr. Lenchus
Click here to listen to more of our interview with Dr. Lenchus
Click here to listen to more of our interview with Dr. Lenchus
Hospitalist Rick Hilger, MD, SFHM, Discusses How the ACA Might Accelerate the Drive Toward ACO-style of Care
Click here to listen to more of our interview with Dr. Hilger
Click here to listen to more of our interview with Dr. Hilger
Click here to listen to more of our interview with Dr. Hilger
ONLINE EXCLUSIVE
Enter text here
Enter text here
Enter text here