User login
Reflections on the Hospital Environment

Six years ago, after I had been in clinical practice for almost a decade, my career took several unusual turns that now have me sitting in the position of president of a 500-bed, full-service, very successful community hospital and referral center. While that has inevitably whittled my clinical time down to a mere fraction of what it used to be, I still spend a lot of time “on the dance floor,” although the steps are different at the bedside.
Whether you spend your day going from patient to patient or meeting to meeting, over time it’s nearly inevitable that you will lose some perspective and appreciation for the hospital settings that we have chosen to spend our careers in. From time to time, whether you are in clinical medicine or administration, take the time to step off that dance floor and get a different perspective, to reflect upon our hospital environment. It’s a critical skill for “systems-based thinkers.” Take a minute to reconnect and appreciate some extraordinary things about the places we work in.
Here are a handful of my own reflections:
Hospitals are remarkable places. Lives are transformed in hospitals—some by the miraculous skills and technology available, and some despite that technology. Last week, I saw a 23-week-old baby in our neonatal ICU, barely a pound, intubated, being tube-fed breast milk, with skin more delicate than tissue paper. When I was a medical student, such prematurity was simply incompatible with life.
We also walk patients and families through the end-of-life journey. To organize families and patients around such issues and help them find a path toward understanding and closure is a remarkable experience as well.
The difference between a good hospital and a great one is culture, not just “quality.” Over Labor Day, I went to my parents’ house outside Cincinnati. When I arrived, near midnight, my mother greeted my three children and me and then announced that she had to take my father to the hospital. Evidently, he had a skin/soft tissue infection that had gotten worse over the last couple of days, and when contacted that evening, his physician had made arrangements for him to be admitted directly to a nearby community hospital. It sure seemed to me that it would make more sense for me to take him to the hospital, so off we went.
I will say at this point that the quality of his care was fine. He was guided from registration to his room promptly. His IV antibiotics were started and were appropriately chosen. A surgeon saw him and debrided a large purulent lesion. The wound was packed, and he started feeling better. His pain was well controlled, and he went home a few days later with correct discharge instructions. There were no medication errors and no “near-misses” or harm events.
Yet, on that first night, no one was introduced by name or role. On the wheelchair ride up to the room, we passed at least six employees—four nurses or aides, a clerk, and a housekeeper. No one broke away from what they were doing (or not doing) to make eye contact, much less to smile or greet us. This hospital has EHR stations right in patient rooms, and the nurse and charge nurse stood in front of the machine, where we could hear them, complaining about the EHR. No one was able to step back from “the dance floor” of the minute-by-minute work and acknowledge the bummer reality that my father was going to spend Labor Day weekend in the hospital. And this is at a well-regarded community hospital, well-appointed with private rooms, in a relatively affluent community, with resources that most hospitals dream of. I left that night disappointed, not in the quality but in the culture.
Empathy matters. At the Cleveland Clinic, all employed physicians are now required to take a course called “Foundations of Healthcare Communication.” I recently took the class with about a dozen others. Our facilitator led us through several workshops and simulations of patients who were struggling with emotions—fear, uncertainly, anxiety. What struck me in participating in these workshops was our natural tendency as physicians when in these situations to try to “fix the problem.” We try to reassure, for instance, that a patient has “nothing to worry about,” that “everything will be fine,” or that “you are in good hands.”
While these statements may have a role, jumping to them as an immediate response misses a critical step: the acknowledgement of the fear, anxiety, or sense of hopelessness that our patients feel. It’s terribly difficult, when surrounded by so much sickness, to stay in touch with our ability to express empathy. Therefore, it’s all the more important to be able to step back and appreciate the need to do so.
Change is difficult—and hospitals are not airplanes. In healthcare, we are attempting to apply the principles of high reliability, continuous improvement, and “lean workflows” to our systems and to the bedside. This is absolutely necessary to improve patient safety and the outcomes and lives in our communities, with comparisons to the airline industry and other “high reliability” industries as benchmarks. I couldn’t agree more that our focus should not just be on prevention of errors; we should be eliminating them. Every central line-associated bloodstream infection, every “never event,” every patient who does not feel touched by our empathy—we should think of each of these as our industry’s equivalent of a “plane crash.”
As leaders, however, it’s critical that we step back and remember that healthcare is far behind in terms of integrated technologies and decision support—and more dependent on “human factors.” We are more complex, more variable, and more fallible.
A nurse arriving on his or her shift at my hospital is coming in to care for somewhere between four and seven patients, each of whom have different conditions, different complexities, different levels of understanding and expectation, different provider teams and family support. I am not sure that the comparison to the airline industry is appropriate, unless we level the playing field: How safe and reliable would air travel be if, until he or she sat down in the cockpit, the pilot had no idea what kind of plane he would be flying, how many of her flight crew had shown up, what the weather would be like on takeoff, or where the flight was even going. That is more similar to our reality at the bedside.
The answer, of course, is that the airline industry has made the decisions necessary to ensure that pilots, crew, and passengers are never in such situations. We need to re-engineer our own systems, even as they are more reliant upon these human factors. We also need the higher perspective to manage our teams through these extraordinarily difficult changes.
In Sum
I believe that the skills that successful physician leaders need come, either naturally or through self-selection, to many who work in hospital-based environments: teamwork, collaboration, communication, deference to expertise, and a focus on results. I also believe that the physician leaders who will stand out and become leaders in hospitals, systems, and policy will be those who are able stand back, gain perspective, and organize teams and systems toward aspirational strategies that engage our idealism and empathy, and continuously raise the bar.
From my 15 years with SHM and hospital medicine, I’ve seen that our organization is full of such individuals. Those of us in administrative and hospital leadership positions are looking to all of you to learn and showcase those skills, and to lead the way forward to improve care for our patients and communities.
Dr. Harte is president of Hillcrest Hospital in Mayfield Heights, Ohio, part of the Cleveland Clinic Health System. He is associate professor of medicine at the Lerner College of Medicine in Cleveland and an SHM board member.
PODCAST: Hospitalists and eInformation Management
This month’s feature looks at ways that hospitalists can better manage the flood, and flow, of eInformation in the hospital setting.
Three hospitalists, Dr. Vineet Arora, Dr. Cheng-Kai Kao, and Dr. Roger Yu, offer advice on navigating the push and pull of information, forging a collaboration between clinicians and IT professionals to more effectively manage the flow of digital information, and building infrastructure to support eInformation management.
Click here to listen to our eInformation management podcast.
Electronic Health Records Can Complicate Who Does What in a Hospital


The accumulated wisdom, research data, and opinions regarding the use of electronic health records (EHRs) are vast. A quick Internet search turns up many informative articles on their positive and negative effects. But I haven’t found many that explicitly review the unanticipated effects EHRs have on who does what in the hospital.
For example, when reports such as admission and discharge notes are done via recorded dictation and transcription, the author would typically dictate where copies of the report should be sent (“copy to Dr. Matheny”) and rely on others to ensure it reached its intended destination. In many hospitals, such reports are now typed directly into the EHR, often using speech recognition software, and it is up to the author to click several buttons to ensure that it is routed to the intended recipients. So now a clerical function, sending reports, is handled by providers. This can be a good thing—reduced clerical staffing costs, faster transmission of reports—but often means that there is no documentation within the report itself of whom it was sent to (i.e., no list of “cc’s”). It also means that when the recipient isn’t easy to find, the report author is likely to give up, and the report may never be sent.
Any hospitalist using an EHR could easily list dozens of similar unanticipated effects, both good and bad. The magnitude and risk of these are difficult to quantify.
Altered Referral Patterns, Division of Labor
A hospitalist-specific side effect of EHR adoption is that they tend to cause many other doctors to resist serving as attending physician, instead asking hospitalists to replace them in that role. Even without EHRs, shifting attending responsibility to hospitalists has been a trend at nearly every hospital for years, but it can be accelerated dramatically at the time of a “go live.” So, in addition to the stress of adapting to the new EHR, hospitalists typically face higher than usual patient volumes resulting from increased referrals from other doctors.
If you’re a hospitalist facing an upcoming “go live,” it would be worth talking to other doctors in multiple specialties regarding your capacity to handle additional work. Keep in mind the possibility of higher than typical winter 2014 patient volumes that could result from patients who are newly insured through health exchanges.
Many factors, in addition to EHRs, are moving physicians away from a willingness to serve as attending, including the complexity of managing inpatient vs. observation status, keeping up with ever-changing documentation, pay-for-performance initiatives, the stress of ED call, and so on. As I’ve written before (see my January 2011 column, “Health IT Hurdles,”), I think effective management of hospital systems is becoming as complicated as safely piloting a jumbo jet. It will be increasingly difficult for doctors in any specialty to stay proficient at “piloting” a hospital unless they do it all or most of the time. And, staying proficient at multiple hospitals simultaneously may not be feasible at some point. We’ll see.
When Do Things Get Done?
A friend of mine, Dr. John Maa, is a general surgeon who was instrumental in establishing one of the first general surgery hospitalist practices. He tells a very personal and tragic story of his mother’s death, which, he has come to believe, might have been made more likely because of the unintended effect of an EHR.
She was a healthy 69-year-old who developed new onset atrial fibrillation and went to “one of the most highly regarded academic medical centers on the West Coast,” albeit not a facility where John was practicing. She was admitted with orders for anticoagulation but spent her first night on a stretcher in the ED because no inpatient bed was available. She went to a hospital room the next day, but her late arrival there delayed the planned transesophageal echo and cardioversion by another day.
Tragically, before the cardioversion could be done, she had a very large embolic stroke that led to brain herniation. A short time later, John and his father made the wrenching decision to discontinue mechanical ventilation. She died 112 hours after walking into the hospital.
What John later learned is that the admission orders written while she was in the ED were put into “sign and hold” status in the hospital’s EHR. Her caregivers had not anticipated a significant delay in moving her to an inpatient bed, and for the 18 or so hours she spent boarding in the ED, her admission orders were not acted on, and anticoagulation was delayed many hours. She might have had the same outcome even if anticoagulation had been started promptly, but it would have been much less likely.
John believes that the “sign and hold” status of the admission orders was a major contributor to the treatment delay. It increased the risk that the ED caregivers never acted on those orders, and may not have even seen them, since the EHR essentially holds them for presentation to the receiving inpatient unit.
John only recognized this vulnerability three years after his mother’s passing, when he underwent the physician training for the same EHR system. The course teachers agreed that this problem could arise if a patient was boarded in the ED for a prolonged period but felt that the responsibility rested with hospital administrators to minimize overcrowding in the ED. John also raised the issue with hospital leadership, who shared his concern but believed that a software remedy should be the solution. Ultimately, the answer may come from medical hospitalists, who recognize that every day and night, patients across America are at risk for a repeat of the incident John’s family suffered nearly five years ago.
In a very well written and moving essay, John describes his mother’s care.1 Though he doesn’t specifically mention the likely contribution of the “sign and hold” orders, it is one more example of EHR-related confusion that can arise around who does what and when they should do it. Clearly, the same sort of confusion exists in a non-EHR hospital, but it is the EHR-related change in the previous way of doing things that likely increases risk.
It can be very difficult—even impossible—to see all of these issues in advance. Even when acknowledged, the challenges can be difficult to address. But the first step is to recognize a problem, or potential problem, and think carefully about how it should be addressed.
Dr. Nelson has been a practicing hospitalist since 1988. He is co-founder and past president of SHM, and principal in Nelson Flores Hospital Medicine Consultants. He is co-director for SHM’s “Best Practices in Managing a Hospital Medicine Program” course. Write to him at [email protected].
Reference
Five Reasons To Pursue ABIM's Hospitalist-Focused MOC

By now, most hospitalists have at least heard about the Recognition in Focused Practice in Hospital Medicine (RFPHM), which is offered as a variation in certification for internal medicine- and family medicine-trained graduates who are pursuing Maintenance of Certification (MOC). Although the requirements are relatively straightforward, it may not be abundantly clear exactly why a hospitalist would pursue this pathway. As a recent “graduate” of the first cycle of the program, I can testify it is wholly worth the time and energy for the following reasons:
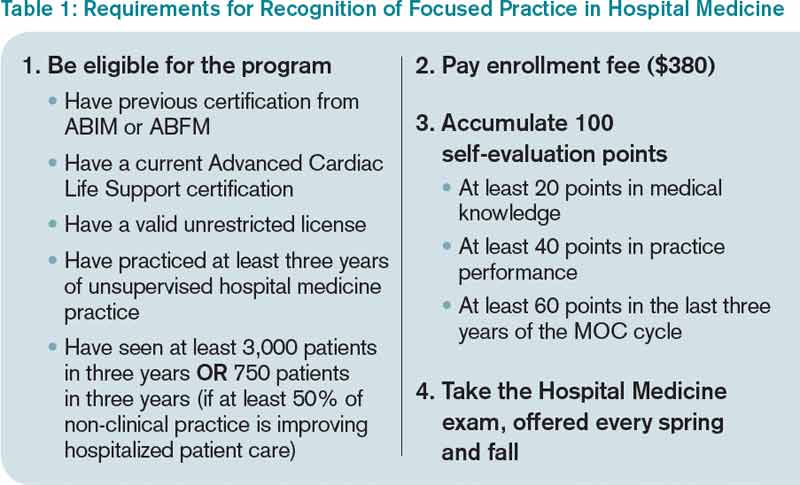
1. The requirements are relatively easy. Table 1 outlines the requirements for eligibility for enrolling in the program through the American Board of Internal Medicine (ABIM); enrollment through the American Board of Family Medicine (ABFM) also is available. These are basic requirements, and most practicing hospitalists will easily qualify simply by doing their daily jobs. Enrollment does require an administrative fee, but many HM programs can—and should—reimburse you for these fees, so be sure to ask if your program will cover the cost.
After enrolling and paying the fee, your next step is to accumulate points toward certification. Of note, the 100 points do not all have to be accumulated prior to sitting for the exam, but accumulating these points generally prepares you for the exam, so it is a good idea to complete this task before the exam, in most circumstances.
The medical knowledge modules can be completed through ABIM/ABFM, the Society of Hospital Medicine (SHM), or the New England Journal of Medicine.1 A repertoire of clinical and non-clinical modules are offered by ABIM, and there are two modules on quality-patient safety offered by SHM. You can attend a number of pre-courses offered at local-regional-national HM meetings; these modules can be completed individually or in a group setting. A list of available group learning sessions can be found at www.abim.org. You can earn CME credit for completing these modules. Not only are the medical knowledge modules readily available, but they are also well written, are easy to complete, and prepare you well for the exam.
The practice performance modules can be completed through ABIM/ABFM or through a number of medical centers that participate in the American Board of Medical Specialties “Portfolio Program.” For organizations that participate in the program, hospitalists within the organizational network who have completed a quality improvement project may qualify for module credit. A list of these sponsoring organizations can be found at http://mocportfolioprogram.org/approved-portfolio-sponsors.
Hospitalists can earn practice improvement module (PIM) credit for being involved in a number of large collaborative projects, including SHM’s mentored implementation programs (e.g. glycemic control, VTE, and Project BOOST).3
For those completing a PIM through the ABIM, the most straightforward are the self-directed PIM or the completed project PIM.2
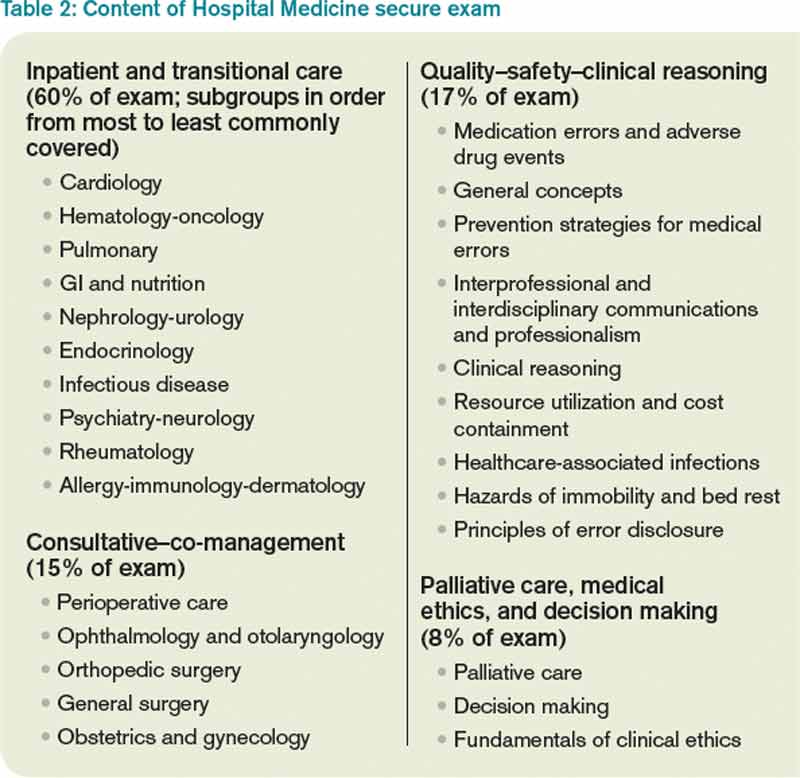
2. The exam content is known. Table 2 lists the content categories of the secure exam, published by ABIM, with approximate percentages of the content within overall categories and subcategories. This information helps you focus your efforts in preparing for the exam and is aligned with what most hospitalists practice on a daily basis.
3. The exam preparation is easy. Not only is the content outlined in the blueprint in Table 2, but practice exams are available online from the ABIM and a tutorial can be found at www.abim.org/hospital-medicine-tutorial. This tutorial simulates the actual exam, to enhance preparation and reduce testing anxiety.
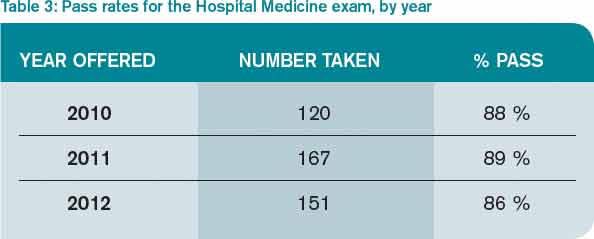
4. The exam pass rate is high. Table 3 lists pass rates from the 2010-2012 hospital medicine exam. These pass rates are equivalent to the general medicine exam, and they exceed some of the other specialty exam pass rates.
5. RFPHM is gaining more of the recognition it deserves. Given this growth in recognition, from employers, peers, patients, and maybe even payors, it would serve you well to start the process early, because it is highly likely to gain traction in the coming years.
Join Us
All told, RFPHM enrollment, preparation, and exam completion are straightforward, relatively easy, and worth the time and energy. I hope you join me and the 418 other hospitalists who have pursued this recognition. You will be glad you invested in your future.
Dr. Scheurer is a hospitalist and chief quality officer at the Medical University of South Carolina in Charleston. She is physician editor of The Hospitalist. Email her at [email protected].
References
- American Board of Internal Medicine. List of self-evaluation modules. Available at: http://www.abim.org/maintenance-of-certification/medical-knowledge/modules.aspx#hosp. Accessed November 27, 2013.
- American Board of Internal Medicine. List of PIMs from ABIM. Available at: http://www.abim.org/moc/earning-points.aspx. Accessed November 27, 2013.
- American Board of Internal Medicine. List of PIMs from sponsoring institutions. Available at: http://www.abim.org/moc/earning-points/productinfo-demo-ordering.aspx#aqi. Accessed November 27, 2013.
By now, most hospitalists have at least heard about the Recognition in Focused Practice in Hospital Medicine (RFPHM), which is offered as a variation in certification for internal medicine- and family medicine-trained graduates who are pursuing Maintenance of Certification (MOC). Although the requirements are relatively straightforward, it may not be abundantly clear exactly why a hospitalist would pursue this pathway. As a recent “graduate” of the first cycle of the program, I can testify it is wholly worth the time and energy for the following reasons:
1. The requirements are relatively easy. Table 1 outlines the requirements for eligibility for enrolling in the program through the American Board of Internal Medicine (ABIM); enrollment through the American Board of Family Medicine (ABFM) also is available. These are basic requirements, and most practicing hospitalists will easily qualify simply by doing their daily jobs. Enrollment does require an administrative fee, but many HM programs can—and should—reimburse you for these fees, so be sure to ask if your program will cover the cost.
After enrolling and paying the fee, your next step is to accumulate points toward certification. Of note, the 100 points do not all have to be accumulated prior to sitting for the exam, but accumulating these points generally prepares you for the exam, so it is a good idea to complete this task before the exam, in most circumstances.
The medical knowledge modules can be completed through ABIM/ABFM, the Society of Hospital Medicine (SHM), or the New England Journal of Medicine.1 A repertoire of clinical and non-clinical modules are offered by ABIM, and there are two modules on quality-patient safety offered by SHM. You can attend a number of pre-courses offered at local-regional-national HM meetings; these modules can be completed individually or in a group setting. A list of available group learning sessions can be found at www.abim.org. You can earn CME credit for completing these modules. Not only are the medical knowledge modules readily available, but they are also well written, are easy to complete, and prepare you well for the exam.
The practice performance modules can be completed through ABIM/ABFM or through a number of medical centers that participate in the American Board of Medical Specialties “Portfolio Program.” For organizations that participate in the program, hospitalists within the organizational network who have completed a quality improvement project may qualify for module credit. A list of these sponsoring organizations can be found at http://mocportfolioprogram.org/approved-portfolio-sponsors.
Hospitalists can earn practice improvement module (PIM) credit for being involved in a number of large collaborative projects, including SHM’s mentored implementation programs (e.g. glycemic control, VTE, and Project BOOST).3
For those completing a PIM through the ABIM, the most straightforward are the self-directed PIM or the completed project PIM.2
2. The exam content is known. Table 2 lists the content categories of the secure exam, published by ABIM, with approximate percentages of the content within overall categories and subcategories. This information helps you focus your efforts in preparing for the exam and is aligned with what most hospitalists practice on a daily basis.
3. The exam preparation is easy. Not only is the content outlined in the blueprint in Table 2, but practice exams are available online from the ABIM and a tutorial can be found at www.abim.org/hospital-medicine-tutorial. This tutorial simulates the actual exam, to enhance preparation and reduce testing anxiety.
4. The exam pass rate is high. Table 3 lists pass rates from the 2010-2012 hospital medicine exam. These pass rates are equivalent to the general medicine exam, and they exceed some of the other specialty exam pass rates.
5. RFPHM is gaining more of the recognition it deserves. Given this growth in recognition, from employers, peers, patients, and maybe even payors, it would serve you well to start the process early, because it is highly likely to gain traction in the coming years.
Join Us
All told, RFPHM enrollment, preparation, and exam completion are straightforward, relatively easy, and worth the time and energy. I hope you join me and the 418 other hospitalists who have pursued this recognition. You will be glad you invested in your future.
Dr. Scheurer is a hospitalist and chief quality officer at the Medical University of South Carolina in Charleston. She is physician editor of The Hospitalist. Email her at [email protected].
References
- American Board of Internal Medicine. List of self-evaluation modules. Available at: http://www.abim.org/maintenance-of-certification/medical-knowledge/modules.aspx#hosp. Accessed November 27, 2013.
- American Board of Internal Medicine. List of PIMs from ABIM. Available at: http://www.abim.org/moc/earning-points.aspx. Accessed November 27, 2013.
- American Board of Internal Medicine. List of PIMs from sponsoring institutions. Available at: http://www.abim.org/moc/earning-points/productinfo-demo-ordering.aspx#aqi. Accessed November 27, 2013.
Performance Evaluation Program for Individual Physicians Directional at Best


What makes a great doctor? Heck if I know. Maybe it’s like pornography. A great physician, well, “You know one when you see one.” That approach worked from the time of Hippocrates until the recent past, when the Centers for Medicare & Medicaid Services (CMS), the Joint Commission, and others embarked on programs to measure and report physician quality. Of course, bodies like the American Board of Internal Medicine have been certifying physicians for a long time.
Ongoing Professional Practice Evaluation (OPPE) is one such measurement program, now over four years old, with standards put forth by the Joint Commission in an effort to monitor individual physician—and non-physician provider—performance across a number of domains. The program requires accredited hospitals to monitor and report performance to the physician/provider at least every 11 months, and to use such information in the credentialing process.
This year, I received two OPPE reports, causing me to reflect on how helpful these reports are in judging and improving the quality of my practice. Before I discuss some of the “grades” I received, let me start with my conclusion: Physician quality measurement is in its infancy, and the measures are at best “directional” for most physicians, including hospitalists. Some measurement is better than none at all, however, and selected measures, such as surgical site infection and other measures of harm, may be grounds for closer monitoring, or even corrective action, of a physician’s practice. Unfortunately, my stance that OPPE quality measures are “directional” might not help a physician whose privileges are on the line.
Attribution
For hospitalists, the first concern in measuring and reporting quality is, “How can I attribute quality to an individual hospitalist, when several different hospitalists see the patient?” My perspective is that unless a quality measure can be attributed to an individual hospitalist (e.g. discharge medication reconciliation), it should be attributed at the group level.
However, the OPPE program is specifically intended to address the individual physician/provider for purposes of credentialing, and group attribution is a non-starter. In my performance examples below, I believe that attributing outcomes like mortality, readmissions, or resource utilization to individual hospitalists does not make sense—and is probably unfair.
Resource Utilization
The report lists my performance (Practitioner) compared to an Internal Comparison Group for a specified time period (see Figure 1). The comparison group is described as “practitioners in your specialty...from within your health system.” My data were generated based on only 45 cases (I see patients only part time), while the comparison group was based on 4,530 cases. What I take home from this is that, for cost/resource, I look favorable in “supplies” and “pharmacy”; for most of the others, I’m expensive in comparison.
Will this change my practice? Maybe I will think twice about incurring laboratory or pharmacy costs, but I can’t say I am going to fundamentally rethink how or what I order. And I take all these data with a grain of salt, because I share responsibility for patients with several other hospitalists.
Readmissions
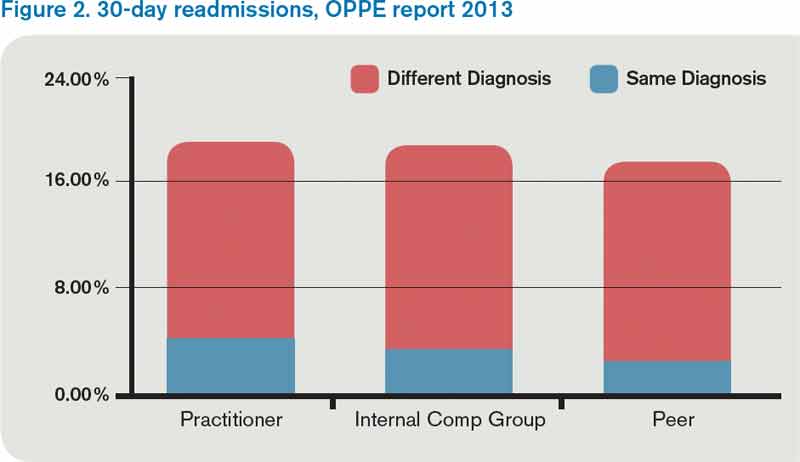
My 30-day readmissions performance (see Figure 2) is weak compared to the Internal Comp Group, which I defined above, and the Peer group, which in my report is defined as derived from practitioners at facilities with 501 beds or more (my facility has 700-plus beds). I accept the “directional” nature of the data, meaning that it provides a general idea but not a precise measurement, and vow to reflect on the processes underlying my approach to hospital discharge (teach back, medication reconciliation, PCP communication, and so on).
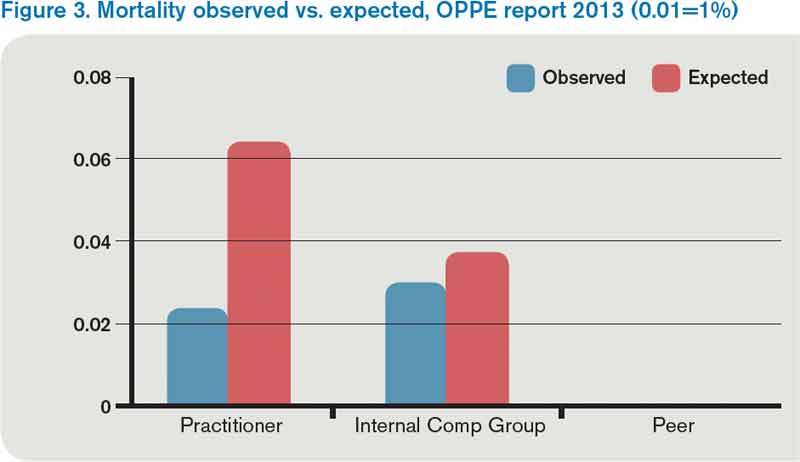
Mortality
For this category (see Figure 3), I’m looking better. The blue bar is “observed,” while the red bar is “expected.” Although my patients are sicker (higher “expected” mortality), my “observed” mortality is lower than the comparison group. I’m not sure why my observed mortality is lower, but I’m convinced that part of the reason for a higher expected mortality is that my documentation is better than the comparison group.
Will OPPE Change My Practice?
There are other data in my report, including process (core) measures, length of stay, hospital-acquired conditions, and patient flow measures. The OPPE report is but one of a growing number of physician report cards: The Massachusetts Board of Medicine, Physician Compare (CMS), and Health Grades are just a few of the organizations that have public websites reporting my performance. Perhaps at this stage, the primary impact of these reports is through the oft-invoked “Hawthorne Effect,” where subjects modify behavior simply because they are being observed, as opposed to any particular piece of feedback.
My sense is that hospitalists are particularly open to the type of feedback offered in OPPE and similar reports, as long as the data are credible, even if reflecting group level performance. The 2012 SHM State of Hospital Medicine survey shows that the percent of hospitalist compensation based on performance (other than production/billings) increased to 7% from 4% in 2011. It seems that performance measurement with consequences, be it for credentialing or compensation, is here to stay.
Dr. Whitcombis Chief Medical Officer of Remedy Partners. He is co-founder and past president of SHM. Email him at [email protected].
What makes a great doctor? Heck if I know. Maybe it’s like pornography. A great physician, well, “You know one when you see one.” That approach worked from the time of Hippocrates until the recent past, when the Centers for Medicare & Medicaid Services (CMS), the Joint Commission, and others embarked on programs to measure and report physician quality. Of course, bodies like the American Board of Internal Medicine have been certifying physicians for a long time.
Ongoing Professional Practice Evaluation (OPPE) is one such measurement program, now over four years old, with standards put forth by the Joint Commission in an effort to monitor individual physician—and non-physician provider—performance across a number of domains. The program requires accredited hospitals to monitor and report performance to the physician/provider at least every 11 months, and to use such information in the credentialing process.
This year, I received two OPPE reports, causing me to reflect on how helpful these reports are in judging and improving the quality of my practice. Before I discuss some of the “grades” I received, let me start with my conclusion: Physician quality measurement is in its infancy, and the measures are at best “directional” for most physicians, including hospitalists. Some measurement is better than none at all, however, and selected measures, such as surgical site infection and other measures of harm, may be grounds for closer monitoring, or even corrective action, of a physician’s practice. Unfortunately, my stance that OPPE quality measures are “directional” might not help a physician whose privileges are on the line.
Attribution
For hospitalists, the first concern in measuring and reporting quality is, “How can I attribute quality to an individual hospitalist, when several different hospitalists see the patient?” My perspective is that unless a quality measure can be attributed to an individual hospitalist (e.g. discharge medication reconciliation), it should be attributed at the group level.
However, the OPPE program is specifically intended to address the individual physician/provider for purposes of credentialing, and group attribution is a non-starter. In my performance examples below, I believe that attributing outcomes like mortality, readmissions, or resource utilization to individual hospitalists does not make sense—and is probably unfair.
Resource Utilization
The report lists my performance (Practitioner) compared to an Internal Comparison Group for a specified time period (see Figure 1). The comparison group is described as “practitioners in your specialty...from within your health system.” My data were generated based on only 45 cases (I see patients only part time), while the comparison group was based on 4,530 cases. What I take home from this is that, for cost/resource, I look favorable in “supplies” and “pharmacy”; for most of the others, I’m expensive in comparison.
Will this change my practice? Maybe I will think twice about incurring laboratory or pharmacy costs, but I can’t say I am going to fundamentally rethink how or what I order. And I take all these data with a grain of salt, because I share responsibility for patients with several other hospitalists.
Readmissions
My 30-day readmissions performance (see Figure 2) is weak compared to the Internal Comp Group, which I defined above, and the Peer group, which in my report is defined as derived from practitioners at facilities with 501 beds or more (my facility has 700-plus beds). I accept the “directional” nature of the data, meaning that it provides a general idea but not a precise measurement, and vow to reflect on the processes underlying my approach to hospital discharge (teach back, medication reconciliation, PCP communication, and so on).
Mortality
For this category (see Figure 3), I’m looking better. The blue bar is “observed,” while the red bar is “expected.” Although my patients are sicker (higher “expected” mortality), my “observed” mortality is lower than the comparison group. I’m not sure why my observed mortality is lower, but I’m convinced that part of the reason for a higher expected mortality is that my documentation is better than the comparison group.
Will OPPE Change My Practice?
There are other data in my report, including process (core) measures, length of stay, hospital-acquired conditions, and patient flow measures. The OPPE report is but one of a growing number of physician report cards: The Massachusetts Board of Medicine, Physician Compare (CMS), and Health Grades are just a few of the organizations that have public websites reporting my performance. Perhaps at this stage, the primary impact of these reports is through the oft-invoked “Hawthorne Effect,” where subjects modify behavior simply because they are being observed, as opposed to any particular piece of feedback.
My sense is that hospitalists are particularly open to the type of feedback offered in OPPE and similar reports, as long as the data are credible, even if reflecting group level performance. The 2012 SHM State of Hospital Medicine survey shows that the percent of hospitalist compensation based on performance (other than production/billings) increased to 7% from 4% in 2011. It seems that performance measurement with consequences, be it for credentialing or compensation, is here to stay.
Dr. Whitcombis Chief Medical Officer of Remedy Partners. He is co-founder and past president of SHM. Email him at [email protected].
2014's Top Healthcare Policy Issues Center on Performance, Quality
Although the bungled rollout of health exchange websites has dominated healthcare-related headlines in the last months of 2013, hospitalist leaders say the policy landscape for 2014 features bigger issues.
To set the table, The Hospitalist reached out to four hospitalists who keep a close eye on the policy sphere. Those interviewed agree that the continued shift from fee-for-service to pay-for-performance will dominate policy discussions. In tow with that are the expected quality improvements the payment model is supposed to beget.
“Pay-for-performance and quality measures will be major issues for hospitalists moving forward,” says SHM Public Policy Committee member Joshua Lenchus, DO, RPh, FACP, SFHM. “But, I am not very optimistic that these processes will lead to their desired outcomes. At the end of the day, personal patient responsibility will need to be accounted for if a real change in healthcare outcomes is to be recognized.”
Other pressing policy issues the panel will pay attention to this year include:
1. Value-Based Purchasing
Further refinement and development of just how physician value-based purchasing will be implemented. More specifically, Josh Boswell, SHM’s senior manager of government relations, is watching to see how that will be incorporated into a possible long-term fix for the sustainable growth rate (SGR) formula.
“As the costs associated with noncompliance increase, hospitals will increasingly look to hospitalists to drive better performance,” says former SHM Public Policy Committee member Eric Siegal, MD, SFHM, director, Aurora Critical Care Service, St Luke’s Medical Center, Milwaukee, and clinical associate professor of medicine, University of Wisconsin School of Medicine and Public Health. “The good news: This is job security for many hospitalists. The bad news: Increasing amounts of human capital will be dedicated to meeting Medicare’s mandates, irrespective of whether this represents the most productive or effective use of those resources.”
2. ACOs
Continued monitoring of accountable-care organizations (ACOs) as the first waves of data emerge on claims and performance. Along with managing health populations, expect consolidation of healthcare systems from nearly 700 to what some experts think could be as few as 50 to 70 mega-providers.
3. Observation Status
The rollout of the new two-midnight rule, which the Centers for Medicare & Medicaid Services (CMS) recently changed to allow physicians to admit a patient if they reasonably expect and document in the medical record that a beneficiary will need to stay in the hospital for more than two midnights. Such admissions will be presumed to be appropriate for Medicare Part A payment. CMS cited concerns about the growing trend of longer observation stays to support this change. Connected with this issue is SHM’s continued backing of the Improving Access to Medicare Coverage Act of 2013 (H.R. 1179, S. 569), which would solve the conundrum of “observation status” time not counting toward the required three consecutive overnights an inpatient needs to qualify for Medicare benefits at a skilled nursing facility.
Forward Moving
SHM Public Policy Committee chair Ron Greeno, MD, FCCP, MHM, says that while insurance reform is one of the three legs of the Affordable Care Act, hospitalists need to be focused just as vigilantly on expanding healthcare access for more patients and reforming the delivery system.
“That’s where we’re supposedly going to get the resources to do these other things,” says Dr. Greeno, chief medical officer for Cogent HMG of Brentwood, Tenn. “Hospitalists are right in the middle of those discussions—and they should be.”
Whether you are for or against the changes produced by the Affordable Care Act, Dr. Siegal says the system “just became a lot less stable.”
“The tacit, quid pro quo had been that lost revenue from Medicare would, at least in part, [be] offset when 30-plus million Americans with newly minted insurance plans became paying healthcare consumers,” Dr. Siegal adds. “With this delicate balance suddenly jeopardized, my guess is that many health systems will circle their wagons until they know which way the wind will blow.”
All told, the healthcare landscape remains one that is pockmarked by generational reform that will require deft hands to navigate. But those who are still fighting reform and its expanded access provision might be missing the larger point.
“You could repeal the Affordable Care Act today, which is not going to happen obviously, but it wouldn’t change the fact that these emerging alternative payment methodologies are still going to occur,” Dr. Siegal says. “It’s beyond Medicare. The private payors are doing it. Physician groups and hospitals and other integrated healthcare organizations are gearing up to take those payments ... because staying in fee-for-service is untenable.”
Richard Quinn is a freelance writer in New Jersey.
Five Reasons Hospitalists Should Participate in Compensation, Productivity Survey

Hospital budgets are tight, so your administrative time has been cut back. You’re pulling extra clinical shifts because of the busy flu season. You’re weeks away from going live on the new electronic health record system. And every spare minute is spent working on improving patient satisfaction scores or reducing readmissions. Investing a few hours in the 2014 State of Hospital Medicine survey is just not on your radar screen.
I realize it may be asking a lot, but I’d like to challenge you to step back and take a longer view. Here are five compelling reasons every hospitalist leader and administrator should participate in this year’s SHM survey and in the MGMA Physician Compensation and Production Survey.
Information You and Your Colleagues Will Use
Hospitalist groups all over the country, probably including yours, use information from SHM and MGMA surveys to benchmark compensation and productivity internally and to assess options related to scope of services, staffing and scheduling, and other structural parameters. If you don’t participate, your group’s data isn’t collected, depriving HM practices everywhere of the benefits of your group’s experience.
Be Prepared to Defend Your Group’s Performance
Other people who have influence over your practice are going to use this information to make judgments about how your group stacks up. It is in your interest to understand how the survey questions are worded and how the data is analyzed and presented. Participation offers firsthand insight into what information is actually being collected and reported, which can help you explain why your group’s results might be different. And the free copy of the survey you receive ensures you will have direct access to the information others are using to evaluate you.
Small Sample Sizes Bias the Results
It’s tempting to sit back and think there are plenty of others participating. But the more groups that participate, the more robust and representative the data will be. And with larger data sets, the data analysts have more options for “cutting” the data and reporting meaningful results for different subsets of the hospitalist universe. Your group’s data just might mean the difference between numbers and blanks in some of those tables.
A Valuable Way to “Give Back” to the Specialty
HM has been good to you. Even if you don’t have the time or opportunity to write, speak, serve on SHM committees, or otherwise move your specialty forward, one important way you can “give back” to the field is to help ensure high quality, representative survey results.
You Might Just Learn Something
Some of the information the survey asks for isn’t at your fingertips. You’re going to have to dig, and probably work with others, to obtain what you need. But in the process, you’re likely to learn something useful about your group’s performance that you didn’t know before, like your CPT code distribution or the amount of financial support you received. And, once you learn it, you’ll want to keep tracking it going forward.
Leslie Flores, MHA, SFHM, is partner in Nelson Flores Hospital Medicine Consultants and an SHM Practice Analysis Committee member.
SHM Helps Hospitals Comply With Two-Midnight Rule for Patient Admissions

As many hospitalists are probably acutely aware, the Centers for Medicare & Medicaid Services (CMS) is putting a new rule into effect that will greatly impact how inpatient admission decisions are made. The rule, known as the “two-midnight rule,” states that if the admitting practitioner admits a Medicare beneficiary as an inpatient with the reasonable expectation that the beneficiary will require care that “crosses two midnights” and this decision is justified in the medical record, Medicare Part A payment is “generally appropriate.”
While there are multiple caveats, exceptions, and details, this rule can be simply articulated: If the admitting physician feels a patient will be in the hospital for a period longer than two midnights and the medical record supports this determination, the patient is an inpatient. Stays expected to be shorter than two midnights should be under observation status.
This new policy is an attempt to respond both to hospital calls for more guidance about when a beneficiary is appropriately treated as an inpatient—and paid by Medicare—and concerns about increasingly long hospital stays under observation status. Most hospitalists wrestle with status determination issues on a daily basis.
SHM is aware of the struggle and has been advocating on behalf of hospitalists to help shape observation status and the two-midnight rule. When the rule was first proposed, SHM voiced serious concerns about its utility and how it was unlikely to solve the overall confusion surrounding inpatient status determinations. Nevertheless, CMS finalized the rule as an attempt to begin addressing the problem.
Faced with an increasingly loud chorus of providers and hospitals concerned about the implementation of the new policy, CMS agreed to delay full enforcement from the original date of Oct. 1, 2013, until March 31, 2014.
During the delayed enforcement period, hospitals will be expected to begin implementing the two-midnight rule, and auditors will be giving hospitals non-punitive feedback on their application of the policy. To accomplish this, CMS is instructing Medicare Administrative Contractors (MACs) to review a sample of 10 to 25 inpatient hospital claims spanning less than two midnights after admission for each hospital. This probe sample will be used to assist hospitals with implementing the new requirements correctly. To give an additional level of comfort during this adjustment period, CMS has announced that it will not conduct post-payment patient status reviews for claims with dates of admission Oct. 1, 2013, through March 31, 2014.
Unfortunately, beyond the vague guidance CMS has offered thus far, there is no foolproof guide to establishing new hospital admissions policies that comply with the rule. As a result, there likely will be wide variation among hospitals.
To assist in sorting out the confusion, SHM will be hosting a webinar this month with case studies from several hospitals. The focus will be on the internal processes each hospital is using to implement the rule and how they were developed. Sharing and learning from national implementation experiences is a valuable way for hospitalists to gain new perspectives and to bring those experiences to their home institutions when considering their own roles in meeting the new admissions criteria head on.
For more information about the webinar and to register, visit www.hospitalmedicine.org today.
Josh Boswell is SHM’s senior manager of government relations.
New Feature Melds SHM’s Online Community with LinkedIn
A new feature installed on HMX, LinkedIn Connect, makes it easier for you to fill out your member profile by pulling pieces of your LinkedIn profile into HMX. How does it work exactly?
Login at www.hmxchange.org and click “My Profile.” Midway down the page, you will see a section that reads, “Grab Profile Info from LinkedIn.” Click the link and follow the onscreen instructions. HMX will connect with your LinkedIn profile, pulling information like your photo, bio, education, and job history information.
It makes filling out your profile just a little bit easier.
HMX Highlights
Hospitalists everywhere have been sharing and asking questions through HMX. Here are some recent examples:
- “Does anyone have any ideas on how to get residents involved in quality improvement?”
- “We currently use nurse practitioners at night, but we always have a physician in-house with the NP. We see the NP as a great asset to our team, and this ole has positively impacted our physicians' level of satisfaction.”
- “I've just posted several related files, including our IV insulin protocols … as well as some data and an article related to AutoCal, which is a computerized way to administer the protocol that also collects data.”
Three Steps to Register for Focused Practice in Hospital Medicine
Here are three simple steps to register for the FPHM MOC, according to the ABIM.
- Click “Physician Login” at www.abim.org and enter your ABIM ID and your password. The default password is your six-digit date of birth (MMDDYY).
- Under “My Maintenance of Certification Program,” click on “Enter Focused Practice in Hospital Medicine MOC Program.”
- There you will begin the entry process, which requires you to complete a Web-based self-attestation, as well as the submission of the Senior Hospital Officer attestation to your eligibility. The attestations must be submitted and approved prior to entry into the program.
You can track your status in this process via the “View Status of Entry into Focused Practice in Hospital Medicine MOC Program” on your home page.