User login
How to Handle Medicare Documentation Audits

The recent announcement of a settlement by a physician firm should cause the HM community to pause and take inventory. The settlement “addressed allegations that, between 2004 and 2012, [the firm] knowingly submitted to federal health benefits programs inflated claims on behalf of its hospitalist employees for higher and more expensive levels of service than were documented by hospitalists in patient medical records.”1
This civil settlement highlights the vigilance being exercised against healthcare fraud and demonstrates the coordinated efforts in place to tackle the issue. To put the weight of this case in perspective, consider the breadth of legal entities involved: the U.S. Department of Justice; the U.S. Attorney’s Office; the U.S. Department of Health and Human Services; the U.S. Department of Defense; the U.S. Office of Personnel Management; the U.S. Department of Veterans’ Affairs; and the TRICARE Management Activity Office of General Counsel.1
The underlying factor in the settlement is a common issue routinely identified by Medicare-initiated review programs such as CERT (Comprehensive Error Rate Testing). CERT selects a stratified, random sample of approximately 40,000 claims submitted to Part A/B Medicare Administrative Contractors (MACs) and Durable Medical Equipment MACs (DME MACs) during each reporting period and allows the Centers for Medicare and Medicaid Services (CMS) to calculate a national improper payment rate and contractor- and service-specific improper payment rates.2 The CERT-determined improper payment rate identifies services that have not satisfied Medicare requirements, but it cannot label a claim fraudulent.2
Incorrect coding errors involving hospitalists are related to inpatient evaluation and management (E/M) services that do not adequately reflect the documentation in the medical record. For example, WPS Medicare identified the following error rates for claims submitted 7/1/11 to 6/30/12: 45% of 99223 (initial hospital care, per day, for the evaluation and management of a patient, which requires these three key components: a comprehensive history, a comprehensive exam, and medical decision-making of high complexity); and 34% of 99233 (subsequent hospital care, per day, for the evaluation and management of a patient, which requires at least two of these three key components: a detailed interval history, a detailed examination, and medical decision-making of high complexity).3,4 More recent WPS Medicare data in first quarter of FY2013 reveals a continuing problem but an improved error rate.5 Novitas Solutions offers additional support of these findings.6
Based on efforts that identify improper payments, MACs are encouraged to initiate targeted service-specific prepayment review to prevent improper payments for services identified by CERT or recovery audit contractors (RACs) as problem areas, as well as problem areas identified by their own data analysis.7 For this reason, hospitalists may see prepayment requests for documentation by Medicare for services that are most “problematic” (e.g., 99223 and 99233). This occurs when a claim involving these services is submitted to Medicare. The MAC suspends all or part of a claim so that a trained clinician or claims analyst can review the claim and associated documentation in order to make determinations about coverage and payment.7 Responding to these requests in a timely manner is crucial in preventing claim denials.
Responding to Requests
When documentation is requested by the payor, take note of the date and the provider for whom the service is requested. Be certain to include all pertinent information in support of the claim. The payor request letter will typically include a generic list of items that should be submitted with the documentation request. Consider these particular items when submitting documentation for targeted services typically provided by hospitalists:
- Initial Hospital Care (99223)
- Physician notes (including resident, nurse practitioner, or physician assistant notes);
- Identify any referenced sources of information (e.g., physician referencing a family history documented in the ED record);
- Dictations, when performed;
- Admitting orders; and
- Labs or diagnostic test reports performed on admission.
- Subsequent Hospital Care (99233)
- Physician notes (including resident, nurse practitioner, or physician assistant notes);
- Identify multiple encounters/entries recorded on a given date;
- Physician orders; and
- Labs or diagnostic test reports performed on the requested date.
Documentation Tips
Because it is the primary communication tool for providers involved in the patient’s care, documentation must be entered in a timely manner and must be decipherable to members of the healthcare team as well as other individuals who may need to review the information (e.g., auditors). Proper credit cannot be given for documentation that is difficult to read.
Information should include historical review of past/interim events, a physical exam, medical decision-making as related to the patient’s progress/response to intervention, and modification of the care plan (as necessary). The reason for the encounter should be evident to support the medical necessity of the service. Because various specialists may participate in patient care, documentation for each provider’s encounter should demonstrate personalized and non-duplicative care.
Each individual provider must exhibit a personal contribution to the case to prevent payors from viewing the documentation as overlapping and indistinguishable from care already provided by another physician. Each entry should be dated and signed with a legible identifier (i.e., signature with a printed name).
The next several articles will address each of the key components (history, exam, and decision-making) and serve as a “documentation refresher” for providers who wish to compare their documentation to current standards.
References
- Department of Justice, Office of Public Affairs. Tacoma, Wash., Medical Firm to Pay $14.5 Million to Settle Overbilling Allegations. Available at: www.justice.gov/opa/pr/2013/July/13-civ-758.html. Accessed September 20, 2013.
- Centers for Medicare and Medicaid Services. Comprehensive Error Rate Testing (CERT). Available at: www.cms.gov/Research-Statistics-Data-and-Systems/Monitoring-Programs/CERT/index.html?redirect=/cert. Accessed September 20, 2013.
- WPS Medicare, Legacy Part B. Are you billing these evaluation and management (e/m) services correctly? Available at: http://www.wpsmedicare.com/j5macpartb/departments/cert/2011-0912-billemservices.shtml. Accessed September 20, 2013.
- Abraham M, Ahlman J, Boudreau A, Connelly J, Levreau-Davis, L. Current Procedural Terminology 2013 Professional Edition. Chicago: American Medical Association Press; 2012:15-17.
- WPS Medicare, Legacy Part B. 1st Qtr. 2013 (Jan. - Mar.) - CERT Error Summary. Available at: http://www.wpsmedicare.com/j5macpartb/departments/cert/2013-1st-quarter-summary.shtml. Accessed September 20, 2013.
- Novitas Solutions. Analysis of JL Part B Comprehensive Error Rate Testing (CERT) Data - January thru March 2013. Available at: https://www.novitas-solutions.com/cert/errors/2013/b-jan-mar-j12.html. Accessed September 20, 2013.
- Centers for Medicare and Medicaid Services. Medicare Program Integrity Manual, Chapter 3, Section 3.2. Available at: www.cms.gov/Regulations-and-Guidance/Guidance/Manuals/downloads/pim83c03.pdf. Accessed September 20, 2013.
- Centers for Medicare and Medicaid Services. Medicare Claims Processing Manual, Chapter 11, Section 40.1.2 Available at: www.cms.gov/Regulations-and-Guidance/Guidance/Manuals/Downloads/clm104c11.pdf. Accessed September 20, 2013.
Shorter Door-to-Balloon Time for Heart Attack Patients
67
Number in minutes of publicly reported “door-to-balloon” times for heart attack patients who underwent primary percutaneous coronary interventions in U.S. hospitals in 2009, according to a new study in the New England Journal of Medicine.1 Average time in 2005 was 83 minutes. Current guidelines recommend door-to-balloon of 90 minutes or less.
The 30-day mortality rates for studied patients, however, were unchanged over the same time period, suggesting that additional strategies are needed to reduce in-hospital mortality in this population.
Reference
Hospitalist-Led, Post-Discharge Clinic Improves Care Transitions
Two Research, Hospital Innovations, and Clinical Vignettes (RIV) scientific posters presented at HM13 shed new light on the opportunities and challenges of hospitalist-run post-discharge clinics, which a growing number of hospitals have adopted in an attempt to smooth care transitions and prevent rehospitalizations.
The Denver VA Medical Center (VAMC) started its post-discharge clinic, located on a floor above its medicine wards, in 2003. Open two afternoons, the clinic sees up to 16 patients a week. Discharging housestaff are paged to meet their patients in the clinic as part of required afternoon activities, explains the poster’s lead author, Robert Burke, MD, a hospitalist at the VAMC and assistant professor of medicine at affiliated University of Colorado. Every patient is seen by a rotating, supervising hospitalist attending.
The clinic is able to see patients for their first post-discharge clinical encounter within five days on average, much sooner than either urgent care clinics (9.4 days) or primary care physicians (13.7 days).
However, data presented at HM13 found no reduction in readmissions for the VA clinic’s patients.1 Dr. Burke suggests that this finding reflects the challenges of connecting patients to their PCPs after the clinic visit. “Also, it’s not a full, multidisciplinary clinic—just housestaff and attendings,” he says. “The patients we see in the clinic are very ill.”
A second poster from the same team presented data from a national survey of hospitalists’ attitudes regarding post-discharge clinics.2 Three-quarters of 228 respondents believed that these clinics would reduce ED visits, but only 38% said that hospitalists should be seeing patients after discharge, and about 75% said doing so should require additional compensation for the physician.
“In my experience, I find it very valuable to see patients post-discharge as part of the larger continuum of care,” Dr. Burke says.
Larry Beresford is a freelance writer in San Francisco.
References
Safety WalkRounds at Children's Hospital Improve Teamwork

A recent study in The Joint Commission Journal on Quality and Patient Safety describes unit-based Patient Safety Leadership WalkRounds conducted on six pilot units at the Children’s Hospital of Philadelphia (CHOP) and how they have helped clinical leaders identify and address safety concerns.1 The WalkRound team, made up of at least one senior executive, a patient safety officer, and the manager of each unit, engages frontline staff in safety assessments and concerns.
The concept was developed by Allan Frankel, MD, director of patient safety at Partners Healthcare System in Boston, to increase awareness of safety issues by all clinicians, make safety a high priority for senior leadership, and act on the safety information collected from frontline staff.
At CHOP, the WalkRounds led to improved nurse-physician relationships, workflow, and medical safety, and uncovered previously unidentified safety concerns.
Reference
San Francisco Medical Center Adapts Choosing Wisely List for Waste Reduction Campaign


A University of California at San Francisco (UCSF) quality initiative targeting waste and overuse of healthcare resources plans to focus on four of five questionable treatments identified by the Society of Hospital Medicine for the ABIM Foundation’s Choosing Wisely campaign. The UCSF Division of Hospital Medicine’s High Value Care Committee grew out of efforts to operationalize a curriculum for teaching medical trainees about the actual costs of treatments they commonly order. UCSF hospitalist Christopher Moriates, MD, developed the curriculum when he was a resident.
The committee brings together physicians, who have historically focused on quality improvement, and finance administrators, who focus on cost reduction. Together they are pursuing performance improvement projects serving both goals, Dr. Moriates says. The committee identified six waste targets initially and has already reduced the use of ionized calcium blood tests, formerly administered to numerous patients at UCSF Medical Center whether they needed it or not, and the unnecessary use of nebulizers, by more than half.
“When the Choosing Wisely list came out, it fit with what we were doing, although I wasn’t sure that these things were problems for us,” Dr. Moriates explains.
The data, however, show that UCSF was significantly better than its peers for only one of the five treatments on the list: utilization of Foley catheters and corresponding rates of catheter-related urinary tract infections. The committee is focused on more judicious, evidence-based ordering of the other Choosing Wisely treatments: medications for stress ulcer prophylaxis, blood transfusions, continuous telemetry monitoring outside of the ICU, and certain lab tests.
Dr. Moriates recommends the Choosing Wisely list for other hospitals and hospitalists starting to tackle unnecessary medical treatments and tests. Data is essential to these efforts, he says, stressing the need to consider not just utilization rates but actual dollars spent.
“That shouldn’t be a major hurdle, given hospital information technology, but often it is,” he says, adding that waste initiatives are more successful when they are led by frontline champions, rather than just assigned by the department’s chair.
Read more about Dr. Moriates’ waste control efforts in HealthLeaders Media, and learn about another waste reduction strategy called the Teaching Value Project at www.teachingvalue.org.1
Reference
PIAA Director of Research and Loss Prevention Discusses Hospitalist Insurance Premiums
Click here to listen to more of our interview with Divya Parikh
Click here to listen to more of our interview with Divya Parikh
Click here to listen to more of our interview with Divya Parikh
How Should Patients with Acute Hip Fractures Be Managed Perioperatively?

Case
A 91-year-old man with Alzheimer’s dementia presents with severe right hip pain after a fall at his nursing home. His family reports that he is dependent in most of his activities of daily living (ADLs) and can normally ambulate short distances with a walker. He is alert and oriented at baseline but has been more confused since his wife died a week earlier from pneumonia. His only new medication is lorazepam as needed for anxiety. On admission, the patient is diagnosed with a displaced femoral neck fracture, delirium, and healthcare-associated pneumonia, with a new oxygen requirement of 5 L/min. The orthopedic surgery service requests a medicine consult. How should this patient be managed perioperatively?
Overview
Hip fractures are a major health burden on the United States’ geriatric population. The lifetime risk of hip fracture is approximately 17% for Caucasian women and 6% for Caucasian men.1 In 2010, an estimated 258,000 people aged 65 years and older were hospitalized with hip fractures.2 This number is expected to climb to 289,000 by 2030.
In total, hip fractures directly cost the healthcare system about $18 billion per year.1
Hip fractures, like most other geriatric syndromes, are almost invariably multifactorial in etiology. They occur at the intersection of general frailty, bone fragility, and fall risk. Hip fractures too often trigger a further downward spiral in elderly patients, as deconditioning and acute complications compound chronic comorbidities and compromise any remaining physiologic reserve. Mortality after a hip fracture approaches 25% at one year.3 An excess mortality risk persists for at least 10 years.4 Of the patients who survive six months, only 50% can perform their ADLs, and only 25% can perform their instrumental ADLs as well as they could prior to their fracture.5,6
Unsurprisingly, older adults with hip fractures are five times more likely to require nursing home placement at one year.5
Hospitalists frequently encounter patients with hip fractures in the perioperative setting. Given their close collaboration with orthopedic surgeons and emphasis on transitions of care, hospitalists can play an important role in reversing the trajectory of death and disability following hip fractures. Key aspects of inpatient management are outlined below.
Hip Fracture Repair
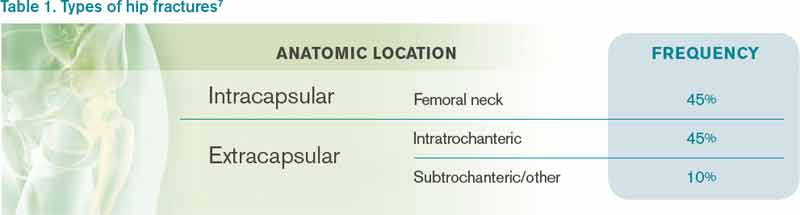
Hip fractures can be divided into intracapsular (femoral neck) or extracapsular (intratrochanteric or subtrochanteric) fractures. Their relative frequencies are listed in Table 1.7
Surgery types. Femoral neck fractures typically are the most difficult to heal, given a limited regional blood supply.5,7 Displaced femoral neck fractures require either a hemiarthroplasty or total hip arthroplasty. Over time, hemiarthroplasties tend to cause hip pain from acetabular erosion, so they are better suited for less active, elderly patients. Nondisplaced femoral neck, intratrochanteric, and subtrochanteric fractures are usually managed with open reduction and internal fixation.
The overall goal of surgery is to return patients to their prior level of functioning. In the short term, surgery also provides pain relief and allows for early mobilization. Nonoperative management is generally reserved for patients with very high operative risk or limited life expectancies or those who are bedridden at baseline.
Timing of surgery. In general, hip fracture repair should be performed within 24-48 hours of admission in patients who are medically stable. Though early surgery may not improve functional outcomes or mortality, it has been associated with improved pain control, decreased length of stay, and fewer major complications.8 Patients with active medical conditions (e.g. pneumonia) should be medically optimized before proceeding with surgery. A 2011 study found that most of the excess in-hospital mortality associated with surgical delays beyond five days was attributable to the active medical issues rather than to the delay itself.9
Prevention of Perioperative Complications
The principles of geriatric medicine should be applied to the care of elderly patients with hip fractures. Emphasis should be placed on early recognition of treatable conditions and avoidance of iatrogenesis. Careful assessment of medical problems, social support, and functional status within an interdisciplinary framework is recommended. Such a multi-faceted approach has been shown to reduce overall complications in hip fracture patients.10 Specific complications are discussed in more detail below.
Delirium. Delirium is the most common complication after hip fracture surgery, with a prevalence of 35%-65%.7 Proper pain control, minimization of polypharmacy, removal of tethers, and frequent reorientation are among the many preventive measures that should be implemented.
Venous thromboembolism (VTE). VTE is a leading cause of morbidity and mortality for hip fracture patients.11 Without prophylaxis, about 1.8% will develop symptomatic deep venous thromboses, and 1% will develop symptomatic pulmonary emboli in the first seven to 14 days after surgery. An estimated 4.3% will develop symptomatic VTE in the first 35 days after surgery.
The American College of Chest Physicians recommends that patients undergoing hip fracture surgery receive VTE prophylaxis for a minimum of 10-14 days postoperatively.11 Extending prophylaxis out to 35 days is reasonable. Low molecular-weight heparin is preferred over low-dose unfractionated heparin, fondaparinux, warfarin, and aspirin. Patients should receive preoperative VTE prophylaxis if surgery is delayed.
Postoperative infections. Urinary tract infections (UTIs) are the most common infectious complication after hip fracture surgery.7 If not caught early, they can result in urosepsis, prosthetic joint infections, and death. After the first 48 hours of urinary catheterization, the risk of a UTI is 5%-10% per day.12
Therefore, catheters should be removed within 24-48 hours of surgery.
Acute blood loss anemia. Anemia is common in hip fracture patients. It may be present on admission or develop as a result of intraoperative blood loss, ongoing drain output, or fluid resuscitation.
The recent FOCUS trial, which helped to clarify the optimal transfusion threshold for patients after hip fracture surgery, compared a liberal versus restrictive transfusion strategy in patients with cardiovascular disease.13 Transfusing for a hemoglobin < 10 g/dL, as opposed to transfusing for symptoms or a hemoglobin < 8 g/dL, did not improve mortality, in-hospital morbidity (including myocardial infarction), or functional status at 60 days.
Pressure ulcers. Patients with hip fractures are at risk of developing decubitus ulcers. One study found the incidence of new pressure ulcers to be 16% at seven days and 36% at 32 days after initial hospitalization.14 Multicomponent interventions have been shown to successfully reduce the rate of hospital-acquired pressure ulcers.15
Medical Management of Osteoporosis
The World Heath Organization defines osteoporosis as a bone mineral density of at least 2.5 standard deviations below that of a “normal” young adult as measured on DEXA scan, or a T-score ≤ -2.5.16 However, it is important to recognize that bone strength depends not only on the quantity of bone but also on the quality. Any patient who sustains a hip fracture with minimal trauma (e.g. a fall from standing height) should be considered to have osteoporosis, regardless of T-score.
Patients with their first hip fracture are 2.5 times more likely to have a future fragility fracture.17 Hospitalists must therefore make secondary prevention a priority. Medical management focuses on maintaining bone strength, slowing further bone loss, and preventing future falls.
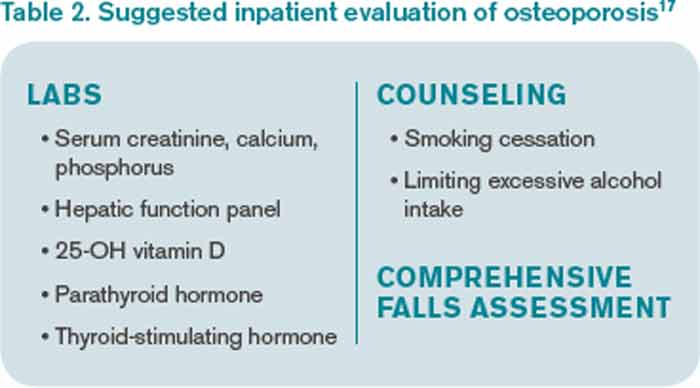
Evaluation. A directed history and physical examination should be completed to screen for secondary causes of osteoporosis. A basic laboratory workup is reasonable in the inpatient setting (see Table 2).17 Other tests, such as a serum and urine protein electrophoresis, can be obtained as clinically indicated.
Patients require counseling directed at lifestyle factors, including the importance of weight-bearing exercise, smoking cessation, and avoidance of excessive alcohol intake. A comprehensive falls assessment is also warranted.
Treatment. All patients with hip fractures should be discharged from the hospital on calcium and vitamin D supplementation, unless there is a specific contraindication.18 Guidelines vary by organization, but the National Osteoporosis Foundation’s recommendations are listed in Table 3.17,19,20 Dietary calcium is usually insufficient to meet the daily requirement.
Bisphosphonates are considered first-line therapy for osteoporosis.17 The HORIZON trial was a randomized, placebo-controlled study that evaluated annual zoledronic acid infusions in hip fracture patients who were intolerant of oral bisphosphonates.21 Zoledronic acid reduced the rate of new fractures by 35% after 1.9 years, with a number needed to treat (NNT) of 19. It also improved survival by 28%, for an NNT of 27. All subjects also received calcium and vitamin D supplementation.
Both hospitalists and orthopedists might worry about bisphosphonates adversely affecting bone healing in the acute setting. Subsequent analyses from the HORIZON trial suggest that bisphosphonates can be safely started as soon as two weeks after surgery.22,23
Transitions of care. Despite well-established guidelines for the treatment of osteoporosis, patients with hip fractures often are undertreated. A retrospective study of 420 acute hip fracture patients found that only 37% received calcium, 36% received vitamin D, and 31% received a bisphosphonate on discharge.24 A prospective study of 1,075 women with new osteoporotic fractures found that only 17% had started anti-osteoporosis medications at one year.25
Hospitalists should recognize and address potential barriers to appropriate medical therapy. Patient-related obstacles may include the cost of medications, concerns about side effects, and lack of a PCP.24,25 Hospitalists should document the diagnosis of osteoporosis in the medical record so subsequent providers are attuned to the issue.26 They should also clarify the ownership of osteoporosis across the continuum of care, because medicine consultants, orthopedists, primary care or rehabilitation physicians, and subspecialists may all be involved. Hospitalists can certainly take advantage of this window of opportunity by starting patients on osteoporosis treatment and ensuring smooth transitions of care on discharge.

Back to the Case
The patient was started on intravenous antibiotics for healthcare-associated pneumonia with improvement of his oxygen requirement to 3 L/min. He underwent a right hemiarthroplasty on hospital day five and tolerated the procedure well. His delirium resolved with treatment of his infection, pain control, discontinuation of lorazepam, and other conservative measures. He was given VTE prophylaxis pre- and postoperatively. His urinary catheter was discontinued on day one after surgery. He was started on calcium supplementation and vitamin D repletion after his 25-OH vitamin D level returned low at 14 ng/mL.
The patient progressed well with physical and occupational therapy and was discharged back to his skilled nursing facility, with plans to start a bisphosphonate in two weeks.
Bottom Line
Hospitalists should be familiar with the best practices for the perioperative management of hip fracture patients.
Dr. Anderson and Dr. Wolfe are hospitalists at the University of Colorado Hospital in Aurora. Dr. Anderson directs the medicine consult service, and Dr. Wolfe serves as the associate director.
References
- The Joint Commission. Improving and measuring osteoporosis treatment 2008. Oakbrook Terrace, Il; 2008. Available at: http://www.jointcommission.org/improving_and_measuring_osteoporosis_management/. Accessed September 29, 2013.
- Stevens JA, Rudd RA. The impact of decreasing U.S. hip fracture rates on future hip fracture estimates. Osteoporos Int. 2013;24(10):2725-2728.
- Braithwaite RS, Col NF, Wong JB. Estimating hip fracture morbidity, mortality, and costs. J Am Geriatr Soc. 2003;51(3):364-370. Haentjens P, Magaziner J, Colón-Emeric CS, et al.
- Meta-analysis: excess mortality after hip fracture among older women and men. Ann Intern Med. 2010;152(6):380-390.
- Hung WW, Egol KA, Zuckerman JD, Siu AL. Hip fracture management: tailoring care for the older patient. JAMA. 2012;307(20):2185-2194.
- Magaziner J, Simonsick EM, Kashner TM, Hebel JR, Kenzora JE. Predictors of functional recovery one year following hospital discharge for hip fracture: a prospective study. J Gerontol. 1990;45(3):M101-107.
- Bateman L, Vuppala S, Porada P, et al. Medical management in the acute hip fracture patient: a comprehensive review for the internist. Ochsner J. 2012;12(2):101-110.
- Orosz GM, Magaziner J, Hannan EL, et al. Association of timing of surgery for hip fracture and patient outcomes. JAMA. 2004;291(14):1738-1743.
- Vidán MT, Sánchez E, Gracia Y, Marañón E, Vaquero J, Serra JA. Causes and effects of surgical delay in patients with hip fracture: a cohort study. Ann Intern Med. 2011;155(4):226-233.
- Vidán M, Serra JA, Moreno C, Riquelme G, Ortiz J. Efficacy of a comprehensive geriatric intervention in older patients hospitalized for hip fracture: a randomized, controlled trial. J Am Geriatr Soc. 2005;53(9):1476-1482.
- Falck-Ytter Y, Francis CW, Johanson NA, et al. Prevention of VTE in orthopedic surgery patients: Antithrombotic Therapy and Prevention of Thrombosis, 9th ed: American College of Chest Physicians Evidence-Based Clinical Practice Guidelines. Chest. 2012;141(2 Suppl):e278S-e325S.
- Wald H, Epstein A, Kramer A. Extended use of indwelling urinary catheters in postoperative hip fracture patients. Med Care. 2005;43(10):1009-1017.
- Carson JL, Terrin ML, Noveck H, et al. Liberal or restrictive transfusion in high-risk patients after hip surgery. N Engl J Med. 2011;365(26):2453-2462.
- Baumgarten M, Margolis DJ, Orwig DL, et al. Pressure ulcers in elderly patients with hip fracture across the continuum of care. J Am Geriatr Soc. 2009;57(5):863-870.
- Sullivan N, Schoelles KM. Preventing in-facility pressure ulcers as a patient safety strategy: a systematic review. Ann Intern Med. 2013;158(5 Pt 2):410-416.
- World Health Organization. Prevention and management of osteoporosis: Report of a WHO scientific group 2000. Geneva, Switzerland; 2000. WHO technical report series; 921. Available at: http://whqlibdoc.who.int/trs/who_trs_921.pdf. Accessed July 9, 2013.
- National Osteoporosis Foundation. Clinician’s guide to prevention and treatment of osteoporosis 2013. Washington, D.C.; 2013. Available at: www.nof.org/files/nof/public/content/file/917/upload/481.pdf. Accessed September 29, 2013.
- Tang BM, Eslick GD, Nowson C, Smith C, Bensoussan A. Use of calcium or calcium in combination with vitamin D supplementation to prevent fractures and bone loss in people aged 50 years and older: a meta-analysis. Lancet. 2007;370(9588):657-666.
- Holick MF, Binkley NC, Bischoff-Ferrari HA, et al. Evaluation, treatment, and prevention of vitamin D deficiency: an Endocrine Society clinical practice guideline. J Clin Endocrinol Metab. 2011;96(7):1911-1930.
- Ross AC, Taylor CL, Yaktine AL, Del Valle HB, eds. Dietary reference intakes for calcium and vitamin D. Washington, D.C.: National Academies Press; 2011. Lyles KW, Colón-Emeric CS, Magaziner JS, et al.
- Zoledronic acid in reducing clinical fracture and mortality after hip fracture. N Engl J Med. 2007;357: nihpa40967.
- Colón-Emeric CS, Nordsletten L, Olson S, et al. Association between timing of zoledronic acid infusion and hip fracture healing. Osteoporos Int. 2011;22(8):2329-2336.
- Eriksen EF, Lyles KW, Colón-Emeric CS, et al. Antifracture efficacy and reduction of mortality in relation to timing of the first dose of zoledronic acid after hip fracture. J Bone Miner Res. 2009;24(7):1308-1313.
- Byszewski A, Lemay G, Molnar F, Azad N, McMartin SE. Closing the osteoporosis care gap in hip fracture patients: an opportunity to decrease recurrent fractures and hospital admissions. J Osteoporos. 2011;2011:404969.
- Greenspan SL, Wyman, A, Hoovan FH, et al. Predictors of treatment with osteoporosis medications after recent fragility fractures in a multinational cohort of postmenopausal women. J Am Geriatr Soc. 2012;60(3):455-461.
- Kamel HK, Hussain MS, Tariq S, Perry HM, Morley JE. Failure to diagnose and treat osteoporosis in elderly patients hospitalized with hip fracture. Am J Med. 2000;109(4):326-328.
Case
A 91-year-old man with Alzheimer’s dementia presents with severe right hip pain after a fall at his nursing home. His family reports that he is dependent in most of his activities of daily living (ADLs) and can normally ambulate short distances with a walker. He is alert and oriented at baseline but has been more confused since his wife died a week earlier from pneumonia. His only new medication is lorazepam as needed for anxiety. On admission, the patient is diagnosed with a displaced femoral neck fracture, delirium, and healthcare-associated pneumonia, with a new oxygen requirement of 5 L/min. The orthopedic surgery service requests a medicine consult. How should this patient be managed perioperatively?
Overview
Hip fractures are a major health burden on the United States’ geriatric population. The lifetime risk of hip fracture is approximately 17% for Caucasian women and 6% for Caucasian men.1 In 2010, an estimated 258,000 people aged 65 years and older were hospitalized with hip fractures.2 This number is expected to climb to 289,000 by 2030.
In total, hip fractures directly cost the healthcare system about $18 billion per year.1
Hip fractures, like most other geriatric syndromes, are almost invariably multifactorial in etiology. They occur at the intersection of general frailty, bone fragility, and fall risk. Hip fractures too often trigger a further downward spiral in elderly patients, as deconditioning and acute complications compound chronic comorbidities and compromise any remaining physiologic reserve. Mortality after a hip fracture approaches 25% at one year.3 An excess mortality risk persists for at least 10 years.4 Of the patients who survive six months, only 50% can perform their ADLs, and only 25% can perform their instrumental ADLs as well as they could prior to their fracture.5,6
Unsurprisingly, older adults with hip fractures are five times more likely to require nursing home placement at one year.5
Hospitalists frequently encounter patients with hip fractures in the perioperative setting. Given their close collaboration with orthopedic surgeons and emphasis on transitions of care, hospitalists can play an important role in reversing the trajectory of death and disability following hip fractures. Key aspects of inpatient management are outlined below.
Hip Fracture Repair
Hip fractures can be divided into intracapsular (femoral neck) or extracapsular (intratrochanteric or subtrochanteric) fractures. Their relative frequencies are listed in Table 1.7
Surgery types. Femoral neck fractures typically are the most difficult to heal, given a limited regional blood supply.5,7 Displaced femoral neck fractures require either a hemiarthroplasty or total hip arthroplasty. Over time, hemiarthroplasties tend to cause hip pain from acetabular erosion, so they are better suited for less active, elderly patients. Nondisplaced femoral neck, intratrochanteric, and subtrochanteric fractures are usually managed with open reduction and internal fixation.
The overall goal of surgery is to return patients to their prior level of functioning. In the short term, surgery also provides pain relief and allows for early mobilization. Nonoperative management is generally reserved for patients with very high operative risk or limited life expectancies or those who are bedridden at baseline.
Timing of surgery. In general, hip fracture repair should be performed within 24-48 hours of admission in patients who are medically stable. Though early surgery may not improve functional outcomes or mortality, it has been associated with improved pain control, decreased length of stay, and fewer major complications.8 Patients with active medical conditions (e.g. pneumonia) should be medically optimized before proceeding with surgery. A 2011 study found that most of the excess in-hospital mortality associated with surgical delays beyond five days was attributable to the active medical issues rather than to the delay itself.9
Prevention of Perioperative Complications
The principles of geriatric medicine should be applied to the care of elderly patients with hip fractures. Emphasis should be placed on early recognition of treatable conditions and avoidance of iatrogenesis. Careful assessment of medical problems, social support, and functional status within an interdisciplinary framework is recommended. Such a multi-faceted approach has been shown to reduce overall complications in hip fracture patients.10 Specific complications are discussed in more detail below.
Delirium. Delirium is the most common complication after hip fracture surgery, with a prevalence of 35%-65%.7 Proper pain control, minimization of polypharmacy, removal of tethers, and frequent reorientation are among the many preventive measures that should be implemented.
Venous thromboembolism (VTE). VTE is a leading cause of morbidity and mortality for hip fracture patients.11 Without prophylaxis, about 1.8% will develop symptomatic deep venous thromboses, and 1% will develop symptomatic pulmonary emboli in the first seven to 14 days after surgery. An estimated 4.3% will develop symptomatic VTE in the first 35 days after surgery.
The American College of Chest Physicians recommends that patients undergoing hip fracture surgery receive VTE prophylaxis for a minimum of 10-14 days postoperatively.11 Extending prophylaxis out to 35 days is reasonable. Low molecular-weight heparin is preferred over low-dose unfractionated heparin, fondaparinux, warfarin, and aspirin. Patients should receive preoperative VTE prophylaxis if surgery is delayed.
Postoperative infections. Urinary tract infections (UTIs) are the most common infectious complication after hip fracture surgery.7 If not caught early, they can result in urosepsis, prosthetic joint infections, and death. After the first 48 hours of urinary catheterization, the risk of a UTI is 5%-10% per day.12
Therefore, catheters should be removed within 24-48 hours of surgery.
Acute blood loss anemia. Anemia is common in hip fracture patients. It may be present on admission or develop as a result of intraoperative blood loss, ongoing drain output, or fluid resuscitation.
The recent FOCUS trial, which helped to clarify the optimal transfusion threshold for patients after hip fracture surgery, compared a liberal versus restrictive transfusion strategy in patients with cardiovascular disease.13 Transfusing for a hemoglobin < 10 g/dL, as opposed to transfusing for symptoms or a hemoglobin < 8 g/dL, did not improve mortality, in-hospital morbidity (including myocardial infarction), or functional status at 60 days.
Pressure ulcers. Patients with hip fractures are at risk of developing decubitus ulcers. One study found the incidence of new pressure ulcers to be 16% at seven days and 36% at 32 days after initial hospitalization.14 Multicomponent interventions have been shown to successfully reduce the rate of hospital-acquired pressure ulcers.15
Medical Management of Osteoporosis
The World Heath Organization defines osteoporosis as a bone mineral density of at least 2.5 standard deviations below that of a “normal” young adult as measured on DEXA scan, or a T-score ≤ -2.5.16 However, it is important to recognize that bone strength depends not only on the quantity of bone but also on the quality. Any patient who sustains a hip fracture with minimal trauma (e.g. a fall from standing height) should be considered to have osteoporosis, regardless of T-score.
Patients with their first hip fracture are 2.5 times more likely to have a future fragility fracture.17 Hospitalists must therefore make secondary prevention a priority. Medical management focuses on maintaining bone strength, slowing further bone loss, and preventing future falls.
Evaluation. A directed history and physical examination should be completed to screen for secondary causes of osteoporosis. A basic laboratory workup is reasonable in the inpatient setting (see Table 2).17 Other tests, such as a serum and urine protein electrophoresis, can be obtained as clinically indicated.
Patients require counseling directed at lifestyle factors, including the importance of weight-bearing exercise, smoking cessation, and avoidance of excessive alcohol intake. A comprehensive falls assessment is also warranted.
Treatment. All patients with hip fractures should be discharged from the hospital on calcium and vitamin D supplementation, unless there is a specific contraindication.18 Guidelines vary by organization, but the National Osteoporosis Foundation’s recommendations are listed in Table 3.17,19,20 Dietary calcium is usually insufficient to meet the daily requirement.
Bisphosphonates are considered first-line therapy for osteoporosis.17 The HORIZON trial was a randomized, placebo-controlled study that evaluated annual zoledronic acid infusions in hip fracture patients who were intolerant of oral bisphosphonates.21 Zoledronic acid reduced the rate of new fractures by 35% after 1.9 years, with a number needed to treat (NNT) of 19. It also improved survival by 28%, for an NNT of 27. All subjects also received calcium and vitamin D supplementation.
Both hospitalists and orthopedists might worry about bisphosphonates adversely affecting bone healing in the acute setting. Subsequent analyses from the HORIZON trial suggest that bisphosphonates can be safely started as soon as two weeks after surgery.22,23
Transitions of care. Despite well-established guidelines for the treatment of osteoporosis, patients with hip fractures often are undertreated. A retrospective study of 420 acute hip fracture patients found that only 37% received calcium, 36% received vitamin D, and 31% received a bisphosphonate on discharge.24 A prospective study of 1,075 women with new osteoporotic fractures found that only 17% had started anti-osteoporosis medications at one year.25
Hospitalists should recognize and address potential barriers to appropriate medical therapy. Patient-related obstacles may include the cost of medications, concerns about side effects, and lack of a PCP.24,25 Hospitalists should document the diagnosis of osteoporosis in the medical record so subsequent providers are attuned to the issue.26 They should also clarify the ownership of osteoporosis across the continuum of care, because medicine consultants, orthopedists, primary care or rehabilitation physicians, and subspecialists may all be involved. Hospitalists can certainly take advantage of this window of opportunity by starting patients on osteoporosis treatment and ensuring smooth transitions of care on discharge.
Back to the Case
The patient was started on intravenous antibiotics for healthcare-associated pneumonia with improvement of his oxygen requirement to 3 L/min. He underwent a right hemiarthroplasty on hospital day five and tolerated the procedure well. His delirium resolved with treatment of his infection, pain control, discontinuation of lorazepam, and other conservative measures. He was given VTE prophylaxis pre- and postoperatively. His urinary catheter was discontinued on day one after surgery. He was started on calcium supplementation and vitamin D repletion after his 25-OH vitamin D level returned low at 14 ng/mL.
The patient progressed well with physical and occupational therapy and was discharged back to his skilled nursing facility, with plans to start a bisphosphonate in two weeks.
Bottom Line
Hospitalists should be familiar with the best practices for the perioperative management of hip fracture patients.
Dr. Anderson and Dr. Wolfe are hospitalists at the University of Colorado Hospital in Aurora. Dr. Anderson directs the medicine consult service, and Dr. Wolfe serves as the associate director.
References
- The Joint Commission. Improving and measuring osteoporosis treatment 2008. Oakbrook Terrace, Il; 2008. Available at: http://www.jointcommission.org/improving_and_measuring_osteoporosis_management/. Accessed September 29, 2013.
- Stevens JA, Rudd RA. The impact of decreasing U.S. hip fracture rates on future hip fracture estimates. Osteoporos Int. 2013;24(10):2725-2728.
- Braithwaite RS, Col NF, Wong JB. Estimating hip fracture morbidity, mortality, and costs. J Am Geriatr Soc. 2003;51(3):364-370. Haentjens P, Magaziner J, Colón-Emeric CS, et al.
- Meta-analysis: excess mortality after hip fracture among older women and men. Ann Intern Med. 2010;152(6):380-390.
- Hung WW, Egol KA, Zuckerman JD, Siu AL. Hip fracture management: tailoring care for the older patient. JAMA. 2012;307(20):2185-2194.
- Magaziner J, Simonsick EM, Kashner TM, Hebel JR, Kenzora JE. Predictors of functional recovery one year following hospital discharge for hip fracture: a prospective study. J Gerontol. 1990;45(3):M101-107.
- Bateman L, Vuppala S, Porada P, et al. Medical management in the acute hip fracture patient: a comprehensive review for the internist. Ochsner J. 2012;12(2):101-110.
- Orosz GM, Magaziner J, Hannan EL, et al. Association of timing of surgery for hip fracture and patient outcomes. JAMA. 2004;291(14):1738-1743.
- Vidán MT, Sánchez E, Gracia Y, Marañón E, Vaquero J, Serra JA. Causes and effects of surgical delay in patients with hip fracture: a cohort study. Ann Intern Med. 2011;155(4):226-233.
- Vidán M, Serra JA, Moreno C, Riquelme G, Ortiz J. Efficacy of a comprehensive geriatric intervention in older patients hospitalized for hip fracture: a randomized, controlled trial. J Am Geriatr Soc. 2005;53(9):1476-1482.
- Falck-Ytter Y, Francis CW, Johanson NA, et al. Prevention of VTE in orthopedic surgery patients: Antithrombotic Therapy and Prevention of Thrombosis, 9th ed: American College of Chest Physicians Evidence-Based Clinical Practice Guidelines. Chest. 2012;141(2 Suppl):e278S-e325S.
- Wald H, Epstein A, Kramer A. Extended use of indwelling urinary catheters in postoperative hip fracture patients. Med Care. 2005;43(10):1009-1017.
- Carson JL, Terrin ML, Noveck H, et al. Liberal or restrictive transfusion in high-risk patients after hip surgery. N Engl J Med. 2011;365(26):2453-2462.
- Baumgarten M, Margolis DJ, Orwig DL, et al. Pressure ulcers in elderly patients with hip fracture across the continuum of care. J Am Geriatr Soc. 2009;57(5):863-870.
- Sullivan N, Schoelles KM. Preventing in-facility pressure ulcers as a patient safety strategy: a systematic review. Ann Intern Med. 2013;158(5 Pt 2):410-416.
- World Health Organization. Prevention and management of osteoporosis: Report of a WHO scientific group 2000. Geneva, Switzerland; 2000. WHO technical report series; 921. Available at: http://whqlibdoc.who.int/trs/who_trs_921.pdf. Accessed July 9, 2013.
- National Osteoporosis Foundation. Clinician’s guide to prevention and treatment of osteoporosis 2013. Washington, D.C.; 2013. Available at: www.nof.org/files/nof/public/content/file/917/upload/481.pdf. Accessed September 29, 2013.
- Tang BM, Eslick GD, Nowson C, Smith C, Bensoussan A. Use of calcium or calcium in combination with vitamin D supplementation to prevent fractures and bone loss in people aged 50 years and older: a meta-analysis. Lancet. 2007;370(9588):657-666.
- Holick MF, Binkley NC, Bischoff-Ferrari HA, et al. Evaluation, treatment, and prevention of vitamin D deficiency: an Endocrine Society clinical practice guideline. J Clin Endocrinol Metab. 2011;96(7):1911-1930.
- Ross AC, Taylor CL, Yaktine AL, Del Valle HB, eds. Dietary reference intakes for calcium and vitamin D. Washington, D.C.: National Academies Press; 2011. Lyles KW, Colón-Emeric CS, Magaziner JS, et al.
- Zoledronic acid in reducing clinical fracture and mortality after hip fracture. N Engl J Med. 2007;357: nihpa40967.
- Colón-Emeric CS, Nordsletten L, Olson S, et al. Association between timing of zoledronic acid infusion and hip fracture healing. Osteoporos Int. 2011;22(8):2329-2336.
- Eriksen EF, Lyles KW, Colón-Emeric CS, et al. Antifracture efficacy and reduction of mortality in relation to timing of the first dose of zoledronic acid after hip fracture. J Bone Miner Res. 2009;24(7):1308-1313.
- Byszewski A, Lemay G, Molnar F, Azad N, McMartin SE. Closing the osteoporosis care gap in hip fracture patients: an opportunity to decrease recurrent fractures and hospital admissions. J Osteoporos. 2011;2011:404969.
- Greenspan SL, Wyman, A, Hoovan FH, et al. Predictors of treatment with osteoporosis medications after recent fragility fractures in a multinational cohort of postmenopausal women. J Am Geriatr Soc. 2012;60(3):455-461.
- Kamel HK, Hussain MS, Tariq S, Perry HM, Morley JE. Failure to diagnose and treat osteoporosis in elderly patients hospitalized with hip fracture. Am J Med. 2000;109(4):326-328.
Blood Culture for Uncomplicated SSTI Not Helpful with Bacteriologic Diagnosis

Clinical question: What is the yield of blood cultures performed on pediatric patients admitted for uncomplicated and complicated skin and soft tissue infections (SSTIs and cSSTIs)?
Background: SSTIs are a common cause of pediatric ED visits and hospitalizations. Current Infectious Diseases Society of America (IDSA) guidelines include obtaining a blood culture for patients who show signs of systemic toxicity. Blood cultures are performed frequently in all pediatric patients hospitalized for SSTI and cSSTI. Little recent data exists about the rate of bacteremia in pediatric SSTI since the widespread emergence of community-acquired methicillin-resistant Staphylococcus aureus (CA-MRSA) and adoption of routine vaccination for Haemophilus influenzae type B (HiB) and varicella.
Study design: Single-center, retrospective case series.
Setting: University-affiliated pediatric hospital at a tertiary medical center.
Synopsis: Researchers used the hospital’s electronic medical record system to search for patients between the ages of 0 and 18 years hospitalized for SSTI/cSSTI. Initial screening of the data utilized ICD-9-CM codes for cellulitis and abscess (682.X), with subsequent review by investigators to exclude miscoded cases, immunocompromised patients, hospital-acquired infection, and incidentally noted SSTI during admissions for other problems. SSTIs were classified as being complicated in the cases of surgical or traumatic wound infection, need for surgical intervention, and infected ulcers or burns. Routine incision and drainage did not constitute surgical intervention.
Of the 580 patients remaining, 482 were classified as having SSTI, of which 455 underwent testing with blood cultures. None of the blood cultures led to pathogenic bacterial growth after 120 hours of incubation; three grew S. epidermidis. Of the 98 patients classified as having cSSTI, 80 underwent blood culture testing, of which 10 (12.5%) were positive.
Pathogens identified in positive blood cultures included MRSA (6), methicillin-sensitive S. aureus (3), and S. pneumococcus (1). Length of stay was significantly longer for patients with SSTI who underwent blood culture testing (3.24 days) compared to those who did not (2.33 days).
Bottom line: Obtaining blood cultures in a child hospitalized with uncomplicated SSTI is highly unlikely to be helpful in obtaining a bacteriologic diagnosis. Even worse, it will likely increase the length of stay for these patients.
Citation: Malone JR, Durica SR, Thompson DM, Bogie A, Naifeh M. Blood cultures in the evaluation of uncomplicated skin and soft tissue infections. Pediatrics. 2013;132:454-459.
Reviewed by Pediatric Editor Weijen Chang, MD, SFHM, FAAP, associate clinical professor of medicine and pediatrics at the University of California at San Diego School of Medicine, and a hospitalist at both UCSD Medical Center and Rady Children’s Hospital.
Hospitalists' Role in PQRS, Pay for Performance Gets Boost
With the voluntary and incentive period for participating in the Physician Quality Reporting System (PQRS) quickly coming to a close, hospitalists are finding a limited number of PQRS measures broadly applicable to their practice. SHM, through its Performance Measurement and Reporting Committee (PMRC), is actively working on behalf of hospitalists to change that. At the same time, it is critical that hospitalists be proactive and participate in PQRS, not just to avoid the 2015 penalty, but to position themselves for success as the Value-Based Payment Modifier (VBPM) expands to all physicians by 2017.
In the current PQRS, the PMRC has identified the following measures that have appropriate inpatient codes for reporting and have potential relevance to hospitalists:
- Congestive Heart Failure (CHF): #5, ACE/ARB for LV systolic dysfunction; #8, beta-blocker prescribed for LV systolic dysfunction; #228, assessment of LV function.
- Stroke: #31, DVT prophylaxis; #32, discharge on antiplatelet therapy; #33, anticoagulation for atrial fibrillation; #35, dysphagia screening; #36, consideration of rehab; #187, thrombolytic therapy.
- Others: #47, advance care plan documented; #76, use of a central venous catheter insertion protocol.
Some of these measures are only reportable by registry. For groups who do not take care of stroke patients, the field is clearly limited. More detail on PQRS reporting and available codes can be found at the Centers for Medicare and Medicaid Services (CMS) website (www.cms.gov/Medicare/Quality-Initiatives-Patient-Assessment-Instruments/PQRS/MeasuresCodes.html).
The committee is deeply concerned about the limited number of PQRS measures broadly applicable to hospitalists, and we are working to change this disparity. Over the past several months, the PMRC has successfully advocated to add inpatient codes to existing measures that will expand the field for hospitalists. So far, we have achieved the following changes for future PQRS reporting years:
- Community-acquired pneumonia (CAP): Measures #56 (vital signs) and #59 (empiric antibiotics) will have admission codes 99221, 99222, and 99223 added to the denominator.
- Osteoporosis/fractures: Measure #24 (communication with the outpatient provider) and #40 (DXA scan ordered or therapy initiated) will have discharge codes 99238 and 99239 added to their denominator, in recognition of the fact that many hospitalists partner with their orthopedic colleagues in the care of patients post-hip fracture.
- Medication reconciliation: Measure #130 (documentation of current medication list) will have admission codes 99221, 99222, and 99223 added to the denominator.
- Anticoagulation for acute pulmonary embolism: Measure #252, intended for use by ED physicians, is being retired by CMS due to a loss of National Quality Forum endorsement. SHM is working with the American College of Emergency Physicians (ACEP) to appeal the decision, possibly maintain the measure, and add inpatient admission codes to the denominator. This remains a work in progress.
Finally, in response to SHM advocacy efforts, the recent FY2014 Physician Fee Schedule proposed rule sought comments from stakeholders about retooling certain hospital-based measures to allow for physician-level reporting. SHM supports the concept of allowing physician-level performance reporting on hospital metrics and recommended the inclusion of multiple measures from the Inpatient Quality Reporting Program.
The PMRC is charged with monitoring the rapidly evolving provider performance and measurement landscape to ensure that hospitalists are adequately represented. We will continue to work diligently with key stakeholders on behalf of our field.
Dr. Seymann is chief of the division of hospital medicine at the University of California San Diego and chair of SHM’s Performance Measurement and Reporting Committee. Josh Boswell is SHM’s senior manager of government relations.
SHM Report Provides New Insights About Physician Practice Leaders
The Society of Hospital Medicine’s 2012 State of Hospital Medicine report (SOHM) offers new insights about physician practice leaders.
Physician Leader Presence
“Choose a hospitalist leader with the right skills and experience. Selecting the right leader is fundamental to a successful hospitalist practice. These individuals are hard to find. They must be excellent clinically and have superb communication skills.”1
The SOHM survey shows that the vast majority (97%) of hospital medicine groups (HMGs) in the U.S. now have a designated physician leader (see Figure 1). Given this high percentage, examining the outliers is intriguing. Of the 13 adult medicine HMGs that reported not having a physician leader, the large majority were hospital-owned, located in the South region, and situated in non-teaching hospitals. The size of the HMG impacted the presence of a physician leader: 100% of groups with 20 or more full-time equivalents had physician leaders.
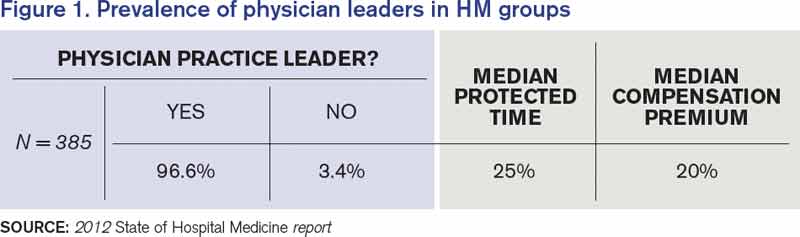
Source: 2012 State of Hospital Medicine report
Dedicated Leadership Time
“The medical director of the hospitalist program needs sufficient, non-clinical time to address administrative and leadership issues.”1
The 2007/2008 SOHM survey reported a median of 20% administrative time for physician leaders. In the 2012 survey, the median amount of time was 25% for adult medicine HMGs. The percentages were higher in the East and West regions, in hospital-owned programs, and in non- academic programs. The percentage of protected time also went up with group size.

Compensation
The 2012 SOHM shows median compensation premiums for physician leaders of 20%; that is, leader compensation is 120% of the average salary in their group. The numbers across regions and sizes were remarkably consistent. Overall, it seems that a 15% to 20% compensation premium for hospitalist leaders is standard.
Key Takeaways
No. 1, hospitalist groups need physician hospitalist leaders with protected leadership, but who also work clinically as a hospitalist. Why? Because hospitalists need a leader they respect, someone that they believe understands their specific issues. Unless the physician in charge has worked those 12-hour overnight shifts, argued with the consultants, tried to discharge an ornery patient, received 20 pages in an hour about medication reconciliation, or disagreed with an ED doc about the appropriateness of an admission, it would be hard for that leader to fully understand the stresses hospitalists encounter on a daily basis.
Hospitalist leaders are taking on increasingly important roles to help their organizations realize key performance improvement goals.
Additionally, the roles of outpatient doctors are changing: “Many physicians are no longer able or willing to serve on hospital committees or play a leadership role for the medical staff. Hospitalists have the potential to step in and help address these key issues”1
No. 2, size matters. Given increased responsibilities that include handling focused and ongoing professional practice evaluations, designing pathways to reduce adverse events, counseling, mentoring, disciplining, conducting yearly reviews, and investigating patient and staff complaints, it makes sense that larger programs also have leaders with more protected time and commensurate compensation.
As our healthcare systems ask hospitalists to offer higher reliability and to champion more administrative, safety, and quality projects, HM leaders—who are perfectly placed to organize and manage those projects—need the time and the compensation to do so. To borrow from hospitalist pioneer Bob Wachter, MD, MHM, our future C-suite leaders are percolating in hospitalist programs, learning the skills we will need to participate in the high reliability hospitals of our present and future.
Dr. Lovins is chief of hospital medicine at Middlesex Hospital in Middletown, Conn., and assistant clinical professor of medicine at Yale University School of Medicine. She is a member of SHM’s Practice Analysis Committee.
Reference
The Society of Hospital Medicine’s 2012 State of Hospital Medicine report (SOHM) offers new insights about physician practice leaders.
Physician Leader Presence
“Choose a hospitalist leader with the right skills and experience. Selecting the right leader is fundamental to a successful hospitalist practice. These individuals are hard to find. They must be excellent clinically and have superb communication skills.”1
The SOHM survey shows that the vast majority (97%) of hospital medicine groups (HMGs) in the U.S. now have a designated physician leader (see Figure 1). Given this high percentage, examining the outliers is intriguing. Of the 13 adult medicine HMGs that reported not having a physician leader, the large majority were hospital-owned, located in the South region, and situated in non-teaching hospitals. The size of the HMG impacted the presence of a physician leader: 100% of groups with 20 or more full-time equivalents had physician leaders.
Source: 2012 State of Hospital Medicine report
Dedicated Leadership Time
“The medical director of the hospitalist program needs sufficient, non-clinical time to address administrative and leadership issues.”1
The 2007/2008 SOHM survey reported a median of 20% administrative time for physician leaders. In the 2012 survey, the median amount of time was 25% for adult medicine HMGs. The percentages were higher in the East and West regions, in hospital-owned programs, and in non- academic programs. The percentage of protected time also went up with group size.
Compensation
The 2012 SOHM shows median compensation premiums for physician leaders of 20%; that is, leader compensation is 120% of the average salary in their group. The numbers across regions and sizes were remarkably consistent. Overall, it seems that a 15% to 20% compensation premium for hospitalist leaders is standard.
Key Takeaways
No. 1, hospitalist groups need physician hospitalist leaders with protected leadership, but who also work clinically as a hospitalist. Why? Because hospitalists need a leader they respect, someone that they believe understands their specific issues. Unless the physician in charge has worked those 12-hour overnight shifts, argued with the consultants, tried to discharge an ornery patient, received 20 pages in an hour about medication reconciliation, or disagreed with an ED doc about the appropriateness of an admission, it would be hard for that leader to fully understand the stresses hospitalists encounter on a daily basis.
Hospitalist leaders are taking on increasingly important roles to help their organizations realize key performance improvement goals.
Additionally, the roles of outpatient doctors are changing: “Many physicians are no longer able or willing to serve on hospital committees or play a leadership role for the medical staff. Hospitalists have the potential to step in and help address these key issues”1
No. 2, size matters. Given increased responsibilities that include handling focused and ongoing professional practice evaluations, designing pathways to reduce adverse events, counseling, mentoring, disciplining, conducting yearly reviews, and investigating patient and staff complaints, it makes sense that larger programs also have leaders with more protected time and commensurate compensation.
As our healthcare systems ask hospitalists to offer higher reliability and to champion more administrative, safety, and quality projects, HM leaders—who are perfectly placed to organize and manage those projects—need the time and the compensation to do so. To borrow from hospitalist pioneer Bob Wachter, MD, MHM, our future C-suite leaders are percolating in hospitalist programs, learning the skills we will need to participate in the high reliability hospitals of our present and future.
Dr. Lovins is chief of hospital medicine at Middlesex Hospital in Middletown, Conn., and assistant clinical professor of medicine at Yale University School of Medicine. She is a member of SHM’s Practice Analysis Committee.