User login
Report on England’s Health System Mirrors Need for Improvement in U.S.

Don Berwick, MD, former president and CEO of the Institute for Healthcare Improvement (IHI) and former administrator for the Centers for Medicare and Medicaid Services (CMS), recently consulted with the National Health Service (NHS) on how to devise and implement a safer and better healthcare system for England. His services were solicited due to a number of high-profile scandals involving neglect in hospitals. His team’s work resulted in a report entitled “A Promise to Learn – A Commitment to Act: Improving the Safety of Patients in England.”1 The purpose of the consultative visit and resulting series of recommendations was to identify and recommend solutions to ailments and limitations in the current NHS.
Many of the “current state” ailments outlined in Dr. Berwick’s report would not sound terribly novel or unfamiliar to most U.S. healthcare systems. The report listed problems with:
- Systems-procedures-conditions-environments-constraints that lead people to make bad or incorrect decisions;
- Incorrect priorities;
- Not heeding warning signals about patient safety;
- Diffusion of responsibility;
- Lack of support for continuous improvement; and
- Fear, which is “toxic to both safety and improvement.”
Dr. Berwick and his team made a number of recommendations to reshape priorities and resources, enhance the safety of the system, and rebuild the confidence of its customers (e.g., patients and caregivers).
The consultant group’s core message was simple and inspiring:
“The NHS in England can become the safest healthcare system in the world. It will require unified will, optimism, investment, and change. Everyone can and should help. And, it will require a culture firmly rooted in continual improvement. Rules, standards, regulations, and enforcement have a place in the pursuit of quality, but they pale in potential compared to the power of pervasive and constant learning.”
To achieve improvement, Dr. Berwick’s team recommended 10 guiding principles. Similar to The 10 Commandments, they offer a way of thinking, acting, and living—to make the healthcare industry a better place. These healthcare 10 commandments include the following:
- “The NHS should continually and forever reduce patient harm by embracing wholeheartedly an ethic of learning.” While we should all aspire to zero harm, the reality is that getting there will be a long and difficult goal, more than likely a goal of continual reduction. Defining harm is also more difficult than looking just at what meets the eye; because the qualitative “you know it when you see it” will likely never be embraced widely, we are left with quantitative and imperfect measures, such as hospital-acquired conditions (HACs) and patient safety indicators (PSIs). Despite the imperfection of current measures, the goal for continual reduction is laudable and necessary.
- “All leaders concerned with NHS healthcare—political, regulatory, governance, executive, clinical, and advocacy—should place quality of care in general, and patient safety in particular, at the top of their priorities for investment, inquiry, improvement, regular reporting, encouragement, and support.” As with anything, leadership sets the vision, mission, and values of an organization or system. Leadership will have to commit to placing patient safety at the top of the priority list, without sacrificing other priorities.
- “Patients and their caregivers should be present, powerful, and involved at all levels of healthcare organizations, from the wards to the boards of trusts.” This directive is certainly ideal, but, realistically, it will take a while to develop a level of comfort from both the patients and the providers, because both are much more used to operating in parallel, with intermittent intersections. Involving patients in all organizational decision-making, and including the boards of trustees, will be prerequisite to true patient-caregiver-centered care.
- “Government, Health Education England, and NHS England should assure that sufficient staff are available to meet the NHS’ needs now and in the future. Healthcare organizations should ensure staff are present in appropriate numbers to provide safe care at all times and are well-supported." All healthcare organizations should be on a relentless pursuit to match workload and intensity to staffing, pursue work standardization and efficiency, and match work to human intellect. These are the founding tenets of Lean and Six Sigma and should be pursued for all disciplines, both clinical and non-clinical.
- “Mastery of quality and patient-safety sciences and practices should be part of initial preparation and lifelong education of all healthcare professionals, including managers and executives.” The U.S. has made great strides in incorporating at least a basic curriculum of quality and safety for most healthcare professionals, but we need to move the current level of understanding to the next level. We need to ensure that all healthcare professionals have at least a basic understanding of the fundamental principles.
- “The NHS should become a learning organization. Its leaders should create and support the capability for learning, and therefore change, at scale within the NHS.” Healthcare organizations should not just be willing to learn from individual and system opportunities; they should be eager to learn. Quality and safety missions should uniformly extend into educational and research missions in all organizations, to enhance learning opportunities and create best practice.
- “Transparency should be complete, timely, and unequivocal. All data on quality and safety, whether assembled by government, organizations, or professional societies, should be shared in a timely fashion with all parties who want it, including, in accessible form, with the public.” Many healthcare organizations equate transparency with marketing, where they tout their fanciest technology or latest innovation. And many also subscribe to the theory “if you’re gonna go bare, you better be buff” and only widely disseminate those metrics that make them appear superior. We all need to be more transparent across the board, because going “bare” can actually stimulate improvements more quickly and reliably than they would otherwise occur. Organizational metrics really should not belong to the organization; they should belong to the patients who created the metrics. As such, full transparency of organizational performance (on all the domains of quality) should be an organizational and patient expectation.
- “All organizations should seek out the patient and caregiver voice as an essential asset in monitoring the safety and quality of care.” Organizations should seek out patient-caregiver feedback and should be eager to learn from their words. Most other industries regularly and routinely seek out customer feedback to improve upon their products and services; some even pay customers for a chance to hear what they have to say. Too often, the theme from disgruntled patients is that no one is listening to them.
- “Supervisory and regulatory systems should be simple and clear. They should avoid diffusion of responsibility. They should be respectful of the goodwill and sound intention of the vast majority of staff. All incentives should point in the same direction.”
- U.S. regulatory agencies have an incredible amount of simplification to accomplish, along with a need to align incentives for the betterment of the patient. “We support responsive regulation of organizations, with a hierarchy of responses. Recourse to criminal sanctions should be extremely rare, and should function primarily as a deterrent to willful or reckless neglect or mistreatment.”
This commandment acknowledges the rarity of willful misconduct, by organizations and providers, and calls for a simplification of the governance needed for such rare events and situations.
In Sum As with The 10 Commandments, these guiding principles can help transform the way we in the healthcare industry think, act, and live—and put us on the road to making it a better place.
Reference
Dr. Scheurer is a hospitalist and chief quality officer at the Medical University of South Carolina in Charleston. She is physician editor of The Hospitalist. Email her at [email protected].
Adding Clopidogrel to Aspirin Prevents Recurrent CVA in a Defined Population
Clinical question: Does loading clopidogrel with aspirin reduce recurrent stroke after moderate to high-risk transient ischemic attack (TIA) or minor stroke if started within 24 hours of primary event?
Background: Recurrent stroke risk is highest during the first few weeks after TIA or minor stroke.
Study design: Randomized, double-blinded, placebo-controlled trial.
Setting: Multi-center health system in China.
Synopsis: More than 5100 patients were randomized within 24 hours after minor ischemic stroke (NIHSS<=3) or high-risk TIA (ABCD2>= 4) to loading dose clopidogrel 300 mg, then 75 mg po daily x 90 days in addition to aspirin 75 mg daily for the first 21 days or aspirin 75 mg po daily x 90 days + placebo. Within 90 days, recurrent stroke was higher in aspirin + placebo group compared to aspirin + clopidogrel (11.7% event rate compared with 8.2%). Moderate to severe bleeding risk was the same (0.3%) in both groups.
Strict eligibility criteria in this study might limit generalizability to the general public. This study occurred in China, where the recurrent stroke rate was higher (near 10%) than the rate seen in primary stroke centers in more developed countries (3% to 5%), perhaps because of less emphasis on secondary risk prevention (including hypertension and hyperlipidemia) in China.
Also, the distribution of stroke subtype in China (more intracranial atherosclerosis than in other populations) might have affected the study outcomes. Because of these limitations, more research needs to be done to confirm these findings for other populations.
Bottom line: Adding clopidogrel to aspirin reduced recurrent cerebrovascular event after high-risk TIA or minor ischemic stroke in China, but generalizability to other patient populations is not clear.
Citation: Wang Y, Wang Y, Zhao X, et al. Clopidogrel with aspirin in acute minor stroke or transient ischemic attack. New Engl J Med. 2013;369:11-19.
CDC Expert Discusses MRSA Infections and Monitoring for Anti-Microbial Resistance
Click here to listen to more of our interview with Dr. Patel
Click here to listen to more of our interview with Dr. Patel
Click here to listen to more of our interview with Dr. Patel
Hospitalists Have Opportunity to Transform Healthcare

“I’m going to the sun,” my TWO-and-a-half-year-old daughter confidently declared. She said it so casually, as if she was letting me know that she was going to the playground.
Thinking I could use this as a great parenting opportunity and push my toddler to think through her decisions, I replied in a concerned tone: “Sweetie, the sun is really, really hot. What are you going to do about that?”
She replied effortlessly, as if the solution had always been right there in front of me, and somehow I had failed to see it, “I’m going to wear a really, really big hat!”
Later that night, I was reflecting on the little exchange with my daughter. Why had I been so determined to point out to her that it was impossible to travel to the sun? After all, two is the age to dream and imagine. As we grow up, why do we stop believing that we can do anything, absolutely anything, we imagine?
Since I started working as a hospitalist in 2007, the state of healthcare has been in constant turmoil and distress. Everyone, from providers to policymakers to patients, has been critical about the current state of our healthcare system. Many are concerned with the future, too. In fact, headlines regularly describe healthcare as “deficient,” “error-prone,” “deadly,” “bankrupt,” or “wasteful.”
This is not the vision of the medical profession that I had when I was an idealistic medical student. I was filled with aspirations of curing the sick, alleviating suffering, and helping to make the world a better place.
Don’t get me wrong...I get it. Hospitals, hospitalists, and all forms of care providers have a long way to go before we provide the highest quality of care at a cost our nation and our patients can afford. But in the critical evaluation of the current state of healthcare, where is the positive beacon of hope?
When did we, providers of care, stop believing that we could do anything, absolutely anything, to improve the state of healthcare?
Over the past decade, numerous innovations have been introduced to address the deficiencies in our system. However, efforts to come together as a medical profession and address these issues systematically have been lacking. And new initiatives, such as the ABIM Foundation’s Choosing Wisely campaign, are still in the early stages of widespread acceptance and adoption.
We have come a long way from the witchcraft of early healers and the barber-surgeons of medieval times. Modern medicine comes from a tradition of discovering the germ theory, eradicating polio, sequencing the entire genome, and performing simultaneous multiple organ transplantation. Providers are more than healers of the individual patient; they are healers of populations. By advancing health, they have enabled societies to thrive, grow, discover, and innovate. We shoulder significant responsibility, and our impact has shaped the course of human history.
Despite the stated challenges in healthcare, I’d like to think this is our finest hour, our time to shine. We have a rare and unique opportunity to completely reinvent the system and redefine the practice of medicine—to transform it from how it is practiced to how it should be delivered: high quality, high value, patient-centered, yet population-focused. This goes beyond ensuring that every patient with acute myocardial infarction receives an aspirin or working to prevent surgical site infections. This opportunity affords us the possibility to deliver extraordinary care.
Can hospitalists bridge this gap and change the world? Absolutely!
Inherent in our work is continuous improvement, not solely the improvement of our specialty, but also of the services we help co-manage, the hospital-wide committees we sit on, and the C-suite conversations we partake in. And, unlike most of healthcare, we manage to do this, not in isolation, but in multidisciplinary teams of physicians, nurses, staff, and, most importantly, patients and families.
If we unleash the potential of our specialty, the possibilities are endless. Here are some examples from our own hospitalists and society:
- Imagine the future of care with mentored implementation.
SHM’s award-winning mentored implementation model has helped transform care in more than 300 hospitals through best practices in venous thromboembolism, readmissions, and care of diabetic patients.
- Lead with the academy.
The future of healthcare will belong to clinicians who can lead teams and make the case for real change. That’s one of the reasons that SHM’s Leadership Academy has been so successful: It is creating a cadre of more than 2,000 hospitalists who are armed with the confidence and know-how to envision the hospital of the future and manage hospital-based teams toward that vision.
- Collaborate with HMX.
If you’ve ever been to SHM’s annual meeting, you know that hospitalists are a collaborative bunch. In fact, it’s that tendency toward collaboration and problem solving that has led more than 2,300 hospitalists to participate in SHM’s new online community, Hospital Medicine Exchange (www.hmxchange.org). It’s unlike any other platform for hospital-based clinicians, and the conversations on HMX are helping hospitalists everywhere benefit from the experience of colleagues nationally.
- Learn through the portal.
Hospitalists can’t shape the future of healthcare without staying up to date, but the days of getting continuing medical education (CME) credit exclusively from conferences is over. SHM is helping hospitalists with its brand new eLearning Portal (www.shmlearningportal.org), which can be accessed on PCs, tablets, or mobile devices.
Expectation High
So, be bold! The sky is the limit. Continue to learn, collaborate, and lead. Most of all, never stop believing that you can create the future you imagine. After all, it was Albert Einstein who cleverly said, “Imagination is more important than knowledge.”
As for my daughter and I, well, I guess I’m going to start investing in really big hats.
Dr. Afsar is associate chief medical officer at UCLA Hospitals in Los Angeles. She is also assistant clinical professor and executive director of quality and safety in the Department of Medicine and Neurosurgery at UCLA Hospitals. She is an SHM board member. Contact her at [email protected].
Pros and Cons of Clinical Observation Units

Hospitals nationwide face significant capacity constraints in emergency departments. High hospitalization rates can have a ripple effect, leading to long wait times, frequent diversion of patients to other hospitals, and higher patient-care expenses. However, a sizable number of inpatient admissions can be prevented through dedicated clinical observation units, or COUs. Such a strategy is likely to be more efficient, can result in shorter lengths of stay, and can decrease health-care costs.1
Also known as clinical decision units, “obs” units, or short-stay observation units, these hospital-based units lend themselves as a feasible solution. Many of the COU success stories come from “chest pain” units, along with ED-based observation units. Over time, the COUs have been expanded to include many more conditions and have enjoyed success when dealing with asthma exacerbations, transient ischemic attacks, bronchiolitis in pediatric populations, and congestive-heart-failure exacerbation, to name a few.
Most COUs use a window of six to 24 hours to carry out triaging, diagnosing, treating, and monitoring the patient response. Anytime before the 24-hour mark, a decision is made whether to discharge or admit the patient. The success of dedicated COUs relies heavily on strong leadership, strict treatment protocols, and well-defined inclusion/exclusion criteria.
COU utilization has been well received by several professional bodies. Both emergency medicine physicians and hospitalists are natural key players in the widespread utilization of COUs. SHM, in a white paper, concluded: “Collaboration between hospitalists, emergency physicians, hospital administrators, and academicians will serve not only to promote outstanding observation care, but also to focus quality improvement and research efforts for the observation unit of the 21st century.”2 The American College of Emergency Physicians (ACEP), in its position statement, said the “observation of appropriate ED patients in a dedicated ED observation area, instead of a general inpatient bed or an acute care ED bed, is a ‘best practice’ that requires a commitment of staff and hospital resources.”3
As promising as the COUs appear, it is estimated that only one-third of hospitals have them in place.4 And while much of the COU story is good, there are concerns with the patient-care model.
The Good
Instinctively, a COU is a win-win proposition for all stakeholders. Essentially, many see these units as a fine blend of clinical care, fiscal responsibility, and patient accountability. Among the benefits:
Reduced admissions. On average, the admission rates from ED to inpatient services are 13.3%.5 In contrast, in hospitals that have a robust COU in place, the admission rates are much lower. As an example, Cook County Hospital in Chicago in the mid-1990s saw a decline in the admission rates from the emergency room following implementation of a COU, along with an increase in bed capacity due to the efficient, protocol-driven approach that goes along with successful ED observation units.6 With well-structured and managed observation units, such a reduction in hospitalization rates has been shown, is reproducible, and is achievable.
Improved case-mix multiplier. Inpatient reimbursements from the Centers for Medicare and Medicaid Services (CMS) and private insurers frequently are tied to the acuity of care a hospital provides. Critical to making that determination is the case mix that a given hospital sees. Usually, the more complex patients a hospital admits, the higher the reimbursements are. With a successful COU, a hospital can expect a case-mix multiplier representing patients with greater complexity and higher acuity.
What a successful COU essentially does is lead to the admission of patients with greater comorbidities—those who are sicker than the average patient. In doing so, COUs also facilitate safe discharges of the patients who do not necessarily need to be admitted. As an average, the cohort of patients who are admitted as inpatients then consists of patients who are sick enough and absolutely need to be admitted.
Resource utilization. When a patient is admitted from the ED to an inpatient floor, a lot of resources are utilized. These include expenses related to transportation, housekeeping, nursing, and ancillary services. Each of these additional resources comes with an expense. The more resources that are put in motion, the greater the expense a hospital incurs. With effective COUs, it is generally expected that suitable patients will get the care in a specific geographic area by the same set of providers. COUs tend to reduce unnecessary hospitalizations, redundancy of manpower utilization, and duplication of documentation—therefore reducing the expenses incurred by the hospital.
Infection control. The COUs operate based on minimizing the stay of the patients who can be safely discharged after a brief observation period. Decreased duration of stay also means decreased movement and unique provider contact/exposure—thus decreasing the chances for acquiring health-care-related infections. Besides, most COUs are restricted to a certain geographic area within the hospital, which helps to restrict patients to a limited area. This again may be helpful in better overall infection-control practices. More research is necessary to establish this association of the infection-control advantages of COUs. The hypothesis, however, does appear very promising.
Prompt and standardized care. Most COUs use an evidence-based, standardized approach toward the patients seen in the ED. Several professional bodies have endorsed the use of protocol-driven care for the conditions seen in the COU. Most professional organizations that have a key role in COUs advocate this approach, and include the ACEP, AHA, and SHM. When a COU has established itself, it likely is to use specific, expedited, protocol-driven approaches. This allows for care to be focused and standardized. This also is an opportunity to avoid redundant imaging and lab testing.
Patient safety. In its landmark publication “To Err is Human: Building a Safer Health System,” the Institute of Medicine identified communication error as one of the factors that lead to mistakes in patient care.7 COUs often tend to provide bulk of care at a given geographical area; this minimizes the transfer of patients from one place to another, thereby decreasing communication errors.
By providing more time to make decisions, COUs afford a greater diagnostic certainty. In the long run, this also helps a hospital minimize costly lawsuits.
The Bad
Not everything about COUs is great. There are certain areas that dull the luster of an observation unit.
Overzealous approaches. COUs are designed to allow more time to make clinical decisions when the triaging is in a gray area: whether to admit or not. Also, COUs provide clinicians with more time to follow the response to the care the patients receive in an emergent fashion. It needs to be emphasized that COUs are designed neither to replace hospitalization, nor to act as urgent care. As a corollary, there is a chance clinicians may be overzealous in discharging patients from COUs close to the 24-hour mark—even though it might not be clear whether the patient needs to be admitted or discharged. Overzealous discharging of COU patients can damage the premise of these units: to determine the need for admission and ensure patient safety. Having strict inclusion and exclusion criteria and good management can prevent these problems.
Staffing. Introduction of a COU can strain an already short-staffed ED. No different from any other novel approach, COU staffers need to be afforded a learning curve. This requires training personnel and establishing a robust team to staff COUs. It can be a strenuous process, at least in the beginning. Strong leadership and support of hospital, physician, and nursing leadership all play a role in the successful implementation and ongoing utilization of COUs.
Logistics. Coordination of people, facilities, and supplies that go into instituting a COU might be a challenge. Also, there may be times where patient ownership may not be very clear. Logistical concerns can include:
- Who owns the patient?
- How much of a role does a consulting service have?
- Who oversees the follow-up plans?
Although a popular COU setup is to have a dedicated observation unit adjacent to the ED, it is not a standard.
Reimbursement. Unfortunately, there is some degree of negative incentive built into reimbursements for COU operations. To understand why this is a bad thing for a hospital, let’s examine how hospitals are paid for services provided in a COU.
Frequently, COU patients are treated as “outpatients.” The operating formula is based on the Hospital Outpatient Prospective Payment System (OPPS), which is based on Ambulatory Payment Classification, or APC.8 Reimbursement differences in these two approaches can be quite sizable. Depending on what condition is being treated, the hospital reimbursement can be as little as half to a quarter of the payment for inpatient treatment.9 Essentially, the patient would have received very similar care, diagnostic work-up, antibiotics, imaging, lab work, and equally qualified clinicians as caretakers in both the settings. The payments need to account for the care in the COUs, which is usually more acute than in the ambulatory setting and potentially more efficient than an inpatient setting. The payments, therefore, should be sensitive to these factors.
The Ugly
COUs are intended to address many of the challenges facing the healthcare system, and in large part, that is what they do. However, some hospitals could be penalized for providing care through COUs. An efficient COU means that the patients who are admitted are, in fact, sicker. Logically, these patients will have a higher chance of being readmitted. Because the “not so sick” patients were successfully intervened and discharged from COUs, the patients that did get admitted must be pretty sick and must have higher comorbidities.
According to CMS, a readmission occurs if a patient has “an admission to a subsection hospital within 30 days of a discharge from the same or another subsection hospital.”10 The denominator here consists of all the patients who were discharged from the hospital inpatient stay. If a hospital does not have a robust COU, a large number of “not so sick” patients will be admitted as inpatients and will provide a larger denominator for calculating the readmission rates.
In contrast, a successful COU will allow for a large number of “not so sick” and “borderline” patients to be discharged, shrinking the denominator base, and “very sick” patients who are likely to be readmitted. This may erroneously cause the hospital to appear to have higher 30-day readmission rates. These hospitals may risk substantial readmission-related penalties.
This issue, along with a lopsided payment model, makes the COU landscape murky. With a greater share of pie being the “Il buono” in Il buono, il brutto, il cattivo, clinical observation units are certain to take a prominent position in addressing many of the issues that plague current healthcare facilities—capacity constraints, long ED wait times, limited inpatient beds, and soaring health-care expenditures.
Most important, COUs can lead to better and more efficient patient care.11 It is, therefore, not surprising that the IOM, in its report “Hospital Based Emergency Care—At the Breaking Point,” has identified clinical decision units as a “particularly promising” technique to improve patient flow.12
Dr. Asudani is a hospitalist in the division of hospital medicine in the department of internal medicine at the University of California San Diego Health System. Dr. Tolia is director of observation medicine in the department of emergency medicine and internal medicine at UCSD Health System.
References
- Baugh CW, Venkatesh AK, Hilton JA, Samuel PA, Schuur JD, Bohan JS. Making greater use of dedicated hospital observation units for many short-stay patients could save $3.1 billion a year. Health Aff (Millwood). 2012;31(10):2314-2323.
- Society of Hospital Medicine. The observation unit white paper. Society of Hospital Medicine website. Available at: http://www.hospitalmedicine.org/AM/Template.cfm?Section=White_Papers&Template=/CM/ContentDisplay.cfm&ContentID=21890. Accessed April 3, 2013.
- American College of Emergency Physicians. Emergency department observation services. American College of Emergency Physicians website. Available at: http://www.acep.org/Clinical—Practice-Management/Emergency-Department-Observation-Services. Accessed April 10, 2013.
- Niska R, Bhuiya F, Xu J. National Hospital Ambulatory Medical Care Survey: 2007 emergency department summary. Hyattsville, Md.: National Center for Health Statistics; 2010.
- Centers for Disease Control and Prevention. Fast stats. Centers for Disease Control and Prevention. Available at: http://www.cdc.gov/nchs/fastats/ervisits.htm. Accessed April 9, 2013.
- Martinez E, Reilly BM, Evans AT, Roberts RR. The observation unit: a new interface between inpatient and outpatient care. Am J Med. 2001;110(4):274-277.
- To err is human: building a safer health system. Institute of Medicine. Washington (DC): National Academies Press; 2000.
- Centers for Medicare & Medicaid Services. Hospital outpatient prospective payment system. Centers for Medicare & Medicaid Services website. Available at: http://www.cms.gov/Outreach-and-Education/Medicare-Learning-Network-MLN/MLNProducts/downloads/hospitaloutpaysysfctsht.pdf. Accessed April 2, 2013.
- Runy L. Clinical observation units: Building a bridge between outpatient and inpatient services. Hospitals and Health Networks website. Available at: http://www.hhnmag.com/hhnmag/jsp/articledisplay.jsp?dcrpath=HHNMAG/PubsNewsArticle/data/2006March/0603HHN_FEA_gatefold&domain=HHNMAG. Accessed April 9, 2013.
- Centers for Medicare & Medicaid Services. Readmissions reduction program. Centers for Medicare & Medicaid Services website. Available at: http://www.cms.gov/Medicare/Medicare-Fee-for-Service-Payment/AcuteInpatientPPS/Readmissions-Reduction-Program.html. Accessed May 6, 2013.
- Baugh CW, Venkatesh AK, Bohan JS. Emergency department observation nits: a clinical and financial benefit for hospitals. Health Care Manage Rev. 2011;36(1):28-37.
- Institute of Medicine. Hospital-based emergency care: at the breaking point. Washington: National Academies Press; 2007.
Clinical Vignettes 101

Check out winners of the HM13 Research, Innovation, and Clinical Vignette competition at www.hospitalmedicine2013.org/riv/vignettes.php. The site includes poster PDFs and presentations from the winners, as well as poster PDFs for all finalists.
Physicians are exposed to a wide variety of cases that pique our interest. Cases that make you go home and read just a little bit more. Cases that prompt you to seek out your classmates and colleagues for further discussion, or trigger a call to someone from your past. Residents and students often ask, “Should I write this case up?” Our answer is, “Yes!”
Why do we recommend that you write the case up? Much of medical education is a clinical- or case-based exercise. Clinical cases provide context for the principles being taught. We use real cases to point out the nuance in a presentation of a particular illness or the management of a disease.
In clinical conferences, such as morning report or clinical-pathologic conferences (CPCs), we highlight the choices we make as physicians to provide the best care. Respected physicians and master clinicians at our own institutions often lead these discussions, which form the building blocks for how many of us will practice in our careers.
At grand rounds, the best speakers start with a case. These vignettes grab our attention, making us realize the importance of what the speaker teaches us.
Writing up a vignette will give you a skill set you need. You learn how to select a case, create a “teachable moment,” or hone a series of teaching points. You develop your skills in searching and critically appraising the literature. You become a content expert among your peers. This activity helps you to develop and master the academic skills that will drive your career and will be pivotal in your success.
Follow these eight steps to produce successful clinical vignette submissions:
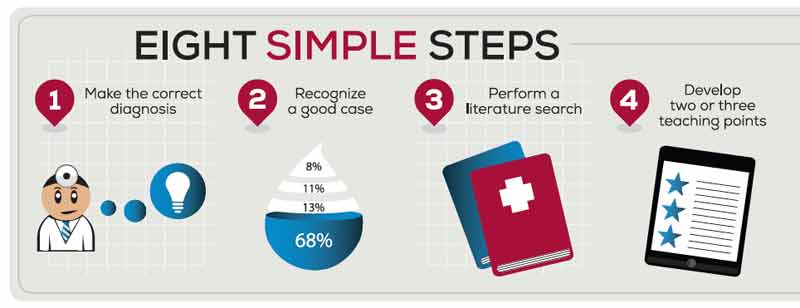
Step 1
Be a good doctor and make the correct diagnosis: Interesting cases will come to you. Don’t chase a zebra on every cough. Don’t send autoimmune panels for every rash. Read about each patient’s case that you see. Use the time to build your clinical acumen and develop your own illness scripts. Through the process of being a thoughtful student of medicine, you will come to distinguish the fascinoma from the merely fleeting infatuation with a diagnosis.
Step 2
Recognize the good case: The best way to recognize a good case is appreciate when it excites people locally. If you present it at morning report or CPC, are you inundated with requests to speak more after the conference has finished? Did it stump your colleagues (usually a pretty bright group)? Do you find that the consultants ask for others in their division to come and see the case? Clinically, did it take the team a while to come to the end diagnosis? If any of these are true, then you should move forward.
Step 3
Perform a literature search: How often does a similar situation arise? Is it 1 in 10,000, 1 in a million, or less? Even a case of 1 in 10,000 can be impactful to read about when you consider how long it may take a physician to see that many patients.
Step 4.
Develop two or three teaching points: Most abstracts for national and regional meetings have a restrictive word limit. When you consider all the information required of a thorough case presentation and adequate discussion, it can seem almost impossible to fit it all in. Start early, at least a month before the deadline if you can, and start big. Determine two or three key teaching points you wish to make. These will serve as your roadmap for the write-up.
Next, write down everything you want to say. Then cut the verbiage and descriptions that are not needed to tell your story. Focus on two or three take-home points. Each fact included or statement made should help to guide the reader to these lessons. As readers and authors, we also like to see prevalence and incidence of disease findings, or how good a test is with specificity and sensitivity values. Make sure the readers know what you want them to learn.
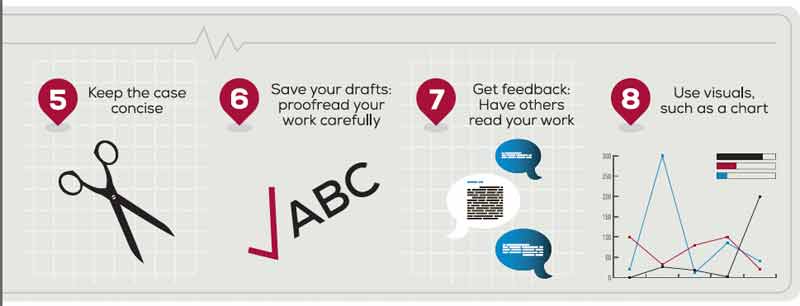
Step 5
Keep the case concise, and focus on the discussion: The best write-ups keep the case description short and focused. Avoid trying to tell your readers everything about your case. Highlight what makes your case different without including extraneous information that does not support your teaching points. This leaves more room to focus on your discussion and explain to the reader the importance of your case. The discussion is where you create the “teachable moment” by elaborating on your teaching points.
Step 6
Keep your drafts and proofread your work carefully: The process of writing a clear and concise vignette will take many drafts. To do a great job, plan for at least three or four versions. Through the process of revisiting every word you use, you will start to hone your mastery of the topic; you will see the case in a new way with each draft.
As you do this, keep each edit as a separate file. You will inevitably edit something out early on that you will want to put back in later. Keeping your drafts will make this much easier.
At the final version, proofread carefully! Most reviewers will deduct points for poor grammar and misspellings. If it looks sloppy, then a reader will assume it represents sloppy thoughts.
Step 7
Get feedback: Have others read your work. It is always hard to put your writing out there for critique, particularly when it is such a personal representation of your own clinical thought. Hopefully, you have collaborated with others involved in the case; however, to avoid any “group think” about the work, it is best to have uninvolved individuals (e.g., trusted faculty member, program director, division chief) review your work before submission. The point of these vignettes is to help you develop skills as an author and academician. Since most meetings do not provide any feedback on the review of your submission, outside of “accepted” or “rejected,” it is important to get this from your own institution. It will also heighten your chances of acceptance. Take their suggestions openly, and use them to refine your abstract.
Step 8
Consider the following keys to a poster or oral presentation: The presentation at the meeting should be an expansion on the abstract. Remember, you have described the situation, but now you have the opportunity to use a picture. The old adage that a picture is worth a thousand words really rings true here.
Avoid copying and pasting your text. Concise statements will grab people’s eyes and leave you more space for charts and images. Visuals grab the reader’s eye better than small-font text.
Conclusion
Your first clinical vignette can be a truly great experience. Although it is a lot of hard work, presenting clinical thought is a skill that you must learn. Once you do this, you might find that you have “caught the bug,” and will find yourself well on your way to a role in medical education. You might even start a larger project based on this experience.
Dr. Burger is associate program director of internal medicine residency in the Department of Medicine at Beth Israel Medical Center and assistant dean and assistant professor of medicine at Albert Einstein College of Medicine, both in New York City. Dr. Paesch is a comprehensive care physician in the section of hospital medicine at the University of Chicago, and assistant professor at the University of Chicago Pritzker School of Medicine. Dr. Miller is director of student programs, associate program director, residency, and associate professor of medicine in the Department of Medicine at Tulane Health Sciences Center in New Orleans.
Check out winners of the HM13 Research, Innovation, and Clinical Vignette competition at www.hospitalmedicine2013.org/riv/vignettes.php. The site includes poster PDFs and presentations from the winners, as well as poster PDFs for all finalists.
Physicians are exposed to a wide variety of cases that pique our interest. Cases that make you go home and read just a little bit more. Cases that prompt you to seek out your classmates and colleagues for further discussion, or trigger a call to someone from your past. Residents and students often ask, “Should I write this case up?” Our answer is, “Yes!”
Why do we recommend that you write the case up? Much of medical education is a clinical- or case-based exercise. Clinical cases provide context for the principles being taught. We use real cases to point out the nuance in a presentation of a particular illness or the management of a disease.
In clinical conferences, such as morning report or clinical-pathologic conferences (CPCs), we highlight the choices we make as physicians to provide the best care. Respected physicians and master clinicians at our own institutions often lead these discussions, which form the building blocks for how many of us will practice in our careers.
At grand rounds, the best speakers start with a case. These vignettes grab our attention, making us realize the importance of what the speaker teaches us.
Writing up a vignette will give you a skill set you need. You learn how to select a case, create a “teachable moment,” or hone a series of teaching points. You develop your skills in searching and critically appraising the literature. You become a content expert among your peers. This activity helps you to develop and master the academic skills that will drive your career and will be pivotal in your success.
Follow these eight steps to produce successful clinical vignette submissions:
Step 1
Be a good doctor and make the correct diagnosis: Interesting cases will come to you. Don’t chase a zebra on every cough. Don’t send autoimmune panels for every rash. Read about each patient’s case that you see. Use the time to build your clinical acumen and develop your own illness scripts. Through the process of being a thoughtful student of medicine, you will come to distinguish the fascinoma from the merely fleeting infatuation with a diagnosis.
Step 2
Recognize the good case: The best way to recognize a good case is appreciate when it excites people locally. If you present it at morning report or CPC, are you inundated with requests to speak more after the conference has finished? Did it stump your colleagues (usually a pretty bright group)? Do you find that the consultants ask for others in their division to come and see the case? Clinically, did it take the team a while to come to the end diagnosis? If any of these are true, then you should move forward.
Step 3
Perform a literature search: How often does a similar situation arise? Is it 1 in 10,000, 1 in a million, or less? Even a case of 1 in 10,000 can be impactful to read about when you consider how long it may take a physician to see that many patients.
Step 4.
Develop two or three teaching points: Most abstracts for national and regional meetings have a restrictive word limit. When you consider all the information required of a thorough case presentation and adequate discussion, it can seem almost impossible to fit it all in. Start early, at least a month before the deadline if you can, and start big. Determine two or three key teaching points you wish to make. These will serve as your roadmap for the write-up.
Next, write down everything you want to say. Then cut the verbiage and descriptions that are not needed to tell your story. Focus on two or three take-home points. Each fact included or statement made should help to guide the reader to these lessons. As readers and authors, we also like to see prevalence and incidence of disease findings, or how good a test is with specificity and sensitivity values. Make sure the readers know what you want them to learn.
Step 5
Keep the case concise, and focus on the discussion: The best write-ups keep the case description short and focused. Avoid trying to tell your readers everything about your case. Highlight what makes your case different without including extraneous information that does not support your teaching points. This leaves more room to focus on your discussion and explain to the reader the importance of your case. The discussion is where you create the “teachable moment” by elaborating on your teaching points.
Step 6
Keep your drafts and proofread your work carefully: The process of writing a clear and concise vignette will take many drafts. To do a great job, plan for at least three or four versions. Through the process of revisiting every word you use, you will start to hone your mastery of the topic; you will see the case in a new way with each draft.
As you do this, keep each edit as a separate file. You will inevitably edit something out early on that you will want to put back in later. Keeping your drafts will make this much easier.
At the final version, proofread carefully! Most reviewers will deduct points for poor grammar and misspellings. If it looks sloppy, then a reader will assume it represents sloppy thoughts.
Step 7
Get feedback: Have others read your work. It is always hard to put your writing out there for critique, particularly when it is such a personal representation of your own clinical thought. Hopefully, you have collaborated with others involved in the case; however, to avoid any “group think” about the work, it is best to have uninvolved individuals (e.g., trusted faculty member, program director, division chief) review your work before submission. The point of these vignettes is to help you develop skills as an author and academician. Since most meetings do not provide any feedback on the review of your submission, outside of “accepted” or “rejected,” it is important to get this from your own institution. It will also heighten your chances of acceptance. Take their suggestions openly, and use them to refine your abstract.
Step 8
Consider the following keys to a poster or oral presentation: The presentation at the meeting should be an expansion on the abstract. Remember, you have described the situation, but now you have the opportunity to use a picture. The old adage that a picture is worth a thousand words really rings true here.
Avoid copying and pasting your text. Concise statements will grab people’s eyes and leave you more space for charts and images. Visuals grab the reader’s eye better than small-font text.
Conclusion
Your first clinical vignette can be a truly great experience. Although it is a lot of hard work, presenting clinical thought is a skill that you must learn. Once you do this, you might find that you have “caught the bug,” and will find yourself well on your way to a role in medical education. You might even start a larger project based on this experience.
Dr. Burger is associate program director of internal medicine residency in the Department of Medicine at Beth Israel Medical Center and assistant dean and assistant professor of medicine at Albert Einstein College of Medicine, both in New York City. Dr. Paesch is a comprehensive care physician in the section of hospital medicine at the University of Chicago, and assistant professor at the University of Chicago Pritzker School of Medicine. Dr. Miller is director of student programs, associate program director, residency, and associate professor of medicine in the Department of Medicine at Tulane Health Sciences Center in New Orleans.
Massachusetts Hospitalists Experiment with Unit-Based Rounding

Today marks the end of the second week of a three-month experiment we are embarking on to improve team-based care. The main elements of our experiment are two early career hospitalists dedicated to a single nursing unit who are present on the unit throughout the day, structured multidisciplinary rounds, pharmacists doing medication histories to help with medical reconciliation, and a veteran hospitalist serving as a coach, broadly overseeing care coordination and throughput on the unit. (I’m going to focus on multidisciplinary care and leave the coaching part for another day.)
Many have written about and many more have tried to establish unit-based hospitalist models, where a hospitalist is assigned to a single nursing unit. These models often incorporate multidisciplinary rounds, where the hospitalist, case management, social services, physical therapy, and perhaps pharmacy meet each day and review each patient’s progress through the hospitalization. The underlying premise for establishing a unit-based model is that all, or nearly all, of the hospitalist’s patients are located on the nursing unit.
It Can’t Be That Hard
Dedicated units and multidisciplinary rounds are designed to achieve better coordination between the hospitalists and the other members of the hospital team. Most healthcare professionals intuitively support this model; however, many hospitalists have concerns.
To provide the best care for their patients while maintaining career satisfaction, these hospitalists may feel the need for flexibility—the ability to be independent and roam unrestricted through the hallways and departments of the hospital. This goal can be at odds with being limited to a single nursing unit.
For these hospitalists to support the unit-based model, there had better be good reasons for doing so.
Measuring the Effects of Teamwork
Jody Hoffer Gittell, PhD, a professor of management at Brandeis University in Waltham, Mass., has studied relational coordination extensively in healthcare and other service industries. Relational coordination can be defined as “coordinating work through relationships of shared goals, shared knowledge and mutual respect, supported by frequent, timely, accurate, problem-solving communication.”1
Dr. Gittell has developed a validated questionnaire to be completed by each member of the healthcare team, quantifying their perspective on these dimensions for others on the team. I think of relational coordination as a rigorous way of quantifying teamwork.
In 2008, Dr. Gittell published an observational study with SHM senior vice president Joe Miller and hospitalist leader Adrienne L. Bennett, MD, PhD, conducted at a suburban Boston hospital.2 The study looked at relational coordination between members of the hospital team under hospitalist care compared to traditional, PCP-based hospital care. They measured relational coordination by asking the attending physician (hospitalist or PCP providing hospital care), medical resident, floor nurse, case manager, social worker, and therapist (occupational, physical, respiratory, speech) to complete questionnaires about the other team members for a cohort of patients.
The study concluded that relational coordination between other members of the team and the physician was significantly higher for patients treated by hospitalists than for patients treated by traditional PCPs. Further, they found that as relational coordination increased, for patients treated either by hospitalists or PCPs, length of stay, cost, and 30-day readmission rates decreased. I will add that the hospitalists were not unit-based in this study, but were assumed to be more available to the care team than traditional PCPs.
Subsequent studies of multidisciplinary rounds on a “hospitalist unit” conducted by Kevin O’Leary, MD, and colleagues at Northwestern University in Chicago have demonstrated a favorable effect on nurses’ ratings of teamwork and collaboration, as well as the rate of adverse events.3,4 The former study did not, however, find decreased costs or length of stay.
Keys to Success
Before our current experiment, I’ve had the privilege to witness, both at my home institution and at a number of outside ones, many permutations of multidisciplinary rounds and unit-based hospitalists. I’ve seen failures, some mixed results, and occasional success stories. In all cases, participants seem to agree that it takes extra effort to execute on this model, especially once the initial enthusiasm wanes. So, for these arrangements to succeed over time, including our current experiment, I see the following four factors as critical:
- Multidisciplinary rounds must be tightly organized, with case manager, nurse, and hospitalist providing input concisely. Average time per patient should not exceed about three minutes. The total time for rounds, no matter how many patients are under discussion, should not exceed one hour.
- Each team member must be prepared to provide critical information for rounds. For example, hospitalists and nurses should have seen/reviewed their patients, case managers should know expected length of stay and key disposition information, and pharmacists should know medical histories and other pertinent information.
- The fundamental concern of multidisciplinary rounds—that someone’s time is being wasted (when not talking about that team member’s patient at that moment)—must be mitigated one way or another. Solutions include rotating nurses or hospitalists in and out of rounds, and allowing hospitalists to enter orders and do other discreet multitasking during rounds. Careful attention to showing up for the rounds on time and on cue is crucial.
- Hospitalist autonomy and need to roam has to be programmed in by allowing them time to get off the unit, see the broader world, and interact with colleagues.
At the conclusion of three months, as a QI project (as opposed to rigorous research), we will measure a number of things, including cost, throughput, patient satisfaction, and team member satisfaction with the model. If you have predictions, please e-mail me. I’ll report our results in a subsequent column.
Dr. Whitcomb is medical director of healthcare quality at Baystate Medical Center in Springfield, Mass. He is co-founder and past president of SHM. E-mail him at [email protected].
References
- Relational Coordination Research Collaborative. Brandeis University website. Available at: http://rcrc.brandeis.edu/about-rc/What%20is%20Relational%20Coordination.html. Accessed September 23, 2013.
- Gittell JH, Weinberg DB, Bennett AL, Miller JA. Is the doctor in? A relational approach to job design and the coordination of work. Hum Resource Manag J. 2008;47(4):729-755.
- O’Leary KJ, Haviley C, Slade ME, Shah HM, Lee J, Williams MV. Improving teamwork: impact of structured interdisciplinary rounds on a hospitalist unit. J Hosp Med. 2011;6(2):88-93.
- O’Leary KJ, Buck R, Fligiel HM, et al. Structured interdisciplinary rounds in a medical teaching unit: improving patient safety. Arch Intern Med. 2011;171(7):678-684.
Hospitalist Greg Harlan Embraces Everything Hospital Medicine Career Offers

If he wasn’t a physician administrator working for one of the largest physician management companies in the country, or a clinical instructor at a medical school, or a pediatric hospitalist picking up shifts at a children’s hospital, Greg Harlan, MD, MPH, would have a very different life.
He says he’d “promote vegetable gardens to kindergartners, hike the West Coast Trail, fight the obesity epidemic, and play lots of golf.”
Oh, yeah, one more: “Give every kid a bicycle.”
It’s quite the altruistic—some might say enviable—list. Instead, Dr. Harlan is hard at work as director of medical affairs at North Hollywood, Calif.-based IPC The Hospitalist Company. He is also a clinical instructor at the University of Southern California Medical School and moonlights as a pediatric hospitalist in Los Angeles.
He says he chose to focus on hospital medicine as a career while working as a young faculty member at the University of Utah.
“I noticed that lots of innovation, experimentation, and energy was coming from the newly formed hospitalist division,” says Dr. Harlan, one of nine new members of Team Hospitalist, The Hospitalist’s volunteer editorial advisory group. “I tried it out and loved it, especially getting to teach the students and residents for intense periods of time.”
At IPC, Dr. Harlan leads company-wide quality improvement (QI) initiatives, coordinates risk reduction activities, and directs the IPC-University of California San Francisco Fellowship for Hospitalist Leaders. He says he has a growing interest in “physician leadership, high-functioning teams, and physician groups’ well-being.”

“I am using my QI background to apply these principles to better understanding how teams and leaders can thrive,” he says.
Question: Why did you choose a career in medicine?
A: Medicine is a cool combination of hard science, psychology, counseling, and teaching. It’s an amazing way to combine multiple passions and get to be involved on a very intimate level with many people.
Q: What do you like most about working as a hospitalist?
A: The focus on improving the system as a whole. Ultimately, the patients benefit, but so do many of the other stakeholders in the processes we touch.
Q: What do you dislike most?
A: It’s tough to take in-house call at night. It’s also hard to step in to many sick patients’ care for a short period of time, especially midway through their hospitalization.
Q: What’s the best advice you ever received?
A: Find the people who actually do the work. This is the concept of going to the front line, to see where the real work is being done. It never ceases to amaze me to find out the difference between what we think is going on and what is actually going on.
Q: What’s the biggest change you’ve seen in HM in your career?
A: Providers are getting squeezed a little more each year. There are growing pressures from many sides, and the providers are feeling “crunched.”
Q: Why is it important for you to continue seeing patients?
A: Feeling the joy and pain of actually providing care for patients is integral to leading the hospitalist movement. By acutely experiencing an electronic health record, or dealing with medication authorizations or handoffs, one stays in the real world of hospital medicine.
Q: What is your biggest professional challenge?
A: Balancing my multiple passions. I love being a teacher and still teach young med students at USC med school (my alma mater). I still enjoy seeing patients, too. I am most excited by a growing interest in leadership and teamwork, but it’s still in its development stage as a career path.
Q: What is your biggest professional reward?
A: Being able to see others flourish. Whether it’s beginning med students, professional colleagues, or administrative staff, I truly beam when someone I’ve helped succeeds.
Q: When you aren’t working, what is important to you?
A: My family, my health, and staying balanced. I am learning the importance of listening to my body, trusting my intuition, and finding true “balance.” It’s not easy, but it’s imperative.
Q: What’s next professionally?
A: I am really excited to put some science behind “leadership in medicine” and “optimal teamwork in medicine.” I think there is so much more we can learn and implement.
Q: What’s the best book you’ve read recently? Why?
A: A few come to mind: “18 Minutes” by Peter Bregman offers some really easy steps to getting organized and focused; “Six Thinking Hats” by Edward de Bono is a great framework for approaching problems and innovations; “The Inner Game of Golf” by W. Timothy Gallwey makes me realize how amazing our bodies and minds truly are.
Q: How many Apple products do you interface with in a given week?
A: I only have an iPhone. Amazing little gadget, but I don’t want to become wedded to it. Maybe I’ll get a MacBook soon.
Q: What’s next in your Netflix queue?
A: We use Netflix mainly for their drama series. I prefer foreign films and documentaries. My wife and I love “Breaking Bad.” My kids and I are working our way through the “Star Wars” episodes.
Richard Quinn is a freelance writer in New Jersey.
If he wasn’t a physician administrator working for one of the largest physician management companies in the country, or a clinical instructor at a medical school, or a pediatric hospitalist picking up shifts at a children’s hospital, Greg Harlan, MD, MPH, would have a very different life.
He says he’d “promote vegetable gardens to kindergartners, hike the West Coast Trail, fight the obesity epidemic, and play lots of golf.”
Oh, yeah, one more: “Give every kid a bicycle.”
It’s quite the altruistic—some might say enviable—list. Instead, Dr. Harlan is hard at work as director of medical affairs at North Hollywood, Calif.-based IPC The Hospitalist Company. He is also a clinical instructor at the University of Southern California Medical School and moonlights as a pediatric hospitalist in Los Angeles.
He says he chose to focus on hospital medicine as a career while working as a young faculty member at the University of Utah.
“I noticed that lots of innovation, experimentation, and energy was coming from the newly formed hospitalist division,” says Dr. Harlan, one of nine new members of Team Hospitalist, The Hospitalist’s volunteer editorial advisory group. “I tried it out and loved it, especially getting to teach the students and residents for intense periods of time.”
At IPC, Dr. Harlan leads company-wide quality improvement (QI) initiatives, coordinates risk reduction activities, and directs the IPC-University of California San Francisco Fellowship for Hospitalist Leaders. He says he has a growing interest in “physician leadership, high-functioning teams, and physician groups’ well-being.”
“I am using my QI background to apply these principles to better understanding how teams and leaders can thrive,” he says.
Question: Why did you choose a career in medicine?
A: Medicine is a cool combination of hard science, psychology, counseling, and teaching. It’s an amazing way to combine multiple passions and get to be involved on a very intimate level with many people.
Q: What do you like most about working as a hospitalist?
A: The focus on improving the system as a whole. Ultimately, the patients benefit, but so do many of the other stakeholders in the processes we touch.
Q: What do you dislike most?
A: It’s tough to take in-house call at night. It’s also hard to step in to many sick patients’ care for a short period of time, especially midway through their hospitalization.
Q: What’s the best advice you ever received?
A: Find the people who actually do the work. This is the concept of going to the front line, to see where the real work is being done. It never ceases to amaze me to find out the difference between what we think is going on and what is actually going on.
Q: What’s the biggest change you’ve seen in HM in your career?
A: Providers are getting squeezed a little more each year. There are growing pressures from many sides, and the providers are feeling “crunched.”
Q: Why is it important for you to continue seeing patients?
A: Feeling the joy and pain of actually providing care for patients is integral to leading the hospitalist movement. By acutely experiencing an electronic health record, or dealing with medication authorizations or handoffs, one stays in the real world of hospital medicine.
Q: What is your biggest professional challenge?
A: Balancing my multiple passions. I love being a teacher and still teach young med students at USC med school (my alma mater). I still enjoy seeing patients, too. I am most excited by a growing interest in leadership and teamwork, but it’s still in its development stage as a career path.
Q: What is your biggest professional reward?
A: Being able to see others flourish. Whether it’s beginning med students, professional colleagues, or administrative staff, I truly beam when someone I’ve helped succeeds.
Q: When you aren’t working, what is important to you?
A: My family, my health, and staying balanced. I am learning the importance of listening to my body, trusting my intuition, and finding true “balance.” It’s not easy, but it’s imperative.
Q: What’s next professionally?
A: I am really excited to put some science behind “leadership in medicine” and “optimal teamwork in medicine.” I think there is so much more we can learn and implement.
Q: What’s the best book you’ve read recently? Why?
A: A few come to mind: “18 Minutes” by Peter Bregman offers some really easy steps to getting organized and focused; “Six Thinking Hats” by Edward de Bono is a great framework for approaching problems and innovations; “The Inner Game of Golf” by W. Timothy Gallwey makes me realize how amazing our bodies and minds truly are.
Q: How many Apple products do you interface with in a given week?
A: I only have an iPhone. Amazing little gadget, but I don’t want to become wedded to it. Maybe I’ll get a MacBook soon.
Q: What’s next in your Netflix queue?
A: We use Netflix mainly for their drama series. I prefer foreign films and documentaries. My wife and I love “Breaking Bad.” My kids and I are working our way through the “Star Wars” episodes.
Richard Quinn is a freelance writer in New Jersey.
Industry Insider Explains the State of Medical Liability Insurance
Click here to listen to more of our interview with Mike Matray
Click here to listen to more of our interview with Mike Matray
Click here to listen to more of our interview with Mike Matray
Veterans Affairs National Quality Scholars Fellowship Program Offers Hospitalists Training Opportunity
As he was completing his residency in 1998, hospitalist Peter J. Kaboli, MD, MS, was undecided about his career direction. He didn’t know whether he wanted a clinical job in which he could pursue “quality improvement projects or a job focused on research.”
He entered the Veterans Affairs (VA) National Quality Scholars Fellowship Program, first offered in 1999, and found that he actually enjoyed both pursuits. As co-director of the Center for Comprehensive Access and Delivery Research and Evaluation (CADRE) for the VA Iowa City Health Care System, Dr. Kaboli has continued to pursue his interest in clinical research, exploring such issues as quality indicators to guide prescription of medicines for older adults and regional differences in prescribing quality among older veterans.1,2 He credits his time as a fellow as a definitive period in his career growth.

Dr. Kaboli, who now directs the VAQS Fellowship Program at the Iowa City VAMC, suggests that young hospitalists seeking to focus career directions consider a similar path. In fact, Dr. Kaboli and colleague Greg Ogrinc, MD, MS, senior scholar and director of the VA Quality Scholars (VAQS) Fellowship Program at the White River Junction VA in Vermont, say the VA healthcare system offers several avenues for hospitalists to hone their clinical, research, quality improvement, and leadership skills.
Research Paths
A nearly 15-year history with electronic health records (EHR) and a large population of enrolled beneficiaries make the VA system a rich source of data for understanding systems and improving care, Dr. Ogrinc says.
The VAQS Fellowship Program, offered at eight VA centers nationally, is a 2-year interdisciplinary program that pairs physicians and doctorally prepared nurses. Several sites also provide master’s degree training at an affiliated university. The curriculum is designed to train physicians in new methods of improving the quality and safety of healthcare for veterans and the nation. All eight VAQS centers are affiliated with academic institutions. That’s the case with the program at White River Junction, where VAQS Senior Scholar Dr. Ogrinc also holds dual appointments with Geisel School of Medicine in Hanover, N.H. and The Dartmouth Institute for Health Policy and Clinical Practice in Lebanon, N.H.
Dr. Ogrinc has tracked the VA’s experience with the program since its inception. One summary, published in 2009, notes that one of the strengths of the program is its combination of healthcare improvement curricula with adult learning strategies.3 This, along with mentorship and meaningful projects, serves to prepare physicians to lead improvement initiatives in healthcare quality and safety.
At White River Junction, graduates of the fellowship program follow a wide range of career paths. Dr. Ogrinc says roughly 50% choose to remain with the VA. Wherever fellows land after the program, both Dr. Kaboli and Dr. Ogrinc agree that the two-year delay before going into practice is a worthwhile investment. “The upfront investment in time pays back in the long run,” Dr. Kaboli says.
Additional fellowships offered through the VA include Career Development Awards (akin to the National Institutes of Health career development K awards), often located at VA medical centers designated as Centers of Innovation. They supply research infrastructure and access to data. Some of the centers offering VAQS and patient safety fellowships are co-located with Veterans Engineering Resource Centers, so that cross-fertilization with experts in organizational engineering makes for an additional “rich learning environment,” notes Dr. Ogrinc.
Clinical Path
Like all U.S. healthcare systems, the VA is expanding its use of hospitalists.
“There are great opportunities for hospitalists in the VA as salaried physicians, with very reasonable work hours and an excellent electronic medical record,” Dr. Kaboli says.
Dr. Ogrinc points out that residency programs do not always prepare hospitalists for the administrative, system improvement, and organizational responsibilities that often fall under hospitalist purview. “Committee and improvement work can often be seen as bothersome by some,” he says, “especially if they don’t have the opportunity to learn the skills and methods to make their organizations work better from a patient outcome standpoint.”
In addition, either experiencing a fellowship program or simply working in a salaried position with the VA “can round out your skill set, make you a better hospitalist overall, and put you in a position to be a leader as a hospitalist in a practice,” Dr. Ogrinc says.
Dr. Kaboli agrees.
“The future of healthcare reform in this country is embracing the model of the accountable care organization,” he says. “The VA system, with capitated payment, salaried physicians, and comprehensive integrated care, is arguably the largest ACO [accountable care organization] in the country.”
Gretchen Henkel is a freelance writer in California.
Resources for VA Research Programs

Eight VA medical centers participate in the National Quality Scholars Fellowship Program: Greater Los Angeles, Atlanta, Birmingham, Cleveland, Iowa City, Nashville, San Francisco, and White River Junction. For more information on application requirements and deadlines, visit www.va.gov and search “National Quality Scholars Fellowship Program.”
There are three levels of Career Development Awards offered through the VA Office of Research and Development, including biomedical laboratory/clinical sciences and health services. For more information on award categories and submission deadlines, visit www.research.va.gov/funding.
The New England Veterans Engineering Resource Center (www.newengland.va.gov/verc) provides examples of the variety of systems engineering research projects being undertaken by the VA. —Gretchen Henkel
References
- Lund BC, Steinman MA, Chrischilles EA, Kaboli PJ. Beers criteria as a proxy for inappropriate prescribing of other medications among older adults. Ann Pharmacother. 2011;45:1363-1370.
- Lund BC, Charlton ME, Steinman MA, Kaboli PJ. Regional differences in prescribing quality among elder veterans and the impact of rural residence. J Rural Health. 2013;29:172-179.
- Splaine ME, Ogrinc G, Gilman SC, et al. The Department of Veterans Affairs National Quality Scholars Fellowship Program: experience from 10 year of training quality scholars. Acad Med. 2009;84:1741-1748.
As he was completing his residency in 1998, hospitalist Peter J. Kaboli, MD, MS, was undecided about his career direction. He didn’t know whether he wanted a clinical job in which he could pursue “quality improvement projects or a job focused on research.”
He entered the Veterans Affairs (VA) National Quality Scholars Fellowship Program, first offered in 1999, and found that he actually enjoyed both pursuits. As co-director of the Center for Comprehensive Access and Delivery Research and Evaluation (CADRE) for the VA Iowa City Health Care System, Dr. Kaboli has continued to pursue his interest in clinical research, exploring such issues as quality indicators to guide prescription of medicines for older adults and regional differences in prescribing quality among older veterans.1,2 He credits his time as a fellow as a definitive period in his career growth.
Dr. Kaboli, who now directs the VAQS Fellowship Program at the Iowa City VAMC, suggests that young hospitalists seeking to focus career directions consider a similar path. In fact, Dr. Kaboli and colleague Greg Ogrinc, MD, MS, senior scholar and director of the VA Quality Scholars (VAQS) Fellowship Program at the White River Junction VA in Vermont, say the VA healthcare system offers several avenues for hospitalists to hone their clinical, research, quality improvement, and leadership skills.
Research Paths
A nearly 15-year history with electronic health records (EHR) and a large population of enrolled beneficiaries make the VA system a rich source of data for understanding systems and improving care, Dr. Ogrinc says.
The VAQS Fellowship Program, offered at eight VA centers nationally, is a 2-year interdisciplinary program that pairs physicians and doctorally prepared nurses. Several sites also provide master’s degree training at an affiliated university. The curriculum is designed to train physicians in new methods of improving the quality and safety of healthcare for veterans and the nation. All eight VAQS centers are affiliated with academic institutions. That’s the case with the program at White River Junction, where VAQS Senior Scholar Dr. Ogrinc also holds dual appointments with Geisel School of Medicine in Hanover, N.H. and The Dartmouth Institute for Health Policy and Clinical Practice in Lebanon, N.H.
Dr. Ogrinc has tracked the VA’s experience with the program since its inception. One summary, published in 2009, notes that one of the strengths of the program is its combination of healthcare improvement curricula with adult learning strategies.3 This, along with mentorship and meaningful projects, serves to prepare physicians to lead improvement initiatives in healthcare quality and safety.
At White River Junction, graduates of the fellowship program follow a wide range of career paths. Dr. Ogrinc says roughly 50% choose to remain with the VA. Wherever fellows land after the program, both Dr. Kaboli and Dr. Ogrinc agree that the two-year delay before going into practice is a worthwhile investment. “The upfront investment in time pays back in the long run,” Dr. Kaboli says.
Additional fellowships offered through the VA include Career Development Awards (akin to the National Institutes of Health career development K awards), often located at VA medical centers designated as Centers of Innovation. They supply research infrastructure and access to data. Some of the centers offering VAQS and patient safety fellowships are co-located with Veterans Engineering Resource Centers, so that cross-fertilization with experts in organizational engineering makes for an additional “rich learning environment,” notes Dr. Ogrinc.
Clinical Path
Like all U.S. healthcare systems, the VA is expanding its use of hospitalists.
“There are great opportunities for hospitalists in the VA as salaried physicians, with very reasonable work hours and an excellent electronic medical record,” Dr. Kaboli says.
Dr. Ogrinc points out that residency programs do not always prepare hospitalists for the administrative, system improvement, and organizational responsibilities that often fall under hospitalist purview. “Committee and improvement work can often be seen as bothersome by some,” he says, “especially if they don’t have the opportunity to learn the skills and methods to make their organizations work better from a patient outcome standpoint.”
In addition, either experiencing a fellowship program or simply working in a salaried position with the VA “can round out your skill set, make you a better hospitalist overall, and put you in a position to be a leader as a hospitalist in a practice,” Dr. Ogrinc says.
Dr. Kaboli agrees.
“The future of healthcare reform in this country is embracing the model of the accountable care organization,” he says. “The VA system, with capitated payment, salaried physicians, and comprehensive integrated care, is arguably the largest ACO [accountable care organization] in the country.”
Gretchen Henkel is a freelance writer in California.
Resources for VA Research Programs
Eight VA medical centers participate in the National Quality Scholars Fellowship Program: Greater Los Angeles, Atlanta, Birmingham, Cleveland, Iowa City, Nashville, San Francisco, and White River Junction. For more information on application requirements and deadlines, visit www.va.gov and search “National Quality Scholars Fellowship Program.”
There are three levels of Career Development Awards offered through the VA Office of Research and Development, including biomedical laboratory/clinical sciences and health services. For more information on award categories and submission deadlines, visit www.research.va.gov/funding.
The New England Veterans Engineering Resource Center (www.newengland.va.gov/verc) provides examples of the variety of systems engineering research projects being undertaken by the VA. —Gretchen Henkel
References
- Lund BC, Steinman MA, Chrischilles EA, Kaboli PJ. Beers criteria as a proxy for inappropriate prescribing of other medications among older adults. Ann Pharmacother. 2011;45:1363-1370.
- Lund BC, Charlton ME, Steinman MA, Kaboli PJ. Regional differences in prescribing quality among elder veterans and the impact of rural residence. J Rural Health. 2013;29:172-179.
- Splaine ME, Ogrinc G, Gilman SC, et al. The Department of Veterans Affairs National Quality Scholars Fellowship Program: experience from 10 year of training quality scholars. Acad Med. 2009;84:1741-1748.