User login
Continued Pressure, Collaboration, Member Action Key to Ending SGR
Faced with a looming 27% cut in Medicare physician payment rates and a one-year timeline to find a solution, 2011 was the year Congress was going to stop the vicious circle of short-term “doc fix” patches and finally put an end to the Sustainable Growth Rate (SGR) formula. A serious solution really did seem possible when the House Energy and Commerce Committee solicited ideas on how to solve the problem.
SHM and other healthcare groups responded, and there seemed to be genuine interest in acting on the various plans that were presented.
What happened?
In reality, 2011 became the year of deficit reduction (if not in actions, at least in words). Every discussion in Congress seemed to come back to the deficit. Hearings were held, countless bills were introduced, blame was cast, and, eventually, the powerful Joint Deficit Deduction Committee, or “supercommittee,” was charged with finding at least $1.5 trillion in savings. At one point, the committee was even urged to “go big” and come up with $4 trillion in savings.
The deficit-reduction-or-bust mentality suddenly made an SGR fix and its $300 billion price tag seem like a pretty hard sell.
Undaunted, groups representing caregivers tried to turn the focus on the deficit into an opportunity and even approached the supercommittee to resolve the SGR matter—an illogical step at first glance, but the reasoning did make long-term sense. The cost of fixing the SGR will only increase with time, and it is estimated that elimination will cost $600 billion in 2016. A timely fix will be cheaper, as delay will only serve to further increase the deficit.
In an effort to appeal to the deficit committee, SHM worked closely with U.S. Rep. Allyson Schwartz (D-Pa.) to develop and submit a framework for eliminating the SGR and eventually phasing out fee-for-service. Despite these efforts, the deficit committee failed, and lawmakers were left with limited time before the scheduled SGR payment cuts were to take effect on Jan. 1.
As 2011 came to a close, a short-term extension that would last until the end of February was all that Congress could agree to. The SGR cycle began anew.
The positive in all this is that, although an SGR replacement did not happen in 2011 and action in 2012 might turn out to be exceedingly difficult, there are now realistic replacement plans out there. For example, Schwartz is looking to introduce legislation based on her above-mentioned framework, but doing so will need broad support.
Moving forward, it will be imperative for societies like SHM and practitioners like hospitalists to keep pressure on Congress. Individual hospitalists will continue to play an important role by contacting their elected officials. This can be done through personal phone calls and letters, or by responding to SHM’s legislative action alerts. You can even act now by visiting SHM’s legislative action center.
For more public policy information and resources, visit www.hospitalmedicine.org/advocacy
Hospitalists on the Move

March S. Demyun, MD, has accepted a position as program director of the newly developed hospitalist program at Wesley Medical Center in Hattiesburg, Miss. Dr. Demyun joined the hospital as an internist in 2005. The new team will consist of one other full-time hospitalist, a full-time nurse practitioner, and five other internists.

J.P. Valin, MD, has been selected as chief medical officer for Banner Medical Group’s Western region. Dr. Valin is chief of staff at McKee Medical Center in Loveland, Colo., as well as the director of McKee’s hospitalist program.
Sarah Swift, MD, has been appointed director of Central Vermont Medical Center’s hospitalist program in Berlin. Dr. Swift most recently served as an inpatient-attending physician at the Hospital of the University of Pennsylvania in the division of hospital medicine. She also was on the faculty of the University of Pennsylvania School of Medicine in Philadelphia.
David Levy, MD, pulmonary disease physician and hospitalist at Beth Israel Medical Center-Kings Highway Division in Brooklyn, N.Y., was presented with the Nefesh Chaya Community Service Award by the Bikur Cholim of Flatbush for outstanding contributions to the community.

Jamie Gray, MD, was awarded the 2011 Rising Star Award by Vail Valley Medical Center in Vail, Colo., where she is vice president of the medical staff and an adult hospitalist. The award is for physicians who have been at the hospital for five or fewer years, and acknowledges a standout physician’s abilities in leadership, quality, community contributions, and the daily use of evidence-based medicine. Dr. Gray was chosen by her peers, physician leadership, and hospital administration.

Vineet Arora, MD, MPP, FACP, FHM, associate professor of medicine at the University of Chicago, was named one of the “20 People Who Make Healthcare Better 2011” by HealthLeaders Media. Dr. Arora was recognized for her research on sleep schedules for residents to improve quality and safety.
March S. Demyun, MD, has accepted a position as program director of the newly developed hospitalist program at Wesley Medical Center in Hattiesburg, Miss. Dr. Demyun joined the hospital as an internist in 2005. The new team will consist of one other full-time hospitalist, a full-time nurse practitioner, and five other internists.
J.P. Valin, MD, has been selected as chief medical officer for Banner Medical Group’s Western region. Dr. Valin is chief of staff at McKee Medical Center in Loveland, Colo., as well as the director of McKee’s hospitalist program.
Sarah Swift, MD, has been appointed director of Central Vermont Medical Center’s hospitalist program in Berlin. Dr. Swift most recently served as an inpatient-attending physician at the Hospital of the University of Pennsylvania in the division of hospital medicine. She also was on the faculty of the University of Pennsylvania School of Medicine in Philadelphia.
David Levy, MD, pulmonary disease physician and hospitalist at Beth Israel Medical Center-Kings Highway Division in Brooklyn, N.Y., was presented with the Nefesh Chaya Community Service Award by the Bikur Cholim of Flatbush for outstanding contributions to the community.
Jamie Gray, MD, was awarded the 2011 Rising Star Award by Vail Valley Medical Center in Vail, Colo., where she is vice president of the medical staff and an adult hospitalist. The award is for physicians who have been at the hospital for five or fewer years, and acknowledges a standout physician’s abilities in leadership, quality, community contributions, and the daily use of evidence-based medicine. Dr. Gray was chosen by her peers, physician leadership, and hospital administration.
Vineet Arora, MD, MPP, FACP, FHM, associate professor of medicine at the University of Chicago, was named one of the “20 People Who Make Healthcare Better 2011” by HealthLeaders Media. Dr. Arora was recognized for her research on sleep schedules for residents to improve quality and safety.
CODE-H: Bringing Better Coding to Hospitalists
For some hospitalists, coding can be akin to what a humorist once said about the weather: Everyone grumbles about it, but no one ever does anything about it. But, like weather, good coding can have a profound effect on a hospitalist practice’s operations and revenues. Unlike the weather, hospitalists can now do something about it.
This month, SHM introduced CODE-H (Coding Optimally by Documenting Effectively for Hospitalists), a series of Web-based education sessions that will help hospitalists optimize their revenue streams through better coding. CODE-H will provide easy access to training and support on coding and documentation issues unique to hospitalists.
“Coding is an integral part of the day-to-day operations for hospitalists, but hospitalists rarely take the opportunity to improve their coding efforts,” says Barb Pierce, CCS-P, ACS-EM, who will be leading the first CODE-H session.
Pierce’s session will be presented live to subscribers on Feb. 1. It, along with all sessions, will be archived for on-demand use.
In addition to formal educational webinars, the series creates an opportunity for individuals with an interest in coding to interact with the webinar faculty and other hospitalists.
Subscribers are encouraged to share the wealth with others in their hospitalist practice. For the subscription price of $1,200, hospitalists get access to the full array of CODE-H resources and programs for up to 10 people in their practices. Additional participants from the same site can be added to the subscription for $50 each.
Hospitalists can register today at www.hospitalmedicine.org/codeh.
Survey Insights: NPs and PAs in Hospital Medicine
One of the most intriguing changes in hospitalist practice staffing over the past few years is the increase in the number of groups integrating nurse practitioners (NPs) and/or physician assistants (PAs) into workflows. When SHM surveyed HM groups in 2005, only 29% of respondents reported having NPs and/or PAs in their practices. In 2011, nearly half (49%) of respondents to the SHM-MGMA nonacademic survey have NPs/PAs in their practices; academic hospital medicine practices were only slightly lower, at 47%.
Of course, it is always important to keep in mind that the respondent pool for the SHM-MGMA surveys is broader than SHM’s historical survey base, which could lead to different results.
Nevertheless, my anecdotal experience from talking with hospitalists around the country, and the experience of SHM Practice Analysis Committee members, supports the conclusion that the proportion of practices using NPs/PAs is growing, and that the number of NPs/PAs per practice is also growing.
Last year, MGMA created new NP/PA specialties just for HM—“Nurse Practitioner: Hospitalist” and “Physician Assistant: Hospitalist.” Data were submitted for only 26 NPs and 23 PAs in these specialties—but hey, it’s a start. Very few practices submitted encounters or wRVUs for hospitalist NPs or PAs, so the only item for which enough data were submitted to report results was compensation, as shown in the table.
NPs in the sample were about evenly divided between hospital-employed and not hospital-employed; however, most of the PAs were hospital-employed. The only region in which enough of the NPs and PAs were located to separately report data was the Southern section. And the vast majority of both NPs and PAs in the sample worked in practices with a shift-based staffing model.
Practice Analysis Committee (PAC) member Scarlett Blue, RN, MSN, vice president of quality and clinical development at Atlanta-based Eagle Hospital Physicians, believes the growing number of NPs and PAs is an indication not only of the continued shortage of physician resources, but also of growing recognition of the value that NPs/PAs can bring to a hospitalist practice. She notes that although Eagle has had NPs/PAs in its practices for some time, the company recently responded to this growth by appointing a national director for hospitalist NP-PA services who is an acute-care nurse practitioner (ACNP) and a doctor of nursing practice (DNP).
Dan Fuller, president of IN Compass Health and a PAC member, concurs. “We’ve had varying success incorporating NPs and PAs so far,” he says. “But as a model, it makes sense. We need to find ways to extend the abilities of our physicians without sacrificing quality.”
The 2012 MGMA surveys are again requesting compensation and productivity data for hospitalist NPs and PAs, and we’re hoping for a robust response. SHM’s new, independent State of Hospital Medicine survey includes questions about NPs and PAs as well. The questionnaires, which only take a few minutes to complete, are available through March 9 at www.hospitalmedicine.org/survey.
Leslie Flores, SHM senior advisor, practice management
MGMA and SHM compensation and productivity surveys are available through March 9; to participate, visit www.hospitalmedicine.org/survey
Pediatric HM Literature: Serious Bacterial Infection Rates Very Low in Bronchiolitis

Clinical question: What are the rates of serious bacterial infection (SBI) in infants with bronchiolitis?
Background: Fever is common in young infants with viral bronchiolitis. Infants younger than 90 days of age with clinical bronchiolitis and fever often are evaluated according to established guidelines for fever without source. The extent to which this work-up is necessary remains unclear, as rates for bacteremia, urinary tract infections (UTIs), and meningitis have not been precisely defined in this population.
Study design: Systematic review of the literature.
Synopsis: After a Medline database search including the terms serious bacterial infection, bacteremia, meningitis, urinary tract infection, bronchiolitis, and respiratory syncytial virus (RSV), studies and bibliographies were screened for articles that allowed for a calculation of site- and age-specific rates of SBI. Studies based in ICUs and studies of pneumonia were excluded. Eleven studies were analyzed.
The prevalence rate for UTI was 3.3% based on a random effects meta-analysis. Study design and setting did not appear to influence this rate; however, the prevalence of UTI was higher in RSV-positive infants as opposed to infants with clinical bronchiolitis. Rates for bacteremia were very low, and there were no reported cases of meningitis.
This study provides useful information to guide clinical decision-making in the setting of a young, febrile infant presenting with bronchiolitis. Nonselective work-up for SBI appeared to be routine in the studies reviewed; the yield of work-up for bacteremia was extremely low (and zero for meningitis). Thus, investigations of blood and cerebrospinal fluid might be unnecessary in the uncomplicated patient.
Although it appears that UTIs do occur with reasonable frequency in this population, a primary limitation of the review is that the studies analyzed primarily used urine culture as a means of diagnosis without publication of urinalysis results. This increases the likelihood that UTI rates are overestimated in this population, as asymptomatic bacteriuria is a potential confounder.
Bottom line: Serious bacterial infection is rare in febrile young infants with bronchiolitis.
Citation: Ralston S, Hill V, Waters A. Occult serious bacterial infection in infants younger than 60 to 90 days with bronchiolitis: a systematic review. Arch Pediatr Adolesc Med. 2011;165(10):951-956.
Reviewed by Pediatric Editor Mark Shen, MD, FHM, medical director of hospital medicine at Dell Children’s Medical Center, Austin, Texas.
What Is the Appropriate Use of Antibiotics In Acute Exacerbations of COPD?

Case
A 58-year-old male smoker with moderate chronic obstructive pulmonary disease (COPD) (FEV1 56% predicted) is admitted with an acute exacerbation of COPD for the second time this year. He presented to the ED with increased productive cough and shortness of breath, similar to prior exacerbations. He denies fevers, myalgias, or upper-respiratory symptoms. Physical exam is notable for bilateral inspiratory and expiratory wheezing. His sputum is purulent. He is given continuous nebulizer therapy and one dose of oral prednisone, but his dyspnea and wheezing persist. Chest X-ray does not reveal an infiltrate.
Should this patient be treated with antibiotics and, if so, what regimen is most appropriate?
Overview
Acute exacerbations of COPD (AECOPD) present a major health burden, accounting for more than 2.4% of all hospital admissions and causing significant morbidity, mortality, and costs.1 During 2006 and 2007, COPD mortality in the United States topped 39 deaths per 100,000 people, and more recently, hospital costs related to COPD were expected to exceed $13 billion annually.2 Patients with AECOPD also experience decreased quality of life and faster decline in pulmonary function, further highlighting the need for timely and appropriate treatment.1
Several guidelines have proposed treatment strategies now considered standard of care in AECOPD management.3,4,5,6 These include the use of corticosteroids, bronchodilator agents, and, in select cases, antibiotics. While there is well-established evidence for the use of steroids and bronchodilators in AECOPD, the debate continues over the appropriate use of antibiotics in the treatment of acute exacerbations. There are multiple potential factors leading to AECOPD, including viruses, bacteria, and common pollutants; as such, antibiotic treatment may not be indicated for all patients presenting with exacerbations. Further, the risks of antibiotic treatment—including adverse drug events, selection for drug-resistant bacteria, and associated costs—are not insignificant.
However, bacterial infections do play a role in approximately 50% of patients with AECOPD and, for this population, use of antibiotics may confer important benefits.7
Interestingly, a retrospective cohort study of 84,621 patients admitted for AECOPD demonstrated that 85% of patients received antibiotics at some point during hospitalization.8
Support for Antibiotics
Several randomized trials have compared clinical outcomes in patients with AECOPD who have received antibiotics versus those who received placebos. Most of these had small sample sizes and studied only ββ-lactam and tetracycline antibiotics in an outpatient setting; there are limited data involving inpatients and newer drugs. Nevertheless, antibiotic treatment has been associated with decreased risk of adverse outcomes in AECOPD.
One meta-analysis demonstrated that antibiotics reduced treatment failures by 66% and in-hospital mortality by 78% in the subset of trials involving hospitalized patients.8 Similarly, analysis of a large retrospective cohort of patients hospitalized for AECOPD found a significantly lower risk of treatment failure in antibiotic-treated versus untreated patients.9 Specifically, treated patients had lower rates of in-hospital mortality and readmission for AECOPD and a lower likelihood of requiring subsequent mechanical ventilation during the index hospitalization.
Data also suggest that antibiotic treatment during exacerbations might favorably impact subsequent exacerbations.10 A retrospective study of 18,928 Dutch patients with AECOPD compared outcomes among patients who had received antibiotics (most frequently doxycycline or a penicillin) as part of their therapy to those who did not. The authors demonstrated that the median time to the next exacerbation was significantly longer in the patients receiving antibiotics.10 Further, both mortality and overall risk of developing a subsequent exacerbation were significantly decreased in the antibiotic group, with median follow-up of approximately two years.
Indications for Antibiotics
Clinical symptoms. A landmark study by Anthonisen and colleagues set forth three clinical criteria that have formed the basis for treating AECOPD with antibiotics in subsequent studies and in clinical practice.11 Often referred to as the “cardinal symptoms” of AECOPD, these include increased dyspnea, sputum volume, and sputum purulence. In this study, 173 outpatients with COPD were randomized to a 10-day course of antibiotics or placebo at onset of an exacerbation and followed clinically. The authors found that antibiotic-treated patients were significantly more likely than the placebo group to achieve treatment success, defined as resolution of all exacerbated symptoms within 21 days (68.1% vs. 55.0%, P<0.01).
Importantly, treated patients were also significantly less likely to experience clinical deterioration after 72 hours (9.9% vs. 18.9%, P<0.05). Patients with Type I exacerbations, characterized by all three cardinal symptoms, were most likely to benefit from antibiotic therapy, followed by patients with Type II exacerbations, in whom only two of the symptoms were present. Subsequent studies have suggested that sputum purulence correlates well with the presence of acute bacterial infection and therefore may be a reliable clinical indicator of patients who are likely to benefit from antibiotic therapy.12
Laboratory data. While sputum purulence is associated with bacterial infection, sputum culture is less reliable, as pathogenic bacteria are commonly isolated from patients with both AECOPD and stable COPD. In fact, the prevalence of bacterial colonization in moderate to severe COPD might be as high as 50%.13 Therefore, a positive bacterial sputum culture, in the absence of purulence or other signs of infection, is not recommended as the sole basis for which to prescribe antibiotics.
Serum biomarkers, most notably C-reactive protein (CRP) and procalcitonin, have been studied as a newer approach to identify patients who might benefit from antibiotic therapy for AECOPD. Studies have demonstrated increased CRP levels during AECOPD, particularly in patients with purulent sputum and positive bacterial sputum cultures.12 Procalcitonin is preferentially elevated in bacterial infections.
One randomized, placebo-controlled trial in hospitalized patients with AECOPD demonstrated a significant reduction in antibiotic usage based on low procalcitonin levels, without negatively impacting clinical success rate, hospital mortality, subsequent antibiotic needs, or time to next exacerbation.14 However, due to inconsistent evidence, use of these markers to guide antibiotic administration in AECOPD has not yet been definitively established.14,15 Additionally, these laboratory results are often not available at the point of care, potentially limiting their utility in the decision to initiate antibiotics.
Severity of illness. Severity of illness is an important factor in the decision to treat AECOPD with antibiotics. Patients with advanced, underlying airway obstruction, as measured by FEV1, are more likely to have a bacterial cause of AECOPD.16 Additionally, baseline clinical characteristics including advanced age and comorbid conditions, particularly cardiovascular disease and diabetes, increase the risk of severe exacerbations.17
One meta-analysis of placebo-controlled trials found that patients with severe exacerbations were likely to benefit from antibiotic therapy, while patients with mild or moderate exacerbations had no reduction in treatment failure or mortality rates.18 Patients presenting with acute respiratory failure necessitating intensive care and/or ventilator support (noninvasive or invasive) have also been shown to benefit from antibiotics.19
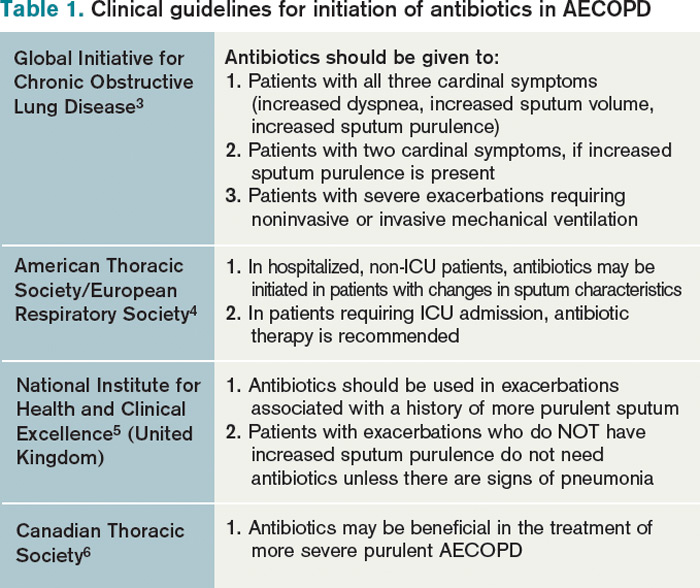
Current clinical guidelines vary slightly in their recommendations regarding when to give antibiotics in AECOPD (see Table 1). However, existing evidence favors antibiotic treatment for those patients presenting with two or three cardinal symptoms, specifically those with increased sputum purulence, and those with severe disease (i.e. pre-existing advanced airflow obstruction and/or exacerbations requiring mechanical ventilation). Conversely, studies have shown that many patients, particularly those with milder exacerbations, experience resolution of symptoms without antibiotic treatment.11,18

Antibiotic Choice in AECOPD
Risk stratification. In patients likely to benefit from antibiotic therapy, an understanding of the relationship between severity of COPD, host risk factors for poor outcomes, and microbiology is paramount to guide clinical decision-making. Historically, such bacteria as Haemophilus influenzae, Streptococcus pneumoniae, and Moraxella catarrhalis have been implicated in the pathogenesis of AECOPD.3,7 In patients with simple exacerbations, antibiotics that target these pathogens should be used (see Table 2).
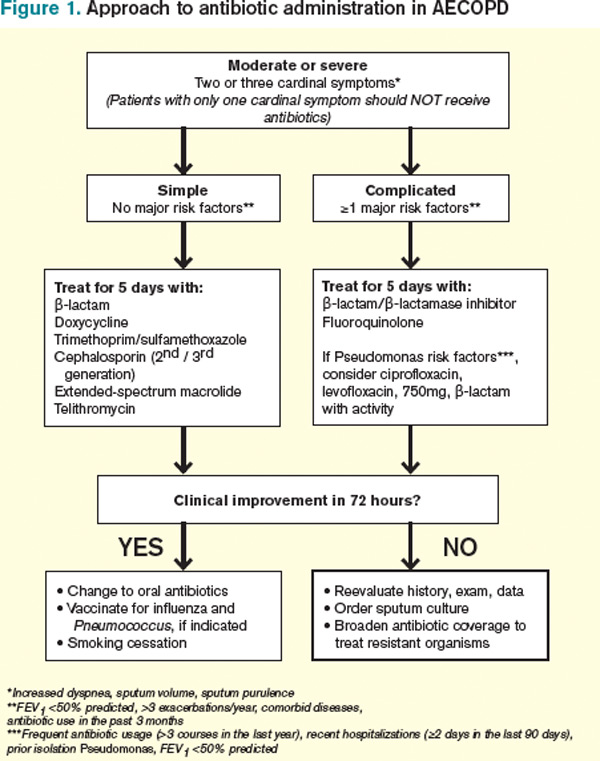
However, patients with more severe underlying airway obstruction (i.e. FEV1<50%) and risk factors for poor outcomes, specifically recent hospitalization (≥2 days during the previous 90 days), frequent antibiotics (>3 courses during the previous year), and severe exacerbations are more likely to be infected with resistant strains or gram-negative organisms.3,7 Pseudomonas aeruginosa, in particular, is of increasing concern in this population. In patients with complicated exacerbations, more broad-coverage, empiric antibiotics should be initiated (see Table 2).
With this in mind, patients meeting criteria for treatment must first be stratified according to the severity of COPD and risk factors for poor outcomes before a decision regarding a specific antibiotic is reached. Figure 1 outlines a recommended approach for antibiotic administration in AECOPD. The optimal choice of antibiotics must consider cost-effectiveness, local patterns of antibiotic resistance, tissue penetration, patient adherence, and risk of such adverse drug events as diarrhea.
Comparative effectiveness. Current treatment guidelines do not favor the use of any particular antibiotic in simple AECOPD.3,4,5,6 However, as selective pressure has led to in vitro resistance to antibiotics traditionally considered first-line (e.g. doxycycline, trimethoprim/sulfamethoxazole, amoxicillin), the use of second-line antibiotics (e.g. fluoroquinolones, macrolides, cephalosporins, β-lactam/ β-lactamase inhibitors) has increased. Consequently, several studies have compared the effectiveness of different antimicrobial regimens.
One meta-analysis found that second-line antibiotics, when compared with first-line agents, provided greater clinical improvement to patients with AECOPD, without significant differences in mortality, microbiologic eradication, or incidence of adverse drug events.20 Among the subgroup of trials enrolling hospitalized patients, the clinical effectiveness of second-line agents remained significantly greater than that of first-line agents.
Another meta-analysis compared trials that studied only macrolides, quinolones, and amoxicillin-clavulanate and found no difference in terms of short-term clinical effectiveness; however, there was weak evidence to suggest that quinolones were associated with better microbiological success and fewer recurrences of AECOPD.21 Fluoroquinolones are preferred in complicated cases of AECOPD in which there is a greater risk for enterobacteriaceae and Pseudomonas species.3,7
Antibiotic Duration
The duration of antibiotic therapy in AECOPD has been studied extensively, with randomized controlled trials consistently demonstrating no additional benefit to courses extending beyond five days. One meta-analysis of 21 studies found similar clinical and microbiologic cure rates among patients randomized to antibiotic treatment for ≤5 days versus >5 days.22 A subgroup analysis of the trials evaluating different durations of the same antibiotic also demonstrated no difference in clinical effectiveness, and this finding was confirmed in a separate meta-analysis.22,23
Advantages to shorter antibiotic courses include improved compliance and decreased rates of resistance. The usual duration of antibiotic therapy is three to seven days, depending upon the response to therapy.3
Back to the Case
As the patient has no significant comorbidities or risk factors, and meets criteria for a simple Anthonisen Type I exacerbation (increased dyspnea, sputum, and sputum purulence), antibiotic therapy with trimethoprim/sulfamethoxazole is initiated on admission, in addition to the previously started steroid and bronchodilator treatments. The patient’s clinical status improves, and he is discharged on hospital Day 3 with a prescription to complete a five-day course of antibiotics.
Bottom Line
Antibiotic therapy is effective in select AECOPD patients, with maximal benefits obtained when the decision to treat is based on careful consideration of characteristic clinical symptoms and severity of illness. Choice and duration of antibiotics should follow likely bacterial causes and current guidelines.
Dr. Cunningham is an assistant professor of internal medicine and academic hospitalist in the section of hospital medicine at Vanderbilt University School of Medicine in Nashville, Tenn. Dr. LaBrin is assistant professor of internal medicine and pediatrics and an academic hospitalist at Vanderbilt. Dr. Markley is a clinical instructor and academic hospitalist at Vanderbilt.
References
- Donaldson GC, Wedzicha JA. COPD exacerbations: 1. Epidemiology. Thorax. 2006;61:164-168.
- National Heart, Lung, and Blood Institute. 2009 NHLBI Morbidity and Mortality Chartbook. National Heart, Lung, and Blood Institute website. Available at: http://www.nhlbi.nih.gov/resources/docs/cht-book.htm Accessed Oct. 10, 2011.
- Global Initiative for Chronic Obstructive Lung Disease (GOLD). Global Strategy for the Diagnosis, Management and Prevention of Chronic Obstructive Pulmonary Disease. Global Initiative for Chronic Obstructive Lung Disease (GOLD) website. Available at: www.goldcopd.org/guidelines-resources.html Accessed Oct. 10, 2011.
- Celli BR, MacNee W, Agusti A, et al. Standards for the diagnosis and treatment of patients with COPD: a summary of the ATS/ERS position paper. Eur Resp J. 2004;23:932-946.
- National Clinical Guideline Centre. Chronic obstructive pulmonary disease: management of chronic obstructive pulmonary disease in adults in primary and secondary care. National Institute for Health and Clinical Excellence website. Available at: http://guidance.nice.org.uk/CG101/Guidance/pdf/English. Accessed Oct. 10, 2011.
- O’Donnell DE, Aaron S, Bourbeau J, et al. Canadian Thoracic Society recommendations for management of chronic obstructive pulmonary disease—2007 update. Can Respir J. 2007;14(Suppl B):5B-32B.
- Sethi S, Murphy TF. Infection in the pathogenesis and course of chronic obstructive pulmonary disease. N Engl J Med. 2008;359:2355-2565.
- Quon BS, Qi Gan W, Sin DD. Contemporary management of acute exacerbations of COPD: a systematic review and metaanalysis. Chest. 2008;133:756-766.
- Rothberg MB, Pekow PS, Lahti M, Brody O, Skiest DJ, Lindenauer PK. Antibiotic therapy and treatment failure in patients hospitalized for acute exacerbations of chronic obstructive pulmonary disease. JAMA. 2010;303:2035-2042.
- Roede BM, Bresser P, Bindels PJE, et al. Antibiotic treatment is associated with reduced risk of subsequent exacerbation in obstructive lung disease: a historical population based cohort study. Thorax. 2008;63:968-973.
- Anthonisen NR, Manfreda J, Warren CP, Hershfield ES, Harding GKM, Nelson NA. Antibiotic therapy in exacerbations of chronic obstructive pulmonary disease. Ann Intern Med. 1987;106:196-204.
- Stockley RA, O’Brien C, Pye A, Hill SL. Relationship of sputum color to nature and outpatient management of acute exacerbations of COPD. Chest. 2000;117:1638-1645.
- Rosell A, Monso E, Soler N, et al. Microbiologic determinants of exacerbation in chronic obstructive pulmonary disease. Arch Intern Med. 2005; 165:891-897.
- Stolz D, Christ-Crain M, Bingisser R, et al. Antibiotic treatment of exacerbations of COPD: a randomized, controlled trial comparing procalcitonin-guidance with standard therapy. Chest. 2007;131:9-19.
- Daniels JMA, Schoorl M, Snijders D, et al. Procalcitonin vs C-reactive protein as predictive markers of response to antibiotic therapy in acute exacerbations of COPD. Chest. 2010;138:1108-1015.
- Miravitlles M, Espinosa C, Fernandez-Laso E, Martos JA, Maldonado JA, Gallego M. Relationship between bacterial flora in sputum and functional impairment in patients with acute exacerbations of COPD. Chest. 1999;116:40-46.
- Patil SP, Krishnan JA, Lechtzin N, Diette GB. In-hospital mortality following acute exacerbations of chronic obstructive pulmonary disease. Arch Intern Med. 2003;163:1180-1186.
- Puhan MA, Vollenweider D, Latshang T, Steurer J, Steurer-Stey C. Exacerbations of chronic obstructive lung disease: when are antibiotics indicated? A systematic review. Resp Res. 2007;8:30-40.
- Nouira S, Marghli S, Belghith M, Besbes L, Elatrous S, Abroug F. Once daily ofloxacin in chronic obstructive pulmonary disease exacerbation requiring mechanical ventilation: a randomized placebo-controlled trial. Lancet. 2001;358:2020-2025.
- Dimopoulos G, Siempos II, Korbila IP, Manta KG, Falagas ME. Comparison of first-line with second-line antibiotics for acute exacerbations of chronic bronchitis: a metaanalysis of randomized controlled trials. Chest. 2007;132:447-455.
- Siempos II, Dimopoulos G, Korbila IP, Manta KG, Falagas ME. Macrolides, quinolones and amoxicillin/clavulanate for chronic bronchitis: a meta-analysis. Eur Resp J. 2007;29:1127-1137.
- El-Moussaoui, Roede BM, Speelman P, Bresser P, Prins JM, Bossuyt PMM. Short-course antibiotic treatment in acute exacerbations of chronic bronchitis and COPD: a meta-analysis of double-blind studies. Thorax. 2008;63:415-422.
- Falagas ME, Avgeri SG, Matthaiou DK, Dimopoulos G, Siempos II. Short- versus long-duration antimicrobial treatment for exacerbations of chronic bronchitis: a meta-analysis. J Antimicrob Chemother. 2008;62:442-450.
Case
A 58-year-old male smoker with moderate chronic obstructive pulmonary disease (COPD) (FEV1 56% predicted) is admitted with an acute exacerbation of COPD for the second time this year. He presented to the ED with increased productive cough and shortness of breath, similar to prior exacerbations. He denies fevers, myalgias, or upper-respiratory symptoms. Physical exam is notable for bilateral inspiratory and expiratory wheezing. His sputum is purulent. He is given continuous nebulizer therapy and one dose of oral prednisone, but his dyspnea and wheezing persist. Chest X-ray does not reveal an infiltrate.
Should this patient be treated with antibiotics and, if so, what regimen is most appropriate?
Overview
Acute exacerbations of COPD (AECOPD) present a major health burden, accounting for more than 2.4% of all hospital admissions and causing significant morbidity, mortality, and costs.1 During 2006 and 2007, COPD mortality in the United States topped 39 deaths per 100,000 people, and more recently, hospital costs related to COPD were expected to exceed $13 billion annually.2 Patients with AECOPD also experience decreased quality of life and faster decline in pulmonary function, further highlighting the need for timely and appropriate treatment.1
Several guidelines have proposed treatment strategies now considered standard of care in AECOPD management.3,4,5,6 These include the use of corticosteroids, bronchodilator agents, and, in select cases, antibiotics. While there is well-established evidence for the use of steroids and bronchodilators in AECOPD, the debate continues over the appropriate use of antibiotics in the treatment of acute exacerbations. There are multiple potential factors leading to AECOPD, including viruses, bacteria, and common pollutants; as such, antibiotic treatment may not be indicated for all patients presenting with exacerbations. Further, the risks of antibiotic treatment—including adverse drug events, selection for drug-resistant bacteria, and associated costs—are not insignificant.
However, bacterial infections do play a role in approximately 50% of patients with AECOPD and, for this population, use of antibiotics may confer important benefits.7
Interestingly, a retrospective cohort study of 84,621 patients admitted for AECOPD demonstrated that 85% of patients received antibiotics at some point during hospitalization.8
Support for Antibiotics
Several randomized trials have compared clinical outcomes in patients with AECOPD who have received antibiotics versus those who received placebos. Most of these had small sample sizes and studied only ββ-lactam and tetracycline antibiotics in an outpatient setting; there are limited data involving inpatients and newer drugs. Nevertheless, antibiotic treatment has been associated with decreased risk of adverse outcomes in AECOPD.
One meta-analysis demonstrated that antibiotics reduced treatment failures by 66% and in-hospital mortality by 78% in the subset of trials involving hospitalized patients.8 Similarly, analysis of a large retrospective cohort of patients hospitalized for AECOPD found a significantly lower risk of treatment failure in antibiotic-treated versus untreated patients.9 Specifically, treated patients had lower rates of in-hospital mortality and readmission for AECOPD and a lower likelihood of requiring subsequent mechanical ventilation during the index hospitalization.
Data also suggest that antibiotic treatment during exacerbations might favorably impact subsequent exacerbations.10 A retrospective study of 18,928 Dutch patients with AECOPD compared outcomes among patients who had received antibiotics (most frequently doxycycline or a penicillin) as part of their therapy to those who did not. The authors demonstrated that the median time to the next exacerbation was significantly longer in the patients receiving antibiotics.10 Further, both mortality and overall risk of developing a subsequent exacerbation were significantly decreased in the antibiotic group, with median follow-up of approximately two years.
Indications for Antibiotics
Clinical symptoms. A landmark study by Anthonisen and colleagues set forth three clinical criteria that have formed the basis for treating AECOPD with antibiotics in subsequent studies and in clinical practice.11 Often referred to as the “cardinal symptoms” of AECOPD, these include increased dyspnea, sputum volume, and sputum purulence. In this study, 173 outpatients with COPD were randomized to a 10-day course of antibiotics or placebo at onset of an exacerbation and followed clinically. The authors found that antibiotic-treated patients were significantly more likely than the placebo group to achieve treatment success, defined as resolution of all exacerbated symptoms within 21 days (68.1% vs. 55.0%, P<0.01).
Importantly, treated patients were also significantly less likely to experience clinical deterioration after 72 hours (9.9% vs. 18.9%, P<0.05). Patients with Type I exacerbations, characterized by all three cardinal symptoms, were most likely to benefit from antibiotic therapy, followed by patients with Type II exacerbations, in whom only two of the symptoms were present. Subsequent studies have suggested that sputum purulence correlates well with the presence of acute bacterial infection and therefore may be a reliable clinical indicator of patients who are likely to benefit from antibiotic therapy.12
Laboratory data. While sputum purulence is associated with bacterial infection, sputum culture is less reliable, as pathogenic bacteria are commonly isolated from patients with both AECOPD and stable COPD. In fact, the prevalence of bacterial colonization in moderate to severe COPD might be as high as 50%.13 Therefore, a positive bacterial sputum culture, in the absence of purulence or other signs of infection, is not recommended as the sole basis for which to prescribe antibiotics.
Serum biomarkers, most notably C-reactive protein (CRP) and procalcitonin, have been studied as a newer approach to identify patients who might benefit from antibiotic therapy for AECOPD. Studies have demonstrated increased CRP levels during AECOPD, particularly in patients with purulent sputum and positive bacterial sputum cultures.12 Procalcitonin is preferentially elevated in bacterial infections.
One randomized, placebo-controlled trial in hospitalized patients with AECOPD demonstrated a significant reduction in antibiotic usage based on low procalcitonin levels, without negatively impacting clinical success rate, hospital mortality, subsequent antibiotic needs, or time to next exacerbation.14 However, due to inconsistent evidence, use of these markers to guide antibiotic administration in AECOPD has not yet been definitively established.14,15 Additionally, these laboratory results are often not available at the point of care, potentially limiting their utility in the decision to initiate antibiotics.
Severity of illness. Severity of illness is an important factor in the decision to treat AECOPD with antibiotics. Patients with advanced, underlying airway obstruction, as measured by FEV1, are more likely to have a bacterial cause of AECOPD.16 Additionally, baseline clinical characteristics including advanced age and comorbid conditions, particularly cardiovascular disease and diabetes, increase the risk of severe exacerbations.17
One meta-analysis of placebo-controlled trials found that patients with severe exacerbations were likely to benefit from antibiotic therapy, while patients with mild or moderate exacerbations had no reduction in treatment failure or mortality rates.18 Patients presenting with acute respiratory failure necessitating intensive care and/or ventilator support (noninvasive or invasive) have also been shown to benefit from antibiotics.19
Current clinical guidelines vary slightly in their recommendations regarding when to give antibiotics in AECOPD (see Table 1). However, existing evidence favors antibiotic treatment for those patients presenting with two or three cardinal symptoms, specifically those with increased sputum purulence, and those with severe disease (i.e. pre-existing advanced airflow obstruction and/or exacerbations requiring mechanical ventilation). Conversely, studies have shown that many patients, particularly those with milder exacerbations, experience resolution of symptoms without antibiotic treatment.11,18
Antibiotic Choice in AECOPD
Risk stratification. In patients likely to benefit from antibiotic therapy, an understanding of the relationship between severity of COPD, host risk factors for poor outcomes, and microbiology is paramount to guide clinical decision-making. Historically, such bacteria as Haemophilus influenzae, Streptococcus pneumoniae, and Moraxella catarrhalis have been implicated in the pathogenesis of AECOPD.3,7 In patients with simple exacerbations, antibiotics that target these pathogens should be used (see Table 2).
However, patients with more severe underlying airway obstruction (i.e. FEV1<50%) and risk factors for poor outcomes, specifically recent hospitalization (≥2 days during the previous 90 days), frequent antibiotics (>3 courses during the previous year), and severe exacerbations are more likely to be infected with resistant strains or gram-negative organisms.3,7 Pseudomonas aeruginosa, in particular, is of increasing concern in this population. In patients with complicated exacerbations, more broad-coverage, empiric antibiotics should be initiated (see Table 2).
With this in mind, patients meeting criteria for treatment must first be stratified according to the severity of COPD and risk factors for poor outcomes before a decision regarding a specific antibiotic is reached. Figure 1 outlines a recommended approach for antibiotic administration in AECOPD. The optimal choice of antibiotics must consider cost-effectiveness, local patterns of antibiotic resistance, tissue penetration, patient adherence, and risk of such adverse drug events as diarrhea.
Comparative effectiveness. Current treatment guidelines do not favor the use of any particular antibiotic in simple AECOPD.3,4,5,6 However, as selective pressure has led to in vitro resistance to antibiotics traditionally considered first-line (e.g. doxycycline, trimethoprim/sulfamethoxazole, amoxicillin), the use of second-line antibiotics (e.g. fluoroquinolones, macrolides, cephalosporins, β-lactam/ β-lactamase inhibitors) has increased. Consequently, several studies have compared the effectiveness of different antimicrobial regimens.
One meta-analysis found that second-line antibiotics, when compared with first-line agents, provided greater clinical improvement to patients with AECOPD, without significant differences in mortality, microbiologic eradication, or incidence of adverse drug events.20 Among the subgroup of trials enrolling hospitalized patients, the clinical effectiveness of second-line agents remained significantly greater than that of first-line agents.
Another meta-analysis compared trials that studied only macrolides, quinolones, and amoxicillin-clavulanate and found no difference in terms of short-term clinical effectiveness; however, there was weak evidence to suggest that quinolones were associated with better microbiological success and fewer recurrences of AECOPD.21 Fluoroquinolones are preferred in complicated cases of AECOPD in which there is a greater risk for enterobacteriaceae and Pseudomonas species.3,7
Antibiotic Duration
The duration of antibiotic therapy in AECOPD has been studied extensively, with randomized controlled trials consistently demonstrating no additional benefit to courses extending beyond five days. One meta-analysis of 21 studies found similar clinical and microbiologic cure rates among patients randomized to antibiotic treatment for ≤5 days versus >5 days.22 A subgroup analysis of the trials evaluating different durations of the same antibiotic also demonstrated no difference in clinical effectiveness, and this finding was confirmed in a separate meta-analysis.22,23
Advantages to shorter antibiotic courses include improved compliance and decreased rates of resistance. The usual duration of antibiotic therapy is three to seven days, depending upon the response to therapy.3
Back to the Case
As the patient has no significant comorbidities or risk factors, and meets criteria for a simple Anthonisen Type I exacerbation (increased dyspnea, sputum, and sputum purulence), antibiotic therapy with trimethoprim/sulfamethoxazole is initiated on admission, in addition to the previously started steroid and bronchodilator treatments. The patient’s clinical status improves, and he is discharged on hospital Day 3 with a prescription to complete a five-day course of antibiotics.
Bottom Line
Antibiotic therapy is effective in select AECOPD patients, with maximal benefits obtained when the decision to treat is based on careful consideration of characteristic clinical symptoms and severity of illness. Choice and duration of antibiotics should follow likely bacterial causes and current guidelines.
Dr. Cunningham is an assistant professor of internal medicine and academic hospitalist in the section of hospital medicine at Vanderbilt University School of Medicine in Nashville, Tenn. Dr. LaBrin is assistant professor of internal medicine and pediatrics and an academic hospitalist at Vanderbilt. Dr. Markley is a clinical instructor and academic hospitalist at Vanderbilt.
References
- Donaldson GC, Wedzicha JA. COPD exacerbations: 1. Epidemiology. Thorax. 2006;61:164-168.
- National Heart, Lung, and Blood Institute. 2009 NHLBI Morbidity and Mortality Chartbook. National Heart, Lung, and Blood Institute website. Available at: http://www.nhlbi.nih.gov/resources/docs/cht-book.htm Accessed Oct. 10, 2011.
- Global Initiative for Chronic Obstructive Lung Disease (GOLD). Global Strategy for the Diagnosis, Management and Prevention of Chronic Obstructive Pulmonary Disease. Global Initiative for Chronic Obstructive Lung Disease (GOLD) website. Available at: www.goldcopd.org/guidelines-resources.html Accessed Oct. 10, 2011.
- Celli BR, MacNee W, Agusti A, et al. Standards for the diagnosis and treatment of patients with COPD: a summary of the ATS/ERS position paper. Eur Resp J. 2004;23:932-946.
- National Clinical Guideline Centre. Chronic obstructive pulmonary disease: management of chronic obstructive pulmonary disease in adults in primary and secondary care. National Institute for Health and Clinical Excellence website. Available at: http://guidance.nice.org.uk/CG101/Guidance/pdf/English. Accessed Oct. 10, 2011.
- O’Donnell DE, Aaron S, Bourbeau J, et al. Canadian Thoracic Society recommendations for management of chronic obstructive pulmonary disease—2007 update. Can Respir J. 2007;14(Suppl B):5B-32B.
- Sethi S, Murphy TF. Infection in the pathogenesis and course of chronic obstructive pulmonary disease. N Engl J Med. 2008;359:2355-2565.
- Quon BS, Qi Gan W, Sin DD. Contemporary management of acute exacerbations of COPD: a systematic review and metaanalysis. Chest. 2008;133:756-766.
- Rothberg MB, Pekow PS, Lahti M, Brody O, Skiest DJ, Lindenauer PK. Antibiotic therapy and treatment failure in patients hospitalized for acute exacerbations of chronic obstructive pulmonary disease. JAMA. 2010;303:2035-2042.
- Roede BM, Bresser P, Bindels PJE, et al. Antibiotic treatment is associated with reduced risk of subsequent exacerbation in obstructive lung disease: a historical population based cohort study. Thorax. 2008;63:968-973.
- Anthonisen NR, Manfreda J, Warren CP, Hershfield ES, Harding GKM, Nelson NA. Antibiotic therapy in exacerbations of chronic obstructive pulmonary disease. Ann Intern Med. 1987;106:196-204.
- Stockley RA, O’Brien C, Pye A, Hill SL. Relationship of sputum color to nature and outpatient management of acute exacerbations of COPD. Chest. 2000;117:1638-1645.
- Rosell A, Monso E, Soler N, et al. Microbiologic determinants of exacerbation in chronic obstructive pulmonary disease. Arch Intern Med. 2005; 165:891-897.
- Stolz D, Christ-Crain M, Bingisser R, et al. Antibiotic treatment of exacerbations of COPD: a randomized, controlled trial comparing procalcitonin-guidance with standard therapy. Chest. 2007;131:9-19.
- Daniels JMA, Schoorl M, Snijders D, et al. Procalcitonin vs C-reactive protein as predictive markers of response to antibiotic therapy in acute exacerbations of COPD. Chest. 2010;138:1108-1015.
- Miravitlles M, Espinosa C, Fernandez-Laso E, Martos JA, Maldonado JA, Gallego M. Relationship between bacterial flora in sputum and functional impairment in patients with acute exacerbations of COPD. Chest. 1999;116:40-46.
- Patil SP, Krishnan JA, Lechtzin N, Diette GB. In-hospital mortality following acute exacerbations of chronic obstructive pulmonary disease. Arch Intern Med. 2003;163:1180-1186.
- Puhan MA, Vollenweider D, Latshang T, Steurer J, Steurer-Stey C. Exacerbations of chronic obstructive lung disease: when are antibiotics indicated? A systematic review. Resp Res. 2007;8:30-40.
- Nouira S, Marghli S, Belghith M, Besbes L, Elatrous S, Abroug F. Once daily ofloxacin in chronic obstructive pulmonary disease exacerbation requiring mechanical ventilation: a randomized placebo-controlled trial. Lancet. 2001;358:2020-2025.
- Dimopoulos G, Siempos II, Korbila IP, Manta KG, Falagas ME. Comparison of first-line with second-line antibiotics for acute exacerbations of chronic bronchitis: a metaanalysis of randomized controlled trials. Chest. 2007;132:447-455.
- Siempos II, Dimopoulos G, Korbila IP, Manta KG, Falagas ME. Macrolides, quinolones and amoxicillin/clavulanate for chronic bronchitis: a meta-analysis. Eur Resp J. 2007;29:1127-1137.
- El-Moussaoui, Roede BM, Speelman P, Bresser P, Prins JM, Bossuyt PMM. Short-course antibiotic treatment in acute exacerbations of chronic bronchitis and COPD: a meta-analysis of double-blind studies. Thorax. 2008;63:415-422.
- Falagas ME, Avgeri SG, Matthaiou DK, Dimopoulos G, Siempos II. Short- versus long-duration antimicrobial treatment for exacerbations of chronic bronchitis: a meta-analysis. J Antimicrob Chemother. 2008;62:442-450.
Hospitalist/Nurse Collaboration Drives Multidisciplinary Rounding
Aultidisciplinary patient rounding system implemented on a non-teaching hospitalist unit at the Ohio State University Medical Center (OSUMC) has been well received by unit staff, according to an HM11 abstract presentation. Key to its success, says lead author and OSUMC hospitalist Eric Schumacher, DO, MBA, was to involve nursing staff from the start and to work closely with the unit’s nurse manager and charge nurse.
“Once we got their buy-in, we proposed what we wanted to do and asked for their suggestions,” Dr. Schumacher says.
Hospitalists partner with the nurse leaders to establish a morning bedside rounding process on the unit, using a “Physician Nurse Rounding Sheet” for each hospitalist. The sheet is prepared daily by the charge nurse and unit clerks, listing the hospitalist’s patients, assigned nurses, and phone numbers. A short debriefing is performed outside the patient’s room before each encounter, and a daily feedback sheet is given to the patient and family with a picture of the hospitalist, a list of all care-team members, and such information as goals for the day, pending tests and consultations, and anticipated discharge date.
“Part of the challenge is to create a process that is efficient for both doctors and nurses, given multiple nurses caring for multiple patients,” Dr. Schumacher says.
Charge nurses or nursing managers provide backup when the bedside nurse is not available for bedside rounding. “Right now we’re rounding with hospitalists and nurses only, but a long-term goal is to expand it to include the social worker and other ancillary professionals,” he says.
Preliminary data on the project show the feasibility of multidisciplinary rounding, with elevated Press Ganey patient satisfaction scores on the unit in the first two months after rounding began. In the third month, compliance with rounding went down, and so did satisfaction scores, but with a renewed commitment the following month, scores went back up again. Subjective reports from hospitalists also suggest fewer interruptions during the day from nursing pages, Dr. Schumacher says.
Adverse Events and Rural Discharges
The Center on Patient Safety at Florida State University College of Medicine in Tallahassee has been awarded a two-year, $908,000 grant from the federal Agency for Healthcare Research and Quality to study adverse events during the three weeks following hospital discharge, both for urban patients and, for the first time, those returning to rural settings.
Center director Dennis Tsilimingras, MD, MPH, says the project will enroll 600 patients, half urban and half rural, discharged by the Tallahassee Memorial Hospitalist Group, and track injuries resulting from medical errors, including medication errors, procedure-related injuries, nosocomial infections, and pressure ulcers.
Errors or injuries to patients may occur in the hospital but not be identified until after the patient goes home, he says, and such errors could contribute to rehospitalizations. “Our hypothesis is that the rate of adverse events post-discharge may be greater among rural patients because they have less access to follow-up care,” he adds.
Dr. Tsilimingras will be working closely with hospitalists, and Phase 2 of the research will use the hospital’s post-discharge transitional care clinic (see “Is a Post-Discharge Clinic in Your Hospital’s Future?,” December 2011) as an intervention strategy.
The eventual goal is to develop a screening tool to flag risk for post-discharge adverse events and develop strategies to reduce post-discharge problems, including readmissions, a quarter of which may be related to post-discharge adverse events, Dr. Tsilimingras says. He encourages hospitalists to reevaluate their patients and review their charts at the time of discharge, to see if post-discharge problems loom, and to reach out to primary care physicians by telephone, rather than just sending discharge summaries.
Larry Beresford is a freelance writer in Oakland, Calif.
References
- Armellino D, Hussain E, Schilling ME, et al. Using high-technology to enforce low-technology safety measures: the use of third-party remote video auditing and real-time feedback in healthcare [published online ahead of print Nov. 21, 2011. Clin Infect Dis. doi;10.1093/cid/cir773.
- Fuller C, Savage J, Besser S, et al. “The dirty handin the latex glove”: a study of hand hygiene compliance when gloves are worn. Infect Control Hosp Epidemiol. 2011;32(12):1194-1199.
Hand Hygiene Makes Headlines
Recent efforts to raise awareness about proper hand hygiene in health facilities in order to prevent disease transmission, range from the ScrubUp! campaign in Ohio to the World Health Organization’s global Clean Care is Safer Care campaign (www.who.int/gpsc/en/), which advocates for improving hand hygiene practices of health care workers around the world.
Twenty hospitals in Central Ohio staged ScrubUp! rallies on Dec. 5, 2011, during National Handwashing Awareness Week, not only to raise awareness of the hospitals’ commitment to hand hygiene, but also to encourage hospital visitors to wash their hands. The Ohio Hospital Association estimates that 50,000 people were exposed to these messages via a full-page ad in the Columbus Dispatch, overhead announcements and distribution tables in each hospital, handing out hand sanitizers to visitors, and engaging staff with humor, food, and prizes.
A recent study conducted at North Shore University Hospital in Manhasset, N.Y., found that hand hygiene compliance rates improve when remote video auditing platforms provide professionals with continuous feedback.1 During 16 weeks of real-time feedback on compliance with strict hand hygiene (i.e. within 10 seconds of entering/leaving patients’ rooms) via LED screens mounted on the walls of a MICU, compliance jumped to more than 80%.
A British study of 7,000 contacts in ICUs and geriatric units found that wearing latex gloves may discourage guideline-recommended hand washing, even though such failures to wash may contribute to spreading disease.2 Compliance was 47.7% without gloves, and 41% with gloves.
One of the study’s authors calls for further study of the behavioral reasons why healthcare workers are less likely to wash their hands when gloved, but urges that hand hygiene associated with gloving be part of educational campaigns.
By the Numbers: 57
Percentage of responding physicians who say they are using electronic health records (EHR), according to a survey of 10,000 office-based physicians by the National Center for Health Statistics, up from 51% usage in 2010. More than half say they intend to apply for meaningful use incentives offered by the government for implementing EHR, and 43% of those respondents report having computerized systems meeting Stage 1 Core Set criteria to qualify.
Percentage of responding physicians who say they are using electronic health records (EHR), according to a survey of 10,000 office-based physicians by the National Center for Health Statistics, up from 51% usage in 2010. More than half say they intend to apply for meaningful use incentives offered by the government for implementing EHR, and 43% of those respondents report having computerized systems meeting Stage 1 Core Set criteria to qualify.
Percentage of responding physicians who say they are using electronic health records (EHR), according to a survey of 10,000 office-based physicians by the National Center for Health Statistics, up from 51% usage in 2010. More than half say they intend to apply for meaningful use incentives offered by the government for implementing EHR, and 43% of those respondents report having computerized systems meeting Stage 1 Core Set criteria to qualify.