User login
Risk factors for postop cardiac events differ between vascular and general surgery
Predictive risk factors for cardiac events (CEs) after general and vascular surgery differed significantly, according to a large retrospective study. However, there was no significant difference seen in the overall incidence of CEs between the two types of surgery, reported Derrick Acheampong, MD, and his colleagues at the Icahn School of Medicine at Mount Sinai, New York.

They performed a retrospective data analysis of 8,441 adult patients at their large urban teaching hospital; these patients had undergone general or vascular surgery during 2013-2016 and, in the analysis, were grouped by whether they experienced postoperative CEs.
Univariate and multivariate analyses identified predictors of postoperative CE and the association of CEs with adverse postoperative outcomes. CEs were defined as myocardial infarction or cardiac arrest within the 30-day postoperative period.
A total of 157 patients (1.9%) experienced CEs after major general and vascular surgery, with no significant difference in incidence between the two types of surgery (P = .44), according to their report, published online in the Annals of Medicine and Surgery. CE-associated mortality among this group was high, at 55.4%.
The occurrence of a CE following surgery in both groups was significantly associated with increased mortality, as well as pulmonary, renal, and neurological complications, in addition to systemic sepsis, postoperative red blood cell transfusion, unplanned return to the operating room, and prolonged hospitalization, according to the researchers.
However, predictors of CEs risk between vascular and general surgery were significantly different.
For general surgery, American Society of Anesthesiologists (ASA) status greater than 3, dependent functional status, acute renal failure or dialysis, weight loss, creatinine greater than 1.2 mg/dL, international normalized ratio (INR) greater than 1.5, and partial thromboplastin time (PTT) less than 35 seconds were all unique independent predictors of postoperative CEs.
For vascular surgery, the unique significant predictors of postoperative CEs were age greater than 65 years, emergency surgery, diabetes, congestive heart failure, systemic sepsis, and operative time greater than 240 minutes.
The only common predictive risk factors for postoperative CEs for the two forms of surgery were hematocrit less than 34% and ventilator dependence.
“The present study corroborates reported studies that recommend separate predictive CE risk indices and risk stratification among different surgical specialties. Predictors for CE greatly differed between general and vascular surgery patients in our patient population,” the authors stated.
They concluded with the hope that their study “provides useful information to surgeons and allows for the necessary resources to be focused on identified at-risk patients to improve surgical outcomes.”
Dr. Acheampong and his colleagues reported having no disclosures.
SOURCE: Acheampong D et al. Ann Med Surg. 2018. doi: 10.1016/j.amsu.2018.08.001.
Predictive risk factors for cardiac events (CEs) after general and vascular surgery differed significantly, according to a large retrospective study. However, there was no significant difference seen in the overall incidence of CEs between the two types of surgery, reported Derrick Acheampong, MD, and his colleagues at the Icahn School of Medicine at Mount Sinai, New York.
They performed a retrospective data analysis of 8,441 adult patients at their large urban teaching hospital; these patients had undergone general or vascular surgery during 2013-2016 and, in the analysis, were grouped by whether they experienced postoperative CEs.
Univariate and multivariate analyses identified predictors of postoperative CE and the association of CEs with adverse postoperative outcomes. CEs were defined as myocardial infarction or cardiac arrest within the 30-day postoperative period.
A total of 157 patients (1.9%) experienced CEs after major general and vascular surgery, with no significant difference in incidence between the two types of surgery (P = .44), according to their report, published online in the Annals of Medicine and Surgery. CE-associated mortality among this group was high, at 55.4%.
The occurrence of a CE following surgery in both groups was significantly associated with increased mortality, as well as pulmonary, renal, and neurological complications, in addition to systemic sepsis, postoperative red blood cell transfusion, unplanned return to the operating room, and prolonged hospitalization, according to the researchers.
However, predictors of CEs risk between vascular and general surgery were significantly different.
For general surgery, American Society of Anesthesiologists (ASA) status greater than 3, dependent functional status, acute renal failure or dialysis, weight loss, creatinine greater than 1.2 mg/dL, international normalized ratio (INR) greater than 1.5, and partial thromboplastin time (PTT) less than 35 seconds were all unique independent predictors of postoperative CEs.
For vascular surgery, the unique significant predictors of postoperative CEs were age greater than 65 years, emergency surgery, diabetes, congestive heart failure, systemic sepsis, and operative time greater than 240 minutes.
The only common predictive risk factors for postoperative CEs for the two forms of surgery were hematocrit less than 34% and ventilator dependence.
“The present study corroborates reported studies that recommend separate predictive CE risk indices and risk stratification among different surgical specialties. Predictors for CE greatly differed between general and vascular surgery patients in our patient population,” the authors stated.
They concluded with the hope that their study “provides useful information to surgeons and allows for the necessary resources to be focused on identified at-risk patients to improve surgical outcomes.”
Dr. Acheampong and his colleagues reported having no disclosures.
SOURCE: Acheampong D et al. Ann Med Surg. 2018. doi: 10.1016/j.amsu.2018.08.001.
FROM ANNALS OF MEDICINE AND SURGERY
Key clinical point: There was a significant difference in predictive risk factors for postoperative cardiac events between vascular and general surgery.
Major finding: The 1.9% incidence of cardiac events following general or vascular surgery was associated with a mortality rate of 55%.
Study details: Retrospective study of 8,441 patients who underwent vascular or general surgery during 2013-2015.
Disclosures: The authors reported having no disclosures.
Source: Acheampong D et al. Ann Med Surg. 2018. doi: 10.1016/j.amsu.2018.08.001.
FDA attacks antibiotic resistance with new strategy
WASHINGTON – A strategy combining stewardship and science is needed to help combat antimicrobial resistance, and updated plans from the U.S. Food and Drug Administration include four key components to address all aspects of product development and use, FDA commissioner Scott Gottlieb, MD, said in a press briefing in Washington on Sept. 14.
“The FDA plays a unique role in advancing human and animal health” that provides a unique vantage point for coordinating all aspects of product development and application, he said.
The FDA’s comprehensive approach to the challenge of antimicrobial resistance (AMR) includes:
- Facilitating product development.
- Promoting antimicrobial stewardship.
- Supporting the development of new tools for surveillance.
- Advancing scientific initiatives, including research for the development of alternative treatments.
The FDA’s product development plan to combat AMR includes the creation of incentives for companies to develop new antibiotic products and create a robust pipeline, which is a challenge because of the lack of immediate economic gain, Dr. Gottlieb said.
“It necessary to change the perception that the costs and risks of antibiotic innovation are too high relative to their expected gains,” he emphasized.
Strategies to incentivize companies include fast track designation, priority review, and breakthrough therapy designation. In addition, the Limited Population Pathway for Antibacterial and Antifungal Drugs (LPAD) is designed to promote development of antimicrobial drugs for limited and underserved populations, Dr. Gottlieb said. The FDA plan also calls for pursuing reimbursement options with the Centers for Medicare & Medicaid Services.
Promoting antimicrobial stewardship remains an ongoing element of the FDA’s plan to reduce AMR. In conjunction with the release of the FDA’s updated approach to AMR, the FDA’s Center for Veterinary Medicine CVM released a 5-year action plan to promote and support antimicrobial stewardship in not only the agricultural arena, but in companion animals as well.
The FDA plans to bring all antimicrobials of medical importance that are approved for use in animals under the oversight of CVM, which will pursue the improve labeling on antimicrobial drugs used in the feed and water of food-producing animals, including defining durations of use, Dr. Gottlieb noted.
Supporting the development and improvement of surveillance tools is “essential to understanding the drivers of resistance in human and veterinary settings and formulating appropriate responses” to outbreaks, Dr. Gottlieb said.
To help meet this goal, the FDA will expand sampling via the National Antimicrobial Resistance Monitoring System (NARMS) database, he said. Other surveillance goals include supporting genomics research and expanding AMR monitoring to include pathogens associated with animal feed and companion animals, he added.
As part of the final component of the FDA’s AMR strategy to advance scientific initiatives, the FDA has released a new Request for Information “to obtain additional, external input on how best to develop an annual list of regulatory science initiatives specific for antimicrobial products,” Dr. Gottlieb announced. The FDA intends to use the information gained from clinicians and others in its creation of guidance documents and recommendations to streamline the antibiotic development process. He also cited the FDA’s ongoing support of partnerships with public and private organizations such as the Clinical Trials Transformation Initiative, which focuses on drug development for severe bacterial infections with current unmet medical need.
“We need to harness science and policy to help our public health systems and researchers become nimbler in the battle against drug-resistant pathogens,” Dr. Gottlieb concluded.
In a panel discussion following the briefing, several experts offered perspective on the FDA’s goals and on the challenges of AMR.
William Flynn, DVM, deputy director of science policy for the Center of Veterinary Medicine, noted some goals for reducing the use of antibiotics in the veterinary arena.
“We are trying to focus on the driver: What are the disease conditions that drive use of the product,” he said. Ideally, better management of disease conditions can reduce reliance on antibiotics, he added.
Also in the panel discussion, Steven Gitterman, MD, deputy director of the division of microbiology devices at the Center for Devices and Radiological Health, emphasized the value of sustainable trial databases so AMR research can continue on an ongoing basis. Finally, Carolyn Wilson, PhD, associate director of research at the Center for Biologics Evaluation and Research, noted that the FDA’s research and development efforts include antibiotic alternatives, including live biotherapeutic products, fecal microbiota transplantation, and bacteriophage therapy.
Visit www.fda.gov for a transcript of Dr. Gottlieb’s talk, and for the updated FDA website page with more details on the agency’s plans to combat antimicrobial resistance.
Dr. Gottlieb and the panelists had no financial conflicts to disclose.
Hospitalist NPs and PAs note progress
But remain underutilized
Nurse practitioners (NPs) and physician assistants (PAs) have become a more prominent part of the hospitalist workforce, and at many institutions, they account for a large proportion of patient care and have a powerful effect on a patient’s experience. But NP and PA roles in hospital medicine continue to evolve – and understanding what they do is still, at times, a work in progress.

One myth that persists regarding NPs and PAs is that, if you’ve seen one, you’ve seen them all.
At the 2018 Annual Conference of the Society of Hospital Medicine, Noam Shabani, MS, PA-C, lead physician assistant at Massachusetts General Hospital’s Hospital Medicine Unit, Boston, offered an example to help shatter this misperception.
Mr. Shabani described a 28-year-old woman who had a bachelor’s in biology with a premed track and spent 4 years as a paramedic before attending the physician assistant program at Duke University, Durham, N.C. As a new PA graduate, she was hired as a hospitalist at a community hospital in Kentucky.
Given this new PA’s clinical experience and formal education, there are certain skills she should bring to the table: the ability to develop a differential diagnosis and a good understanding of disease pathophysiology and the mechanisms of action of drugs. And because of her paramedic experience, she should be comfortable with making urgent clinical care decisions and should be proficient with electrocardiograms, as well as chest and abdominal x-rays.
But compared with a newly graduated NP with registered nurse (RN) floor experience, the PA is likely to be less familiar with hospital mechanics and systems, with leading goal of care discussions with patients and families, and with understanding nuances involved with transitions of care.
The subtle differences between NPs and PAs don’t end there. Because of the progressive policies and recently updated bylaws at the Kentucky hospital where the PA was hired, this health care professional can see patients and write notes independently without a physician signature. But because she practices in Kentucky, she is not allowed to prescribe Schedule II medications, per state law.
“This example demonstrates how nuanced and multi-layered the process of integrating NPs and PAs into hospitalist groups can be,” Mr. Shabani said.
Goals, roles, and expectations
Physician assistants and nurse practitioners have reported that their job descriptions, and the variety of roles they can play within HM teams, are becoming better understood by hospitalist physicians and administrators. However, they also have acknowledged that both PAs and NPs are still underutilized.
Tricia Marriott, PA-C, MPAS, an orthopedic service line administrator at Saint Mary’s Hospital in Waterbury, Conn., and an expert in NP and PA policy, has noticed growing enlightenment about PAs and NPs in her travels to conferences in recent years.
“I’m no longer explaining what a PA is and what an NP is, and the questions have become very sophisticated,” she said at HM18. “However, I spent the last two days in the exhibit hall, and some of the conversations I had with physicians are interesting in that the practice and utilization styles have not become sophisticated. So I think there is a lot of opportunity out there.”
Mr. Shabani said the hospitalist care provided by PAs and NPs sits “at the intersection” of state regulations, hospital bylaws, department utilization, and – of course – clinical experience and formal medical education.
“What this boils down to is first understanding these factors, followed by strategizing recruitment and training as a response,” he said.

Tracy Cardin, ACNP-BC, SFHM, associate director of clinical integration at Adfinitas Health in Hanover, Md., and a Society of Hospital Medicine board member, said that, even though she usually sees and hears about a 10%-15% productivity gap between physicians and PAs or NPs, there is no good reason that an experienced PA or NP should not be able to handle the same patient load as a physician hospitalist – if that’s the goal.
“Part of it is about communication of expectation,” she said, noting that organizations must provide the training to allows NPs and PAs to reach prescribed goals along with an adequate level of administrative support. “I think we shouldn’t accept those gaps in productivity.”
Nicolas Houghton, DNP, ACNP-BC, CFRN, nurse practitioner/physician assistant manager at the Cleveland Clinic, thinks that it is completely reasonable for health care organizations to have an expectation that, at the 3- to 5-year mark, NPs and PAs “are really going to be functioning at very high levels that may be nearly indistinguishable.”

Dr. Houghton and Mr. Shabani agreed that, while they had considerably different duties at the start of their careers, they now have clinical roles which mirror one another.
For example, they agreed on these basics: NPs must be a certified RN, while a PA can have any undergraduate degree with certain prerequisite courses such as biology and chemistry. All PAs are trained in general medicine, while NPs specialize in areas such as acute care, family medicine, geriatrics, and women’s health. NPs need 500 didactic hours and 500-700 clinical hours in their area of expertise, while physician assistants need 1,000 didactic and 2,000 clinical hours spread over many disciplines.
For NP’s, required clinical rotations depend on the specialty, while all PAs need to complete rotations in inpatient medicine, emergency medicine, primary care, surgery, psychiatry, pediatrics, and ob.gyn. Also, NPs can practice independently in 23 states and the District of Columbia, while PAs must have a supervising physician. About 10% of NPs work in hospital settings, and about 39% of PAs work in hospital settings, they said.
Dr. Houghton and Mr. Shabani emphasized that Medicare does recognize NP and PA services as physician services. The official language, in place since 1998, is that their services “are the type that are considered physician’s services if furnished by a doctor of medicine or osteopathy.”
Mr. Shabani said this remained a very relevant issue. “I can’t overstate how important this is,” he said.
Debunking myths
Several myths continue to persist about PAs and NPs, Ms. Marriott said. Some administrators and physicians believe that they can’t see new patients, that a physician must see every patient, that a physician cosignature means that a claim can be submitted under the physician’s name, that reimbursement for services provided by PAs and NPs “leaves 15% on the table,” and that patients won’t be happy being seen by a PA or an NP. All of those things are false, she said.
“We really need to improve people’s understanding in a lot of different places – it’s not just at the clinician level,” she said. “It goes all the way through the operations team, and the operations team has some very old-fashioned thinking about what PAs and NPs really are, which is – they believe – clinical support staff.”
But she suggested that the phrase “working at the top of one’s license” can be used too freely – individual experience and ability will encompass a range of practices, she said.
“I’m licensed to drive a car,” she said. “But you do not want me in the Daytona 500. I am not capable of driving a race car.”
She cautioned that nurse practitioner care must still involve an element of collaboration, according to the Medicaid benefit policy manual, even if they work in states that allow NPs to provide “independent” care. They must have documentation “indicating the relationships that they have with physicians to deal with issues outside their scope of practice,” the manual says.
“Don’t ask me how people prove it,” Ms. Marriott said. “Just know that, if someone were to audit you, then you would need to show what this looks like.”
Regarding the 15% myth, she showed a calculation: Data from the Medical Group Management Association show that median annual compensation for a physician is $134 an hour and that it’s approximately $52 an hour for a PA or NP. An admission history and physical that takes an hour can be reimbursed at $102 for a physician and at 85% of that – $87 – for a PA or NP. That leaves a deficit of $32 for the physician and a surplus of $35 for the PA or NP.
“If you properly deploy your PAs and NPs, you’re going to generate positive margins,” Ms. Marriott said.
Physicians often scurry about seeing all the patients that have already been seen by a PA, she said, because they think they must capture the extra 15% reimbursement. But that is unnecessary, she said.
“Go do another admission. You should see patients because of their clinical condition. My point is not that you go running around because you want to capture the extra 15% – because that provides no additional medically necessary care.”
Changing practice
Many institutions continue to be hamstrung by their own bylaws in the use of NPs and PAs. It’s true that a physician doesn’t have to see every patient, unless it’s required in a hospital’s rules, Ms. Marriott noted.
“Somebody step up, get on the bylaws committee, and say, ‘Let’s update these.’ ” she said.
As for patient satisfaction, access and convenience routinely rank higher on the patient priority lists than provider credentials. “The patient wants to get off the gurney in the ED and get to a room,” she said.
But changing hospital bylaws and practices is also about the responsible use of health care dollars, Ms. Marriott affirmed.
“More patients seen in a timely fashion, and quality metrics improvement: Those are all things that are really, really important,” she said. “As a result, [if bylaws and practice patterns are changed] the physicians are hopefully going to be happier, certainly the administration is going to be happier, and the patients are going to fare better.”
Scott Faust, MS, APRN, CNP, an acute care nurse practitioner at Health Partners in St. Paul, Minn., said that teamwork without egos is crucial to success for all providers on the hospital medicine team, especially at busier moments.
“Nobody wants to be in this alone,” he said. “I think the hospitalist teams that work well are the ones that check their titles at the door.”
PAs and NPs generally agree that, as long as all clinical staffers are working within their areas of skill without being overly concerned about specific titles and roles, hospitals and patients will benefit.
“I’ve had physicians at my organization say ‘We need to have an NP and PA set of educational requirements,’ and I said, ‘We have some already for physicians, right? Why aren’t we using that?’ ” Dr. Houghton said. “I think we should have the same expectations clinically. At the end of the day, the patient deserves the same outcomes and the same care, whether they’re being cared for by a physician, an NP, or a PA.”
Onboarding NPs and PAs
According to SHM’s Nurse Practitioner/Physician Assistant Committee, the integration of a new NP or PA hire, whether experienced or not, requires up-front organization and planning for the employee as he or she enters into a new practice.
To that end, the NP/PA Committee created a toolkit to aid health care organizations in their integration of NP and PA staffers into hospital medicine practice groups. The document includes resources for recruiting and interviewing NPs and PAs, information about orientation and onboarding, detailed descriptions of models of care to aid in the utilization of NPs and PAs, best practices for staff retention, insights on billing and reimbursement, and ideas for program evaluation.
Readers can download the Onboarding Toolkit in PDF format at shm.hospitalmedicine.org/acton/attachment/25526/f-040f/1/-/-/-/-/SHM_NPPA_OboardingToolkit.pdf.
But remain underutilized
But remain underutilized
Nurse practitioners (NPs) and physician assistants (PAs) have become a more prominent part of the hospitalist workforce, and at many institutions, they account for a large proportion of patient care and have a powerful effect on a patient’s experience. But NP and PA roles in hospital medicine continue to evolve – and understanding what they do is still, at times, a work in progress.
One myth that persists regarding NPs and PAs is that, if you’ve seen one, you’ve seen them all.
At the 2018 Annual Conference of the Society of Hospital Medicine, Noam Shabani, MS, PA-C, lead physician assistant at Massachusetts General Hospital’s Hospital Medicine Unit, Boston, offered an example to help shatter this misperception.
Mr. Shabani described a 28-year-old woman who had a bachelor’s in biology with a premed track and spent 4 years as a paramedic before attending the physician assistant program at Duke University, Durham, N.C. As a new PA graduate, she was hired as a hospitalist at a community hospital in Kentucky.
Given this new PA’s clinical experience and formal education, there are certain skills she should bring to the table: the ability to develop a differential diagnosis and a good understanding of disease pathophysiology and the mechanisms of action of drugs. And because of her paramedic experience, she should be comfortable with making urgent clinical care decisions and should be proficient with electrocardiograms, as well as chest and abdominal x-rays.
But compared with a newly graduated NP with registered nurse (RN) floor experience, the PA is likely to be less familiar with hospital mechanics and systems, with leading goal of care discussions with patients and families, and with understanding nuances involved with transitions of care.
The subtle differences between NPs and PAs don’t end there. Because of the progressive policies and recently updated bylaws at the Kentucky hospital where the PA was hired, this health care professional can see patients and write notes independently without a physician signature. But because she practices in Kentucky, she is not allowed to prescribe Schedule II medications, per state law.
“This example demonstrates how nuanced and multi-layered the process of integrating NPs and PAs into hospitalist groups can be,” Mr. Shabani said.
Goals, roles, and expectations
Physician assistants and nurse practitioners have reported that their job descriptions, and the variety of roles they can play within HM teams, are becoming better understood by hospitalist physicians and administrators. However, they also have acknowledged that both PAs and NPs are still underutilized.
Tricia Marriott, PA-C, MPAS, an orthopedic service line administrator at Saint Mary’s Hospital in Waterbury, Conn., and an expert in NP and PA policy, has noticed growing enlightenment about PAs and NPs in her travels to conferences in recent years.
“I’m no longer explaining what a PA is and what an NP is, and the questions have become very sophisticated,” she said at HM18. “However, I spent the last two days in the exhibit hall, and some of the conversations I had with physicians are interesting in that the practice and utilization styles have not become sophisticated. So I think there is a lot of opportunity out there.”
Mr. Shabani said the hospitalist care provided by PAs and NPs sits “at the intersection” of state regulations, hospital bylaws, department utilization, and – of course – clinical experience and formal medical education.
“What this boils down to is first understanding these factors, followed by strategizing recruitment and training as a response,” he said.
Tracy Cardin, ACNP-BC, SFHM, associate director of clinical integration at Adfinitas Health in Hanover, Md., and a Society of Hospital Medicine board member, said that, even though she usually sees and hears about a 10%-15% productivity gap between physicians and PAs or NPs, there is no good reason that an experienced PA or NP should not be able to handle the same patient load as a physician hospitalist – if that’s the goal.
“Part of it is about communication of expectation,” she said, noting that organizations must provide the training to allows NPs and PAs to reach prescribed goals along with an adequate level of administrative support. “I think we shouldn’t accept those gaps in productivity.”
Nicolas Houghton, DNP, ACNP-BC, CFRN, nurse practitioner/physician assistant manager at the Cleveland Clinic, thinks that it is completely reasonable for health care organizations to have an expectation that, at the 3- to 5-year mark, NPs and PAs “are really going to be functioning at very high levels that may be nearly indistinguishable.”
Dr. Houghton and Mr. Shabani agreed that, while they had considerably different duties at the start of their careers, they now have clinical roles which mirror one another.
For example, they agreed on these basics: NPs must be a certified RN, while a PA can have any undergraduate degree with certain prerequisite courses such as biology and chemistry. All PAs are trained in general medicine, while NPs specialize in areas such as acute care, family medicine, geriatrics, and women’s health. NPs need 500 didactic hours and 500-700 clinical hours in their area of expertise, while physician assistants need 1,000 didactic and 2,000 clinical hours spread over many disciplines.
For NP’s, required clinical rotations depend on the specialty, while all PAs need to complete rotations in inpatient medicine, emergency medicine, primary care, surgery, psychiatry, pediatrics, and ob.gyn. Also, NPs can practice independently in 23 states and the District of Columbia, while PAs must have a supervising physician. About 10% of NPs work in hospital settings, and about 39% of PAs work in hospital settings, they said.
Dr. Houghton and Mr. Shabani emphasized that Medicare does recognize NP and PA services as physician services. The official language, in place since 1998, is that their services “are the type that are considered physician’s services if furnished by a doctor of medicine or osteopathy.”
Mr. Shabani said this remained a very relevant issue. “I can’t overstate how important this is,” he said.
Debunking myths
Several myths continue to persist about PAs and NPs, Ms. Marriott said. Some administrators and physicians believe that they can’t see new patients, that a physician must see every patient, that a physician cosignature means that a claim can be submitted under the physician’s name, that reimbursement for services provided by PAs and NPs “leaves 15% on the table,” and that patients won’t be happy being seen by a PA or an NP. All of those things are false, she said.
“We really need to improve people’s understanding in a lot of different places – it’s not just at the clinician level,” she said. “It goes all the way through the operations team, and the operations team has some very old-fashioned thinking about what PAs and NPs really are, which is – they believe – clinical support staff.”
But she suggested that the phrase “working at the top of one’s license” can be used too freely – individual experience and ability will encompass a range of practices, she said.
“I’m licensed to drive a car,” she said. “But you do not want me in the Daytona 500. I am not capable of driving a race car.”
She cautioned that nurse practitioner care must still involve an element of collaboration, according to the Medicaid benefit policy manual, even if they work in states that allow NPs to provide “independent” care. They must have documentation “indicating the relationships that they have with physicians to deal with issues outside their scope of practice,” the manual says.
“Don’t ask me how people prove it,” Ms. Marriott said. “Just know that, if someone were to audit you, then you would need to show what this looks like.”
Regarding the 15% myth, she showed a calculation: Data from the Medical Group Management Association show that median annual compensation for a physician is $134 an hour and that it’s approximately $52 an hour for a PA or NP. An admission history and physical that takes an hour can be reimbursed at $102 for a physician and at 85% of that – $87 – for a PA or NP. That leaves a deficit of $32 for the physician and a surplus of $35 for the PA or NP.
“If you properly deploy your PAs and NPs, you’re going to generate positive margins,” Ms. Marriott said.
Physicians often scurry about seeing all the patients that have already been seen by a PA, she said, because they think they must capture the extra 15% reimbursement. But that is unnecessary, she said.
“Go do another admission. You should see patients because of their clinical condition. My point is not that you go running around because you want to capture the extra 15% – because that provides no additional medically necessary care.”
Changing practice
Many institutions continue to be hamstrung by their own bylaws in the use of NPs and PAs. It’s true that a physician doesn’t have to see every patient, unless it’s required in a hospital’s rules, Ms. Marriott noted.
“Somebody step up, get on the bylaws committee, and say, ‘Let’s update these.’ ” she said.
As for patient satisfaction, access and convenience routinely rank higher on the patient priority lists than provider credentials. “The patient wants to get off the gurney in the ED and get to a room,” she said.
But changing hospital bylaws and practices is also about the responsible use of health care dollars, Ms. Marriott affirmed.
“More patients seen in a timely fashion, and quality metrics improvement: Those are all things that are really, really important,” she said. “As a result, [if bylaws and practice patterns are changed] the physicians are hopefully going to be happier, certainly the administration is going to be happier, and the patients are going to fare better.”
Scott Faust, MS, APRN, CNP, an acute care nurse practitioner at Health Partners in St. Paul, Minn., said that teamwork without egos is crucial to success for all providers on the hospital medicine team, especially at busier moments.
“Nobody wants to be in this alone,” he said. “I think the hospitalist teams that work well are the ones that check their titles at the door.”
PAs and NPs generally agree that, as long as all clinical staffers are working within their areas of skill without being overly concerned about specific titles and roles, hospitals and patients will benefit.
“I’ve had physicians at my organization say ‘We need to have an NP and PA set of educational requirements,’ and I said, ‘We have some already for physicians, right? Why aren’t we using that?’ ” Dr. Houghton said. “I think we should have the same expectations clinically. At the end of the day, the patient deserves the same outcomes and the same care, whether they’re being cared for by a physician, an NP, or a PA.”
Onboarding NPs and PAs
According to SHM’s Nurse Practitioner/Physician Assistant Committee, the integration of a new NP or PA hire, whether experienced or not, requires up-front organization and planning for the employee as he or she enters into a new practice.
To that end, the NP/PA Committee created a toolkit to aid health care organizations in their integration of NP and PA staffers into hospital medicine practice groups. The document includes resources for recruiting and interviewing NPs and PAs, information about orientation and onboarding, detailed descriptions of models of care to aid in the utilization of NPs and PAs, best practices for staff retention, insights on billing and reimbursement, and ideas for program evaluation.
Readers can download the Onboarding Toolkit in PDF format at shm.hospitalmedicine.org/acton/attachment/25526/f-040f/1/-/-/-/-/SHM_NPPA_OboardingToolkit.pdf.
EXPERT ANALYSIS FROM HM18
More than half of urine drug screens showed improper medication use
LAS VEGAS –

Of almost 4 million urine screens examined, 52% were discordant for the screen-ordered drugs, Jeffrey Gudin, MD, said at the annual PAINWeek. Most common was the combination of opioids and benzodiazepines, which accounted for 21% of the discordant samples – and, in 64% of these cases, at least one of the drugs was not prescribed.
“Drug testing is a standard of care in pain management, and it’s the only objective way to know what patients are really taking,” said Dr. Gudin, director of pain and palliative care at Englewood (N.J.) Hospital and Medical Center. “What this tells us is that, if we just ask our patients, half the time they won’t tell you the whole story. More than 50% of the time things don’t match up. To me this is just unbelievable.”
Quest Diagnostics compiled these data, and many more, in its “Health Trends Report: Drug Misuse in America 2018.”
The report examines 3.9 million routine drug screens ordered by primary care and pain physicians during 2011-2017. It not only looks at prescription drug use and misuse but also tracks illicit drugs in both general and substance abuse patient populations. The findings reported at PAINWeek were based on 456,675 screens from 276,953 patients conducted in 2017. These results were included in the Quest Diagnostics medMATCH reports, which indicated what tested drugs were prescribed and whether these drugs were detected in the specimen.
The following were found among the discordant screens identified in 2017:
- 45% were positive for nonprescribed or illicit drugs in addition to all the prescribed drugs.
- 34% did not show all the drugs they had been prescribed, or any other tested drug.
- 22% did not show all the drugs they had been prescribed but were positive for other illicit or nonprescribed drugs.
The tests were ordered as a part of routine care – an important point, Dr. Gudin said in an interview. “These are not ‘gotcha tests,’ ” intended to catch patients unawares. “These are regularly ordered screens that are standard of care in pain management.”
The report found that men and women were equally likely to misuse medications (52% each). There were some age-related differences, with misuse peaking in young adulthood: 60% of 18- to 24-year-olds and 56% of 25- to 45-year-olds. Misuse dropped off in those aged 55-64 years (52%) and in those 65 years and older (43%). But even children showed evidence of medication misuse, with about 41% of samples from children aged 10 years and younger being discordant.
The rates of misuse were about 50% in Medicare and private pay patients, but around 65% in Medicaid patients.
There was some good news: In the general patient population, opioid use was down by 12% from 2016 – the largest annual decrease Quest has noted since 2012. Several factors probably contributed to that decline, including shifts in clinical care and payer reimbursement, as well as regulatory and legislative restrictions.
“This shows that we’re doing better on the pain management front,” Dr. Gudin said. “But in substance use disorder settings, we saw 400% increases for both fentanyl and heroin. The addiction front it out of control.”
More than 27% of all specimens that came from substance abuse treatment centers were positive for nonprescribed fentanyl and 10% were positive for heroin. “We also saw that, in 2016, 45% of those heroin-positive samples had fentanyl in them, and in 2017, 83% did.”
Although not discussed at PAINWeek, the report also noted a rise in gabapentin misuse. The antiepileptic is now the 10th most commonly prescribed drug in the United States, the report noted, with 68 million prescriptions dispensed last year. The report found that 9.5% of tests showed nonprescription gabapentin. In the subset of samples obtained from substance abuse treatment centers, gabapentin misuse increased by 800% from 2016 – the most dramatic increase of any of the tracked drugs.
The combination of gabapentin and opioids is risky, the report noted. Opioid-related deaths are 49% more common among those taking both than those taking opioids only.
SOURCE: Gudin J et al. PAINWeek 2018, abstract 44.
LAS VEGAS –
Of almost 4 million urine screens examined, 52% were discordant for the screen-ordered drugs, Jeffrey Gudin, MD, said at the annual PAINWeek. Most common was the combination of opioids and benzodiazepines, which accounted for 21% of the discordant samples – and, in 64% of these cases, at least one of the drugs was not prescribed.
“Drug testing is a standard of care in pain management, and it’s the only objective way to know what patients are really taking,” said Dr. Gudin, director of pain and palliative care at Englewood (N.J.) Hospital and Medical Center. “What this tells us is that, if we just ask our patients, half the time they won’t tell you the whole story. More than 50% of the time things don’t match up. To me this is just unbelievable.”
Quest Diagnostics compiled these data, and many more, in its “Health Trends Report: Drug Misuse in America 2018.”
The report examines 3.9 million routine drug screens ordered by primary care and pain physicians during 2011-2017. It not only looks at prescription drug use and misuse but also tracks illicit drugs in both general and substance abuse patient populations. The findings reported at PAINWeek were based on 456,675 screens from 276,953 patients conducted in 2017. These results were included in the Quest Diagnostics medMATCH reports, which indicated what tested drugs were prescribed and whether these drugs were detected in the specimen.
The following were found among the discordant screens identified in 2017:
- 45% were positive for nonprescribed or illicit drugs in addition to all the prescribed drugs.
- 34% did not show all the drugs they had been prescribed, or any other tested drug.
- 22% did not show all the drugs they had been prescribed but were positive for other illicit or nonprescribed drugs.
The tests were ordered as a part of routine care – an important point, Dr. Gudin said in an interview. “These are not ‘gotcha tests,’ ” intended to catch patients unawares. “These are regularly ordered screens that are standard of care in pain management.”
The report found that men and women were equally likely to misuse medications (52% each). There were some age-related differences, with misuse peaking in young adulthood: 60% of 18- to 24-year-olds and 56% of 25- to 45-year-olds. Misuse dropped off in those aged 55-64 years (52%) and in those 65 years and older (43%). But even children showed evidence of medication misuse, with about 41% of samples from children aged 10 years and younger being discordant.
The rates of misuse were about 50% in Medicare and private pay patients, but around 65% in Medicaid patients.
There was some good news: In the general patient population, opioid use was down by 12% from 2016 – the largest annual decrease Quest has noted since 2012. Several factors probably contributed to that decline, including shifts in clinical care and payer reimbursement, as well as regulatory and legislative restrictions.
“This shows that we’re doing better on the pain management front,” Dr. Gudin said. “But in substance use disorder settings, we saw 400% increases for both fentanyl and heroin. The addiction front it out of control.”
More than 27% of all specimens that came from substance abuse treatment centers were positive for nonprescribed fentanyl and 10% were positive for heroin. “We also saw that, in 2016, 45% of those heroin-positive samples had fentanyl in them, and in 2017, 83% did.”
Although not discussed at PAINWeek, the report also noted a rise in gabapentin misuse. The antiepileptic is now the 10th most commonly prescribed drug in the United States, the report noted, with 68 million prescriptions dispensed last year. The report found that 9.5% of tests showed nonprescription gabapentin. In the subset of samples obtained from substance abuse treatment centers, gabapentin misuse increased by 800% from 2016 – the most dramatic increase of any of the tracked drugs.
The combination of gabapentin and opioids is risky, the report noted. Opioid-related deaths are 49% more common among those taking both than those taking opioids only.
SOURCE: Gudin J et al. PAINWeek 2018, abstract 44.
REPORTING FROM PAINWEEK 2018
Key clinical point: More than half of patients undergoing urine drug screens were misusing medications.
Major finding: The samples were discordant for the queried drug in 52% of samples.
Study details: The study was based on 3.9 million drug screens ordered during 2011-2017.
Disclosures: The findings were included in Quest Diagnostics’ “Health Trends Report: Drug Misuse in America 2018.”
Source: Gudin J et al. PAINWeek, Abstract 44.
Zika virus infection: Novel assay extends diagnostic window
ATLANTA – A novel pyrosequencing (PSQ)–based reverse-transcription polymerase chain reaction (RT-PCR) assay improves and expands diagnostic capabilities for Zika virus infection, according to findings in 60 patients diagnosed with the virus in 2016 and 2017.

The PSQ assay provides rapid, specific, and cost-effective detection of the virus in tissues of congenital and pregnancy-associated infections, and, compared with serum-based assays, extends the time frame for Zika virus detection, Julu Bhatnagar, PhD, reported in a presentation at the International Conference on Emerging Infectious Diseases.
Dr. Bhatnagar and her colleagues from the Centers for Disease Control and Prevention in Atlanta developed the assay and evaluated it using RNA extracted from formalin-fixed, paraffin-embedded placental/fetal tissues from 53 women with varying pregnancy outcomes, and brain tissues from seven infants with microcephaly who died. In all of the tissue samples, which were received between January 2016 and August 2017, Zika virus was previously identified by conventional RT-PCR and Sanger sequencing.
The PSQ assay detected and sequence confirmed Zika virus in tissues from all 60 patients, whereas 40 negative control samples, including tissues from dengue- and chikungunya virus–confirmed cases, all tested negative.
In addition, the PSQ assay detected Zika virus in placental tissues from three other cases that were previously negative by the conventional tissue-based RT-PCR, thereby demonstrating better sensitivity of the PSQ assay in comparison to conventional tissue RT-PCR, said Dr. Bhatnagar, who is molecular pathology team leader in the Infectious Diseases Pathology Branch, Division of High-Consequence Pathogens and Pathology at the CDC’s National Center for Emerging and Zoonotic Infectious Diseases.
“Importantly, PSQ results can be obtained in 1 day and at half the cost of Sanger sequencing,” she said.
The findings are important because Zika virus infection during pregnancy can cause microcephaly and is associated with pregnancy loss. Laboratory diagnosis of the virus is challenging for pregnancy-associated infections because of the short duration of viremia, she explained.
However, prolonged detection of Zika virus RNA in placental, fetal, and neonatal brain tissue has been reported.
Dr. Bhatnagar was the first author on a 2016 study published in Emerging Infectious Diseases that provided confirmation of the linkage of Zika virus with microcephaly and that suggested its association with adverse pregnancy outcomes and provided evidence of Zika virus replication and persistence in fetal brain and placenta.
“This article highlights the value of tissue analysis to expand opportunities to diagnose Zika virus congenital and pregnancy-associated infections and to enhance the understanding of mechanism of Zika virus intrauterine transmission and pathogenesis,” she and her colleagues wrote in that article. “In addition, the tissue-based RT-PCRs extend the time frame for Zika virus detection and particularly help to establish a diagnosis retrospectively, enabling pregnant women and their health care providers to identify the cause of severe microcephaly or fetal loss.”
Those findings led to the hypothesis that the PSQ assay evaluated in the current study would provide better opportunities for detection, particularly in cases where serum RT-PCR or serologic testing is negative because of testing performed outside the optimal testing window, she said.
Indeed, the novel assay not only allows for an extended time frame for Zika virus detection, it also provides insights into viral tissue tropism and persistence, she noted.
According to the CDC, no local mosquito-borne Zika virus transmissions have been reported in the continental United States in 2018, but transmission is still a threat internationally, and those traveling outside of the continental United States should find out if they are traveling to an area with risk of Zika.
Dr. Bhatnagar reported having no disclosures.
SOURCE: Bhatnagar J et al. ICEID 2018, Abstract O1.
ATLANTA – A novel pyrosequencing (PSQ)–based reverse-transcription polymerase chain reaction (RT-PCR) assay improves and expands diagnostic capabilities for Zika virus infection, according to findings in 60 patients diagnosed with the virus in 2016 and 2017.
The PSQ assay provides rapid, specific, and cost-effective detection of the virus in tissues of congenital and pregnancy-associated infections, and, compared with serum-based assays, extends the time frame for Zika virus detection, Julu Bhatnagar, PhD, reported in a presentation at the International Conference on Emerging Infectious Diseases.
Dr. Bhatnagar and her colleagues from the Centers for Disease Control and Prevention in Atlanta developed the assay and evaluated it using RNA extracted from formalin-fixed, paraffin-embedded placental/fetal tissues from 53 women with varying pregnancy outcomes, and brain tissues from seven infants with microcephaly who died. In all of the tissue samples, which were received between January 2016 and August 2017, Zika virus was previously identified by conventional RT-PCR and Sanger sequencing.
The PSQ assay detected and sequence confirmed Zika virus in tissues from all 60 patients, whereas 40 negative control samples, including tissues from dengue- and chikungunya virus–confirmed cases, all tested negative.
In addition, the PSQ assay detected Zika virus in placental tissues from three other cases that were previously negative by the conventional tissue-based RT-PCR, thereby demonstrating better sensitivity of the PSQ assay in comparison to conventional tissue RT-PCR, said Dr. Bhatnagar, who is molecular pathology team leader in the Infectious Diseases Pathology Branch, Division of High-Consequence Pathogens and Pathology at the CDC’s National Center for Emerging and Zoonotic Infectious Diseases.
“Importantly, PSQ results can be obtained in 1 day and at half the cost of Sanger sequencing,” she said.
The findings are important because Zika virus infection during pregnancy can cause microcephaly and is associated with pregnancy loss. Laboratory diagnosis of the virus is challenging for pregnancy-associated infections because of the short duration of viremia, she explained.
However, prolonged detection of Zika virus RNA in placental, fetal, and neonatal brain tissue has been reported.
Dr. Bhatnagar was the first author on a 2016 study published in Emerging Infectious Diseases that provided confirmation of the linkage of Zika virus with microcephaly and that suggested its association with adverse pregnancy outcomes and provided evidence of Zika virus replication and persistence in fetal brain and placenta.
“This article highlights the value of tissue analysis to expand opportunities to diagnose Zika virus congenital and pregnancy-associated infections and to enhance the understanding of mechanism of Zika virus intrauterine transmission and pathogenesis,” she and her colleagues wrote in that article. “In addition, the tissue-based RT-PCRs extend the time frame for Zika virus detection and particularly help to establish a diagnosis retrospectively, enabling pregnant women and their health care providers to identify the cause of severe microcephaly or fetal loss.”
Those findings led to the hypothesis that the PSQ assay evaluated in the current study would provide better opportunities for detection, particularly in cases where serum RT-PCR or serologic testing is negative because of testing performed outside the optimal testing window, she said.
Indeed, the novel assay not only allows for an extended time frame for Zika virus detection, it also provides insights into viral tissue tropism and persistence, she noted.
According to the CDC, no local mosquito-borne Zika virus transmissions have been reported in the continental United States in 2018, but transmission is still a threat internationally, and those traveling outside of the continental United States should find out if they are traveling to an area with risk of Zika.
Dr. Bhatnagar reported having no disclosures.
SOURCE: Bhatnagar J et al. ICEID 2018, Abstract O1.
REPORTING FROM ICEID 2018
Key clinical point: A novel assay extends the time frame for diagnosing Zika virus infection.
Major finding: The PSQ assay detected and sequence confirmed Zika virus in all 60 samples; 40 negative control samples all tested negative.
Study details: An analysis of 60 tissue samples using a novel assay.
Disclosures: Dr. Bhatnagar reported having no disclosures.
Source: Bhatnagar J et al. ICEID 2018, Abstract O1.
Does nurse-physician rounding matter?
Advancing the Quadruple Aim
Inadequate and fragmented communication between physicians and nurses can lead to unwelcome events for the hospitalized patient and clinicians. Missing orders, medication errors, patient misidentification, and lack of physician awareness of significant changes in patient status are just some examples of how deficits in formal communication can affect health outcomes during acute stays.

A 2000 Institute of Medicine report showed that bad systems, not bad people, account for the majority of errors and injuries caused by complexity, professional fragmentation, and barriers in communication. Their recommendation was to train physicians, nurses, and other professionals in teamwork.1,2 However, as Milisa Manojlovich, PhD, RN, found, there are significant differences in how physicians and nurses perceive collaboration and communication.3
Nurse-physician rounding was historically standard for patient care during hospitalization. When physicians split time between inpatient and outpatient care, nurses had to maximize their time to collaborate and communicate with physicians whenever the physicians left their outpatient offices to come and round on their patients. Today most inpatient care is delivered by hospitalists on a 24-hour basis. This continuous availability of physicians reduces the perceived need to have joint rounds.
However, health care teams in acute care facilities now face higher and sicker patient volumes, different productivity models and demands, new compliance standards, changing work flows, and increased complexity of treatment and management of patients. This has led to gaps in timely communication and partnership.4-6 Erosion of the traditional nurse-physician relationships affects the quality of patient care, the patient’s experience, and patient safety.8-10 Poor communication among health care team members is one of the most common causes of patient care errors.4 Poor nurse-physician communication can also lead to medical errors, poor outcomes caused by lack of coordination within the treatment team, increased use of unnecessary resources with inefficiency, and increases in the complexity of communication among team members, and time wastage.5,7,11 All these lead to poor work flows and directly affect patient safety.7

At Lee Health System in Lee County, Fla., we saw an opportunity in this changing health care environment to promote nurse-physician rounding. We created a structured, standardized process for morning rounding and engaged unit clerks, nursing leadership, and hospitalist service line leaders. We envisioned improvement of the patient experience, nurse-physician relationship, quality of care, the discharge planning process, and efficiency, as well as decreasing length of stay, improving communication, and bringing the patient and the treatment team closer, as demonstrated by Bradley Monash, MD, et al.12
Some data suggest that patient-centered bedside rounds on hospitalized patients have no effect on patient perceptions or their satisfaction with care.13 However, we felt that collaboration among a multidisciplinary team would help us achieve better outcomes. For example, our patients would perceive the care team (MD-RN) as a cohesive unit, and in turn gain trust in the members of the treatment team, as found by Nathalie McIntosh, PhD, et al and by Jason Ramirez, MD.7,16 Our vision was to empower nurses to be advocates for patients and their family members as they navigated their acute care admission. Nurses could also support physicians by communicating the physicians’ care plans to families and patients. After rounding with the physician, the nurse would be part of the decision-making process and care planning.17
Every rounding session had discharge planning and hospital stay expectations that were shared with the patient and nurse, who could then partner with case managers and social workers, which would streamline and reduce length of stay.14 We hoped rounding would also decrease the number of nurse pages to clarify or question orders. This would, in turn, improve daily work flow for the physicians and the nursing team with improvements in employee satisfaction scores.15 A study also has demonstrated a reduction in readmission rates from nurse-physician rounding.19
A disconnect in communication and trust between physicians and the nursing staff was reflected in low patient experience scores and perceived quality of care received during in-hospital stay. Gwendolyn Lancaster, EdD, MSN, RN, CCRN, et al, as well as a Joint Commission report, demonstrated how a lack of communication and poor team dynamics can translate to poor patient experience and be a major cause for sentinel events.6,20 Artificial, forced hierarchies and role perception among health care team members led to frustration, hostility, and distrust, which compromises quality and patient safety.1
One of our biggest challenges when we started this project was explaining the “Why” to the hospitalist group and nursing staff. Physicians were used to being the dominant partner in the team. Partnering with and engaging nurses in shared decision making and care planning was a seismic shift in culture and work flow within the care team. Early gains helped skeptical team members begin to understand the value in nurse-physician rounding. Near universal adoption of the rounding process at Lee Health has caused improvements in the working relationship and trust among the health care professionals. We have seen improvements in utilization management, as well as appropriateness and timeliness of resource use, because of better communication and understanding of care plans by nursing and physicians. Collaboration with specialists and alignment in care planning are other gains. Hospitalists and nurses are both very satisfied with the decrease in the number of pages during the day, and this has lowered stressors on health care teams.
How we did it
Nurse-physician rounding is a proven method to improve collaboration, communication, and relationships among health care team members in acute care facilities. In the complex health care challenges faced today, this improved work flow for taking care of patients can help advance the Quadruple Aim of high quality, low cost, improved patient experience, physician, and staff satisfaction.21
Lee Health System includes four facilities in Lee County, with a total of 1,216 licensed adult acute care beds. The pilot project was started in 2014.
Initially the vice president of nursing and the hospitalist medical director met to create an education plan for nurses and physicians. We chose one adult medicine unit to pilot the project because there already existed a closely knit nursing and hospitalist team. In our facility there is no strict geographical rounding; each hospitalist carries between three and six patients in the unit. As a first step, a nurse floor assignment sheet was faxed in the morning to the hospitalist office with the direct phone numbers of the nurses. The unit clerk, using physician assignments in the EHR, teamed up the physician and nurses for rounding. Once the physician arrived at the unit, he or she checked in with the unit clerk, who alerted nurses that the hospitalist was available on the floor to commence rounding. If the primary nurse was unavailable because of other duties or breaks, the charge nurse rounded with the physician.
Once in the room with the patient, the duo introduced themselves as members of the treatment team and acknowledged the patient’s needs. During the visit, care plans and treatment were reviewed, the patient’s questions were answered, a physical exam was completed, and lab and imaging results were discussed; the nurse also helped raise questions he or she had received from family members so answers could be communicated to the family later. Patients appreciated knowing that their physicians and nurses were working together as a team for their safety and recovery. During the visit, care was taken to focus specially on the course of hospitalization and discharge planning.
We tracked the rounding with a manual paper process maintained by the charge nurse. Our initial rounding rates were 30%-40%, and we continued to promote this initiative to the team, and eventually the importance and value of these rounds caught on with both nurses and physicians, and now our current average rounding rate is 90%. We then decided to scale this to all units in the hospital.
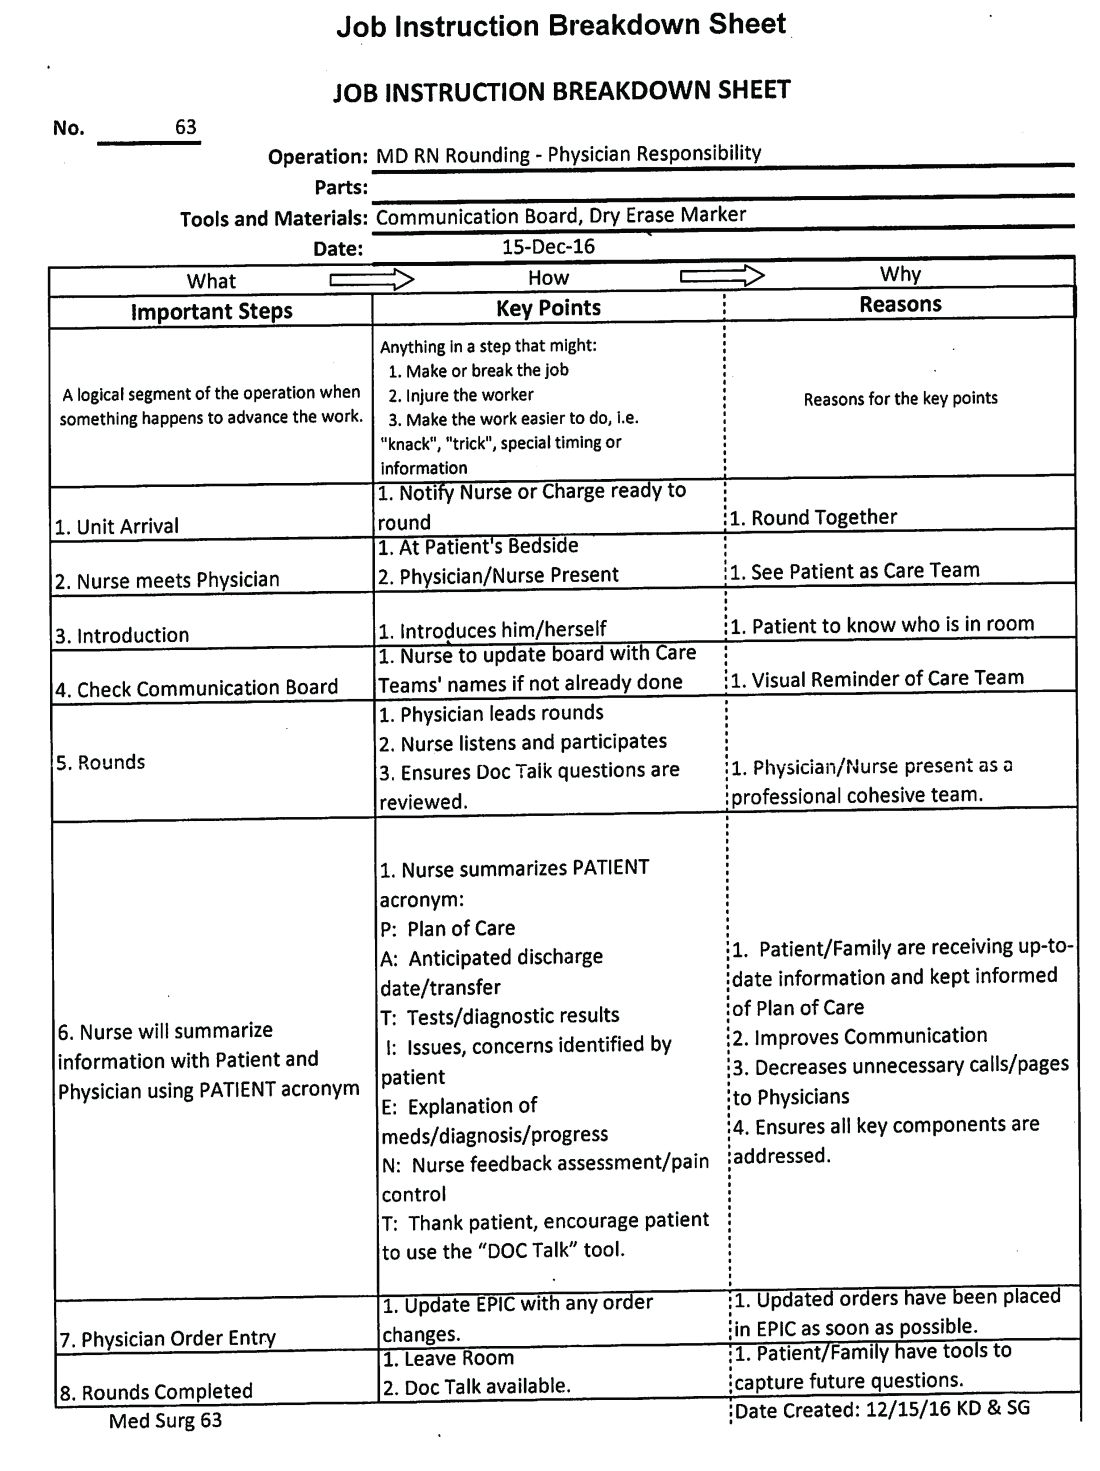
This process was repeated at other hospitals in the system once a standardized work flow was created (See Image 1). This initiative was next presented to the health system board of directors, who agreed that nurse-physician rounding should be the standard of care across our health system. Through partnership and collaboration with the IT department, we developed a tool to track nurse-physician rounding through our EHR system, which gave accountability to both physicians and nurses.
In conclusion, improved communication by timely nurse-physician rounding can lead to better outcomes for patients and also reduce costs and improve patient and staff experience, advancing the Quadruple Aim. Moving forward to build and sustain this work flow, we plan to continue nurse-physician collaboration across the health system consistently and for all areas of acute care operations.
Explaining the “Why,” sharing data on the benefits of the model, and reinforcing documentation of the rounding in our EHR are some steps we have put into action at leadership and staff meetings to sustain the activity. We are soliciting feedback, as well as monitoring and identifying any unaddressed barriers during rounding. Addition of this process measure to our quality improvement bonus opportunity also has helped to sustain performance from our teams.
Dr. Laufer is system medical director of hospital medicine and transitional care at Lee Health in Ft. Myers, Fla. Dr. Prasad is chief medical officer of Lee Physician Group, Ft. Myers, Fla.
References
1. Leape LL et al. Five years after to err is human: What we have learned? JAMA. 2005;293(19):2384-90.
2. Sutcliffe KM et al. Communication failures: An insidious contributor to medical mishaps. Acad Med. 2004;79(2):186-94.
3. Manojlovich M. Reframing communication with physicians as sensemaking. J Nurs Care Qual. 2013 Oct-Dec;28(4):295-303.
4. Siegele P. Enhancing outcomes in a surgical intensive care unit by implementing daily goals. Crit Care Nurse. 2009 Dec;29(6):58-69.
5. Asthon J et al. Qualitative evaluation of regular morning meeting aimed at improving interdisciplinary communication and patient outcomes. Int J Nurs Pract. 2005 Oct;11(5):206-13.
6. Lancaster G et al. Interdisciplinary Communication and collaboration among physicians, nurses, and unlicensed assistive personnel. J Nurs Scholarsh. 2015 May;47(3):275-84.
7. McIntosh N et al. Impact of provider coordination on nurse and physician perception of patient care quality. J Nurs Care Qual. 2014 Jul-Sep;29(3):269-79.
8. Jo M et al. An organizational assessment of disruptive clinical behavior. J Nurs Care Qual. 2013 Apr-Jun;28(2):110-21.
9. World Health Organization. Framework for action on interprofessional education and collaborative practice. Geneva, 2010.
10. O’Connor P et al. A mixed-methods study of the causes and impact of poor teamwork between junior doctors and nurses. Int J Qual Health Care. 2016 Jun;28(3):339-45.
11. Manojlovich M. Nurse/Physician communication through a sense making lens. Med Care. 2010 Nov;48(11):941-6.
12. Monash B et al. Standardized attending rounds to improve the patient experience: A pragmatic cluster randomized controlled trial. J Hosp Med. 2017 Mar;12(3):143-9.
13. O’Leary KJ et al. Effect of patient-centered bedside rounds on hospitalized patients decision control, activation and satisfaction with care. BMJ Qual Saf. 2016 Dec;25(12):921-8.
14. Dutton RP et al. Daily multidisciplinary rounds shorten length of stay for trauma patients. J Trauma. 2003 Nov;55(5):913-9.
15. Manojlovich M et al. Healthy work environments, nurse-physician communication, and patients’ outcomes. Am J Crit Care. 2007 Nov;16(6):536-43.
16. Ramirez J et al. Patient satisfaction with bedside teaching rounds compared with nonbedside rounds. South Med J. 2016 Feb;109(2):112-5.
17. Sollami A et al. Nurse-Physician collaboration: A meta-analytical investigation of survey scores. J Interprof Care. 2015 May;29(3):223-9.
18. House S et al. Nurses and physicians perceptions of nurse-physician collaboration. J Nurs Adm. 2017 Mar;47(3):165-71.
19. Townsend-Gervis M et al. Interdisciplinary rounds and structured communications reduce re-admissions and improve some patients’ outcomes. West J Nurs Res. 2014 Aug;36(7):917-28.
20. The Joint Commission. Sentinel Events. http://www.jointcommission.org/sentinel_event.aspx. Accessed Oct 2017.
21. Bodenheimer T et al. From Triple to Quadruple Aim: Care of the patient requires care of the provider. Ann Fam Med. 2014 Nov-Dec;12(6):573-6.
Advancing the Quadruple Aim
Advancing the Quadruple Aim
Inadequate and fragmented communication between physicians and nurses can lead to unwelcome events for the hospitalized patient and clinicians. Missing orders, medication errors, patient misidentification, and lack of physician awareness of significant changes in patient status are just some examples of how deficits in formal communication can affect health outcomes during acute stays.
A 2000 Institute of Medicine report showed that bad systems, not bad people, account for the majority of errors and injuries caused by complexity, professional fragmentation, and barriers in communication. Their recommendation was to train physicians, nurses, and other professionals in teamwork.1,2 However, as Milisa Manojlovich, PhD, RN, found, there are significant differences in how physicians and nurses perceive collaboration and communication.3
Nurse-physician rounding was historically standard for patient care during hospitalization. When physicians split time between inpatient and outpatient care, nurses had to maximize their time to collaborate and communicate with physicians whenever the physicians left their outpatient offices to come and round on their patients. Today most inpatient care is delivered by hospitalists on a 24-hour basis. This continuous availability of physicians reduces the perceived need to have joint rounds.
However, health care teams in acute care facilities now face higher and sicker patient volumes, different productivity models and demands, new compliance standards, changing work flows, and increased complexity of treatment and management of patients. This has led to gaps in timely communication and partnership.4-6 Erosion of the traditional nurse-physician relationships affects the quality of patient care, the patient’s experience, and patient safety.8-10 Poor communication among health care team members is one of the most common causes of patient care errors.4 Poor nurse-physician communication can also lead to medical errors, poor outcomes caused by lack of coordination within the treatment team, increased use of unnecessary resources with inefficiency, and increases in the complexity of communication among team members, and time wastage.5,7,11 All these lead to poor work flows and directly affect patient safety.7
At Lee Health System in Lee County, Fla., we saw an opportunity in this changing health care environment to promote nurse-physician rounding. We created a structured, standardized process for morning rounding and engaged unit clerks, nursing leadership, and hospitalist service line leaders. We envisioned improvement of the patient experience, nurse-physician relationship, quality of care, the discharge planning process, and efficiency, as well as decreasing length of stay, improving communication, and bringing the patient and the treatment team closer, as demonstrated by Bradley Monash, MD, et al.12
Some data suggest that patient-centered bedside rounds on hospitalized patients have no effect on patient perceptions or their satisfaction with care.13 However, we felt that collaboration among a multidisciplinary team would help us achieve better outcomes. For example, our patients would perceive the care team (MD-RN) as a cohesive unit, and in turn gain trust in the members of the treatment team, as found by Nathalie McIntosh, PhD, et al and by Jason Ramirez, MD.7,16 Our vision was to empower nurses to be advocates for patients and their family members as they navigated their acute care admission. Nurses could also support physicians by communicating the physicians’ care plans to families and patients. After rounding with the physician, the nurse would be part of the decision-making process and care planning.17
Every rounding session had discharge planning and hospital stay expectations that were shared with the patient and nurse, who could then partner with case managers and social workers, which would streamline and reduce length of stay.14 We hoped rounding would also decrease the number of nurse pages to clarify or question orders. This would, in turn, improve daily work flow for the physicians and the nursing team with improvements in employee satisfaction scores.15 A study also has demonstrated a reduction in readmission rates from nurse-physician rounding.19
A disconnect in communication and trust between physicians and the nursing staff was reflected in low patient experience scores and perceived quality of care received during in-hospital stay. Gwendolyn Lancaster, EdD, MSN, RN, CCRN, et al, as well as a Joint Commission report, demonstrated how a lack of communication and poor team dynamics can translate to poor patient experience and be a major cause for sentinel events.6,20 Artificial, forced hierarchies and role perception among health care team members led to frustration, hostility, and distrust, which compromises quality and patient safety.1
One of our biggest challenges when we started this project was explaining the “Why” to the hospitalist group and nursing staff. Physicians were used to being the dominant partner in the team. Partnering with and engaging nurses in shared decision making and care planning was a seismic shift in culture and work flow within the care team. Early gains helped skeptical team members begin to understand the value in nurse-physician rounding. Near universal adoption of the rounding process at Lee Health has caused improvements in the working relationship and trust among the health care professionals. We have seen improvements in utilization management, as well as appropriateness and timeliness of resource use, because of better communication and understanding of care plans by nursing and physicians. Collaboration with specialists and alignment in care planning are other gains. Hospitalists and nurses are both very satisfied with the decrease in the number of pages during the day, and this has lowered stressors on health care teams.
How we did it
Nurse-physician rounding is a proven method to improve collaboration, communication, and relationships among health care team members in acute care facilities. In the complex health care challenges faced today, this improved work flow for taking care of patients can help advance the Quadruple Aim of high quality, low cost, improved patient experience, physician, and staff satisfaction.21
Lee Health System includes four facilities in Lee County, with a total of 1,216 licensed adult acute care beds. The pilot project was started in 2014.
Initially the vice president of nursing and the hospitalist medical director met to create an education plan for nurses and physicians. We chose one adult medicine unit to pilot the project because there already existed a closely knit nursing and hospitalist team. In our facility there is no strict geographical rounding; each hospitalist carries between three and six patients in the unit. As a first step, a nurse floor assignment sheet was faxed in the morning to the hospitalist office with the direct phone numbers of the nurses. The unit clerk, using physician assignments in the EHR, teamed up the physician and nurses for rounding. Once the physician arrived at the unit, he or she checked in with the unit clerk, who alerted nurses that the hospitalist was available on the floor to commence rounding. If the primary nurse was unavailable because of other duties or breaks, the charge nurse rounded with the physician.
Once in the room with the patient, the duo introduced themselves as members of the treatment team and acknowledged the patient’s needs. During the visit, care plans and treatment were reviewed, the patient’s questions were answered, a physical exam was completed, and lab and imaging results were discussed; the nurse also helped raise questions he or she had received from family members so answers could be communicated to the family later. Patients appreciated knowing that their physicians and nurses were working together as a team for their safety and recovery. During the visit, care was taken to focus specially on the course of hospitalization and discharge planning.
We tracked the rounding with a manual paper process maintained by the charge nurse. Our initial rounding rates were 30%-40%, and we continued to promote this initiative to the team, and eventually the importance and value of these rounds caught on with both nurses and physicians, and now our current average rounding rate is 90%. We then decided to scale this to all units in the hospital.
This process was repeated at other hospitals in the system once a standardized work flow was created (See Image 1). This initiative was next presented to the health system board of directors, who agreed that nurse-physician rounding should be the standard of care across our health system. Through partnership and collaboration with the IT department, we developed a tool to track nurse-physician rounding through our EHR system, which gave accountability to both physicians and nurses.
In conclusion, improved communication by timely nurse-physician rounding can lead to better outcomes for patients and also reduce costs and improve patient and staff experience, advancing the Quadruple Aim. Moving forward to build and sustain this work flow, we plan to continue nurse-physician collaboration across the health system consistently and for all areas of acute care operations.
Explaining the “Why,” sharing data on the benefits of the model, and reinforcing documentation of the rounding in our EHR are some steps we have put into action at leadership and staff meetings to sustain the activity. We are soliciting feedback, as well as monitoring and identifying any unaddressed barriers during rounding. Addition of this process measure to our quality improvement bonus opportunity also has helped to sustain performance from our teams.
Dr. Laufer is system medical director of hospital medicine and transitional care at Lee Health in Ft. Myers, Fla. Dr. Prasad is chief medical officer of Lee Physician Group, Ft. Myers, Fla.
References
1. Leape LL et al. Five years after to err is human: What we have learned? JAMA. 2005;293(19):2384-90.
2. Sutcliffe KM et al. Communication failures: An insidious contributor to medical mishaps. Acad Med. 2004;79(2):186-94.
3. Manojlovich M. Reframing communication with physicians as sensemaking. J Nurs Care Qual. 2013 Oct-Dec;28(4):295-303.
4. Siegele P. Enhancing outcomes in a surgical intensive care unit by implementing daily goals. Crit Care Nurse. 2009 Dec;29(6):58-69.
5. Asthon J et al. Qualitative evaluation of regular morning meeting aimed at improving interdisciplinary communication and patient outcomes. Int J Nurs Pract. 2005 Oct;11(5):206-13.
6. Lancaster G et al. Interdisciplinary Communication and collaboration among physicians, nurses, and unlicensed assistive personnel. J Nurs Scholarsh. 2015 May;47(3):275-84.
7. McIntosh N et al. Impact of provider coordination on nurse and physician perception of patient care quality. J Nurs Care Qual. 2014 Jul-Sep;29(3):269-79.
8. Jo M et al. An organizational assessment of disruptive clinical behavior. J Nurs Care Qual. 2013 Apr-Jun;28(2):110-21.
9. World Health Organization. Framework for action on interprofessional education and collaborative practice. Geneva, 2010.
10. O’Connor P et al. A mixed-methods study of the causes and impact of poor teamwork between junior doctors and nurses. Int J Qual Health Care. 2016 Jun;28(3):339-45.
11. Manojlovich M. Nurse/Physician communication through a sense making lens. Med Care. 2010 Nov;48(11):941-6.
12. Monash B et al. Standardized attending rounds to improve the patient experience: A pragmatic cluster randomized controlled trial. J Hosp Med. 2017 Mar;12(3):143-9.
13. O’Leary KJ et al. Effect of patient-centered bedside rounds on hospitalized patients decision control, activation and satisfaction with care. BMJ Qual Saf. 2016 Dec;25(12):921-8.
14. Dutton RP et al. Daily multidisciplinary rounds shorten length of stay for trauma patients. J Trauma. 2003 Nov;55(5):913-9.
15. Manojlovich M et al. Healthy work environments, nurse-physician communication, and patients’ outcomes. Am J Crit Care. 2007 Nov;16(6):536-43.
16. Ramirez J et al. Patient satisfaction with bedside teaching rounds compared with nonbedside rounds. South Med J. 2016 Feb;109(2):112-5.
17. Sollami A et al. Nurse-Physician collaboration: A meta-analytical investigation of survey scores. J Interprof Care. 2015 May;29(3):223-9.
18. House S et al. Nurses and physicians perceptions of nurse-physician collaboration. J Nurs Adm. 2017 Mar;47(3):165-71.
19. Townsend-Gervis M et al. Interdisciplinary rounds and structured communications reduce re-admissions and improve some patients’ outcomes. West J Nurs Res. 2014 Aug;36(7):917-28.
20. The Joint Commission. Sentinel Events. http://www.jointcommission.org/sentinel_event.aspx. Accessed Oct 2017.
21. Bodenheimer T et al. From Triple to Quadruple Aim: Care of the patient requires care of the provider. Ann Fam Med. 2014 Nov-Dec;12(6):573-6.
Burnout may jeopardize patient care
because of depersonalization of care, according to recent research published in JAMA Internal Medicine.

“The primary conclusion of this review is that physician burnout might jeopardize patient care,” Maria Panagioti, PhD, from the National Institute for Health Research (NIHR) School for Primary Care Research and the NIHR Greater Manchester Patient Safety Translational Research Centre at the University of Manchester (United Kingdom) and her colleagues wrote in their study. “Physician wellness and quality of patient care are critical [as are] complementary dimensions of health care organization efficiency.”
Dr. Panagioti and her colleagues performed a search of the MEDLINE, EMBASE, CINAHL, and PsycInfo databases and found 47 eligible studies on the topics of physician burnout and patient care, which altogether included data from a pooled cohort of 42,473 physicians. The physicians were median 38 years old, with 44.7% of studies looking at physicians in residency or early career (up to 5 years post residency) and 55.3% of studies examining experienced physicians. The meta-analysis also evaluated physicians in a hospital setting (63.8%), primary care (13.8%), and across various different health care settings (8.5%).
The researchers found physicians with burnout were significantly associated with higher rates of patient safety issues (odds ratio, 1.96; 95% confidence interval, 1.59-2.40), reduced patient satisfaction (OR, 2.28; 95% CI, 1.42-3.68), and lower quality of care (OR, 2.31; 95% CI, 1.87-2.85). System-reported instances of patient safety issues and low professionalism were not statistically significant, but the subgroup differences did reach statistical significance (Cohen Q, 8.14; P = .007). Among residents and physicians in their early career, there was a greater association between burnout and low professionalism (OR, 3.39; 95% CI, 2.38-4.40), compared with physicians in the middle or later in their career (OR, 1.73; 95% CI, 1.46-2.01; Cohen Q, 7.27; P = .003).
“Investments in organizational strategies to jointly monitor and improve physician wellness and patient care outcomes are needed,” Dr. Panagioti and her colleagues wrote in the study. “Interventions aimed at improving the culture of health care organizations, as well as interventions focused on individual physicians but supported and funded by health care organizations, are beneficial.”
Researchers noted the study quality was low to moderate. Variation in outcomes across studies, heterogeneity among studies, potential selection bias by excluding gray literature, and the inability to establish causal links from findings because of the cross-sectional nature of the studies analyzed were potential limitations in the study, they reported.
The study was funded by the United Kingdom NIHR School for Primary Care Research and the NIHR Greater Manchester Patient Safety Translational Research Centre. The authors report no relevant conflicts of interest.
SOURCE: Panagioti M et al. JAMA Intern Med. 2018 Sept 4. doi: 10.1001/jamainternmed.2018.3713.
Because of a lack of funding for research into burnout and the immediate need for change based on the effect it has on patient care seen in Pangioti et al., the question of how to address physician burnout should be answered with quality improvement programs aimed at making immediate changes in health care settings, Mark Linzer, MD, wrote in a related editorial.
“Resonating with these concepts, I propose that, for the burnout prevention and wellness field, we encourage quality improvement projects of high standards: multiple sites, concurrent control groups, longitudinal design, and blinding when feasible, with assessment of outcomes and costs,” he wrote. “These studies can point us toward what we will evaluate in larger trials and allow a place for the rapidly developing information base to be viewed and thus become part of the developing science of work conditions, burnout reduction, and the anticipated result on quality and safety.”
There are research questions that have yet to be answered on this topic, he added, such as to what extent do factors like workflow redesign, use and upkeep of electronic medical records, and chaotic workplaces affect burnout. Further, regulatory environments may play a role, and it is still not known whether reducing burnout among physicians will also reduce burnout among staff. Future studies should also look at how burnout affects trainees and female physicians, he suggested.
“The link between burnout and adverse patient outcomes is stronger, thanks to the work of Panagioti and colleagues,” Dr. Linzer said. “With close to half of U.S. physicians experiencing symptoms of burnout, more work is needed to understand how to reduce it and what we can expect from doing so.”
Dr. Linzer is from the Hennepin Healthcare Systems in Minneapolis. These comments summarize his editorial regarding the findings of Pangioti et al. He reported support for Wellness Champion training by the American College of Physicians and the Association of Chiefs and Leaders in General Internal Medicine and that he has received support for American Medical Association research projects.
because of depersonalization of care, according to recent research published in JAMA Internal Medicine.
“The primary conclusion of this review is that physician burnout might jeopardize patient care,” Maria Panagioti, PhD, from the National Institute for Health Research (NIHR) School for Primary Care Research and the NIHR Greater Manchester Patient Safety Translational Research Centre at the University of Manchester (United Kingdom) and her colleagues wrote in their study. “Physician wellness and quality of patient care are critical [as are] complementary dimensions of health care organization efficiency.”
Dr. Panagioti and her colleagues performed a search of the MEDLINE, EMBASE, CINAHL, and PsycInfo databases and found 47 eligible studies on the topics of physician burnout and patient care, which altogether included data from a pooled cohort of 42,473 physicians. The physicians were median 38 years old, with 44.7% of studies looking at physicians in residency or early career (up to 5 years post residency) and 55.3% of studies examining experienced physicians. The meta-analysis also evaluated physicians in a hospital setting (63.8%), primary care (13.8%), and across various different health care settings (8.5%).
The researchers found physicians with burnout were significantly associated with higher rates of patient safety issues (odds ratio, 1.96; 95% confidence interval, 1.59-2.40), reduced patient satisfaction (OR, 2.28; 95% CI, 1.42-3.68), and lower quality of care (OR, 2.31; 95% CI, 1.87-2.85). System-reported instances of patient safety issues and low professionalism were not statistically significant, but the subgroup differences did reach statistical significance (Cohen Q, 8.14; P = .007). Among residents and physicians in their early career, there was a greater association between burnout and low professionalism (OR, 3.39; 95% CI, 2.38-4.40), compared with physicians in the middle or later in their career (OR, 1.73; 95% CI, 1.46-2.01; Cohen Q, 7.27; P = .003).
“Investments in organizational strategies to jointly monitor and improve physician wellness and patient care outcomes are needed,” Dr. Panagioti and her colleagues wrote in the study. “Interventions aimed at improving the culture of health care organizations, as well as interventions focused on individual physicians but supported and funded by health care organizations, are beneficial.”
Researchers noted the study quality was low to moderate. Variation in outcomes across studies, heterogeneity among studies, potential selection bias by excluding gray literature, and the inability to establish causal links from findings because of the cross-sectional nature of the studies analyzed were potential limitations in the study, they reported.
The study was funded by the United Kingdom NIHR School for Primary Care Research and the NIHR Greater Manchester Patient Safety Translational Research Centre. The authors report no relevant conflicts of interest.
SOURCE: Panagioti M et al. JAMA Intern Med. 2018 Sept 4. doi: 10.1001/jamainternmed.2018.3713.
FROM JAMA INTERNAL MEDICINE
Key clinical point: Burnout among physicians was associated with lower quality of care because of unprofessionalism, reduced patient satisfaction, and an increased risk of patient safety issues.
Major finding: Physicians with burnout were significantly associated with higher rates of patient safety issues (odds ratio, 1.96; 95% confidence interval, 1.59-2.40), reduced patient satisfaction (OR, 2.28; 95% CI, 1.42-3.68), and lower quality of care (OR, 2.31; 95% CI, 1.87-2.85).
Study details: A systematic review and meta-analysis of 42,473 physicians from 47 different studies.
Disclosures: The study was funded by the United Kingdom National Institute of Health Research (NIHR) School for Primary Care Research and the NIHR Greater Manchester Patient Safety Translational Research Centre. The authors reported no relevant conflicts of interest.
Source: Panagioti M et al. JAMA Intern Med. 2018 Sept 4. doi: 10.1001/jamainternmed.2018.3713.
New stroke intervention guidelines stress volume
A consensus working group from numerous international societies has published new guidelines for standards of practice in the treatment of acute ischemic stroke (AIS). The new guidelines differ somewhat from the Joint Commission guideline, released in 2015, primarily by raising the bar for the number of mechanical thrombectomy (MT) procedures that level 1 and level 2 stroke centers should perform annually in order to maintain a minimum safety threshold.

Previous studies have shown lower mortality in high-volume centers, but setting minimum standards can be a challenge, especially in under-served countries and localities. The authors, led by first author Laurent Pierot, MD, PhD, of University Hospital Reims (France), acknowledge that newly established level 2 centers may struggle to meet the minimum requirement for MT procedures, but that this is acceptable as long as the volume is expected to meet the minimum within 12-24 months.
The guidelines were created by a working group of delegates from 13 international societies, including the American Society of Neuroradiology, European Stroke Organization, World Stroke Organization, and the Society of NeuroInterventional Surgery.
The publication in 2015 of studies showing the efficacy of MT in anterior circulation emergent large-vessel occlusion (ELVO) stroke patients reverberated through the stroke care community, but posed a challenge in delivering this therapy to populations in diverse localities that have no access to level 1 stroke centers.
The guidelines, published online in the Journal of NeuroInterventional Surgery, aim to ensure that facilities can handle not only the MT procedure, but also the medical management before, during, and after the procedure.
According to the new guidelines, level 2 centers should handle cases when a level 1 center cannot be reached within 2 hours. Level 2 centers should care for at least 100 AIS patients per year and should also have a relationship with a level 1 center to maintain staff training, teleconsultations, referrals, and other collaborations.
Previous studies have identified 35 or 36 MT procedures annually as a threshold to be considered “high volume,” a category that led to lower mortality. The new recommendations fall below that threshold because they are intended to apply broadly, to regions that may be under-served. In highly developed countries, stroke centers should follow regional or national guidelines that have higher limits.
Level 2 centers should perform at least 50 intracranial thrombectomy procedures for ELVO, and a total of 120 diagnostic or interventional neuroendovascular procedures per year. Individual interventionists should conduct at least 15 intracranial thrombectomy and 50 interventional neuroendovascular procedures per year.
Other recommendations cover additional details about personnel, as well as community and emergency medical services outreach.
In many ways, the recommendations are in line with the Joint Commission (TJC), according to David Tirschwell, MD, who is the medical director for the UW Medicine* Comprehensive Stroke Center at Harborview Medical Center, Seattle. He was not involved in the development of the new guidelines.
Dr. Tirschwell noted one key difference with respect to the number of MT procedures required to qualify. TJC offered no minimum annual procedures for Comprehensive Stroke Centers (equivalent to level 1), and only 15 for Thrombectomy Capable Stroke Centers (level 2), versus 50 in the new guidelines. The minimum procedure numbers are also higher for individual clinicians.
The guidelines also recommend that level 2 centers have at least three interventionalists on staff available at all times, while TJC does not address this element of staffing.
“The higher minimum number of procedures in the new international recommendations is a substantial difference and would make it harder for many hospitals to qualify, compared to the TJC requirements. As such, a lower number of hospitals may qualify, and such a barrier could prevent access to mechanical thrombectomy for many patients. On the other hand, the higher minimum number may ensure a higher quality of care, which can be seen as a strong positive feature,” Dr. Tirschwell said.
A spokesman for the Joint Commission and the American Heart Association indicated that they will review the new guidelines and consider whether to make changes to their 2015 guidelines.
SOURCE: Pierot Laurent et al. J Neurointervent Surg. 2018 Aug 28. doi: 10.1136/neurintsurg-2018-014287.
*Updated Sept. 14, 2018.
A consensus working group from numerous international societies has published new guidelines for standards of practice in the treatment of acute ischemic stroke (AIS). The new guidelines differ somewhat from the Joint Commission guideline, released in 2015, primarily by raising the bar for the number of mechanical thrombectomy (MT) procedures that level 1 and level 2 stroke centers should perform annually in order to maintain a minimum safety threshold.
Previous studies have shown lower mortality in high-volume centers, but setting minimum standards can be a challenge, especially in under-served countries and localities. The authors, led by first author Laurent Pierot, MD, PhD, of University Hospital Reims (France), acknowledge that newly established level 2 centers may struggle to meet the minimum requirement for MT procedures, but that this is acceptable as long as the volume is expected to meet the minimum within 12-24 months.
The guidelines were created by a working group of delegates from 13 international societies, including the American Society of Neuroradiology, European Stroke Organization, World Stroke Organization, and the Society of NeuroInterventional Surgery.
The publication in 2015 of studies showing the efficacy of MT in anterior circulation emergent large-vessel occlusion (ELVO) stroke patients reverberated through the stroke care community, but posed a challenge in delivering this therapy to populations in diverse localities that have no access to level 1 stroke centers.
The guidelines, published online in the Journal of NeuroInterventional Surgery, aim to ensure that facilities can handle not only the MT procedure, but also the medical management before, during, and after the procedure.
According to the new guidelines, level 2 centers should handle cases when a level 1 center cannot be reached within 2 hours. Level 2 centers should care for at least 100 AIS patients per year and should also have a relationship with a level 1 center to maintain staff training, teleconsultations, referrals, and other collaborations.
Previous studies have identified 35 or 36 MT procedures annually as a threshold to be considered “high volume,” a category that led to lower mortality. The new recommendations fall below that threshold because they are intended to apply broadly, to regions that may be under-served. In highly developed countries, stroke centers should follow regional or national guidelines that have higher limits.
Level 2 centers should perform at least 50 intracranial thrombectomy procedures for ELVO, and a total of 120 diagnostic or interventional neuroendovascular procedures per year. Individual interventionists should conduct at least 15 intracranial thrombectomy and 50 interventional neuroendovascular procedures per year.
Other recommendations cover additional details about personnel, as well as community and emergency medical services outreach.
In many ways, the recommendations are in line with the Joint Commission (TJC), according to David Tirschwell, MD, who is the medical director for the UW Medicine* Comprehensive Stroke Center at Harborview Medical Center, Seattle. He was not involved in the development of the new guidelines.
Dr. Tirschwell noted one key difference with respect to the number of MT procedures required to qualify. TJC offered no minimum annual procedures for Comprehensive Stroke Centers (equivalent to level 1), and only 15 for Thrombectomy Capable Stroke Centers (level 2), versus 50 in the new guidelines. The minimum procedure numbers are also higher for individual clinicians.
The guidelines also recommend that level 2 centers have at least three interventionalists on staff available at all times, while TJC does not address this element of staffing.
“The higher minimum number of procedures in the new international recommendations is a substantial difference and would make it harder for many hospitals to qualify, compared to the TJC requirements. As such, a lower number of hospitals may qualify, and such a barrier could prevent access to mechanical thrombectomy for many patients. On the other hand, the higher minimum number may ensure a higher quality of care, which can be seen as a strong positive feature,” Dr. Tirschwell said.
A spokesman for the Joint Commission and the American Heart Association indicated that they will review the new guidelines and consider whether to make changes to their 2015 guidelines.
SOURCE: Pierot Laurent et al. J Neurointervent Surg. 2018 Aug 28. doi: 10.1136/neurintsurg-2018-014287.
*Updated Sept. 14, 2018.
FROM THE JOURNAL OF NEUROINTERVENTIONAL SURGERY
NYC outbreak of Candida auris linked to 45% mortality
Mortality within 90 days of infection was 45% among 51 patients diagnosed with antibiotic-resistant Candida auris infections in a multihospital outbreak in New York City from 2012 to 2017.
Transmission is ongoing in health care facilities, primarily among patients with extensive health care exposures, according to a report published in Emerging Infectious Diseases.

“Intensive infection prevention and control efforts continue; the goals are delaying endemicity, preventing outbreaks within facilities, reducing transmission and geographic spread, and blunting the effect of C. auris in New York and the rest of the United States,” Eleanor Adams, MD, of the New York Health Department, and her colleagues wrote. “Among medically fragile patients in NYC who had a history of extensive contact with health care facilities, clinicians should include C. auris in the differential diagnosis for patients with symptoms compatible with bloodstream infection.”
In the intensive case-patient analysis conducted by the New York State Health Department, 21 cases were from seven hospitals in Brooklyn, 16 were from three hospitals and one private medical office in Queens, 12 were from five hospitals and one long-term acute care hospital in Manhattan, and 1 was from a hospital in the Bronx. The remaining clinical case was identified in a western New York hospital in a patient who had recently been admitted to an involved Brooklyn hospital.
Among these patients, 31 (61%) had resided in long-term care facilities immediately before being admitted to the hospital in which their infection was diagnosed, and 19 of these 31 resided in skilled nursing facilities with ventilator beds; 1 (2%) resided in a long-term acute care hospital; 5 (10%) had been transferred from another hospital; and 4 (8%) had traveled internationally within 5 years before diagnosis, according to the investigators.
Isolates from 50 patients (98%) were resistant to fluconazole and 13 (25%) were resistant to fluconazole and amphotericin B. No initial isolates were resistant to echinocandins, although subsequent isolates obtained from 3 persons who had received an echinocandin acquired resistance to it, according to the researchers. Whole-genome sequencing performed at The Centers for Disease Control and Prevention indicated that 50 of 51 isolates belonged to a South Asia clade; the remaining isolate was the only one susceptible to fluconazole.
The work was supported by the CDC. No disclosures were reported.
SOURCE: Adams E et al. Emerg Infect Dis. 2018 Sep 12; 24(10); ID: 18-0649.
Mortality within 90 days of infection was 45% among 51 patients diagnosed with antibiotic-resistant Candida auris infections in a multihospital outbreak in New York City from 2012 to 2017.
Transmission is ongoing in health care facilities, primarily among patients with extensive health care exposures, according to a report published in Emerging Infectious Diseases.
“Intensive infection prevention and control efforts continue; the goals are delaying endemicity, preventing outbreaks within facilities, reducing transmission and geographic spread, and blunting the effect of C. auris in New York and the rest of the United States,” Eleanor Adams, MD, of the New York Health Department, and her colleagues wrote. “Among medically fragile patients in NYC who had a history of extensive contact with health care facilities, clinicians should include C. auris in the differential diagnosis for patients with symptoms compatible with bloodstream infection.”
In the intensive case-patient analysis conducted by the New York State Health Department, 21 cases were from seven hospitals in Brooklyn, 16 were from three hospitals and one private medical office in Queens, 12 were from five hospitals and one long-term acute care hospital in Manhattan, and 1 was from a hospital in the Bronx. The remaining clinical case was identified in a western New York hospital in a patient who had recently been admitted to an involved Brooklyn hospital.
Among these patients, 31 (61%) had resided in long-term care facilities immediately before being admitted to the hospital in which their infection was diagnosed, and 19 of these 31 resided in skilled nursing facilities with ventilator beds; 1 (2%) resided in a long-term acute care hospital; 5 (10%) had been transferred from another hospital; and 4 (8%) had traveled internationally within 5 years before diagnosis, according to the investigators.
Isolates from 50 patients (98%) were resistant to fluconazole and 13 (25%) were resistant to fluconazole and amphotericin B. No initial isolates were resistant to echinocandins, although subsequent isolates obtained from 3 persons who had received an echinocandin acquired resistance to it, according to the researchers. Whole-genome sequencing performed at The Centers for Disease Control and Prevention indicated that 50 of 51 isolates belonged to a South Asia clade; the remaining isolate was the only one susceptible to fluconazole.
The work was supported by the CDC. No disclosures were reported.
SOURCE: Adams E et al. Emerg Infect Dis. 2018 Sep 12; 24(10); ID: 18-0649.
FROM EMERGING INFECTIOUS DISEASES
Pregnancy boosts cardiac disease mortality nearly 100-fold
MUNICH – Women with cardiac disease who became pregnant had a nearly 100-fold higher mortality rate, compared with pregnant women without cardiac disease, according to the outcomes of more than 5,700 pregnancies in an international registry of women with cardiac disease.

In addition to increased mortality, women with cardiac disease who become pregnant also had a greater than 100-fold higher rate of developing heart failure, compared with pregnant women without cardiac disease.
Despite these highly elevated relative risks, the absolute rate of serious complications from pregnancy for most women with heart disease was relatively modest. The worst prognosis by far was for the 1% of women in the registry who had pulmonary arterial hypertension at the time their pregnancy began. For these women, mortality during pregnancy was about 9%, and new-onset heart failure occurred in about one third. Another subgroup showing particularly poor outcomes were women classified with WHO IV maternal cardiovascular risk by the modified World Health Organization criteria, which corresponds to having an “extremely high risk of maternal mortality or severe morbidity,” according to guidelines published in the European Heart Journal (2011 Dec 1;32[24]:3147-97).These women, constituting 7% of the registry cohort, had a 2.5% mortality rate during pregnancy and a 33% incidence of heart failure.
Across all women with cardiac disease enrolled in the registry, the incidence of death during pregnancy was 0.6% and the incidence of heart failure was 11%. Women without cardiac disease have rates of 0.007% and less than 0.1%, respectively, Jolien Roos-Hesselink, MD, said at the annual congress of the European Society of Cardiology.
“The most important message of my talk is that all patients should be counseled, not just the women at high risk, for whom pregnancy is contraindicated, but also the women at low risk,” who can have a child with relative safety, she said. “Many women [with cardiac disease] can go through pregnancy at low risk.” Counseling is the key so that women know their risk before becoming pregnant, stressed Dr. Roos-Hesselink, a cardiologist at Erasmus Medical Center in Rotterdam, the Netherlands.
Based on the observed rates of mortality and other complications, pulmonary arterial hypertension and the other cardiac conditions that define a WHO IV maternal risk classification remain contraindications for pregnancy, she said. According to the 2011 guidelines from the European Society of Cardiology for managing cardiovascular disease during pregnancy, the full list of conditions that define a WHO IV classification are the following:
- Pulmonary arterial hypertension of any cause.
- Severe systemic ventricular dysfunction (a left ventricular ejection fraction of less than 30%) or New York Heart Association functional class III or IV.
- Previous peripartum cardiomyopathy with any residual impairment of left ventricular function.
- Severe mitral stenosis or severe symptomatic aortic stenosis.
- Marfan syndrome with the aorta dilated to more than 45 mm.
- Aortic dilatation greater than 50 mm in aortic disease associated with a bicuspid aortic valve.
- Native severe coarctation.
The registry data, collected during 2007-2018, showed a clear increase in the percentage of women with WHO class IV cardiovascular disease who became pregnant and entered the registry despite the contraindication designation for that classification, rising from about 1% of enrolled women in 2008 and 2009 to more than 10% of women in 2013, 2016, and 2017. “Individualization is necessary, but all these women are at very high risk and should be counseled against pregnancy,” Dr. Roos-Hesselink said.
The Registry of Pregnancy and Cardiac Disease (ROPAC) enrolled 5,739 pregnant women at any of 138 participating centers in 53 countries including the United States. Clinicians submitted WHO classification of cardiovascular risk for 5,711 of these women. The most common risk was congenital heart disease in 57% of enrolled women, followed by valvular heart disease in 29% and cardiomyopathy in 7%. Nearly 1,200 women in the registry – about 21% of the total – had a WHO I classification, which meant that they would be expected to have no detectable increase in mortality rate during pregnancy, compared with women without cardiac disease, and either no rise in morbidity or a mild effect.
Delivery was by cesarean section in 44% of the pregnancies, roughly twice the rate in women without diagnosed cardiac disease, even though published guidelines don’t advise cesarean delivery because of cardiac disease, Dr. Roos-Hesselink said. “Cesarean sections are used too often, in my opinion,” she commented, but added that many of these women require delivery at a tertiary, specialized center.
Overall fetal mortality was 1%, nearly threefold higher than in pregnancies in women without cardiac disease, and the overall incidence of fetal and neonatal complications was especially high, at 53%, in women with pulmonary arterial hypertension. The incidence of obstetrical complications was roughly similar across the range of cardiac disease type, ranging from 16% to 24%. Premature delivery occurred in 28% of women in the high-risk WHO IV class, compared with a 13% rate among women in the WHO I class. The mortality rate was 0.2% among the WHO class I women, and their heart failure incidence was 5%.
The ROPAC registry is sponsored by the European Society of Cardiology. Dr. Roos-Hesselink had no disclosures.
MUNICH – Women with cardiac disease who became pregnant had a nearly 100-fold higher mortality rate, compared with pregnant women without cardiac disease, according to the outcomes of more than 5,700 pregnancies in an international registry of women with cardiac disease.
In addition to increased mortality, women with cardiac disease who become pregnant also had a greater than 100-fold higher rate of developing heart failure, compared with pregnant women without cardiac disease.
Despite these highly elevated relative risks, the absolute rate of serious complications from pregnancy for most women with heart disease was relatively modest. The worst prognosis by far was for the 1% of women in the registry who had pulmonary arterial hypertension at the time their pregnancy began. For these women, mortality during pregnancy was about 9%, and new-onset heart failure occurred in about one third. Another subgroup showing particularly poor outcomes were women classified with WHO IV maternal cardiovascular risk by the modified World Health Organization criteria, which corresponds to having an “extremely high risk of maternal mortality or severe morbidity,” according to guidelines published in the European Heart Journal (2011 Dec 1;32[24]:3147-97).These women, constituting 7% of the registry cohort, had a 2.5% mortality rate during pregnancy and a 33% incidence of heart failure.
Across all women with cardiac disease enrolled in the registry, the incidence of death during pregnancy was 0.6% and the incidence of heart failure was 11%. Women without cardiac disease have rates of 0.007% and less than 0.1%, respectively, Jolien Roos-Hesselink, MD, said at the annual congress of the European Society of Cardiology.
“The most important message of my talk is that all patients should be counseled, not just the women at high risk, for whom pregnancy is contraindicated, but also the women at low risk,” who can have a child with relative safety, she said. “Many women [with cardiac disease] can go through pregnancy at low risk.” Counseling is the key so that women know their risk before becoming pregnant, stressed Dr. Roos-Hesselink, a cardiologist at Erasmus Medical Center in Rotterdam, the Netherlands.
Based on the observed rates of mortality and other complications, pulmonary arterial hypertension and the other cardiac conditions that define a WHO IV maternal risk classification remain contraindications for pregnancy, she said. According to the 2011 guidelines from the European Society of Cardiology for managing cardiovascular disease during pregnancy, the full list of conditions that define a WHO IV classification are the following:
- Pulmonary arterial hypertension of any cause.
- Severe systemic ventricular dysfunction (a left ventricular ejection fraction of less than 30%) or New York Heart Association functional class III or IV.
- Previous peripartum cardiomyopathy with any residual impairment of left ventricular function.
- Severe mitral stenosis or severe symptomatic aortic stenosis.
- Marfan syndrome with the aorta dilated to more than 45 mm.
- Aortic dilatation greater than 50 mm in aortic disease associated with a bicuspid aortic valve.
- Native severe coarctation.
The registry data, collected during 2007-2018, showed a clear increase in the percentage of women with WHO class IV cardiovascular disease who became pregnant and entered the registry despite the contraindication designation for that classification, rising from about 1% of enrolled women in 2008 and 2009 to more than 10% of women in 2013, 2016, and 2017. “Individualization is necessary, but all these women are at very high risk and should be counseled against pregnancy,” Dr. Roos-Hesselink said.
The Registry of Pregnancy and Cardiac Disease (ROPAC) enrolled 5,739 pregnant women at any of 138 participating centers in 53 countries including the United States. Clinicians submitted WHO classification of cardiovascular risk for 5,711 of these women. The most common risk was congenital heart disease in 57% of enrolled women, followed by valvular heart disease in 29% and cardiomyopathy in 7%. Nearly 1,200 women in the registry – about 21% of the total – had a WHO I classification, which meant that they would be expected to have no detectable increase in mortality rate during pregnancy, compared with women without cardiac disease, and either no rise in morbidity or a mild effect.
Delivery was by cesarean section in 44% of the pregnancies, roughly twice the rate in women without diagnosed cardiac disease, even though published guidelines don’t advise cesarean delivery because of cardiac disease, Dr. Roos-Hesselink said. “Cesarean sections are used too often, in my opinion,” she commented, but added that many of these women require delivery at a tertiary, specialized center.
Overall fetal mortality was 1%, nearly threefold higher than in pregnancies in women without cardiac disease, and the overall incidence of fetal and neonatal complications was especially high, at 53%, in women with pulmonary arterial hypertension. The incidence of obstetrical complications was roughly similar across the range of cardiac disease type, ranging from 16% to 24%. Premature delivery occurred in 28% of women in the high-risk WHO IV class, compared with a 13% rate among women in the WHO I class. The mortality rate was 0.2% among the WHO class I women, and their heart failure incidence was 5%.
The ROPAC registry is sponsored by the European Society of Cardiology. Dr. Roos-Hesselink had no disclosures.
REPORTING FROM THE ESC CONGRESS 2018
Key clinical point: Women with cardiac disease who became pregnant had substantially increased mortality and morbidity.
Major finding: Pregnancy mortality was 0.6% in women with cardiac disease versus 0.007% in women without cardiac disorders.
Study details: The ROPAC registry, which enrolled 5,739 pregnant women at any of 138 centers in 53 countries during 2007-2018.
Disclosures: The ROPAC registry is sponsored by the European Society of Cardiology. Dr. Roos-Hesselink had no disclosures.