User login
Effect of In-Office Samples on Dermatologists’ Prescribing Habits: A Retrospective Review
Over the years, there has been growing concern about the relationship between physicians and pharmaceutical companies. Many studies have demonstrated that pharmaceutical interactions and incentives can influence physicians’ prescribing habits.1-3 As a result, many academic centers have adopted policies that attempt to limit the pharmaceutical industry’s influence on faculty and in-training physicians. Although these policies can vary greatly, they generally limit access of pharmaceutical representatives to providers and restrict pharmaceutical samples.4,5 This policy shift has even been reported in private practice.6
At the heart of the matter is the question: What really influences physicians to write a prescription for a particular medication? Is it cost, efficacy, or representatives pushing a product? Prior studies illustrate that generic medications are equivalent to their brand-name counterparts. In fact, current regulations require no more than 5% to 7% difference in bioequivalence.7-9 Although most generic medications are bioequivalent, it may not be universal.10
Garrison and Levin11 distributed a survey to US-based prescribers in family practice, psychiatry, and internal medicine and found that prescribers deemed patient response and success as the highest priority when determining which drugs to prescribe. In contrast, drug representatives and free samples only slightly contributed.11 Considering the minimum duration for efficacy of a medication such as an antidepressant vs a topical steroid, this pattern may differ with samples in dermatologic settings. Interestingly, another survey concluded that samples were associated with “sticky” prescribing habits, noting that physicians would prescribe a brand-name medication after using a sample, despite increased cost to the patient.12 Further, it has been suggested that recipients of free samples may experience increased costs in the long run, which contrasts a stated goal of affordability to patients.12,13
Physician interaction with pharmaceutical companies begins as early as medical school,14 with physicians reporting interactions as often as 4 times each month.14-18 Interactions can include meetings with pharmaceutical representatives, sponsored meals, gifts, continuing medical education sponsorship, funding for travel, pharmaceutical representative speakers, research funding, and drug samples.3
A 2014 study reported that prescribing habits are influenced by the free drug samples provided by nongeneric pharmaceutical companies.19 Nationally, the number of brand-name and branded generic medications constitute 79% of prescriptions, yet together they only comprise 17% of medications prescribed at an academic medical clinic that does not provide samples. The number of medications with samples being prescribed by dermatologists increased by 15% over 9 years, which may correlate with the wider availability of medication samples, more specifically an increase in branded generic samples.19 This potential interaction is the reason why institutions question the current influence of pharmaceutical companies. Samples may appear convenient, allowing a patient to test the medication prior to committing; however, with brand-name samples being provided to the physician, he/she may become more inclined to prescribe the branded medication.12,15,19-22 Because brand-name medications are more expensive than generic medications, this practice can increase the cost of health care.13 One study found that over 1 year, the overuse of nongeneric medications led to a loss of potential savings throughout 49 states, equating to $229 million just through Medicaid; interestingly, it was noted that in some states, a maximum reimbursement is set by Medicaid, regardless of whether the generic or branded medication is dispensed. The authors also noted variability in the potential savings by state, which may be a function of the state-by-state maximum reimbursements for certain medications.23 Another study on oral combination medications estimated Medicare spending on branded drugs relative to the cost if generic combinations had been purchased instead. This study examined branded medications for which the active components were available as over-the-counter (OTC), generic, or same-class generic, and the authors estimated that $925 million could have been saved in 2016 by purchasing a generic substitute.24 The overuse of nongeneric medications when generic alternatives are available becomes an issue that not only financially impacts patients but all taxpayers. However, this pattern may differ if limited only to dermatologic medications, which was not the focus of the prior studies.
To limit conflicts of interest in interactions with the pharmaceutical, medical device, and biotechnology industries, the University of South Florida (USF) Morsani College of Medicine (COM)(Tampa, Florida) implemented its own set of regulations that eliminated in-office pharmaceutical samples, in addition to other restrictions. This study aimed to investigate if there was a change in the prescribing habits of academic dermatologists after their medical school implemented these new policies.
We hypothesized that the number of brand-name drugs prescribed by physicians in the Department of Dermatology & Cutaneous Surgery would change following USF Morsani COM pharmaceutical policy changes. We sought to determine how physician prescribing practices within the Department of Dermatology & Cutaneous Surgery changed following USF Morsani COM pharmaceutical policy changes.
Methods
Data Collection
A retrospective review of medical records was conducted to investigate the effect of the USF Morsani COM pharmaceutical policy changes on physician prescribing practices within the Department of Dermatology & Cutaneous Surgery. Medical records of patients seen for common dermatology diagnoses before (January 1, 2010, to May 30, 2010) and after (August 1, 2011, to December 31, 2011) the pharmaceutical policy changes were reviewed, and all medications prescribed were recorded. Data were collected from medical records within the USF Health electronic medical record system and included visits with each of the department’s 3 attending dermatologists. The diagnoses included in the study—acne vulgaris, atopic dermatitis, onychomycosis, psoriasis, and rosacea—were chosen because in-office samples were available. Prescribing data from the first 100 consecutive medical records were collected from each time period, and a medical record was included only if it contained at least 1 of the following diagnoses: acne vulgaris, atopic dermatitis, onychomycosis, psoriasis, or rosacea. The assessment and plan of each progress note were reviewed, and the exact medication name and associated diagnosis were recorded for each prescription. Subsequently, each medication was reviewed and placed in 1 of 3 categories: brand name, generic, and OTC. The total number of prescriptions for each diagnosis (per visit/note); the specific number of brand, generic, and OTC medications prescribed (per visit/note); and the percentage of brand, generic, and OTC medications prescribed (per visit/note and per diagnosis in total) were calculated. To ensure only intended medications were included, each medication recorded in the medical record note was cross-referenced with the prescribed medication in the electronic medical record. The primary objective of this study was to capture the prescribing physician’s intent as proxied by the pattern of prescription. Thus, changes made in prescriptions after the initial plan—whether insurance related or otherwise—were not relevant to this investigation.
The data were collected to compare the percentage of brand vs generic or OTC prescriptions per diagnosis to see if there was a difference in the prescribing habits before and after the pharmaceutical policy changes. Of note, several other pieces of data were collected from each medical record, including age, race, class of insurance (ie, Medicare, Medicaid, private health maintenance organization, private preferred provider organization), subtype diagnoses, and whether the prescription was new or a refill. The information gathered from the written record on the assessment and plan was verified using prescriptions ordered in the Allscripts electronic record, and any difference was noted. No identifying information that could be used to easily identify study participants was recorded.
Differences in prescribing habits across diagnoses before and after the policy changes were ascertained using a Fisher exact test and were further assessed using a mixed effects ordinal logistic regression model that accounted for within-provider clustering and baseline patient characteristics. An ordinal model was chosen to recognize differences in average cost among brand-name, generic, and OTC medications.
Results
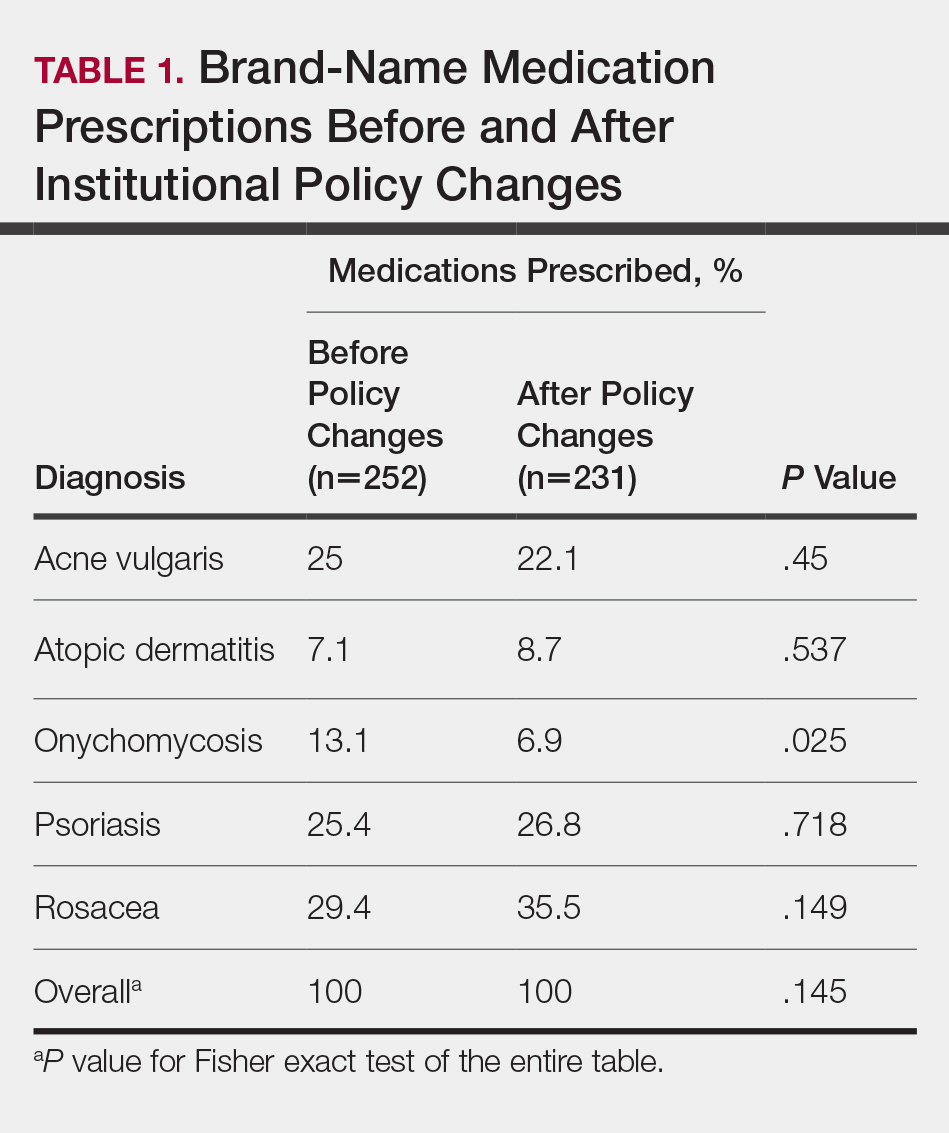
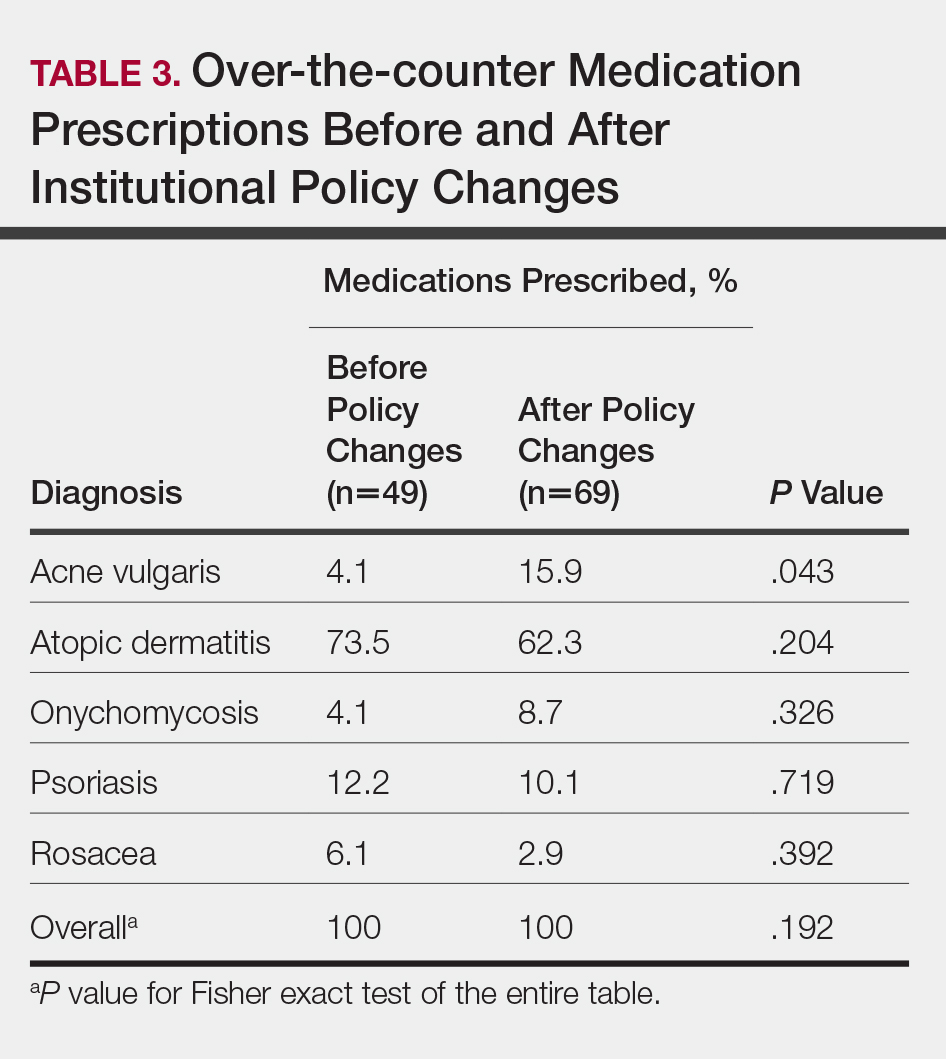
In total, 200 medical records were collected. For the period analyzed before the policy change, 252 brand-name medications were prescribed compared to 231 prescribed for the period analyzed after the policy changes. There was insufficient evidence of an overall difference in brand-name medications prescribed before and after the policy changes (P=.145; Fisher exact test)(Table 1). There also was insufficient evidence of an overall difference in generic prescriptions, which totaled 153 before and 134 after the policy changes (P=.872; Fisher exact test)(Table 2). Over-the-counter prescriptions totaled 49 before and 69 after the policy changes. There was insufficient evidence of an overall difference before and after the policy changes for OTC medications (P=.192; Fisher exact test)(Table 3).

Comment
Although some medical institutions are diligently working to limit the potential influence pharmaceutical companies have on physician prescribing habits,4,5,25 the effect on physician prescribing habits is only now being established.15 Prior studies12,19,21 have found evidence that medication samples may lead to overuse of brand-name medications, but these findings do not hold true for the USF dermatologists included in this study, perhaps due to the difference in pharmaceutical company interactions or physicians maintaining prior prescription habits that were unrelated to the policy. Although this study focused on policy changes for in-office samples, prior studies either included other forms of interaction21 or did not include samples.22
Pharmaceutical samples allow patients to try a medication before committing to a long-term course of treatment with a particular medication, which has utility for physicians and patients. Although brand-name prescriptions may cost more, a trial period may assist the patient in deciding whether the medication is worth purchasing. Furthermore, physicians may feel more comfortable prescribing a medication once the individual patient has demonstrated a benefit from the sample, which may be particularly true in a specialty such as dermatology in which many branded topical medications contain a different vehicle than generic formulations, resulting in notable variations in active medication delivery and efficacy. Given the higher cost of branded topical medications, proving efficacy in patients through samples can provide a useful tool to the physician to determine the need for a branded formulation.
The benefits described are subjective but should not be disregarded. Although Hurley et al19 found that the number of brand-name medications prescribed increases as more samples are given out, our study demonstrated that after eliminating medication samples, there was no significant difference in the percentage of brand-name medications prescribed compared to generic and OTC medications.
Physician education concerning the price of each brand-name medication prescribed in office may be one method of reducing the amount of such prescriptions. Physicians generally are uninformed of the cost of the medications being prescribed26 and may not recognize the financial burden one medication may have compared to its alternative. However, educating physicians will empower them to make the conscious decision to prefer or not prefer a brand-name medication. With some generic medications shown to have a difference in bioequivalence compared to their brand-name counterparts, a physician may find more success prescribing the brand-name medications, regardless of pharmaceutical company influence, which is an alternative solution to policy changes that eliminate samples entirely. Although this study found insufficient evidence that removing samples decreases brand-name medication prescriptions, it is imperative that solutions are established to reduce the country’s increasing burden of medical costs.
Possible shortfalls of this study include the short period of time between which prepolicy data and postpolicy data were collected. It is possible that providers did not have enough time to adjust their prescribing habits or that providers would not have changed a prescribing pattern or preference simply because of a policy change. Future studies could allow a time period greater than 2 years to compare prepolicy and postpolicy prescribing habits, or a future study might make comparisons of prescriber patterns at different institutions that have different policies. Another possible shortfall is that providers and patients were limited to those at the Department of Dermatology & Cutaneous Surgery at the USF Morsani COM. Although this study has found insufficient evidence of a difference in prescribing habits, it may be beneficial to conduct a larger study that encompasses multiple academic institutions with similar policy changes. Most importantly, this study only investigated the influence of in-office pharmaceutical samples on prescribing patterns. This study did not look at the many other ways in which providers may be influenced by pharmaceutical companies, which likely is a significant confounding variable in this study. Continued additional studies that specifically examine other methods through which providers may be influenced would be helpful in further examining the many ways in which physician prescription habits are influenced.
Conclusion
Changes in pharmaceutical policy in 2011 at USF Morsani COM specifically banned in-office samples. The totality of evidence in this study shows modest observational evidence of a change in the postpolicy odds relative to prepolicy odds, but the data also are compatible with no change between prescribing habits before and after the policy changes. Further study is needed to fully understand this relationship.
- Sondergaard J, Vach K, Kragstrup J, et al. Impact of pharmaceutical representative visits on GPs’ drug preferences. Fam Pract. 2009;26:204-209.
- Jelinek GA, Neate SL. The influence of the pharmaceutical industry in medicine. J Law Med. 2009;17:216-223.
- Wazana A. Physicians and the pharmaceutical industry: is a gift ever just a gift? JAMA. 2000;283:373-380.
- Coleman DL. Establishing policies for the relationship between industry and clinicians: lessons learned from two academic health centers. Acad Med. 2008;83:882-887.
- Coleman DL, Kazdin AE, Miller LA, et al. Guidelines for interactions between clinical faculty and the pharmaceutical industry: one medical school’s approach. Acad Med. 2006;81:154-160.
- Evans D, Hartung DM, Beasley D, et al. Breaking up is hard to do: lessons learned from a pharma-free practice transformation. J Am Board Fam Med. 2013;26:332-338.
- Davit BM, Nwakama PE, Buehler GJ, et al. Comparing generic and innovator drugs: a review of 12 years of bioequivalence data from the United States Food and Drug Administration. Ann Pharmacother. 2009;43:1583-1597.
- Kesselheim AS, Misono AS, Lee JL, et al. Clinical equivalence of generic and brand-name drugs used in cardiovascular disease: a systematic review and meta-analysis. JAMA. 2008;300:2514-2526.
- McCormack J, Chmelicek JT. Generic versus brand name: the other drug war. Can Fam Physician. 2014;60:911.
- Borgheini G. The bioequivalence and therapeutic efficacy of generic versus brand-name psychoactive drugs. Clin Ther. 2003;25:1578-1592.
- Garrison GD, Levin GM. Factors affecting prescribing of the newer antidepressants. Ann Pharmacother. 2000;34:10-14.
- Rafique S, Sarwar W, Rashid A, et al. Influence of free drug samples on prescribing by physicians: a cross sectional survey. J Pak Med Assoc. 2017;67:465-467.
- Alexander GC, Zhang J, Basu A. Characteristics of patients receiving pharmaceutical samples and association between sample receipt and out-of-pocket prescription costs. Med Care. 2008;46:394-402.
- Hodges B. Interactions with the pharmaceutical industry: experiences and attitudes of psychiatry residents, interns and clerks. CMAJ. 1995;153:553-559.
- Brotzman GL, Mark DH. The effect on resident attitudes of regulatory policies regarding pharmaceutical representative activities. J Gen Intern Med. 1993;8:130-134.
- Keim SM, Sanders AB, Witzke DB, et al. Beliefs and practices of emergency medicine faculty and residents regarding professional interactions with the biomedical industry. Ann Emerg Med. 1993;22:1576-1581.
- Thomson AN, Craig BJ, Barham PM. Attitudes of general practitioners in New Zealand to pharmaceutical representatives. Br J Gen Pract. 1994;44:220-223.
- Ziegler MG, Lew P, Singer BC. The accuracy of drug information from pharmaceutical sales representatives. JAMA. 1995;273:1296-1298.
- Hurley MP, Stafford RS, Lane AT. Characterizing the relationship between free drug samples and prescription patterns for acne vulgaris and rosacea. JAMA Dermatol. 2014;150:487-493.
- Lexchin J. Interactions between physicians and the pharmaceutical industry: what does the literature say? CMAJ. 1993;149:1401-1407.
- Lieb K, Scheurich A. Contact between doctors and the pharmaceutical industry, their perceptions, and the effects on prescribing habits. PLoS One. 2014;9:e110130.
- Spurling GK, Mansfield PR, Montgomery BD, et al. Information from pharmaceutical companies and the quality, quantity, and cost of physicians’ prescribing: a systematic review. PLoS Med. 2010;7:e1000352.
- Fischer MA, Avorn J. Economic consequences of underuse of generic drugs: evidence from Medicaid and implications for prescription drug benefit plans. Health Serv Res. 2003;38:1051-1064.
- Sacks CA, Lee CC, Kesselheim AS, et al. Medicare spending on brand-name combination medications vs their generic constituents. JAMA. 2018;320:650-656.
- Brennan TA, Rothman DJ, Blank L, et al. Health industry practices that create conflicts of interest: a policy proposal for academic medical centers. JAMA. 2006;295:429-433.
- Allan GM, Lexchin J, Wiebe N. Physician awareness of drug cost: a systematic review. PLoS Med. 2007;4:e283.
Over the years, there has been growing concern about the relationship between physicians and pharmaceutical companies. Many studies have demonstrated that pharmaceutical interactions and incentives can influence physicians’ prescribing habits.1-3 As a result, many academic centers have adopted policies that attempt to limit the pharmaceutical industry’s influence on faculty and in-training physicians. Although these policies can vary greatly, they generally limit access of pharmaceutical representatives to providers and restrict pharmaceutical samples.4,5 This policy shift has even been reported in private practice.6
At the heart of the matter is the question: What really influences physicians to write a prescription for a particular medication? Is it cost, efficacy, or representatives pushing a product? Prior studies illustrate that generic medications are equivalent to their brand-name counterparts. In fact, current regulations require no more than 5% to 7% difference in bioequivalence.7-9 Although most generic medications are bioequivalent, it may not be universal.10
Garrison and Levin11 distributed a survey to US-based prescribers in family practice, psychiatry, and internal medicine and found that prescribers deemed patient response and success as the highest priority when determining which drugs to prescribe. In contrast, drug representatives and free samples only slightly contributed.11 Considering the minimum duration for efficacy of a medication such as an antidepressant vs a topical steroid, this pattern may differ with samples in dermatologic settings. Interestingly, another survey concluded that samples were associated with “sticky” prescribing habits, noting that physicians would prescribe a brand-name medication after using a sample, despite increased cost to the patient.12 Further, it has been suggested that recipients of free samples may experience increased costs in the long run, which contrasts a stated goal of affordability to patients.12,13
Physician interaction with pharmaceutical companies begins as early as medical school,14 with physicians reporting interactions as often as 4 times each month.14-18 Interactions can include meetings with pharmaceutical representatives, sponsored meals, gifts, continuing medical education sponsorship, funding for travel, pharmaceutical representative speakers, research funding, and drug samples.3
A 2014 study reported that prescribing habits are influenced by the free drug samples provided by nongeneric pharmaceutical companies.19 Nationally, the number of brand-name and branded generic medications constitute 79% of prescriptions, yet together they only comprise 17% of medications prescribed at an academic medical clinic that does not provide samples. The number of medications with samples being prescribed by dermatologists increased by 15% over 9 years, which may correlate with the wider availability of medication samples, more specifically an increase in branded generic samples.19 This potential interaction is the reason why institutions question the current influence of pharmaceutical companies. Samples may appear convenient, allowing a patient to test the medication prior to committing; however, with brand-name samples being provided to the physician, he/she may become more inclined to prescribe the branded medication.12,15,19-22 Because brand-name medications are more expensive than generic medications, this practice can increase the cost of health care.13 One study found that over 1 year, the overuse of nongeneric medications led to a loss of potential savings throughout 49 states, equating to $229 million just through Medicaid; interestingly, it was noted that in some states, a maximum reimbursement is set by Medicaid, regardless of whether the generic or branded medication is dispensed. The authors also noted variability in the potential savings by state, which may be a function of the state-by-state maximum reimbursements for certain medications.23 Another study on oral combination medications estimated Medicare spending on branded drugs relative to the cost if generic combinations had been purchased instead. This study examined branded medications for which the active components were available as over-the-counter (OTC), generic, or same-class generic, and the authors estimated that $925 million could have been saved in 2016 by purchasing a generic substitute.24 The overuse of nongeneric medications when generic alternatives are available becomes an issue that not only financially impacts patients but all taxpayers. However, this pattern may differ if limited only to dermatologic medications, which was not the focus of the prior studies.
To limit conflicts of interest in interactions with the pharmaceutical, medical device, and biotechnology industries, the University of South Florida (USF) Morsani College of Medicine (COM)(Tampa, Florida) implemented its own set of regulations that eliminated in-office pharmaceutical samples, in addition to other restrictions. This study aimed to investigate if there was a change in the prescribing habits of academic dermatologists after their medical school implemented these new policies.
We hypothesized that the number of brand-name drugs prescribed by physicians in the Department of Dermatology & Cutaneous Surgery would change following USF Morsani COM pharmaceutical policy changes. We sought to determine how physician prescribing practices within the Department of Dermatology & Cutaneous Surgery changed following USF Morsani COM pharmaceutical policy changes.
Methods
Data Collection
A retrospective review of medical records was conducted to investigate the effect of the USF Morsani COM pharmaceutical policy changes on physician prescribing practices within the Department of Dermatology & Cutaneous Surgery. Medical records of patients seen for common dermatology diagnoses before (January 1, 2010, to May 30, 2010) and after (August 1, 2011, to December 31, 2011) the pharmaceutical policy changes were reviewed, and all medications prescribed were recorded. Data were collected from medical records within the USF Health electronic medical record system and included visits with each of the department’s 3 attending dermatologists. The diagnoses included in the study—acne vulgaris, atopic dermatitis, onychomycosis, psoriasis, and rosacea—were chosen because in-office samples were available. Prescribing data from the first 100 consecutive medical records were collected from each time period, and a medical record was included only if it contained at least 1 of the following diagnoses: acne vulgaris, atopic dermatitis, onychomycosis, psoriasis, or rosacea. The assessment and plan of each progress note were reviewed, and the exact medication name and associated diagnosis were recorded for each prescription. Subsequently, each medication was reviewed and placed in 1 of 3 categories: brand name, generic, and OTC. The total number of prescriptions for each diagnosis (per visit/note); the specific number of brand, generic, and OTC medications prescribed (per visit/note); and the percentage of brand, generic, and OTC medications prescribed (per visit/note and per diagnosis in total) were calculated. To ensure only intended medications were included, each medication recorded in the medical record note was cross-referenced with the prescribed medication in the electronic medical record. The primary objective of this study was to capture the prescribing physician’s intent as proxied by the pattern of prescription. Thus, changes made in prescriptions after the initial plan—whether insurance related or otherwise—were not relevant to this investigation.
The data were collected to compare the percentage of brand vs generic or OTC prescriptions per diagnosis to see if there was a difference in the prescribing habits before and after the pharmaceutical policy changes. Of note, several other pieces of data were collected from each medical record, including age, race, class of insurance (ie, Medicare, Medicaid, private health maintenance organization, private preferred provider organization), subtype diagnoses, and whether the prescription was new or a refill. The information gathered from the written record on the assessment and plan was verified using prescriptions ordered in the Allscripts electronic record, and any difference was noted. No identifying information that could be used to easily identify study participants was recorded.
Differences in prescribing habits across diagnoses before and after the policy changes were ascertained using a Fisher exact test and were further assessed using a mixed effects ordinal logistic regression model that accounted for within-provider clustering and baseline patient characteristics. An ordinal model was chosen to recognize differences in average cost among brand-name, generic, and OTC medications.
Results
In total, 200 medical records were collected. For the period analyzed before the policy change, 252 brand-name medications were prescribed compared to 231 prescribed for the period analyzed after the policy changes. There was insufficient evidence of an overall difference in brand-name medications prescribed before and after the policy changes (P=.145; Fisher exact test)(Table 1). There also was insufficient evidence of an overall difference in generic prescriptions, which totaled 153 before and 134 after the policy changes (P=.872; Fisher exact test)(Table 2). Over-the-counter prescriptions totaled 49 before and 69 after the policy changes. There was insufficient evidence of an overall difference before and after the policy changes for OTC medications (P=.192; Fisher exact test)(Table 3).
Comment
Although some medical institutions are diligently working to limit the potential influence pharmaceutical companies have on physician prescribing habits,4,5,25 the effect on physician prescribing habits is only now being established.15 Prior studies12,19,21 have found evidence that medication samples may lead to overuse of brand-name medications, but these findings do not hold true for the USF dermatologists included in this study, perhaps due to the difference in pharmaceutical company interactions or physicians maintaining prior prescription habits that were unrelated to the policy. Although this study focused on policy changes for in-office samples, prior studies either included other forms of interaction21 or did not include samples.22
Pharmaceutical samples allow patients to try a medication before committing to a long-term course of treatment with a particular medication, which has utility for physicians and patients. Although brand-name prescriptions may cost more, a trial period may assist the patient in deciding whether the medication is worth purchasing. Furthermore, physicians may feel more comfortable prescribing a medication once the individual patient has demonstrated a benefit from the sample, which may be particularly true in a specialty such as dermatology in which many branded topical medications contain a different vehicle than generic formulations, resulting in notable variations in active medication delivery and efficacy. Given the higher cost of branded topical medications, proving efficacy in patients through samples can provide a useful tool to the physician to determine the need for a branded formulation.
The benefits described are subjective but should not be disregarded. Although Hurley et al19 found that the number of brand-name medications prescribed increases as more samples are given out, our study demonstrated that after eliminating medication samples, there was no significant difference in the percentage of brand-name medications prescribed compared to generic and OTC medications.
Physician education concerning the price of each brand-name medication prescribed in office may be one method of reducing the amount of such prescriptions. Physicians generally are uninformed of the cost of the medications being prescribed26 and may not recognize the financial burden one medication may have compared to its alternative. However, educating physicians will empower them to make the conscious decision to prefer or not prefer a brand-name medication. With some generic medications shown to have a difference in bioequivalence compared to their brand-name counterparts, a physician may find more success prescribing the brand-name medications, regardless of pharmaceutical company influence, which is an alternative solution to policy changes that eliminate samples entirely. Although this study found insufficient evidence that removing samples decreases brand-name medication prescriptions, it is imperative that solutions are established to reduce the country’s increasing burden of medical costs.
Possible shortfalls of this study include the short period of time between which prepolicy data and postpolicy data were collected. It is possible that providers did not have enough time to adjust their prescribing habits or that providers would not have changed a prescribing pattern or preference simply because of a policy change. Future studies could allow a time period greater than 2 years to compare prepolicy and postpolicy prescribing habits, or a future study might make comparisons of prescriber patterns at different institutions that have different policies. Another possible shortfall is that providers and patients were limited to those at the Department of Dermatology & Cutaneous Surgery at the USF Morsani COM. Although this study has found insufficient evidence of a difference in prescribing habits, it may be beneficial to conduct a larger study that encompasses multiple academic institutions with similar policy changes. Most importantly, this study only investigated the influence of in-office pharmaceutical samples on prescribing patterns. This study did not look at the many other ways in which providers may be influenced by pharmaceutical companies, which likely is a significant confounding variable in this study. Continued additional studies that specifically examine other methods through which providers may be influenced would be helpful in further examining the many ways in which physician prescription habits are influenced.
Conclusion
Changes in pharmaceutical policy in 2011 at USF Morsani COM specifically banned in-office samples. The totality of evidence in this study shows modest observational evidence of a change in the postpolicy odds relative to prepolicy odds, but the data also are compatible with no change between prescribing habits before and after the policy changes. Further study is needed to fully understand this relationship.
- Sondergaard J, Vach K, Kragstrup J, et al. Impact of pharmaceutical representative visits on GPs’ drug preferences. Fam Pract. 2009;26:204-209.
- Jelinek GA, Neate SL. The influence of the pharmaceutical industry in medicine. J Law Med. 2009;17:216-223.
- Wazana A. Physicians and the pharmaceutical industry: is a gift ever just a gift? JAMA. 2000;283:373-380.
- Coleman DL. Establishing policies for the relationship between industry and clinicians: lessons learned from two academic health centers. Acad Med. 2008;83:882-887.
- Coleman DL, Kazdin AE, Miller LA, et al. Guidelines for interactions between clinical faculty and the pharmaceutical industry: one medical school’s approach. Acad Med. 2006;81:154-160.
- Evans D, Hartung DM, Beasley D, et al. Breaking up is hard to do: lessons learned from a pharma-free practice transformation. J Am Board Fam Med. 2013;26:332-338.
- Davit BM, Nwakama PE, Buehler GJ, et al. Comparing generic and innovator drugs: a review of 12 years of bioequivalence data from the United States Food and Drug Administration. Ann Pharmacother. 2009;43:1583-1597.
- Kesselheim AS, Misono AS, Lee JL, et al. Clinical equivalence of generic and brand-name drugs used in cardiovascular disease: a systematic review and meta-analysis. JAMA. 2008;300:2514-2526.
- McCormack J, Chmelicek JT. Generic versus brand name: the other drug war. Can Fam Physician. 2014;60:911.
- Borgheini G. The bioequivalence and therapeutic efficacy of generic versus brand-name psychoactive drugs. Clin Ther. 2003;25:1578-1592.
- Garrison GD, Levin GM. Factors affecting prescribing of the newer antidepressants. Ann Pharmacother. 2000;34:10-14.
- Rafique S, Sarwar W, Rashid A, et al. Influence of free drug samples on prescribing by physicians: a cross sectional survey. J Pak Med Assoc. 2017;67:465-467.
- Alexander GC, Zhang J, Basu A. Characteristics of patients receiving pharmaceutical samples and association between sample receipt and out-of-pocket prescription costs. Med Care. 2008;46:394-402.
- Hodges B. Interactions with the pharmaceutical industry: experiences and attitudes of psychiatry residents, interns and clerks. CMAJ. 1995;153:553-559.
- Brotzman GL, Mark DH. The effect on resident attitudes of regulatory policies regarding pharmaceutical representative activities. J Gen Intern Med. 1993;8:130-134.
- Keim SM, Sanders AB, Witzke DB, et al. Beliefs and practices of emergency medicine faculty and residents regarding professional interactions with the biomedical industry. Ann Emerg Med. 1993;22:1576-1581.
- Thomson AN, Craig BJ, Barham PM. Attitudes of general practitioners in New Zealand to pharmaceutical representatives. Br J Gen Pract. 1994;44:220-223.
- Ziegler MG, Lew P, Singer BC. The accuracy of drug information from pharmaceutical sales representatives. JAMA. 1995;273:1296-1298.
- Hurley MP, Stafford RS, Lane AT. Characterizing the relationship between free drug samples and prescription patterns for acne vulgaris and rosacea. JAMA Dermatol. 2014;150:487-493.
- Lexchin J. Interactions between physicians and the pharmaceutical industry: what does the literature say? CMAJ. 1993;149:1401-1407.
- Lieb K, Scheurich A. Contact between doctors and the pharmaceutical industry, their perceptions, and the effects on prescribing habits. PLoS One. 2014;9:e110130.
- Spurling GK, Mansfield PR, Montgomery BD, et al. Information from pharmaceutical companies and the quality, quantity, and cost of physicians’ prescribing: a systematic review. PLoS Med. 2010;7:e1000352.
- Fischer MA, Avorn J. Economic consequences of underuse of generic drugs: evidence from Medicaid and implications for prescription drug benefit plans. Health Serv Res. 2003;38:1051-1064.
- Sacks CA, Lee CC, Kesselheim AS, et al. Medicare spending on brand-name combination medications vs their generic constituents. JAMA. 2018;320:650-656.
- Brennan TA, Rothman DJ, Blank L, et al. Health industry practices that create conflicts of interest: a policy proposal for academic medical centers. JAMA. 2006;295:429-433.
- Allan GM, Lexchin J, Wiebe N. Physician awareness of drug cost: a systematic review. PLoS Med. 2007;4:e283.
Practice Points
- There has been growing concern that pharmaceutical interactions and incentives can influence physicians’ prescribing habits.
- Many academic centers have adopted policies that attempt to limit the pharmaceutical industry’s influence on faculty and in-training physicians.
- This study aimed to investigate if there was a change in the prescribing habits of academic dermatologists after the medical school implemented new policies that banned in-office samples.

Halobetasol Propionate for the Management of Psoriasis
In clinical practice, for the majority of patients with psoriasis superpotent topical corticosteroids (TCSs) are used as initial therapy as well as ongoing breakthrough therapy to achieve quick resolution of target lesions. However, safe and effective long-term treatment and maintenance options are required for managing the chronic nature of psoriasis to improve patient satisfaction, adherence, and quality of life, especially given that package inserts advise no more than 2 to 4 weeks of continuous use to limit side effects. The long-term use of superpotent TCSs can have a multitude of unwanted cutaneous side effects, such as skin atrophy, telangiectases, striae, and allergic vehicle responses.1,2 Tachyphylaxis, a decreased response to treatment over time, has been more controversial and may not occur with halobetasol propionate (HP) ointment 0.05%.3 In addition, TCSs are associated with relapse or rebound on withdrawal, which can be problematic but are poorly characterized.
We review the clinical data on HP, a superpotent TCS, in the treatment of psoriasis. We also explore both recent formulation developments and fixed-combination approaches to providing optimal treatment.
Clinical Experience With HP 0.05% in Various Formulations
Halobetasol propionate is a superpotent TCS with extensive clinical experience in treating psoriasis spanning nearly 30 years.1,2,3-7 Most recently, a twice-daily HP lotion 0.05% formulation was evaluated in patients with moderate to severe disease.8 Halobetasol propionate lotion 0.05% applied morning and night was shown to be significantly more effective than vehicle after 2 weeks of treatment (P<.001) in 2 parallel-group studies of 443 patients.9 Treatment success (ie, at least a 2-grade improvement in investigator global assessment [IGA] and IGA score of clear or almost clear) was achieved in 44.5% of patients treated with HP lotion 0.05% compared to 6.3% and 7.1% in the 2 vehicle arms. Treatment-related adverse events (AEs) were uncommon, with application-site pain reported in 2 patients treated with HP lotion 0.05% compared to 5 patients treated with vehicle.9
Several earlier studies have evaluated the short-term efficacy of twice-daily HP cream 0.05% and HP ointment 0.05% in the treatment of plaque psoriasis, but only 2 placebo-controlled trials have been reported, and data are limited.
Two 2-week studies of twice-daily HP ointment 0.05% (paired-comparison and parallel-group designs) in 204 patients with moderate plaque psoriasis reported improvement in plaque elevation, erythema, and scaling compared to vehicle. Patient global responses and physician global evaluation favored HP ointment 0.05%, and reports of stinging and burning were similar with active treatment and vehicle.4
Similarly, HP cream 0.05% applied twice daily was shown to be significantly superior to vehicle in reducing overall disease severity, erythema, plaque elevation, and scaling after 1 and 2 weeks of treatment in a paired-comparison study of 110 patients (P=.0001).5 A clinically significant reduction (at least a 1-grade improvement) in erythema, plaque elevation, pruritus, and scaling was noted in 81% to 92% of patients (P=.0001). Patients’ self-assessment of effectiveness rated HP cream 0.05% as excellent, very good, or good in 69% of patients compared to 20% for vehicle. Treatment-related AEs were reported by 4 patients.5
A small, noncontrolled, 2-week pediatric study (N=11) demonstrated the efficacy of combined therapy with HP cream 0.05% every morning and HP ointment 0.05% every night due to the then-perceived preference for creams as being more pleasant to apply during the day and ointments being more efficacious. Reported side effects were relatively mild, with application-site burning being the most common.10
Potential local AEs associated with HP are similar to those seen with other superpotent TCSs. Overall, they were reported in 0% to 13% of patients. The most common AEs were burning, pruritus, erythema, hypopigmentation, dryness, and folliculitis.5-8,10-14 Isolated cases of moderate telangiectasia and mild atrophy also have been reported.8,10
Comparative Studies With Other TCSs
In comparative studies of patients with severe localized plaque psoriasis, HP ointment 0.05% applied twice daily for up to 4 weeks was significantly superior compared to clobetasol propionate ointment 0.05% for the number of patients with none or mild disease (P=.0237) or comparisons of global evaluation scores (P=.01315) at week 2, or compared to betamethasone valerate ointment 0.1% (P=.02).6 It also was more effective than betamethasone dipropionate ointment 0.05% with healing seen in 40% of patients treated with HP ointment 0.05% within 24 days compared to 25% of patients treated with betamethasone dipropionate ointment 0.05%.8 Patient acceptance of HP ointment 0.05% based on cosmetic acceptability and ease of application was better (very good in 90% vs 80% of patients7) or significantly better compared to clobetasol propionate ointment 0.05% (P=.042 and P=.01915) and betamethasone dipropionate ointment 0.05% (P=.02).8
Evolving Management Strategies
A number of management strategies have been proposed to improve the safety and efficacy of long-term therapy with TCSs, including weekend-only or pulse therapy, dose reduction, rotating to another therapy, or combining with other topical therapies. Maintenance efficacy data are sparse. A small double-blind study in 44 patients with mild to moderate psoriasis was conducted wherein patients were treated with calcipotriene ointment in the morning and HP ointment in the evening for 2 weeks.16 Those patients who achieved at least a 50% improvement in disease severity (N=40) were randomized to receive HP ointment twice daily on weekends and calcipotriene ointment or placebo twice daily on weekdays for 6 months. Seventy-six percent of those patients treated with a HP/calcipotriene pulsed therapy maintained remission (achieving and maintaining a 75% improvement in physician global assessment) compared to 40% of those patients treated with HP only (P=.045). Mild AEs were reported in 4 patients treated with the combination regimen and 1 patient treated with HP only. No AE-related discontinuations occurred.16
In a real-world setting, a maintenance regimen that is less complicated enhances the potential for increased patient adherence and successful outcomes.17 After an initial 2-week regimen of twice-daily HP ointment 0.05% in combination with ammonium lactate lotion in patients with mild to moderate psoriasis (N=55), those rated clear or almost clear (41/55 [74.6%]) entered a maintenance phase, applying ammonium lactate lotion twice daily and either HP or placebo ointment twice daily on weekends. The probability of disease worsening by week 14 was 29% in the HP-treated group compared to 100% in the placebo group (P<.0001). By week 24, 12 patients (29.2%) remained clear or almost clear.17
Development of HP Lotion 0.01%
There are numerous examples in dermatology where advances in formulation development have made it possible to reduce the strength of active ingredients without compromising efficacy. Formulation advances also afford improved safety profiles that can extend a product’s utility. The vehicle affects not only the potency of an agent but also patient compliance, which is crucial for adequate response. Patients prefer lighter vehicles, such as lotions, over heavy ointments and creams.18,19
Recently, a polymeric honeycomb matrix (carbomer cross-linked polymers), which helps structure the oil emulsion and provide a uniform distribution of both active and moisturizing/hydrating ingredients (ie, sorbitol, light mineral oil, diethyl sebacate) at the surface of the skin, has been deployed for topical delivery of HP (eFigure 1). Ninety percent of the oil droplets containing solubilized halobetasol are 13 µm or smaller, an ideal size for penetration through follicular openings (unpublished data, Bausch Health, 2018).

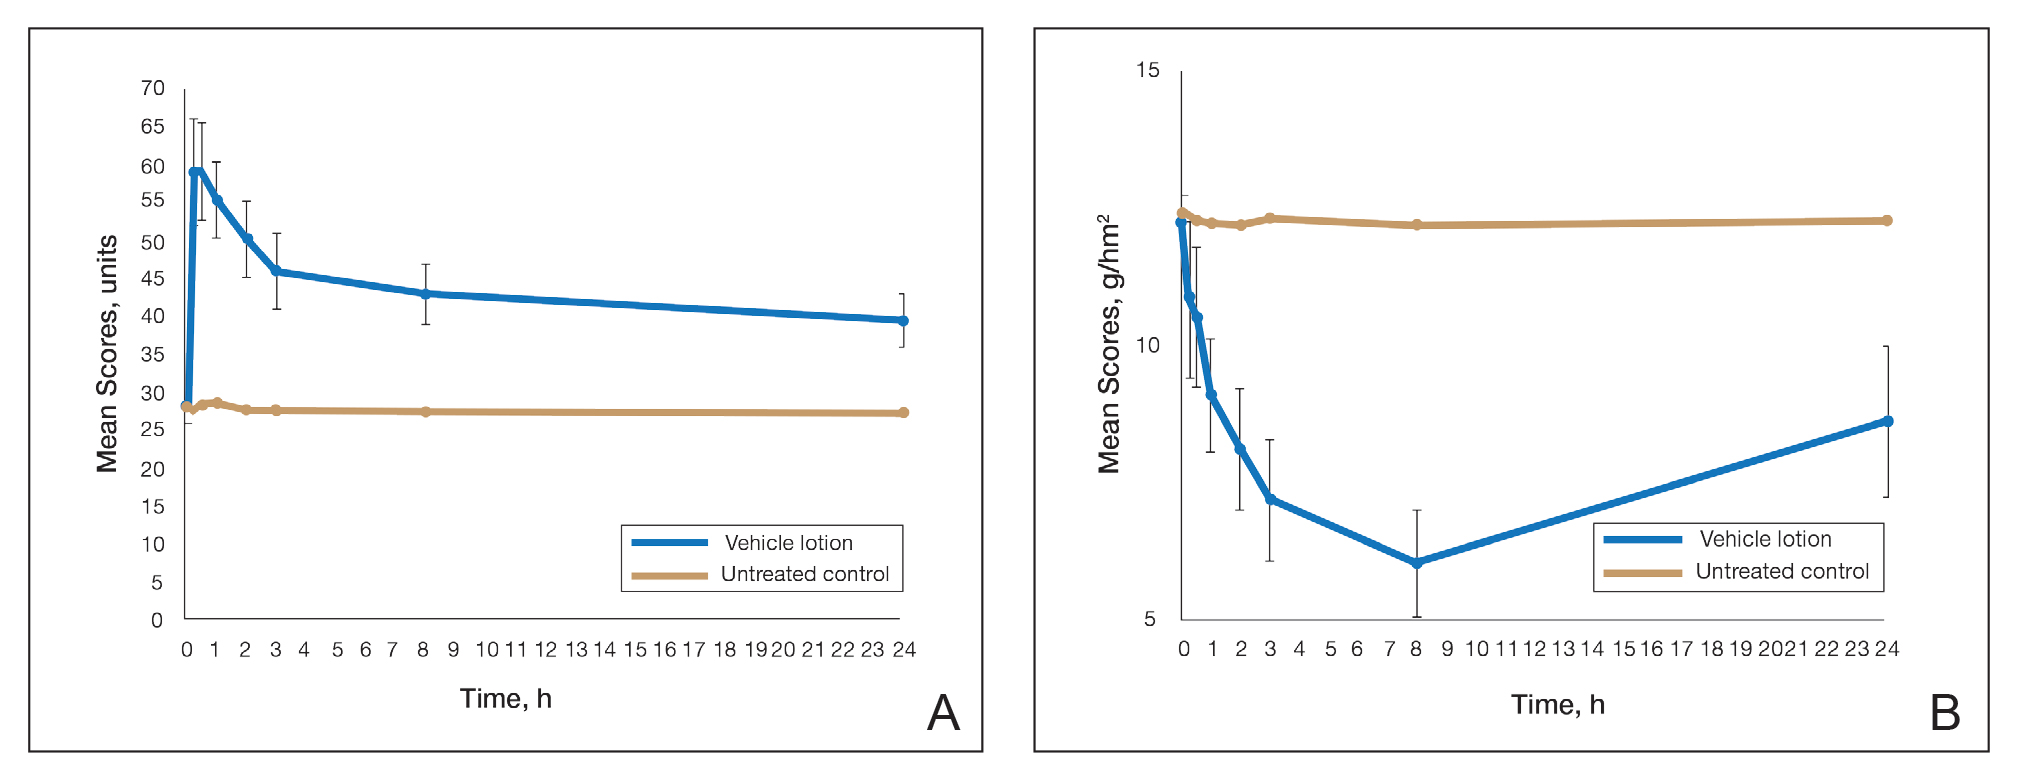
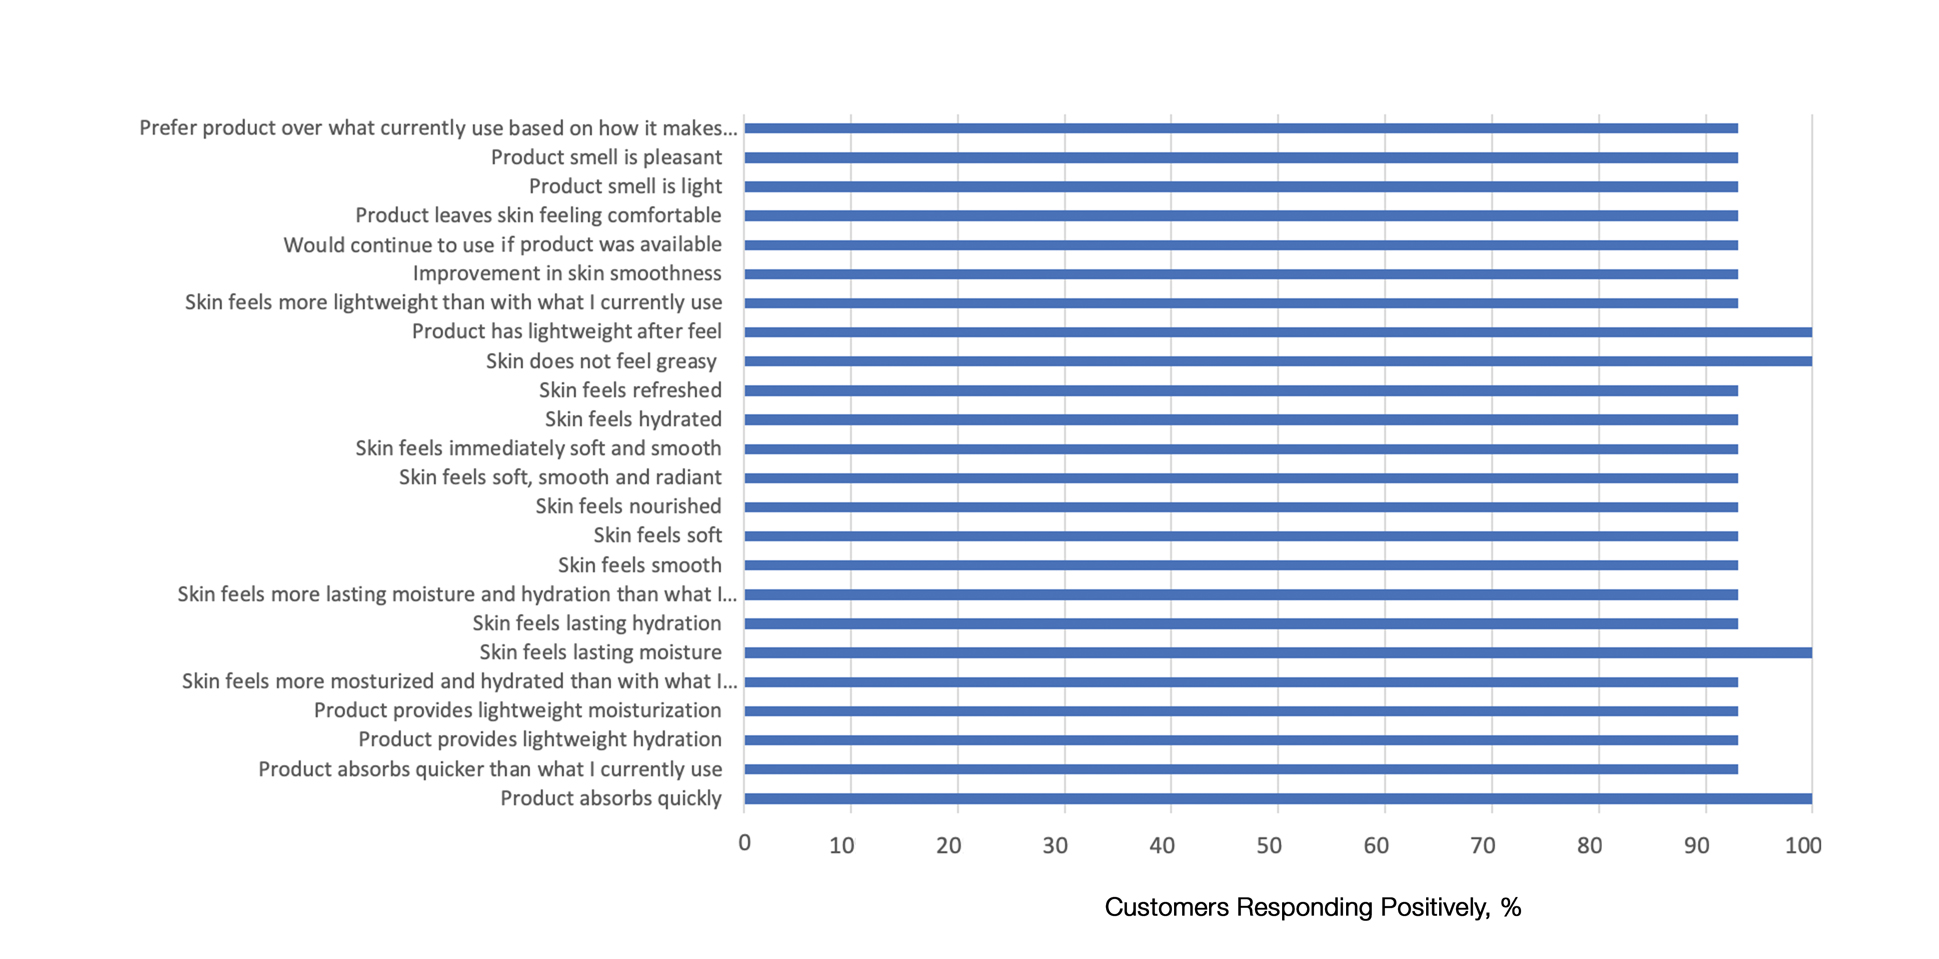
This polymerized emulsion also forms a barrier by reducing epidermal water loss and improving skin hydration. Skin hydration and barrier protection of the lotion were assessed through corneometry and transepidermal water loss (TEWL) in 30 healthy female volunteers (aged 35–65 years) over 24 hours. The test material was applied to the volar forearm, with an untreated site serving as a control. Measurements using Tewameter and Corneometer were taken at baseline; 15 and 30 minutes; and 1, 2, 3, 8, and 24 hours postapplication. In addition, for the 8-hour study period, 15 patients applied the test material to the right side of the face and completed a customer-perception evaluation. Adverse events were noted throughout and irritation was assessed preapplication and postapplication. There were no AEs or skin irritation reported throughout the study. At baseline, mean (standard deviation [SD]) corneometry scores were 28.9 (2.9) and 28.1 (2.7) units for the test material and untreated control, respectively. There was an immediate improvement in water content that was maintained throughout the study. After 15 minutes, the mean (SD) score had increased to 59.1 (7.1) units in the vehicle lotion group (eFigure 2A). There was no improvement at the control site, and differences were significant at all postapplication assessments (P<.001). At baseline, mean (SD) TEWL scores were 12.26 (0.48) and 12.42 (0.44) g/hm2, respectively (eFigure 2B). There was an immediate improvement in TEWL with a mean (SD) score of 6.04 (0.99) after 8 hours in the vehicle lotion group, a 50.7% change over baseline. There was no improvement at the control site, and differences were significant at all postapplication assessments (P<.001). Customer perception of the novel lotion formulation was positive, with the majority of patients (93%–100%) responding favorably to all questions about the various attributes of the test material (eFigure 3)(unpublished data, Bausch Health, 2018).
Comparison of Skin Penetration of HP Lotion 0.01% vs HP Cream 0.05%
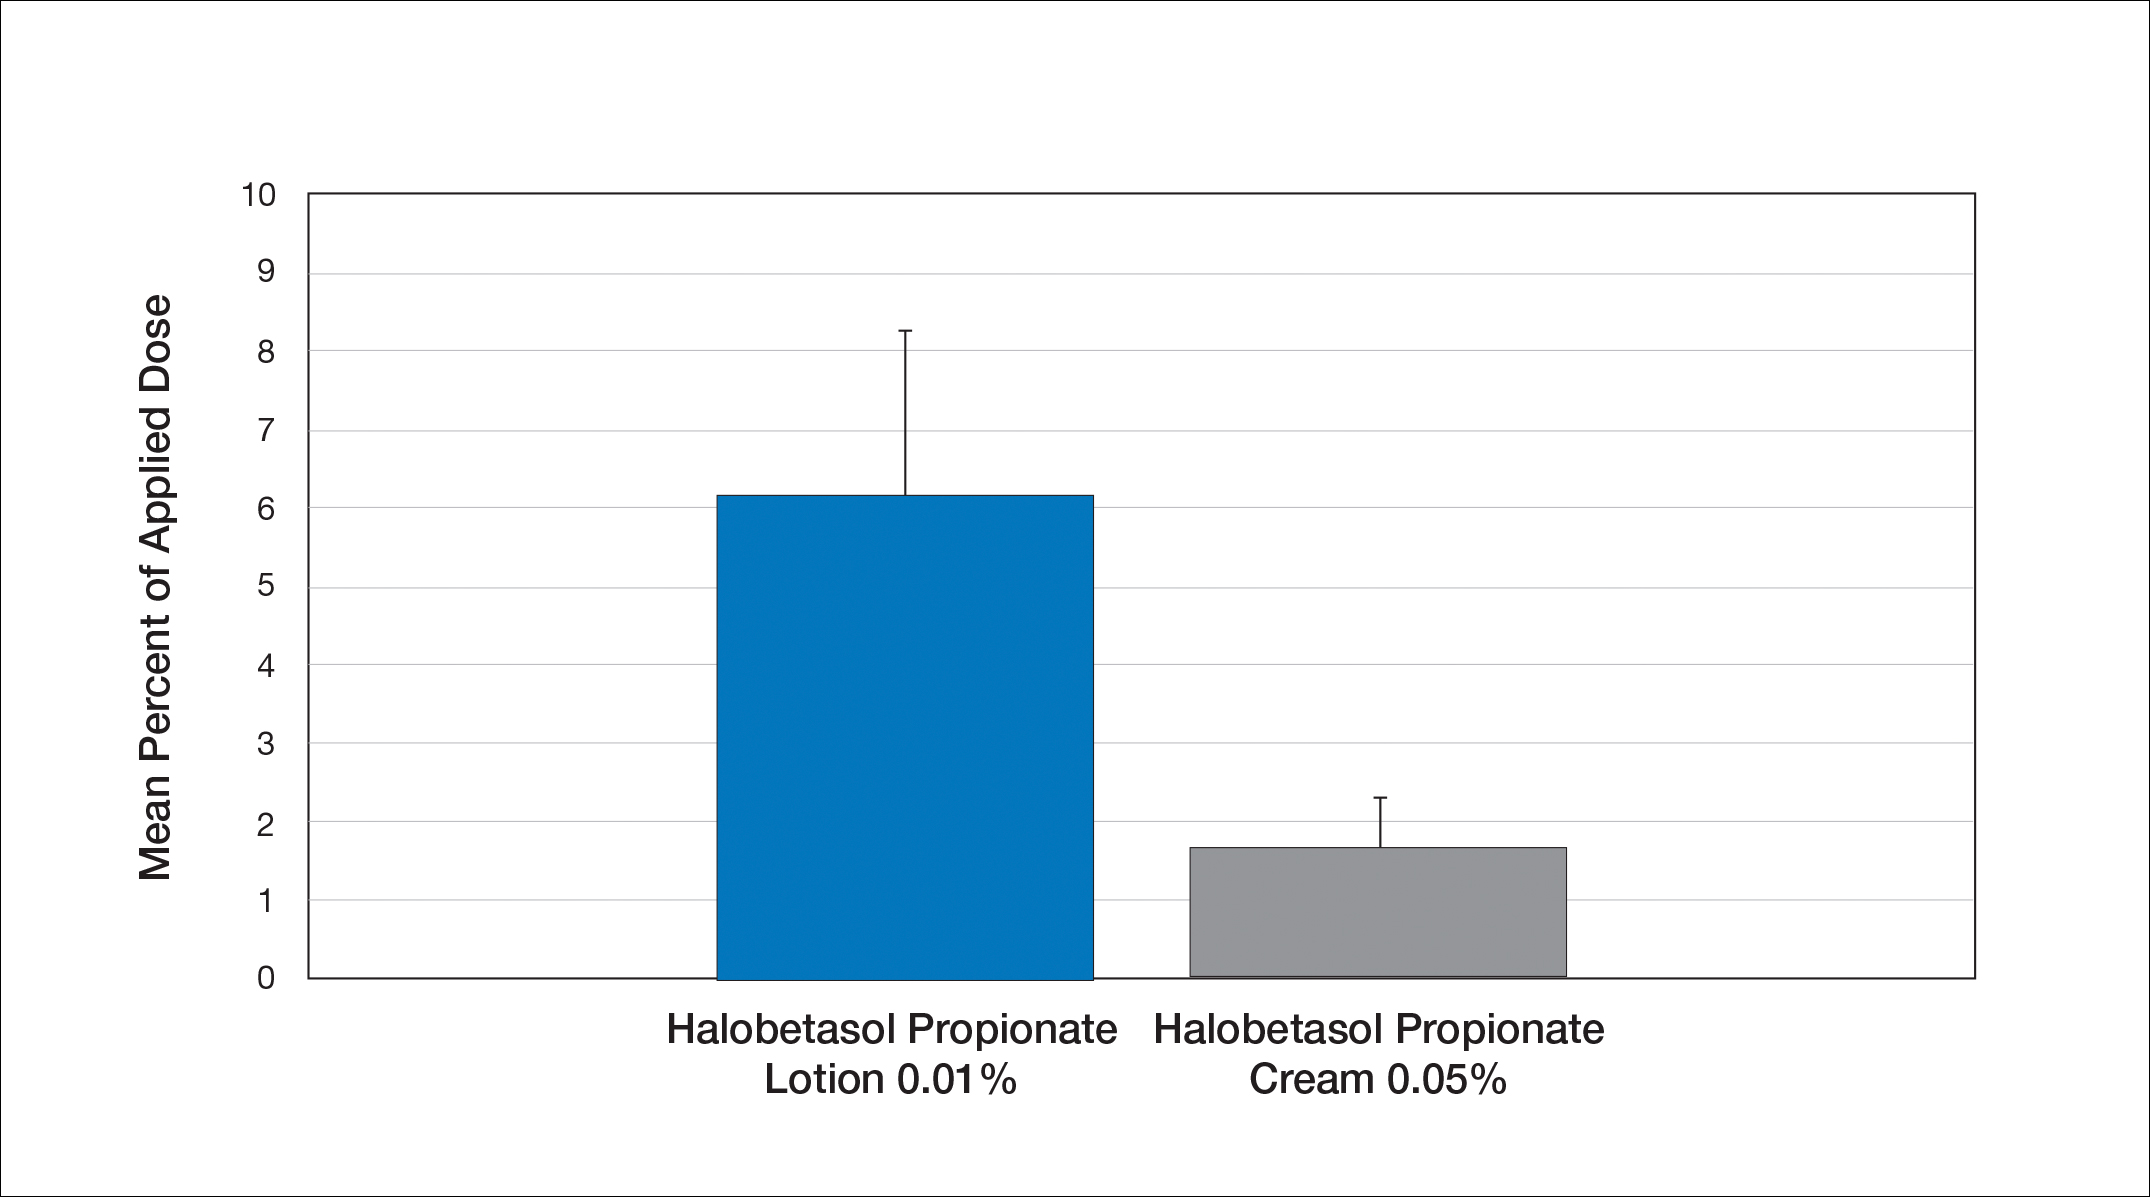
Comparative percutaneous absorption of 2 HP formulations—0.01% lotion and 0.05% cream—was evaluated in vitro using human tissue from a single donor mounted on Bronaugh flow-through diffusion cells. Receptor phase samples were collected over the 24-hour study period and HP content assessed using liquid chromatography–mass spectrometry analysis. Halobetasol propionate lotion 0.01% demonstrated faster tissue permeation, with receptor phase levels of 0.91% of the applied dose at 24 hours compared to 0.28% of the applied dose with HP cream 0.05%. Although there was little differentiation of cumulative receptor fluid levels of HP at 6 hours, there was significant differentiation at 12 hours. Levels of HP were lowest in the receptor phase and highest in the epidermal layers of the skin, indicating limited permeation through the epidermis to the dermis. The mean (SD) for epidermal deposition of HP following the 24-hour duration of exposure was 6.17% (2.07%) and 1.72% (0.76%) for the 0.01% lotion and 0.05% cream, respectively (Figure 1)(unpublished data, Bausch Health, 2018).
Efficacy and Safety of HP Lotion 0.01% in Moderate to Severe Plaque Psoriasis
Two articles have been published on the use of HP lotion 0.01% in moderate to severe psoriasis: 2 pivotal studies comparing once-daily application with vehicle lotion over 8 weeks (N=430),20 and a comparative “label-restricted” 2-week study with HP lotion 0.01% and HP cream 0.05% (N=150).21
HP Lotion 0.01% Compared to Vehicle
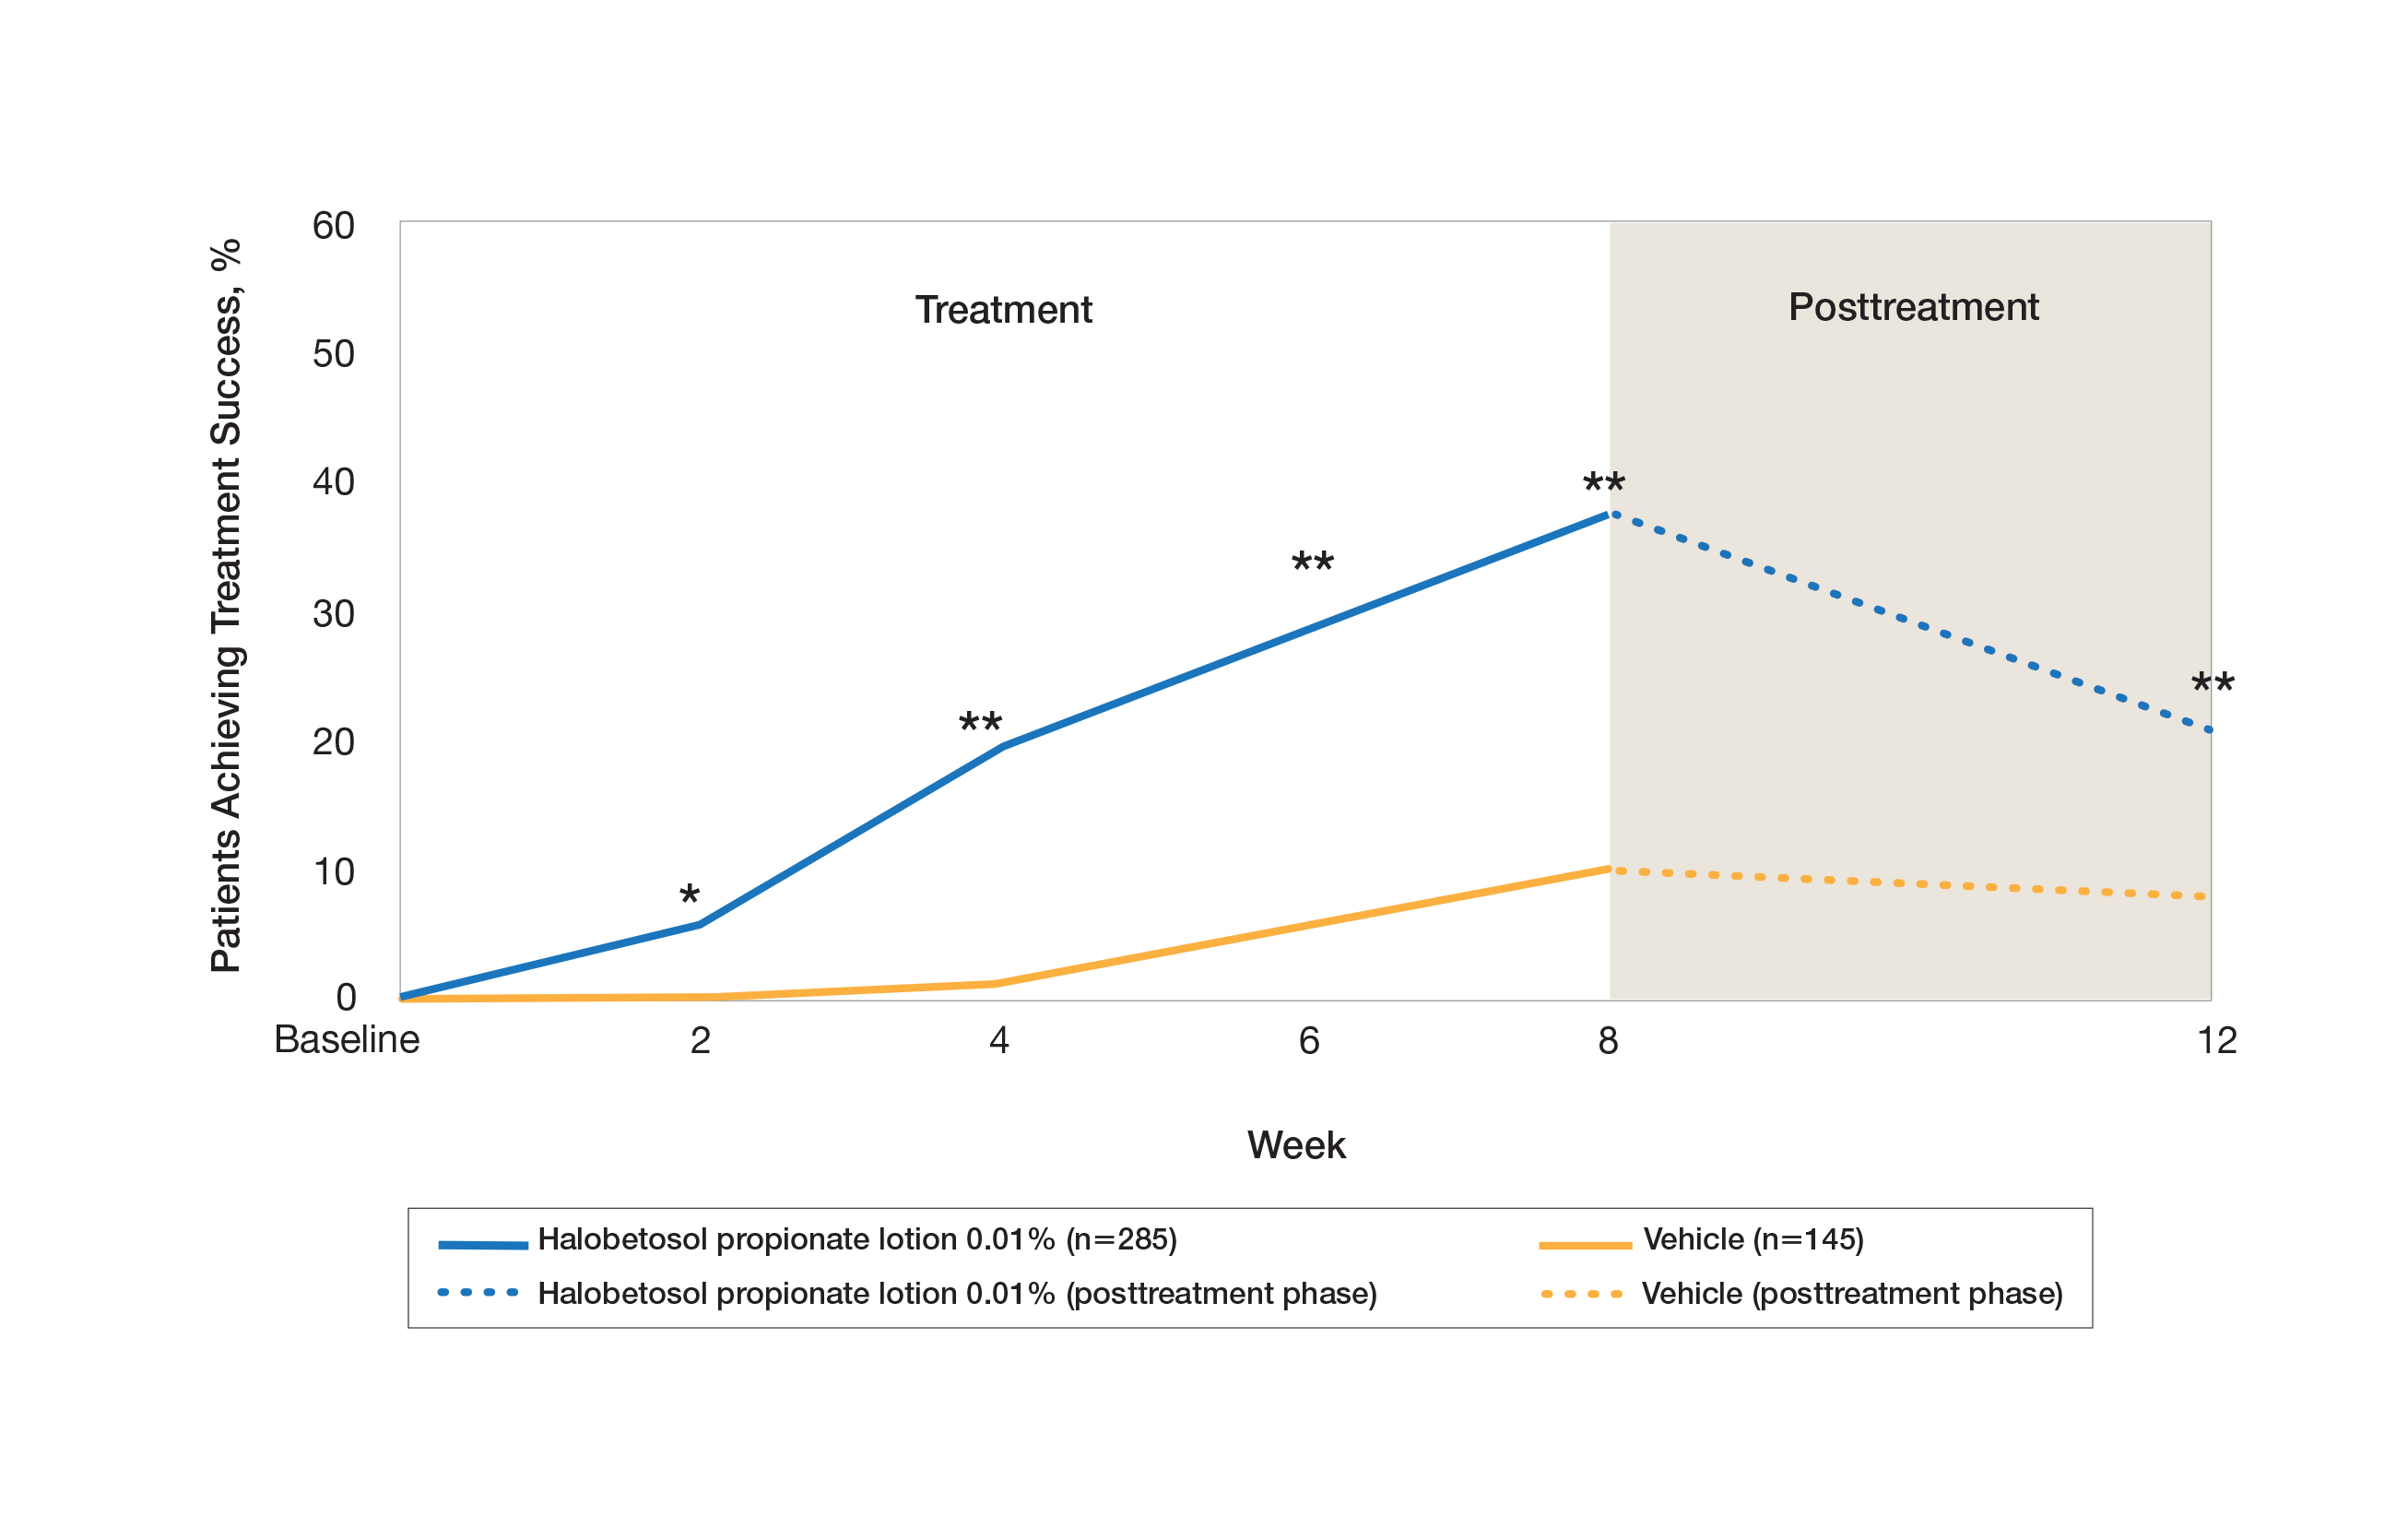
Two multicenter, randomized, double-blind, vehicle-controlled phase 3 studies investigated the safety and efficacy of once-daily HP lotion 0.01% in moderate to severe plaque psoriasis (N=430).20 Patients were treated with HP lotion 0.01% or vehicle (randomized in a 2:1 ratio) for 8 weeks, with a 4-week posttreatment follow-up. Treatment success (defined as at least a 2-grade improvement in baseline IGA score and a score equating to clear or almost clear) was significantly greater with HP lotion 0.01% at all assessment points (Figure 2)(P=.003 for week 2; P<.001 for other time points). At week 8, 37.4% of patients receiving HP lotion 0.01% were treatment successes compared to 10.0% of patients receiving vehicle (P<.001). Additionally, a 2-grade improvement from baseline for each psoriasis sign—erythema, plaque elevation, and scaling—was achieved by 42.2% of patients receiving HP lotion 0.01% at week 8 compared to 11.4% of patients receiving vehicle (P<.001). Good efficacy was maintained posttreatment that was significant compared to vehicle (P<.001).20
There were corresponding reductions in body surface area (BSA) affected following treatment with HP lotion 0.01%.20 At baseline, the mean BSA was 6.1 (range, 3–12). By week 8, there was a 35.2% reduction in BSA compared to 5.9% with vehicle. Again, a significant reduction in BSA was maintained posttreatment compared to vehicle (P<.001).20
Halobetasol propionate lotion 0.01% was well tolerated with few treatment-related AEs.20 Most AEs were application-site reactions such as dermatitis (0.7%), infection, pruritus, and discoloration (0.4% each). Mild to moderate itching, dryness, burning, and stinging present at baseline all improved with treatment, and severity of local skin reactions was significantly lower than with vehicle at week 8 (P<.001). Quality-of-life data also highlighted the benefits of active treatment compared to vehicle for cutaneous tolerability. The Dermatology Life Quality Index (DLQI) is a 10-item patient-reported questionnaire consisting of questions concerning symptoms and feelings, daily activities, leisure, work and school, personal relationships, and treatment.22 Change from baseline for DLQI (how itchy, sore, painful, stinging) was significantly greater with HP lotion 0.01% at weeks 4 and 8 (P<.001). Changes in the overall DLQI score also were significantly greater with HP lotion 0.01% at both study visits (P=.006 and P=.014 at week 4 and P=.001 and P=.004 at week 8 for study 1 and study 2, respectively).20
HP Lotion 0.01% Compared to HP Cream 0.05%
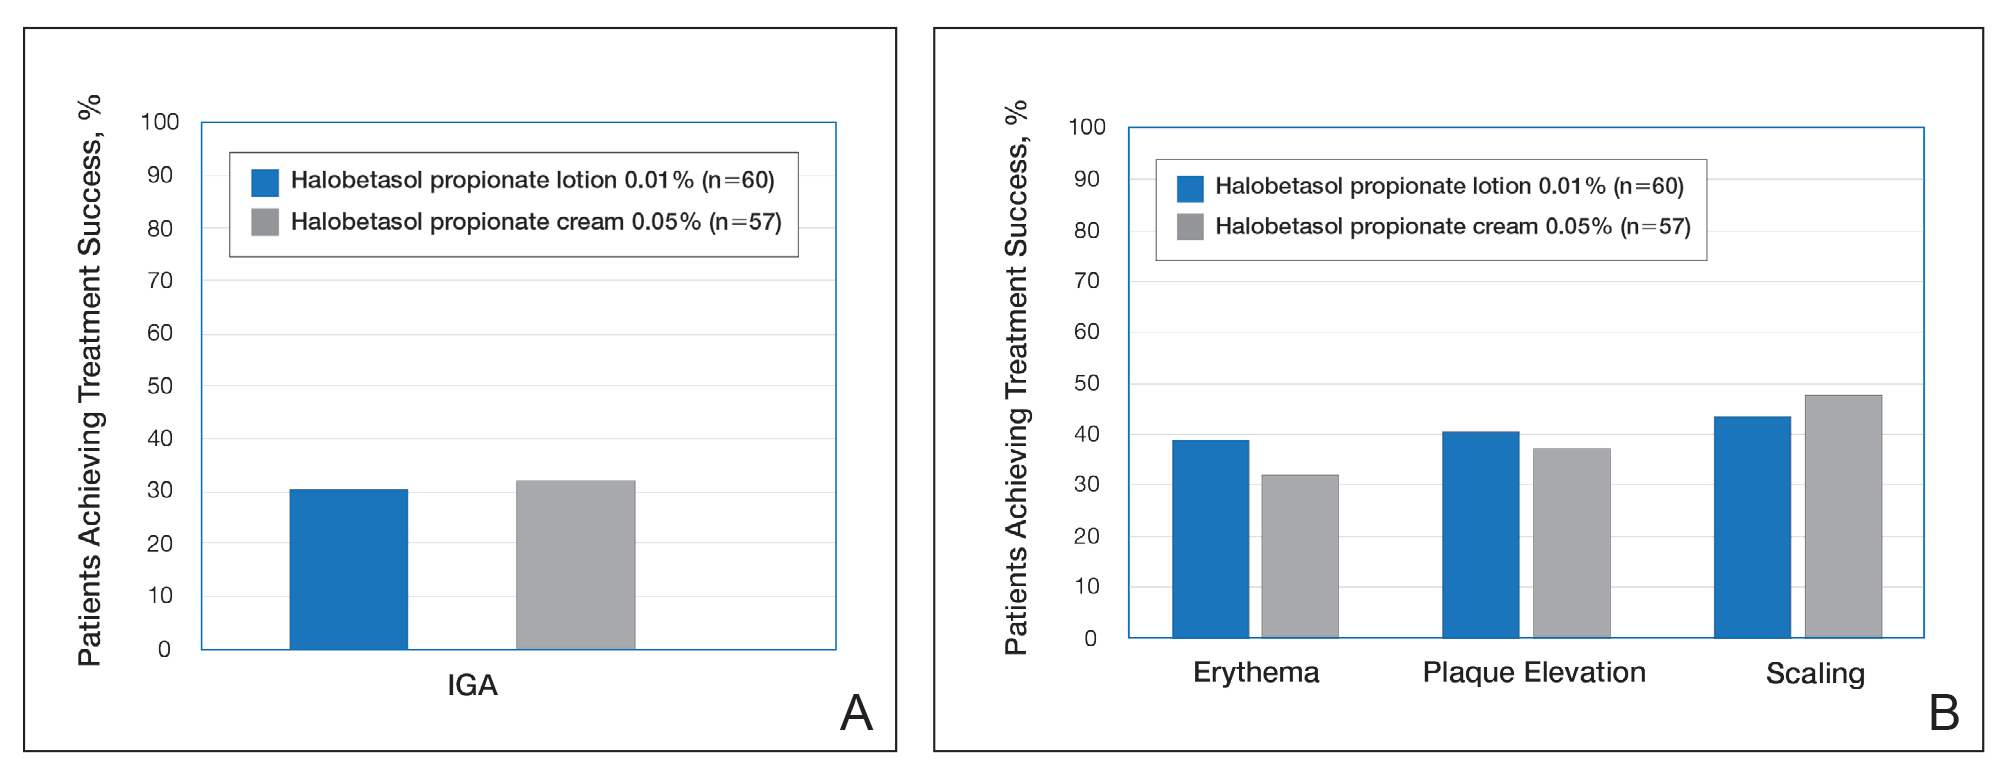
Treatment success with HP lotion 0.01% also was shown to be comparable to the higher-concentration HP cream 0.05% in patients with moderate to severe psoriasis over a 2-week “label-restricted” treatment period (Figure 3). Both products were well tolerated over the 2-week treatment period. One patient reported application-site dermatitis (1.7%) with HP lotion 0.01%.21
Conclusion
Halobetasol propionate 0.05%—cream, ointment, and lotion—has been shown to be a highly effective short-term topical treatment for psoriasis. Longer-term treatment strategies using HP, which are important when considering management of a chronic condition, have been limited by safety concerns and labelling. However, there are data to suggest weekend or pulsed therapy may be an option.
A novel formulation of HP lotion 0.01% has been developed using a polymerized matrix with active ingredients and moisturizing excipients suspended in oil droplets. The polymerized honeycomb matrix and vehicle formulation form a barrier by reducing epidermal water loss and improving skin hydration. The oil droplets deliver uniform amounts of active ingredient in an optimal size for follicular penetration. Skin penetration has been shown to be quicker with greater retention in the epidermis with HP lotion 0.01% compared to HP cream 0.05%, with corresponding considerably lower penetration into the dermis.
Although there have been a number of clinical studies of HP for psoriasis, until recently there have been no comparative trials, with studies label restricted to a 2- to 4-week duration. Three clinical studies with HP lotion 0.01% have now been reported.Not only has HP lotion 0.01% been shown to be as effective as HP cream 0.05% in a 2-week comparative study (despite having one-fifth the concentration of HP), it also has been shown to be very effective and well tolerated following 8 weeks of daily use.20,21 Further studies involving longer treatment durations are required to better elucidate AEs, but HP lotion 0.01% may provide the first longer-term TCS treatment solution for moderate to severe psoriasis.
Acknowledgments
We thank Brian Bulley, MSc (Konic Limited, United Kingdom), for assistance with the preparation of the manuscript. Ortho Dermatologics funded Konic’s activities pertaining to this manuscript.
- Kamili QU, Menter A. Topical treatment of psoriasis. Curr Probl Dermatol. 2009;38:37-58.
- Bailey J, Whitehair B. Topical treatments for chronic plaque psoriasis. Am Fam Physician. 2010;81:596.
- Czarnowicki T, Linkner RV, Suarez-Farinas M, et al. An investigator-initiated, double-blind, vehicle-controlled pilot study: assessment for tachyphylaxis to topically occluded halobetasol 0.05% ointment in the treatment of psoriasis. J Am Acad Dermatol. 2014;71:954-959.
- Bernhard J, Whitmore C, Guzzo C, et al. Evaluation of halobetasol propionate ointment in the treatment of plaque psoriasis: report on two double-blind, vehicle-controlled studies. J Am Acad Dermatol. 1991;25:1170-1174.
- Katz HI, Gross E, Buxman M, et al. A double-blind, vehicle-controlled paired comparison of halobetasol propionate cream on patients with plaque psoriasis. J Am Acad Dermatol. 1991;25:1175-1178.
- Blum G, Yawalkar S. A comparative, multicenter, double blind trial of 0.05% halobetasol propionate ointment and 0.1% betamethasone valerate ointment in the treatment of patients with chronic, localized plaque psoriasis. J Am Acad Dermatol. 1991;25:1153-1156.
- Goldberg B, Hartdegen R, Presbury D, et al. A double-blind, multicenter comparison of 0.05% halobetasol propionate ointment and 0.05% clobetasol propionate ointment in patients with chronic, localized plaque psoriasis. J Am Acad Dermatol. 1991;25:1145-1148.
- Mensing H, Korsukewitz G, Yawalkar S. A double-blind, multicenter comparison between 0.05% halobetasol propionate ointment and 0.05% betamethasone dipropionate ointment in chronic plaque psoriasis. J Am Acad Dermatol. 1991;25:1149-1152.
- Pariser D, Bukhalo M, Guenthner S, et al. Two multicenter, randomized, double-blind, parallel group comparison studies of a novel enhanced lotion formulation of halobetasol propionate, 0.05% versus its vehicle in adult subjects with plaque psoriasis. J Drugs Dermatol. 2017;16:234-240.
- Herz G, Blum G, Yawalkar S. Halobetasol propionate cream by day and halobetasol propionate ointment at night for the treatment of pediatric patients with chronic, localized psoriasis and atopic dermatitis. J Am Acad Dermatol. 1991;25:1166-1169.
- Datz B, Yawalkar S. A double-blind, multicenter trial of 0.05% halobetasol propionate ointment and 0.05% clobetasol 17-propionate ointment in the treatment of patients with chronic, localized atopic dermatitis or lichen simplex chronicus. J Am Acad Dermatol. 1991;25:1157-1160.
- Kantor I, Cook PR, Cullen SI, et al. Double-blind bilateral paired comparison of 0.05% halobetasol propionate cream and its vehicle in patients with chronic atopic dermatitis and other eczematous dermatoses. J Am Acad Dermatol. 1991;25:1184-1186.
- Yawalkar SJ, Schwerzmann L. Double-blind, comparative clinical trials with halobetasol propionate cream in patients with atopic dermatitis. J Am Acad Dermatol. 1991;25:1163-1166.
- Watson WA, Kalb RE, Siskin SB, et al. The safety of halobetasol 0.05% ointment in the treatment of psoriasis. Pharmacotherapy. 1990;10:107-111.
- Dhurat R, Aj K, Vishwanath V, et al. Evaluation of the efficacy and safety of 0.05% halobetasol propionate ointment and 0.05% clobetasol propionate ointment in chronic, localized plaque psoriasis. Asian J Pharm Clin Res. 2016;9:288-291.
- Lebwohl M, Yoles A, Lombardi K, et al. Calcipotriene ointment and halobetasol ointment in the long-term treatment of psoriasis: effects on the duration of improvement. J Am Acad Dermatol. 1998;39:447-450.
- Feldman SR, Horn EJ, Balkrishnan R, et al. Psoriasis: improvingadherence to topical therapy. J Am Acad Dermatol. 2008;59:1009-1016.
- Housman TS, Mellen BG, Rapp SR, et al. Patients with psoriasis prefer solution and foam vehicles: a quantitative assessment of vehicle preference. Cutis. 2002;70:327-332.
- Eastman WJ, Malahias S, Delconte J, et al. Assessing attributes of topical vehicles for the treatment of acne, atopic dermatitis, and plaque psoriasis. Cutis. 2014;94:46-53.
- Green LJ, Kerdel FA, Cook-Bolden FE, et al. Safety and efficacy of halobetasol propionate 0.01% lotion in the treatment of moderate-to-severe plaque psoriasis: results of 2 phase III randomized controlled trials. J Drugs Dermatol. 2018;17:1062-1069.
- Kerdel FA, Draelos ZD, Tyring SK, et al. A phase 2, multicenter, double-blind, randomized, vehicle controlled clinical study to compare the safety and efficacy of halobetasol propionate 0.01% lotion and halobetasol propionate 0.05% cream in the treatment of plaque psoriasis [published online November 5, 2018].J Dermatolog Treat. 2019;30:333-339.
- Lewis V, Finlay AY. 10 years’ experience of the Dermatology Life Quality Index (DLQI). J Investig Dermatol Symp Proc. 2004;9:169-180.
In clinical practice, for the majority of patients with psoriasis superpotent topical corticosteroids (TCSs) are used as initial therapy as well as ongoing breakthrough therapy to achieve quick resolution of target lesions. However, safe and effective long-term treatment and maintenance options are required for managing the chronic nature of psoriasis to improve patient satisfaction, adherence, and quality of life, especially given that package inserts advise no more than 2 to 4 weeks of continuous use to limit side effects. The long-term use of superpotent TCSs can have a multitude of unwanted cutaneous side effects, such as skin atrophy, telangiectases, striae, and allergic vehicle responses.1,2 Tachyphylaxis, a decreased response to treatment over time, has been more controversial and may not occur with halobetasol propionate (HP) ointment 0.05%.3 In addition, TCSs are associated with relapse or rebound on withdrawal, which can be problematic but are poorly characterized.
We review the clinical data on HP, a superpotent TCS, in the treatment of psoriasis. We also explore both recent formulation developments and fixed-combination approaches to providing optimal treatment.
Clinical Experience With HP 0.05% in Various Formulations
Halobetasol propionate is a superpotent TCS with extensive clinical experience in treating psoriasis spanning nearly 30 years.1,2,3-7 Most recently, a twice-daily HP lotion 0.05% formulation was evaluated in patients with moderate to severe disease.8 Halobetasol propionate lotion 0.05% applied morning and night was shown to be significantly more effective than vehicle after 2 weeks of treatment (P<.001) in 2 parallel-group studies of 443 patients.9 Treatment success (ie, at least a 2-grade improvement in investigator global assessment [IGA] and IGA score of clear or almost clear) was achieved in 44.5% of patients treated with HP lotion 0.05% compared to 6.3% and 7.1% in the 2 vehicle arms. Treatment-related adverse events (AEs) were uncommon, with application-site pain reported in 2 patients treated with HP lotion 0.05% compared to 5 patients treated with vehicle.9
Several earlier studies have evaluated the short-term efficacy of twice-daily HP cream 0.05% and HP ointment 0.05% in the treatment of plaque psoriasis, but only 2 placebo-controlled trials have been reported, and data are limited.
Two 2-week studies of twice-daily HP ointment 0.05% (paired-comparison and parallel-group designs) in 204 patients with moderate plaque psoriasis reported improvement in plaque elevation, erythema, and scaling compared to vehicle. Patient global responses and physician global evaluation favored HP ointment 0.05%, and reports of stinging and burning were similar with active treatment and vehicle.4
Similarly, HP cream 0.05% applied twice daily was shown to be significantly superior to vehicle in reducing overall disease severity, erythema, plaque elevation, and scaling after 1 and 2 weeks of treatment in a paired-comparison study of 110 patients (P=.0001).5 A clinically significant reduction (at least a 1-grade improvement) in erythema, plaque elevation, pruritus, and scaling was noted in 81% to 92% of patients (P=.0001). Patients’ self-assessment of effectiveness rated HP cream 0.05% as excellent, very good, or good in 69% of patients compared to 20% for vehicle. Treatment-related AEs were reported by 4 patients.5
A small, noncontrolled, 2-week pediatric study (N=11) demonstrated the efficacy of combined therapy with HP cream 0.05% every morning and HP ointment 0.05% every night due to the then-perceived preference for creams as being more pleasant to apply during the day and ointments being more efficacious. Reported side effects were relatively mild, with application-site burning being the most common.10
Potential local AEs associated with HP are similar to those seen with other superpotent TCSs. Overall, they were reported in 0% to 13% of patients. The most common AEs were burning, pruritus, erythema, hypopigmentation, dryness, and folliculitis.5-8,10-14 Isolated cases of moderate telangiectasia and mild atrophy also have been reported.8,10
Comparative Studies With Other TCSs
In comparative studies of patients with severe localized plaque psoriasis, HP ointment 0.05% applied twice daily for up to 4 weeks was significantly superior compared to clobetasol propionate ointment 0.05% for the number of patients with none or mild disease (P=.0237) or comparisons of global evaluation scores (P=.01315) at week 2, or compared to betamethasone valerate ointment 0.1% (P=.02).6 It also was more effective than betamethasone dipropionate ointment 0.05% with healing seen in 40% of patients treated with HP ointment 0.05% within 24 days compared to 25% of patients treated with betamethasone dipropionate ointment 0.05%.8 Patient acceptance of HP ointment 0.05% based on cosmetic acceptability and ease of application was better (very good in 90% vs 80% of patients7) or significantly better compared to clobetasol propionate ointment 0.05% (P=.042 and P=.01915) and betamethasone dipropionate ointment 0.05% (P=.02).8
Evolving Management Strategies
A number of management strategies have been proposed to improve the safety and efficacy of long-term therapy with TCSs, including weekend-only or pulse therapy, dose reduction, rotating to another therapy, or combining with other topical therapies. Maintenance efficacy data are sparse. A small double-blind study in 44 patients with mild to moderate psoriasis was conducted wherein patients were treated with calcipotriene ointment in the morning and HP ointment in the evening for 2 weeks.16 Those patients who achieved at least a 50% improvement in disease severity (N=40) were randomized to receive HP ointment twice daily on weekends and calcipotriene ointment or placebo twice daily on weekdays for 6 months. Seventy-six percent of those patients treated with a HP/calcipotriene pulsed therapy maintained remission (achieving and maintaining a 75% improvement in physician global assessment) compared to 40% of those patients treated with HP only (P=.045). Mild AEs were reported in 4 patients treated with the combination regimen and 1 patient treated with HP only. No AE-related discontinuations occurred.16
In a real-world setting, a maintenance regimen that is less complicated enhances the potential for increased patient adherence and successful outcomes.17 After an initial 2-week regimen of twice-daily HP ointment 0.05% in combination with ammonium lactate lotion in patients with mild to moderate psoriasis (N=55), those rated clear or almost clear (41/55 [74.6%]) entered a maintenance phase, applying ammonium lactate lotion twice daily and either HP or placebo ointment twice daily on weekends. The probability of disease worsening by week 14 was 29% in the HP-treated group compared to 100% in the placebo group (P<.0001). By week 24, 12 patients (29.2%) remained clear or almost clear.17
Development of HP Lotion 0.01%
There are numerous examples in dermatology where advances in formulation development have made it possible to reduce the strength of active ingredients without compromising efficacy. Formulation advances also afford improved safety profiles that can extend a product’s utility. The vehicle affects not only the potency of an agent but also patient compliance, which is crucial for adequate response. Patients prefer lighter vehicles, such as lotions, over heavy ointments and creams.18,19
Recently, a polymeric honeycomb matrix (carbomer cross-linked polymers), which helps structure the oil emulsion and provide a uniform distribution of both active and moisturizing/hydrating ingredients (ie, sorbitol, light mineral oil, diethyl sebacate) at the surface of the skin, has been deployed for topical delivery of HP (eFigure 1). Ninety percent of the oil droplets containing solubilized halobetasol are 13 µm or smaller, an ideal size for penetration through follicular openings (unpublished data, Bausch Health, 2018).
This polymerized emulsion also forms a barrier by reducing epidermal water loss and improving skin hydration. Skin hydration and barrier protection of the lotion were assessed through corneometry and transepidermal water loss (TEWL) in 30 healthy female volunteers (aged 35–65 years) over 24 hours. The test material was applied to the volar forearm, with an untreated site serving as a control. Measurements using Tewameter and Corneometer were taken at baseline; 15 and 30 minutes; and 1, 2, 3, 8, and 24 hours postapplication. In addition, for the 8-hour study period, 15 patients applied the test material to the right side of the face and completed a customer-perception evaluation. Adverse events were noted throughout and irritation was assessed preapplication and postapplication. There were no AEs or skin irritation reported throughout the study. At baseline, mean (standard deviation [SD]) corneometry scores were 28.9 (2.9) and 28.1 (2.7) units for the test material and untreated control, respectively. There was an immediate improvement in water content that was maintained throughout the study. After 15 minutes, the mean (SD) score had increased to 59.1 (7.1) units in the vehicle lotion group (eFigure 2A). There was no improvement at the control site, and differences were significant at all postapplication assessments (P<.001). At baseline, mean (SD) TEWL scores were 12.26 (0.48) and 12.42 (0.44) g/hm2, respectively (eFigure 2B). There was an immediate improvement in TEWL with a mean (SD) score of 6.04 (0.99) after 8 hours in the vehicle lotion group, a 50.7% change over baseline. There was no improvement at the control site, and differences were significant at all postapplication assessments (P<.001). Customer perception of the novel lotion formulation was positive, with the majority of patients (93%–100%) responding favorably to all questions about the various attributes of the test material (eFigure 3)(unpublished data, Bausch Health, 2018).
Comparison of Skin Penetration of HP Lotion 0.01% vs HP Cream 0.05%
Comparative percutaneous absorption of 2 HP formulations—0.01% lotion and 0.05% cream—was evaluated in vitro using human tissue from a single donor mounted on Bronaugh flow-through diffusion cells. Receptor phase samples were collected over the 24-hour study period and HP content assessed using liquid chromatography–mass spectrometry analysis. Halobetasol propionate lotion 0.01% demonstrated faster tissue permeation, with receptor phase levels of 0.91% of the applied dose at 24 hours compared to 0.28% of the applied dose with HP cream 0.05%. Although there was little differentiation of cumulative receptor fluid levels of HP at 6 hours, there was significant differentiation at 12 hours. Levels of HP were lowest in the receptor phase and highest in the epidermal layers of the skin, indicating limited permeation through the epidermis to the dermis. The mean (SD) for epidermal deposition of HP following the 24-hour duration of exposure was 6.17% (2.07%) and 1.72% (0.76%) for the 0.01% lotion and 0.05% cream, respectively (Figure 1)(unpublished data, Bausch Health, 2018).
Efficacy and Safety of HP Lotion 0.01% in Moderate to Severe Plaque Psoriasis
Two articles have been published on the use of HP lotion 0.01% in moderate to severe psoriasis: 2 pivotal studies comparing once-daily application with vehicle lotion over 8 weeks (N=430),20 and a comparative “label-restricted” 2-week study with HP lotion 0.01% and HP cream 0.05% (N=150).21
HP Lotion 0.01% Compared to Vehicle
Two multicenter, randomized, double-blind, vehicle-controlled phase 3 studies investigated the safety and efficacy of once-daily HP lotion 0.01% in moderate to severe plaque psoriasis (N=430).20 Patients were treated with HP lotion 0.01% or vehicle (randomized in a 2:1 ratio) for 8 weeks, with a 4-week posttreatment follow-up. Treatment success (defined as at least a 2-grade improvement in baseline IGA score and a score equating to clear or almost clear) was significantly greater with HP lotion 0.01% at all assessment points (Figure 2)(P=.003 for week 2; P<.001 for other time points). At week 8, 37.4% of patients receiving HP lotion 0.01% were treatment successes compared to 10.0% of patients receiving vehicle (P<.001). Additionally, a 2-grade improvement from baseline for each psoriasis sign—erythema, plaque elevation, and scaling—was achieved by 42.2% of patients receiving HP lotion 0.01% at week 8 compared to 11.4% of patients receiving vehicle (P<.001). Good efficacy was maintained posttreatment that was significant compared to vehicle (P<.001).20
There were corresponding reductions in body surface area (BSA) affected following treatment with HP lotion 0.01%.20 At baseline, the mean BSA was 6.1 (range, 3–12). By week 8, there was a 35.2% reduction in BSA compared to 5.9% with vehicle. Again, a significant reduction in BSA was maintained posttreatment compared to vehicle (P<.001).20
Halobetasol propionate lotion 0.01% was well tolerated with few treatment-related AEs.20 Most AEs were application-site reactions such as dermatitis (0.7%), infection, pruritus, and discoloration (0.4% each). Mild to moderate itching, dryness, burning, and stinging present at baseline all improved with treatment, and severity of local skin reactions was significantly lower than with vehicle at week 8 (P<.001). Quality-of-life data also highlighted the benefits of active treatment compared to vehicle for cutaneous tolerability. The Dermatology Life Quality Index (DLQI) is a 10-item patient-reported questionnaire consisting of questions concerning symptoms and feelings, daily activities, leisure, work and school, personal relationships, and treatment.22 Change from baseline for DLQI (how itchy, sore, painful, stinging) was significantly greater with HP lotion 0.01% at weeks 4 and 8 (P<.001). Changes in the overall DLQI score also were significantly greater with HP lotion 0.01% at both study visits (P=.006 and P=.014 at week 4 and P=.001 and P=.004 at week 8 for study 1 and study 2, respectively).20
HP Lotion 0.01% Compared to HP Cream 0.05%
Treatment success with HP lotion 0.01% also was shown to be comparable to the higher-concentration HP cream 0.05% in patients with moderate to severe psoriasis over a 2-week “label-restricted” treatment period (Figure 3). Both products were well tolerated over the 2-week treatment period. One patient reported application-site dermatitis (1.7%) with HP lotion 0.01%.21
Conclusion
Halobetasol propionate 0.05%—cream, ointment, and lotion—has been shown to be a highly effective short-term topical treatment for psoriasis. Longer-term treatment strategies using HP, which are important when considering management of a chronic condition, have been limited by safety concerns and labelling. However, there are data to suggest weekend or pulsed therapy may be an option.
A novel formulation of HP lotion 0.01% has been developed using a polymerized matrix with active ingredients and moisturizing excipients suspended in oil droplets. The polymerized honeycomb matrix and vehicle formulation form a barrier by reducing epidermal water loss and improving skin hydration. The oil droplets deliver uniform amounts of active ingredient in an optimal size for follicular penetration. Skin penetration has been shown to be quicker with greater retention in the epidermis with HP lotion 0.01% compared to HP cream 0.05%, with corresponding considerably lower penetration into the dermis.
Although there have been a number of clinical studies of HP for psoriasis, until recently there have been no comparative trials, with studies label restricted to a 2- to 4-week duration. Three clinical studies with HP lotion 0.01% have now been reported.Not only has HP lotion 0.01% been shown to be as effective as HP cream 0.05% in a 2-week comparative study (despite having one-fifth the concentration of HP), it also has been shown to be very effective and well tolerated following 8 weeks of daily use.20,21 Further studies involving longer treatment durations are required to better elucidate AEs, but HP lotion 0.01% may provide the first longer-term TCS treatment solution for moderate to severe psoriasis.
Acknowledgments
We thank Brian Bulley, MSc (Konic Limited, United Kingdom), for assistance with the preparation of the manuscript. Ortho Dermatologics funded Konic’s activities pertaining to this manuscript.
- Kamili QU, Menter A. Topical treatment of psoriasis. Curr Probl Dermatol. 2009;38:37-58.
- Bailey J, Whitehair B. Topical treatments for chronic plaque psoriasis. Am Fam Physician. 2010;81:596.
- Czarnowicki T, Linkner RV, Suarez-Farinas M, et al. An investigator-initiated, double-blind, vehicle-controlled pilot study: assessment for tachyphylaxis to topically occluded halobetasol 0.05% ointment in the treatment of psoriasis. J Am Acad Dermatol. 2014;71:954-959.
- Bernhard J, Whitmore C, Guzzo C, et al. Evaluation of halobetasol propionate ointment in the treatment of plaque psoriasis: report on two double-blind, vehicle-controlled studies. J Am Acad Dermatol. 1991;25:1170-1174.
- Katz HI, Gross E, Buxman M, et al. A double-blind, vehicle-controlled paired comparison of halobetasol propionate cream on patients with plaque psoriasis. J Am Acad Dermatol. 1991;25:1175-1178.
- Blum G, Yawalkar S. A comparative, multicenter, double blind trial of 0.05% halobetasol propionate ointment and 0.1% betamethasone valerate ointment in the treatment of patients with chronic, localized plaque psoriasis. J Am Acad Dermatol. 1991;25:1153-1156.
- Goldberg B, Hartdegen R, Presbury D, et al. A double-blind, multicenter comparison of 0.05% halobetasol propionate ointment and 0.05% clobetasol propionate ointment in patients with chronic, localized plaque psoriasis. J Am Acad Dermatol. 1991;25:1145-1148.
- Mensing H, Korsukewitz G, Yawalkar S. A double-blind, multicenter comparison between 0.05% halobetasol propionate ointment and 0.05% betamethasone dipropionate ointment in chronic plaque psoriasis. J Am Acad Dermatol. 1991;25:1149-1152.
- Pariser D, Bukhalo M, Guenthner S, et al. Two multicenter, randomized, double-blind, parallel group comparison studies of a novel enhanced lotion formulation of halobetasol propionate, 0.05% versus its vehicle in adult subjects with plaque psoriasis. J Drugs Dermatol. 2017;16:234-240.
- Herz G, Blum G, Yawalkar S. Halobetasol propionate cream by day and halobetasol propionate ointment at night for the treatment of pediatric patients with chronic, localized psoriasis and atopic dermatitis. J Am Acad Dermatol. 1991;25:1166-1169.
- Datz B, Yawalkar S. A double-blind, multicenter trial of 0.05% halobetasol propionate ointment and 0.05% clobetasol 17-propionate ointment in the treatment of patients with chronic, localized atopic dermatitis or lichen simplex chronicus. J Am Acad Dermatol. 1991;25:1157-1160.
- Kantor I, Cook PR, Cullen SI, et al. Double-blind bilateral paired comparison of 0.05% halobetasol propionate cream and its vehicle in patients with chronic atopic dermatitis and other eczematous dermatoses. J Am Acad Dermatol. 1991;25:1184-1186.
- Yawalkar SJ, Schwerzmann L. Double-blind, comparative clinical trials with halobetasol propionate cream in patients with atopic dermatitis. J Am Acad Dermatol. 1991;25:1163-1166.
- Watson WA, Kalb RE, Siskin SB, et al. The safety of halobetasol 0.05% ointment in the treatment of psoriasis. Pharmacotherapy. 1990;10:107-111.
- Dhurat R, Aj K, Vishwanath V, et al. Evaluation of the efficacy and safety of 0.05% halobetasol propionate ointment and 0.05% clobetasol propionate ointment in chronic, localized plaque psoriasis. Asian J Pharm Clin Res. 2016;9:288-291.
- Lebwohl M, Yoles A, Lombardi K, et al. Calcipotriene ointment and halobetasol ointment in the long-term treatment of psoriasis: effects on the duration of improvement. J Am Acad Dermatol. 1998;39:447-450.
- Feldman SR, Horn EJ, Balkrishnan R, et al. Psoriasis: improvingadherence to topical therapy. J Am Acad Dermatol. 2008;59:1009-1016.
- Housman TS, Mellen BG, Rapp SR, et al. Patients with psoriasis prefer solution and foam vehicles: a quantitative assessment of vehicle preference. Cutis. 2002;70:327-332.
- Eastman WJ, Malahias S, Delconte J, et al. Assessing attributes of topical vehicles for the treatment of acne, atopic dermatitis, and plaque psoriasis. Cutis. 2014;94:46-53.
- Green LJ, Kerdel FA, Cook-Bolden FE, et al. Safety and efficacy of halobetasol propionate 0.01% lotion in the treatment of moderate-to-severe plaque psoriasis: results of 2 phase III randomized controlled trials. J Drugs Dermatol. 2018;17:1062-1069.
- Kerdel FA, Draelos ZD, Tyring SK, et al. A phase 2, multicenter, double-blind, randomized, vehicle controlled clinical study to compare the safety and efficacy of halobetasol propionate 0.01% lotion and halobetasol propionate 0.05% cream in the treatment of plaque psoriasis [published online November 5, 2018].J Dermatolog Treat. 2019;30:333-339.
- Lewis V, Finlay AY. 10 years’ experience of the Dermatology Life Quality Index (DLQI). J Investig Dermatol Symp Proc. 2004;9:169-180.
Practice Points
- The widespread use of superpotent topical corticosteroids in treating psoriasis is limited by labelling that restricts short-term use, concerns about side effects, and a paucity of clinical data with longer-term use.
- Long-term management and treatment options are required for managing the chronic nature of psoriasis to improve patient satisfaction, adherence, and quality of life.
- A novel formulation of halobetasol propionate lotion 0.01% has been developed using a polymerized matrix with active ingredients and moisturizing excipients suspended in oil droplets.
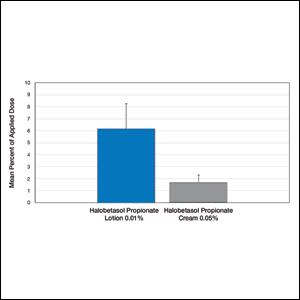
PSA cancer screening: A case for shared decision-making
Prostate cancer is the most frequently diagnosed cancer in men and the third leading cause of cancer death in men worldwide.1 An estimated 174,650 new cases are diagnosed each year in the United States; 31,620 American men die annually from the disease.2 Although prostate cancer can be a serious disease, many men do not die from it. In fact, 2.9 million men who were diagnosed with prostate cancer at some point are alive today.3
Risk factors. Prostate cancer develops mainly in men ages ≥ 65 years and rarely occurs before age 40. In addition to age, family history and African American ethnicity are the major nonmodifiable risk factors for prostate cancer.4 From the 1970s to the most recent statistical analysis of the National Cancer Institute Surveillance, Epidemiology, and End Results (SEER) program, African American men have continued to have significantly higher incidence of, and mortality rates from, prostate cancer than their European American counterparts. African American men are also more likely than men of European ancestry to have aggressive prostate cancers.5 Other risk factors include geographic location (higher risk in Northern Europe, North America, and Australia; lower risk in Asia, Africa, and South and Central America), mutations in the BRCA2 gene, and hereditary non-polyposis colon cancer syndrome.4
Prostate-specific antigen (PSA) was first used as a screening tool for prostate cancer in 1991.6 Prostate cancer incidence, especially organ-confined disease, has dramatically increased since then.7 PSA testing has a low sensitivity and specificity for the detection of prostate cancer, and there is no clear threshold at which biopsy can or should be offered. The most commonly used cutoff value of 4 ng/mL has a false-positive rate of about 70%.8
Benign prostatic conditions such as hypertrophy and infection can elevate PSA levels. In addition, the PSA test does not distinguish between aggressive and slow-growing cancers, and about 15% of patients with prostate cancer have a normal PSA level.9
A word about the digital rectal exam. While PSA testing has been the mainstay of prostate cancer screening, a few studies have included digital rectal exam (DRE) in their protocols. Data from the Prostate, Lung, Colorectal, and Ovarian (PLCO) Cancer Screening Trial showed that DRE captured an additional 2% of men with prostate cancer in the setting of a normal PSA test result.10 In the Rotterdam arm of the European Randomized Study of Screening for Prostate Cancer (ERSPC) trial, the overall detection rate for prostate cancer was found to be better when DRE was combined with PSA and prostate biopsy than when DRE was used alone (4.5% vs 2.5%).11 Nevertheless, generally speaking, DRE can be omitted in the era of PSA screening.
Screening guidelines vary
Recommendations for prostate cancer screening vary by organization and are summarized in TABLE 1.9,12-14 In 2012, the US Preventive Services Task Force (USPSTF) recommended against PSA-based screening for prostate cancer (Category D).15 In 2018, USPSTF provided an update with a new recommendation that clinicians inform men ages 55 to 69 years about the potential benefits and harms of PSA-based screening (Category C).14 The USPSTF continues to recommend against PSA-based screening for men ages ≥ 70 years (Category D).14

Does PSA-based screening improve patient-centered outcomes?
Several randomized controlled trials (RCTs) such as the Quebec Prospective Randomized Controlled Trial,16 the Norrköping Sweden Study,17 ERSPC,11 and PLCO10 have been conducted to assess the benefits of PSA testing. PLCO and ERSPC have contributed significantly to our understanding of prostate cancer screening even though their 13-year follow-up results are conflicting (TABLE 2).10,11,18

Continue to: In the ERSPC 13-year follow-up publication...
In the ERSPC 13-year follow-up publication, the authors concluded that a substantial reduction in prostate cancer mortality is attributable to testing with PSA.18 Despite limitations in the study design (eg, France entered after 2 years, screening intervals varied between 2 and 4 years, biopsy indications varied, and screening was discontinued at different times), PSA screening detected more prostate cancer than was detected in the control arm (10.2% vs 6.8%).
In the initial 11 years of follow-up, the study group experienced a 21% reduction in prostate cancer mortality, even though the absolute decrease ranged from only 0.6% (545 per 89,352) to 0.5% (355 per 72,891). The updated absolute risk reduction of death from prostate cancer at 13 years of follow-up showed a larger benefit: 0.11 per 1000 person-years or 1.28 per 1000 men randomized, which is equivalent to 1 prostate cancer death averted per 781 (95% confidence interval [CI], 490-1929) men invited for screening, or 1 per 27 (17-66) additional prostate cancers detected.
The PLCO trial did not show any significant difference in prostate cancer detection (11.1% screened vs 9.9% control), and there was no improvement in prostate cancer mortality (3.7 vs 3.4 death per 10,000 person-years).10 However, the PLCO trial suffered from issues of contamination, which may have influenced the overall results. About 52% of men in the control (usual care) group received a PSA test at some point during the study. And more than two-thirds of the men who had a prostate biopsy because of a positive PSA test did not have prostate cancer.
Community standards for the PSA threshold for biopsy were applied in various centers (> 4 ng/ml in general) in PLCO, whereas in ERSPC, a cut-off PSA value ≥ 3 ng/mL was used for biopsy. Because of the lower PSA threshold, ERSPC may have identified cancers that would have had good outcomes without any intervention.
The harms of PSA screening
While it is unclear whether PSA screening results in any improvement in patient-centered outcomes, it does lead to downstream intervention due to overdiagnosis, which precipitates unnecessary anxiety, biopsies, and overtreatment (eg, excess radiation, overuse of androgen deprivation therapy).19 Biopsies carry the risk of hematuria (22.6%), hematospermia (50.4%), and urinary tract infection.20 Data from SEER-Medicare showed that prostate biopsy was associated with a 2.65-fold increased risk of hospitalization within 30 days of the procedure compared to a control population.21
Continue to: Overdiagnosis leads to overtreatment...
Overdiagnosis leads to overtreatment of low-risk prostate cancer. Both traditional treatment options for prostate cancer—radical prostatectomy and radiotherapy—are associated with urinary incontinence, erectile dysfunction, and issues with bowel function.22,23
The Prostate Cancer Intervention vs Observation Trial (PIVOT),24 the Scandinavian Prostate Cancer Group Study Number 4 (SPCG-4),25 and the Prostate Testing for Cancer and Treatment (ProtecT) trial,22,23 are the major RCTs that looked at the outcomes of treatment modalities for localized prostate cancer in the modern era of PSA testing.
PIVOT compared passive observation with radical prostatectomy.24 After 20 years of follow-up on 731 patients, the researchers concluded that radical prostatectomy did not reduce all-cause or prostate cancer–related mortality (TABLE 3).24

SPCG-4 showed survival benefits for men who underwent radical prostatectomy compared with men in a watchful waiting group, but only 5% of the study cohort had cancer detected by PSA screening (TABLE 4).25 The rest had either palpable tumors or symptoms of a tumor.

ProtecT, which followed patients with localized prostate cancer for more than 10 years,compared the outcomes and adverse effects of active surveillance, radical prostatectomy, and radiotherapy.23 Prostate cancer–specific mortality was low irrespective of the treatment,23 and there was no significant difference in all-cause mortality or prostate cancer–specific mortality between the 3 treatment groups.23 The active surveillance group had considerably fewer adverse events.22,23 The incidence rates of erectile dysfunction and urinary incontinence at the 1- and 6-year follow-up marks are outlined in TABLE 5.22

Continue to: The purpose of active monitoring...
The purpose of active monitoring is to minimize overtreatment by avoiding immediate radical intervention. Radical treatments with curative intent can be undertaken at any point while patients are being actively monitored. It is important to note that the active monitoring that took place in ProtecT23 was very different from the passive surveillance of PIVOT24 and SPCG-4.25 In ProtecT, once an elevated serum PSA level was noted, PSA levels were monitored every 3 months in the first year and every 6 to 12 months thereafter.23 Triggers to reassess patients and consider a change in clinical management were based largely on changes in PSA levels. Participants with an increase of at least 50% in PSA level during the previous 12 months were offered either continued monitoring or treatment after further testing.
Making individualized decisions about prostate cancer screening
Traditionally, the goal of cancer screening has been to maximize the number of people screened. Generally, the information provided to patients about cancer screening emphasizes the benefits and minimizes the harms. Recently, however, there has been a shift in communication about cancer screening with the emphasis now being placed on informed decision-making and encouraging patients to make individual decisions about screening participation.26
The treatment option of active surveillance, with its lower incidence of adverse outcomes, is an important reason for patients to make individualized decisions about prostate cancer screening.
Another reason relates to 5-alpha-reductase inhibitors. Although their role in the management of prostate cancer is currently not well defined, a reduction of almost 25% in the risk of prostate cancer and improvement in the performance of PSA has been reported.27
And yet another reason is that there are alternate strategies to manage the majority of patients who have been diagnosed with low-risk disease through transrectal ultrasound biopsy. The ERSPC study mentions multiparametric magnetic resonance imaging combined with targeted biopsy to identify high-grade disease.28,29 Genetic and epigenetic assays of the biopsied tissue can help grade disease based on aggressiveness.30 Transperineal mapping biopsy using a mapping software program can identify specific disease sites within the prostate gland, so that patients can be offered the option of targeted therapy.30
Continue to: Applying shared decision-making to prostate cancer screening
Applying shared decision-making to prostate cancer screening
Balancing errors of omission with errors of commission is challenging. Shared decision-making (SDM) is an approach whereby clinicians and patients share the best available evidence when faced with the task of medical decision-making and in which patients are supported while they consider their options and achieve their preferences.31 SDM is well supported by evidence from a number of RCTs and results in increased knowledge, involvement, and confidence on the part of patients.32 An individualized approach using the schematic diagram (FIGURE 13,18) may be helpful.

Barriers to SDM success. Many factors can interfere with the success of SDM including limited or poor communication; lack of time during busy office visits; and patients’ cultural, informational, and/or emotional needs. To improve patient-centered communication, we can: (1) make information understandable and available to patients and families; (2) prioritize training in communication; (3) use decision aid tools to facilitate communication; and (4) work to improve the payment model to incentivize patient-centered communication. Tools that facilitate SDM include videotapes, patient group discussions, brief scripts read to patients, and informational pamphlets. One such tool is the American Society for Clinical Oncology’s decision aid tool for PSA testing.33
Limited knowledge among patients. Decisions regarding treatment among men diagnosed with localized prostate cancer can be difficult because there are several treatment options with similar prognoses, but there are differences in adverse effects. One population-based cohort study of men with newly diagnosed localized prostate cancer found that most men had significant knowledge deficits regarding the survival benefits of the 2 major treatment options—surgery and radiation.34 In a large population-based study, 38% of men with localized prostate cancer reported receiving help from their primary care providers in the decision-making process for treatment.35
Learning to employ SDM. Elwyn et al proposed a 3-step model to incorporate SDM into clinical practice.31 They described key steps that include: choice talk (making sure patients are informed about the reasonable options), option talk (providing more detailed information about the options), and decision talk (supporting the work of patients considering their preferences and deciding what is best). Properly employing these methods requires training using simulations.31
The bottom line
Although current guidelines regarding PSA screening differ by organization, generally speaking PSA screening should be offered only to men with a life expectancy > 10 years. The PSA test has low sensitivity and specificity and lacks a clear cut-off value that warrants prostate biopsy. Men who choose to have PSA testing increase their chances of detecting prostate cancer, but most prostate cancers are slow growing and do not cause death. The decision to undergo PSA screening should be made by both the provider and the patient, after a discussion of the limited benefits and associated harms. The interval of follow-up screening may vary from 2 to 4 years depending on patient age, level of PSA, and whether a patient is taking medications such as 5-alpha-reductase inhibitors.
CORRESPONDENCE
Jaividhya Dasarathy, MD, FAAFP, 2500 Metro Health Medical Drive, Cleveland, Ohio 44109; [email protected].
1. Siegel RL, Miller KD, Jemal A. Cancer statistics, 2016. CA Cancer J Clin. 2016;66:7-30.
2. National Cancer Institute Surveillance, Epidemiology, and End Results Program. Cancer Stat Facts: Prostate Cancer. https://seer.cancer.gov/statfacts/html/prost.html. Accessed January 16, 2020.
3. American Cancer Society. Key statistics for prostate cancer. Last revised August 1, 2019. www.cancer.org/cancer/prostate-cancer/about/key-statistics.html. Accessed January 16, 2020.
4. Brawley OW. Trends in prostate cancer in the United States. J Natl Cancer Inst Monogr. 2012;2012:152-156.
5. Powell IJ. Epidemiology and pathophysiology of prostate cancer in African-American men. J Urol. 2007;177:444-449.
6. Catalona WJ, Smith DS, Ratliff TL, et al. Measurement of prostate-specific antigen in serum as a screening test for prostate cancer. N Engl J Med. 1991;324:1156-1161.
7. Jacobsen SJ, Katusic SK, Bergstraih EJ. Incidence of prostate cancer diagnosis in the eras before and after serum prostate-specific antigen testing. JAMA. 1995;274:1445-1449.
8. Mistry K, Cable G. Meta-analysis of prostate-specific antigen and digital rectal examination as screening tests for prostate carcinoma. J Am Board Fam Pract. 2003;16:95-101.
9. Qaseem A, Barry MJ, Denberg TD, et al. Screening for prostate cancer: a guidance statement from the Clinical Guidelines Committee of the American College of Physicians. Ann Int Med. 2013;158:761-769.
10. Andriole GL, Crawford ED, Grubb RL 3rd, et al. Prostate cancer screening in the randomized Prostate, Lung, Colorectal, and Ovarian Cancer Screening Trial: mortality results after 13 years of follow-up. J Natl Cancer Inst. 2012;104:125-132.
11. Schröder FH, Hugosson J, Roobol MJ, et al. Screening and prostate-cancer mortality in a randomized European study. N Engl J Med. 2009;360:1320-1328.
12. American Cancer Society. American Cancer Society recommendations for prostate cancer early detection. Last revised August 1, 2019. www.cancer.org/cancer/prostate-cancer/detection-diagnosis-staging/acs-recommendations.html. Accessed January 16, 2020.
13. American Urologic Association. Early detection of prostate cancer (2018). Reviewed 2018. https://www.auanet.org/guidelines/prostate-cancer-early-detection-guideline. Accessed January 16, 2020.
14. US Preventive Services Task Force. Screening for Prostate Cancer: US Preventive Services Task Force Recommendation Statement. JAMA. 2018;319:1901-1913.
15 Moyer VA. Screening for prostate cancer: US Preventive Services Task Force recommendation statement. Ann Int Med. 2012;157:120-134.
16. Labrie F, Candas B, Dupont A, et al. Screening decreases prostate cancer death: first analysis of the 1988 Quebec prospective randomized controlled trial. Prostate. 1999;38:83-91.
17. Sandblom G, Varenhorst E, Rosell J, et al. Randomised prostate cancer screening trial: 20-year follow-up. BMJ. 2011;342:d1539.
18. Schröder FH, Hugosson J, Roobol MJ, et al. Screening and prostate cancer mortality: results of the European Randomized Study of Screening for Prostate Cancer (ERSPC) at 13 years of follow-up. Lancet. 2014;384:2027-2035.
19. McNaughton-Collins M, Fowler FJ Jr, Caubet JF, et al. Psychological effects of a suspicious prostate cancer screening test followed by a benign biopsy result. Am J Med. 2004;117:719-725.
20 Raaijmakers R, Kirkels WJ, Roobol MJ, et al. Complication rates and risk factors of 5802 transrectal ultrasound-guided sextant biopsies of the prostate within a population-based screening program. Urology. 2002;60:826-830.
21. Loeb S, Carter HB, Berndt SI, et al. Complications after prostate biopsy: data from SEER-Medicare. J Urol. 2011;186:1830-1834.
22. Donovan J, Hamdy F, Lane J, et al. Patient-reported outcomes after monitoring, surgery, or radiotherapy for prostate cancer. N Engl J Med. 2016;375:1425-1437.
23. Hamdy FC, Donovan JL, Lane JA, et al. 10-year outcomes after monitoring, surgery, or radiotherapy for localized prostate cancer. N Engl J Med. 2016;375:1415-1424.
24. Wilt TJ, Jones KM, Barry MJ, et al. Follow-up of prostatectomy versus observation for early prostate cancer. N Engl J Med. 2017;377:132-142.
25. Bill-Axelson A, Holmberg L, Garmo H, et al. Radical prostatectomy or watchful waiting in early prostate cancer. N Engl J Med. 2018;379:2319-2329.
26. Hersch JK, Nickel BL, Ghanouni A, et al. Improving communication about cancer screening: moving towards informed decision making. Public Health Res Pract. 2017;27(2).
27. Cuzick J, Thorat MA, Andriole G, et al. Prevention and early detection of prostate cancer. Lancet Oncol. 2014;15:e484-e492.
28. Pinto PA, Chung PH, Rastinehad AR, et al. Magnetic resonance imaging/ultrasound fusion guided prostate biopsy improves cancer detection following transrectal ultrasound biopsy and correlates with multiparametric magnetic resonance imaging. J Urol. 2011;186:1281-1285.
29. Kuru TH, Roethke MC, Seidenader J, et al. Critical evaluation of magnetic resonance imaging targeted, transrectal ultrasound guided transperineal fusion biopsy for detection of prostate cancer. J Urol. 2013;190:1380-1386.
30. Crawford ED, Rove KO, Barqawi AB, et al. Clinical-pathologic correlation between transperineal mapping biopsies of the prostate and three-dimensional reconstruction of prostatectomy specimens. Prostate. 2013;73:778-787.
31. Elwyn G, Frosch D, Thomson R, et al. Shared decision making: a model for clinical practice. J Gen Intern Med. 2012;27:1361-1367.
32. Stacey D, Légaré F, Lewis K, et al. Decision aids for people facing health treatment or screening decisions. Cochrane Database Syst Rev. 2017;4:CD001431.
33. ASCO. Decision aid tool: prostate cancer screening with PSA testing. https://www.asco.org/sites/new-www.asco.org/files/content-files/practice-and-guidelines/documents/2012-psa-pco-decision-aid.pdf. Accessed January 16, 2020.
34. Daum LM, Reamer EN, Ruterbusch JJ, et al. Patient knowledge and qualities of treatment decisions for localized prostate cancer. J Am Board Fam Med. 2017;30:288-297.
35. Radhakrishnan A, Grande D, Ross M, et al. When primary care providers (PCPs) help patients choose prostate cancer treatment. J Am Board Fam Med. 2017;30:298-307.
Prostate cancer is the most frequently diagnosed cancer in men and the third leading cause of cancer death in men worldwide.1 An estimated 174,650 new cases are diagnosed each year in the United States; 31,620 American men die annually from the disease.2 Although prostate cancer can be a serious disease, many men do not die from it. In fact, 2.9 million men who were diagnosed with prostate cancer at some point are alive today.3
Risk factors. Prostate cancer develops mainly in men ages ≥ 65 years and rarely occurs before age 40. In addition to age, family history and African American ethnicity are the major nonmodifiable risk factors for prostate cancer.4 From the 1970s to the most recent statistical analysis of the National Cancer Institute Surveillance, Epidemiology, and End Results (SEER) program, African American men have continued to have significantly higher incidence of, and mortality rates from, prostate cancer than their European American counterparts. African American men are also more likely than men of European ancestry to have aggressive prostate cancers.5 Other risk factors include geographic location (higher risk in Northern Europe, North America, and Australia; lower risk in Asia, Africa, and South and Central America), mutations in the BRCA2 gene, and hereditary non-polyposis colon cancer syndrome.4
Prostate-specific antigen (PSA) was first used as a screening tool for prostate cancer in 1991.6 Prostate cancer incidence, especially organ-confined disease, has dramatically increased since then.7 PSA testing has a low sensitivity and specificity for the detection of prostate cancer, and there is no clear threshold at which biopsy can or should be offered. The most commonly used cutoff value of 4 ng/mL has a false-positive rate of about 70%.8
Benign prostatic conditions such as hypertrophy and infection can elevate PSA levels. In addition, the PSA test does not distinguish between aggressive and slow-growing cancers, and about 15% of patients with prostate cancer have a normal PSA level.9
A word about the digital rectal exam. While PSA testing has been the mainstay of prostate cancer screening, a few studies have included digital rectal exam (DRE) in their protocols. Data from the Prostate, Lung, Colorectal, and Ovarian (PLCO) Cancer Screening Trial showed that DRE captured an additional 2% of men with prostate cancer in the setting of a normal PSA test result.10 In the Rotterdam arm of the European Randomized Study of Screening for Prostate Cancer (ERSPC) trial, the overall detection rate for prostate cancer was found to be better when DRE was combined with PSA and prostate biopsy than when DRE was used alone (4.5% vs 2.5%).11 Nevertheless, generally speaking, DRE can be omitted in the era of PSA screening.
Screening guidelines vary
Recommendations for prostate cancer screening vary by organization and are summarized in TABLE 1.9,12-14 In 2012, the US Preventive Services Task Force (USPSTF) recommended against PSA-based screening for prostate cancer (Category D).15 In 2018, USPSTF provided an update with a new recommendation that clinicians inform men ages 55 to 69 years about the potential benefits and harms of PSA-based screening (Category C).14 The USPSTF continues to recommend against PSA-based screening for men ages ≥ 70 years (Category D).14
Does PSA-based screening improve patient-centered outcomes?
Several randomized controlled trials (RCTs) such as the Quebec Prospective Randomized Controlled Trial,16 the Norrköping Sweden Study,17 ERSPC,11 and PLCO10 have been conducted to assess the benefits of PSA testing. PLCO and ERSPC have contributed significantly to our understanding of prostate cancer screening even though their 13-year follow-up results are conflicting (TABLE 2).10,11,18
Continue to: In the ERSPC 13-year follow-up publication...
In the ERSPC 13-year follow-up publication, the authors concluded that a substantial reduction in prostate cancer mortality is attributable to testing with PSA.18 Despite limitations in the study design (eg, France entered after 2 years, screening intervals varied between 2 and 4 years, biopsy indications varied, and screening was discontinued at different times), PSA screening detected more prostate cancer than was detected in the control arm (10.2% vs 6.8%).
In the initial 11 years of follow-up, the study group experienced a 21% reduction in prostate cancer mortality, even though the absolute decrease ranged from only 0.6% (545 per 89,352) to 0.5% (355 per 72,891). The updated absolute risk reduction of death from prostate cancer at 13 years of follow-up showed a larger benefit: 0.11 per 1000 person-years or 1.28 per 1000 men randomized, which is equivalent to 1 prostate cancer death averted per 781 (95% confidence interval [CI], 490-1929) men invited for screening, or 1 per 27 (17-66) additional prostate cancers detected.
The PLCO trial did not show any significant difference in prostate cancer detection (11.1% screened vs 9.9% control), and there was no improvement in prostate cancer mortality (3.7 vs 3.4 death per 10,000 person-years).10 However, the PLCO trial suffered from issues of contamination, which may have influenced the overall results. About 52% of men in the control (usual care) group received a PSA test at some point during the study. And more than two-thirds of the men who had a prostate biopsy because of a positive PSA test did not have prostate cancer.
Community standards for the PSA threshold for biopsy were applied in various centers (> 4 ng/ml in general) in PLCO, whereas in ERSPC, a cut-off PSA value ≥ 3 ng/mL was used for biopsy. Because of the lower PSA threshold, ERSPC may have identified cancers that would have had good outcomes without any intervention.
The harms of PSA screening
While it is unclear whether PSA screening results in any improvement in patient-centered outcomes, it does lead to downstream intervention due to overdiagnosis, which precipitates unnecessary anxiety, biopsies, and overtreatment (eg, excess radiation, overuse of androgen deprivation therapy).19 Biopsies carry the risk of hematuria (22.6%), hematospermia (50.4%), and urinary tract infection.20 Data from SEER-Medicare showed that prostate biopsy was associated with a 2.65-fold increased risk of hospitalization within 30 days of the procedure compared to a control population.21
Continue to: Overdiagnosis leads to overtreatment...
Overdiagnosis leads to overtreatment of low-risk prostate cancer. Both traditional treatment options for prostate cancer—radical prostatectomy and radiotherapy—are associated with urinary incontinence, erectile dysfunction, and issues with bowel function.22,23
The Prostate Cancer Intervention vs Observation Trial (PIVOT),24 the Scandinavian Prostate Cancer Group Study Number 4 (SPCG-4),25 and the Prostate Testing for Cancer and Treatment (ProtecT) trial,22,23 are the major RCTs that looked at the outcomes of treatment modalities for localized prostate cancer in the modern era of PSA testing.
PIVOT compared passive observation with radical prostatectomy.24 After 20 years of follow-up on 731 patients, the researchers concluded that radical prostatectomy did not reduce all-cause or prostate cancer–related mortality (TABLE 3).24
SPCG-4 showed survival benefits for men who underwent radical prostatectomy compared with men in a watchful waiting group, but only 5% of the study cohort had cancer detected by PSA screening (TABLE 4).25 The rest had either palpable tumors or symptoms of a tumor.
ProtecT, which followed patients with localized prostate cancer for more than 10 years,compared the outcomes and adverse effects of active surveillance, radical prostatectomy, and radiotherapy.23 Prostate cancer–specific mortality was low irrespective of the treatment,23 and there was no significant difference in all-cause mortality or prostate cancer–specific mortality between the 3 treatment groups.23 The active surveillance group had considerably fewer adverse events.22,23 The incidence rates of erectile dysfunction and urinary incontinence at the 1- and 6-year follow-up marks are outlined in TABLE 5.22
Continue to: The purpose of active monitoring...
The purpose of active monitoring is to minimize overtreatment by avoiding immediate radical intervention. Radical treatments with curative intent can be undertaken at any point while patients are being actively monitored. It is important to note that the active monitoring that took place in ProtecT23 was very different from the passive surveillance of PIVOT24 and SPCG-4.25 In ProtecT, once an elevated serum PSA level was noted, PSA levels were monitored every 3 months in the first year and every 6 to 12 months thereafter.23 Triggers to reassess patients and consider a change in clinical management were based largely on changes in PSA levels. Participants with an increase of at least 50% in PSA level during the previous 12 months were offered either continued monitoring or treatment after further testing.
Making individualized decisions about prostate cancer screening
Traditionally, the goal of cancer screening has been to maximize the number of people screened. Generally, the information provided to patients about cancer screening emphasizes the benefits and minimizes the harms. Recently, however, there has been a shift in communication about cancer screening with the emphasis now being placed on informed decision-making and encouraging patients to make individual decisions about screening participation.26
The treatment option of active surveillance, with its lower incidence of adverse outcomes, is an important reason for patients to make individualized decisions about prostate cancer screening.
Another reason relates to 5-alpha-reductase inhibitors. Although their role in the management of prostate cancer is currently not well defined, a reduction of almost 25% in the risk of prostate cancer and improvement in the performance of PSA has been reported.27
And yet another reason is that there are alternate strategies to manage the majority of patients who have been diagnosed with low-risk disease through transrectal ultrasound biopsy. The ERSPC study mentions multiparametric magnetic resonance imaging combined with targeted biopsy to identify high-grade disease.28,29 Genetic and epigenetic assays of the biopsied tissue can help grade disease based on aggressiveness.30 Transperineal mapping biopsy using a mapping software program can identify specific disease sites within the prostate gland, so that patients can be offered the option of targeted therapy.30
Continue to: Applying shared decision-making to prostate cancer screening
Applying shared decision-making to prostate cancer screening
Balancing errors of omission with errors of commission is challenging. Shared decision-making (SDM) is an approach whereby clinicians and patients share the best available evidence when faced with the task of medical decision-making and in which patients are supported while they consider their options and achieve their preferences.31 SDM is well supported by evidence from a number of RCTs and results in increased knowledge, involvement, and confidence on the part of patients.32 An individualized approach using the schematic diagram (FIGURE 13,18) may be helpful.
Barriers to SDM success. Many factors can interfere with the success of SDM including limited or poor communication; lack of time during busy office visits; and patients’ cultural, informational, and/or emotional needs. To improve patient-centered communication, we can: (1) make information understandable and available to patients and families; (2) prioritize training in communication; (3) use decision aid tools to facilitate communication; and (4) work to improve the payment model to incentivize patient-centered communication. Tools that facilitate SDM include videotapes, patient group discussions, brief scripts read to patients, and informational pamphlets. One such tool is the American Society for Clinical Oncology’s decision aid tool for PSA testing.33
Limited knowledge among patients. Decisions regarding treatment among men diagnosed with localized prostate cancer can be difficult because there are several treatment options with similar prognoses, but there are differences in adverse effects. One population-based cohort study of men with newly diagnosed localized prostate cancer found that most men had significant knowledge deficits regarding the survival benefits of the 2 major treatment options—surgery and radiation.34 In a large population-based study, 38% of men with localized prostate cancer reported receiving help from their primary care providers in the decision-making process for treatment.35
Learning to employ SDM. Elwyn et al proposed a 3-step model to incorporate SDM into clinical practice.31 They described key steps that include: choice talk (making sure patients are informed about the reasonable options), option talk (providing more detailed information about the options), and decision talk (supporting the work of patients considering their preferences and deciding what is best). Properly employing these methods requires training using simulations.31
The bottom line
Although current guidelines regarding PSA screening differ by organization, generally speaking PSA screening should be offered only to men with a life expectancy > 10 years. The PSA test has low sensitivity and specificity and lacks a clear cut-off value that warrants prostate biopsy. Men who choose to have PSA testing increase their chances of detecting prostate cancer, but most prostate cancers are slow growing and do not cause death. The decision to undergo PSA screening should be made by both the provider and the patient, after a discussion of the limited benefits and associated harms. The interval of follow-up screening may vary from 2 to 4 years depending on patient age, level of PSA, and whether a patient is taking medications such as 5-alpha-reductase inhibitors.
CORRESPONDENCE
Jaividhya Dasarathy, MD, FAAFP, 2500 Metro Health Medical Drive, Cleveland, Ohio 44109; [email protected].
1. Siegel RL, Miller KD, Jemal A. Cancer statistics, 2016. CA Cancer J Clin. 2016;66:7-30.
2. National Cancer Institute Surveillance, Epidemiology, and End Results Program. Cancer Stat Facts: Prostate Cancer. https://seer.cancer.gov/statfacts/html/prost.html. Accessed January 16, 2020.
3. American Cancer Society. Key statistics for prostate cancer. Last revised August 1, 2019. www.cancer.org/cancer/prostate-cancer/about/key-statistics.html. Accessed January 16, 2020.
4. Brawley OW. Trends in prostate cancer in the United States. J Natl Cancer Inst Monogr. 2012;2012:152-156.
5. Powell IJ. Epidemiology and pathophysiology of prostate cancer in African-American men. J Urol. 2007;177:444-449.
6. Catalona WJ, Smith DS, Ratliff TL, et al. Measurement of prostate-specific antigen in serum as a screening test for prostate cancer. N Engl J Med. 1991;324:1156-1161.
7. Jacobsen SJ, Katusic SK, Bergstraih EJ. Incidence of prostate cancer diagnosis in the eras before and after serum prostate-specific antigen testing. JAMA. 1995;274:1445-1449.
8. Mistry K, Cable G. Meta-analysis of prostate-specific antigen and digital rectal examination as screening tests for prostate carcinoma. J Am Board Fam Pract. 2003;16:95-101.
9. Qaseem A, Barry MJ, Denberg TD, et al. Screening for prostate cancer: a guidance statement from the Clinical Guidelines Committee of the American College of Physicians. Ann Int Med. 2013;158:761-769.
10. Andriole GL, Crawford ED, Grubb RL 3rd, et al. Prostate cancer screening in the randomized Prostate, Lung, Colorectal, and Ovarian Cancer Screening Trial: mortality results after 13 years of follow-up. J Natl Cancer Inst. 2012;104:125-132.
11. Schröder FH, Hugosson J, Roobol MJ, et al. Screening and prostate-cancer mortality in a randomized European study. N Engl J Med. 2009;360:1320-1328.
12. American Cancer Society. American Cancer Society recommendations for prostate cancer early detection. Last revised August 1, 2019. www.cancer.org/cancer/prostate-cancer/detection-diagnosis-staging/acs-recommendations.html. Accessed January 16, 2020.
13. American Urologic Association. Early detection of prostate cancer (2018). Reviewed 2018. https://www.auanet.org/guidelines/prostate-cancer-early-detection-guideline. Accessed January 16, 2020.
14. US Preventive Services Task Force. Screening for Prostate Cancer: US Preventive Services Task Force Recommendation Statement. JAMA. 2018;319:1901-1913.
15 Moyer VA. Screening for prostate cancer: US Preventive Services Task Force recommendation statement. Ann Int Med. 2012;157:120-134.
16. Labrie F, Candas B, Dupont A, et al. Screening decreases prostate cancer death: first analysis of the 1988 Quebec prospective randomized controlled trial. Prostate. 1999;38:83-91.
17. Sandblom G, Varenhorst E, Rosell J, et al. Randomised prostate cancer screening trial: 20-year follow-up. BMJ. 2011;342:d1539.
18. Schröder FH, Hugosson J, Roobol MJ, et al. Screening and prostate cancer mortality: results of the European Randomized Study of Screening for Prostate Cancer (ERSPC) at 13 years of follow-up. Lancet. 2014;384:2027-2035.
19. McNaughton-Collins M, Fowler FJ Jr, Caubet JF, et al. Psychological effects of a suspicious prostate cancer screening test followed by a benign biopsy result. Am J Med. 2004;117:719-725.
20 Raaijmakers R, Kirkels WJ, Roobol MJ, et al. Complication rates and risk factors of 5802 transrectal ultrasound-guided sextant biopsies of the prostate within a population-based screening program. Urology. 2002;60:826-830.
21. Loeb S, Carter HB, Berndt SI, et al. Complications after prostate biopsy: data from SEER-Medicare. J Urol. 2011;186:1830-1834.
22. Donovan J, Hamdy F, Lane J, et al. Patient-reported outcomes after monitoring, surgery, or radiotherapy for prostate cancer. N Engl J Med. 2016;375:1425-1437.
23. Hamdy FC, Donovan JL, Lane JA, et al. 10-year outcomes after monitoring, surgery, or radiotherapy for localized prostate cancer. N Engl J Med. 2016;375:1415-1424.
24. Wilt TJ, Jones KM, Barry MJ, et al. Follow-up of prostatectomy versus observation for early prostate cancer. N Engl J Med. 2017;377:132-142.
25. Bill-Axelson A, Holmberg L, Garmo H, et al. Radical prostatectomy or watchful waiting in early prostate cancer. N Engl J Med. 2018;379:2319-2329.
26. Hersch JK, Nickel BL, Ghanouni A, et al. Improving communication about cancer screening: moving towards informed decision making. Public Health Res Pract. 2017;27(2).
27. Cuzick J, Thorat MA, Andriole G, et al. Prevention and early detection of prostate cancer. Lancet Oncol. 2014;15:e484-e492.
28. Pinto PA, Chung PH, Rastinehad AR, et al. Magnetic resonance imaging/ultrasound fusion guided prostate biopsy improves cancer detection following transrectal ultrasound biopsy and correlates with multiparametric magnetic resonance imaging. J Urol. 2011;186:1281-1285.
29. Kuru TH, Roethke MC, Seidenader J, et al. Critical evaluation of magnetic resonance imaging targeted, transrectal ultrasound guided transperineal fusion biopsy for detection of prostate cancer. J Urol. 2013;190:1380-1386.
30. Crawford ED, Rove KO, Barqawi AB, et al. Clinical-pathologic correlation between transperineal mapping biopsies of the prostate and three-dimensional reconstruction of prostatectomy specimens. Prostate. 2013;73:778-787.
31. Elwyn G, Frosch D, Thomson R, et al. Shared decision making: a model for clinical practice. J Gen Intern Med. 2012;27:1361-1367.
32. Stacey D, Légaré F, Lewis K, et al. Decision aids for people facing health treatment or screening decisions. Cochrane Database Syst Rev. 2017;4:CD001431.
33. ASCO. Decision aid tool: prostate cancer screening with PSA testing. https://www.asco.org/sites/new-www.asco.org/files/content-files/practice-and-guidelines/documents/2012-psa-pco-decision-aid.pdf. Accessed January 16, 2020.
34. Daum LM, Reamer EN, Ruterbusch JJ, et al. Patient knowledge and qualities of treatment decisions for localized prostate cancer. J Am Board Fam Med. 2017;30:288-297.
35. Radhakrishnan A, Grande D, Ross M, et al. When primary care providers (PCPs) help patients choose prostate cancer treatment. J Am Board Fam Med. 2017;30:298-307.
PRACTICE RECOMMENDATIONS
› Recommend individualized decision-making to men ages 55 to 69 years after discussing the potential benefits and risks of prostate-specific antigen (PSA)-based screening. B
› Do not use a PSA-based screening method for prostate cancer in men ages < 50 years or > 70 years or men with a life expectancy < 10 years. C
› Do not routinely recommend PSA-based screening to men with a family history of prostate cancer or to men who are African American. C
Strength of recommendation (SOR)
A Good-quality patient-oriented evidence
B Inconsistent or limited-quality patient-oriented evidence
C Consensus, usual practice, opinion, disease-oriented evidence, case series

2020 Update on obstetrics
Attributed to the ancient Greek philosopher Heraclitus, and often quoted in contemporary times, is the expression “the only constant is change.” This sentiment rings true for the field of obstetrics this past year, as several bread-and-butter guidelines for managing common obstetric conditions were either challenged or altered.
The publication of the PROLONG trial called into question the use of intramuscular progesterone for the prevention of preterm birth. Prophylaxis guidelines for group B streptococcal disease were updated, including several significant clinical practice changes. Finally, there was a comprehensive overhaul of the guidelines for hypertensive disorders of pregnancy, which replaced a landmark Task Force document from the American College of Obstetricians and Gynecologists (ACOG) that was published only a few years ago.
Change is constant, and in obstetrics it is vital to keep up with the changing guidelines that result as new data become available for digestion and implementation into everyday clinical practice.
Results from the PROLONG trial may shake up treatment options for recurrent preterm birth
Blackwell SC, Gyamfi-Bannerman C, Biggio JR Jr, et al. 17-OHPC to prevent recurrent preterm birth in singleton gestations (PROLONG study): a multicenter, international, randomized double-blind trial. Am J Perinatol. 2019. doi: 10.1055/s-0039-3400227. 
The drug 17 α-hydroxyprogesterone caproate (17-OHPC, or 17P; Makena) was approved by the US Food and Drug Administration (FDA) in 2011 for the prevention of spontaneous preterm birth (PTB) in women with a singleton pregnancy and a history of singleton spontaneous PTB. The results of the trial by Meis and colleagues of 17-OHPC played a major role in achieving that approval, as it demonstrated a 34% reduction in recurrent PTB and a reduction in some neonatal morbidities.1 Following the drug's approval, both ACOG and the Society for Maternal-Fetal Medicine (SMFM) published guidelines recommending progesterone therapy, including 17-OHPC, for the prevention of recurrent spontaneous PTB.2
The FDA approval of 17-OHPC was granted under an accelerated conditional pathway that required a confirmatory trial evaluating efficacy, safety, and long-term infant follow-up to be performed by the sponsor. That trial, Progestin's Role in Optimizing Neonatal Gestation (PROLONG), was started in 2009, and its results were published on October 25, 2019.3
Continue to: Design of the trial...
Design of the trial
PROLONG was a multicenter (93 sites), randomized, placebo-controlled, double-blind study conducted in 9 countries (23% of participants were in the United States, 60% were in Russia and Ukraine). The co-primary outcome was PTB < 35 weeks and a composite neonatal morbidity and mortality index. The primary safety outcome was fetal/early infant death.
The study was designed to have 98% power to detect a 30% reduction in PTB < 35 weeks, and 90% power to detect a 35% reduction in the neonatal composite index. It included 1,708 participants (1,130 were treated with 17-OHPC, and 578 received placebo).
Trial outcomes. There was no difference in PTB < 35 weeks between the 17-OHPC and the placebo groups (11.0% vs 11.5%; relative risk [RR], 0.95; 95% confidence interval [CI], 0.71-1.26). There was no difference in PTB < 32 or < 37 weeks.
The study revealed also that there was no difference between groups in the neonatal composite index (5.6% for 17-OHPC vs 5.0% for placebo; RR, 1.12; 95% CI, 0.68-1.61). In addition, there was no difference in fetal/early infant death between the 17-OHPC and placebo groups (1.7% vs 1.9%; RR, 0.87; 95% CI, 0.4-1.81).
Conclusions. The trial investigators concluded that 17-OHPC did not demonstrate a reduction in recurrent PTB and did not decrease neonatal morbidity.
Study limitations included underpowering and selection bias
The investigators noted that the PTB rate in PROLONG was unexpectedly almost 50% lower than that in the Meis trial, and that therefore the PROLONG trial was underpowered to assess the primary outcomes.
Further, the study populations of the 2 trials were very different: The Meis trial included women at higher baseline risk for PTB (> 1 prior PTB and at least 1 other risk factor for PTB). Additionally, while the PROLONG trial included mostly white (90%), married (90%), nonsmoking women (8% smoked), the Meis trial population was 59% black and 50% married, and 20% were smokers.
The availability and common use of 17-OHPC in the United States likely led to a selection bias for the PROLONG trial population, as the highest-risk patients were most likely already receiving treatment and were therefore excluded from the PROLONG trial.
Society, and FDA, responses to the new data
The results of the PROLONG trial call into question what has become standard practice for patients with a history of spontaneous PTB in the United States. While the safety profile of 17-OHPC has not been cited as a concern, whether or not the drug should be used at all has—as has its current FDA-approved status.
In response to the publication of the PROLONG trial results, ACOG released a Practice Advisory that acknowledged the study's findings but did not alter the current recommendations to continue to offer progesterone for the prevention of preterm birth, upholding ACOG's current Practice Bulletin guidance.2,4 Additional considerations for offering 17-OHPC use include the patients' preferences, available resources, and the setting for the intervention.
SMFM's response was more specific, stating that it is reasonable to continue to use 17-OHPC in high-risk patient populations consistent with those in the Meis trial.5 In the rest of the general population at risk for recurrent PTB, SMFM recommends that, due to uncertain benefit with 17-OHPC, the high cost, patient discomfort, and increased visits should be taken into account.
Four days after the publication of the PROLONG study, the FDA Bone, Reproductive, and Urologic Drugs Advisory Committee voted 9-7 to withdraw approval for 17-OHPC.6 In response, SMFM released a statement supporting continued access to 17-OHPC.7 The FDA's final decision on the status of the drug is expected within the next several months from this writing.
17-OHPC continues to be considered safe and still is recommended by both ACOG and SMFM for the prevention of recurrent preterm birth in high-risk patients. The high-risk patient population who may benefit most from this therapy is still not certain, but hopefully future studies will better delineate this. The landscape for 17-OHPC use may change dramatically if FDA approval is not upheld in the future. In my current practice, I am continuing to offer 17-OHPC to patients per the current ACOG guidelines, but I am counseling patients in a shared decision-making model regarding the findings of the PROLONG trial and the potential change in FDA approval.
Continue to: ACOG updates guidance on preventing early-onset GBS disease...
ACOG updates guidance on preventing early-onset GBS disease
American College of Obstetricians and Gynecologists—Committee on Obstetric Practice. ACOG committee opinion no. 782: prevention of early-onset group B streptococcal disease in newborns. Obstet Gynecol. 2019;134:e19-e40. 
Group B streptococcus (GBS) is the leading cause of newborn infection and is associated with maternal infections as well as preterm labor and stillbirth. Early-onset GBS disease occurs within 7 days of birth and is linked to vertical transmission via maternal colonization of the genitourinary or gastrointestinal tract and fetal/neonatal aspiration at birth.
Preventing early-onset GBS disease with maternal screening and intrapartum prophylaxis according to the Centers for Disease Control and Prevention (CDC) guidelines has reduced early-onset disease by 80% since the 1990s. By contrast, late-onset GBS infection, which occurs 7 days to 3 months after birth, usually is associated with horizontal maternal transmission or hospital or community infections, and it is not prevented by intrapartum treatment.
In 2018, the CDC transferred responsibility for GBS prophylaxis guidelines to ACOG and the American Academy of Pediatrics (AAP). In July 2019, ACOG released its Committee Opinion on preventing early-onset GBS disease in newborns.8 This guidance replaces and updates the previous guidelines, with 3 notable changes.
The screening timing has changed
In the CDC's 2010 guidelines, GBS screening was recommended to start at 35 weeks' gestation. The new guidelines recommend universal vaginal-rectal screening at 36 to 37 6/7 weeks' gestation. The new timing of culture will shift the expected 5-week window in which GBS cultures are considered valid up to at least 41 weeks' gestation. The rationale for this change is that any GBS-unknown patient who previously would have been cultured under 37 weeks' would be an automatic candidate for empiric therapy and the lower rate of birth in the 35th versus the 41st week of gestation.
Identifying candidates for intrapartum treatment
The usual indications for intrapartum antibiotic prophylaxis include a GBS-positive culture at 36 weeks or beyond, GBS bacteriuria at any point in pregnancy, a prior GBS-affected child, or unknown GBS status with any of the following: < 37 weeks, rupture of membranes ≥ 18 hours or temperature ≥ 100.4°F (38°C), and a positive rapid GBS culture in labor. In addition, antibiotics now should be considered for patients at term with unknown GBS status but with a history of GBS colonization in a prior pregnancy.
This represents a major practice change for women at ≥ 37 weeks with unknown GBS status and no other traditional risk factors. The rationale for this recommendation is that women who have been positive for GBS in a prior pregnancy have a 50% chance of being colonized in the current pregnancy, and their newborns are therefore at higher risk for early-onset GBS disease.
Managing patients with penicillin allergy
Intravenous penicillin (or ampicillin) remains the antibiotic of choice for intrapartum prophylaxis against GBS due to its efficacy and specific, narrow coverage of gram-positive organisms. The updated recommendations emphasize that it is important to carefully evaluate patients with reported penicillin allergies for several reasons: determining risk of anaphylaxis and clindamycin susceptibility testing in GBS evaluations are often overlooked by obstetric providers, the need for antibiotic stewardship to reduce the development of antibiotic resistance, and clarification of allergy status for future health care needs.
Three recommendations are made:
- Laboratory requisitions for cultures should specifically note a penicillin allergy so that clindamycin susceptibility testing can be performed.
- Penicillin allergy skin testing should be considered for patients at unknown or low risk for anaphylaxis, as it is considered safe in pregnancy and most patients (80%-90%) who report a penicillin allergy are actually penicillin tolerant.
- For patients at high risk for anaphylaxis to penicillin, the recommended vancomycin dosing has been changed from 1 g IV every 12 hours to 20 mg/kg IV every 8 hours (maximum single dose, 2 g). Renal function should be assessed prior to dosing. This weight- and renal function-based dosing increased neonatal therapeutic levels in several studies of different doses.
ACOG's key recommendations for preventing early-onset GBS disease in newborns include:
- Universal vaginal-rectal screening for GBS should be performed at 36 to 37 6/7 weeks' gestation.
- Intrapartum antibiotic prophylaxis should be considered for low-risk patients at term with unknown GBS status and a history of GBS colonization in a prior pregnancy.
- Patients with a reported penicillin allergy require careful evaluation of the nature of their allergy, including consideration of skin testing and GBS susceptibility evaluation in order to promote the best practices for antibiotic use.
- For GBS-positive patients at high risk for penicillin anaphylaxis, vancomycin 20 mg/kg IV every 8 hours (maximum single dose, 2 g) is recommended.
Continue to: Managing hypertension in pregnancy: New recommendations...
Managing hypertension in pregnancy: New recommendations
American College of Obstetricians and Gynecologists. ACOG practice bulletin no. 202. Gestational hypertension and preeclampsia. Obstet Gynecol. 2019;133:e1-e25.

In 2013, ACOG released "Hypertension in pregnancy," a 99-page comprehensive document developed by their Task Force on Hypertension in Pregnancy, to summarize knowledge on the subject, provide guidelines for management, and identify needed areas of research.9 I summarized key points from that document in the 2014 "Update on Obstetrics" (OBG Manag. 2013;26[1]:28-36). Now, ACOG has released 2 Practice Bulletins—"Gestational hypertension and preeclampsia" and "Chronic hypertension in pregnancy"—that replace the 2013 document.10,11 These Practice Bulletins are quite comprehensive and warrant a thorough read. Several noteworthy changes relevant to the practicing obstetrician are summarized below.
Highlights of revised guidance
Expectant management vs early delivery in preeclampsia with fetal growth restriction. Fetal growth restriction, which was removed from the definition of preeclampsia with severe features in 2013, is no longer an indication for delivery in preeclampsia with severe features (previously, if the estimated fetal weight was < 5th percentile for gestational age, delivery after steroid administration was recommended). Rather, expectant management is reasonable if fetal antenatal testing, amniotic fluid, and Doppler ultrasound studies are reassuring. Abnormal umbilical artery Doppler studies continue to be an indication for earlier delivery.
Postpartum NSAID use in hypertension. The 2013 document cautioned against nonsteroidal anti-inflammatory drug (NSAID) use postpartum in women with hypertensive disorders of pregnancy because of concern for exacerbating hypertension. The updated Practice Bulletins recommend NSAIDs as the preferred choice over opioid analgesics as data have not shown these drugs to increase blood pressure, antihypertensive requirements, or other adverse events in postpartum patients with blood pressure issues.
More women will be diagnosed with chronic hypertension. Recently, the American College of Cardiology and the American Heart Association changed the definition of hypertension. Stage 1 hypertension is now defined as a systolic blood pressure of 130-139 mm Hg or a diastolic blood pressure of 80-89 mm Hg. Treatment of stage 1 hypertension is recommended for nonpregnant adults with risk factors for current or future cardiovascular disease. The potential impact is that more women will enter pregnancy with a diagnosis of chronic hypertension, and more may be on prepregnancy antihypertensive therapy that will need to be addressed during the pregnancy.
Blood pressure goals. The target blood pressure range for pregnant women with chronic hypertension is recommended to be ≥ 120/80 mm Hg and < 160/110 mm Hg (this represents a slight change, as previously diastolic blood pressure was to be < 105 mm Hg). Postpartum blood pressure goals of < 150/100 mm Hg remain the same.
Managing acute hypertensive emergencies. Both Practice Bulletins emphasize the importance of aggressive management of acute hypertensive emergency, with options for 3 protocols: labetalol, nifedipine, and hydralazine. The goal is to administer antihypertensive therapy within 30 to 60 minutes, but administration as soon as feasibly possible after diagnosis of severe hypertension is ideal.
Timing of delivery. Recommended delivery timing in patients with chronic hypertension was slightly altered (previous recommendations included a range of 37 to 39 6/7 weeks). The lower limit of gestational age for recommended delivery timing in chronic hypertension has not changed—it remains not before 38 weeks if no antihypertensive therapy and stable, and not before 37 weeks if antihypertensive therapy and stable.
The upper limit of 39 6/7 weeks is challenged, however, because data support that induction of labor at either 38 or 39 weeks reduces the risk of severe hypertensive complications (such as superimposed preeclampsia and eclampsia) without increasing the risk of cesarean delivery. Therefore, for patients with chronic hypertension, expectant management beyond 39 weeks is cautioned, to be done only with careful consideration of risks and with close surveillance.
As with ACOG’s original Task Force document on hypertension, clinicians should thoroughly read these 2 Practice Bulletins on hypertension in pregnancy as there are subtle changes that affect day-to-day practice, such as the definition of hypertension prior to pregnancy, treatment guidelines, and delivery timing recommendations. As always, these are guidelines, and the obstetrician’s clinical judgment and the needs of specific patient populations also must be taken into account.
- Meis PJ, Klebanoff M, Thom E, et al; National Institute of Child Health and Human Development Maternal-Fetal Medicine Units Network. Prevention of recurrent preterm delivery by 17 alpha-hydroxyprogesterone caproate. N Engl J Med. 2003;348:2379-2385.
- American College of Obstetricians and Gynecologists Committee on Practice Bulletins—Obstetrics. Practice bulletin No. 130: prediction and prevention of preterm birth. Obstet Gynecol. 2012;120:964-973.
- Blackwell SC, Gyamfi-Bannerman C, Biggio JR Jr, et al. 17-OHPC to prevent recurrent preterm birth in singleton gestations (PROLONG study): a multicenter, international, randomized double-blind trial. Am J Perinatol. 2019. doi: 10.1055/s-0039-3400227.
- ACOG Practice Advisory. Clinical guidance for integration of the findings of the PROLONG study: progestin’s role in optimizing neonatal gestation. https://www.acog.org/Clinical-Guidance-and-Publications/Practice-Advisories/Clinical-guidance-for-integration-of-the-findings-of-The-PROLONG-study-Progestins-Role-in-Optimizing. Accessed November 10, 2019.
- Society for Maternal-Fetal Medicine Publications Committee. SMFM Statement: use of 17-alpha hydroxyprogesterone caproate for prevention of recurrent preterm birth. https://www.smfm.org/publications/280-smfm-statement-use-of-17-alpha-hydroxyprogesterone-caproate-for-prevention-of-recurrent-preterm-birth. Accessed November 10, 2019.
- US Food and Drug Administration. Bone, Reproductive, and Urologic Drugs Advisory Committee Meeting, October 29, 2019. Advisory Committee Briefing Materials: Available for Public Release. https://www.fda.gov/media/132004/download. Accessed November 19, 2019.
- Society for Maternal-Fetal Medicine. SMFM responds to the FDA’s Bone, Reproductive and Urologic Advisory Committee. https://s3.amazonaws.com/cdn.smfm.org/media/2091/17P_Public_Statement.pdf. Accessed November 19, 2019.
- American College of Obstetricians and Gynecologists—Committee on Obstetric Practice. ACOG committee opinion no. 782: prevention of early-onset group B streptococcal disease in newborns. Obstet Gynecol. 2019;134:e19-e40.
- American College of Obstetricians and Gynecologists, Task Force on Hypertension in Pregnancy. Hypertension in Pregnancy. Washington, DC: ACOG; November 2013.
- American College of Obstetricians and Gynecologists. ACOG practice bulletin no. 202: gestational hypertension and preeclampsia. Obstet Gynecol. 2019;133:e1-e25.
- American College of Obstetricians and Gynecologists. ACOG practice bulletin no. 203: chronic hypertension in pregnancy. Obstet Gynecol. 2019;133:e26-e50.

Dr. Pauli is Associate Professor and Attending Perinatologist, Division of Maternal-Fetal Medicine, Department of Obstetrics and Gynecology, Penn State Health, Milton S. Hershey Medical Center, Hershey, Pennsylvania.
The author reports no financial relationships relevant to this article.
Dr. Pauli is Associate Professor and Attending Perinatologist, Division of Maternal-Fetal Medicine, Department of Obstetrics and Gynecology, Penn State Health, Milton S. Hershey Medical Center, Hershey, Pennsylvania.
The author reports no financial relationships relevant to this article.
Dr. Pauli is Associate Professor and Attending Perinatologist, Division of Maternal-Fetal Medicine, Department of Obstetrics and Gynecology, Penn State Health, Milton S. Hershey Medical Center, Hershey, Pennsylvania.
The author reports no financial relationships relevant to this article.
Attributed to the ancient Greek philosopher Heraclitus, and often quoted in contemporary times, is the expression “the only constant is change.” This sentiment rings true for the field of obstetrics this past year, as several bread-and-butter guidelines for managing common obstetric conditions were either challenged or altered.
The publication of the PROLONG trial called into question the use of intramuscular progesterone for the prevention of preterm birth. Prophylaxis guidelines for group B streptococcal disease were updated, including several significant clinical practice changes. Finally, there was a comprehensive overhaul of the guidelines for hypertensive disorders of pregnancy, which replaced a landmark Task Force document from the American College of Obstetricians and Gynecologists (ACOG) that was published only a few years ago.
Change is constant, and in obstetrics it is vital to keep up with the changing guidelines that result as new data become available for digestion and implementation into everyday clinical practice.
Results from the PROLONG trial may shake up treatment options for recurrent preterm birth
Blackwell SC, Gyamfi-Bannerman C, Biggio JR Jr, et al. 17-OHPC to prevent recurrent preterm birth in singleton gestations (PROLONG study): a multicenter, international, randomized double-blind trial. Am J Perinatol. 2019. doi: 10.1055/s-0039-3400227.
The drug 17 α-hydroxyprogesterone caproate (17-OHPC, or 17P; Makena) was approved by the US Food and Drug Administration (FDA) in 2011 for the prevention of spontaneous preterm birth (PTB) in women with a singleton pregnancy and a history of singleton spontaneous PTB. The results of the trial by Meis and colleagues of 17-OHPC played a major role in achieving that approval, as it demonstrated a 34% reduction in recurrent PTB and a reduction in some neonatal morbidities.1 Following the drug's approval, both ACOG and the Society for Maternal-Fetal Medicine (SMFM) published guidelines recommending progesterone therapy, including 17-OHPC, for the prevention of recurrent spontaneous PTB.2
The FDA approval of 17-OHPC was granted under an accelerated conditional pathway that required a confirmatory trial evaluating efficacy, safety, and long-term infant follow-up to be performed by the sponsor. That trial, Progestin's Role in Optimizing Neonatal Gestation (PROLONG), was started in 2009, and its results were published on October 25, 2019.3
Continue to: Design of the trial...
Design of the trial
PROLONG was a multicenter (93 sites), randomized, placebo-controlled, double-blind study conducted in 9 countries (23% of participants were in the United States, 60% were in Russia and Ukraine). The co-primary outcome was PTB < 35 weeks and a composite neonatal morbidity and mortality index. The primary safety outcome was fetal/early infant death.
The study was designed to have 98% power to detect a 30% reduction in PTB < 35 weeks, and 90% power to detect a 35% reduction in the neonatal composite index. It included 1,708 participants (1,130 were treated with 17-OHPC, and 578 received placebo).
Trial outcomes. There was no difference in PTB < 35 weeks between the 17-OHPC and the placebo groups (11.0% vs 11.5%; relative risk [RR], 0.95; 95% confidence interval [CI], 0.71-1.26). There was no difference in PTB < 32 or < 37 weeks.
The study revealed also that there was no difference between groups in the neonatal composite index (5.6% for 17-OHPC vs 5.0% for placebo; RR, 1.12; 95% CI, 0.68-1.61). In addition, there was no difference in fetal/early infant death between the 17-OHPC and placebo groups (1.7% vs 1.9%; RR, 0.87; 95% CI, 0.4-1.81).
Conclusions. The trial investigators concluded that 17-OHPC did not demonstrate a reduction in recurrent PTB and did not decrease neonatal morbidity.
Study limitations included underpowering and selection bias
The investigators noted that the PTB rate in PROLONG was unexpectedly almost 50% lower than that in the Meis trial, and that therefore the PROLONG trial was underpowered to assess the primary outcomes.
Further, the study populations of the 2 trials were very different: The Meis trial included women at higher baseline risk for PTB (> 1 prior PTB and at least 1 other risk factor for PTB). Additionally, while the PROLONG trial included mostly white (90%), married (90%), nonsmoking women (8% smoked), the Meis trial population was 59% black and 50% married, and 20% were smokers.
The availability and common use of 17-OHPC in the United States likely led to a selection bias for the PROLONG trial population, as the highest-risk patients were most likely already receiving treatment and were therefore excluded from the PROLONG trial.
Society, and FDA, responses to the new data
The results of the PROLONG trial call into question what has become standard practice for patients with a history of spontaneous PTB in the United States. While the safety profile of 17-OHPC has not been cited as a concern, whether or not the drug should be used at all has—as has its current FDA-approved status.
In response to the publication of the PROLONG trial results, ACOG released a Practice Advisory that acknowledged the study's findings but did not alter the current recommendations to continue to offer progesterone for the prevention of preterm birth, upholding ACOG's current Practice Bulletin guidance.2,4 Additional considerations for offering 17-OHPC use include the patients' preferences, available resources, and the setting for the intervention.
SMFM's response was more specific, stating that it is reasonable to continue to use 17-OHPC in high-risk patient populations consistent with those in the Meis trial.5 In the rest of the general population at risk for recurrent PTB, SMFM recommends that, due to uncertain benefit with 17-OHPC, the high cost, patient discomfort, and increased visits should be taken into account.
Four days after the publication of the PROLONG study, the FDA Bone, Reproductive, and Urologic Drugs Advisory Committee voted 9-7 to withdraw approval for 17-OHPC.6 In response, SMFM released a statement supporting continued access to 17-OHPC.7 The FDA's final decision on the status of the drug is expected within the next several months from this writing.
17-OHPC continues to be considered safe and still is recommended by both ACOG and SMFM for the prevention of recurrent preterm birth in high-risk patients. The high-risk patient population who may benefit most from this therapy is still not certain, but hopefully future studies will better delineate this. The landscape for 17-OHPC use may change dramatically if FDA approval is not upheld in the future. In my current practice, I am continuing to offer 17-OHPC to patients per the current ACOG guidelines, but I am counseling patients in a shared decision-making model regarding the findings of the PROLONG trial and the potential change in FDA approval.
Continue to: ACOG updates guidance on preventing early-onset GBS disease...
ACOG updates guidance on preventing early-onset GBS disease
American College of Obstetricians and Gynecologists—Committee on Obstetric Practice. ACOG committee opinion no. 782: prevention of early-onset group B streptococcal disease in newborns. Obstet Gynecol. 2019;134:e19-e40.
Group B streptococcus (GBS) is the leading cause of newborn infection and is associated with maternal infections as well as preterm labor and stillbirth. Early-onset GBS disease occurs within 7 days of birth and is linked to vertical transmission via maternal colonization of the genitourinary or gastrointestinal tract and fetal/neonatal aspiration at birth.
Preventing early-onset GBS disease with maternal screening and intrapartum prophylaxis according to the Centers for Disease Control and Prevention (CDC) guidelines has reduced early-onset disease by 80% since the 1990s. By contrast, late-onset GBS infection, which occurs 7 days to 3 months after birth, usually is associated with horizontal maternal transmission or hospital or community infections, and it is not prevented by intrapartum treatment.
In 2018, the CDC transferred responsibility for GBS prophylaxis guidelines to ACOG and the American Academy of Pediatrics (AAP). In July 2019, ACOG released its Committee Opinion on preventing early-onset GBS disease in newborns.8 This guidance replaces and updates the previous guidelines, with 3 notable changes.
The screening timing has changed
In the CDC's 2010 guidelines, GBS screening was recommended to start at 35 weeks' gestation. The new guidelines recommend universal vaginal-rectal screening at 36 to 37 6/7 weeks' gestation. The new timing of culture will shift the expected 5-week window in which GBS cultures are considered valid up to at least 41 weeks' gestation. The rationale for this change is that any GBS-unknown patient who previously would have been cultured under 37 weeks' would be an automatic candidate for empiric therapy and the lower rate of birth in the 35th versus the 41st week of gestation.
Identifying candidates for intrapartum treatment
The usual indications for intrapartum antibiotic prophylaxis include a GBS-positive culture at 36 weeks or beyond, GBS bacteriuria at any point in pregnancy, a prior GBS-affected child, or unknown GBS status with any of the following: < 37 weeks, rupture of membranes ≥ 18 hours or temperature ≥ 100.4°F (38°C), and a positive rapid GBS culture in labor. In addition, antibiotics now should be considered for patients at term with unknown GBS status but with a history of GBS colonization in a prior pregnancy.
This represents a major practice change for women at ≥ 37 weeks with unknown GBS status and no other traditional risk factors. The rationale for this recommendation is that women who have been positive for GBS in a prior pregnancy have a 50% chance of being colonized in the current pregnancy, and their newborns are therefore at higher risk for early-onset GBS disease.
Managing patients with penicillin allergy
Intravenous penicillin (or ampicillin) remains the antibiotic of choice for intrapartum prophylaxis against GBS due to its efficacy and specific, narrow coverage of gram-positive organisms. The updated recommendations emphasize that it is important to carefully evaluate patients with reported penicillin allergies for several reasons: determining risk of anaphylaxis and clindamycin susceptibility testing in GBS evaluations are often overlooked by obstetric providers, the need for antibiotic stewardship to reduce the development of antibiotic resistance, and clarification of allergy status for future health care needs.
Three recommendations are made:
- Laboratory requisitions for cultures should specifically note a penicillin allergy so that clindamycin susceptibility testing can be performed.
- Penicillin allergy skin testing should be considered for patients at unknown or low risk for anaphylaxis, as it is considered safe in pregnancy and most patients (80%-90%) who report a penicillin allergy are actually penicillin tolerant.
- For patients at high risk for anaphylaxis to penicillin, the recommended vancomycin dosing has been changed from 1 g IV every 12 hours to 20 mg/kg IV every 8 hours (maximum single dose, 2 g). Renal function should be assessed prior to dosing. This weight- and renal function-based dosing increased neonatal therapeutic levels in several studies of different doses.
ACOG's key recommendations for preventing early-onset GBS disease in newborns include:
- Universal vaginal-rectal screening for GBS should be performed at 36 to 37 6/7 weeks' gestation.
- Intrapartum antibiotic prophylaxis should be considered for low-risk patients at term with unknown GBS status and a history of GBS colonization in a prior pregnancy.
- Patients with a reported penicillin allergy require careful evaluation of the nature of their allergy, including consideration of skin testing and GBS susceptibility evaluation in order to promote the best practices for antibiotic use.
- For GBS-positive patients at high risk for penicillin anaphylaxis, vancomycin 20 mg/kg IV every 8 hours (maximum single dose, 2 g) is recommended.
Continue to: Managing hypertension in pregnancy: New recommendations...
Managing hypertension in pregnancy: New recommendations
American College of Obstetricians and Gynecologists. ACOG practice bulletin no. 202. Gestational hypertension and preeclampsia. Obstet Gynecol. 2019;133:e1-e25.
In 2013, ACOG released "Hypertension in pregnancy," a 99-page comprehensive document developed by their Task Force on Hypertension in Pregnancy, to summarize knowledge on the subject, provide guidelines for management, and identify needed areas of research.9 I summarized key points from that document in the 2014 "Update on Obstetrics" (OBG Manag. 2013;26[1]:28-36). Now, ACOG has released 2 Practice Bulletins—"Gestational hypertension and preeclampsia" and "Chronic hypertension in pregnancy"—that replace the 2013 document.10,11 These Practice Bulletins are quite comprehensive and warrant a thorough read. Several noteworthy changes relevant to the practicing obstetrician are summarized below.
Highlights of revised guidance
Expectant management vs early delivery in preeclampsia with fetal growth restriction. Fetal growth restriction, which was removed from the definition of preeclampsia with severe features in 2013, is no longer an indication for delivery in preeclampsia with severe features (previously, if the estimated fetal weight was < 5th percentile for gestational age, delivery after steroid administration was recommended). Rather, expectant management is reasonable if fetal antenatal testing, amniotic fluid, and Doppler ultrasound studies are reassuring. Abnormal umbilical artery Doppler studies continue to be an indication for earlier delivery.
Postpartum NSAID use in hypertension. The 2013 document cautioned against nonsteroidal anti-inflammatory drug (NSAID) use postpartum in women with hypertensive disorders of pregnancy because of concern for exacerbating hypertension. The updated Practice Bulletins recommend NSAIDs as the preferred choice over opioid analgesics as data have not shown these drugs to increase blood pressure, antihypertensive requirements, or other adverse events in postpartum patients with blood pressure issues.
More women will be diagnosed with chronic hypertension. Recently, the American College of Cardiology and the American Heart Association changed the definition of hypertension. Stage 1 hypertension is now defined as a systolic blood pressure of 130-139 mm Hg or a diastolic blood pressure of 80-89 mm Hg. Treatment of stage 1 hypertension is recommended for nonpregnant adults with risk factors for current or future cardiovascular disease. The potential impact is that more women will enter pregnancy with a diagnosis of chronic hypertension, and more may be on prepregnancy antihypertensive therapy that will need to be addressed during the pregnancy.
Blood pressure goals. The target blood pressure range for pregnant women with chronic hypertension is recommended to be ≥ 120/80 mm Hg and < 160/110 mm Hg (this represents a slight change, as previously diastolic blood pressure was to be < 105 mm Hg). Postpartum blood pressure goals of < 150/100 mm Hg remain the same.
Managing acute hypertensive emergencies. Both Practice Bulletins emphasize the importance of aggressive management of acute hypertensive emergency, with options for 3 protocols: labetalol, nifedipine, and hydralazine. The goal is to administer antihypertensive therapy within 30 to 60 minutes, but administration as soon as feasibly possible after diagnosis of severe hypertension is ideal.
Timing of delivery. Recommended delivery timing in patients with chronic hypertension was slightly altered (previous recommendations included a range of 37 to 39 6/7 weeks). The lower limit of gestational age for recommended delivery timing in chronic hypertension has not changed—it remains not before 38 weeks if no antihypertensive therapy and stable, and not before 37 weeks if antihypertensive therapy and stable.
The upper limit of 39 6/7 weeks is challenged, however, because data support that induction of labor at either 38 or 39 weeks reduces the risk of severe hypertensive complications (such as superimposed preeclampsia and eclampsia) without increasing the risk of cesarean delivery. Therefore, for patients with chronic hypertension, expectant management beyond 39 weeks is cautioned, to be done only with careful consideration of risks and with close surveillance.
As with ACOG’s original Task Force document on hypertension, clinicians should thoroughly read these 2 Practice Bulletins on hypertension in pregnancy as there are subtle changes that affect day-to-day practice, such as the definition of hypertension prior to pregnancy, treatment guidelines, and delivery timing recommendations. As always, these are guidelines, and the obstetrician’s clinical judgment and the needs of specific patient populations also must be taken into account.
- Meis PJ, Klebanoff M, Thom E, et al; National Institute of Child Health and Human Development Maternal-Fetal Medicine Units Network. Prevention of recurrent preterm delivery by 17 alpha-hydroxyprogesterone caproate. N Engl J Med. 2003;348:2379-2385.
- American College of Obstetricians and Gynecologists Committee on Practice Bulletins—Obstetrics. Practice bulletin No. 130: prediction and prevention of preterm birth. Obstet Gynecol. 2012;120:964-973.
- Blackwell SC, Gyamfi-Bannerman C, Biggio JR Jr, et al. 17-OHPC to prevent recurrent preterm birth in singleton gestations (PROLONG study): a multicenter, international, randomized double-blind trial. Am J Perinatol. 2019. doi: 10.1055/s-0039-3400227.
- ACOG Practice Advisory. Clinical guidance for integration of the findings of the PROLONG study: progestin’s role in optimizing neonatal gestation. https://www.acog.org/Clinical-Guidance-and-Publications/Practice-Advisories/Clinical-guidance-for-integration-of-the-findings-of-The-PROLONG-study-Progestins-Role-in-Optimizing. Accessed November 10, 2019.
- Society for Maternal-Fetal Medicine Publications Committee. SMFM Statement: use of 17-alpha hydroxyprogesterone caproate for prevention of recurrent preterm birth. https://www.smfm.org/publications/280-smfm-statement-use-of-17-alpha-hydroxyprogesterone-caproate-for-prevention-of-recurrent-preterm-birth. Accessed November 10, 2019.
- US Food and Drug Administration. Bone, Reproductive, and Urologic Drugs Advisory Committee Meeting, October 29, 2019. Advisory Committee Briefing Materials: Available for Public Release. https://www.fda.gov/media/132004/download. Accessed November 19, 2019.
- Society for Maternal-Fetal Medicine. SMFM responds to the FDA’s Bone, Reproductive and Urologic Advisory Committee. https://s3.amazonaws.com/cdn.smfm.org/media/2091/17P_Public_Statement.pdf. Accessed November 19, 2019.
- American College of Obstetricians and Gynecologists—Committee on Obstetric Practice. ACOG committee opinion no. 782: prevention of early-onset group B streptococcal disease in newborns. Obstet Gynecol. 2019;134:e19-e40.
- American College of Obstetricians and Gynecologists, Task Force on Hypertension in Pregnancy. Hypertension in Pregnancy. Washington, DC: ACOG; November 2013.
- American College of Obstetricians and Gynecologists. ACOG practice bulletin no. 202: gestational hypertension and preeclampsia. Obstet Gynecol. 2019;133:e1-e25.
- American College of Obstetricians and Gynecologists. ACOG practice bulletin no. 203: chronic hypertension in pregnancy. Obstet Gynecol. 2019;133:e26-e50.

Eating for 2: Managing eating disorders in pregnancy
Eating disorders affect nearly 1% of US adults,1 and disordered eating, or unspecified eating disorder, affects at least 1% of all pregnancies.2 Among 739 pregnant women assessed with the Eating Disorder Diagnostic scale, 7.5% of patients met criteria for an eating disorder, with 8.8% of women reporting binge eating and 2.3% of pregnant women engaging in regular compensatory behaviors. In fact, 23.4% of the study population expressed concerns about pregnancy-related weight gain and body shape.3 Eating disorders during pregnancy are more common than previously thought, and they create unique clinical challenges for obstetric providers.
Types of eating disorders
There are 3 major types of eating disorders: anorexia nervosa, bulimia nervosa, and binge eating disorder, with significant fluidity existing between all 3 conditions.
Anorexia nervosa is a condition in which an individual believes he or she is significantly overweight despite being underweight. Patients with anorexia nervosa often restrict food intake and have compulsive rituals around eating and exercise, leading to weight loss and starvation.4
Bulimia nervosa is marked by intensive dieting, uncontrolled episodes of overeating, and compensatory behaviors.4 Compensatory behaviors include self-induced vomiting; excessive exercise; and misuse of laxatives, diuretics, or other medications.
Binge eating disorder is classified as recurrent episodes of uncontrolled overeating without compensatory purging behaviors, leading to excessive weight gain.4
Eating disorders and pregnancy
Pregnancy can impact the course of preexisting eating disorders, and women also can develop symptoms of eating disorders for the first time during pregnancy. This is clinically significant as there are both maternal and fetal consequences to a mother’s disordered eating.
The risks of anorexia nervosa include vitamin deficiencies (vitamin B12/folate), dehydration leading to renal injury and electrolyte imbalances, hypoglycemia, abnormal lipid profiles, cardiac arrhythmia, and even death. The mortality rate of patients with anorexia nervosa may approach 10%; however, death during pregnancy is quite rare.2 Bulimia nervosa also carries the risks of protein and vitamin deficiencies, hypoglycemia and hyperglycemia, and death, with mortality estimated at 7% for those with a 5-year history of the illness. However, death in pregnancy due to the condition is again quite rare.5
Eating disorders can cause significant maternal and fetal complications during pregnancy and postpartum.
Maternal complications. When women with eating disorders become pregnant, they have increased risks of some pregnancy complications. Approximately 10% to 25% of pregnant women with eating disorders develop hyperemesis gravidarum.6 The nausea can serve as a trigger for a woman with an eating disorder, particularly among women with a history of purging behaviors.
Cesarean delivery is more common among women with eating disorders, which may be due to preexisting fetal compromise, leading to poor tolerance of labor, or to clinicians perceiving these pregnancies as higher risk.7
It is well known that eating disorders are highly comorbid with depression and other psychiatric conditions. In fact, 30% to 40% of women with an eating disorder develop symptoms of postpartum depression.8
Continue to: Fetal risks and complications...
Fetal risks and complications. Excessive caloric restriction and dieting can lead to folate deficiency, which in turn increases the risk of neural tube defects. Such defects are more common among women with eating disorders.9 Intrauterine growth restriction also can be a concern, most likely because of maternal malnutrition and poor maternal weight gain.10 In addition, women with eating disorders are more likely to have a preterm delivery or experience perinatal mortality or stillbirth.10
Bulimia nervosa is associated with low birthweight, while anorexia nervosa is associated with the very premature birth, low birthweight, and perinatal death.11 Eating disorders during pregnancy can have long-term psychological impacts on children, including increased likelihood of childhood hyperactivity, conduct, and adjustment disorder.12
When a patient presents showing concerning signs or symptoms of an eating disorder, it is best to start by giving her a validated assessment tool. Normalize this questioning as routine amongst populations of obstetric patients. If concerning behaviors are identified, it is best to have an open and honest conversation with the patient about her history and current disordered eating behaviors, including restrictive, binging, or purging. It is also important to address concerns and fears about pregnancy and its associated triggers. If patients are willing to accept care, it is best to connect them with a multidisciplinary treatment team, including psychiatry, nutrition, obstetrics, and social work.
Assessing patients for an eating disorder
Diagnosis of eating disorders is an interview-guided process using clinical criteria of the Diagnostic and Statistical Manual of Mental Disorders, 5th edition.4 The Eating Disorder Examination is a semi-structured interview composed of 4 subsections (restraint, eating concern, shape concern, and weight concern). The interview’s aim is to assess the psychopathology associated with eating disorders, and it is used in research settings rather than clinically.

Clinical diagnosis. The SCOFF questionnaire is a quick, validated tool that can be used to clinically assess for an eating disorder.13 It is composed of 5 questions, with a positive test resulting from 2 yes answers:
- Do you make yourself sick because you feel uncomfortably full?
- Do you worry that you have lost control over how much you eat?
- Have you recently lost more than one stone (14 lb) in a 3-month period?
- Do you believe yourself to be fat when others say you are too thin?
- Would you say that food dominates your life?
Referral. Patients for whom you have a concern for any eating disorder should be referred to a psychiatrist for formal diagnosis. Integrated multidisciplinary care of pregnant patients with eating disorders is necessary to improve maternal and fetal outcomes. Care teams should include obstetricians or maternal-fetal medicine clinicians experienced in caring for patients with eating disorders, psychiatrists, psychologists, nutritionists, and social workers. General treatment principles require an assessment for appropriate setting of intervention, which depends on presentation severity, assessment of nutritional status, treatment of psychiatric comorbidity, and psychotherapeutic intervention.
Overall management strategy
The initial treatment strategy for pregnant women with eating disorders should involve evaluating for severe illness and life-threatening complications of the specific disorder. All patients should be screened for suicidal ideation, severe malnutrition, electrolyte abnormalities, dehydration, hemodynamic instability, and cardiac arrhythmia. Patients with any of these severe features should be admitted for medical hospitalization and psychiatric evaluation.14 Patients that are hospitalized should be watched closely for refeeding syndrome—potentially life threatening metabolic disturbances that occur when nutrition is reinstituted to patients who are severely malnourished.
Patients without severe features or acute life-threatening complications can be managed safely on an outpatient basis with close medical monitoring. Psychiatric providers should be involved to assess for treatment needs including psychotherapy and psychotropic medications. There are numerous pharmacologic options available for patients, with the use of selective serotonin reuptake inhibitors (SSRIs) most common. While SSRI use has been controversial in pregnancy in the past, the risks of untreated illness carry risk to the mother and unborn child that outweigh the small risks associated with SSRI exposure in pregnancy.15
Women should have established care with a nutritionist or dietician who can ensure adequate counseling regarding meal planning and multivitamin supplementation. The numerous food restrictions in pregnancy, such as avoidance of unpasteurized cheese or deli meats, may be triggering for many patients with a history of restrictive eating.
One of the greatest difficulties for women with disordered eating in pregnancy revolves around weight gain. Many patients find the various measurements of pregnancy (maternal weight gain, fetal weight, fetal heart rate, and fundal height) triggering, which can make appropriate maternal and fetal weight gain in pregnancy very challenging. One strategy for managing this includes using fetal weight and growth as a surrogate for appropriate maternal gestational weight gain. One other strategy involves blind weights, where the woman is turned away from the scale so her weight is not disclosed to her. Patients often will not be able to achieve the expected 28 to 40 lb of pregnancy weight gain. It is best to have an open, honest conversation in early pregnancy to discuss how she would like to address weight in her pregnancy.
A 38-year-old woman (G1) at 32 weeks' gestation presents for a routine visit. Her bulimia had been in relatively good control until the nausea of pregnancy triggered a return to purging behaviors. She reports searching her online medical record for any recording of weights, and has now started restrictive eating because a routine recent growth scan revealed the baby to be in the 80th percentile for growth. She is concerned about her mood, and thinks she may be depressed. Because her bulimia was present before pregnancy, during her pregnancy she is followed by a multidisciplinary team, including maternal-fetal medicine, perinatal psychiatry, and nutrition. At pregnancy, she elected for outpatient day program management during her pregnancy.
Continue to: Postpregnancy concerns...
Postpregnancy concerns
Patients with eating disorders are at high risk of relapse in the postpartum period, even if they are able to achieve full remission in pregnancy. Rapid postpartum weight loss may be a sign of disordered eating. Postpartum depression also is a concern, and women should be followed closely for surveillance of symptoms. Finally, postpartum contraception is extremely important. The menstrual irregularities that are common among women with eating disorders along with common misconceptions regarding fertility in the postpartum period increase the risk of unplanned pregnancy.
Remain cognizant of eating disorders
A clear surveillance plan early in the pregnancy that is developed in conjunction with the patient and her care team is crucial in improving maternal and fetal outcomes among women with an eating disorder. Clinician knowledge of complications and risks specific to disordered eating and pregnancy can affect outcomes for both mother and baby.
- Udo T, Grilo CM. Prevalence and correlates of DSM-5-defined eating disorders in a nationally representative sample of U.S. adults. Biol Psychiatry. 2018;84:345-354.
- Easter A, Bye A, Taborelli E, et al. Recognising the symptoms: how common are eating disorders in pregnancy? Eur Eat Disord Rev. 2013;21:340-344.
- Hudson JI, Hiripi E, Pope HG Jr, et al. The prevalence and correlates of eating disorders in the National Comorbidity Survey Replication. Biol Psychiatry. 2007;61:348-358.
- American Psychiatric Association. Diagnostic and Statistical Manual of Mental Disorders, Fifth Edition (DSM-5). American Psychiatry Association: Arlington, VA; 2013.
- Morgan JF, Lacey JH, Sedgwick PM. Impact of pregnancy on bulimia nervosa. Br J Psychiatry. 1999;174:135-140.
- Franko DL, Spirrell EB. Detection and management of eating disorders during pregnancy. Obstet Gynecol. 2000;95:942-946.
- Bulik CM, Von Holle A, Siega-Riz AM, et al. Birth outcomes in women with eating disorders in the Norwegian Mother and Child Cohort Study. Int J Eat Disord. 2009;42:9-18.
- Mitchell-Gieleghem A, Mittelstaedt ME, Bulik CM. Eating disorders and childbearing: concealment and consequences. Birth. 2002;29:182.
- Carmichael SL, Shaw GM, Schaffer DM, et al. Dieting behaviors and risk of neural tube defects. Am J Epidemiol. 2003;158:1127-1131.
- Micali N, Simonoff E, Treasure J. Risk of major adverse perinatal outcomes in women with eating disorders. Br J Psychiatry. 2007;190-255.
- Linna MS, Raevuori A, Haukka J. Pregnancy, obstetrics, and perinatal health outcomes in eating disorders. Am J Obstet Gynecol. 2014;211:392.e1-e8.
- Barona M, Nybo Andersen AM, Micali N. Childhood psychopathology in children of women with eating disorders. Acta Psychiatr Scand. 2016;134:295-304.
- Morgan JF, Reid F, Lacey JH. The SCOFF questionnaire: assessment of a new screening tool for eating disorders. BMJ. 1999;319:1467.
- Andersen AE, Ryan GL. Eating disorders in the obstetric and gynecologic patient population. Obstet Gynecol. 2009;114:1353-1367.
- Weisskopf E, Fischer CJ, Bickle Graz M, et al. Risk-benefit balance assessment of SSRI antidepressant use during pregnancy and lactation based on best available evidence. Expert Opin Drug Saf. 2015;14:413-427.
Eating disorders affect nearly 1% of US adults,1 and disordered eating, or unspecified eating disorder, affects at least 1% of all pregnancies.2 Among 739 pregnant women assessed with the Eating Disorder Diagnostic scale, 7.5% of patients met criteria for an eating disorder, with 8.8% of women reporting binge eating and 2.3% of pregnant women engaging in regular compensatory behaviors. In fact, 23.4% of the study population expressed concerns about pregnancy-related weight gain and body shape.3 Eating disorders during pregnancy are more common than previously thought, and they create unique clinical challenges for obstetric providers.
Types of eating disorders
There are 3 major types of eating disorders: anorexia nervosa, bulimia nervosa, and binge eating disorder, with significant fluidity existing between all 3 conditions.
Anorexia nervosa is a condition in which an individual believes he or she is significantly overweight despite being underweight. Patients with anorexia nervosa often restrict food intake and have compulsive rituals around eating and exercise, leading to weight loss and starvation.4
Bulimia nervosa is marked by intensive dieting, uncontrolled episodes of overeating, and compensatory behaviors.4 Compensatory behaviors include self-induced vomiting; excessive exercise; and misuse of laxatives, diuretics, or other medications.
Binge eating disorder is classified as recurrent episodes of uncontrolled overeating without compensatory purging behaviors, leading to excessive weight gain.4
Eating disorders and pregnancy
Pregnancy can impact the course of preexisting eating disorders, and women also can develop symptoms of eating disorders for the first time during pregnancy. This is clinically significant as there are both maternal and fetal consequences to a mother’s disordered eating.
The risks of anorexia nervosa include vitamin deficiencies (vitamin B12/folate), dehydration leading to renal injury and electrolyte imbalances, hypoglycemia, abnormal lipid profiles, cardiac arrhythmia, and even death. The mortality rate of patients with anorexia nervosa may approach 10%; however, death during pregnancy is quite rare.2 Bulimia nervosa also carries the risks of protein and vitamin deficiencies, hypoglycemia and hyperglycemia, and death, with mortality estimated at 7% for those with a 5-year history of the illness. However, death in pregnancy due to the condition is again quite rare.5
Eating disorders can cause significant maternal and fetal complications during pregnancy and postpartum.
Maternal complications. When women with eating disorders become pregnant, they have increased risks of some pregnancy complications. Approximately 10% to 25% of pregnant women with eating disorders develop hyperemesis gravidarum.6 The nausea can serve as a trigger for a woman with an eating disorder, particularly among women with a history of purging behaviors.
Cesarean delivery is more common among women with eating disorders, which may be due to preexisting fetal compromise, leading to poor tolerance of labor, or to clinicians perceiving these pregnancies as higher risk.7
It is well known that eating disorders are highly comorbid with depression and other psychiatric conditions. In fact, 30% to 40% of women with an eating disorder develop symptoms of postpartum depression.8
Continue to: Fetal risks and complications...
Fetal risks and complications. Excessive caloric restriction and dieting can lead to folate deficiency, which in turn increases the risk of neural tube defects. Such defects are more common among women with eating disorders.9 Intrauterine growth restriction also can be a concern, most likely because of maternal malnutrition and poor maternal weight gain.10 In addition, women with eating disorders are more likely to have a preterm delivery or experience perinatal mortality or stillbirth.10
Bulimia nervosa is associated with low birthweight, while anorexia nervosa is associated with the very premature birth, low birthweight, and perinatal death.11 Eating disorders during pregnancy can have long-term psychological impacts on children, including increased likelihood of childhood hyperactivity, conduct, and adjustment disorder.12
When a patient presents showing concerning signs or symptoms of an eating disorder, it is best to start by giving her a validated assessment tool. Normalize this questioning as routine amongst populations of obstetric patients. If concerning behaviors are identified, it is best to have an open and honest conversation with the patient about her history and current disordered eating behaviors, including restrictive, binging, or purging. It is also important to address concerns and fears about pregnancy and its associated triggers. If patients are willing to accept care, it is best to connect them with a multidisciplinary treatment team, including psychiatry, nutrition, obstetrics, and social work.
Assessing patients for an eating disorder
Diagnosis of eating disorders is an interview-guided process using clinical criteria of the Diagnostic and Statistical Manual of Mental Disorders, 5th edition.4 The Eating Disorder Examination is a semi-structured interview composed of 4 subsections (restraint, eating concern, shape concern, and weight concern). The interview’s aim is to assess the psychopathology associated with eating disorders, and it is used in research settings rather than clinically.
Clinical diagnosis. The SCOFF questionnaire is a quick, validated tool that can be used to clinically assess for an eating disorder.13 It is composed of 5 questions, with a positive test resulting from 2 yes answers:
- Do you make yourself sick because you feel uncomfortably full?
- Do you worry that you have lost control over how much you eat?
- Have you recently lost more than one stone (14 lb) in a 3-month period?
- Do you believe yourself to be fat when others say you are too thin?
- Would you say that food dominates your life?
Referral. Patients for whom you have a concern for any eating disorder should be referred to a psychiatrist for formal diagnosis. Integrated multidisciplinary care of pregnant patients with eating disorders is necessary to improve maternal and fetal outcomes. Care teams should include obstetricians or maternal-fetal medicine clinicians experienced in caring for patients with eating disorders, psychiatrists, psychologists, nutritionists, and social workers. General treatment principles require an assessment for appropriate setting of intervention, which depends on presentation severity, assessment of nutritional status, treatment of psychiatric comorbidity, and psychotherapeutic intervention.
Overall management strategy
The initial treatment strategy for pregnant women with eating disorders should involve evaluating for severe illness and life-threatening complications of the specific disorder. All patients should be screened for suicidal ideation, severe malnutrition, electrolyte abnormalities, dehydration, hemodynamic instability, and cardiac arrhythmia. Patients with any of these severe features should be admitted for medical hospitalization and psychiatric evaluation.14 Patients that are hospitalized should be watched closely for refeeding syndrome—potentially life threatening metabolic disturbances that occur when nutrition is reinstituted to patients who are severely malnourished.
Patients without severe features or acute life-threatening complications can be managed safely on an outpatient basis with close medical monitoring. Psychiatric providers should be involved to assess for treatment needs including psychotherapy and psychotropic medications. There are numerous pharmacologic options available for patients, with the use of selective serotonin reuptake inhibitors (SSRIs) most common. While SSRI use has been controversial in pregnancy in the past, the risks of untreated illness carry risk to the mother and unborn child that outweigh the small risks associated with SSRI exposure in pregnancy.15
Women should have established care with a nutritionist or dietician who can ensure adequate counseling regarding meal planning and multivitamin supplementation. The numerous food restrictions in pregnancy, such as avoidance of unpasteurized cheese or deli meats, may be triggering for many patients with a history of restrictive eating.
One of the greatest difficulties for women with disordered eating in pregnancy revolves around weight gain. Many patients find the various measurements of pregnancy (maternal weight gain, fetal weight, fetal heart rate, and fundal height) triggering, which can make appropriate maternal and fetal weight gain in pregnancy very challenging. One strategy for managing this includes using fetal weight and growth as a surrogate for appropriate maternal gestational weight gain. One other strategy involves blind weights, where the woman is turned away from the scale so her weight is not disclosed to her. Patients often will not be able to achieve the expected 28 to 40 lb of pregnancy weight gain. It is best to have an open, honest conversation in early pregnancy to discuss how she would like to address weight in her pregnancy.
A 38-year-old woman (G1) at 32 weeks' gestation presents for a routine visit. Her bulimia had been in relatively good control until the nausea of pregnancy triggered a return to purging behaviors. She reports searching her online medical record for any recording of weights, and has now started restrictive eating because a routine recent growth scan revealed the baby to be in the 80th percentile for growth. She is concerned about her mood, and thinks she may be depressed. Because her bulimia was present before pregnancy, during her pregnancy she is followed by a multidisciplinary team, including maternal-fetal medicine, perinatal psychiatry, and nutrition. At pregnancy, she elected for outpatient day program management during her pregnancy.
Continue to: Postpregnancy concerns...
Postpregnancy concerns
Patients with eating disorders are at high risk of relapse in the postpartum period, even if they are able to achieve full remission in pregnancy. Rapid postpartum weight loss may be a sign of disordered eating. Postpartum depression also is a concern, and women should be followed closely for surveillance of symptoms. Finally, postpartum contraception is extremely important. The menstrual irregularities that are common among women with eating disorders along with common misconceptions regarding fertility in the postpartum period increase the risk of unplanned pregnancy.
Remain cognizant of eating disorders
A clear surveillance plan early in the pregnancy that is developed in conjunction with the patient and her care team is crucial in improving maternal and fetal outcomes among women with an eating disorder. Clinician knowledge of complications and risks specific to disordered eating and pregnancy can affect outcomes for both mother and baby.
- Udo T, Grilo CM. Prevalence and correlates of DSM-5-defined eating disorders in a nationally representative sample of U.S. adults. Biol Psychiatry. 2018;84:345-354.
- Easter A, Bye A, Taborelli E, et al. Recognising the symptoms: how common are eating disorders in pregnancy? Eur Eat Disord Rev. 2013;21:340-344.
- Hudson JI, Hiripi E, Pope HG Jr, et al. The prevalence and correlates of eating disorders in the National Comorbidity Survey Replication. Biol Psychiatry. 2007;61:348-358.
- American Psychiatric Association. Diagnostic and Statistical Manual of Mental Disorders, Fifth Edition (DSM-5). American Psychiatry Association: Arlington, VA; 2013.
- Morgan JF, Lacey JH, Sedgwick PM. Impact of pregnancy on bulimia nervosa. Br J Psychiatry. 1999;174:135-140.
- Franko DL, Spirrell EB. Detection and management of eating disorders during pregnancy. Obstet Gynecol. 2000;95:942-946.
- Bulik CM, Von Holle A, Siega-Riz AM, et al. Birth outcomes in women with eating disorders in the Norwegian Mother and Child Cohort Study. Int J Eat Disord. 2009;42:9-18.
- Mitchell-Gieleghem A, Mittelstaedt ME, Bulik CM. Eating disorders and childbearing: concealment and consequences. Birth. 2002;29:182.
- Carmichael SL, Shaw GM, Schaffer DM, et al. Dieting behaviors and risk of neural tube defects. Am J Epidemiol. 2003;158:1127-1131.
- Micali N, Simonoff E, Treasure J. Risk of major adverse perinatal outcomes in women with eating disorders. Br J Psychiatry. 2007;190-255.
- Linna MS, Raevuori A, Haukka J. Pregnancy, obstetrics, and perinatal health outcomes in eating disorders. Am J Obstet Gynecol. 2014;211:392.e1-e8.
- Barona M, Nybo Andersen AM, Micali N. Childhood psychopathology in children of women with eating disorders. Acta Psychiatr Scand. 2016;134:295-304.
- Morgan JF, Reid F, Lacey JH. The SCOFF questionnaire: assessment of a new screening tool for eating disorders. BMJ. 1999;319:1467.
- Andersen AE, Ryan GL. Eating disorders in the obstetric and gynecologic patient population. Obstet Gynecol. 2009;114:1353-1367.
- Weisskopf E, Fischer CJ, Bickle Graz M, et al. Risk-benefit balance assessment of SSRI antidepressant use during pregnancy and lactation based on best available evidence. Expert Opin Drug Saf. 2015;14:413-427.

We can achieve opioid-free analgesia after childbirth: Stop prescribing opioids after vaginal delivery and reduce their use after cesarean
CASE New mother receives unneeded opioids after CD
A house officer wrote orders for a healthy patient who had just had an uncomplicated cesarean delivery (CD). The hospital’s tradition dictates orders for oxycodone plus acetaminophen tablets in addition to ibuprofen for all new mothers. At the time of the patient’s discharge, the same house officer prescribed 30 tablets of oxycodone plus acetaminophen “just in case,” although the patient had required only a few tablets while in the hospital on postoperative day 2 and none on the day of discharge.
Stuck in the habit
Prescribing postpartum opioids in the United States is almost habitual. Both optimizing patient satisfaction and minimizing patient phone calls may be driving this well-established pattern. Interestingly, a survey study of obstetric providers in 14 countries found that clinicians in 13 countries prescribe opioids “almost never” after vaginal delivery.1 The United States was the 1 outlier, with providers reporting prescribing opioids “on a regular basis” after vaginal birth. Similarly, providers in 10 countries reported prescribing opioids “almost never” after CD, while those in the United States reported prescribing opioids “almost always” in this context.
Moreover, mounting data suggest that many patients do not require the quantity of opioids prescribed and that our overprescribing may be causing more harm than good.
The problem of overprescribing opioids after childbirth
Opioid analgesia has long been the mainstay of treatment for postpartum pain, which when poorly controlled is associated with the development of postpartum depression and chronic pain.2 However, common adverse effects of opioids, including nausea, drowsiness, and dizziness, similarly can interfere with self-care and infant care. Of additional concern, a 2016 claims data study found that 1 of 300 opioid-naïve women who were prescribed opioids at discharge after CD used these medications persistently in the first year postpartum.3
Many women do not use the opioids that are prescribed to them at discharge, thus making tablets available for potential diversion into the community—a commonly recognized source of opioid misuse and abuse.4,5 In a 2018 Committee Opinion on postpartum pain management, the American College of Obstetricians and Gynecologists (ACOG) stated that “a stepwise, multimodal approach emphasizing nonopioid analgesia as first-line therapy is safe and effective for vaginal deliveries and cesarean deliveries.”6 The Committee Opinion also asserted that “opioid medication is an adjunct for patients with uncontrolled pain despite adequate first-line therapy.”6
Despite efforts by the Centers for Disease Control and Prevention (CDC) and ACOG to improve opioid prescribing patterns after childbirth, the vast majority of women receive opioids in the hospital and at discharge not only after CD, but after vaginal delivery as well.4,7 Why has tradition prevailed over data, and why have we not changed?
Continue to: Common misconceptions about reducing opioid use...
Common misconceptions about reducing opioid use
Two misconceptions persist regarding reducing opioid prescriptions for postpartum pain.
Misconception #1: Patients will be in pain
Randomized controlled trials that compared nonopioid with opioid regimens in the emergency room setting and opioid use after outpatient general surgery procedures have demonstrated that pain control for patients receiving opioids was equivalent to that for patients with pain managed with nonopioid regimens.8-10 In the obstetric setting, a survey study of 720 women who underwent CD found that higher quantities of opioid tablets prescribed at discharge were not associated with improved pain, higher satisfaction, or lower refill rates at 2 weeks postpartum.4 However, greater quantities of opioids prescribed at the time of discharge were associated with greater opioid consumption.
Recently, several quality improvement studies implemented various interventions and successfully decreased postpartum opioid consumption without compromising pain management. One quality improvement project eliminated the routine use of opioids after CD and decreased the proportion of patients using any opioids in the hospital from 68% to 45%, with no changes in pain scores.11 A similar study implemented an enhanced recovery after surgery (ERAS) program for women after CD; mean in-patient opioid use decreased from 10.7 to 5.4 average daily morphine equivalents, with improvement in the proportion of time that patients reported their pain as acceptable.12
Misconception #2: Clinicians will be overwhelmed with pages and phone calls
Providers commonly fear that decreasing opioid use will lead to an increased volume of pages and phone calls from patients requesting additional medication. However, data suggest otherwise. For example, a quality improvement study that eliminated the routine use of opioids after CD tracked the number of phone calls that were received requesting rescue opioid prescriptions after discharge.11 Although the percentage of women discharged with opioids decreased from 90.6% to 40.3%, the requests for rescue opioid prescriptions did not change. Of 191 women, 4 requested a rescue prescription prior to the intervention compared with no women after the intervention. At the same time, according to unpublished data (Dr. Holland), satisfaction among nurses, house staff, and faculty did not change.
Similarly, a quality improvement project that implemented shared decision-making to inform the quantity of opioids prescribed at discharge demonstrated that the number of tablets prescribed decreased from 33.2 to 26.5, and there was no change in the rate of patients requesting opioid refills.13
Success stories: Strategies for reducing opioid use after childbirth
While overall rates of opioid prescribing after vaginal delivery and CD remain high throughout the United States, various institutions have developed successful and reproducible strategies to reduce opioid use after childbirth both in the hospital and at discharge. We highlight 3 strategies below.
Strategy 1: ERAS initiatives
An integrated health care system in northern California studied the effects of an ERAS protocol for CD across 15 medical centers.12 The intervention centered on 4 pillars: multimodal pain management, early mobility, optimal nutrition, and patient engagement through education. Specifically, multimodal pain management consisted of the following:
- intrathecal opioids during CD
- scheduled intravenous acetaminophen for 24 hours followed by oral acetaminophen every 6 hours
- nonsteroidal anti-inflammatory drugs (NSAIDs) every 6 hours
- oral oxycodone for breakthrough pain
- decoupling of opioid medication from nonopioids in the post-CD order set
- decoupling of opioid and nonopioid medications in the discharge order set along with a reduction from 30 to 20 tablets as the default discharge quantity.
Continue to: Among 4,689 and 4,624 patients who underwent CD...
Among 4,689 and 4,624 patients who underwent CD before and after the intervention, the daily morphine milligram equivalents (MME) consumed in the hospital decreased from 10.7 to 5.4. The percentage of women who required no opioids while in the hospital increased from 8.3% to 21.4% after ERAS implementation, while the percentage of time that patients reported acceptable pain scores increased from 82.1% to 86.4%. The average number of opioid tablets prescribed at discharge also decreased, from 37 to 26 MME.12 (The TABLE shows oxycodone doses converted to MMEs.)
A similar initiative at a network of 5 hospitals in Texas showed that implementation of a “multimodal pain power plan” (which incorporated postpartum activity goals with standardized order sets) decreased opioid use after both vaginal delivery and CD.14
Strategy 2: Order set change to eliminate routine use of opioids
A tertiary care center in Boston, Massachusetts, implemented a quality improvement project aimed at eliminating the routine use of opioid medication after CD through an order set change.11 The intervention consisted of the following:
- intrathecal morphine
- multimodal postoperative pain management including scheduled oral acetaminophen for 72 hours followed by as-needed oral acetaminophen, scheduled NSAIDs for 72 hours followed by as-needed NSAIDs
- no postoperative order for opioids unless the patient had a contraindication to acetaminophen or NSAIDs, had a history of opioid dependence, or underwent complex surgery
- counseling patients that opioids were available for breakthrough pain if needed. In this case, nursing staff would page the responding clinician, who would order oxycodone 5 mg every 6 hours for 6 doses.
- specific criteria for discharge quantities of opioids: if the patient required no opioids in the hospital, she received no opioids at discharge; if the patient required opioids in the hospital but none at the time of discharge, she received no more than 10 tablets of oxycodone 5 mg; if the patient required opioids at the time of discharge, she received a maximum of 20 tablets of oxycodone 5 mg.
Among 191 and 181 women undergoing CD before and after the intervention, the percentage of patients who received any opioids in the hospital decreased from 68.1% to 45.3%.11 Similarly, the percentage of patients receiving a discharge prescription for opioids decreased from 90.6% to 40.3%, while patient pain scores and satisfaction with pain control remained unchanged.
Strategy 3: Shared decision-making tool
Another tertiary care center in Boston evaluated the effects of a shared decision-making tool on opioid discharge prescribing after CD.15 The intervention consisted of a 10-minute clinician-facilitated session incorporating:
- education around anticipated patterns of postoperative pain
- expected outpatient opioid use after CD
- risks and benefits of opioids and nonopioids
- education around opioid disposal and access to refills.
Among the 50 women enrolled in the study, the number of oxycodone 5-mg tablets prescribed at discharge decreased from the institutional standard of 40 to 20. Ninety percent of women reported being satisfied or very satisfied with their pain control, while only 4 of 50 women required an opioid refill. A follow-up quality improvement project, which implemented the shared decision-making model along with a standardized multimodal pain management protocol, demonstrated a similar decrease in the quantity of opioids prescribed at discharge.13
Continue to: Change is here to stay: A new culture of postpartum analgesia...
Change is here to stay: A new culture of postpartum analgesia
The CDC continues to champion responsible opioid prescribing, while ACOG advocates for a reassessment of the way that opioids are utilized postpartum. The majority of women in the United States, however, continue to receive opioids after both vaginal delivery and CD. Consciously or not, we clinicians may be contributing to an outdated tradition that is potentially harmful both to patients and society. Reproducible strategies exist to reduce opioid use without compromising pain control or overwhelming clinicians with phone calls. It is time to embrace the change.
- Wong CA, Girard T. Undertreated or overtreated? Opioids for postdelivery analgesia. Br J Anaesth. 2018;121:339-342.
- Eisenach JC, Pan PH, Smiley R, et al. Severity of acute pain after childbirth, but not type of delivery, predicts persistent pain and postpartum depression. Pain. 2008;140:87-94.
- Bateman BT, Franklin JM, Bykov K, et al. Persistent opioid use following cesarean delivery: patterns and predictors among opioid-naïve women. Am J Obstet Gynecol. 2016;215:353.e1- 353.e18.
- Bateman BT, Cole NM, Maeda A, et al. Patterns of opioid prescription and use after cesarean delivery. Obstet Gynecol. 2017;130:29-35.
- Osmundson SS, Schornack LA, Grasch JL, et al. Postdischarge opioid use after cesarean delivery. Obstet Gynecol. 2017;130:36-41.
- American College of Obstetricians and Gynecologists. ACOG committee opinion no. 742: postpartum pain management. Obstet Gynecol. 2018;132:e35-e43.
- Mills JR, Huizinga MM, Robinson SB, et al. Draft opioid prescribing guidelines for uncomplicated normal spontaneous vaginal birth. Obstet Gynecol. 2019;133:81-90.
- Chang AK, Bijur PE, Esses D, et al. Effect of a single dose of oral opioid and nonopioid analgesics on acute extremity pain in the emergency department: a randomized clinical trial. JAMA. 2017;318:1661-1667.
- Mitchell A, van Zanten SV, Inglis K, et al. A randomized controlled trial comparing acetaminophen plus ibuprofen versus acetaminophen plus codeine plus caffeine after outpatient general surgery. J Am Coll Surg. 2008;206:472-479.
- Mitchell A, McCrea P, Inglis K, et al. A randomized, controlled trial comparing acetaminophen plus ibuprofen versus acetaminophen plus codeine plus caffeine (Tylenol 3) after outpatient breast surgery. Ann Surg Oncol. 2012;19:3792-3800.
- Holland E, Bateman BT, Cole N, et al. Evaluation of a quality improvement intervention that eliminated routine use of opioids after cesarean delivery. Obstet Gynecol. 2019;133:91-97.
- Hedderson M, Lee D, Hunt E, et al. Enhanced recovery after surgery to change process measures and reduce opioid use after cesarean delivery: a quality improvement initiative. Obstet Gynecol. 2019;134:511-519.
- Prabhu M, Dubois H, James K, et al. Implementation of a quality improvement initiative to decrease opioid prescribing after cesarean delivery. Obstet Gynecol. 2018;132:631-636.
- Rogers RG, Nix M, Chipman Z, et al. Decreasing opioid use postpartum: a quality improvement initiative. Obstet Gynecol. 2019;134:932-940.
- Prabhu M, McQuaid-Hanson E, Hopp S, et al. A shared decision-making intervention to guide opioid prescribing after cesarean delivery. Obstet Gynecol. 2017;130:42-46.
- Centers for Disease Control and Prevention. Calculating total daily dose of opioids for safer dosage. www.cdc.gov/ drugoverdose/pdf/calculating_total_daily_dose-a.pdf. Accessed December 31, 2019.
CASE New mother receives unneeded opioids after CD
A house officer wrote orders for a healthy patient who had just had an uncomplicated cesarean delivery (CD). The hospital’s tradition dictates orders for oxycodone plus acetaminophen tablets in addition to ibuprofen for all new mothers. At the time of the patient’s discharge, the same house officer prescribed 30 tablets of oxycodone plus acetaminophen “just in case,” although the patient had required only a few tablets while in the hospital on postoperative day 2 and none on the day of discharge.
Stuck in the habit
Prescribing postpartum opioids in the United States is almost habitual. Both optimizing patient satisfaction and minimizing patient phone calls may be driving this well-established pattern. Interestingly, a survey study of obstetric providers in 14 countries found that clinicians in 13 countries prescribe opioids “almost never” after vaginal delivery.1 The United States was the 1 outlier, with providers reporting prescribing opioids “on a regular basis” after vaginal birth. Similarly, providers in 10 countries reported prescribing opioids “almost never” after CD, while those in the United States reported prescribing opioids “almost always” in this context.
Moreover, mounting data suggest that many patients do not require the quantity of opioids prescribed and that our overprescribing may be causing more harm than good.
The problem of overprescribing opioids after childbirth
Opioid analgesia has long been the mainstay of treatment for postpartum pain, which when poorly controlled is associated with the development of postpartum depression and chronic pain.2 However, common adverse effects of opioids, including nausea, drowsiness, and dizziness, similarly can interfere with self-care and infant care. Of additional concern, a 2016 claims data study found that 1 of 300 opioid-naïve women who were prescribed opioids at discharge after CD used these medications persistently in the first year postpartum.3
Many women do not use the opioids that are prescribed to them at discharge, thus making tablets available for potential diversion into the community—a commonly recognized source of opioid misuse and abuse.4,5 In a 2018 Committee Opinion on postpartum pain management, the American College of Obstetricians and Gynecologists (ACOG) stated that “a stepwise, multimodal approach emphasizing nonopioid analgesia as first-line therapy is safe and effective for vaginal deliveries and cesarean deliveries.”6 The Committee Opinion also asserted that “opioid medication is an adjunct for patients with uncontrolled pain despite adequate first-line therapy.”6
Despite efforts by the Centers for Disease Control and Prevention (CDC) and ACOG to improve opioid prescribing patterns after childbirth, the vast majority of women receive opioids in the hospital and at discharge not only after CD, but after vaginal delivery as well.4,7 Why has tradition prevailed over data, and why have we not changed?
Continue to: Common misconceptions about reducing opioid use...
Common misconceptions about reducing opioid use
Two misconceptions persist regarding reducing opioid prescriptions for postpartum pain.
Misconception #1: Patients will be in pain
Randomized controlled trials that compared nonopioid with opioid regimens in the emergency room setting and opioid use after outpatient general surgery procedures have demonstrated that pain control for patients receiving opioids was equivalent to that for patients with pain managed with nonopioid regimens.8-10 In the obstetric setting, a survey study of 720 women who underwent CD found that higher quantities of opioid tablets prescribed at discharge were not associated with improved pain, higher satisfaction, or lower refill rates at 2 weeks postpartum.4 However, greater quantities of opioids prescribed at the time of discharge were associated with greater opioid consumption.
Recently, several quality improvement studies implemented various interventions and successfully decreased postpartum opioid consumption without compromising pain management. One quality improvement project eliminated the routine use of opioids after CD and decreased the proportion of patients using any opioids in the hospital from 68% to 45%, with no changes in pain scores.11 A similar study implemented an enhanced recovery after surgery (ERAS) program for women after CD; mean in-patient opioid use decreased from 10.7 to 5.4 average daily morphine equivalents, with improvement in the proportion of time that patients reported their pain as acceptable.12
Misconception #2: Clinicians will be overwhelmed with pages and phone calls
Providers commonly fear that decreasing opioid use will lead to an increased volume of pages and phone calls from patients requesting additional medication. However, data suggest otherwise. For example, a quality improvement study that eliminated the routine use of opioids after CD tracked the number of phone calls that were received requesting rescue opioid prescriptions after discharge.11 Although the percentage of women discharged with opioids decreased from 90.6% to 40.3%, the requests for rescue opioid prescriptions did not change. Of 191 women, 4 requested a rescue prescription prior to the intervention compared with no women after the intervention. At the same time, according to unpublished data (Dr. Holland), satisfaction among nurses, house staff, and faculty did not change.
Similarly, a quality improvement project that implemented shared decision-making to inform the quantity of opioids prescribed at discharge demonstrated that the number of tablets prescribed decreased from 33.2 to 26.5, and there was no change in the rate of patients requesting opioid refills.13
Success stories: Strategies for reducing opioid use after childbirth
While overall rates of opioid prescribing after vaginal delivery and CD remain high throughout the United States, various institutions have developed successful and reproducible strategies to reduce opioid use after childbirth both in the hospital and at discharge. We highlight 3 strategies below.
Strategy 1: ERAS initiatives
An integrated health care system in northern California studied the effects of an ERAS protocol for CD across 15 medical centers.12 The intervention centered on 4 pillars: multimodal pain management, early mobility, optimal nutrition, and patient engagement through education. Specifically, multimodal pain management consisted of the following:
- intrathecal opioids during CD
- scheduled intravenous acetaminophen for 24 hours followed by oral acetaminophen every 6 hours
- nonsteroidal anti-inflammatory drugs (NSAIDs) every 6 hours
- oral oxycodone for breakthrough pain
- decoupling of opioid medication from nonopioids in the post-CD order set
- decoupling of opioid and nonopioid medications in the discharge order set along with a reduction from 30 to 20 tablets as the default discharge quantity.
Continue to: Among 4,689 and 4,624 patients who underwent CD...
Among 4,689 and 4,624 patients who underwent CD before and after the intervention, the daily morphine milligram equivalents (MME) consumed in the hospital decreased from 10.7 to 5.4. The percentage of women who required no opioids while in the hospital increased from 8.3% to 21.4% after ERAS implementation, while the percentage of time that patients reported acceptable pain scores increased from 82.1% to 86.4%. The average number of opioid tablets prescribed at discharge also decreased, from 37 to 26 MME.12 (The TABLE shows oxycodone doses converted to MMEs.)
A similar initiative at a network of 5 hospitals in Texas showed that implementation of a “multimodal pain power plan” (which incorporated postpartum activity goals with standardized order sets) decreased opioid use after both vaginal delivery and CD.14
Strategy 2: Order set change to eliminate routine use of opioids
A tertiary care center in Boston, Massachusetts, implemented a quality improvement project aimed at eliminating the routine use of opioid medication after CD through an order set change.11 The intervention consisted of the following:
- intrathecal morphine
- multimodal postoperative pain management including scheduled oral acetaminophen for 72 hours followed by as-needed oral acetaminophen, scheduled NSAIDs for 72 hours followed by as-needed NSAIDs
- no postoperative order for opioids unless the patient had a contraindication to acetaminophen or NSAIDs, had a history of opioid dependence, or underwent complex surgery
- counseling patients that opioids were available for breakthrough pain if needed. In this case, nursing staff would page the responding clinician, who would order oxycodone 5 mg every 6 hours for 6 doses.
- specific criteria for discharge quantities of opioids: if the patient required no opioids in the hospital, she received no opioids at discharge; if the patient required opioids in the hospital but none at the time of discharge, she received no more than 10 tablets of oxycodone 5 mg; if the patient required opioids at the time of discharge, she received a maximum of 20 tablets of oxycodone 5 mg.
Among 191 and 181 women undergoing CD before and after the intervention, the percentage of patients who received any opioids in the hospital decreased from 68.1% to 45.3%.11 Similarly, the percentage of patients receiving a discharge prescription for opioids decreased from 90.6% to 40.3%, while patient pain scores and satisfaction with pain control remained unchanged.
Strategy 3: Shared decision-making tool
Another tertiary care center in Boston evaluated the effects of a shared decision-making tool on opioid discharge prescribing after CD.15 The intervention consisted of a 10-minute clinician-facilitated session incorporating:
- education around anticipated patterns of postoperative pain
- expected outpatient opioid use after CD
- risks and benefits of opioids and nonopioids
- education around opioid disposal and access to refills.
Among the 50 women enrolled in the study, the number of oxycodone 5-mg tablets prescribed at discharge decreased from the institutional standard of 40 to 20. Ninety percent of women reported being satisfied or very satisfied with their pain control, while only 4 of 50 women required an opioid refill. A follow-up quality improvement project, which implemented the shared decision-making model along with a standardized multimodal pain management protocol, demonstrated a similar decrease in the quantity of opioids prescribed at discharge.13
Continue to: Change is here to stay: A new culture of postpartum analgesia...
Change is here to stay: A new culture of postpartum analgesia
The CDC continues to champion responsible opioid prescribing, while ACOG advocates for a reassessment of the way that opioids are utilized postpartum. The majority of women in the United States, however, continue to receive opioids after both vaginal delivery and CD. Consciously or not, we clinicians may be contributing to an outdated tradition that is potentially harmful both to patients and society. Reproducible strategies exist to reduce opioid use without compromising pain control or overwhelming clinicians with phone calls. It is time to embrace the change.
- Wong CA, Girard T. Undertreated or overtreated? Opioids for postdelivery analgesia. Br J Anaesth. 2018;121:339-342.
- Eisenach JC, Pan PH, Smiley R, et al. Severity of acute pain after childbirth, but not type of delivery, predicts persistent pain and postpartum depression. Pain. 2008;140:87-94.
- Bateman BT, Franklin JM, Bykov K, et al. Persistent opioid use following cesarean delivery: patterns and predictors among opioid-naïve women. Am J Obstet Gynecol. 2016;215:353.e1- 353.e18.
- Bateman BT, Cole NM, Maeda A, et al. Patterns of opioid prescription and use after cesarean delivery. Obstet Gynecol. 2017;130:29-35.
- Osmundson SS, Schornack LA, Grasch JL, et al. Postdischarge opioid use after cesarean delivery. Obstet Gynecol. 2017;130:36-41.
- American College of Obstetricians and Gynecologists. ACOG committee opinion no. 742: postpartum pain management. Obstet Gynecol. 2018;132:e35-e43.
- Mills JR, Huizinga MM, Robinson SB, et al. Draft opioid prescribing guidelines for uncomplicated normal spontaneous vaginal birth. Obstet Gynecol. 2019;133:81-90.
- Chang AK, Bijur PE, Esses D, et al. Effect of a single dose of oral opioid and nonopioid analgesics on acute extremity pain in the emergency department: a randomized clinical trial. JAMA. 2017;318:1661-1667.
- Mitchell A, van Zanten SV, Inglis K, et al. A randomized controlled trial comparing acetaminophen plus ibuprofen versus acetaminophen plus codeine plus caffeine after outpatient general surgery. J Am Coll Surg. 2008;206:472-479.
- Mitchell A, McCrea P, Inglis K, et al. A randomized, controlled trial comparing acetaminophen plus ibuprofen versus acetaminophen plus codeine plus caffeine (Tylenol 3) after outpatient breast surgery. Ann Surg Oncol. 2012;19:3792-3800.
- Holland E, Bateman BT, Cole N, et al. Evaluation of a quality improvement intervention that eliminated routine use of opioids after cesarean delivery. Obstet Gynecol. 2019;133:91-97.
- Hedderson M, Lee D, Hunt E, et al. Enhanced recovery after surgery to change process measures and reduce opioid use after cesarean delivery: a quality improvement initiative. Obstet Gynecol. 2019;134:511-519.
- Prabhu M, Dubois H, James K, et al. Implementation of a quality improvement initiative to decrease opioid prescribing after cesarean delivery. Obstet Gynecol. 2018;132:631-636.
- Rogers RG, Nix M, Chipman Z, et al. Decreasing opioid use postpartum: a quality improvement initiative. Obstet Gynecol. 2019;134:932-940.
- Prabhu M, McQuaid-Hanson E, Hopp S, et al. A shared decision-making intervention to guide opioid prescribing after cesarean delivery. Obstet Gynecol. 2017;130:42-46.
- Centers for Disease Control and Prevention. Calculating total daily dose of opioids for safer dosage. www.cdc.gov/ drugoverdose/pdf/calculating_total_daily_dose-a.pdf. Accessed December 31, 2019.

Medical malpractice: Its evolution to today’s risk of the “big verdict”
Medical malpractice (more formally, professional liability, but we will use the term malpractice) has been of concern to ObGyns for many years, and for good reasons. This specialty has some of the highest incidents of malpractice claims, some of the largest verdicts, and some of the highest malpractice insurance rates. We look more closely at ObGyn malpractice issues in a 3-part “What’s the Verdict” series over the next few months.
In part 1, we discuss the background on malpractice and reasons why malpractice rates have been so high—including large verdicts and lawsuit-prone physicians. In the second part we will look at recent experience and developments in malpractice exposure—who is sued and why. Finally, in the third part we will consider suggestions for reducing the likelihood of a malpractice lawsuit, with a special focus on recent research regarding apologies.
Two reports of recent trials involving ObGyn care illustrate the risk of “the big verdict.”1,2 (Note that the following vignettes are drawn from actual cases but are outlines of those cases and not complete descriptions of the claims. Because the information does not come from formal court records, the facts may be inaccurate and are incomplete; they should be viewed as illustrations only.)
CASE 1 Delayed delivery, $19M verdict
At 39 weeks’ gestation, a woman was admitted to the hospital in spontaneous labor. Artificial rupture of membranes with clear amniotic fluid was noted. Active contractions occurred for 11 hours. Oxytocin was then initiated, and 17 minutes later, profound fetal bradycardia was detected. There was recurrent evidence of fetal distress with meconium. After a nursing staff change a second nurse restarted oxytocin for a prolonged period. The physician allowed labor to continue despite fetal distress, and performed a cesarean delivery (CD) 4.5 hours later. Five hours postdelivery the neonate was noted to have a pneumothorax, lung damage, and respiratory failure. The infant died at 18 days of age.
The jury felt that there was negligence—failure to timely diagnose fetal distress and failure to timely perform CD, all of which resulted in a verdict for the plaintiff. The jury awarded in excess of $19 million.1
CASE 2 An undiagnosed tumor, $20M verdict
A patient underwent bilateral mastectomy. Following surgery, she reported pain and swelling at the surgical site for 2 years, and the defendant physician “dismissed” her complaint, refusing to evaluate it as the provider felt it was related to scar tissue. Three years after the mastectomies, the patient underwent surgical exploration and removal of 3 ribs and sternum secondary to a desmoid tumor. Surgical mesh and chest reconstruction was required, necessitating long-term opioids and sleeping medications that “will slow her wits, dull her senses and limit activities of daily living.” Of note, discrepancies were found in the medical records maintained by the defendant. (There was, for example, no report in the record of the plaintiff’s pain until late in the process.) The plaintiff based her claim on the fact that her pain and lump were neither evaluated nor discovered until it was too late.
The jury awarded $20 million. The verdict was reduced to $2 million by the court based on state statutory limits on malpractice damages.2,3

Continue to: Medical malpractice: Evolution of a standard of care...
Medical malpractice: Evolution of a standard of care
Medical malpractice is not a modern invention. Some historians trace malpractice to the Code of Hammurabi (2030 BC), through Roman law,4 into English common law.5 It was sufficiently established by 1765 that the classic legal treatise of the century referred to medical malpractice.6,7 Although medical malpractice existed for a long time, actual malpractice cases were relatively rare before the last half of the 20th century.8
Defensive medicine born out of necessity. The number of malpractice cases increased substantially—described as a “geometric increase”—after 1960, with a 300% rise between 1965 and 1970.7,9 This “malpractice maelstrom of the 70s”7 resulted in dramatic increases in malpractice insurance costs and invited the practice of defensive medicine—medically unnecessary or unjustified tests and services.10Although there is controversy about what is defensive medicine and what is reasonably cautious medicine, the practice may account for 3% of total health care spending.11 Mello and others have estimated that there may be a $55 billion annual cost related to the medical malpractice system.12
Several malpractice crises and waves of malpractice or tort reform ensued,13 beginning in the 1970s and extending into the 2000s.11 Malpractice law is primarily a matter of state law, so reform essentially has been at the state level—as we will see in the second part in this series.
Defining a standard of care
Medical malpractice is the application of standard legal principles to medical practice. Those principles generally are torts (intentional torts and negligence), and sometimes contracts.14 Eventually, medical malpractice came to focus primarily on negligence. The legal purposes of imposing negligence liability are compensation (to repay the plaintiff the costs of the harm caused by the defendant) and deterrence (to discourage careless conduct that can harm others.)
Negligence is essentially carelessness that falls below the acceptable standard of care. Negligence may arise, for example, from15:
- doing something (giving a drug to a patient with a known allergy to it)
- not doing something (failing to test for a possible tumor, as in the second case above)
- not giving appropriate informed consent
- failing to conduct an adequate examination
- abandoning a patient
- failing to refer a patient to a specialist (or conduct a consultation).
(In recent years, law reforms directed specifically at medical malpractice have somewhat separated medical malpractice from other tort law.)
In malpractice cases, the core question is whether the provider did (or did not) do something that a reasonably careful physician would have done. It is axiomatic that not all bad outcomes are negligent. Indeed, not all mistakes are negligent—only the mistakes that were unreasonable given all of the circumstances. In the first case above, for example, given all of the facts that preceded it, the delay of the physician for 4.5 hours after the fetal distress started was, as seen by the jury, not just a mistake but an unreasonable mistake. Hence, it was negligent. In the second case, the failure to investigate the pain and swelling in the surgical site for 2 years (or failure to refer the patient to another physician) was seen by the jury as an unreasonable mistake—one that would not have been made by a reasonably careful practitioner.
Continue to: The big verdict...
The big verdict
Everyone—every professional providing service, every manufacturer, every driver—eventually will make an unreasonable mistake (ie, commit negligence). If that negligence results in harming someone else, our standard legal response is that the negligent person should be financially responsible for the harm to the other. So, a driver who fails to stop at a red light and hits another car is responsible for those damages. But the damages may vary—perhaps a banged-up fender, or, in another instance, with the same negligence, perhaps terrible personal injuries that will disable the other driver for life. Thus, the damages can vary for the same level of carelessness. The “big verdict” may therefore fall on someone who was not especially careless.
Big verdicts often involve long-term care. The opening case vignettes illustrate a concern of medical malpractice generally—especially for ObGyn practice—the very high verdict. Very high verdicts generally reflect catastrophic damages that will continue for a long time. Bixenstine and colleagues found, for example, that catastrophic payouts often involved “patient age less than 1 year, quadriplegia, brain damage, or lifelong care.”16 In the case of serious injuries during delivery, for example, the harm to the child may last a lifetime and require years and years of intensive medical services.
Million-dollar-plus payouts are on the rise. The percentage of paid claims (through settlement or trial) that are above $1 million is increasing. These million-dollar cases represent 36% of the total dollars paid in ObGyn malpractice claims, even though they represent only 8% of the number of claims paid.16 The increase in the big verdict cases (above $1 million) suggests that ObGyn practitioners should consider their malpractice policy limits—a million dollars may not be enough.
In big verdict cases, the great harm to the plaintiff is often combined with facts that produce extraordinary sympathy for the plaintiff. Sometimes there is decidedly unsympathetic conduct by the defendant as well. In the second case, for example, the problems with the medical record may have suggested to the jury that the doctor was either trying to hide something or did not care enough about the patient even to note a serious complaint. In a case we reviewed in an earlier “What’s the Verdict” column, a physician left the room for several minutes during a critical time—to take a call from a stockbroker.16-18
The big verdict does not necessarily suggest that the defendant was especially or grossly negligent.16 It was a bad injury that occurred, for instance. On the other hand, the physician with several malpractice judgments may suggest that this is a problem physician.
Physicians facing multiple lawsuits are the exceptions
A number of studies have demonstrated that only a small proportion of physicians are responsible for a disproportionate number of paid medical malpractice claims. (“Paid claims” are those in which the plaintiff receives money from the doctor’s insurance. “Filed claims” are all malpractice lawsuits filed. Many claims are filed, but few are paid.)
ObGyn has high number of paid claims and high risk of claim payment recurrence. Studdert and colleagues found that the probability of future paid malpractice climbed with each past paid claim.19 They also found that 1% of physicians accounted for 32% of all paid claims. The number of paid claims varied by specialty—obstetrics and gynecology accounted for the second largest number of paid claims (13%). The risk of recurrence (more than one paid claim) was highest among 4 surgical specialties and ObGyns (about double the recurrence rate in these specialties compared with internal medicine).19
A minority of physicians responsible for lion share of paid claims. Black and colleagues followed up the Studdert study. Although there were some differences in what they found, the results were very similar.20 For example, they found that having even a single prior paid claim strongly predicted future claims over the next 5 years. They also found that some “outlier” physicians with multiple paid claims “are responsible for a significant share of paid claims.” They specifically found that, even for physicians in high-risk specialties in high-risk states, “bad luck is highly unlikely to explain” multiple claims within 5 years.
Continue to: Both of the studies just mentioned relied on...
Both of the studies just mentioned relied on the National Practitioner Data Bank for information about paid claims. This source has some limitations in capturing claims or payments made by hospitals or other institutions for the actions of its agent-physicians. Some of these limitations were resolved in another recent study that looked at Indiana state insurance and licensing discipline records (over a 41-year period).21 Not surprisingly, this study found that claims paid increase with more severe licensure discipline. On the other hand, although, the “frequent fliers” in terms of malpractice claims made and paid could be identified as a “small number of repeat defendants,” these physicians were not routinely disciplined by the state medical board. This was only a single state study, of course, but it also found that a few physicians accounted for a significant number of the claims. The state board was not taking licensing action against this small group, however.
Should the few bad apples be picked from the orchard?
Collectively, these studies are fairly overwhelming in demonstrating that there are some physicians who are “prone” to malpractice claims (for whom all physicians in the specialty are probably paying higher malpractice rates), but who do not attract the attention of licensing agencies for careful examination. In addition to its self-interest in eliminating physicians prone to malpractice claims and payments, the obligation of professions to protect the public interest suggests that state boards should be more aggressive in pursuing those physicians practicing risky medicine.
This medical malpractice series will continue next month with a look at how to reduce malpractice exposure.
- Delivery delay blamed for baby’s death days later—$19.2 million Illinois verdict. Medical Malpractice: Verdicts, Settlements & Experts. 2019;35:17.
- Failure to identify signs of a growing tumor—$20 million Virginia verdict. Medical Malpractice: Verdicts, Settlements & Experts. 2019;35:18.
- Hellinger FJ, Encinosa WE. The impact of state laws limiting malpractice damage awards on health care expenditures. Am J Public Health. 2006;96:1375-1381.
- Bal BS. An introduction to medical malpractice in the United States. Clin Orthop Relat Res. 2009;467:339–347.
- Everad v. Hopkins, 80 English Reports 1164 (1615).
- Blackstone W. Commentaries on the laws of England. Oxford, England: Clarendon Press; 1768:122.
- Berlin L. Medical errors, malpractice, and defensive medicine: an ill-fated triad. Diagnosis (Berl). 2017;4:133-139.
- DeVille KA. Medical Malpractice in Nineteenth-Century America: Origins and Legacy. New York, NY: NYU Press; 1990.
- Hershey N. The defensive practice of medicine. Myth or reality. Milbank Mem Fund Q. 1972;50:69-98.
- Agarwal R, Gupta A, Gupta S. The impact of tort reform on defensive medicine, quality of care, and physician supply: a systematic review. Health Serv Res. 2019;54:851-859.
- Gerlach J, Abodunde B, Sollosy M, et al. Rethinking the obvious: time for new ideas on medical malpractice tort reform. Health Care Manag (Frederick). 2019;38:109-115.
- Mello MM, Chandra A, Gawande AA, et al. National costs of the medical liability system. Health Aff. 2010;29:1569-1577.
- Bovbjerg RR. Malpractice crisis and reform. Clin Perinatol. 2005;32:203-233, viii-ix.
- Hawkins v. McGee, 84 N.H. 114, 146 A. 641 (1929).
- Gittler GJ, Goldstein EJ. The elements of medical malpractice: an overview. Clin Infect Dis. 1996;23:1152–1155.
- Bixenstine PJ, Shore AD, Mehtsun WT, et al. Catastrophic medical malpractice payouts in the United States. J Healthc Quality. 2014;36:43-53.
- Sanfilippo JS, Smith SR. Lessons from a daunting malpractice event. OBG Manag. 2018;30:41-47.
- Chang D. Miami doctor hit with $33 million judgment in brain-damaged baby suit. Miami Herald. April 28, 2017. http://www.miamiherald.com/news/health-care/ article147506019.html. Accessed December 12, 2019.
- Studdert DM, Bismark MM, Mello MM, et al. Prevalence and characteristics of physicians prone to malpractice claims. N Engl J Med. 2016;374:354-362.
- Black B, Hyman DA, Lerner JY. Physicians with multiple paid medical malpractice claims: Are they outliers or just unlucky? Int Rev Law Econ. 2019;59:146-157.
- Liu J, Hyman DA. Targeting bad doctors: lessons from Indiana, 1975–2015. J Empirical Legal Studies. 2019;16: 248-328.

Mr. Smith is Professor Emeritus and Dean Emeritus at California Western School of Law, San Diego, California.

Dr. Sanfilippo is Professor, Department of Obstetrics, Gynecology, and Reproductive Sciences, University of Pittsburgh, and Academic Division Director, Reproductive Endocrinology and Infertility, Magee-Womens Hospital, Pittsburgh, Pennsylvania. He also serves on the
The authors report no financial relationships relevant to this article.
Mr. Smith is Professor Emeritus and Dean Emeritus at California Western School of Law, San Diego, California.
Dr. Sanfilippo is Professor, Department of Obstetrics, Gynecology, and Reproductive Sciences, University of Pittsburgh, and Academic Division Director, Reproductive Endocrinology and Infertility, Magee-Womens Hospital, Pittsburgh, Pennsylvania. He also serves on the
The authors report no financial relationships relevant to this article.
Medical malpractice (more formally, professional liability, but we will use the term malpractice) has been of concern to ObGyns for many years, and for good reasons. This specialty has some of the highest incidents of malpractice claims, some of the largest verdicts, and some of the highest malpractice insurance rates. We look more closely at ObGyn malpractice issues in a 3-part “What’s the Verdict” series over the next few months.
In part 1, we discuss the background on malpractice and reasons why malpractice rates have been so high—including large verdicts and lawsuit-prone physicians. In the second part we will look at recent experience and developments in malpractice exposure—who is sued and why. Finally, in the third part we will consider suggestions for reducing the likelihood of a malpractice lawsuit, with a special focus on recent research regarding apologies.
Two reports of recent trials involving ObGyn care illustrate the risk of “the big verdict.”1,2 (Note that the following vignettes are drawn from actual cases but are outlines of those cases and not complete descriptions of the claims. Because the information does not come from formal court records, the facts may be inaccurate and are incomplete; they should be viewed as illustrations only.)
CASE 1 Delayed delivery, $19M verdict
At 39 weeks’ gestation, a woman was admitted to the hospital in spontaneous labor. Artificial rupture of membranes with clear amniotic fluid was noted. Active contractions occurred for 11 hours. Oxytocin was then initiated, and 17 minutes later, profound fetal bradycardia was detected. There was recurrent evidence of fetal distress with meconium. After a nursing staff change a second nurse restarted oxytocin for a prolonged period. The physician allowed labor to continue despite fetal distress, and performed a cesarean delivery (CD) 4.5 hours later. Five hours postdelivery the neonate was noted to have a pneumothorax, lung damage, and respiratory failure. The infant died at 18 days of age.
The jury felt that there was negligence—failure to timely diagnose fetal distress and failure to timely perform CD, all of which resulted in a verdict for the plaintiff. The jury awarded in excess of $19 million.1
CASE 2 An undiagnosed tumor, $20M verdict
A patient underwent bilateral mastectomy. Following surgery, she reported pain and swelling at the surgical site for 2 years, and the defendant physician “dismissed” her complaint, refusing to evaluate it as the provider felt it was related to scar tissue. Three years after the mastectomies, the patient underwent surgical exploration and removal of 3 ribs and sternum secondary to a desmoid tumor. Surgical mesh and chest reconstruction was required, necessitating long-term opioids and sleeping medications that “will slow her wits, dull her senses and limit activities of daily living.” Of note, discrepancies were found in the medical records maintained by the defendant. (There was, for example, no report in the record of the plaintiff’s pain until late in the process.) The plaintiff based her claim on the fact that her pain and lump were neither evaluated nor discovered until it was too late.
The jury awarded $20 million. The verdict was reduced to $2 million by the court based on state statutory limits on malpractice damages.2,3
Continue to: Medical malpractice: Evolution of a standard of care...
Medical malpractice: Evolution of a standard of care
Medical malpractice is not a modern invention. Some historians trace malpractice to the Code of Hammurabi (2030 BC), through Roman law,4 into English common law.5 It was sufficiently established by 1765 that the classic legal treatise of the century referred to medical malpractice.6,7 Although medical malpractice existed for a long time, actual malpractice cases were relatively rare before the last half of the 20th century.8
Defensive medicine born out of necessity. The number of malpractice cases increased substantially—described as a “geometric increase”—after 1960, with a 300% rise between 1965 and 1970.7,9 This “malpractice maelstrom of the 70s”7 resulted in dramatic increases in malpractice insurance costs and invited the practice of defensive medicine—medically unnecessary or unjustified tests and services.10Although there is controversy about what is defensive medicine and what is reasonably cautious medicine, the practice may account for 3% of total health care spending.11 Mello and others have estimated that there may be a $55 billion annual cost related to the medical malpractice system.12
Several malpractice crises and waves of malpractice or tort reform ensued,13 beginning in the 1970s and extending into the 2000s.11 Malpractice law is primarily a matter of state law, so reform essentially has been at the state level—as we will see in the second part in this series.
Defining a standard of care
Medical malpractice is the application of standard legal principles to medical practice. Those principles generally are torts (intentional torts and negligence), and sometimes contracts.14 Eventually, medical malpractice came to focus primarily on negligence. The legal purposes of imposing negligence liability are compensation (to repay the plaintiff the costs of the harm caused by the defendant) and deterrence (to discourage careless conduct that can harm others.)
Negligence is essentially carelessness that falls below the acceptable standard of care. Negligence may arise, for example, from15:
- doing something (giving a drug to a patient with a known allergy to it)
- not doing something (failing to test for a possible tumor, as in the second case above)
- not giving appropriate informed consent
- failing to conduct an adequate examination
- abandoning a patient
- failing to refer a patient to a specialist (or conduct a consultation).
(In recent years, law reforms directed specifically at medical malpractice have somewhat separated medical malpractice from other tort law.)
In malpractice cases, the core question is whether the provider did (or did not) do something that a reasonably careful physician would have done. It is axiomatic that not all bad outcomes are negligent. Indeed, not all mistakes are negligent—only the mistakes that were unreasonable given all of the circumstances. In the first case above, for example, given all of the facts that preceded it, the delay of the physician for 4.5 hours after the fetal distress started was, as seen by the jury, not just a mistake but an unreasonable mistake. Hence, it was negligent. In the second case, the failure to investigate the pain and swelling in the surgical site for 2 years (or failure to refer the patient to another physician) was seen by the jury as an unreasonable mistake—one that would not have been made by a reasonably careful practitioner.
Continue to: The big verdict...
The big verdict
Everyone—every professional providing service, every manufacturer, every driver—eventually will make an unreasonable mistake (ie, commit negligence). If that negligence results in harming someone else, our standard legal response is that the negligent person should be financially responsible for the harm to the other. So, a driver who fails to stop at a red light and hits another car is responsible for those damages. But the damages may vary—perhaps a banged-up fender, or, in another instance, with the same negligence, perhaps terrible personal injuries that will disable the other driver for life. Thus, the damages can vary for the same level of carelessness. The “big verdict” may therefore fall on someone who was not especially careless.
Big verdicts often involve long-term care. The opening case vignettes illustrate a concern of medical malpractice generally—especially for ObGyn practice—the very high verdict. Very high verdicts generally reflect catastrophic damages that will continue for a long time. Bixenstine and colleagues found, for example, that catastrophic payouts often involved “patient age less than 1 year, quadriplegia, brain damage, or lifelong care.”16 In the case of serious injuries during delivery, for example, the harm to the child may last a lifetime and require years and years of intensive medical services.
Million-dollar-plus payouts are on the rise. The percentage of paid claims (through settlement or trial) that are above $1 million is increasing. These million-dollar cases represent 36% of the total dollars paid in ObGyn malpractice claims, even though they represent only 8% of the number of claims paid.16 The increase in the big verdict cases (above $1 million) suggests that ObGyn practitioners should consider their malpractice policy limits—a million dollars may not be enough.
In big verdict cases, the great harm to the plaintiff is often combined with facts that produce extraordinary sympathy for the plaintiff. Sometimes there is decidedly unsympathetic conduct by the defendant as well. In the second case, for example, the problems with the medical record may have suggested to the jury that the doctor was either trying to hide something or did not care enough about the patient even to note a serious complaint. In a case we reviewed in an earlier “What’s the Verdict” column, a physician left the room for several minutes during a critical time—to take a call from a stockbroker.16-18
The big verdict does not necessarily suggest that the defendant was especially or grossly negligent.16 It was a bad injury that occurred, for instance. On the other hand, the physician with several malpractice judgments may suggest that this is a problem physician.
Physicians facing multiple lawsuits are the exceptions
A number of studies have demonstrated that only a small proportion of physicians are responsible for a disproportionate number of paid medical malpractice claims. (“Paid claims” are those in which the plaintiff receives money from the doctor’s insurance. “Filed claims” are all malpractice lawsuits filed. Many claims are filed, but few are paid.)
ObGyn has high number of paid claims and high risk of claim payment recurrence. Studdert and colleagues found that the probability of future paid malpractice climbed with each past paid claim.19 They also found that 1% of physicians accounted for 32% of all paid claims. The number of paid claims varied by specialty—obstetrics and gynecology accounted for the second largest number of paid claims (13%). The risk of recurrence (more than one paid claim) was highest among 4 surgical specialties and ObGyns (about double the recurrence rate in these specialties compared with internal medicine).19
A minority of physicians responsible for lion share of paid claims. Black and colleagues followed up the Studdert study. Although there were some differences in what they found, the results were very similar.20 For example, they found that having even a single prior paid claim strongly predicted future claims over the next 5 years. They also found that some “outlier” physicians with multiple paid claims “are responsible for a significant share of paid claims.” They specifically found that, even for physicians in high-risk specialties in high-risk states, “bad luck is highly unlikely to explain” multiple claims within 5 years.
Continue to: Both of the studies just mentioned relied on...
Both of the studies just mentioned relied on the National Practitioner Data Bank for information about paid claims. This source has some limitations in capturing claims or payments made by hospitals or other institutions for the actions of its agent-physicians. Some of these limitations were resolved in another recent study that looked at Indiana state insurance and licensing discipline records (over a 41-year period).21 Not surprisingly, this study found that claims paid increase with more severe licensure discipline. On the other hand, although, the “frequent fliers” in terms of malpractice claims made and paid could be identified as a “small number of repeat defendants,” these physicians were not routinely disciplined by the state medical board. This was only a single state study, of course, but it also found that a few physicians accounted for a significant number of the claims. The state board was not taking licensing action against this small group, however.
Should the few bad apples be picked from the orchard?
Collectively, these studies are fairly overwhelming in demonstrating that there are some physicians who are “prone” to malpractice claims (for whom all physicians in the specialty are probably paying higher malpractice rates), but who do not attract the attention of licensing agencies for careful examination. In addition to its self-interest in eliminating physicians prone to malpractice claims and payments, the obligation of professions to protect the public interest suggests that state boards should be more aggressive in pursuing those physicians practicing risky medicine.
This medical malpractice series will continue next month with a look at how to reduce malpractice exposure.
- Delivery delay blamed for baby’s death days later—$19.2 million Illinois verdict. Medical Malpractice: Verdicts, Settlements & Experts. 2019;35:17.
- Failure to identify signs of a growing tumor—$20 million Virginia verdict. Medical Malpractice: Verdicts, Settlements & Experts. 2019;35:18.
- Hellinger FJ, Encinosa WE. The impact of state laws limiting malpractice damage awards on health care expenditures. Am J Public Health. 2006;96:1375-1381.
- Bal BS. An introduction to medical malpractice in the United States. Clin Orthop Relat Res. 2009;467:339–347.
- Everad v. Hopkins, 80 English Reports 1164 (1615).
- Blackstone W. Commentaries on the laws of England. Oxford, England: Clarendon Press; 1768:122.
- Berlin L. Medical errors, malpractice, and defensive medicine: an ill-fated triad. Diagnosis (Berl). 2017;4:133-139.
- DeVille KA. Medical Malpractice in Nineteenth-Century America: Origins and Legacy. New York, NY: NYU Press; 1990.
- Hershey N. The defensive practice of medicine. Myth or reality. Milbank Mem Fund Q. 1972;50:69-98.
- Agarwal R, Gupta A, Gupta S. The impact of tort reform on defensive medicine, quality of care, and physician supply: a systematic review. Health Serv Res. 2019;54:851-859.
- Gerlach J, Abodunde B, Sollosy M, et al. Rethinking the obvious: time for new ideas on medical malpractice tort reform. Health Care Manag (Frederick). 2019;38:109-115.
- Mello MM, Chandra A, Gawande AA, et al. National costs of the medical liability system. Health Aff. 2010;29:1569-1577.
- Bovbjerg RR. Malpractice crisis and reform. Clin Perinatol. 2005;32:203-233, viii-ix.
- Hawkins v. McGee, 84 N.H. 114, 146 A. 641 (1929).
- Gittler GJ, Goldstein EJ. The elements of medical malpractice: an overview. Clin Infect Dis. 1996;23:1152–1155.
- Bixenstine PJ, Shore AD, Mehtsun WT, et al. Catastrophic medical malpractice payouts in the United States. J Healthc Quality. 2014;36:43-53.
- Sanfilippo JS, Smith SR. Lessons from a daunting malpractice event. OBG Manag. 2018;30:41-47.
- Chang D. Miami doctor hit with $33 million judgment in brain-damaged baby suit. Miami Herald. April 28, 2017. http://www.miamiherald.com/news/health-care/ article147506019.html. Accessed December 12, 2019.
- Studdert DM, Bismark MM, Mello MM, et al. Prevalence and characteristics of physicians prone to malpractice claims. N Engl J Med. 2016;374:354-362.
- Black B, Hyman DA, Lerner JY. Physicians with multiple paid medical malpractice claims: Are they outliers or just unlucky? Int Rev Law Econ. 2019;59:146-157.
- Liu J, Hyman DA. Targeting bad doctors: lessons from Indiana, 1975–2015. J Empirical Legal Studies. 2019;16: 248-328.

The Ketogenic Diet and Dermatology: A Primer on Current Literature
The ketogenic diet has been therapeutically employed by physicians since the times of Hippocrates, primarily for its effect on the nervous system.1 The neurologic literature is inundated with the uses of this medicinal diet for applications in the treatment of epilepsy, neurodegenerative disease, malignancy, and enzyme deficiencies, among others.2 In recent years, physicians and scientists have moved to study the application of a ketogenic diet in the realms of cardiovascular disease,3 autoimmune disease,4 management of diabetes mellitus (DM) and obesity,3,5 and enhancement of sports and combat performance,6 all with promising results. Increased interest in alternative therapies among the lay population and the efficacy purported by many adherents has spurred intrigue by health care professionals. Over the last decade, there has seen a boom in so-called holistic approaches to health; included are the Paleo Diet, Primal Blueprint Diet, Bulletproof Diet, and the ketogenic/low-carbohydrate, high-fat diet. The benefits of ketones in these diets—through intermittent fasting or cyclical ketosis—–for cognitive enhancement, overall well-being, amelioration of chronic disease states, and increased health span have been promulgated to the lay population. But to date, there is a large gap in the literature on the applications of ketones as well as the ketogenic diet in dermatology and skin health and disease.
The aim of this article is not to summarize the uses of ketones and the ketogenic diet in dermatologic applications (because, unfortunately, those studies have not been undertaken) but to provide evidence from all available literature to support the need for targeted research and to encourage dermatologists to investigate ketones and their role in treating skin disease, primarily in an adjunctive manner. In doing so, a clearly medicinal diet may gain a foothold in the disease-treatment repertoire and among health-promoting agents of the dermatologist. Given the amount of capital being spent on health care, there is an ever-increasing need for low-cost, safe, and tolerable treatments that can be used for multiple disease processes and to promote health. We believe the ketogenic diet is such an adjunctive therapeutic option, as it has clearly been proven to be tolerable, safe, and efficacious for many people over the last millennia.
We conducted a PubMed search of articles indexed for MEDLINE using varying combinations of the terms ketones, ketogenic, skin, inflammation, metabolic, oxidation, dermatology, and dermatologic and found 12 articles. Herein, we summarize the relevant articles and the works cited by those articles.
Adverse Effects of the Ketogenic Diet
As with all medical therapies, the ketogenic diet is not without risk of adverse effects, which should be communicated at the outset of this article and with patients in the clinic. The only known absolute contraindications to a ketogenic diet are porphyria and pyruvate carboxylase deficiency secondary to underlying metabolic derangements.7 Certain metabolic cytopathies and carnitine deficiency are relative contraindications, and patients with these conditions should be cautiously placed on this diet and closely monitored. Dehydration, acidosis, lethargy, hypoglycemia, dyslipidemia, electrolyte imbalances, prurigo pigmentosa, and gastrointestinal distress may be an acute issue, but these effects are transient and can be managed. Chronic adverse effects are nephrolithiasis (there are recommended screening procedures for those at risk and prophylactic therapies, which is beyond the scope of this article) and weight loss.7
NLRP3 Inflammasome Suppression
Youm et al8 reported their findings in Nature Medicine that β-hydroxybutyrate, a ketone body that naturally circulates in the human body, specifically suppresses activity of the NLRP3 inflammasome. The NLRP3 inflammasome serves as the activating platform for IL-1β.8 Aberrant and elevated IL-1β levels cause or are associated with a number of dermatologic diseases—namely, the autoinflammatory syndromes (familial cold autoinflammatory syndrome, Muckle-Wells syndrome, neonatal-onset multisystemic disease/chronic infantile neurological cutaneous articular syndrome), hyperimmunoglobulinemia D with periodic fever syndrome, tumor necrosis factor–receptor associated periodic syndrome, juvenile idiopathic arthritis, relapsing polychondritis, Schnitzler syndrome, Sweet syndrome, Behçet disease, gout, sunburn and contact hypersensitivity, hidradenitis suppurativa, and metastatic melanoma.7 Clearly, the ketogenic diet may be employed in a therapeutic manner (though to what degree, we need further study) for these dermatologic conditions based on the interaction with the NRLP3 inflammasome and IL-1β.
Acne
A link between acne and diet has long been suspected, but a lack of well-controlled studies has caused only speculation to remain. Recent literature suggests that the effects of insulin may be a notable driver of acne through effects on sex hormones and subsequent effects on sebum production and inflammation. Cordain et al9 discuss the mechanism by which insulin can worsen acne in a valuable article, which Paoli et al10 later corroborated. Essentially, insulin propagates acne by 2 known mechanisms. First, an increase in serum insulin causes a rise in insulinlike growth factor 1 levels and a decrease in insulinlike growth factor binding protein 3 levels, which directly influences keratinocyte proliferation and reduces retinoic acid receptor/retinoid X receptor activity in the skin, causing hyperkeratinization and concomitant abnormal desquamation of the follicular epithelium.9,10 Second, this increase in insulinlike growth factor 1 and insulin causes a decrease in sex hormone–binding globulin and leads to increased androgen production and circulation in the skin, which causes an increase in sebum production. These factors combined with skin that is colonized with Cutibacterium acnes lead to an inflammatory response and the disease known as acne vulgaris.9,10 A ketogenic diet could help ameliorate acne because it results in very little insulin secretion, unlike the typical Western diet, which causes frequent large spikes in insulin levels. Furthermore, the anti-inflammatory effects of ketones would benefit the inflammatory nature of this disease.
DM and Diabetic Skin Disease
Diabetes mellitus carries with it the risk for skin diseases specific to the diabetic disease process, such as increased risk for bacterial and fungal infections, venous stasis, pruritus (secondary to poor circulation), acanthosis nigricans, diabetic dermopathy, necrobiosis lipoidica diabeticorum, digital sclerosis, and bullosis diabeticorum.11 It is well established that better control of DM results in better disease state outcomes.12 The ketogenic diet has shown itself to be a formidable and successful treatment in the diseases of carbohydrate intolerance (eg, metabolic syndrome, insulin resistance, type 2 DM) because of several known mechanisms, including less glucose entering the body and thus less fat deposition, end-product glycation, and free-radical production (discussed below); enhanced fat loss and metabolic efficiency; increased insulin sensitivity; and decreased inflammation.13 Lowering a patient’s insulin resistance through a ketogenic diet may help prevent or treat diabetic skin disease.
Dermatologic Malignancy
A ketogenic diet has been of interest in oncology research as an adjunctive therapy for several reasons: anti-inflammatory effects, antioxidation effects, possible effects on mammalian target of rapamycin (mTOR) regulation,7 and exploitation of the Warburg effect.14 One article discusses how mTOR, a cell-cycle regulator of particular importance in cancer biology, can be influenced by ketones both directly and indirectly through modulating the inflammatory response.7 It has been shown that suppressing mTOR activity limits and slows tumor growth and spread. Ketones also may prove to be a unique method of metabolically exploiting cancer physiology. The Warburg effect, which earned Otto Warburg the Nobel Prize in Physiology or Medicine in 1931, is the observation that cancerous cells produce adenosine triphosphate solely through aerobic glycolysis followed by lactic acid fermentation.14 This phenomenon is the basis of the positron emission tomography scan. There are several small studies of the effects of ketogenic diets on malignancy, and although none of these studies are of substantial size or control, they show that a ketogenic diet can halt or even reverse tumor growth.15 The hypothesis is that because cancer cells cannot metabolize ketones (but normal cells can), the Warburg effect can be taken advantage of through a ketogenic diet to aid in the treatment of malignant disease.14 If further studies find it a formidable treatment, it most certainly would be helpful for the dermatologist involved in the treatment of cutaneous cancers.
Oxidative Stress
Oxidative stress, a state brought about when reactive oxygen species (ROS) production exceeds the antioxidant capacity of the cell and causes damage, is known to be a central part of certain skin diseases (eg, acne, psoriasis, cutaneous malignancy, varicose ulcers, cutaneous allergic reactions, and drug-induced skin photosensitivity).7 There are 2 proven mechanisms by which a ketogenic diet can augment the body’s innate antioxidation capacity. First, ketones activate a potent antioxidant upregulating protein known as NRF2, which is bound in cytosol and remains inactive until activated by certain stimuli (ie, ketones).16 Migration to the nucleus causes transcriptional changes in DNA to upregulate, via a myriad of pathways, antioxidant production in the cell; most notably, it results in increased glutathione levels.17 NRF2 also targets several genes involved in chronic inflammatory skin diseases that cause an increase in the antioxidant capacity.18 As an aside, several foods encouraged on a ketogenic diet also activate NRF2 independently of ketones (eg, coffee, broccoli).19 Second, a ketogenic diet results in fewer produced ROS and an increase in the nicotinamide adenine dinucleotide ratio produced by the mitochondria; in short, it is a more efficient way of producing cellular energy while enhancing mitochondrial function. When fewer ROS are produced, there is less oxidative stress that needs to be attended to by the cell and less cellular damage. Feichtinger et al19 point out that mitochondrial inefficiency and dysfunction often are overlooked components in several skin diseases, and based on the studies discussed above, these diseases may be aided with a ketogenic diet.
Patient Applications
Clearly, a ketogenic diet is therapeutic, and there are many promising potential roles it may play in the treatment of a wide variety of health and disease states through hormonal normalization, antioxidant effects, anti-inflammatory effects, and improvement of metabolic risk factors. However, there are vast limitations to what is known about the ketogenic diet and how it might be employed, particularly by the dermatologist. First, the ketogenic diet lacks a firm definition. Although processed inflammatory vegetable oils and meats are low in carbohydrates and high in fat by definition, it is impossible to argue that they are healthy options for consumption and disease prevention and treatment. Second, nutrigenomics dictates that there must be an individual role in how the diet is employed (eg, patients who are lactose intolerant will need to stay away from dairy). Third, there are no clear proven clinical results from the ketogenic diet in the realm of dermatology. Fourth, as with everything, there are potential detrimental side effects of the ketogenic diet that must be considered for patients (though there are established screening procedures and prophylactic therapies that are beyond the scope of this article). Further, other diets have shown benefit for many other disease states and health promotion purposes (eg, the Mediterranean diet).20 We do not know yet if the avoidance of certain dietary factors such as processed carbohydrates and fats are more beneficial than adopting a state of ketosis at this time, and therefore we are not claiming superiority of one dietary approach over others that are proven to promote health.
Because there are no large-scale studies of the ketogenic diet, there is no verified standardization of initiating and monitoring it, though certain academic centers do have published methods of doing so.21 There are ample anecdotal methods of initiating, maintaining, and monitoring the ketogenic diet.22 In short, drastic restriction of carbohydrate intake and increased fat consumption are the staples of initiating the diet. Medium-chain triglyceride oil supplementation, coffee consumption, intermittent fasting, and low-level aerobic activity also are thought to aid in transition to a ketogenic state. As a result, a dermatologist may recommend that patients interested in this option begin by focusing on fat, fiber, and protein consumption while greatly reducing the amount of carbohydrates in the diet. Morning walks or more intense workouts for fitter patients should be encouraged. Consumption of serum ketone–enhancing foods (eg, coffee, medium-chain triglyceride oil, coconut products) also should be encouraged. A popular beverage known as Bulletproof coffee also may be of interest.23 A blood ketone meter can be used for biofeedback to reinforce these behaviors by aiming for proper β-hydroxybutyrate levels. Numerous companies and websites exist for supporting those patients wishing to pursue a ketogenic state, some hosted by physicians/researchers with others hosted by laypeople with an interest in the topic; discretion should be used as to the clinical and scientific accuracy of these sites. The dermatologist in particular can follow these patients and assess for changes in severity of skin disease, subjective well-being, need for medications and adjunctive therapies, and status of comorbid conditions.
For more information on the ketogenic diet, consider reading the works of the following physicians and researchers who all have been involved with or are currently conducting research in the medical use of ketones and ketogenic diets: David Perlmutter, MD; Thomas Seyfried, PhD; Dominic D’Agostino, PhD; Terry Wahls, MD; Jeff Volek, PhD; and Peter Attia, MD.
Conclusion
Based on the available data, there is potential for use of the ketogenic diet in an adjunctive manner for dermatologic applications, and studies should be undertaken to establish the efficacy or inefficacy of this diet as a preventive measure or treatment of skin disease. With the large push for complementary and alternative therapies over the last decade, particularly for skin disease, the time for research on the ketogenic diet is ripe. Over the coming years, it is our hope that larger clinical, randomized, controlled trials will be conducted for the benefit of dermatology patients worldwide.
- Wheless JW. History of the ketogenic diet. Epilepsia. 2008;49:3-5.
- Stafstrom CE, Rho JM. The ketogenic diet as a treatment paradigm for diverse neurological disorders. Front Pharmacol. 2012;3:59.
- Dashti HM, Mathew TC, Hussein T, et al. Long-term effects of a ketogenic diet in obese patients. Exp Clin Cardiol. 2004;9:200-205.
- Storoni M, Plant GT. The therapeutic potential of the ketogenic diet in treating progressive multiple sclerosis. Mult Scler Int. 2015;2015:681289. doi:10.1155/2015/681289.
- Yancy WS, Foy M, Chalecki AM, et al. A low-carbohydrate, ketogenic diet to treat type 2 diabetes. Nutr Metab (Lond). 2005;2:34.
- Phinney SD. Ketogenic diets and physical performance. Nutr Metab (Lond). 2004;1:2.
- J. The promising potential role of ketones in inflammatory dermatologic disease: a new frontier in treatment research. J Dermatol Treat. 2017;28:484-487.
- Youm YH, Nguyen KY, Grant RW, et al. The ketone metabolite β-hydroxybutyrate blocks NLRP3 inflammasome-mediated inflammatory disease. Nat Med. 2015;21:263-269.
- Cordain L, Lindeberg S, Hurtado M, et al. Acne vulgaris: a disease of western civilization. Arch Dermatol
- Nutrition and acne: therapeutic potential of ketogenic diets. Skin Pharmacol Physiol. 2012;25:111-117.
- American Diabetes Association. Skin complications. http://www.diabetes.org/diabetes/complications/skin-complications. Accessed December 18, 2019.
- Greenapple R. Review of strategies to enhance outcomes for patients with type 2 diabetes: payers’ perspective. Am Health Drug Benefits. 2011;4:377-386.
- Paoli A, Rubini A, Volek JS, et al. Beyond weight loss: a review of the therapeutic uses of very-low-carbohydrate (ketogenic) diets. Eur J Clin Nutr. 2013;67:789-796.
- Allen BG, Bhatia SK, Anderson CM, et al. Ketogenic diets as an adjuvant cancer therapy: history and potential mechanism. Redox Biol. 2014;2:963-970.
- Zhou W, Mukherjee P, Kiebish MA. The calorically restricted ketogenic diet, an effective alternative therapy for malignant brain cancer. Nutr Metab (Lond). 2007;4:5.
- Venugopal R, Jaiswal AK. Nrf1 and Nrf2 positively and c-Fos and Fra1 negatively regulate the human antioxidant response element-mediated expression of NAD(P)H:quinone oxidoreductase1 gene. Proc Natl Acad Sci U S A. 1996;93:14960-14965.
- Milder JB, Liang LP, Patel M. Acute oxidative stress and systemic Nrf2 activation by the ketogenic diet. Neurobiol Dis. 2010:40:238-244.
- Vicente SJ, Ishimoto EY, Torres EA. Coffee modulates transcription factor Nrf2 and highly increases the activity of antioxidant enzymes in rats.J Agric Food Chem. 2014;62:116-122.
- Feichtinger R, Sperl W, Bauer JW, et al. Mitochondrial dysfunction: a neglected component of skin diseases. Exp Dermatol. 2014;23:607-614.
- Brandhorst S, Longo VD. Dietary restrictions and nutrition in the prevention and treatment of cardiovascular disease. Circ Res. 2019;124:952-965.
- Johns Hopkins Medicine. Ketogenic diet therapy for epilepsy. https://www.hopkinsmedicine.org/neurology_neurosurgery/
centers_clinics/epilepsy/pediatric_epilepsy/ketogenic_diet.html. Accessed December 18, 2019. - Bergqvist AG. Long-term monitoring of the ketogenic diet: do’s and don’ts. Epilepsy Res. 2012;100:261-266.
- Bulletproof. Bulletproof coffee: everything you want to know. https://blog.bulletproof.com/how-to-make-your-coffee-bulletproof-and-your-morning-too/. Accessed December 18, 2019.
The ketogenic diet has been therapeutically employed by physicians since the times of Hippocrates, primarily for its effect on the nervous system.1 The neurologic literature is inundated with the uses of this medicinal diet for applications in the treatment of epilepsy, neurodegenerative disease, malignancy, and enzyme deficiencies, among others.2 In recent years, physicians and scientists have moved to study the application of a ketogenic diet in the realms of cardiovascular disease,3 autoimmune disease,4 management of diabetes mellitus (DM) and obesity,3,5 and enhancement of sports and combat performance,6 all with promising results. Increased interest in alternative therapies among the lay population and the efficacy purported by many adherents has spurred intrigue by health care professionals. Over the last decade, there has seen a boom in so-called holistic approaches to health; included are the Paleo Diet, Primal Blueprint Diet, Bulletproof Diet, and the ketogenic/low-carbohydrate, high-fat diet. The benefits of ketones in these diets—through intermittent fasting or cyclical ketosis—–for cognitive enhancement, overall well-being, amelioration of chronic disease states, and increased health span have been promulgated to the lay population. But to date, there is a large gap in the literature on the applications of ketones as well as the ketogenic diet in dermatology and skin health and disease.
The aim of this article is not to summarize the uses of ketones and the ketogenic diet in dermatologic applications (because, unfortunately, those studies have not been undertaken) but to provide evidence from all available literature to support the need for targeted research and to encourage dermatologists to investigate ketones and their role in treating skin disease, primarily in an adjunctive manner. In doing so, a clearly medicinal diet may gain a foothold in the disease-treatment repertoire and among health-promoting agents of the dermatologist. Given the amount of capital being spent on health care, there is an ever-increasing need for low-cost, safe, and tolerable treatments that can be used for multiple disease processes and to promote health. We believe the ketogenic diet is such an adjunctive therapeutic option, as it has clearly been proven to be tolerable, safe, and efficacious for many people over the last millennia.
We conducted a PubMed search of articles indexed for MEDLINE using varying combinations of the terms ketones, ketogenic, skin, inflammation, metabolic, oxidation, dermatology, and dermatologic and found 12 articles. Herein, we summarize the relevant articles and the works cited by those articles.
Adverse Effects of the Ketogenic Diet
As with all medical therapies, the ketogenic diet is not without risk of adverse effects, which should be communicated at the outset of this article and with patients in the clinic. The only known absolute contraindications to a ketogenic diet are porphyria and pyruvate carboxylase deficiency secondary to underlying metabolic derangements.7 Certain metabolic cytopathies and carnitine deficiency are relative contraindications, and patients with these conditions should be cautiously placed on this diet and closely monitored. Dehydration, acidosis, lethargy, hypoglycemia, dyslipidemia, electrolyte imbalances, prurigo pigmentosa, and gastrointestinal distress may be an acute issue, but these effects are transient and can be managed. Chronic adverse effects are nephrolithiasis (there are recommended screening procedures for those at risk and prophylactic therapies, which is beyond the scope of this article) and weight loss.7
NLRP3 Inflammasome Suppression
Youm et al8 reported their findings in Nature Medicine that β-hydroxybutyrate, a ketone body that naturally circulates in the human body, specifically suppresses activity of the NLRP3 inflammasome. The NLRP3 inflammasome serves as the activating platform for IL-1β.8 Aberrant and elevated IL-1β levels cause or are associated with a number of dermatologic diseases—namely, the autoinflammatory syndromes (familial cold autoinflammatory syndrome, Muckle-Wells syndrome, neonatal-onset multisystemic disease/chronic infantile neurological cutaneous articular syndrome), hyperimmunoglobulinemia D with periodic fever syndrome, tumor necrosis factor–receptor associated periodic syndrome, juvenile idiopathic arthritis, relapsing polychondritis, Schnitzler syndrome, Sweet syndrome, Behçet disease, gout, sunburn and contact hypersensitivity, hidradenitis suppurativa, and metastatic melanoma.7 Clearly, the ketogenic diet may be employed in a therapeutic manner (though to what degree, we need further study) for these dermatologic conditions based on the interaction with the NRLP3 inflammasome and IL-1β.
Acne
A link between acne and diet has long been suspected, but a lack of well-controlled studies has caused only speculation to remain. Recent literature suggests that the effects of insulin may be a notable driver of acne through effects on sex hormones and subsequent effects on sebum production and inflammation. Cordain et al9 discuss the mechanism by which insulin can worsen acne in a valuable article, which Paoli et al10 later corroborated. Essentially, insulin propagates acne by 2 known mechanisms. First, an increase in serum insulin causes a rise in insulinlike growth factor 1 levels and a decrease in insulinlike growth factor binding protein 3 levels, which directly influences keratinocyte proliferation and reduces retinoic acid receptor/retinoid X receptor activity in the skin, causing hyperkeratinization and concomitant abnormal desquamation of the follicular epithelium.9,10 Second, this increase in insulinlike growth factor 1 and insulin causes a decrease in sex hormone–binding globulin and leads to increased androgen production and circulation in the skin, which causes an increase in sebum production. These factors combined with skin that is colonized with Cutibacterium acnes lead to an inflammatory response and the disease known as acne vulgaris.9,10 A ketogenic diet could help ameliorate acne because it results in very little insulin secretion, unlike the typical Western diet, which causes frequent large spikes in insulin levels. Furthermore, the anti-inflammatory effects of ketones would benefit the inflammatory nature of this disease.
DM and Diabetic Skin Disease
Diabetes mellitus carries with it the risk for skin diseases specific to the diabetic disease process, such as increased risk for bacterial and fungal infections, venous stasis, pruritus (secondary to poor circulation), acanthosis nigricans, diabetic dermopathy, necrobiosis lipoidica diabeticorum, digital sclerosis, and bullosis diabeticorum.11 It is well established that better control of DM results in better disease state outcomes.12 The ketogenic diet has shown itself to be a formidable and successful treatment in the diseases of carbohydrate intolerance (eg, metabolic syndrome, insulin resistance, type 2 DM) because of several known mechanisms, including less glucose entering the body and thus less fat deposition, end-product glycation, and free-radical production (discussed below); enhanced fat loss and metabolic efficiency; increased insulin sensitivity; and decreased inflammation.13 Lowering a patient’s insulin resistance through a ketogenic diet may help prevent or treat diabetic skin disease.
Dermatologic Malignancy
A ketogenic diet has been of interest in oncology research as an adjunctive therapy for several reasons: anti-inflammatory effects, antioxidation effects, possible effects on mammalian target of rapamycin (mTOR) regulation,7 and exploitation of the Warburg effect.14 One article discusses how mTOR, a cell-cycle regulator of particular importance in cancer biology, can be influenced by ketones both directly and indirectly through modulating the inflammatory response.7 It has been shown that suppressing mTOR activity limits and slows tumor growth and spread. Ketones also may prove to be a unique method of metabolically exploiting cancer physiology. The Warburg effect, which earned Otto Warburg the Nobel Prize in Physiology or Medicine in 1931, is the observation that cancerous cells produce adenosine triphosphate solely through aerobic glycolysis followed by lactic acid fermentation.14 This phenomenon is the basis of the positron emission tomography scan. There are several small studies of the effects of ketogenic diets on malignancy, and although none of these studies are of substantial size or control, they show that a ketogenic diet can halt or even reverse tumor growth.15 The hypothesis is that because cancer cells cannot metabolize ketones (but normal cells can), the Warburg effect can be taken advantage of through a ketogenic diet to aid in the treatment of malignant disease.14 If further studies find it a formidable treatment, it most certainly would be helpful for the dermatologist involved in the treatment of cutaneous cancers.
Oxidative Stress
Oxidative stress, a state brought about when reactive oxygen species (ROS) production exceeds the antioxidant capacity of the cell and causes damage, is known to be a central part of certain skin diseases (eg, acne, psoriasis, cutaneous malignancy, varicose ulcers, cutaneous allergic reactions, and drug-induced skin photosensitivity).7 There are 2 proven mechanisms by which a ketogenic diet can augment the body’s innate antioxidation capacity. First, ketones activate a potent antioxidant upregulating protein known as NRF2, which is bound in cytosol and remains inactive until activated by certain stimuli (ie, ketones).16 Migration to the nucleus causes transcriptional changes in DNA to upregulate, via a myriad of pathways, antioxidant production in the cell; most notably, it results in increased glutathione levels.17 NRF2 also targets several genes involved in chronic inflammatory skin diseases that cause an increase in the antioxidant capacity.18 As an aside, several foods encouraged on a ketogenic diet also activate NRF2 independently of ketones (eg, coffee, broccoli).19 Second, a ketogenic diet results in fewer produced ROS and an increase in the nicotinamide adenine dinucleotide ratio produced by the mitochondria; in short, it is a more efficient way of producing cellular energy while enhancing mitochondrial function. When fewer ROS are produced, there is less oxidative stress that needs to be attended to by the cell and less cellular damage. Feichtinger et al19 point out that mitochondrial inefficiency and dysfunction often are overlooked components in several skin diseases, and based on the studies discussed above, these diseases may be aided with a ketogenic diet.
Patient Applications
Clearly, a ketogenic diet is therapeutic, and there are many promising potential roles it may play in the treatment of a wide variety of health and disease states through hormonal normalization, antioxidant effects, anti-inflammatory effects, and improvement of metabolic risk factors. However, there are vast limitations to what is known about the ketogenic diet and how it might be employed, particularly by the dermatologist. First, the ketogenic diet lacks a firm definition. Although processed inflammatory vegetable oils and meats are low in carbohydrates and high in fat by definition, it is impossible to argue that they are healthy options for consumption and disease prevention and treatment. Second, nutrigenomics dictates that there must be an individual role in how the diet is employed (eg, patients who are lactose intolerant will need to stay away from dairy). Third, there are no clear proven clinical results from the ketogenic diet in the realm of dermatology. Fourth, as with everything, there are potential detrimental side effects of the ketogenic diet that must be considered for patients (though there are established screening procedures and prophylactic therapies that are beyond the scope of this article). Further, other diets have shown benefit for many other disease states and health promotion purposes (eg, the Mediterranean diet).20 We do not know yet if the avoidance of certain dietary factors such as processed carbohydrates and fats are more beneficial than adopting a state of ketosis at this time, and therefore we are not claiming superiority of one dietary approach over others that are proven to promote health.
Because there are no large-scale studies of the ketogenic diet, there is no verified standardization of initiating and monitoring it, though certain academic centers do have published methods of doing so.21 There are ample anecdotal methods of initiating, maintaining, and monitoring the ketogenic diet.22 In short, drastic restriction of carbohydrate intake and increased fat consumption are the staples of initiating the diet. Medium-chain triglyceride oil supplementation, coffee consumption, intermittent fasting, and low-level aerobic activity also are thought to aid in transition to a ketogenic state. As a result, a dermatologist may recommend that patients interested in this option begin by focusing on fat, fiber, and protein consumption while greatly reducing the amount of carbohydrates in the diet. Morning walks or more intense workouts for fitter patients should be encouraged. Consumption of serum ketone–enhancing foods (eg, coffee, medium-chain triglyceride oil, coconut products) also should be encouraged. A popular beverage known as Bulletproof coffee also may be of interest.23 A blood ketone meter can be used for biofeedback to reinforce these behaviors by aiming for proper β-hydroxybutyrate levels. Numerous companies and websites exist for supporting those patients wishing to pursue a ketogenic state, some hosted by physicians/researchers with others hosted by laypeople with an interest in the topic; discretion should be used as to the clinical and scientific accuracy of these sites. The dermatologist in particular can follow these patients and assess for changes in severity of skin disease, subjective well-being, need for medications and adjunctive therapies, and status of comorbid conditions.
For more information on the ketogenic diet, consider reading the works of the following physicians and researchers who all have been involved with or are currently conducting research in the medical use of ketones and ketogenic diets: David Perlmutter, MD; Thomas Seyfried, PhD; Dominic D’Agostino, PhD; Terry Wahls, MD; Jeff Volek, PhD; and Peter Attia, MD.
Conclusion
Based on the available data, there is potential for use of the ketogenic diet in an adjunctive manner for dermatologic applications, and studies should be undertaken to establish the efficacy or inefficacy of this diet as a preventive measure or treatment of skin disease. With the large push for complementary and alternative therapies over the last decade, particularly for skin disease, the time for research on the ketogenic diet is ripe. Over the coming years, it is our hope that larger clinical, randomized, controlled trials will be conducted for the benefit of dermatology patients worldwide.
- Wheless JW. History of the ketogenic diet. Epilepsia. 2008;49:3-5.
- Stafstrom CE, Rho JM. The ketogenic diet as a treatment paradigm for diverse neurological disorders. Front Pharmacol. 2012;3:59.
- Dashti HM, Mathew TC, Hussein T, et al. Long-term effects of a ketogenic diet in obese patients. Exp Clin Cardiol. 2004;9:200-205.
- Storoni M, Plant GT. The therapeutic potential of the ketogenic diet in treating progressive multiple sclerosis. Mult Scler Int. 2015;2015:681289. doi:10.1155/2015/681289.
- Yancy WS, Foy M, Chalecki AM, et al. A low-carbohydrate, ketogenic diet to treat type 2 diabetes. Nutr Metab (Lond). 2005;2:34.
- Phinney SD. Ketogenic diets and physical performance. Nutr Metab (Lond). 2004;1:2.
- J. The promising potential role of ketones in inflammatory dermatologic disease: a new frontier in treatment research. J Dermatol Treat. 2017;28:484-487.
- Youm YH, Nguyen KY, Grant RW, et al. The ketone metabolite β-hydroxybutyrate blocks NLRP3 inflammasome-mediated inflammatory disease. Nat Med. 2015;21:263-269.
- Cordain L, Lindeberg S, Hurtado M, et al. Acne vulgaris: a disease of western civilization. Arch Dermatol
- Nutrition and acne: therapeutic potential of ketogenic diets. Skin Pharmacol Physiol. 2012;25:111-117.
- American Diabetes Association. Skin complications. http://www.diabetes.org/diabetes/complications/skin-complications. Accessed December 18, 2019.
- Greenapple R. Review of strategies to enhance outcomes for patients with type 2 diabetes: payers’ perspective. Am Health Drug Benefits. 2011;4:377-386.
- Paoli A, Rubini A, Volek JS, et al. Beyond weight loss: a review of the therapeutic uses of very-low-carbohydrate (ketogenic) diets. Eur J Clin Nutr. 2013;67:789-796.
- Allen BG, Bhatia SK, Anderson CM, et al. Ketogenic diets as an adjuvant cancer therapy: history and potential mechanism. Redox Biol. 2014;2:963-970.
- Zhou W, Mukherjee P, Kiebish MA. The calorically restricted ketogenic diet, an effective alternative therapy for malignant brain cancer. Nutr Metab (Lond). 2007;4:5.
- Venugopal R, Jaiswal AK. Nrf1 and Nrf2 positively and c-Fos and Fra1 negatively regulate the human antioxidant response element-mediated expression of NAD(P)H:quinone oxidoreductase1 gene. Proc Natl Acad Sci U S A. 1996;93:14960-14965.
- Milder JB, Liang LP, Patel M. Acute oxidative stress and systemic Nrf2 activation by the ketogenic diet. Neurobiol Dis. 2010:40:238-244.
- Vicente SJ, Ishimoto EY, Torres EA. Coffee modulates transcription factor Nrf2 and highly increases the activity of antioxidant enzymes in rats.J Agric Food Chem. 2014;62:116-122.
- Feichtinger R, Sperl W, Bauer JW, et al. Mitochondrial dysfunction: a neglected component of skin diseases. Exp Dermatol. 2014;23:607-614.
- Brandhorst S, Longo VD. Dietary restrictions and nutrition in the prevention and treatment of cardiovascular disease. Circ Res. 2019;124:952-965.
- Johns Hopkins Medicine. Ketogenic diet therapy for epilepsy. https://www.hopkinsmedicine.org/neurology_neurosurgery/
centers_clinics/epilepsy/pediatric_epilepsy/ketogenic_diet.html. Accessed December 18, 2019. - Bergqvist AG. Long-term monitoring of the ketogenic diet: do’s and don’ts. Epilepsy Res. 2012;100:261-266.
- Bulletproof. Bulletproof coffee: everything you want to know. https://blog.bulletproof.com/how-to-make-your-coffee-bulletproof-and-your-morning-too/. Accessed December 18, 2019.
Practice Points
- The ketogenic diet has been employed since antiquity for varying ailments and has a good safety and efficacy profile if administered by a knowledgeable provider.
- New literature is showing promising potential roles for the ketogenic diet as an adjunctive therapy, particularly in the realm of inflammatory disorders, metabolic diseases, and malignancy.
- The dermatologist should be aware of this diet because it is gaining popularity with physicians and patients alike. Dermatologists also should know how it can potentially benefit a number of patients with dermatologic diseases based on small clinical trials, population studies, and basic science research.

A patient-centered approach to tapering opioids
Many Americans who are treated with prescription opioid analgesics would be better off with less opioid or none at all. To that end, published opioid prescribing guidelines do provide guidance on the mechanics of tapering patients off opioids1-4—but they have a major flaw: They do not adequately account for the fact that people who have a diagnosis of chronic pain are a heterogeneous group and require diagnosis-specific treatment planning. A patient-centered approach to opioid tapers must account for the reality that many people who are given a prescription for an opioid to treat pain have significant mental health conditions—for which opioids act as a psychotropic agent. An opioid taper must therefore address psychological trauma, in particular.5 (See “Tapering and harm-reduction strategies have failed.”6-14)
SIDEBAR
Tapering and harm-reduction strategies have failed
Efforts to address the rising number of overdose events that involve opioids began in earnest in 2010. In a 2011 Government Accountability Office report to Congress, the Drug Enforcement Agency reported that “the number of regulatory investigations (of medical providers who prescribed opioids) tripled between fiscal years 2009- 2010.”6
How has it gone since 2010? High-dosage prescribing of opioids has fallen by 48% since 2011, yet the decline has not reduced overdose events of any kind.7,8 Just the opposite: The 19,000 overdose deaths recorded in 2010 involving any opioid increased to 49,068 by 2017, the National Institute on Drug Abuse reports.9 The increase in opioid overdose deaths is fueled by a recent 9-fold increase in consumption of the synthetic opioid fentanyl: “The rate of drug overdose deaths involving synthetic opioids other than methadone … increased on average by 8% per year from 1999 through 2013 and by 71% per year from 2013 through 2017.”10
These and other statistics document only a modest rise in deaths that involve prescription opioids: from 15,000 in 2010 to 19,000 in 2016.9,10 Since 2010, the crisis of opioid overdose deaths burns hotter, and the pattern of opioid use has shifted from prescription drugs to much deadlier illicit drugs, such as heroin.
Interventions have not been successful overall. Results of research focused on the impact of opioid tapering and harm-reduction strategies implemented this decade are likewise discouraging. In 2018, the US Department of Veterans Affairs reported that opioid discontinuation was not associated with a reduction in overdose but was associated with an increase in suicide.11,12 Von Korff and colleagues, in a 2017 report, concluded that “Long-term implementation of opioid dose and risk reduction initiatives [in Washington state] was not associated with lower rates of prescription opioid use disorder among prevalent [chronic opioid therapy] patients.”13
Evidence suggests that efforts to address the opioid crisis of the past decade have had an effect that is the opposite of what was intended. The federal government recognized this in April 2019 in a Drug Safety Communication: “The US Food and Drug Administration (FDA) has received reports of serious harm in patients who are physically dependent on opioid pain medicines suddenly having these medicines discontinued or the dose rapidly decreased. These include serious withdrawal symptoms, uncontrolled pain, psychological distress, and suicide.”14
In this article, we present an evidence-based consensus approach to opioid tapering for your practice that is informed by a broader understanding of why patients take prescription opioids and why they, occasionally, switch to illicit drugs when their prescription is tapered. This consensus approach is based on the experience of the authors, members of the pain faculty of Project ECHO (Extension for Community Healthcare Outcomes) of the ECHO Institute, a worldwide initiative that uses adult learning techniques and interactive video technology to connect community providers with specialists at centers of excellence in regular real-time collaborative sessions. We are variously experts in pain medicine, primary care, psychology, addiction medicine, pharmacy, behavioral health therapy, occupational medicine, and Chinese medicine.
Why Americans obtain prescription opioids
There are 4 principal reasons why patients obtain prescription opioids, beyond indicated analgesic uses:
1. Patients seek the antianxiety and antidepressant effects of opioids. Multiple converging lines of evidence suggest that antianxiety and antidepressant effects of opioids are a significant reason that patients in the United States persist in requesting prescriptions for opioids:
- In our experience with more than 500 primary care telemedicine case presentations, at least 50% of patients say that the main effect of opioids prescribed for them is “it makes me feel calm” or “more relaxed.”
- In a 2007 survey of 91,823 US residents older than 18 years, nonmedical use of opioids was statistically associated with panic, social anxiety, and depressive symptoms.15
- Ten years later, Von Korff and colleagues found that more than half of opioid prescriptions written in the United States were for the small percentage of patients who have a diagnosis of serious anxiety or depression.13
- In 2016, Yovell and colleagues reported that ultra-low-dosage buprenorphine markedly reduced suicidal ideation over 4 weeks in 62 patients with varied levels of depression.16
There is also mechanistic evidence that the antianxiety and antidepressant effects of opioids are significant reasons Americans persist in requesting prescription opioids. The literature suggests that opioid receptors play a role in mood regulation, including alleviation of depression and anxiety; recent research suggests that oxycodone might be a unique mood-altering drug compared to other common prescription opioids because of its ability to affect mood through the δ opioid receptor.17-20
It should not be a surprise that Americans often turn to opioids to address posttraumatic stress disorder (PTSD), anxiety, and depression. A recent study of the state of the US mental health system concluded that mental health services in the United States are inadequate—despite evidence that > 50% of Americans seek, or consider seeking, treatment for mental health problems for themselves or others.21
2. Patients experience pain unrelated to tissue damage. Rather, they are in pain “for psychological reasons.”22 In 2016, Davis and Vanderah wrote: “We theorize that a functional change in the [central nervous system] can occur in response to certain emotional states or traumatic experiences (eg, child abuse, assault, accidents).” They connect this change to central sensitization and a reduced pain-perception threshold,23 and strongly suspect that many patients with chronic pain have undiagnosed and untreated psychological trauma that has changed the way their central nervous system processes sensory stimuli. The authors call this “trauma-induced hyperalgesia.”
Continue to: Psychological trauma...
Psychological trauma is uniquely capable of producing hyperalgesia, compared to anxiety or depression. In a study of veterans, Defrin and colleagues demonstrated hyperalgesia in patients who had a diagnosis of PTSD but not in controls group who had an anxiety disorder only.24
To support successful opioid tapering, trauma-induced hyperalgesia, when present, must be addressed. Treatment of what the International Association for the Study of Pain calls “pain due to psychological factors”22 requires specific trauma therapy. However, our experience validates what researchers have to say about access to treatment of psychological trauma in the United States: “…[C]linical research has identified certain psychological interventions that effectively ameliorate the symptoms of PTSD. But most people struggling with PTSD don’t receive those treatments.”25
We have no doubt that this is due, in part, to underdiagnosis of psychological trauma, even in mental health clinics. According to Miele and colleagues, “PTSD remains largely undiagnosed and undertreated in mental health outpatients, even in teaching hospitals, with diagnosis rates as low as 4% while published prevalence is between 7% and 50% in this population.”26
3. Patients suffer from opioid use disorder (OUD) and complain of pain to obtain opioids by prescription. For patients with OUD, their use is out of control; they devote increasing mental and physical resources to obtaining, using, and recovering from substances; and they continue to use despite adverse consequences.27 The prevalence of OUD in primary care clinics varies strikingly by the location of clinics. In Washington state, the prevalence of moderate and severe OUD in a large population of patients who had been prescribed opioids through primary care clinics was recently determined to be between 21.5% and 23.9%.13
4. Patients are obtaining opioid prescriptions for people other than themselves. While this is a reason that patients obtain opioid prescriptions, it is not necessarily common. Statistics show that the likelihood of a prescription being diverted intentionally is low: Dart and colleagues found that diversion has become uncommon in the general population.28
Continue to: Why we taper opioid analgesics
Why we taper opioid analgesics
Reasons for an opioid taper include concern that the patient has, or will develop, an OUD; will experience accidental or intentional overdose; might be diverting opioids; is not benefiting from opioid therapy for pain; or is experiencing severe adverse effects. A patient who has nociceptive pain and might have opioid-induced hyperalgesia will require a much different opioid taper plan than a patient with untreated PTSD or a patient with severe OUD.
Misunderstanding can lead to inappropriate tapering
We often encounter primary care providers who believe that a large percentage of patients on chronic opioid therapy inevitably develop OUD. This is a common reason for initiating opioid taper. Most patients on a chronic opioid do become physically dependent, but only a small percentage of patients develop psychological dependence (ie, addiction or OUD).29
Physical dependence is “a state of adaptation that is manifested by a drug class–specific withdrawal syndrome that can be produced by abrupt cessation, rapid dose reduction, decreasing blood level of the drug, and/or administration of an antagonist.”30 Symptoms of opioid withdrawal include muscle aches; abdominal cramping; increased lacrimation, rhinorrhea, and perspiration; diarrhea; agitation and anxiety; insomnia; and piloerection. Opioid withdrawal symptoms are caused by physical dependence, not by addiction. They can be mitigated by tapering slowly and instituting adjuvant medications, such as clonidine, to attenuate symptoms.
Psychological dependence, or addiction (that is, OUD, as described in the Diagnostic and Statistical Manual of Mental Disorders 5th edition27), comprises primarily 3 behavioral criteria:
- Loss of control of the medication, with compulsive use
- Continued use despite adverse consequences of using opioids, such as arrest for driving under the influence and deterioration of social, family, or work performance
- Obsession or preoccupation with obtaining and using the substance. In properly selected chronic opioid therapy patients, there is evidence that new-onset OUD is not as common as has been thought. A recent study of the risk for opioid addiction after use of an opioid for ≥ 90 days for chronic noncancer pain found that the absolute rate of de novo OUD among patients treated for 90 days was 0.72%.29 A systematic review by Fishbain and colleagues of 24 studies of opioid-exposed patients found a risk of 3.27% overall—0.19% for patients who did not have a history of abuse or addiction.31 As Director of the National Institute on Drug Abuse Norma Volkow, MD, wrote in 2016: “Addiction occurs in only a small percentage of people who are exposed to opioids—even among those with preexisting vulnerabilities.”32
Assessment should focus on why the patient is taking an opioid
A strong case can be made that less opioid is better for many of the people for whom these medications are prescribed for chronic noncancer pain. However, a one-size-fits-all dosage reduction and addiction-focused approach to opioid tapering has not worked: The assessment and treatment paradigm must change, in our view.
Continue to: During assessment...
During assessment, we must adopt the means to identify the reason that a patient is using a prescription opioid. It is of particular importance that we identify patients using opioids for their psychotropic properties, particularly when the goal is to cope with the effects of psychological trauma. The subsequent treatment protocol will then need to include time for effective, evidence-based behavioral health treatment of anxiety, PTSD, or depression. If opioids are serving primarily as psychotropic medication, an attempt to taper before establishing effective behavioral health treatment might lead the patient to pursue illegal means of procuring opioid medication.
We acknowledge that primary care physicians are not reimbursed for trauma screening and that evidence-based intensive trauma treatment is generally unavailable in the United States. Both of these shortcomings must be corrected if we want to stem the opioid crisis.
If diversion is suspected and there is evidence that the patient is not currently taking prescribed opioids (eg, a negative urine drug screen), discontinuing the opioid prescription is the immediate next step for the sake of public safety.
SIDEBAR
2 decisions to make before continuing to prescribe an opioid for chronic noncancer pain
#1 Should I provide the patient with a prescription for an opioid for a few days, while I await more information?a
Yes. Writing a prescription is a reasonable decision if all of the following apply:
- You do not have significant suspicion of diversion (based on a clinical interview).
- You do not suspect an active addiction disorder, based on the score of the 10-question Drug Abuse Screening Test (DAST-10) and on a clinical interview. (DAST-10 is available at: https://cde.drugabuse.gov/instrument/e9053390-ee9c-9140-e040-bb89ad433d69.)
- The patient is likely to experience withdrawal symptoms if you don’t provide the medication immediately.
- The patient’s pain and function are likely to be impaired if you do not provide the medication.
- The patient does not display altered mental status during the visit (eg, drowsy, slurred speech).
No. If writing a prescription for an opioid for a few days does not seem to be a reasonable decision because the criteria above are not met, but withdrawal symptoms are likely, you can prescribe medication to mitigate symptoms or refer the patient for treatment of withdrawal.
#2 I’ve decided to provide the patient with a prescription for an opioid. For how many days should I write it?
The usual practice, for a patient whose case is familiar to you, is to prescribe a 1-month supply.
However, if any 1 of the following criteria is met, prescribing a 1-month supply is unsafe under most circumstances:
- An unstable social or living environment places the patient at risk by possessing a supply of opioids (based on a clinical interview).
- You suspect an unstable or severe behavioral health condition or a mental health diagnosis (based on a clinical interview or on the patient record from outside your practice).
- The patient scores as “high risk” on the Opioid Risk Tool (ORT; www.drugabuse.gov/sites/default/files/files/OpioidRiskTool.pdf), Screener and Opioid Assessment for Patients with Pain–Revised (SOAPP-R; www.ncbi.nlm.nih.gov/pmc/articles/PMC4706778/), or a similar opioid risk assessment tool.
When 1 or more of these exclusionary criteria are met, you have 3 options:
- Prescribe an opioid for a brief duration and see the patient often.
- Do not prescribe an opioid; instead, refer the patient as necessary for treatment of withdrawal.
- Refer the patient for treatment of the underlying behavioral health condition.
a Additional information might include findings from consultants you’ve engaged regarding the patient’s diagnosis; a response to your call from a past prescriber; urine drug screen results; and results of a prescription monitoring program check.

Considering a taper? Take this 5-step approach
Once it appears that tapering an opioid is indicated, we propose that you take the following steps:
- Establish whether it is safe to continue prescribing (follow the route provided in “2 decisions to make before continuing to prescribe an opioid for chronic noncancer pain”); if continuing it is not safe, take steps to protect the patient and the community
- Determine whether assessment by a trauma-informed behavioral health expert is needed, assuming that, in your judgment, it is safe to continue the opioid (TABLE33). When behavioral health assessment is needed, you need 3 questions answered by that assessment: (1) Are psychological factors present that might put the patient at risk during an opioid taper? (2) What are those factors? (3) What needs to done about them before the taper is started? Recalling that psychological trauma often is not assessed by behavioral health colleagues, it is necessary to provide the behavioral health provider with a specific request to assess trauma burden, and state the physical diagnoses that are causing pain or provide a clear statement that no such diagnoses can be made. (See the FIGURE, which we developed in conjunction with behavioral health colleagues to help the consultant understand what the primary care physician needs from a behavioral health assessment.)
- Obtain consultation from a physical therapist, pain medicine specialist, and, if possible, an alternative or complementary medicine provider to determine what nonpharmacotherapeutic modalities can be instituted to treat pain before tapering the opioid.
- Initiate the Screening, Brief Intervention and Referral to Treatment (SBIRT) approach if OUD is suspected (www.samhsa.gov/sbirt).34 This motivational interviewing tool identifies patients with a substance use disorder, severity of use, and appropriate level of treatment. (If OUD is suspected during assessment, next steps are to stop prescribing and implement harm-reduction strategies, such as primary care level medically assisted treatment [MAT] with buprenorphine, followed by expert behavioral health-centered addiction treatment.)
- Experiment with dosage reduction according to published guidance, if (1) psychological factors are absent or have been adequately addressed, according to the behavioral health consultant, and (2) nonpharmacotherapeutic strategies are in place.8-11

Shifting to a patient-centered approach
The timing and choice of opioid tapers, in relation to harm reduction and intervention targeting the root cause of a patient’s complaint of pain, have not been adequately explored. In our practice, we’ve shifted from an addiction-centered, dosage-centered approach to opioid taper to a patient-centered approach35 that emphasizes behavioral-medical integration—an approach that we broadly endorse. Such an approach (1) is based on a clear understanding of why the patient is taking opioid pain medication, (2) engages medical and complementary or alternative medicine specialists, (3) addresses underdiagnosis of psychological trauma, and (4) requires a quantum leap in access to trauma-specific behavioral health treatment resources. 36
Continue to: To underscore the case...
To underscore the case for shifting to a patient-centered approach35 we present sample cases in “How a patient-centered approach to tapering opioids looks in practice.”
SIDEBAR
How a patient-centered approach to tapering opioids looks in practice
Five hypothetical cases illustrate what might happen when a practice shifts from an addiction-centered, dosage-centered approach to one that places the individual at the center of care.
CASE #1: Brett F
Mr. F appears to use medication responsibly; benefits functionally from an opioid; has tolerable adverse effects; does not have significant psychosocial risk factors (based on the score of the Opioid Risk Tool [ORT] or the Screener and Opioid Assessment for Patients with Pain–Revised [SOAPP-R]); and is engaged in effective self-management. Most of Mr. F’s pain is thought to have a nociceptive or neuropathic source.
Mr F could reasonably contemplate continuing current opioid treatment.
Action: If the daily morphine milligram equivalent (MME) dosage is high, Mr. F should be referred to a pain medicine specialist. We recommend a periodic (at least annually) empiric trial of dosage reduction to see whether he is indeed best served by the current dosage.
CASE #2: Brett F (version 2.0)
Envision Mr. F having the same profile in all respects except that he is not engaged in effective self-management.
Optimal treatment of chronic pain often requires supplemental modalities beyond opioids.
Action: Physical therapy; an individualized, ongoing exercise regimen; interventional procedures; weight loss (if the patient is obese); smoking cessation; and improving coping skills for anxiety and depression without pharmacotherapy might not only temporarily alleviate the pain but, over time, improve Mr. F’s physical condition.
If Mr. F is not willing to do more than take the prescribed opioids, nothing is likely to change: Over time, his condition is likely to deteriorate. A patient like Mr. F can be harmed if opioids continue to be prescribed for him long-term.
Further action: If Mr. F won’t engage in broadening the approach to treating his pain, the opioid medication should be tapered, in his long-term best interest. A carrot-and-stick approach can facilitate Mr. F’s involvement in his care.
CASE #3: Clark S
Mr. S has a significant psychosocial component driving his pain: depression.a
Prescribing opioids without addressing the root cause of trauma is not in the patient’s best interest.
Action: Because of Mr. S’s depression, refer him to a behavioral health provider. If you determine that he is emotionally stable, wait until he is engaged in trauma treatment to begin the taper. If he appears unstable (eg, crying in the office, recent psychological stressors, recent impulsive behaviors, poor insight) consider (1) urgent behavioral health referral and (2) prescribing only enough opioid medication (ie, at close intervals) to prevent withdrawal and panic. Consider whether a psychotropic medication might be of benefit (eg, a serotonin–norepinephrine reuptake inhibitor or selective serotonin reuptake inhibitor).
Further action: Harm-reduction steps, such as close monitoring and, perhaps, a change to a buprenorphine product, is indicated, especially when the patient is overwhelmed by recent psychosocial stressors. Harm-reduction treatment is available through Medication-Assisted Therapy (MAT) programs; however, patients often run into difficulty obtaining access to these programs because regulations and laws restrict MAT to patients who have a diagnosis of opioid use disorder (OUD) and because some health plans and pharmacy benefit managers require prior authorization.
CASE #4: Gloria B
Ms. B isn’t managing her medications responsibly—although you don’t suspect OUD.
When a patient has shown the inability to manage opioid medication responsibly, you should delve into the reason to determine your next step.
Action: Evaluate Ms. B for a cognitive disorder or a thought disorder. Alternatively, as in the case of Mr. S, a psychosocial component might underlie her pain; in that case, the same recommendations can be made for her. In addition, you can propose that she identify a responsible person to dispense her medication.
CASE #5: Nicole L
You suspect that Ms. L, who is taking opioid medication to alleviate pain, also has a substance use disorder.
Action: Implement harm-reduction early for Ms. L: Obtain addiction medicine consultation and implement behavioral health strategies for addiction treatment.
A key characteristic of a substance use disorder is loss of control over use of the substance. A patient like Ms. L—who is in pain and who has an active OUD—cannot be expected to manage her opioid use responsibly.
Further action: We recommend that Ms. L be referred to an addiction specialist for MAT. Evidence of the harmreduction benefit of MAT is sufficient to strongly recommend it. Continue any other treatment modalities for pain that Ms. L has been using, such as non-opioid medication, physical therapy, alternative treatments, and behavioral therapy, or begin such treatments as appropriate.
a Depression is not the only psychosocial component that can underlie pain. Others include anxiety, posttraumatic stress disorder, and grief.
An eye toward the future. To inform future approaches to opioid tapering, more resources need to be deployed to
- support screening and risk stratification for PTSD, anxiety, and related disorders at the primary care level,
- continue the effort to identify and treat OUD,
- develop best-practice responses to screening, and
- make harm-reduction strategies that are now reserved for patients with OUD available to those who don't have OUD.
We urge that research be pursued into best practices for chronic pain interventions that target psychological trauma, anxiety, and depression.
CORRESPONDENCE
Bennet Davis MD, 2092 East Calle de Dulcinea, Tucson, AZ 85718; [email protected].
1. Centers for Disease Control and Prevention. Pocket guide: tapering for chronic pain. https://www.cdc.gov/drugoverdose/pdf/clinical_pocket_guide_tapering-a.pdf. Accessed November 25, 2019.
2. Kral LA, Jackson K, Uritsky TJ. A practical guide to tapering opioids. Ment Health Clin. 2015;5:102-108.
3. Murphy L, Babaei-Rad R, Buna D, et al. Guidance on opioid tapering in the context of chronic pain: evidence, practical advice and frequently asked questions. Can Pharm J (Ott). 2018;151:114-120.
4. Berna C, Kulich RJ, Rathmell JP. Tapering long-term opioid therapy in chronic noncancer pain: evidence and recommendations for everyday practice. Mayo Clin Proc. 2005;90:828-842.
5. Davis M. Prescription opioid use among adults with mental health disorders in the United States. J Am Board Fam Med. 2017;30:407-417.
6. US Government Accountability Office. Report to Congressional Requestors. Prescription drug control: DEA has enhanced efforts to combat diversion, but could better assess and report program results. August 2011. www.gao.gov/assets/520/511464.pdf. Accessed November 25, 2019.
7. National Center for Injury Prevention and Control, Centers for Disease Control and Prevention. Annual surveillance report of drug-related risks and outcomes. United States, 2017. www.cdc.gov/drugoverdose/pdf/pubs/2017-cdc-drug-surveillance-report.pdf. Accessed November 25, 2019.
8. Hedegaard H, Warner M, Miniño AM. Drug overdose deaths in the United States, 1999-2016, NCHS Data Brief No. 294. December 21, 2017. Hyattsville, MD: National Center for Health Statistics. www.cdc.gov/nchs/products/databriefs/db294.htm. Accessed November 25, 2019.
9. Overdose death rates. Bethesda, MD: National Institute on Drug Abuse. January 2019. www.drugabuse.gov/related-topics/trends-statistics/overdose-death-rates. Accessed November 25, 2019.
10. Hedegaard H, Miniño AM, Warner M. Drug overdose deaths in the United States, 1999-2017. NCHS Data Brief No. 329. November 2018. Hyattsville, MD: National Center for Health Statistics. www.cdc.gov/nchs/data/databriefs/db329-h.pdf . Accessed November 25, 2019.
11. Manhapra A, Kertesz S, Oliva A, et al. VA data about Rx opioids and overdose and suicide: clinical implications. Presented at the 2018 National Rx Drug Abuse and Heroin Summit, Atlanta Georgia, April 4, 2018.
12. Demidenko M, Dobscha SK, Morasco BJ, et al. Suicidal ideation and suicidal self-directed violence following clinician-initiated prescription opioid discontinuation among long-term opioid users. Gen Hosp Psychiatry. 2017;47:29-35.
13. Von Korff M, Walker RL, Saunders K, et al. Prevalence of prescription opioid use disorder among chronic opioid therapy patients after health plan opioid dose and risk reduction initiatives. Int J Drug Policy. 2017;46:90-98.
14. United States Food and Drug Administration. FDA Drug Safety Communication: FDA identifies harm reported from sudden discontinuation of opioid pain medicines and requires label changes to guide prescribers on gradual, individualized tapering. April 9, 2019. www.fda.gov/Drugs/DrugSafety/ucm635038.htm. Accessed November 25, 2019.
15. Becker W, Sullivan LE, Tetrault JM, et al. Non-medical use, abuse and dependence on prescription opioids among U.S. adults: psychiatric, medical and substance use correlates. Drug Alcohol Depend. 2008;94:38-47.
16. Yovell Y, Bar G, Mashiah M, et al. Ultra-low-dose buprenorphine as a time-limited treatment for severe suicidal ideation: a randomized controlled trial. Am J Psychiatry. 2016;173:491-498.
17. Pradhan AA, Befort K, Nozaki C, et al. The delta opioid receptor: an evolving target for the treatment of brain disorders. Trends Pharmacol Sci. 2011;32:581-590.
18. Sugiyama A, Yamada M, Saitoh A, et al. Administration of a delta opioid receptor agonist KNT-127 to the basolateral amygdala has robust anxiolytic-like effects in rats. Psychopharmacology (Berl). 2018;235:2947-2955.
19. Richards EM, Mathews DC, Luckenbaugh DA, et al. A randomized, placebo-controlled pilot trial of the delta opioid receptor agonist AZD2327 in anxious depression. Psychopharmacology (Berl). 2016;233:1119-1130.
20. Yang PP, Yeh GC, Yeh TK, et al. Activation of delta-opioid receptor contributes to the antinociceptive effect of oxycodone in mice. Pharmacol Res. 2016;111:867-876.
21. America’s mental health 2018. Stamford, CT: Cohen Veterans Network. October 10, 2018. https://www.cohenveteransnetwork.org/wp-content/uploads/2018/10/Research-Summary-10-10-2018.pdf. Accessed November 25, 2019.
22. Classification of Chronic Pain, Second Edition (Revised). Washington, DC: International Association for the Study of Pain. Updated 2012. www.iasp-pain.org/PublicationsNews/Content.aspx?ItemNumber=1673. Accessed November 25, 2019.
23. Davis B, Vanderah TW. A new paradigm for pain? J Fam Pract. 2016 65:598-605.
24. Defrin R, Ginzburg K, Solomon Z, et al. Quantitative testing of pain perception in subjects with PTSD—implications for the mechanism of the coexistence between PTSD and chronic pain. Pain. 2008;138:450-459.
25. Foa EB, Gillihan SJ, Bryant RA. Challenges and successes in dissemination of evidence-based treatments for posttraumatic stress: lessons learned from prolonged exposure therapy for PTSD. Psychol Science Public Interest. 2013;14:65-111.
26. Miele D, O’Brien EJ. Underdiagnosis of posttraumatic stress disorder in at risk youth. J Trauma Stress. 2010;23:591-598.
27. American Psychiatric Association. Diagnostic and Statistical Manual of Mental Disorders. 5th edition. Washington, DC: American Psychiatric Publishing; 2013:541.
28. Dart RC, Surratt HL, Cicero TJ, et al. Trends in opioid analgesic abuse and mortality in the United States. N Engl J Med. 2015;372:241-248.
29. Schuchat A, Houry D, Guy GP Jr. New data on opioid use and prescribing in the United States. JAMA. 2017;318:425-426.
30. American Academy of Pain Medicine, American Pain Society, American Society of Addiction Medicine. Definitions related to the use of opioids for the treatment of pain. 2001. www.naabt.org/documents/APS_consensus_document.pdf. Accessed November 25, 2019.
31. Fishbain DA, Cole B, Lewis J, et al. What percentage of chronic nonmalignant pain patients exposed to chronic opioid analgesic therapy develop abuse/addiction and/or aberrant drug-related behaviors? A structured evidence-based review. Pain Med. 2008;9:444-459.
32. Volkow ND, McClellan AT. Opioid abuse in chronic pain—misconceptions and mitigation strategies. N Engl J Med. 2016;374:1253-1263.
33. Treede RD, Rief W, Barke A. A classification of chronic pain for ICD-11. Pain. 2015;156:1003-1007.
34. Screening, brief intervention, and referral to treatment (SBIRT). Rockville, MD: Substance Abuse and Mental Health Services Administration. www.samhsa.gov/sbirt. Accessed November 25, 2019.
35. Schneider JP, Davis B. How well do you know your patient? Pract Pain Manag. 2017;17(2). www.practicalpainmanagement.com/resources/practice-management/how-well-do-you-know-your-patient. Accessed November 25, 2019.
36. Schneider JP. A patient-centered approach to the opioid overdose crisis. J Miss State Med Assoc. 2018;59:232-233.
Many Americans who are treated with prescription opioid analgesics would be better off with less opioid or none at all. To that end, published opioid prescribing guidelines do provide guidance on the mechanics of tapering patients off opioids1-4—but they have a major flaw: They do not adequately account for the fact that people who have a diagnosis of chronic pain are a heterogeneous group and require diagnosis-specific treatment planning. A patient-centered approach to opioid tapers must account for the reality that many people who are given a prescription for an opioid to treat pain have significant mental health conditions—for which opioids act as a psychotropic agent. An opioid taper must therefore address psychological trauma, in particular.5 (See “Tapering and harm-reduction strategies have failed.”6-14)
SIDEBAR
Tapering and harm-reduction strategies have failed
Efforts to address the rising number of overdose events that involve opioids began in earnest in 2010. In a 2011 Government Accountability Office report to Congress, the Drug Enforcement Agency reported that “the number of regulatory investigations (of medical providers who prescribed opioids) tripled between fiscal years 2009- 2010.”6
How has it gone since 2010? High-dosage prescribing of opioids has fallen by 48% since 2011, yet the decline has not reduced overdose events of any kind.7,8 Just the opposite: The 19,000 overdose deaths recorded in 2010 involving any opioid increased to 49,068 by 2017, the National Institute on Drug Abuse reports.9 The increase in opioid overdose deaths is fueled by a recent 9-fold increase in consumption of the synthetic opioid fentanyl: “The rate of drug overdose deaths involving synthetic opioids other than methadone … increased on average by 8% per year from 1999 through 2013 and by 71% per year from 2013 through 2017.”10
These and other statistics document only a modest rise in deaths that involve prescription opioids: from 15,000 in 2010 to 19,000 in 2016.9,10 Since 2010, the crisis of opioid overdose deaths burns hotter, and the pattern of opioid use has shifted from prescription drugs to much deadlier illicit drugs, such as heroin.
Interventions have not been successful overall. Results of research focused on the impact of opioid tapering and harm-reduction strategies implemented this decade are likewise discouraging. In 2018, the US Department of Veterans Affairs reported that opioid discontinuation was not associated with a reduction in overdose but was associated with an increase in suicide.11,12 Von Korff and colleagues, in a 2017 report, concluded that “Long-term implementation of opioid dose and risk reduction initiatives [in Washington state] was not associated with lower rates of prescription opioid use disorder among prevalent [chronic opioid therapy] patients.”13
Evidence suggests that efforts to address the opioid crisis of the past decade have had an effect that is the opposite of what was intended. The federal government recognized this in April 2019 in a Drug Safety Communication: “The US Food and Drug Administration (FDA) has received reports of serious harm in patients who are physically dependent on opioid pain medicines suddenly having these medicines discontinued or the dose rapidly decreased. These include serious withdrawal symptoms, uncontrolled pain, psychological distress, and suicide.”14
In this article, we present an evidence-based consensus approach to opioid tapering for your practice that is informed by a broader understanding of why patients take prescription opioids and why they, occasionally, switch to illicit drugs when their prescription is tapered. This consensus approach is based on the experience of the authors, members of the pain faculty of Project ECHO (Extension for Community Healthcare Outcomes) of the ECHO Institute, a worldwide initiative that uses adult learning techniques and interactive video technology to connect community providers with specialists at centers of excellence in regular real-time collaborative sessions. We are variously experts in pain medicine, primary care, psychology, addiction medicine, pharmacy, behavioral health therapy, occupational medicine, and Chinese medicine.
Why Americans obtain prescription opioids
There are 4 principal reasons why patients obtain prescription opioids, beyond indicated analgesic uses:
1. Patients seek the antianxiety and antidepressant effects of opioids. Multiple converging lines of evidence suggest that antianxiety and antidepressant effects of opioids are a significant reason that patients in the United States persist in requesting prescriptions for opioids:
- In our experience with more than 500 primary care telemedicine case presentations, at least 50% of patients say that the main effect of opioids prescribed for them is “it makes me feel calm” or “more relaxed.”
- In a 2007 survey of 91,823 US residents older than 18 years, nonmedical use of opioids was statistically associated with panic, social anxiety, and depressive symptoms.15
- Ten years later, Von Korff and colleagues found that more than half of opioid prescriptions written in the United States were for the small percentage of patients who have a diagnosis of serious anxiety or depression.13
- In 2016, Yovell and colleagues reported that ultra-low-dosage buprenorphine markedly reduced suicidal ideation over 4 weeks in 62 patients with varied levels of depression.16
There is also mechanistic evidence that the antianxiety and antidepressant effects of opioids are significant reasons Americans persist in requesting prescription opioids. The literature suggests that opioid receptors play a role in mood regulation, including alleviation of depression and anxiety; recent research suggests that oxycodone might be a unique mood-altering drug compared to other common prescription opioids because of its ability to affect mood through the δ opioid receptor.17-20
It should not be a surprise that Americans often turn to opioids to address posttraumatic stress disorder (PTSD), anxiety, and depression. A recent study of the state of the US mental health system concluded that mental health services in the United States are inadequate—despite evidence that > 50% of Americans seek, or consider seeking, treatment for mental health problems for themselves or others.21
2. Patients experience pain unrelated to tissue damage. Rather, they are in pain “for psychological reasons.”22 In 2016, Davis and Vanderah wrote: “We theorize that a functional change in the [central nervous system] can occur in response to certain emotional states or traumatic experiences (eg, child abuse, assault, accidents).” They connect this change to central sensitization and a reduced pain-perception threshold,23 and strongly suspect that many patients with chronic pain have undiagnosed and untreated psychological trauma that has changed the way their central nervous system processes sensory stimuli. The authors call this “trauma-induced hyperalgesia.”
Continue to: Psychological trauma...
Psychological trauma is uniquely capable of producing hyperalgesia, compared to anxiety or depression. In a study of veterans, Defrin and colleagues demonstrated hyperalgesia in patients who had a diagnosis of PTSD but not in controls group who had an anxiety disorder only.24
To support successful opioid tapering, trauma-induced hyperalgesia, when present, must be addressed. Treatment of what the International Association for the Study of Pain calls “pain due to psychological factors”22 requires specific trauma therapy. However, our experience validates what researchers have to say about access to treatment of psychological trauma in the United States: “…[C]linical research has identified certain psychological interventions that effectively ameliorate the symptoms of PTSD. But most people struggling with PTSD don’t receive those treatments.”25
We have no doubt that this is due, in part, to underdiagnosis of psychological trauma, even in mental health clinics. According to Miele and colleagues, “PTSD remains largely undiagnosed and undertreated in mental health outpatients, even in teaching hospitals, with diagnosis rates as low as 4% while published prevalence is between 7% and 50% in this population.”26
3. Patients suffer from opioid use disorder (OUD) and complain of pain to obtain opioids by prescription. For patients with OUD, their use is out of control; they devote increasing mental and physical resources to obtaining, using, and recovering from substances; and they continue to use despite adverse consequences.27 The prevalence of OUD in primary care clinics varies strikingly by the location of clinics. In Washington state, the prevalence of moderate and severe OUD in a large population of patients who had been prescribed opioids through primary care clinics was recently determined to be between 21.5% and 23.9%.13
4. Patients are obtaining opioid prescriptions for people other than themselves. While this is a reason that patients obtain opioid prescriptions, it is not necessarily common. Statistics show that the likelihood of a prescription being diverted intentionally is low: Dart and colleagues found that diversion has become uncommon in the general population.28
Continue to: Why we taper opioid analgesics
Why we taper opioid analgesics
Reasons for an opioid taper include concern that the patient has, or will develop, an OUD; will experience accidental or intentional overdose; might be diverting opioids; is not benefiting from opioid therapy for pain; or is experiencing severe adverse effects. A patient who has nociceptive pain and might have opioid-induced hyperalgesia will require a much different opioid taper plan than a patient with untreated PTSD or a patient with severe OUD.
Misunderstanding can lead to inappropriate tapering
We often encounter primary care providers who believe that a large percentage of patients on chronic opioid therapy inevitably develop OUD. This is a common reason for initiating opioid taper. Most patients on a chronic opioid do become physically dependent, but only a small percentage of patients develop psychological dependence (ie, addiction or OUD).29
Physical dependence is “a state of adaptation that is manifested by a drug class–specific withdrawal syndrome that can be produced by abrupt cessation, rapid dose reduction, decreasing blood level of the drug, and/or administration of an antagonist.”30 Symptoms of opioid withdrawal include muscle aches; abdominal cramping; increased lacrimation, rhinorrhea, and perspiration; diarrhea; agitation and anxiety; insomnia; and piloerection. Opioid withdrawal symptoms are caused by physical dependence, not by addiction. They can be mitigated by tapering slowly and instituting adjuvant medications, such as clonidine, to attenuate symptoms.
Psychological dependence, or addiction (that is, OUD, as described in the Diagnostic and Statistical Manual of Mental Disorders 5th edition27), comprises primarily 3 behavioral criteria:
- Loss of control of the medication, with compulsive use
- Continued use despite adverse consequences of using opioids, such as arrest for driving under the influence and deterioration of social, family, or work performance
- Obsession or preoccupation with obtaining and using the substance. In properly selected chronic opioid therapy patients, there is evidence that new-onset OUD is not as common as has been thought. A recent study of the risk for opioid addiction after use of an opioid for ≥ 90 days for chronic noncancer pain found that the absolute rate of de novo OUD among patients treated for 90 days was 0.72%.29 A systematic review by Fishbain and colleagues of 24 studies of opioid-exposed patients found a risk of 3.27% overall—0.19% for patients who did not have a history of abuse or addiction.31 As Director of the National Institute on Drug Abuse Norma Volkow, MD, wrote in 2016: “Addiction occurs in only a small percentage of people who are exposed to opioids—even among those with preexisting vulnerabilities.”32
Assessment should focus on why the patient is taking an opioid
A strong case can be made that less opioid is better for many of the people for whom these medications are prescribed for chronic noncancer pain. However, a one-size-fits-all dosage reduction and addiction-focused approach to opioid tapering has not worked: The assessment and treatment paradigm must change, in our view.
Continue to: During assessment...
During assessment, we must adopt the means to identify the reason that a patient is using a prescription opioid. It is of particular importance that we identify patients using opioids for their psychotropic properties, particularly when the goal is to cope with the effects of psychological trauma. The subsequent treatment protocol will then need to include time for effective, evidence-based behavioral health treatment of anxiety, PTSD, or depression. If opioids are serving primarily as psychotropic medication, an attempt to taper before establishing effective behavioral health treatment might lead the patient to pursue illegal means of procuring opioid medication.
We acknowledge that primary care physicians are not reimbursed for trauma screening and that evidence-based intensive trauma treatment is generally unavailable in the United States. Both of these shortcomings must be corrected if we want to stem the opioid crisis.
If diversion is suspected and there is evidence that the patient is not currently taking prescribed opioids (eg, a negative urine drug screen), discontinuing the opioid prescription is the immediate next step for the sake of public safety.
SIDEBAR
2 decisions to make before continuing to prescribe an opioid for chronic noncancer pain
#1 Should I provide the patient with a prescription for an opioid for a few days, while I await more information?a
Yes. Writing a prescription is a reasonable decision if all of the following apply:
- You do not have significant suspicion of diversion (based on a clinical interview).
- You do not suspect an active addiction disorder, based on the score of the 10-question Drug Abuse Screening Test (DAST-10) and on a clinical interview. (DAST-10 is available at: https://cde.drugabuse.gov/instrument/e9053390-ee9c-9140-e040-bb89ad433d69.)
- The patient is likely to experience withdrawal symptoms if you don’t provide the medication immediately.
- The patient’s pain and function are likely to be impaired if you do not provide the medication.
- The patient does not display altered mental status during the visit (eg, drowsy, slurred speech).
No. If writing a prescription for an opioid for a few days does not seem to be a reasonable decision because the criteria above are not met, but withdrawal symptoms are likely, you can prescribe medication to mitigate symptoms or refer the patient for treatment of withdrawal.
#2 I’ve decided to provide the patient with a prescription for an opioid. For how many days should I write it?
The usual practice, for a patient whose case is familiar to you, is to prescribe a 1-month supply.
However, if any 1 of the following criteria is met, prescribing a 1-month supply is unsafe under most circumstances:
- An unstable social or living environment places the patient at risk by possessing a supply of opioids (based on a clinical interview).
- You suspect an unstable or severe behavioral health condition or a mental health diagnosis (based on a clinical interview or on the patient record from outside your practice).
- The patient scores as “high risk” on the Opioid Risk Tool (ORT; www.drugabuse.gov/sites/default/files/files/OpioidRiskTool.pdf), Screener and Opioid Assessment for Patients with Pain–Revised (SOAPP-R; www.ncbi.nlm.nih.gov/pmc/articles/PMC4706778/), or a similar opioid risk assessment tool.
When 1 or more of these exclusionary criteria are met, you have 3 options:
- Prescribe an opioid for a brief duration and see the patient often.
- Do not prescribe an opioid; instead, refer the patient as necessary for treatment of withdrawal.
- Refer the patient for treatment of the underlying behavioral health condition.
a Additional information might include findings from consultants you’ve engaged regarding the patient’s diagnosis; a response to your call from a past prescriber; urine drug screen results; and results of a prescription monitoring program check.
Considering a taper? Take this 5-step approach
Once it appears that tapering an opioid is indicated, we propose that you take the following steps:
- Establish whether it is safe to continue prescribing (follow the route provided in “2 decisions to make before continuing to prescribe an opioid for chronic noncancer pain”); if continuing it is not safe, take steps to protect the patient and the community
- Determine whether assessment by a trauma-informed behavioral health expert is needed, assuming that, in your judgment, it is safe to continue the opioid (TABLE33). When behavioral health assessment is needed, you need 3 questions answered by that assessment: (1) Are psychological factors present that might put the patient at risk during an opioid taper? (2) What are those factors? (3) What needs to done about them before the taper is started? Recalling that psychological trauma often is not assessed by behavioral health colleagues, it is necessary to provide the behavioral health provider with a specific request to assess trauma burden, and state the physical diagnoses that are causing pain or provide a clear statement that no such diagnoses can be made. (See the FIGURE, which we developed in conjunction with behavioral health colleagues to help the consultant understand what the primary care physician needs from a behavioral health assessment.)
- Obtain consultation from a physical therapist, pain medicine specialist, and, if possible, an alternative or complementary medicine provider to determine what nonpharmacotherapeutic modalities can be instituted to treat pain before tapering the opioid.
- Initiate the Screening, Brief Intervention and Referral to Treatment (SBIRT) approach if OUD is suspected (www.samhsa.gov/sbirt).34 This motivational interviewing tool identifies patients with a substance use disorder, severity of use, and appropriate level of treatment. (If OUD is suspected during assessment, next steps are to stop prescribing and implement harm-reduction strategies, such as primary care level medically assisted treatment [MAT] with buprenorphine, followed by expert behavioral health-centered addiction treatment.)
- Experiment with dosage reduction according to published guidance, if (1) psychological factors are absent or have been adequately addressed, according to the behavioral health consultant, and (2) nonpharmacotherapeutic strategies are in place.8-11
Shifting to a patient-centered approach
The timing and choice of opioid tapers, in relation to harm reduction and intervention targeting the root cause of a patient’s complaint of pain, have not been adequately explored. In our practice, we’ve shifted from an addiction-centered, dosage-centered approach to opioid taper to a patient-centered approach35 that emphasizes behavioral-medical integration—an approach that we broadly endorse. Such an approach (1) is based on a clear understanding of why the patient is taking opioid pain medication, (2) engages medical and complementary or alternative medicine specialists, (3) addresses underdiagnosis of psychological trauma, and (4) requires a quantum leap in access to trauma-specific behavioral health treatment resources. 36
Continue to: To underscore the case...
To underscore the case for shifting to a patient-centered approach35 we present sample cases in “How a patient-centered approach to tapering opioids looks in practice.”
SIDEBAR
How a patient-centered approach to tapering opioids looks in practice
Five hypothetical cases illustrate what might happen when a practice shifts from an addiction-centered, dosage-centered approach to one that places the individual at the center of care.
CASE #1: Brett F
Mr. F appears to use medication responsibly; benefits functionally from an opioid; has tolerable adverse effects; does not have significant psychosocial risk factors (based on the score of the Opioid Risk Tool [ORT] or the Screener and Opioid Assessment for Patients with Pain–Revised [SOAPP-R]); and is engaged in effective self-management. Most of Mr. F’s pain is thought to have a nociceptive or neuropathic source.
Mr F could reasonably contemplate continuing current opioid treatment.
Action: If the daily morphine milligram equivalent (MME) dosage is high, Mr. F should be referred to a pain medicine specialist. We recommend a periodic (at least annually) empiric trial of dosage reduction to see whether he is indeed best served by the current dosage.
CASE #2: Brett F (version 2.0)
Envision Mr. F having the same profile in all respects except that he is not engaged in effective self-management.
Optimal treatment of chronic pain often requires supplemental modalities beyond opioids.
Action: Physical therapy; an individualized, ongoing exercise regimen; interventional procedures; weight loss (if the patient is obese); smoking cessation; and improving coping skills for anxiety and depression without pharmacotherapy might not only temporarily alleviate the pain but, over time, improve Mr. F’s physical condition.
If Mr. F is not willing to do more than take the prescribed opioids, nothing is likely to change: Over time, his condition is likely to deteriorate. A patient like Mr. F can be harmed if opioids continue to be prescribed for him long-term.
Further action: If Mr. F won’t engage in broadening the approach to treating his pain, the opioid medication should be tapered, in his long-term best interest. A carrot-and-stick approach can facilitate Mr. F’s involvement in his care.
CASE #3: Clark S
Mr. S has a significant psychosocial component driving his pain: depression.a
Prescribing opioids without addressing the root cause of trauma is not in the patient’s best interest.
Action: Because of Mr. S’s depression, refer him to a behavioral health provider. If you determine that he is emotionally stable, wait until he is engaged in trauma treatment to begin the taper. If he appears unstable (eg, crying in the office, recent psychological stressors, recent impulsive behaviors, poor insight) consider (1) urgent behavioral health referral and (2) prescribing only enough opioid medication (ie, at close intervals) to prevent withdrawal and panic. Consider whether a psychotropic medication might be of benefit (eg, a serotonin–norepinephrine reuptake inhibitor or selective serotonin reuptake inhibitor).
Further action: Harm-reduction steps, such as close monitoring and, perhaps, a change to a buprenorphine product, is indicated, especially when the patient is overwhelmed by recent psychosocial stressors. Harm-reduction treatment is available through Medication-Assisted Therapy (MAT) programs; however, patients often run into difficulty obtaining access to these programs because regulations and laws restrict MAT to patients who have a diagnosis of opioid use disorder (OUD) and because some health plans and pharmacy benefit managers require prior authorization.
CASE #4: Gloria B
Ms. B isn’t managing her medications responsibly—although you don’t suspect OUD.
When a patient has shown the inability to manage opioid medication responsibly, you should delve into the reason to determine your next step.
Action: Evaluate Ms. B for a cognitive disorder or a thought disorder. Alternatively, as in the case of Mr. S, a psychosocial component might underlie her pain; in that case, the same recommendations can be made for her. In addition, you can propose that she identify a responsible person to dispense her medication.
CASE #5: Nicole L
You suspect that Ms. L, who is taking opioid medication to alleviate pain, also has a substance use disorder.
Action: Implement harm-reduction early for Ms. L: Obtain addiction medicine consultation and implement behavioral health strategies for addiction treatment.
A key characteristic of a substance use disorder is loss of control over use of the substance. A patient like Ms. L—who is in pain and who has an active OUD—cannot be expected to manage her opioid use responsibly.
Further action: We recommend that Ms. L be referred to an addiction specialist for MAT. Evidence of the harmreduction benefit of MAT is sufficient to strongly recommend it. Continue any other treatment modalities for pain that Ms. L has been using, such as non-opioid medication, physical therapy, alternative treatments, and behavioral therapy, or begin such treatments as appropriate.
a Depression is not the only psychosocial component that can underlie pain. Others include anxiety, posttraumatic stress disorder, and grief.
An eye toward the future. To inform future approaches to opioid tapering, more resources need to be deployed to
- support screening and risk stratification for PTSD, anxiety, and related disorders at the primary care level,
- continue the effort to identify and treat OUD,
- develop best-practice responses to screening, and
- make harm-reduction strategies that are now reserved for patients with OUD available to those who don't have OUD.
We urge that research be pursued into best practices for chronic pain interventions that target psychological trauma, anxiety, and depression.
CORRESPONDENCE
Bennet Davis MD, 2092 East Calle de Dulcinea, Tucson, AZ 85718; [email protected].
1. Centers for Disease Control and Prevention. Pocket guide: tapering for chronic pain. https://www.cdc.gov/drugoverdose/pdf/clinical_pocket_guide_tapering-a.pdf. Accessed November 25, 2019.
2. Kral LA, Jackson K, Uritsky TJ. A practical guide to tapering opioids. Ment Health Clin. 2015;5:102-108.
3. Murphy L, Babaei-Rad R, Buna D, et al. Guidance on opioid tapering in the context of chronic pain: evidence, practical advice and frequently asked questions. Can Pharm J (Ott). 2018;151:114-120.
4. Berna C, Kulich RJ, Rathmell JP. Tapering long-term opioid therapy in chronic noncancer pain: evidence and recommendations for everyday practice. Mayo Clin Proc. 2005;90:828-842.
5. Davis M. Prescription opioid use among adults with mental health disorders in the United States. J Am Board Fam Med. 2017;30:407-417.
6. US Government Accountability Office. Report to Congressional Requestors. Prescription drug control: DEA has enhanced efforts to combat diversion, but could better assess and report program results. August 2011. www.gao.gov/assets/520/511464.pdf. Accessed November 25, 2019.
7. National Center for Injury Prevention and Control, Centers for Disease Control and Prevention. Annual surveillance report of drug-related risks and outcomes. United States, 2017. www.cdc.gov/drugoverdose/pdf/pubs/2017-cdc-drug-surveillance-report.pdf. Accessed November 25, 2019.
8. Hedegaard H, Warner M, Miniño AM. Drug overdose deaths in the United States, 1999-2016, NCHS Data Brief No. 294. December 21, 2017. Hyattsville, MD: National Center for Health Statistics. www.cdc.gov/nchs/products/databriefs/db294.htm. Accessed November 25, 2019.
9. Overdose death rates. Bethesda, MD: National Institute on Drug Abuse. January 2019. www.drugabuse.gov/related-topics/trends-statistics/overdose-death-rates. Accessed November 25, 2019.
10. Hedegaard H, Miniño AM, Warner M. Drug overdose deaths in the United States, 1999-2017. NCHS Data Brief No. 329. November 2018. Hyattsville, MD: National Center for Health Statistics. www.cdc.gov/nchs/data/databriefs/db329-h.pdf . Accessed November 25, 2019.
11. Manhapra A, Kertesz S, Oliva A, et al. VA data about Rx opioids and overdose and suicide: clinical implications. Presented at the 2018 National Rx Drug Abuse and Heroin Summit, Atlanta Georgia, April 4, 2018.
12. Demidenko M, Dobscha SK, Morasco BJ, et al. Suicidal ideation and suicidal self-directed violence following clinician-initiated prescription opioid discontinuation among long-term opioid users. Gen Hosp Psychiatry. 2017;47:29-35.
13. Von Korff M, Walker RL, Saunders K, et al. Prevalence of prescription opioid use disorder among chronic opioid therapy patients after health plan opioid dose and risk reduction initiatives. Int J Drug Policy. 2017;46:90-98.
14. United States Food and Drug Administration. FDA Drug Safety Communication: FDA identifies harm reported from sudden discontinuation of opioid pain medicines and requires label changes to guide prescribers on gradual, individualized tapering. April 9, 2019. www.fda.gov/Drugs/DrugSafety/ucm635038.htm. Accessed November 25, 2019.
15. Becker W, Sullivan LE, Tetrault JM, et al. Non-medical use, abuse and dependence on prescription opioids among U.S. adults: psychiatric, medical and substance use correlates. Drug Alcohol Depend. 2008;94:38-47.
16. Yovell Y, Bar G, Mashiah M, et al. Ultra-low-dose buprenorphine as a time-limited treatment for severe suicidal ideation: a randomized controlled trial. Am J Psychiatry. 2016;173:491-498.
17. Pradhan AA, Befort K, Nozaki C, et al. The delta opioid receptor: an evolving target for the treatment of brain disorders. Trends Pharmacol Sci. 2011;32:581-590.
18. Sugiyama A, Yamada M, Saitoh A, et al. Administration of a delta opioid receptor agonist KNT-127 to the basolateral amygdala has robust anxiolytic-like effects in rats. Psychopharmacology (Berl). 2018;235:2947-2955.
19. Richards EM, Mathews DC, Luckenbaugh DA, et al. A randomized, placebo-controlled pilot trial of the delta opioid receptor agonist AZD2327 in anxious depression. Psychopharmacology (Berl). 2016;233:1119-1130.
20. Yang PP, Yeh GC, Yeh TK, et al. Activation of delta-opioid receptor contributes to the antinociceptive effect of oxycodone in mice. Pharmacol Res. 2016;111:867-876.
21. America’s mental health 2018. Stamford, CT: Cohen Veterans Network. October 10, 2018. https://www.cohenveteransnetwork.org/wp-content/uploads/2018/10/Research-Summary-10-10-2018.pdf. Accessed November 25, 2019.
22. Classification of Chronic Pain, Second Edition (Revised). Washington, DC: International Association for the Study of Pain. Updated 2012. www.iasp-pain.org/PublicationsNews/Content.aspx?ItemNumber=1673. Accessed November 25, 2019.
23. Davis B, Vanderah TW. A new paradigm for pain? J Fam Pract. 2016 65:598-605.
24. Defrin R, Ginzburg K, Solomon Z, et al. Quantitative testing of pain perception in subjects with PTSD—implications for the mechanism of the coexistence between PTSD and chronic pain. Pain. 2008;138:450-459.
25. Foa EB, Gillihan SJ, Bryant RA. Challenges and successes in dissemination of evidence-based treatments for posttraumatic stress: lessons learned from prolonged exposure therapy for PTSD. Psychol Science Public Interest. 2013;14:65-111.
26. Miele D, O’Brien EJ. Underdiagnosis of posttraumatic stress disorder in at risk youth. J Trauma Stress. 2010;23:591-598.
27. American Psychiatric Association. Diagnostic and Statistical Manual of Mental Disorders. 5th edition. Washington, DC: American Psychiatric Publishing; 2013:541.
28. Dart RC, Surratt HL, Cicero TJ, et al. Trends in opioid analgesic abuse and mortality in the United States. N Engl J Med. 2015;372:241-248.
29. Schuchat A, Houry D, Guy GP Jr. New data on opioid use and prescribing in the United States. JAMA. 2017;318:425-426.
30. American Academy of Pain Medicine, American Pain Society, American Society of Addiction Medicine. Definitions related to the use of opioids for the treatment of pain. 2001. www.naabt.org/documents/APS_consensus_document.pdf. Accessed November 25, 2019.
31. Fishbain DA, Cole B, Lewis J, et al. What percentage of chronic nonmalignant pain patients exposed to chronic opioid analgesic therapy develop abuse/addiction and/or aberrant drug-related behaviors? A structured evidence-based review. Pain Med. 2008;9:444-459.
32. Volkow ND, McClellan AT. Opioid abuse in chronic pain—misconceptions and mitigation strategies. N Engl J Med. 2016;374:1253-1263.
33. Treede RD, Rief W, Barke A. A classification of chronic pain for ICD-11. Pain. 2015;156:1003-1007.
34. Screening, brief intervention, and referral to treatment (SBIRT). Rockville, MD: Substance Abuse and Mental Health Services Administration. www.samhsa.gov/sbirt. Accessed November 25, 2019.
35. Schneider JP, Davis B. How well do you know your patient? Pract Pain Manag. 2017;17(2). www.practicalpainmanagement.com/resources/practice-management/how-well-do-you-know-your-patient. Accessed November 25, 2019.
36. Schneider JP. A patient-centered approach to the opioid overdose crisis. J Miss State Med Assoc. 2018;59:232-233.
PRACTICE RECOMMENDATIONS
› Screen for developmental and adult trauma, for current trauma symptoms, and for opioid use disorder before tapering an opioid. B
› Refer the patient for in-depth behavioral health evaluation when screening identifies risk of behavioral problems, to identify psychological, behavioral, emotional, cognitive, and social factors pertinent to the prevention, treatment, or management of physical health problems, such as chronic pain. A
› Refer the patient for addiction medicine treatment, either within your practice or to an outside consultant, when screening for opioid use disorder indicates that the patient is at risk. A
Strength of recommendation (SOR)
A Good-quality patient-oriented evidence
B Inconsistent or limited-quality patient-oriented evidence
C Consensus, usual practice, opinion, disease-oriented evidence, case series
