User login
Molecular Profiles Guide Colorectal Cancer Treatment
Colorectal cancer (CRC) is the third leading cause of cancer-related death in veterans, despite significant advances in treatment options.1,2 Over the past 20 years, the median survival of patients with metastatic CRC (mCRC), has improved with the most recent clinical trials demonstrating a median overall survival (OS) of up to 29 months.3
In addition to standard chemotherapeutic regimens using 5-fluorouracil, oxaliplatin, and irinotecan, biologic therapies have resulted in improved OS for patients with mCRC. These therapies include the human vascular endothelial growth factor (VEGF) monoclonal antibody bevacizumab and the epidermal growth factor receptor (EGFR) monoclonal antibodies cetuximab and panitumumab. Additional agents, including aflibercept, ramucirumab, regorafenib, and TAS-102, also have been FDA approved for mCRC, though the OS benefit for these agents as part of the series of standard-of-care treatments is less clear.
Investigators continue to determine subtypes of CRC to further advance treatment options. The histologic classification of colon cancers is actually a collection of multiple cancer subtypes. Each subtype possesses a unique biology largely dependent on the mutations present within the cancer. Recent data, reviewed below, indicate predictive and prognostic benefits to understanding the unique mutational profile of mCRC. Here, the authors present a brief updated summary of these biomarkers and a discussion of treatment strategies.
Resistance to Anti-EGFR Therapies
KRAS and NRAS are members of the RAS family of oncogenes. Activating mutations in these genes results in the propagation of growth factor signals independent of EGFR. The most common KRAS mutations are found in exon 2 (codon 12 or 13). Numerous studies over the past 10 years have confirmed that KRAS mutations at exon 2 predict resistance to cetuximab and panitumumab.4-11 Since at least 2009, restricting use of cetuximab and panitumumab has been the standard of care for patients with KRAS exon 2 wild-type cancers.12
Recent investigations have indicated a predictive role for extended-spectrum KRAS and NRAS mutations (KRAS mutations at exons 2, 3, and 4 and NRAS mutations at exons 2, 3, and 4). In the OPUS clinical trial, patients whose cancers possessed extended-spectrum RAS mutations received no benefit with the addition of cetuximab to standard chemotherapy in response rate (RR), progression-free survival (PFS), or OS compared with standard chemotherapy alone.13 Interestingly, median OS was shorter for those treated with cetuximab when a RAS mutation was present, though the difference was not statistically significant. Additional studies also have confirmed similar benefits in different settings.8,14-18
The CALGB/SWOG 80405 phase 3 clinical trial investigated the first-line use of biologic therapies in combination with standard chemotherapy. The extendedspectrum RAS testing from this study now has been presented.3,19 In the RAS wild-type population, the median OS was 31.2 months in the chemotherapy plus bevacizumab arm and 32.0 months in the chemotherapy plus cetuximab arm (no significant difference). No difference in PFS was observed. A significant improvement in the RR was seen in the cetuximab arm for the RAS wild-type population.
Predictive Biomarkers
BRAF is an oncogene in the RAF gene family that encodes a serine-threonine protein kinase found in the Ras-Raf-MAPK cascade. About 10% of CRC harbor a BRAF mutation.20,21 The most significant and prevalent mutation occurs at the kinase domain from the single substitution V600E. Numerous clinical studies have suggested the presence of this mutation as a predictor of resistance to anti-EGFR therapies and a marker of poor prognosis.6,17,22-25 In a retrospective analysis of RAS and BRAF mutation status of PRIME study data, patients without RAS and BRAF mutations showed significantly better OS and PFS when treated with FOLFOX4 (5-fluorouracil, oxaliplatin, and leucovorin) plus panitumumab, compared with FOLFOX4 alone.8 The presence of BRAF mutations in RAS wild-type patients resulted in a worse outcome. Treatment with anti-EGFR therapy did not significantly improve median PFS or OS.
PIK3CA mutations. Phosphoinositide 3-kinase (PI3K) is a lipid kinase important for multiple cellular processes including cell growth, proliferation, survival, and apoptosis. PIK3CA encodes the catalytic subunit and is mutant in about 20% of mCRC.26 The PI3K is downstream of EGFR signaling; activation of this pathway in the setting of an oncogenic mutation might lead to resistance to anti-EGFR therapies. Sartore-Bianchi and colleagues examined 110 patients with mCRC treated with either panitumumab or cetuximab.27 Of these, 15 patient cancers featured PIK3CA mutations, and none of these responded to anti-EGFR therapies. In addition, preclinical studies have demonstrated that targeting CRC downstream of PI3K might result in significant treatment benefit.28,29
Human epidermal growth factor receptor 2 (HER2) amplification. A subpopulation of CRC with amplification of HER2, a growth factor receptor commonly used in selecting treatment options in breast cancer, has recently been described. The HERACLES phase 2 study evaluated dual HER2 targeting with lapatinib and trastuzumab in therapy-refractory mCRC with HER2 amplification.30 A RR of 35% was observed in this treatment-refractory population.
BRAF mutations. In addition to predicting a poor prognosis and resistance to EGFR-directed therapies, BRAF mutations might be predictive of treatment response using combination regimens containing RAF inhibitors. A recent phase 1B study of a combination therapy using the BRAF inhibitor vemurafenib with irinotecan and cetuximab observed a partial RR of 35%.31 This is being investigated further in the Southwest Oncology Group 1406 phase 2 trial.
Mismatch repair deficiency. Detection of microsatellite instability or the presence of mismatch repair deficiency has become standard-of-care testing for CRC. This is important for the detection of Lynch syndrome and predicting potential resistance to adjuvant 5-fluorouracil in the adjuvant setting.32,33 A recent clinical trial has demonstrated benefits for the use of programmed death 1 (PD-1) inhibitors in the setting of mismatch repair deficiency, including a RR of 40% and PFS of 5.4 months.34
Discussion
Metastatic CRC is now better understood as a collection of multiple cancer subtypes based on mutational profile. This improved understanding of the biology of CRC is altering treatment strategies to a precision medicine-based approach. It is now the standard of care for all patients with mCRC to have the cancers assayed for mutations in KRAS (exons 2, 3, and 4), NRAS (exons 2, 3, and 4), and BRAF. Anti-EGFR therapies should not be used for patients with RAS or BRAF mutations outside of a clinical trial because of a demonstrated lack of benefit in all lines of therapy. Currently, there is no evidence that these mutations significantly alter the response to the approved anti-angiogenic agents bevacizumab, aflibercept, ramucirumab, and regorafenib.
The timing of EGFR-directed therapies for patients with wild-type KRAS, NRAS, and BRAF is still being debated. According to the available data, first-line treatment with anti-EGFR agents in combination with FOLFOX or FOLFIRI (5-fluorouracil, irinotecan, and leucovorin) should be considered for all patients with KRAS, NRAS, and BRAF wild-type mCRCs. The toxicities of anti-EGFR therapies also should be considered for this setting, as some patients find that the acneiform rash, fatigue, nausea, and diarrhea that occur with these agents can have a negative impact on quality of life. As there is no improvement in OS with first-line anti-EGFR therapies for these patients, the increased toxicity from these agents limits their use. In addition, patients with mCRC with known PIK3CA mutation should consider use of EGFR-directed therapies only in the later line setting.
Research is focused on how to best use the mutational profile of the tumor to tailor therapies for mCRC. High-quality, large-volume data sets will become more important as molecular subtypes of cancer become more narrowly defined and less common. Further investigations are needed to look for other markers of resistance and to identify biomarkers predictive of treatment sensitivity.
This is an exciting time in the treatment of many cancers, especially mCRC, which significantly impacts the veteran population, because routine DNA sequencing of patient samples has allowed for rapid advances in the realization of precision medicine. This allows for improved patient selection to reduce costs and toxicities while increasing the benefit for veterans.
Acknowledgments
This work was supported by the National Institutes of Health (P30 CA014520, Core Grant, University of Wisconsin Carbone Cancer Center).
Author disclosures
The authors report no actual or potential conflicts of interest with regard to this article.
Disclaimer
The opinions expressed herein are those of the authors and do not necessarily reflect those of Federal Practitioner, Frontline Medical Communications Inc., the U.S. Government, or any of its agencies.
Click here to read the digital edition.
1. Landrum MB, Keating NL, Lamont EB, et al. Survival of older patients with cancer in the Veterans Health Administration versus fee-for-service Medicare. J Clin Oncol. 2012;30(10):1072-1079.
2. Hynes DM, Tarlov E, Durazo-Arvizu R, et al. Surgery and adjuvant chemotherapy use among veterans with colon cancer: insights from a California study. J Clin Oncol. 2010;28(15):2571-2576.
3. Venook AP, Niedzwiecki D, Lenz H-J, et al; Cancer and Leukemia Group B (Alliance), SWOG, and ECOG. CALGB/SWOG 80405: Phase III trial of irinotecan/5-FU/leucovorin (FOLFIRI) or oxaliplatin/5-FU/leucovorin (mFOLFOX6) with bevacizumab (BV) or cetuximab (CET) for patients (pts) with KRAS wild-type (wt) untreated metastatic adenocarcinoma of the colon or rectum (MCRC). J Clin Oncol. 2014;32(suppl 18):Abstract LBA3.
4. Benvenuti S, Sartore-Bianchi A, Di Nicolantonio F, et al. Oncogenic activation of the RAS/RAF signaling pathway impairs the response of metastatic colorectal cancers to anti-epidermal growth factor receptor antibody therapies. Cancer Res. 2007;67(6):2643-2648.
5. Bokemeyer C, Bondarenko I, Hartmann JT, et al. Efficacy according to biomarker status of cetuximab plus FOLFOX-4 as first-line treatment for metastatic colorectal cancer: the OPUS study. Ann Oncol. 2011;22(7):1535-1546.
6. De Roock W, Claes B, Bernasconi D, et al. Effects of KRAS, BRAF, NRAS, and PIK3CA mutations on the efficacy of cetuximab plus chemotherapy in chemotherapy-refractory metastatic colorectal cancer: a retrospective consortium analysis. Lancet Oncol. 2010;11(8):753-7562.
7. Di Fiore F, Blanchard F, Charbonnier F, et al. Clinical relevance of KRAS mutation detection in metastatic colorectal cancer treated by cetuximab plus chemotherapy. Br J Cancer. 2007;96(8):1166-1169.
8. Douillard JY, Oliner KS, Siena S, et al. Panitumumab-FOLFOX4 treatment and RAS mutations in colorectal cancer. N Engl J Med. 2013;369(11):1023-1034.
9. Lièvre A, Bachet JB, Boige V, et al. KRAS mutations as an independent prognostic factor in patients with advanced colorectal cancer treated with cetuximab. J Clin Oncol. 2008;26(3):374-379.
10. Lièvre A, Bachet JB, Le Corre D, et al. KRAS mutation status is predictive of response to cetuximab therapy in colorectal cancer. Cancer Res. 2006;66(8):3992-3995.
11. Van Cutsem E, Köhne CH, Hitre E, et al. Cetuximab and chemotherapy as initial treatment for metastatic colorectal cancer. N Engl J Med. 2009;360(14):1408-1417.
12. Allegra CJ, Jessup JM, Somerfield MR, et al. American Society of Clinical Oncology provisional clinical opinion: testing for KRAS gene mutations in patients with metastatic colorectal carcinoma to predict response to anti-epidermal growth factor receptor monoclonal antibody therapy. J Clin Oncol. 2009;27(12):2091-2096.
13. Tejpar S, Lenz HJ, Kohne CH, et al. Effect of KRAS and NRAS mutations on treatment outcomes in patients with metastatic colorectal cancer (mCRC) treated first-line with cetuximab plus FOLFOX4: new results from the OPUS study. J Clin Oncol. 2014;32(suppl 3):LBA444.
14. Abad A, Massuti B, Gravalos C, et al. Panitumumab plus FOLFOX4 or panitumumab plus FOLFIRI in subjects with wild-type KRAS (exon 2) colorectal cancer and multiple or unresectable liver-limited metastases: data from the randomized, phase II planet study. Ann Oncol. 2014;25(suppl 2):ii7-ii18.
15. Schwartzberg LS, Rivera F, Karthaus M, et al. PEAK: a randomized, multicenter phase II study of panitumumab plus modified fluorouracil, leucovorin, and oxaliplatin (mFOLFOX6) or bevacizumab plus mFOLFOX6 in patients with previously untreated, unresectable, wild-type KRAS exon 2 metastatic colorectal cancer. J Clin Oncol. 2014;32(21):2240-2247.
16. Peeters M, Oliner K, Price T, et al. KRAS/NRAS and BRAF mutations in the 20050181 study of panitumumab plus FOLFIRI for the 2nd-line treatment of metastatic colorectal cancer: updated analysis. Ann Oncol. 2014;25(suppl 2):ii5.
17. Bokemeyer C, Van Cutsem E, Rougier P, et al. Addition of cetuximab to chemotherapy as first-line treatment for KRAS wild-type metastatic colorectal cancer: pooled analysis of the CRYSTAL and OPUS randomised clinical trials. Eur J Cancer. 2012;48(10):1466-1475.
18. Van Cutsem E, Lenz HJ, Köhne CH, et al. Fluorouracil, leucovorin, and irinotecan plus cetuximab treatment and RAS mutations in colorectal cancer. J Clin Oncol. 2015;33(7):692-700.
19. ESMO. ESMO 2014: results from the CALGB/SWOG 80405 and FIRE-3 (AIO KRK-0306) studies in all RAS wild type population. ESMO website. http://www.esmo.org/Conferences/Past-Conferences/ESMO-2014-Congress/News-Articles/Results-From-the-CALGB-SWOG-80405-and-FIRE-3-AIO-KRK -0306-Studies-In-All-RAS-Wild-Type-Population. Updated September 29, 2014. Accessed April 6, 2016.
20. Davies H, Bignell GR, Cox C, et al. Mutations of the BRAF gene in human cancer. Nature. 2002;417(6892):949-954.
21. Samowitz WS, Sweeney C, Herrick J, Albertsen H, Levin TR, Murtaugh MA, Wolff RK, Slattery ML. Poor survival associated with the BRAF V600E mutation in microsatellite-stable colon cancers. Cancer Res. 2005;65(14):6063-6069.
22. Di Nicolantonio F, Martini M, Molinari F, et al. Wild-type BRAF is required for response to panitumumab or cetuximab in metastatic colorectal cancer. J Clin Oncol. 2008;26(35):5705-5712.
23. Laurent-Puig P, Cayre A, Manceau G, et al. Analysis of PTEN, BRAF, and EGFR status in determining benefit from cetuximab therapy in wild-type KRAS metastatic colon cancer. J Clin Oncol. 2009;27(35):5924-5930.
24. Richman SD, Seymour MT, Chambers P, et al. KRAS and BRAF mutations in advanced colorectal cancer are associated with poor prognosis but do not preclude benefit from oxaliplatin or irinotecan: results from the MRC FOCUS trial. J Clin Oncol. 2009;27(35):5931-5937.
25. Tveit KM, Guren T, et al. Phase III trial of cetuximab with continuous or intermittent fluorouracil, leucovorin, and oxaliplatin (Nordic FLOX) versus FLOX alone in first-line treatment of metastatic colorectal cancer: The NORDIC-VII study. J Clin Oncol. 2012;30(15):1755-1762.
26. Samuels Y, Wang Z, Bardelli A, et al. High frequency of mutations of the PIK3CA gene in human cancers. Science. 2004;304(5670):554.
27. Sartore-Bianchi A, Martini M, Molinari F, et al. PIK3CA mutations in colorectal cancer are associated with clinical resistance to EGFR-targeted monoclonal antibodies. Cancer Res. 2009;69(5):1851-1857.
28. Deming DA, Leystra AA, Farhoud M, et al. mTOR inhibition elicits a dramatic response in PI3K-dependent colon cancers. PLoS One. 2013;8(4):e60709.
29. Yueh AE, Payne SN, Leystra AA, et al. Colon cancer tumorigenesis initiated by the H1047R mutant PI3K. PLoS One. 2016;11(2):e0148730.
30. Siena S, Sartore-Bianchi A, Lonardi S, et al. Trastuzumab and lapatinib in HER2-amplified metastatic colorectal cancer patients (mCRC): the HERACLES trial. J Clin Oncol. 2015;33(suppl 15):3508.
31. Hong DS, Morris VK, El Osta BE, et al. Phase Ib study of vemurafenib in combination with irinotecan and cetuximab in patients with BRAF-mutated metastatic colorectal cancer and advanced cancers. J Clin Oncol. 2015;33(suppl 15):3511.
32. Benatti P, Gafà R, Barana D, et al. Microsatellite instability and colorectal cancer prognosis. Clin Cancer Res. 2005;11(23):8332-8340.
33. Funkhouser WK, Jr, Lubin IM, Monzon FA, et al. Relevance, pathogenesis, and testing algorithm for mismatch repair-defective colorectal carcinomas: a report of the association for molecular pathology. J Mol Diagn. 2012;14(2):91-103.
34. Le DT, Uram JN, Wang H, et al. PD-1 blockade in tumors with mismatch-repair
deficiency. N Engl J Med. 2015;372(26):2509-2520.
Colorectal cancer (CRC) is the third leading cause of cancer-related death in veterans, despite significant advances in treatment options.1,2 Over the past 20 years, the median survival of patients with metastatic CRC (mCRC), has improved with the most recent clinical trials demonstrating a median overall survival (OS) of up to 29 months.3
In addition to standard chemotherapeutic regimens using 5-fluorouracil, oxaliplatin, and irinotecan, biologic therapies have resulted in improved OS for patients with mCRC. These therapies include the human vascular endothelial growth factor (VEGF) monoclonal antibody bevacizumab and the epidermal growth factor receptor (EGFR) monoclonal antibodies cetuximab and panitumumab. Additional agents, including aflibercept, ramucirumab, regorafenib, and TAS-102, also have been FDA approved for mCRC, though the OS benefit for these agents as part of the series of standard-of-care treatments is less clear.
Investigators continue to determine subtypes of CRC to further advance treatment options. The histologic classification of colon cancers is actually a collection of multiple cancer subtypes. Each subtype possesses a unique biology largely dependent on the mutations present within the cancer. Recent data, reviewed below, indicate predictive and prognostic benefits to understanding the unique mutational profile of mCRC. Here, the authors present a brief updated summary of these biomarkers and a discussion of treatment strategies.
Resistance to Anti-EGFR Therapies
KRAS and NRAS are members of the RAS family of oncogenes. Activating mutations in these genes results in the propagation of growth factor signals independent of EGFR. The most common KRAS mutations are found in exon 2 (codon 12 or 13). Numerous studies over the past 10 years have confirmed that KRAS mutations at exon 2 predict resistance to cetuximab and panitumumab.4-11 Since at least 2009, restricting use of cetuximab and panitumumab has been the standard of care for patients with KRAS exon 2 wild-type cancers.12
Recent investigations have indicated a predictive role for extended-spectrum KRAS and NRAS mutations (KRAS mutations at exons 2, 3, and 4 and NRAS mutations at exons 2, 3, and 4). In the OPUS clinical trial, patients whose cancers possessed extended-spectrum RAS mutations received no benefit with the addition of cetuximab to standard chemotherapy in response rate (RR), progression-free survival (PFS), or OS compared with standard chemotherapy alone.13 Interestingly, median OS was shorter for those treated with cetuximab when a RAS mutation was present, though the difference was not statistically significant. Additional studies also have confirmed similar benefits in different settings.8,14-18
The CALGB/SWOG 80405 phase 3 clinical trial investigated the first-line use of biologic therapies in combination with standard chemotherapy. The extendedspectrum RAS testing from this study now has been presented.3,19 In the RAS wild-type population, the median OS was 31.2 months in the chemotherapy plus bevacizumab arm and 32.0 months in the chemotherapy plus cetuximab arm (no significant difference). No difference in PFS was observed. A significant improvement in the RR was seen in the cetuximab arm for the RAS wild-type population.
Predictive Biomarkers
BRAF is an oncogene in the RAF gene family that encodes a serine-threonine protein kinase found in the Ras-Raf-MAPK cascade. About 10% of CRC harbor a BRAF mutation.20,21 The most significant and prevalent mutation occurs at the kinase domain from the single substitution V600E. Numerous clinical studies have suggested the presence of this mutation as a predictor of resistance to anti-EGFR therapies and a marker of poor prognosis.6,17,22-25 In a retrospective analysis of RAS and BRAF mutation status of PRIME study data, patients without RAS and BRAF mutations showed significantly better OS and PFS when treated with FOLFOX4 (5-fluorouracil, oxaliplatin, and leucovorin) plus panitumumab, compared with FOLFOX4 alone.8 The presence of BRAF mutations in RAS wild-type patients resulted in a worse outcome. Treatment with anti-EGFR therapy did not significantly improve median PFS or OS.
PIK3CA mutations. Phosphoinositide 3-kinase (PI3K) is a lipid kinase important for multiple cellular processes including cell growth, proliferation, survival, and apoptosis. PIK3CA encodes the catalytic subunit and is mutant in about 20% of mCRC.26 The PI3K is downstream of EGFR signaling; activation of this pathway in the setting of an oncogenic mutation might lead to resistance to anti-EGFR therapies. Sartore-Bianchi and colleagues examined 110 patients with mCRC treated with either panitumumab or cetuximab.27 Of these, 15 patient cancers featured PIK3CA mutations, and none of these responded to anti-EGFR therapies. In addition, preclinical studies have demonstrated that targeting CRC downstream of PI3K might result in significant treatment benefit.28,29
Human epidermal growth factor receptor 2 (HER2) amplification. A subpopulation of CRC with amplification of HER2, a growth factor receptor commonly used in selecting treatment options in breast cancer, has recently been described. The HERACLES phase 2 study evaluated dual HER2 targeting with lapatinib and trastuzumab in therapy-refractory mCRC with HER2 amplification.30 A RR of 35% was observed in this treatment-refractory population.
BRAF mutations. In addition to predicting a poor prognosis and resistance to EGFR-directed therapies, BRAF mutations might be predictive of treatment response using combination regimens containing RAF inhibitors. A recent phase 1B study of a combination therapy using the BRAF inhibitor vemurafenib with irinotecan and cetuximab observed a partial RR of 35%.31 This is being investigated further in the Southwest Oncology Group 1406 phase 2 trial.
Mismatch repair deficiency. Detection of microsatellite instability or the presence of mismatch repair deficiency has become standard-of-care testing for CRC. This is important for the detection of Lynch syndrome and predicting potential resistance to adjuvant 5-fluorouracil in the adjuvant setting.32,33 A recent clinical trial has demonstrated benefits for the use of programmed death 1 (PD-1) inhibitors in the setting of mismatch repair deficiency, including a RR of 40% and PFS of 5.4 months.34
Discussion
Metastatic CRC is now better understood as a collection of multiple cancer subtypes based on mutational profile. This improved understanding of the biology of CRC is altering treatment strategies to a precision medicine-based approach. It is now the standard of care for all patients with mCRC to have the cancers assayed for mutations in KRAS (exons 2, 3, and 4), NRAS (exons 2, 3, and 4), and BRAF. Anti-EGFR therapies should not be used for patients with RAS or BRAF mutations outside of a clinical trial because of a demonstrated lack of benefit in all lines of therapy. Currently, there is no evidence that these mutations significantly alter the response to the approved anti-angiogenic agents bevacizumab, aflibercept, ramucirumab, and regorafenib.
The timing of EGFR-directed therapies for patients with wild-type KRAS, NRAS, and BRAF is still being debated. According to the available data, first-line treatment with anti-EGFR agents in combination with FOLFOX or FOLFIRI (5-fluorouracil, irinotecan, and leucovorin) should be considered for all patients with KRAS, NRAS, and BRAF wild-type mCRCs. The toxicities of anti-EGFR therapies also should be considered for this setting, as some patients find that the acneiform rash, fatigue, nausea, and diarrhea that occur with these agents can have a negative impact on quality of life. As there is no improvement in OS with first-line anti-EGFR therapies for these patients, the increased toxicity from these agents limits their use. In addition, patients with mCRC with known PIK3CA mutation should consider use of EGFR-directed therapies only in the later line setting.
Research is focused on how to best use the mutational profile of the tumor to tailor therapies for mCRC. High-quality, large-volume data sets will become more important as molecular subtypes of cancer become more narrowly defined and less common. Further investigations are needed to look for other markers of resistance and to identify biomarkers predictive of treatment sensitivity.
This is an exciting time in the treatment of many cancers, especially mCRC, which significantly impacts the veteran population, because routine DNA sequencing of patient samples has allowed for rapid advances in the realization of precision medicine. This allows for improved patient selection to reduce costs and toxicities while increasing the benefit for veterans.
Acknowledgments
This work was supported by the National Institutes of Health (P30 CA014520, Core Grant, University of Wisconsin Carbone Cancer Center).
Author disclosures
The authors report no actual or potential conflicts of interest with regard to this article.
Disclaimer
The opinions expressed herein are those of the authors and do not necessarily reflect those of Federal Practitioner, Frontline Medical Communications Inc., the U.S. Government, or any of its agencies.
Click here to read the digital edition.
1. Landrum MB, Keating NL, Lamont EB, et al. Survival of older patients with cancer in the Veterans Health Administration versus fee-for-service Medicare. J Clin Oncol. 2012;30(10):1072-1079.
2. Hynes DM, Tarlov E, Durazo-Arvizu R, et al. Surgery and adjuvant chemotherapy use among veterans with colon cancer: insights from a California study. J Clin Oncol. 2010;28(15):2571-2576.
3. Venook AP, Niedzwiecki D, Lenz H-J, et al; Cancer and Leukemia Group B (Alliance), SWOG, and ECOG. CALGB/SWOG 80405: Phase III trial of irinotecan/5-FU/leucovorin (FOLFIRI) or oxaliplatin/5-FU/leucovorin (mFOLFOX6) with bevacizumab (BV) or cetuximab (CET) for patients (pts) with KRAS wild-type (wt) untreated metastatic adenocarcinoma of the colon or rectum (MCRC). J Clin Oncol. 2014;32(suppl 18):Abstract LBA3.
4. Benvenuti S, Sartore-Bianchi A, Di Nicolantonio F, et al. Oncogenic activation of the RAS/RAF signaling pathway impairs the response of metastatic colorectal cancers to anti-epidermal growth factor receptor antibody therapies. Cancer Res. 2007;67(6):2643-2648.
5. Bokemeyer C, Bondarenko I, Hartmann JT, et al. Efficacy according to biomarker status of cetuximab plus FOLFOX-4 as first-line treatment for metastatic colorectal cancer: the OPUS study. Ann Oncol. 2011;22(7):1535-1546.
6. De Roock W, Claes B, Bernasconi D, et al. Effects of KRAS, BRAF, NRAS, and PIK3CA mutations on the efficacy of cetuximab plus chemotherapy in chemotherapy-refractory metastatic colorectal cancer: a retrospective consortium analysis. Lancet Oncol. 2010;11(8):753-7562.
7. Di Fiore F, Blanchard F, Charbonnier F, et al. Clinical relevance of KRAS mutation detection in metastatic colorectal cancer treated by cetuximab plus chemotherapy. Br J Cancer. 2007;96(8):1166-1169.
8. Douillard JY, Oliner KS, Siena S, et al. Panitumumab-FOLFOX4 treatment and RAS mutations in colorectal cancer. N Engl J Med. 2013;369(11):1023-1034.
9. Lièvre A, Bachet JB, Boige V, et al. KRAS mutations as an independent prognostic factor in patients with advanced colorectal cancer treated with cetuximab. J Clin Oncol. 2008;26(3):374-379.
10. Lièvre A, Bachet JB, Le Corre D, et al. KRAS mutation status is predictive of response to cetuximab therapy in colorectal cancer. Cancer Res. 2006;66(8):3992-3995.
11. Van Cutsem E, Köhne CH, Hitre E, et al. Cetuximab and chemotherapy as initial treatment for metastatic colorectal cancer. N Engl J Med. 2009;360(14):1408-1417.
12. Allegra CJ, Jessup JM, Somerfield MR, et al. American Society of Clinical Oncology provisional clinical opinion: testing for KRAS gene mutations in patients with metastatic colorectal carcinoma to predict response to anti-epidermal growth factor receptor monoclonal antibody therapy. J Clin Oncol. 2009;27(12):2091-2096.
13. Tejpar S, Lenz HJ, Kohne CH, et al. Effect of KRAS and NRAS mutations on treatment outcomes in patients with metastatic colorectal cancer (mCRC) treated first-line with cetuximab plus FOLFOX4: new results from the OPUS study. J Clin Oncol. 2014;32(suppl 3):LBA444.
14. Abad A, Massuti B, Gravalos C, et al. Panitumumab plus FOLFOX4 or panitumumab plus FOLFIRI in subjects with wild-type KRAS (exon 2) colorectal cancer and multiple or unresectable liver-limited metastases: data from the randomized, phase II planet study. Ann Oncol. 2014;25(suppl 2):ii7-ii18.
15. Schwartzberg LS, Rivera F, Karthaus M, et al. PEAK: a randomized, multicenter phase II study of panitumumab plus modified fluorouracil, leucovorin, and oxaliplatin (mFOLFOX6) or bevacizumab plus mFOLFOX6 in patients with previously untreated, unresectable, wild-type KRAS exon 2 metastatic colorectal cancer. J Clin Oncol. 2014;32(21):2240-2247.
16. Peeters M, Oliner K, Price T, et al. KRAS/NRAS and BRAF mutations in the 20050181 study of panitumumab plus FOLFIRI for the 2nd-line treatment of metastatic colorectal cancer: updated analysis. Ann Oncol. 2014;25(suppl 2):ii5.
17. Bokemeyer C, Van Cutsem E, Rougier P, et al. Addition of cetuximab to chemotherapy as first-line treatment for KRAS wild-type metastatic colorectal cancer: pooled analysis of the CRYSTAL and OPUS randomised clinical trials. Eur J Cancer. 2012;48(10):1466-1475.
18. Van Cutsem E, Lenz HJ, Köhne CH, et al. Fluorouracil, leucovorin, and irinotecan plus cetuximab treatment and RAS mutations in colorectal cancer. J Clin Oncol. 2015;33(7):692-700.
19. ESMO. ESMO 2014: results from the CALGB/SWOG 80405 and FIRE-3 (AIO KRK-0306) studies in all RAS wild type population. ESMO website. http://www.esmo.org/Conferences/Past-Conferences/ESMO-2014-Congress/News-Articles/Results-From-the-CALGB-SWOG-80405-and-FIRE-3-AIO-KRK -0306-Studies-In-All-RAS-Wild-Type-Population. Updated September 29, 2014. Accessed April 6, 2016.
20. Davies H, Bignell GR, Cox C, et al. Mutations of the BRAF gene in human cancer. Nature. 2002;417(6892):949-954.
21. Samowitz WS, Sweeney C, Herrick J, Albertsen H, Levin TR, Murtaugh MA, Wolff RK, Slattery ML. Poor survival associated with the BRAF V600E mutation in microsatellite-stable colon cancers. Cancer Res. 2005;65(14):6063-6069.
22. Di Nicolantonio F, Martini M, Molinari F, et al. Wild-type BRAF is required for response to panitumumab or cetuximab in metastatic colorectal cancer. J Clin Oncol. 2008;26(35):5705-5712.
23. Laurent-Puig P, Cayre A, Manceau G, et al. Analysis of PTEN, BRAF, and EGFR status in determining benefit from cetuximab therapy in wild-type KRAS metastatic colon cancer. J Clin Oncol. 2009;27(35):5924-5930.
24. Richman SD, Seymour MT, Chambers P, et al. KRAS and BRAF mutations in advanced colorectal cancer are associated with poor prognosis but do not preclude benefit from oxaliplatin or irinotecan: results from the MRC FOCUS trial. J Clin Oncol. 2009;27(35):5931-5937.
25. Tveit KM, Guren T, et al. Phase III trial of cetuximab with continuous or intermittent fluorouracil, leucovorin, and oxaliplatin (Nordic FLOX) versus FLOX alone in first-line treatment of metastatic colorectal cancer: The NORDIC-VII study. J Clin Oncol. 2012;30(15):1755-1762.
26. Samuels Y, Wang Z, Bardelli A, et al. High frequency of mutations of the PIK3CA gene in human cancers. Science. 2004;304(5670):554.
27. Sartore-Bianchi A, Martini M, Molinari F, et al. PIK3CA mutations in colorectal cancer are associated with clinical resistance to EGFR-targeted monoclonal antibodies. Cancer Res. 2009;69(5):1851-1857.
28. Deming DA, Leystra AA, Farhoud M, et al. mTOR inhibition elicits a dramatic response in PI3K-dependent colon cancers. PLoS One. 2013;8(4):e60709.
29. Yueh AE, Payne SN, Leystra AA, et al. Colon cancer tumorigenesis initiated by the H1047R mutant PI3K. PLoS One. 2016;11(2):e0148730.
30. Siena S, Sartore-Bianchi A, Lonardi S, et al. Trastuzumab and lapatinib in HER2-amplified metastatic colorectal cancer patients (mCRC): the HERACLES trial. J Clin Oncol. 2015;33(suppl 15):3508.
31. Hong DS, Morris VK, El Osta BE, et al. Phase Ib study of vemurafenib in combination with irinotecan and cetuximab in patients with BRAF-mutated metastatic colorectal cancer and advanced cancers. J Clin Oncol. 2015;33(suppl 15):3511.
32. Benatti P, Gafà R, Barana D, et al. Microsatellite instability and colorectal cancer prognosis. Clin Cancer Res. 2005;11(23):8332-8340.
33. Funkhouser WK, Jr, Lubin IM, Monzon FA, et al. Relevance, pathogenesis, and testing algorithm for mismatch repair-defective colorectal carcinomas: a report of the association for molecular pathology. J Mol Diagn. 2012;14(2):91-103.
34. Le DT, Uram JN, Wang H, et al. PD-1 blockade in tumors with mismatch-repair
deficiency. N Engl J Med. 2015;372(26):2509-2520.
Prevalence of Hypogonadism in Low-Risk Prostate Cancer Survivors
Hypogonadism is characterized by low testosterone levels that can result in symptoms such as reduced libido, erectile dysfunction (ED), fatigue, anemia, decreased bone density, decreased lean body mass, and increased body fat.1,2 The Endocrine Society defines male hypogonadism as serum total testosterone level (T) < 300 ng/dL, a threshold at which the likelihood of most symptoms associated with hypogonadism increases.1
Testosterone replacement therapy (TRT) is recommended for treatment of androgen deficiency in symptomatic men with unequivocally low serum T levels. Although current guidelines recommend against using TRT in men with a history of prostate cancer (PCa),1,3 and the FDA has a black box warning against prescribing TRT for these men, little evidence suggests that TRT stimulates tumor growth in patients treated for low-risk PCa.4-6 Retrospective studies and case series suggest that TRT can be safe in patients with low-risk PCa treated with radical prostatectomy, brachytherapy, or external beam radiation.7,8 Despite observed increases in prostate specific antigen (PSA), TRT does not seem to increase PCa recurrence rates when used cautiously, even in men with high-risk disease.9
Almost 3 million men living in the U.S. have been diagnosed with PCa. While 1 in 7 men will be diagnosed with PCa during their lifetime, most men diagnosed with PCa do not die of it.10 More than 90% of patients with PCa have localized or low-grade disease that does not result in PCa-related mortality.11 Active surveillance, brachytherapy, external beam radiation, and radical prostatectomy are considered appropriate monotherapy modalities for low-risk PCa.12 With successful treatment of early PCa, primary care providers may increasingly encounter PCa survivors with or without symptomatic hypogonadism. Surprisingly, the prevalence of hypogonadism in men with low-risk PCa has not been reported.
The primary objective of this study was to estimate the prevalence of hypogonadism in low-risk PCa survivors who received curative treatment. A second objective was to examine the presence of hypogonadism among subgroups of patients. The authors hypothesized that the prevalence in this population may be high enough to support prospective trials designed to determine the safety of TRT in selected hypogonadal men with a history of PCa.
Methods
This is a cross-sectional study conducted at the Edward Hines, Jr. VA Hospital (EHJVA) that included a convenience sample of 52 veterans aged 25 to 100 years who had been treated for low-risk PCa more than 12 months previously and were currently receiving medical care at EHJVA. Low-risk PCa was defined as tumors with a Gleason score ≤ 6 and PSA at diagnosis < 10 or a (clinical or pathologic) American Joint Committee on Cancer (AJCC) stage I or II. Patients were excluded if they had any of the following: Gleason score > 7, PSA at diagnosis > 10, prior TRT or androgen deprivation therapy, recurrent or active PCa, incomplete treatment of PCa, or history of breast cancer. The study was approved by the institutional review board at EHJVA.
Participant Identification and Recruitment
The EHJVA cancer registry provided a roster of about 600 patients who were diagnosed with AJCC stage I or II PCa after 2002 and had completed treatment by 2011. About 50% of the patients were excluded because they no longer were receiving care at EHJVA. More than 150 patients were excluded because they did not have upcoming appointments at EHJVA, they followed up at community-based outpatient clinics, or they did not meet the remaining parameters of the inclusion criteria.
Between April 2013 and August 2014, the authors approached 75 potentially eligible patients who had upcoming outpatient care appointments at EHJVA and invited them to participate in the study. After explaining the risks and benefits, 15 patients declined to participate. Although 60 eligible patients signed an informed consent, 6 later refused to consent to the medical record review. After the medical record review, 2 patients were excluded because their eligibility could not be confirmed (eg, missing tumor stage or PSA information). A total of 52 men were included in this study.
Data Collection
The study participants were asked to complete a brief validated Androgen Deficiency in the Aging Male (ADAM) questionnaire and provide a blood sample. The standard ADAM questionnaire consists of 10 yes/no questions concerning symptoms of androgen deficiency. A positive questionnaire was defined as a “yes” to any 3 questions.13 A blood sample was obtained between 7AM and 9AM for total and free testosterone level, follicle stimulating hormone, and luteinizing hormone (LH) to determine whether the hypogonadism was primary or secondary to a hypothalamicpituitary process. Additional data were collected, including age, height, weight, race, presence of diabetes mellitus (DM), tumor characteristics at diagnosis (ie, PSA, Gleason score, AJCC stage), and first course of cancer treatment.
Main Outcomes and Measures
The primary outcome was hypogonadism. Patients with serum T < 250 ng/dL were identified as having hypogonadism (the lower limit of the reference range in the EHJVA laboratory assay 250-1,100 ng/dL). The type of hypogonadism was further categorized as primary (LH > 10.6 IU/L) or secondary (LH < 10.6 IU/L). Patients with a body mass index (BMI) > 30 kg/m2 were considered obese.
The prevalence of hypogonadism was assessed overall and for subgroups of patients. The 95% confidence interval (CI) was calculated for each estimate. The correlation between BMI and serum T was also determined. Analyses were carried out using SAS 9.2 (SAS Institute Inc., Cary, North Carolina).
Results
The mean age was 69.1 years and patients were primarily white (Table 1). Half the patients were obese, and 40% had DM. The majority of patients had been diagnosed with stage I PCa, had received radiation as their primary treatment, and had completed the PCa treatment more than 5 years ago.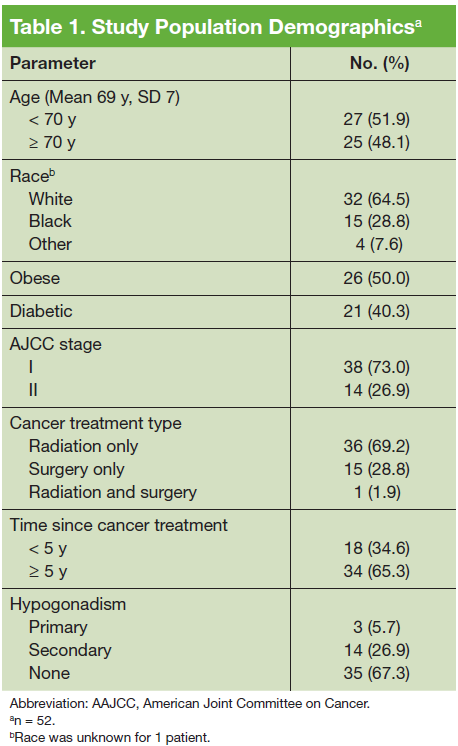
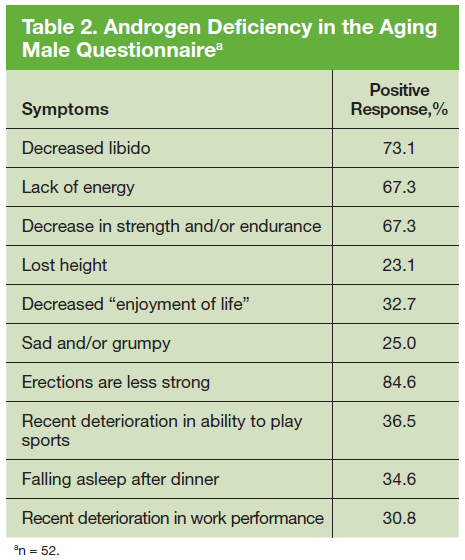
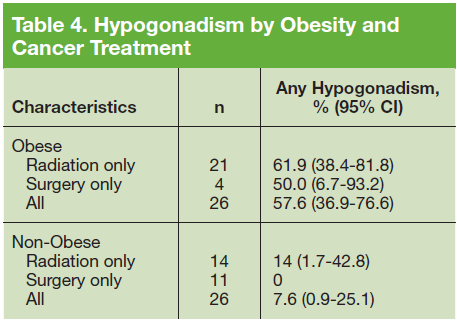
The prevalence of hypogonadism did not differ by race, DM, or tumor stage (Table 3). The oldest age group had the highest prevalence, but it was not statistically significant. However, obese patients were significantly more likely to have hypogonadism than were nonobese patients (57.6% vs 7.6%, P < .001). The negative association between BMI and serum T was more apparent when the correlation (r = -0.37, P < .01) between these 2 factors were examined (Figure). Patients with a higher ADAM score (> 3) were more likely to have hypogonadism than patients with a lower score (40.6% vs 20.0%, P = .14; Table 3). The prevalence of hypogonadism was higher in patients who were treated with radiation compared with patients who had surgery (41.6% vs 13.3%, P = .05). However, obese patients were more likely to have been treated with radiation (Table 4). After stratifying by obesity status, there was no difference in hypogonadism by treatment type.

Discussion
To the authors’ knowledge, this is the first study to assess the prevalence of hypogonadism in treated low-risk PCa survivors. In this sample of 52 men in an outpatient setting, about 1 in 3 had low testosterone levels. Three patients had primary hypogonadism, and 14 had secondary
(hypogonadotrophic) hypogonadism. Obese patients were significantly more likely to have hypogonadism than were nonobese patients. There was no evidence of an associationbetween PCa treatment and hypogonadism.
Estimates of prevalence of hypogonadism in the general population vary in the literature based on different patient demographics, study designs, and geography. A recent review found that the prevalence of hypogonadism in adult men ≥ 18 years had a range of 2.1% to 31.2% since the authors included studies that were population-based, community-based, and primary care or screening-based.14 The prevalence of hypogonadism was 15.0% to 78.8% in obese people and 21.4% to 33% in men with newly diagnosed PCa.14

Mulligan and colleagues estimated that 38.7% of men aged ≥ 45 years who visited primary care clinics in the U.S. had hypogonadism.15 They also found that the prevalence of hypogonadism, defined as serum T < 300 ng/dL, was significantly higher in men with obesity, DM, hypertension, hyperlipidemia, asthma or chronic obstructive pulmonary disease, and prostate disease. The prevalence of hypogonadism in this study was slightly lower (32.6%), but the authors used a different serum T level (< 250 ng/dL).15 Using the Mulligan and colleagues’ definition of serum T level, there was a prevalence of 40.3% in this study’s population of men with treated low-risk PCa.
Other patient characteristics were examined to determine whether the prevalence of hypogonadism differed by age, tumor stage, or mode of treatment. Testosterone levels drop in all men, 1% per year on average after age 30 years.15 Hypogonadism has been consistently found to increase with age and certain comorbidities. Zarotsky and colleagues found a 17% increase in the risk for hypogonadism with every 10-year increase in age.14 In this study, the authors did not find a significant difference in the prevalence of hypogonadism in this group by age or DM.
In the Prostate Cancer Outcomes Study (PCOS), the prevalence of erectile dysfunction was almost 90% in the prostatectomy and radiotherapy group after 15 years. It was unclear whether this was due to PCa and its treatment, the normal aging process, or a combination of factors, but no significant differences were observed between the treatment groups. However, it is unclear whether the PCOS men had hypogonadism, because testosterone levels were not reported.16
In the current study, the association between obesity and hypogonadism is consistent with epidemiologic evidence that suggests complex multidirectional interactions between testosterone, sex hormone-binding globulin, obesity, metabolic syndrome, and type 2 DM (T2DM), mediated by cytokines and adipokines. Several studies show that obesity adversely affects testicular function and is associated with a reduction in sex hormone-binding globulin, serum T, and free testosterone levels.17,18 In addition, secondary hypogonadism has been shown to be higher in men who are overweight (25-29 kg/m2 BMI) and obese (≥ 30 kg/ m2 BMI) compared with normal weight men.19,20 Hypogonadism has also been shown to increase insulin resistance, thereby increasing the risk for developing metabolic syndrome, which is a precursor for cardiovascular disease (CVD) and T2DM.21 Furthermore, low testosterone concentration may be associated with increased insulin resistance, incidence of CVD events, anemia, and low bone density.19,22,23
The relationship between obesity, metabolic syndrome, and androgen deficiency remains unclear because of the complex mechanisms involved in this association. Impairment of hypothalamic-pituitary function by decreased LH pulse amplitude, inhibitory effects of estrogen at the
hypothalamus and pituitary, and the effects of leptin, ghrelin, and resistin, both centrally and on testicular Leydig cells, may explain lower testosterone level in obese males.24,25 Recent studies have suggested a possible increased risk of CV events among groups of men prescribed TRT.26,27 However, other studies demonstrate beneficial effects of TRT on CVD risk factors, and research over several decades suggests a strong beneficial relationship between normal T and CV health.26 The evidence to suggest that TRT increases CV morbidity and mortality risks is poor,28 but FDA is investigating the link between TRT and adverse CV outcomes.29
Testosterone replacement therapy is recommended for symptomatic men with androgen deficiency to induce or maintain secondary sex characteristics and improve their sexual function, sense of well-being, muscle mass, strength, and bone mineral density. In a recent study supported by the National Institutes of Health (NIH) in men aged 65 years, increasing serum testosterone levels to mid-normal range for 1 year was associated with a moderate benefit in sexual function and improved mood, but there was no significant benefit in vitality (as measured by a fatigue scale) or walking distance.28 In the NIH study, 4 men in the testosterone group and 1 in the placebo group received a diagnosis of PCa during or within the subsequent year of treatment, but the sample size was inadequate to reliably assess the effect of testosterone
on the risk of PCa.28
With increasing direct-to-consumer marketing of branded pharmaceutical products in the U.S., there is widening interest in testosterone levels and hypogonadism symptoms in middle-aged and older men. Indeed, 2.3 million patients received a prescription for testosterone in 2013, up from 1.3 million in 2010.29,30 This change has become important because whereas TRT is standard therapy in symptomatic hypogonadal men, it has long been considered taboo for men with a history of PCa, regardless of disease status. Transdermal testosterone is contraindicated in men with carcinoma of the breast or known or suspected carcinoma of the prostate, according to the package insert.31 Androgens are contraindicated in men with known or suspected carcinoma of the prostate or breast, according to the testosterone cypionate injection package insert.32 Although TRT may increase serum PSA levels in some men, it often remains within clinically acceptable ranges and has not been shown to increase the risk for PCa. A recent observation from 3 registries of more than 1,000 hypogonadal men receiving TRT for up to 17 years concluded that TRT does not increase the risk for PCa.33
Prostate cancer encompasses a heterogeneous collection of androgen-dependent and independent cells. Androgens have been known to play an important role in PCa biology, but this relationship is more complex than the traditional view that androgens stimulate PCa growth. More than 7 decades ago, Huggins and colleagues showed that disseminated PCa was inhibited by eliminating androgens by castration and activated by androgen injections.34 Recently, the androgen hypothesis and the relationship of testosterone to PCa has been more clearly defined. Although it has been established that effective suppression of serum T levels with surgical or chemical castration remains an essential strategy in the management of advanced PCa, the assertion that testosterone causes growth of PCa has been challenged.35,36
Recent studies have shown that there may be a more complex relationship between serum T and PCa risk than was previously established.37 Although PCa cells have been shown to become androgen-independent as they progress into the castrate-resistant phase,9 several studies have indicated that low-serum T is associated with greater PCa risk and more worrisome features of PCa.38,39 Hence, a saturation model has been proposed: Changes in serum T concentrations below the point of maximal androgen-androgen receptor (AR) binding will elicit substantial changes in PCa growth, as seen with castration or with serum T administration to castrated men.40 However, once maximal androgen-AR binding is reached, the presence of additional androgen produces little further effect, suggesting that there is a limit to the ability of androgens to stimulate growth of PCa.40
A meta-analysis of 45 articles studying the relationship between serum T and PCa risk has reported conflicting results.4 Eugonadal testosterone levels, whether physiologically or pharmacologically replaced, do not seem to promote PCa growth. It is unclear whether the timing of sex hormone exposure affects PCa or whether the cancer may influence blood levels of sex hormones. Since 2004, there have been case series totaling almost 150 men treated with prostatectomy, brachytherapy, or external beam radiation who have been safely treated with TRT.6-9 These case studies suggest that after a thorough discussion of risks and benefits, TRT may be safer than previously thought for men who have been successfully treated for PCa, are deemed low risk for recurrence, and are monitored closely. However, no randomized controlled trials are available, and published guidelines recommend against starting TRT in patients with a history of breast or PCa.1
Limitations
This study has limitations. The sample size is small and, therefore, it may not have had enough power to show differences in prevalence by subgroups. In addition, the population may not be representative of all male veterans who seek care in the VA or of men in other health care settings, because this was a convenience sample of VA patients who received most of their care in the VA. However, the prevalence of hypogonadism, in this outpatient population is very similar to that found among men seen in primary care clinics.14 Finally, because pretreatment serum T levels were lacking, the authors were unable to assess whether hypogonadism was present before surgery or radiation therapy, and unable to determine whether treatment had any effect on serum T levels.
The study has several strengths. First, to the authors’ knowledge, this is the first study to assess the prevalence of hypogonadism after patients with low-risk PCa have received treatment with curative intent. Second, the authors assessed hypogonadism in every patient by measuring serum T levels in the early morning when levels are known to be at their highest. Third, differentiating primary and secondary hypogonadism helped provide insight into the possible etiology of the low serum T levels. Fourth, this study was performed at a single institution that uses electronic medical records, with almost complete data on patient demographics, PCa treatment, and receipt of TRT or androgen deprivation therapy. Fifth, because this study had the participation of endocrinologists and urologists, the study design helped answer questions pertinent to both medical and surgical specialties.
Conclusion
As life expectancy increases, many survivors of treated PCa present with symptoms of hypogonadism associated with low serum T levels and request TRT. The prevalence of hypogonadism before or after treatment for PCa in this population is not known. This study suggests that many low-risk PCa survivors have hypogonadism. Because hypogonadism negatively impacts quality of life by increasing the risk for sexual dysfunction, mood disturbances, bone fracture, development of metabolic syndrome, frailty, and decline in the feeling of general well-being and may have significant deleterious effects on other body systems, consideration for treatment is warranted.
Patients with PCa may be untreated because the safety of TRT in this population is unknown. Clinical practice guidelines caution against using TRT in this population, and recent literature questions the benefits and risks associated with the long-term safety of TRT, particularly in older men.28,41 Although further studies are necessary before definitive conclusions can be drawn, increasing evidence, albeit small, suggests that TRT can be cautiously considered in selected hypogonadal men treated with curative intent for PCa and without evidence of active disease. However, because obese patients are at higher risk for aggressive PCa and mortality, it is unclear whether obese PCa survivors have an additional risk in regard to TRT.42,43 To help clinicians provide information and care for their patients, appropriately designed prospective randomized studies using a collaborative approach and long-term follow-up are urgently needed to determine the safety of TRT in hypogonadal men with a history of low-risk PCa.
Acknowledgments
This material is the result of work supported with resources and the use of facilities at the Edward Hines Jr. VA Hospital. Dr. Silva’s work was carried out while she was a postdoctoral fellow supported by the VA Office of Academic Affiliations (TPP 42-013). The authors thank Ahmer V. Farooq, DO, Department of Surgery, Division of Urology, for his help in planning the design of the study. Dr. Agrawal affirms that all coauthors contributed significantly to the work and had full access to all data in the study and take responsibility for the integrity of the data and the accuracy of the data analysis.
Author disclosures
The authors report no actual or potential conflicts of interest with regard to this article.
Disclaimer
The opinions expressed herein are those of the authors and do not necessarily reflect those of Federal Practitioner, Frontline Medical Communications Inc., the U.S. Government, or any of its agencies. This article may discuss unlabeled or investigational use of certain drugs. Please review complete prescribing information for specific drugs or drug combinations—including indications, contraindications, warnings, and adverse effects—before administering pharmacologic therapy to patients.
Click here to read the digital edition.
1. Bhasin S, Cunningham GR, Hayes FJ, et al. Testosterone therapy in men with androgen deficiency syndromes: an Endocrine Society clinical practice guideline. J Clin Endocrinol Metab. 2010;95(6):2536-2559.
2. Shortridge EF, Polzer P, Donga P, et al. Experiences and treatment patterns of hypogonadal
men in a U.S. health system. Int J Clin Pract. 2014;68(10):1257-1263.
3. NCCN Clinical Practice Guidelines in Oncology (NCCN Guidelines): prostate cancer. National Comprehensive Cancer Network website. http://www.nccn.org/professionals/physician_gls/pdf/prostate.pdf. Updated February 8, 2016. Accessed April 21, 2016.
4. Klap J, Schmid M, Loughlin KR. The relationship between total testosterone levels and prostate cancer: a review of the continuing controversy. J Urol. 2015;193(2):403-414.
5. Landau D, Tsakok T, Aylwin S, Hughes S. Should testosterone replacement be offered to hypogonadal men treated previously for prostatic carcinoma? Clin Endocrinol (Oxf). 2012;76(2):179-181.
6. Dupree JM, Langille GM, Khera M, Lipshultz LI. The safety of testosterone supplementation therapy in prostate cancer. Nat Rev Urol. 2014;11(9):526-530.
7. Pastuszak AW, Pearlman AM, Godoy G, Miles BJ, Lipshultz LI, Khera M. Testosterone replacement therapy in the setting of prostate cancer treated with radiation. Int J Impot Res. 2013;25(1):24-28.
8. Pastuszak AW, Pearlman AM, Lai WS, et al. Testosterone replacement therapy in patients with prostate cancer after radical prostatectomy. J Urol. 2013;190(2):639-644.
9. Morgentaler A. Testosterone therapy in men with prostate cancer: scientific and ethical considerations. J Urol. 2013;189(1)(suppl):s26-s33.
10. Siegel RL, Miller KD, Jemal A. Cancer statistics, 2015. CA Cancer J Clin. 2015;65(1):5-29.
11. DeSantis CE, Lin CC, Mariotto AB, et al. Cancer treatment and survivorship statistics, 2014. CA Cancer J Clin. 2014;64(4):104-117.
12. Thompson I, Thrasher JB, Aus G, et al. Guideline for the management of clinically localized prostate cancer: 2007 update. J Urol. 2007;177(6):2106-2131.
13. Morley JE, Charlton E, Patrick P, et al. Validation of a screening questionnaire for androgen deficiency in aging males. Metabolism. 2000;49(9):1239-1242.
14. Zarotsky V, Huang M-Y, Carman W, et al. Systematic literature review of the epidemiology of nongenetic forms of hypogonadism in adult males. J Hormones. 2014;2014:190347.
15. Mulligan T, Frick MF, Zuraw QC, Stemhagen A, McWhirter C. Prevalence of hypogonadism in males aged at least 45 years: the HIM study. Int J Clin Pract. 2006;60(7):762-769.
16. Resnick MJ, Koyama T, Fan KH, et al. Long-term functional outcomes after treatment for localized prostate cancer. N Engl J Med. 2013;368(5):436-445.
17. Wu FC, Tajar A, Pye SR, et al; European Male Aging Study Group. Hypothalamicpituitary- testicular axis disruptions in older men are differentially linked to age and modifiable risk factors: the European Male Aging Study. J Clin Endocrinol Metab. 2008;93(7):2737-2745.
18. MacDonald AA, Herbison GP, Showell M, Farquhar CM. The impact of body mass index on semen parameters and reproductive hormones in human males: a systematic review with meta-analysis. Hum Reprod Update. 2010;16(3):293-311.
19. Dandona P, Dhindsa S. Update: hypogonadotropic hypogonadism in type 2 diabetes and obesity. J Clin Endocrinol Metab. 2011;96(9):2643-2651.
20. Hofstra J, Loves S, van Wageningen B, Ruinemans-Koerts J, Jansen I, de Boer H. High prevalence of hypogonadotropic hypogonadism in men referred for obesity treatment. Neth J Med. 2008;66(3):103-109.
21. Kupelian V, Page ST, Araujo AB, Travison TG, Bremner WJ, McKinlay JB. Low sex hormone-binding globulin, total testosterone, and symptomatic androgen deficiency are associated with development of the metabolic syndrome in nonobese men. J Clin Endocrinol Metab. 2006;91(3):843-850.
22. Laughlin GA, Barrett-Connor E, Bergstrom J. Low serum testosterone and mortality in older men. J Clin Endocrinol Metab. 2008;93(1):68-75.
23. Orwoll ES, Klein RF. Osteoporosis in men. Endocrine Rev. 1995;16(1):87-116.
24. Pasquali R. Obesity and androgens: facts and perspectives. Fertil Steril. 2006;85(5):1319-1340.
25. Mah PM, Wittert GA. Obesity and testicular function. Mol Cell Endocrinol. 2010;316(2):180-186.
26. Vigen R, O’Donnell CI, Barón AE, et al. Association of testosterone therapy with mortality, myocardial infarction, and stroke in men with low testosterone levels. JAMA. 2013;310(17):1829-1836.
27. Morgentaler A, Miner MM, Caliber M, Guay AT, Khera M, Traish AM. Testosterone
therapy and cardiovascular risk: advances and controversies. Mayo Clin Proc. 2015;90(2):224-251.
28. Snyder PJ, Bhasin S, Cunningham GR, et al; Testosterone Trials Investigators. Effects
of testosterone treatment in older men. N Engl J Med. 2016;374(7):611-624.
29. U.S. Food and Drug Administration. FDA Drug Safety Communication: FDA evaluating risk of stroke, heart attack and death with FDA-approved testosterone products. U.S. Food and Drug Administration website. http://www.fda.gov/Drugs/DrugSafety/ucm436259.htm. Updated January 14, 2016. Accessed April 12, 2016.
30. Handelsman DJ. Global trends in testosterone prescribing, 2000-2011: expanding the spectrum of prescription drug misuse. Med J Aust. 2013;199(8):548-551.
31. AndroGel [package insert]. North Chicago, IL: AbbVie; 2015.
32. Depo-Testosterone [package insert]. New York, NY: Pfizer; 2015.
33. Haider A, Zitzmann M, Doros G, Isbarn H, Hammerer P, Yassin A. Incidence of prostate cancer in hypogonadal men receiving testosterone therapy: observations from 5-year median followup of 3 registries. J Urol. 2015;193(1):80-86.
34. Huggins C, Hodges CV. Studies on prostatic cancer: I. The effect of castration, of estrogen and androgen injection on serum phosphatases in metastatic carcinoma of the prostate. CA Cancer J Clin. 1972;22(4):232-240.
35. Gomella LG. Effective testosterone suppression for prostate cancer: is there a best castration therapy? Rev Urol. 2009;11(2):52-60.
36. Khera M, Crawford D, Morales A, Salonia A, Morgentaler A. A new era of testosterone and prostate cancer: from physiology to clinical implications. Eur Urol. 2014;65(1):115-123.
37. Morgentaler A. Testosterone and prostate cancer: an historical perspective on a modern myth. Eur Urol. 2006;50(5):935-939.
38. Morgentaler A, Rhoden EL. Prevalence of prostate cancer among hypogonadal men with prostate-specific antigen levels of 4.0 ng/mL or less. Urology. 2006;68(6):1263-1267.
39. Schatzl G, Madersbacher S, Thurridl T, et al. High-grade prostate cancer is associated with low serum testosterone levels. Prostate. 2001;47(1):52-58.
40. Morgentaler A, Traish AM. Shifting the paradigm of testosterone and prostate cancer: the saturation model and the limits of androgen-dependent growth. Eur Urol. 2009;55(2):310-320.
41. Basaria S, Coviello AD, Travison TG, et al. Adverse events associated with testosterone administration. N Engl J Med. 2010;363(2):109-122.
42. Allott EH, Masko EM, Freedland SJ. Obesity and prostate cancer: weighing the evidence. Eur Urol. 2013;63(5):800-809.
43. Buschemeyer WC 3rd, Freedland SJ. Obesity and prostate cancer: epidemiology and clinical implications. Eur Urol. 2007;52(2):331-343.
Hypogonadism is characterized by low testosterone levels that can result in symptoms such as reduced libido, erectile dysfunction (ED), fatigue, anemia, decreased bone density, decreased lean body mass, and increased body fat.1,2 The Endocrine Society defines male hypogonadism as serum total testosterone level (T) < 300 ng/dL, a threshold at which the likelihood of most symptoms associated with hypogonadism increases.1
Testosterone replacement therapy (TRT) is recommended for treatment of androgen deficiency in symptomatic men with unequivocally low serum T levels. Although current guidelines recommend against using TRT in men with a history of prostate cancer (PCa),1,3 and the FDA has a black box warning against prescribing TRT for these men, little evidence suggests that TRT stimulates tumor growth in patients treated for low-risk PCa.4-6 Retrospective studies and case series suggest that TRT can be safe in patients with low-risk PCa treated with radical prostatectomy, brachytherapy, or external beam radiation.7,8 Despite observed increases in prostate specific antigen (PSA), TRT does not seem to increase PCa recurrence rates when used cautiously, even in men with high-risk disease.9
Almost 3 million men living in the U.S. have been diagnosed with PCa. While 1 in 7 men will be diagnosed with PCa during their lifetime, most men diagnosed with PCa do not die of it.10 More than 90% of patients with PCa have localized or low-grade disease that does not result in PCa-related mortality.11 Active surveillance, brachytherapy, external beam radiation, and radical prostatectomy are considered appropriate monotherapy modalities for low-risk PCa.12 With successful treatment of early PCa, primary care providers may increasingly encounter PCa survivors with or without symptomatic hypogonadism. Surprisingly, the prevalence of hypogonadism in men with low-risk PCa has not been reported.
The primary objective of this study was to estimate the prevalence of hypogonadism in low-risk PCa survivors who received curative treatment. A second objective was to examine the presence of hypogonadism among subgroups of patients. The authors hypothesized that the prevalence in this population may be high enough to support prospective trials designed to determine the safety of TRT in selected hypogonadal men with a history of PCa.
Methods
This is a cross-sectional study conducted at the Edward Hines, Jr. VA Hospital (EHJVA) that included a convenience sample of 52 veterans aged 25 to 100 years who had been treated for low-risk PCa more than 12 months previously and were currently receiving medical care at EHJVA. Low-risk PCa was defined as tumors with a Gleason score ≤ 6 and PSA at diagnosis < 10 or a (clinical or pathologic) American Joint Committee on Cancer (AJCC) stage I or II. Patients were excluded if they had any of the following: Gleason score > 7, PSA at diagnosis > 10, prior TRT or androgen deprivation therapy, recurrent or active PCa, incomplete treatment of PCa, or history of breast cancer. The study was approved by the institutional review board at EHJVA.
Participant Identification and Recruitment
The EHJVA cancer registry provided a roster of about 600 patients who were diagnosed with AJCC stage I or II PCa after 2002 and had completed treatment by 2011. About 50% of the patients were excluded because they no longer were receiving care at EHJVA. More than 150 patients were excluded because they did not have upcoming appointments at EHJVA, they followed up at community-based outpatient clinics, or they did not meet the remaining parameters of the inclusion criteria.
Between April 2013 and August 2014, the authors approached 75 potentially eligible patients who had upcoming outpatient care appointments at EHJVA and invited them to participate in the study. After explaining the risks and benefits, 15 patients declined to participate. Although 60 eligible patients signed an informed consent, 6 later refused to consent to the medical record review. After the medical record review, 2 patients were excluded because their eligibility could not be confirmed (eg, missing tumor stage or PSA information). A total of 52 men were included in this study.
Data Collection
The study participants were asked to complete a brief validated Androgen Deficiency in the Aging Male (ADAM) questionnaire and provide a blood sample. The standard ADAM questionnaire consists of 10 yes/no questions concerning symptoms of androgen deficiency. A positive questionnaire was defined as a “yes” to any 3 questions.13 A blood sample was obtained between 7AM and 9AM for total and free testosterone level, follicle stimulating hormone, and luteinizing hormone (LH) to determine whether the hypogonadism was primary or secondary to a hypothalamicpituitary process. Additional data were collected, including age, height, weight, race, presence of diabetes mellitus (DM), tumor characteristics at diagnosis (ie, PSA, Gleason score, AJCC stage), and first course of cancer treatment.
Main Outcomes and Measures
The primary outcome was hypogonadism. Patients with serum T < 250 ng/dL were identified as having hypogonadism (the lower limit of the reference range in the EHJVA laboratory assay 250-1,100 ng/dL). The type of hypogonadism was further categorized as primary (LH > 10.6 IU/L) or secondary (LH < 10.6 IU/L). Patients with a body mass index (BMI) > 30 kg/m2 were considered obese.
The prevalence of hypogonadism was assessed overall and for subgroups of patients. The 95% confidence interval (CI) was calculated for each estimate. The correlation between BMI and serum T was also determined. Analyses were carried out using SAS 9.2 (SAS Institute Inc., Cary, North Carolina).
Results
The mean age was 69.1 years and patients were primarily white (Table 1). Half the patients were obese, and 40% had DM. The majority of patients had been diagnosed with stage I PCa, had received radiation as their primary treatment, and had completed the PCa treatment more than 5 years ago.
The prevalence of hypogonadism did not differ by race, DM, or tumor stage (Table 3). The oldest age group had the highest prevalence, but it was not statistically significant. However, obese patients were significantly more likely to have hypogonadism than were nonobese patients (57.6% vs 7.6%, P < .001). The negative association between BMI and serum T was more apparent when the correlation (r = -0.37, P < .01) between these 2 factors were examined (Figure). Patients with a higher ADAM score (> 3) were more likely to have hypogonadism than patients with a lower score (40.6% vs 20.0%, P = .14; Table 3). The prevalence of hypogonadism was higher in patients who were treated with radiation compared with patients who had surgery (41.6% vs 13.3%, P = .05). However, obese patients were more likely to have been treated with radiation (Table 4). After stratifying by obesity status, there was no difference in hypogonadism by treatment type.
Discussion
To the authors’ knowledge, this is the first study to assess the prevalence of hypogonadism in treated low-risk PCa survivors. In this sample of 52 men in an outpatient setting, about 1 in 3 had low testosterone levels. Three patients had primary hypogonadism, and 14 had secondary
(hypogonadotrophic) hypogonadism. Obese patients were significantly more likely to have hypogonadism than were nonobese patients. There was no evidence of an associationbetween PCa treatment and hypogonadism.
Estimates of prevalence of hypogonadism in the general population vary in the literature based on different patient demographics, study designs, and geography. A recent review found that the prevalence of hypogonadism in adult men ≥ 18 years had a range of 2.1% to 31.2% since the authors included studies that were population-based, community-based, and primary care or screening-based.14 The prevalence of hypogonadism was 15.0% to 78.8% in obese people and 21.4% to 33% in men with newly diagnosed PCa.14
Mulligan and colleagues estimated that 38.7% of men aged ≥ 45 years who visited primary care clinics in the U.S. had hypogonadism.15 They also found that the prevalence of hypogonadism, defined as serum T < 300 ng/dL, was significantly higher in men with obesity, DM, hypertension, hyperlipidemia, asthma or chronic obstructive pulmonary disease, and prostate disease. The prevalence of hypogonadism in this study was slightly lower (32.6%), but the authors used a different serum T level (< 250 ng/dL).15 Using the Mulligan and colleagues’ definition of serum T level, there was a prevalence of 40.3% in this study’s population of men with treated low-risk PCa.
Other patient characteristics were examined to determine whether the prevalence of hypogonadism differed by age, tumor stage, or mode of treatment. Testosterone levels drop in all men, 1% per year on average after age 30 years.15 Hypogonadism has been consistently found to increase with age and certain comorbidities. Zarotsky and colleagues found a 17% increase in the risk for hypogonadism with every 10-year increase in age.14 In this study, the authors did not find a significant difference in the prevalence of hypogonadism in this group by age or DM.
In the Prostate Cancer Outcomes Study (PCOS), the prevalence of erectile dysfunction was almost 90% in the prostatectomy and radiotherapy group after 15 years. It was unclear whether this was due to PCa and its treatment, the normal aging process, or a combination of factors, but no significant differences were observed between the treatment groups. However, it is unclear whether the PCOS men had hypogonadism, because testosterone levels were not reported.16
In the current study, the association between obesity and hypogonadism is consistent with epidemiologic evidence that suggests complex multidirectional interactions between testosterone, sex hormone-binding globulin, obesity, metabolic syndrome, and type 2 DM (T2DM), mediated by cytokines and adipokines. Several studies show that obesity adversely affects testicular function and is associated with a reduction in sex hormone-binding globulin, serum T, and free testosterone levels.17,18 In addition, secondary hypogonadism has been shown to be higher in men who are overweight (25-29 kg/m2 BMI) and obese (≥ 30 kg/ m2 BMI) compared with normal weight men.19,20 Hypogonadism has also been shown to increase insulin resistance, thereby increasing the risk for developing metabolic syndrome, which is a precursor for cardiovascular disease (CVD) and T2DM.21 Furthermore, low testosterone concentration may be associated with increased insulin resistance, incidence of CVD events, anemia, and low bone density.19,22,23
The relationship between obesity, metabolic syndrome, and androgen deficiency remains unclear because of the complex mechanisms involved in this association. Impairment of hypothalamic-pituitary function by decreased LH pulse amplitude, inhibitory effects of estrogen at the
hypothalamus and pituitary, and the effects of leptin, ghrelin, and resistin, both centrally and on testicular Leydig cells, may explain lower testosterone level in obese males.24,25 Recent studies have suggested a possible increased risk of CV events among groups of men prescribed TRT.26,27 However, other studies demonstrate beneficial effects of TRT on CVD risk factors, and research over several decades suggests a strong beneficial relationship between normal T and CV health.26 The evidence to suggest that TRT increases CV morbidity and mortality risks is poor,28 but FDA is investigating the link between TRT and adverse CV outcomes.29
Testosterone replacement therapy is recommended for symptomatic men with androgen deficiency to induce or maintain secondary sex characteristics and improve their sexual function, sense of well-being, muscle mass, strength, and bone mineral density. In a recent study supported by the National Institutes of Health (NIH) in men aged 65 years, increasing serum testosterone levels to mid-normal range for 1 year was associated with a moderate benefit in sexual function and improved mood, but there was no significant benefit in vitality (as measured by a fatigue scale) or walking distance.28 In the NIH study, 4 men in the testosterone group and 1 in the placebo group received a diagnosis of PCa during or within the subsequent year of treatment, but the sample size was inadequate to reliably assess the effect of testosterone
on the risk of PCa.28
With increasing direct-to-consumer marketing of branded pharmaceutical products in the U.S., there is widening interest in testosterone levels and hypogonadism symptoms in middle-aged and older men. Indeed, 2.3 million patients received a prescription for testosterone in 2013, up from 1.3 million in 2010.29,30 This change has become important because whereas TRT is standard therapy in symptomatic hypogonadal men, it has long been considered taboo for men with a history of PCa, regardless of disease status. Transdermal testosterone is contraindicated in men with carcinoma of the breast or known or suspected carcinoma of the prostate, according to the package insert.31 Androgens are contraindicated in men with known or suspected carcinoma of the prostate or breast, according to the testosterone cypionate injection package insert.32 Although TRT may increase serum PSA levels in some men, it often remains within clinically acceptable ranges and has not been shown to increase the risk for PCa. A recent observation from 3 registries of more than 1,000 hypogonadal men receiving TRT for up to 17 years concluded that TRT does not increase the risk for PCa.33
Prostate cancer encompasses a heterogeneous collection of androgen-dependent and independent cells. Androgens have been known to play an important role in PCa biology, but this relationship is more complex than the traditional view that androgens stimulate PCa growth. More than 7 decades ago, Huggins and colleagues showed that disseminated PCa was inhibited by eliminating androgens by castration and activated by androgen injections.34 Recently, the androgen hypothesis and the relationship of testosterone to PCa has been more clearly defined. Although it has been established that effective suppression of serum T levels with surgical or chemical castration remains an essential strategy in the management of advanced PCa, the assertion that testosterone causes growth of PCa has been challenged.35,36
Recent studies have shown that there may be a more complex relationship between serum T and PCa risk than was previously established.37 Although PCa cells have been shown to become androgen-independent as they progress into the castrate-resistant phase,9 several studies have indicated that low-serum T is associated with greater PCa risk and more worrisome features of PCa.38,39 Hence, a saturation model has been proposed: Changes in serum T concentrations below the point of maximal androgen-androgen receptor (AR) binding will elicit substantial changes in PCa growth, as seen with castration or with serum T administration to castrated men.40 However, once maximal androgen-AR binding is reached, the presence of additional androgen produces little further effect, suggesting that there is a limit to the ability of androgens to stimulate growth of PCa.40
A meta-analysis of 45 articles studying the relationship between serum T and PCa risk has reported conflicting results.4 Eugonadal testosterone levels, whether physiologically or pharmacologically replaced, do not seem to promote PCa growth. It is unclear whether the timing of sex hormone exposure affects PCa or whether the cancer may influence blood levels of sex hormones. Since 2004, there have been case series totaling almost 150 men treated with prostatectomy, brachytherapy, or external beam radiation who have been safely treated with TRT.6-9 These case studies suggest that after a thorough discussion of risks and benefits, TRT may be safer than previously thought for men who have been successfully treated for PCa, are deemed low risk for recurrence, and are monitored closely. However, no randomized controlled trials are available, and published guidelines recommend against starting TRT in patients with a history of breast or PCa.1
Limitations
This study has limitations. The sample size is small and, therefore, it may not have had enough power to show differences in prevalence by subgroups. In addition, the population may not be representative of all male veterans who seek care in the VA or of men in other health care settings, because this was a convenience sample of VA patients who received most of their care in the VA. However, the prevalence of hypogonadism, in this outpatient population is very similar to that found among men seen in primary care clinics.14 Finally, because pretreatment serum T levels were lacking, the authors were unable to assess whether hypogonadism was present before surgery or radiation therapy, and unable to determine whether treatment had any effect on serum T levels.
The study has several strengths. First, to the authors’ knowledge, this is the first study to assess the prevalence of hypogonadism after patients with low-risk PCa have received treatment with curative intent. Second, the authors assessed hypogonadism in every patient by measuring serum T levels in the early morning when levels are known to be at their highest. Third, differentiating primary and secondary hypogonadism helped provide insight into the possible etiology of the low serum T levels. Fourth, this study was performed at a single institution that uses electronic medical records, with almost complete data on patient demographics, PCa treatment, and receipt of TRT or androgen deprivation therapy. Fifth, because this study had the participation of endocrinologists and urologists, the study design helped answer questions pertinent to both medical and surgical specialties.
Conclusion
As life expectancy increases, many survivors of treated PCa present with symptoms of hypogonadism associated with low serum T levels and request TRT. The prevalence of hypogonadism before or after treatment for PCa in this population is not known. This study suggests that many low-risk PCa survivors have hypogonadism. Because hypogonadism negatively impacts quality of life by increasing the risk for sexual dysfunction, mood disturbances, bone fracture, development of metabolic syndrome, frailty, and decline in the feeling of general well-being and may have significant deleterious effects on other body systems, consideration for treatment is warranted.
Patients with PCa may be untreated because the safety of TRT in this population is unknown. Clinical practice guidelines caution against using TRT in this population, and recent literature questions the benefits and risks associated with the long-term safety of TRT, particularly in older men.28,41 Although further studies are necessary before definitive conclusions can be drawn, increasing evidence, albeit small, suggests that TRT can be cautiously considered in selected hypogonadal men treated with curative intent for PCa and without evidence of active disease. However, because obese patients are at higher risk for aggressive PCa and mortality, it is unclear whether obese PCa survivors have an additional risk in regard to TRT.42,43 To help clinicians provide information and care for their patients, appropriately designed prospective randomized studies using a collaborative approach and long-term follow-up are urgently needed to determine the safety of TRT in hypogonadal men with a history of low-risk PCa.
Acknowledgments
This material is the result of work supported with resources and the use of facilities at the Edward Hines Jr. VA Hospital. Dr. Silva’s work was carried out while she was a postdoctoral fellow supported by the VA Office of Academic Affiliations (TPP 42-013). The authors thank Ahmer V. Farooq, DO, Department of Surgery, Division of Urology, for his help in planning the design of the study. Dr. Agrawal affirms that all coauthors contributed significantly to the work and had full access to all data in the study and take responsibility for the integrity of the data and the accuracy of the data analysis.
Author disclosures
The authors report no actual or potential conflicts of interest with regard to this article.
Disclaimer
The opinions expressed herein are those of the authors and do not necessarily reflect those of Federal Practitioner, Frontline Medical Communications Inc., the U.S. Government, or any of its agencies. This article may discuss unlabeled or investigational use of certain drugs. Please review complete prescribing information for specific drugs or drug combinations—including indications, contraindications, warnings, and adverse effects—before administering pharmacologic therapy to patients.
Click here to read the digital edition.
1. Bhasin S, Cunningham GR, Hayes FJ, et al. Testosterone therapy in men with androgen deficiency syndromes: an Endocrine Society clinical practice guideline. J Clin Endocrinol Metab. 2010;95(6):2536-2559.
2. Shortridge EF, Polzer P, Donga P, et al. Experiences and treatment patterns of hypogonadal
men in a U.S. health system. Int J Clin Pract. 2014;68(10):1257-1263.
3. NCCN Clinical Practice Guidelines in Oncology (NCCN Guidelines): prostate cancer. National Comprehensive Cancer Network website. http://www.nccn.org/professionals/physician_gls/pdf/prostate.pdf. Updated February 8, 2016. Accessed April 21, 2016.
4. Klap J, Schmid M, Loughlin KR. The relationship between total testosterone levels and prostate cancer: a review of the continuing controversy. J Urol. 2015;193(2):403-414.
5. Landau D, Tsakok T, Aylwin S, Hughes S. Should testosterone replacement be offered to hypogonadal men treated previously for prostatic carcinoma? Clin Endocrinol (Oxf). 2012;76(2):179-181.
6. Dupree JM, Langille GM, Khera M, Lipshultz LI. The safety of testosterone supplementation therapy in prostate cancer. Nat Rev Urol. 2014;11(9):526-530.
7. Pastuszak AW, Pearlman AM, Godoy G, Miles BJ, Lipshultz LI, Khera M. Testosterone replacement therapy in the setting of prostate cancer treated with radiation. Int J Impot Res. 2013;25(1):24-28.
8. Pastuszak AW, Pearlman AM, Lai WS, et al. Testosterone replacement therapy in patients with prostate cancer after radical prostatectomy. J Urol. 2013;190(2):639-644.
9. Morgentaler A. Testosterone therapy in men with prostate cancer: scientific and ethical considerations. J Urol. 2013;189(1)(suppl):s26-s33.
10. Siegel RL, Miller KD, Jemal A. Cancer statistics, 2015. CA Cancer J Clin. 2015;65(1):5-29.
11. DeSantis CE, Lin CC, Mariotto AB, et al. Cancer treatment and survivorship statistics, 2014. CA Cancer J Clin. 2014;64(4):104-117.
12. Thompson I, Thrasher JB, Aus G, et al. Guideline for the management of clinically localized prostate cancer: 2007 update. J Urol. 2007;177(6):2106-2131.
13. Morley JE, Charlton E, Patrick P, et al. Validation of a screening questionnaire for androgen deficiency in aging males. Metabolism. 2000;49(9):1239-1242.
14. Zarotsky V, Huang M-Y, Carman W, et al. Systematic literature review of the epidemiology of nongenetic forms of hypogonadism in adult males. J Hormones. 2014;2014:190347.
15. Mulligan T, Frick MF, Zuraw QC, Stemhagen A, McWhirter C. Prevalence of hypogonadism in males aged at least 45 years: the HIM study. Int J Clin Pract. 2006;60(7):762-769.
16. Resnick MJ, Koyama T, Fan KH, et al. Long-term functional outcomes after treatment for localized prostate cancer. N Engl J Med. 2013;368(5):436-445.
17. Wu FC, Tajar A, Pye SR, et al; European Male Aging Study Group. Hypothalamicpituitary- testicular axis disruptions in older men are differentially linked to age and modifiable risk factors: the European Male Aging Study. J Clin Endocrinol Metab. 2008;93(7):2737-2745.
18. MacDonald AA, Herbison GP, Showell M, Farquhar CM. The impact of body mass index on semen parameters and reproductive hormones in human males: a systematic review with meta-analysis. Hum Reprod Update. 2010;16(3):293-311.
19. Dandona P, Dhindsa S. Update: hypogonadotropic hypogonadism in type 2 diabetes and obesity. J Clin Endocrinol Metab. 2011;96(9):2643-2651.
20. Hofstra J, Loves S, van Wageningen B, Ruinemans-Koerts J, Jansen I, de Boer H. High prevalence of hypogonadotropic hypogonadism in men referred for obesity treatment. Neth J Med. 2008;66(3):103-109.
21. Kupelian V, Page ST, Araujo AB, Travison TG, Bremner WJ, McKinlay JB. Low sex hormone-binding globulin, total testosterone, and symptomatic androgen deficiency are associated with development of the metabolic syndrome in nonobese men. J Clin Endocrinol Metab. 2006;91(3):843-850.
22. Laughlin GA, Barrett-Connor E, Bergstrom J. Low serum testosterone and mortality in older men. J Clin Endocrinol Metab. 2008;93(1):68-75.
23. Orwoll ES, Klein RF. Osteoporosis in men. Endocrine Rev. 1995;16(1):87-116.
24. Pasquali R. Obesity and androgens: facts and perspectives. Fertil Steril. 2006;85(5):1319-1340.
25. Mah PM, Wittert GA. Obesity and testicular function. Mol Cell Endocrinol. 2010;316(2):180-186.
26. Vigen R, O’Donnell CI, Barón AE, et al. Association of testosterone therapy with mortality, myocardial infarction, and stroke in men with low testosterone levels. JAMA. 2013;310(17):1829-1836.
27. Morgentaler A, Miner MM, Caliber M, Guay AT, Khera M, Traish AM. Testosterone
therapy and cardiovascular risk: advances and controversies. Mayo Clin Proc. 2015;90(2):224-251.
28. Snyder PJ, Bhasin S, Cunningham GR, et al; Testosterone Trials Investigators. Effects
of testosterone treatment in older men. N Engl J Med. 2016;374(7):611-624.
29. U.S. Food and Drug Administration. FDA Drug Safety Communication: FDA evaluating risk of stroke, heart attack and death with FDA-approved testosterone products. U.S. Food and Drug Administration website. http://www.fda.gov/Drugs/DrugSafety/ucm436259.htm. Updated January 14, 2016. Accessed April 12, 2016.
30. Handelsman DJ. Global trends in testosterone prescribing, 2000-2011: expanding the spectrum of prescription drug misuse. Med J Aust. 2013;199(8):548-551.
31. AndroGel [package insert]. North Chicago, IL: AbbVie; 2015.
32. Depo-Testosterone [package insert]. New York, NY: Pfizer; 2015.
33. Haider A, Zitzmann M, Doros G, Isbarn H, Hammerer P, Yassin A. Incidence of prostate cancer in hypogonadal men receiving testosterone therapy: observations from 5-year median followup of 3 registries. J Urol. 2015;193(1):80-86.
34. Huggins C, Hodges CV. Studies on prostatic cancer: I. The effect of castration, of estrogen and androgen injection on serum phosphatases in metastatic carcinoma of the prostate. CA Cancer J Clin. 1972;22(4):232-240.
35. Gomella LG. Effective testosterone suppression for prostate cancer: is there a best castration therapy? Rev Urol. 2009;11(2):52-60.
36. Khera M, Crawford D, Morales A, Salonia A, Morgentaler A. A new era of testosterone and prostate cancer: from physiology to clinical implications. Eur Urol. 2014;65(1):115-123.
37. Morgentaler A. Testosterone and prostate cancer: an historical perspective on a modern myth. Eur Urol. 2006;50(5):935-939.
38. Morgentaler A, Rhoden EL. Prevalence of prostate cancer among hypogonadal men with prostate-specific antigen levels of 4.0 ng/mL or less. Urology. 2006;68(6):1263-1267.
39. Schatzl G, Madersbacher S, Thurridl T, et al. High-grade prostate cancer is associated with low serum testosterone levels. Prostate. 2001;47(1):52-58.
40. Morgentaler A, Traish AM. Shifting the paradigm of testosterone and prostate cancer: the saturation model and the limits of androgen-dependent growth. Eur Urol. 2009;55(2):310-320.
41. Basaria S, Coviello AD, Travison TG, et al. Adverse events associated with testosterone administration. N Engl J Med. 2010;363(2):109-122.
42. Allott EH, Masko EM, Freedland SJ. Obesity and prostate cancer: weighing the evidence. Eur Urol. 2013;63(5):800-809.
43. Buschemeyer WC 3rd, Freedland SJ. Obesity and prostate cancer: epidemiology and clinical implications. Eur Urol. 2007;52(2):331-343.
Use of Fluorodeoxyglucose-Positron Emission Tomography in the Diagnosis of Intravascular Diffuse Large B-Cell Lymphoma
Patient 1
A white man aged 67 years, with diastolic heart failure and chronic obstructive pulmonary disease, presented to the emergency department (ED) with shortness of breath. The initial laboratory results were significant for a newly elevated creatinine level of 2.06 mg/dL and a brain natriuretic peptide level of 648 pg/mL.
Imaging studies included a chest radiograph, a ventilation/perfusion scan, and an echocardiogram, as well as a right heart catheterization. All were nondiagnostic. 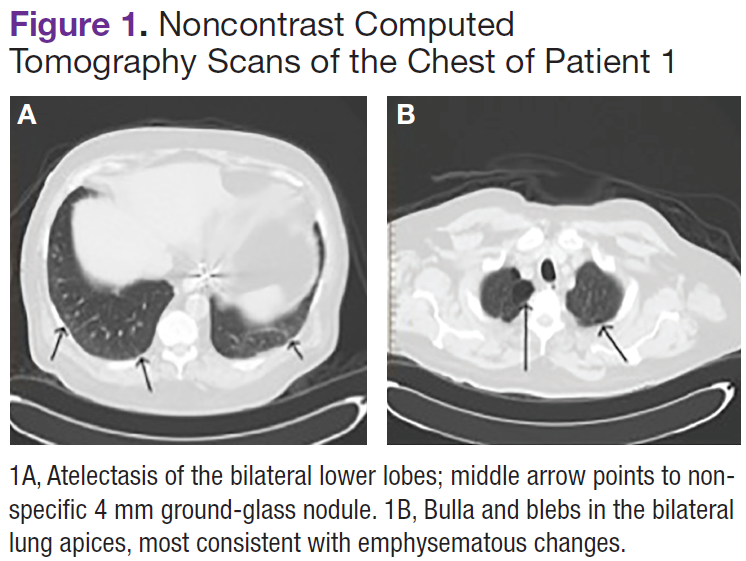
The patient's shortness of breath persisted despite treatment with diuretics, antibiotics, and steroids. Further laboratory workup revealed an elevated lactate dehydrogenase (LDH) level of 1,338 IU/L. A bone marrow biopsy performed because of concern about malignancy was unremarkable. Flow cytometry of the bone marrow aspirate did not reveal clonal B- or T-cell populations. Immunohistochemical staining was not performed. During this hospitalization for shortness of breath, the patient's mental staus began to decline, and his oxygen requirements increased. The patient was intubated but expired 48 hours after mechanical ventilation was initiated.
Patient 2
A white woman aged 67 years presented to the ED with generalized weakness, fatigue, and nausea. The patient’s medical history was significant for a diagnosis of stage IIIa ovarian cancer. She was treated with surgical resection and completed 6 cycles of adjuvant carboplatin and paclitaxel 3 months prior to this presentation. She had good response to treatment with normalization of CA-125. 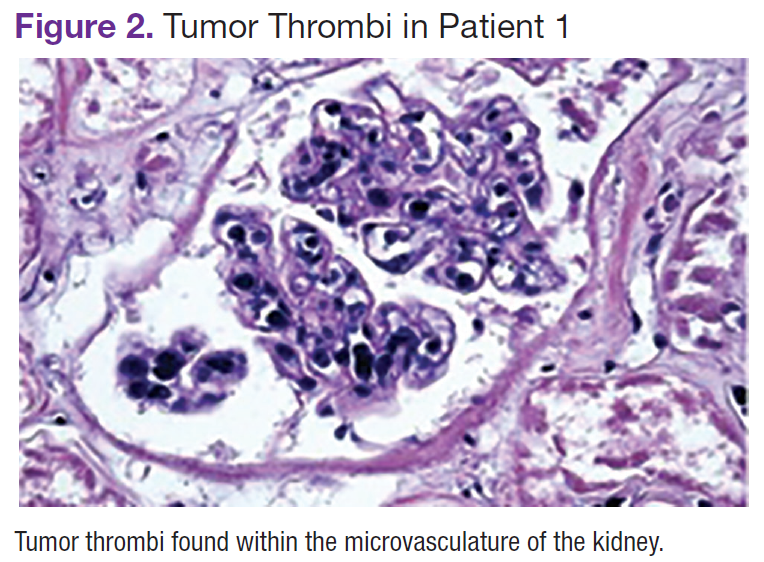
After completion of chemotherapy, the patient was found to have persistent anemia and thrombocytopenia. Admission laboratory results were significant for a hemoglobin level of 8.4 g/dL, a platelet count of 20,000/μL, and an LDH level of 1,220 IU/L.
Chest, abdomen, and pelvis CT scans showed mesenteric adenopathy and splenomegaly (Figures 3A, 3B, and 3C) compared with prior imaging. Bone marrow biopsy revealed large lymphoid cells with scant cytoplasm and irregular nuclei, primarily within blood vessels and sinusoids consistent with IVLBCL (Figure 4). Flow cytometry of the bone marrow specimen showed an abnormal B-cell population with expression CD20, CD19, FMC-7, and dim κ light chain restriction. The cells were negative for CD5 and CD10. Immunohistochemical staining was positive for CD20, CD79a, PAX5, BCL-2 , and MUM1.
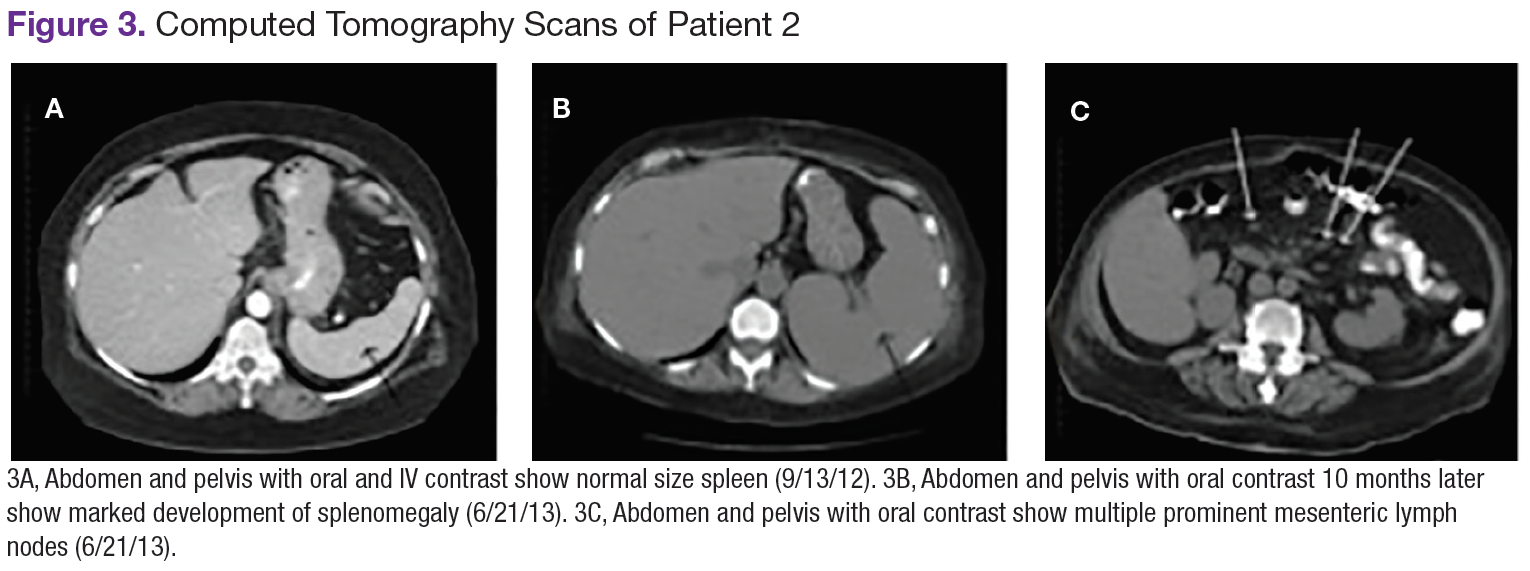
The patient was treated with 4 cycles of cyclophosphamide, doxorubicin, vincristine, prednisone, and rituximab, plus intrathecal methotrexate. The chemotherapy dose was reduced in the final cycle because of neuropathy in the hands and feet. The patient had undergone autologous stem-cell transplantation to allow high-dose chemotherapy. She was doing well more than 5 months after her transplant without evidence of recurrent disease.
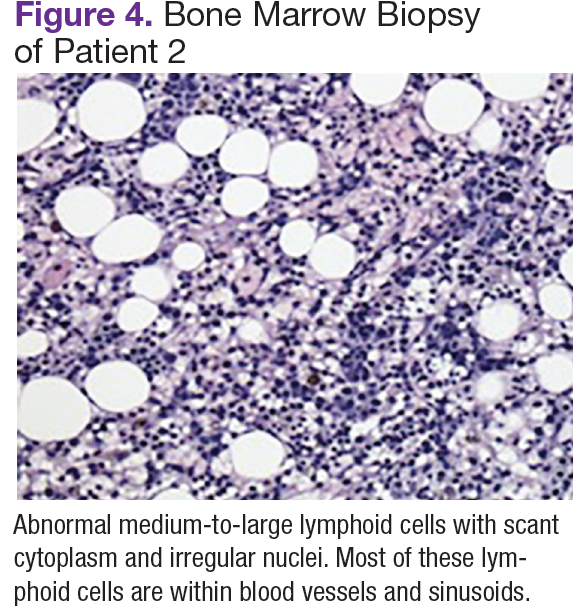
Patient 3
A white man aged 76 years presented to the ED with cutaneous nodules, weight loss, fatigue, fevers, and epigastric pain. The patient’s medical history was significant for asymptomatic lymphoplasmacytic lymphoma diagnosed 2 months earlier, which had not required treatment. Laboratory results on admission revealed transaminitis, mild anemia with a hemoglobin level of 11 g/dL, and LDH level of 497 IU/L.
Chest, abdomen, and pelvis CT scans showed a 1.7cm hepatic lesion and mesenteric adenopathy. A bone marrow biopsy was unchanged from prior studies and showed minimal involvement (5%) of marrow space by low grade B-cell lymphoma.
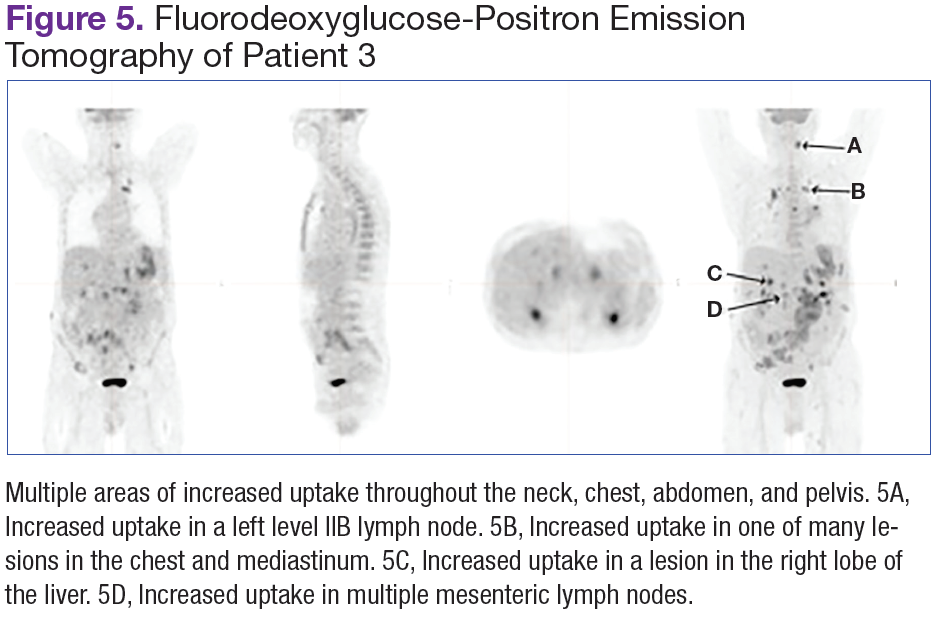
Fluorodeoxyglucose-positron emission tomography (FDG-PET) scans showed multiple areas of uptake in the neck, chest, abdomen, and pelvis (Figures 5 and 6). No increased uptake in the subcutaneous nodules was noted on examination. Laparoscopic biopsy of FDG-avid mesenteric nodes showed clusters of atypical large lymphoid cells resulting in distention of the vascular lumina, resulting in the diagnosis of IVLBCL (Figure 7).

Immunohistochemical stains showed that the intravascular lymphocytes were strongly positive for CD20 and BCL-2 and negative for CD5 and CD10. Flow cytometry on the sample was limited by a low cell count and could not be assessed for clonality. The patient completed 6 cycles of rituximab as well as intrathecal methotrexate. Restaging studies showed a complete remission.
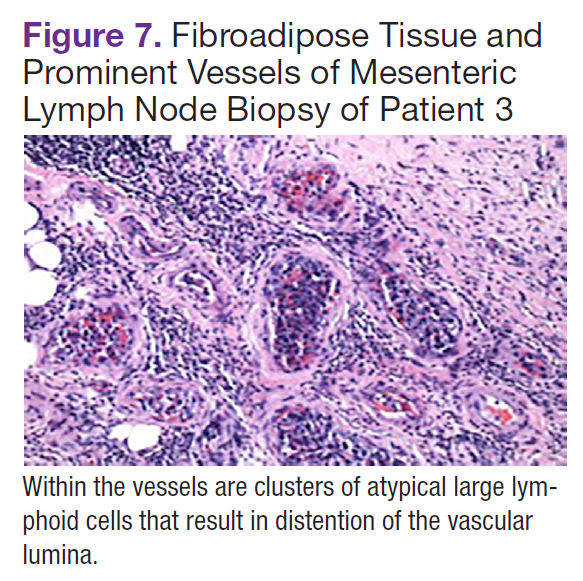
Two months later, the patient developed a skin nodule on the right shoulder. A repeat FDG-PET scan showed increased uptake, and fine-needle biopsy confirmed recurrent disease. The patient is undergoing treatment with ifosfamide, carboplatin, etoposide, and rituximab, as well as workup for autologous stem-cell transplant.
Discussion
Intravascular large B-cell lymphoma, a subtype of diffuse large B-cell lymphoma, is unique because it is primarily extranodal and typically without significant tumor burden.1-4 Standard imaging modalities, therefore, are often nonspecific and do not aid clinicians in establishing a diagnosis. Fluorodeoxyglucose-positron emission tomography has a known role in the assessment of diffuse large B-cell lymphoma, both at time of diagnosis and in monitoring response to treatment.5 However, the use of FDGPET in the diagnosis and management of IVLBCL has not been clearly established.
In a review of the literature, 26 English-language case reports and small case series reporting individual centers’ experience with the use of this imaging modality in the diagnosis of IVLBCL were identified. Two cases were eliminated from review because they did not discuss the use of FDG-PET in relationship to diagnosis. Of the remaining 24 cases, 21 underwent initial imaging with 1 or more of the following imaging modalities: CT, magnetic resonance, ultrasound, bone scan, and gallium scintigraphy, all of which were nonspecific and did not lead to a definitive diagnosis.3,6-25 Each of the 21 cases was followed up by FDG-PET; in 19, the FDG-PET scan was positive and resulted in a diagnosis of IVLBCL. In 2 cases, the FDG-PET scan was nonrevealing and was not considered helpful in diagnosis.11,18 In 3 of the 21 cases, the FDG-PET scan was the primary imaging modality.6,14,25
In this review, all 3 patients had initial imaging with CT scans of anatomic locations that were largely unrevealing, although later histologic examination showed them to be locations of active disease either by biopsy or on autopsy. One patient who underwent early FDG-PET was found to have increased uptake in the mesenteric lymph nodes, which were later biopsied, as well as uptake in the bilateral adrenal glands, lungs, and bone.
Several characteristic FDG-PET findings that have been described in the literature have been identified in patients with IVLBCL, including diffuse accumulation in bilateral lung fields, accumulation in the renal cortex or adrenal glands, diffuse bony involvement, and hypometabolism in the brain.7,10,12,13,17,23,25 These findings show that organs with the richest blood supply, specifically the lungs and kidneys, often are affected. The brain, an obligate glucose metabolizer, would be expected to have high uptake; however, with tumor thrombi occluding small intracranial vessels, micro infarcts ensue and are evidenced by areas of low uptake on FDG-PET scans in patients with IVLBCL.7 These characteristic patterns seen on FDG-PET scans can help to support a diagnosis of IVLBCL when clinical suspicion is high. Further, clinicians may be able to use imaging results to guide an appropriate site for biopsy to confirm diagnosis.
Conclusion
Intravascular large B-cell lymphoma remains a diagnostic challenge for clinicians. Prognosis is generally poor and likely related to frequent delays in diagnosis.1 Clinicians continue to work toward improving their ability to diagnose this disease in its early stages. New diagnostic algorithms and the use of random skin biopsies have shown some promise in improving diagnostic efficiency.26-28 Based on the authors’ experience and review of the literature, FDG-PET may be another promising tool to aid early diagnosis. Characteristic FDG-PET findings have been well described and may help to support the diagnosis of IVLBCL and guide an appropriate biopsy site when clinical suspicion for IVLBCL exists.
Author disclosures
The authors report no actual or potential conflicts of interest with regard to this article.
Disclaimer
The opinions expressed herein are those of the authors and do not necessarily reflect those of Federal Practitioner, Frontline Medical Communications Inc., the U.S. Government, or any of its agencies. This article may discuss unlabeled or investigational use of certain drugs. Please review complete prescribing information for specific drugs or drug combinations—including indications, contraindications, warnings, and adverse effects—before administering pharmacologic therapy to patients.
Click here to read the digital edition.
Patient 1
A white man aged 67 years, with diastolic heart failure and chronic obstructive pulmonary disease, presented to the emergency department (ED) with shortness of breath. The initial laboratory results were significant for a newly elevated creatinine level of 2.06 mg/dL and a brain natriuretic peptide level of 648 pg/mL.
Imaging studies included a chest radiograph, a ventilation/perfusion scan, and an echocardiogram, as well as a right heart catheterization. All were nondiagnostic.
The patient's shortness of breath persisted despite treatment with diuretics, antibiotics, and steroids. Further laboratory workup revealed an elevated lactate dehydrogenase (LDH) level of 1,338 IU/L. A bone marrow biopsy performed because of concern about malignancy was unremarkable. Flow cytometry of the bone marrow aspirate did not reveal clonal B- or T-cell populations. Immunohistochemical staining was not performed. During this hospitalization for shortness of breath, the patient's mental staus began to decline, and his oxygen requirements increased. The patient was intubated but expired 48 hours after mechanical ventilation was initiated.
Patient 2
A white woman aged 67 years presented to the ED with generalized weakness, fatigue, and nausea. The patient’s medical history was significant for a diagnosis of stage IIIa ovarian cancer. She was treated with surgical resection and completed 6 cycles of adjuvant carboplatin and paclitaxel 3 months prior to this presentation. She had good response to treatment with normalization of CA-125.
After completion of chemotherapy, the patient was found to have persistent anemia and thrombocytopenia. Admission laboratory results were significant for a hemoglobin level of 8.4 g/dL, a platelet count of 20,000/μL, and an LDH level of 1,220 IU/L.
Chest, abdomen, and pelvis CT scans showed mesenteric adenopathy and splenomegaly (Figures 3A, 3B, and 3C) compared with prior imaging. Bone marrow biopsy revealed large lymphoid cells with scant cytoplasm and irregular nuclei, primarily within blood vessels and sinusoids consistent with IVLBCL (Figure 4). Flow cytometry of the bone marrow specimen showed an abnormal B-cell population with expression CD20, CD19, FMC-7, and dim κ light chain restriction. The cells were negative for CD5 and CD10. Immunohistochemical staining was positive for CD20, CD79a, PAX5, BCL-2 , and MUM1.
The patient was treated with 4 cycles of cyclophosphamide, doxorubicin, vincristine, prednisone, and rituximab, plus intrathecal methotrexate. The chemotherapy dose was reduced in the final cycle because of neuropathy in the hands and feet. The patient had undergone autologous stem-cell transplantation to allow high-dose chemotherapy. She was doing well more than 5 months after her transplant without evidence of recurrent disease.
Patient 3
A white man aged 76 years presented to the ED with cutaneous nodules, weight loss, fatigue, fevers, and epigastric pain. The patient’s medical history was significant for asymptomatic lymphoplasmacytic lymphoma diagnosed 2 months earlier, which had not required treatment. Laboratory results on admission revealed transaminitis, mild anemia with a hemoglobin level of 11 g/dL, and LDH level of 497 IU/L.
Chest, abdomen, and pelvis CT scans showed a 1.7cm hepatic lesion and mesenteric adenopathy. A bone marrow biopsy was unchanged from prior studies and showed minimal involvement (5%) of marrow space by low grade B-cell lymphoma.
Fluorodeoxyglucose-positron emission tomography (FDG-PET) scans showed multiple areas of uptake in the neck, chest, abdomen, and pelvis (Figures 5 and 6). No increased uptake in the subcutaneous nodules was noted on examination. Laparoscopic biopsy of FDG-avid mesenteric nodes showed clusters of atypical large lymphoid cells resulting in distention of the vascular lumina, resulting in the diagnosis of IVLBCL (Figure 7).
Immunohistochemical stains showed that the intravascular lymphocytes were strongly positive for CD20 and BCL-2 and negative for CD5 and CD10. Flow cytometry on the sample was limited by a low cell count and could not be assessed for clonality. The patient completed 6 cycles of rituximab as well as intrathecal methotrexate. Restaging studies showed a complete remission.
Two months later, the patient developed a skin nodule on the right shoulder. A repeat FDG-PET scan showed increased uptake, and fine-needle biopsy confirmed recurrent disease. The patient is undergoing treatment with ifosfamide, carboplatin, etoposide, and rituximab, as well as workup for autologous stem-cell transplant.
Discussion
Intravascular large B-cell lymphoma, a subtype of diffuse large B-cell lymphoma, is unique because it is primarily extranodal and typically without significant tumor burden.1-4 Standard imaging modalities, therefore, are often nonspecific and do not aid clinicians in establishing a diagnosis. Fluorodeoxyglucose-positron emission tomography has a known role in the assessment of diffuse large B-cell lymphoma, both at time of diagnosis and in monitoring response to treatment.5 However, the use of FDGPET in the diagnosis and management of IVLBCL has not been clearly established.
In a review of the literature, 26 English-language case reports and small case series reporting individual centers’ experience with the use of this imaging modality in the diagnosis of IVLBCL were identified. Two cases were eliminated from review because they did not discuss the use of FDG-PET in relationship to diagnosis. Of the remaining 24 cases, 21 underwent initial imaging with 1 or more of the following imaging modalities: CT, magnetic resonance, ultrasound, bone scan, and gallium scintigraphy, all of which were nonspecific and did not lead to a definitive diagnosis.3,6-25 Each of the 21 cases was followed up by FDG-PET; in 19, the FDG-PET scan was positive and resulted in a diagnosis of IVLBCL. In 2 cases, the FDG-PET scan was nonrevealing and was not considered helpful in diagnosis.11,18 In 3 of the 21 cases, the FDG-PET scan was the primary imaging modality.6,14,25
In this review, all 3 patients had initial imaging with CT scans of anatomic locations that were largely unrevealing, although later histologic examination showed them to be locations of active disease either by biopsy or on autopsy. One patient who underwent early FDG-PET was found to have increased uptake in the mesenteric lymph nodes, which were later biopsied, as well as uptake in the bilateral adrenal glands, lungs, and bone.
Several characteristic FDG-PET findings that have been described in the literature have been identified in patients with IVLBCL, including diffuse accumulation in bilateral lung fields, accumulation in the renal cortex or adrenal glands, diffuse bony involvement, and hypometabolism in the brain.7,10,12,13,17,23,25 These findings show that organs with the richest blood supply, specifically the lungs and kidneys, often are affected. The brain, an obligate glucose metabolizer, would be expected to have high uptake; however, with tumor thrombi occluding small intracranial vessels, micro infarcts ensue and are evidenced by areas of low uptake on FDG-PET scans in patients with IVLBCL.7 These characteristic patterns seen on FDG-PET scans can help to support a diagnosis of IVLBCL when clinical suspicion is high. Further, clinicians may be able to use imaging results to guide an appropriate site for biopsy to confirm diagnosis.
Conclusion
Intravascular large B-cell lymphoma remains a diagnostic challenge for clinicians. Prognosis is generally poor and likely related to frequent delays in diagnosis.1 Clinicians continue to work toward improving their ability to diagnose this disease in its early stages. New diagnostic algorithms and the use of random skin biopsies have shown some promise in improving diagnostic efficiency.26-28 Based on the authors’ experience and review of the literature, FDG-PET may be another promising tool to aid early diagnosis. Characteristic FDG-PET findings have been well described and may help to support the diagnosis of IVLBCL and guide an appropriate biopsy site when clinical suspicion for IVLBCL exists.
Author disclosures
The authors report no actual or potential conflicts of interest with regard to this article.
Disclaimer
The opinions expressed herein are those of the authors and do not necessarily reflect those of Federal Practitioner, Frontline Medical Communications Inc., the U.S. Government, or any of its agencies. This article may discuss unlabeled or investigational use of certain drugs. Please review complete prescribing information for specific drugs or drug combinations—including indications, contraindications, warnings, and adverse effects—before administering pharmacologic therapy to patients.
Click here to read the digital edition.
γ-δ T-Cell Lymphoma With Disseminated Intravascular Coagulation and Autoimmune Hemolytic Anemia
Gamma-delta (γ-δ) T-cell lymphomas (GDTCL) are rare and aggressive cancers with specific morphologic, phenotypic, and functional properties. When discovered in 1984, the T-cell receptor (TCR) was characterized as an alpha-beta (α-β) heterodimer. The γ-δ heterodimer was discovered later, when a third rearranging gene was recognized.1
Gaulard and colleagues described the first case of peripheral neoplasm with the γ-δ TCR.2 Now the present authors report the case of a patient with an autoimmune hemolytic anemia (AIHA) with both cold and warm antibodies—an atypical presentation of this rare form of TCL. Such a case has not been previously reported.
Clinical History
A 77-year-old woman with a past medical history of osteoarthritis, gout, mitral stenosis, bioprosthetic aortic valve replacement, and obesity presented to the emergency department (ED) reporting progressive weakness, confusion, and jaundice. She had been recently discharged from
another hospital after an 18-day stay for gangrenous cholecystitis and shingles. Her home medications were metronidazole and acyclovir. In the ED, she was febrile at 100.5°. Laboratory test results revealed anemia with a hemoglobin level of 50 g/L (83 g/L in clinic 2 weeks earlier) and neutropenia with an absolute neutrophilic count of 500 cells/μL (normal range 1,520-6,370 cells/μL). She also was thrombocytopenic with a platelet count of 71x109/L (normal range 150-450×109/L).
On admission, the hematology service was consulted for pancytopenia. The pertinent workup included a lactate dehydrogenase level of 31.16 μkat/L (normal range 1.7-3.4 μkat/L), a haptoglobin level of < 1,500 mg/L (normal range 260-1,850 mg/L), and a direct bilirubin level of 13.68 μmol/L (normal range 1.7-5.1 μmol/L). A peripheral blood smear was negative for schistocytes. Fibrin split products were 40 mg/L (normal < 10 mg/L), fibrinogen level was 6.94 μmol/L (normal range 5.8-11.8 μmol/L), prothrombin time was 14.6 seconds (normal range 10-14 sec), and international normalized ratio was 1.3 (normal < 1). The concomitant decrease in fibrinogen level and increase in fibrin split product titers were consistent with the diagnosis of acute disseminated intravascular coagulation. Iron studies were consistent with anemia of chronic disease (low reticulocyte count of 0.4%) and vitamin B12 deficiency (level 195). Coombs test results were positive for both cold and warm antibodies, with cold being more prominent. Abdominal ultrasonography revealed hepatosplenomegaly (HSM).
The patient was diagnosed with AIHA with no initial obvious underlying etiology. The differential diagnosis included autoimmune disorder, lymphoproliferative disease, and drug-induced process. She also was diagnosed with sepsis, which was thought to be contributing to the pancytopenia.
Broad-spectrum antibiotics (cefepime, metronidazole) and vitamin B12 supplements were started. After a blood transfusion, the patient developed fever and hypoxia, which required transfer to the medical intensive care unit. The differentials at this time included a transfusion reaction and/or transfusion-associated circulatory overload. Intravenous immunoglobulin was started at 1 g/kg to help with cold agglutinins. Prednisone 1 mg/kg was started as well. Peripheral blood flow cytometry results were positive for an abnormal T-cell population likely consistent with T-cell lineage lymphoma. Bone marrow biopsy results were consistent with GDTCL. Computed tomography (CT) of chest/abdomen/pelvis showed bilateral lung nodules < 1 cm, HSM with multiple spleen infarcts, and a 4.7-cm right adnexal soft-tissue lesion. Liver biopsy results were consistent with GDTCL. Results of a workup for cytomegalovirus and Epstein-Barr virus were negative, as was a mycoplasma screen. The patient was diagnosed with GDTCL with hepatic involvement, and CHOP (cyclophosphamide, hydroxydaunorubicin [doxorubicin], Oncovin [vincristine], prednisone) therapy was started.
Discussion
Peripheral TCL (PTCL) are a rare, typically extranodal group of malignancies. They are aggressive and generally have a poor outcome, with most patients dying of lymphoma within 2 years.3 T-cell lymphomas most commonly express the γ-δ TCR. About 2% to 4% of TCLs express the γ-δ TCR.4 In 2008, the World Health Organization recognized 2 distinct GDTCL subgroups: hepatosplenic GDTCL (HSGDTCL) and primary cutaneous GDTCL.5 As the patient presented with hepatic involvement, this discussion focused on HSGDTCL.
Hepatosplenic GDTCL are rare types of PTCL. First described as a separate TCL subgroup in the 1990 REAL (Revised European-American Lymphoma) classification,6 they are estimated to represent about 1.4% of all TCL, with about 100 cases reported in the literature.4
The GDTCL cells tend to live in mucosa, lymphoid tissue, epithelial-rich tissues (skin, gastrointestinal tract), and red pulp of spleen.7 They develop from thymic precursors in bone marrow and are CD4-/CD8- and thus known as double negative cells.8 They mimic natural killer cells, behave as cytotoxic cells, and are capable of TCR rearrangement as well as phagocytosis.9
Hepatosplenic GDTCL are usually phenotypically CD2+, CD3+, CD4-, CD5-, CD7+, CD8-, and TCR γ-δ+.10 They are rarely associated with Epstein-Barr virus infection; reported cases seem more common in Asia.11 Peak incidence is in young men (median age 20-25 years; male:female ratio 10:1). At-risk populations include the chronically immunosuppressed, including solid organ transplanted patients and patients under prolonged antigenic stimulation.12
The most common clinical features of HSGDTCL include B symptoms (fever of unknown origin, night sweats, loss of > 10% of body weight), marked HSM, and lack of lymphadenopathy. Patients often present with fever, weakness, and abdominal pain. Laboratory test results
typically show abnormal liver function and abnormal lactate dehydrogenase levels. Bone marrow is almost always involved, with possible trilineage cytopenia. Anemia and thrombocytopenia are reported in 75% and 85% of cases, respectively.13
Warm (70%) and cold auto-antibodies are the 2 classifications of AIHA.14 The AIHA can be primary, idiopathic, or a manifestation of underlying disease conditions, including non-Hodgkin lymphomas, systemic autoimmune diseases, chronic infections, postorgan transplantation, and solid tumors. It has also been reported as a complication of treatment with nucleoside analogues.15
Lacking specific symptoms, HSGDTCL is usually diagnosed late. The diagnosis should be suspected in young men who present with the aforementioned symptoms. However, not everyone with HSGDTCL falls in that group—the present patient was a 77-year-old woman.
Hepatosplenic GDTCL staging is similar to staging of other non-Hodgkin lymphomas. Total-body CT with contrast, bone marrow aspiration/biopsy, and direct lesion biopsy are required. Although positron emission tomography is generally thought to be as useful in TCL as in B-cell lymphomas, there is not enough evidence to support its use specifically in HSGDTCL.16 The staging classification follows the Ann Arbor system, with the majority of cases classified as stage IV.
Hepatosplenic GDTCL are aggressive tumors with a strong tendency to rapidly progress, and they are highly resistant to primary chemotherapy agents. Remission is rarely complete with use of conventional chemotherapy agents. Most patients die of the disease within 2 years of
diagnosis.12 Although the rarity of HSGDTCL has made it difficult to identify any clear prognostic factors, a correlation between thrombocytopenia severity and disease progression has been found in many studies.17 There is no standard treatment regimen. Proposed therapies
include splenectomy (for diagnosis or thrombocytopenia management), corticosteroids, alkylating agents, purine analogue, anthracycline-containing regimens, and cytarabine/cisplatin combinations. The anthracycline-based regimen most commonly used as first-line therapy is CHOP, or CHOP derivatives, with complete remission rates between 30% and 45%. However, long-term results remain disappointing (median relapse time 4 months).10 In 3 reviews, median survival was 16 months, 11 months, and 9.5 months.10,17,18 In the International T-Cell Lymphoma Project study, the 5-year failure-free survival rate was 0%, and the overall survival rate was 7%.4 In these studies, the majority of patients received some variation of CHOP-based therapy, and although positive responses were appreciated in many of the cases, they were generally short-lived.
These results have been disappointing, and other modalities have been tried—including high-dose cytarabine regimens, 2'-deoxycoformycin (pentostatin), and anti-CD52 monoclonal antibodies (alemtuzumab).19 In an HSGDTCL study, 2 of 21 patients treated with platinum/cytarabine-based induction regimens were still in remission at 42 and 52 months.17 Another study examined a variety of induction regimens used to treat HSGDTCL in 15 patients.18 Responses tended to be more durable in patients who received a dose-intense Hyper-CVIDDoxil regimen (fractionated cyclophosphamide, liposomal doxorubicin, vincristine, dexamethasone) alternated with methotrexate and cytarabine. Complete response was 50%, and median duration of complete response was 8 months. Over the past 10 years, a few case reports have described successful treatment with autologous or allogeneic stem cell transplantation.20
Conclusion
The present case represents a unique HSGDTCL presentation. To the authors’ knowledge, this is the first report of HSGDTCL presenting with acute disseminated intravascular coagulation and AIHA with both cold and warm antibodies.
Hepatosplenic GDTCL is a rare, novel disease. To understand more about this pathology, investigators need to better characterize the disease process and the manifestations. The hope is that more information will contribute to the development of more effective therapies. The unique presentation reported here may help in further characterizing and understanding this uncommon disease.
Author disclosures
The authors report no actual or potential conflicts of interest with regard to this article.
Disclaimer
The opinions expressed herein are those of the authors and do not necessarily reflect those of Federal Practitioner, Frontline Medical Communications Inc., the U.S. Government, or any of its agencies.
Click here to read the digital edition.
1. Saito H, Kranz DM, Takagaki Y, Hayday AC, Eisen HN, Tonegawa S. A third rearranged and expressed gene in a clone of cytotoxic T lymphocytes. Nature. 1984;312(5989):36-40.
2. Gaulard P, Zafrani ES, Mavier P, et al. Peripheral T-cell lymphoma presenting as predominant liver disease: a report of three cases. Hepatology. 1986;6(5):864-868.
3. Gaulard P, de Leval L. Pathology of peripheral T-cell lymphomas: where do we stand? Semin Hematol. 2014;51(1):5-16.
4. Vose J, Armitage J, Weisenburger D; International T-Cell Lymphoma Project. International peripheral T-cell and natural killer/T-cell lymphoma study: pathology findings and clinical outcomes. J Clin Oncol. 2008;26(25):4124-4130.
5. The International Agency for Research on Cancer. In: Swerdlow SH, Campo E, Harris NL, et al, eds. WHO Classification of Tumours of Haematopoietic and Lymphoid Tissues. Vol 2. 4th ed. Lyon, France: IARC Press; 2008.
6. Harris NL, Jaffe ES, Stein H, et al. A revised European-American classification of lymphoid neoplasm: a proposal from the International Lymphoma Study Group. Blood. 1994;84(5):1361-1392.
7. Farcet JP, Gaulard P, Marolleau JP, et al. Hepatosplenic T-cell lymphoma: sinusal/sinusoidal localization of malignant cells expressing the T-cell receptor gamma delta. Blood. 1990;75(11):2213-2219.
8. Bluestone JA, Khattri R, Sciammas R, Sperling AI. TCR gamma delta cells: a specialized T-cell subset in the immune system. Annu Rev Cell Dev Biol. 1995;11:307-353.
9. Holtmeier W, Kabelitz D. Gamma delta T cells link innate and adaptive immune responses. Chem Immunol Allergy. 2005;86:151-183.
10. Weidmann E. Hepatosplenic T cell lymphoma. A review on 45 cases since the first report describing the disease as a distinct lymphoma entity in 1990. Leukemia. 2000;14(6):991-997.
11. Yu WW, Hsieh PP, Chuang SS. Cutaneous EBV-positive γδ T-cell lymphoma vs. extranodal NK/T-cell lymphoma: a case report and literature review. J Cutan Pathol. 2013;40(3):310-316.
12. Tripodo C, Iannitto E, Florena AM, et al. Gamma-delta T-cell lymphomas. Nat Rev Clin Oncol. 2009;6(12):707-717.
13. Foppoli M, Ferreri AJM. Gamma-delta T-cell lymphomas. Eur J Haematol. 2015;94(3):206-218.
14. Hoffbrand AV, Catovsky D, Tuddenham EGD, Green AR, eds. Postgraduate Haematology. 6th ed. Oxford, England: Wiley-Blackwell; 2011.
15. Valent P, Lechner K. Diagnosis and treatment of autoimmune haemolytic anaemias in adults: a clinical review. Wien Klin Wochenschr. 2008;120(5-6):136-151.
16. Khong PL, Pang CB, Liang R, Kwong YL, Au WY. Fluorine-18 fluorodeoxyglucose positron emission tomography in mature T-cell and natural killer cell malignancies. Ann Hematol. 2008;87(8):613-621.
17. Belhadj K, Reyes F, Farcet JP, et al. Hepatosplenic gammadelta T-cell lymphoma is a rare clinicopathologic entity with poor outcome: report on a series of 21 patients. Blood. 2003;102(13):4261-4269.
18. Falchook GS, Vega F, Dang NH, et al. Hepatosplenic gamma-delta T-cell lymphoma: clinicopathological features and treatment. Ann Oncol. 2009;20(6):1080-1085.
19. Konuma T, Ooi J, Takahashi S, et al. Allogeneic stem cell transplantation for hepatosplenic
gammadelta T-cell lymphoma. Leuk Lymphoma. 2007;48(3):630-632.
20. Ferreri AJ, Govi S, Pileri SA. Hepatosplenic gamma-delta T-cell lymphoma. Crit
Rev Oncol Hematol. 2012;83(2):283-292.
Gamma-delta (γ-δ) T-cell lymphomas (GDTCL) are rare and aggressive cancers with specific morphologic, phenotypic, and functional properties. When discovered in 1984, the T-cell receptor (TCR) was characterized as an alpha-beta (α-β) heterodimer. The γ-δ heterodimer was discovered later, when a third rearranging gene was recognized.1
Gaulard and colleagues described the first case of peripheral neoplasm with the γ-δ TCR.2 Now the present authors report the case of a patient with an autoimmune hemolytic anemia (AIHA) with both cold and warm antibodies—an atypical presentation of this rare form of TCL. Such a case has not been previously reported.
Clinical History
A 77-year-old woman with a past medical history of osteoarthritis, gout, mitral stenosis, bioprosthetic aortic valve replacement, and obesity presented to the emergency department (ED) reporting progressive weakness, confusion, and jaundice. She had been recently discharged from
another hospital after an 18-day stay for gangrenous cholecystitis and shingles. Her home medications were metronidazole and acyclovir. In the ED, she was febrile at 100.5°. Laboratory test results revealed anemia with a hemoglobin level of 50 g/L (83 g/L in clinic 2 weeks earlier) and neutropenia with an absolute neutrophilic count of 500 cells/μL (normal range 1,520-6,370 cells/μL). She also was thrombocytopenic with a platelet count of 71x109/L (normal range 150-450×109/L).
On admission, the hematology service was consulted for pancytopenia. The pertinent workup included a lactate dehydrogenase level of 31.16 μkat/L (normal range 1.7-3.4 μkat/L), a haptoglobin level of < 1,500 mg/L (normal range 260-1,850 mg/L), and a direct bilirubin level of 13.68 μmol/L (normal range 1.7-5.1 μmol/L). A peripheral blood smear was negative for schistocytes. Fibrin split products were 40 mg/L (normal < 10 mg/L), fibrinogen level was 6.94 μmol/L (normal range 5.8-11.8 μmol/L), prothrombin time was 14.6 seconds (normal range 10-14 sec), and international normalized ratio was 1.3 (normal < 1). The concomitant decrease in fibrinogen level and increase in fibrin split product titers were consistent with the diagnosis of acute disseminated intravascular coagulation. Iron studies were consistent with anemia of chronic disease (low reticulocyte count of 0.4%) and vitamin B12 deficiency (level 195). Coombs test results were positive for both cold and warm antibodies, with cold being more prominent. Abdominal ultrasonography revealed hepatosplenomegaly (HSM).
The patient was diagnosed with AIHA with no initial obvious underlying etiology. The differential diagnosis included autoimmune disorder, lymphoproliferative disease, and drug-induced process. She also was diagnosed with sepsis, which was thought to be contributing to the pancytopenia.
Broad-spectrum antibiotics (cefepime, metronidazole) and vitamin B12 supplements were started. After a blood transfusion, the patient developed fever and hypoxia, which required transfer to the medical intensive care unit. The differentials at this time included a transfusion reaction and/or transfusion-associated circulatory overload. Intravenous immunoglobulin was started at 1 g/kg to help with cold agglutinins. Prednisone 1 mg/kg was started as well. Peripheral blood flow cytometry results were positive for an abnormal T-cell population likely consistent with T-cell lineage lymphoma. Bone marrow biopsy results were consistent with GDTCL. Computed tomography (CT) of chest/abdomen/pelvis showed bilateral lung nodules < 1 cm, HSM with multiple spleen infarcts, and a 4.7-cm right adnexal soft-tissue lesion. Liver biopsy results were consistent with GDTCL. Results of a workup for cytomegalovirus and Epstein-Barr virus were negative, as was a mycoplasma screen. The patient was diagnosed with GDTCL with hepatic involvement, and CHOP (cyclophosphamide, hydroxydaunorubicin [doxorubicin], Oncovin [vincristine], prednisone) therapy was started.
Discussion
Peripheral TCL (PTCL) are a rare, typically extranodal group of malignancies. They are aggressive and generally have a poor outcome, with most patients dying of lymphoma within 2 years.3 T-cell lymphomas most commonly express the γ-δ TCR. About 2% to 4% of TCLs express the γ-δ TCR.4 In 2008, the World Health Organization recognized 2 distinct GDTCL subgroups: hepatosplenic GDTCL (HSGDTCL) and primary cutaneous GDTCL.5 As the patient presented with hepatic involvement, this discussion focused on HSGDTCL.
Hepatosplenic GDTCL are rare types of PTCL. First described as a separate TCL subgroup in the 1990 REAL (Revised European-American Lymphoma) classification,6 they are estimated to represent about 1.4% of all TCL, with about 100 cases reported in the literature.4
The GDTCL cells tend to live in mucosa, lymphoid tissue, epithelial-rich tissues (skin, gastrointestinal tract), and red pulp of spleen.7 They develop from thymic precursors in bone marrow and are CD4-/CD8- and thus known as double negative cells.8 They mimic natural killer cells, behave as cytotoxic cells, and are capable of TCR rearrangement as well as phagocytosis.9
Hepatosplenic GDTCL are usually phenotypically CD2+, CD3+, CD4-, CD5-, CD7+, CD8-, and TCR γ-δ+.10 They are rarely associated with Epstein-Barr virus infection; reported cases seem more common in Asia.11 Peak incidence is in young men (median age 20-25 years; male:female ratio 10:1). At-risk populations include the chronically immunosuppressed, including solid organ transplanted patients and patients under prolonged antigenic stimulation.12
The most common clinical features of HSGDTCL include B symptoms (fever of unknown origin, night sweats, loss of > 10% of body weight), marked HSM, and lack of lymphadenopathy. Patients often present with fever, weakness, and abdominal pain. Laboratory test results
typically show abnormal liver function and abnormal lactate dehydrogenase levels. Bone marrow is almost always involved, with possible trilineage cytopenia. Anemia and thrombocytopenia are reported in 75% and 85% of cases, respectively.13
Warm (70%) and cold auto-antibodies are the 2 classifications of AIHA.14 The AIHA can be primary, idiopathic, or a manifestation of underlying disease conditions, including non-Hodgkin lymphomas, systemic autoimmune diseases, chronic infections, postorgan transplantation, and solid tumors. It has also been reported as a complication of treatment with nucleoside analogues.15
Lacking specific symptoms, HSGDTCL is usually diagnosed late. The diagnosis should be suspected in young men who present with the aforementioned symptoms. However, not everyone with HSGDTCL falls in that group—the present patient was a 77-year-old woman.
Hepatosplenic GDTCL staging is similar to staging of other non-Hodgkin lymphomas. Total-body CT with contrast, bone marrow aspiration/biopsy, and direct lesion biopsy are required. Although positron emission tomography is generally thought to be as useful in TCL as in B-cell lymphomas, there is not enough evidence to support its use specifically in HSGDTCL.16 The staging classification follows the Ann Arbor system, with the majority of cases classified as stage IV.
Hepatosplenic GDTCL are aggressive tumors with a strong tendency to rapidly progress, and they are highly resistant to primary chemotherapy agents. Remission is rarely complete with use of conventional chemotherapy agents. Most patients die of the disease within 2 years of
diagnosis.12 Although the rarity of HSGDTCL has made it difficult to identify any clear prognostic factors, a correlation between thrombocytopenia severity and disease progression has been found in many studies.17 There is no standard treatment regimen. Proposed therapies
include splenectomy (for diagnosis or thrombocytopenia management), corticosteroids, alkylating agents, purine analogue, anthracycline-containing regimens, and cytarabine/cisplatin combinations. The anthracycline-based regimen most commonly used as first-line therapy is CHOP, or CHOP derivatives, with complete remission rates between 30% and 45%. However, long-term results remain disappointing (median relapse time 4 months).10 In 3 reviews, median survival was 16 months, 11 months, and 9.5 months.10,17,18 In the International T-Cell Lymphoma Project study, the 5-year failure-free survival rate was 0%, and the overall survival rate was 7%.4 In these studies, the majority of patients received some variation of CHOP-based therapy, and although positive responses were appreciated in many of the cases, they were generally short-lived.
These results have been disappointing, and other modalities have been tried—including high-dose cytarabine regimens, 2'-deoxycoformycin (pentostatin), and anti-CD52 monoclonal antibodies (alemtuzumab).19 In an HSGDTCL study, 2 of 21 patients treated with platinum/cytarabine-based induction regimens were still in remission at 42 and 52 months.17 Another study examined a variety of induction regimens used to treat HSGDTCL in 15 patients.18 Responses tended to be more durable in patients who received a dose-intense Hyper-CVIDDoxil regimen (fractionated cyclophosphamide, liposomal doxorubicin, vincristine, dexamethasone) alternated with methotrexate and cytarabine. Complete response was 50%, and median duration of complete response was 8 months. Over the past 10 years, a few case reports have described successful treatment with autologous or allogeneic stem cell transplantation.20
Conclusion
The present case represents a unique HSGDTCL presentation. To the authors’ knowledge, this is the first report of HSGDTCL presenting with acute disseminated intravascular coagulation and AIHA with both cold and warm antibodies.
Hepatosplenic GDTCL is a rare, novel disease. To understand more about this pathology, investigators need to better characterize the disease process and the manifestations. The hope is that more information will contribute to the development of more effective therapies. The unique presentation reported here may help in further characterizing and understanding this uncommon disease.
Author disclosures
The authors report no actual or potential conflicts of interest with regard to this article.
Disclaimer
The opinions expressed herein are those of the authors and do not necessarily reflect those of Federal Practitioner, Frontline Medical Communications Inc., the U.S. Government, or any of its agencies.
Click here to read the digital edition.
1. Saito H, Kranz DM, Takagaki Y, Hayday AC, Eisen HN, Tonegawa S. A third rearranged and expressed gene in a clone of cytotoxic T lymphocytes. Nature. 1984;312(5989):36-40.
2. Gaulard P, Zafrani ES, Mavier P, et al. Peripheral T-cell lymphoma presenting as predominant liver disease: a report of three cases. Hepatology. 1986;6(5):864-868.
3. Gaulard P, de Leval L. Pathology of peripheral T-cell lymphomas: where do we stand? Semin Hematol. 2014;51(1):5-16.
4. Vose J, Armitage J, Weisenburger D; International T-Cell Lymphoma Project. International peripheral T-cell and natural killer/T-cell lymphoma study: pathology findings and clinical outcomes. J Clin Oncol. 2008;26(25):4124-4130.
5. The International Agency for Research on Cancer. In: Swerdlow SH, Campo E, Harris NL, et al, eds. WHO Classification of Tumours of Haematopoietic and Lymphoid Tissues. Vol 2. 4th ed. Lyon, France: IARC Press; 2008.
6. Harris NL, Jaffe ES, Stein H, et al. A revised European-American classification of lymphoid neoplasm: a proposal from the International Lymphoma Study Group. Blood. 1994;84(5):1361-1392.
7. Farcet JP, Gaulard P, Marolleau JP, et al. Hepatosplenic T-cell lymphoma: sinusal/sinusoidal localization of malignant cells expressing the T-cell receptor gamma delta. Blood. 1990;75(11):2213-2219.
8. Bluestone JA, Khattri R, Sciammas R, Sperling AI. TCR gamma delta cells: a specialized T-cell subset in the immune system. Annu Rev Cell Dev Biol. 1995;11:307-353.
9. Holtmeier W, Kabelitz D. Gamma delta T cells link innate and adaptive immune responses. Chem Immunol Allergy. 2005;86:151-183.
10. Weidmann E. Hepatosplenic T cell lymphoma. A review on 45 cases since the first report describing the disease as a distinct lymphoma entity in 1990. Leukemia. 2000;14(6):991-997.
11. Yu WW, Hsieh PP, Chuang SS. Cutaneous EBV-positive γδ T-cell lymphoma vs. extranodal NK/T-cell lymphoma: a case report and literature review. J Cutan Pathol. 2013;40(3):310-316.
12. Tripodo C, Iannitto E, Florena AM, et al. Gamma-delta T-cell lymphomas. Nat Rev Clin Oncol. 2009;6(12):707-717.
13. Foppoli M, Ferreri AJM. Gamma-delta T-cell lymphomas. Eur J Haematol. 2015;94(3):206-218.
14. Hoffbrand AV, Catovsky D, Tuddenham EGD, Green AR, eds. Postgraduate Haematology. 6th ed. Oxford, England: Wiley-Blackwell; 2011.
15. Valent P, Lechner K. Diagnosis and treatment of autoimmune haemolytic anaemias in adults: a clinical review. Wien Klin Wochenschr. 2008;120(5-6):136-151.
16. Khong PL, Pang CB, Liang R, Kwong YL, Au WY. Fluorine-18 fluorodeoxyglucose positron emission tomography in mature T-cell and natural killer cell malignancies. Ann Hematol. 2008;87(8):613-621.
17. Belhadj K, Reyes F, Farcet JP, et al. Hepatosplenic gammadelta T-cell lymphoma is a rare clinicopathologic entity with poor outcome: report on a series of 21 patients. Blood. 2003;102(13):4261-4269.
18. Falchook GS, Vega F, Dang NH, et al. Hepatosplenic gamma-delta T-cell lymphoma: clinicopathological features and treatment. Ann Oncol. 2009;20(6):1080-1085.
19. Konuma T, Ooi J, Takahashi S, et al. Allogeneic stem cell transplantation for hepatosplenic
gammadelta T-cell lymphoma. Leuk Lymphoma. 2007;48(3):630-632.
20. Ferreri AJ, Govi S, Pileri SA. Hepatosplenic gamma-delta T-cell lymphoma. Crit
Rev Oncol Hematol. 2012;83(2):283-292.
Consensus Statement Supporting the Recommendation for Single-Fraction Palliative Radiotherapy for Uncomplicated, Painful Bone Metastases
The authors would like to acknowledge Tony Quang, MD, JD, for the advice given on this project.
Palliative radiotherapy for bone metastases is typically delivered either as a short course of 1 to 5 fractions or protracted over longer courses of up to 20 treatments. These longer courses can be burdensome and discourage its utilization, despite a 50% to 80% likelihood of meaningful pain relief from only a single fraction of radiation therapy. Meanwhile, there are multiple randomized studies that have demonstrated that shorter course(s) are equivalent for pain control.
Although the VHA currently has 143 medical facilities that have cancer diagnostic and treatment capabilities, only 40 have radiation oncology services on-site.1 Thus, access to palliative radiotherapy may be limited for veterans who do not live close by, and many may seek care outside the VHA. At VHA radiation oncology centers, single-fraction radiation therapy (SFRT) is routinely offered by the majority of radiation oncologists.2,3 However, the longer course is commonly preferred outside the VA, and a recent SEER-Medicare analysis of more than 3,000 patients demonstrated that the majority of patients treated outside the VA actually receive more than 10 treatments.4 For this reason, the VA National Palliative Radiotherapy Task Force prepared this document to provide guidance for clinicians within and outside the VA to increase awareness of the appropriateness, effectiveness, and convenience of SFRT as opposed to longer courses of treatment that increase the burden of care at the end of life and often are unnecessary.
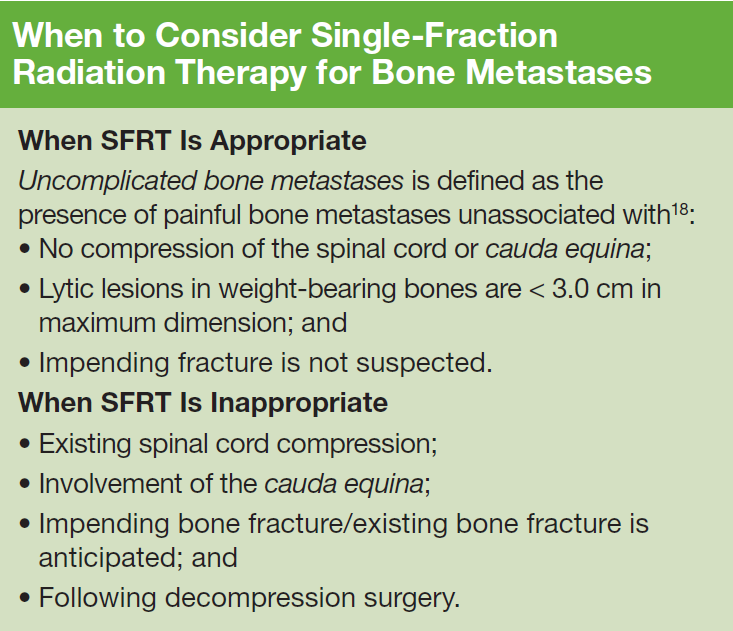
Veterans, Cancer, and Metastases
Within the VA, an estimated 40,000 new cancer cases are diagnosed each year, and 175,000 veterans undergo cancer care within the VHA annually.1 Unfortunately, the majority will develop bone metastases with postmortem examinations, suggesting that the rate can be as high as 90% at the end of life.5-7 For many, including veterans with cancer, pain control can be difficult, and access to palliative radiotherapy is critical.8
Single-Fraction Palliatiev Radiation Therapy
Historically, patients with painful bone metastases have been treated with courses of palliative radiotherapy ranging between 2 and 4 weeks of daily treatments. However, several large randomized clinical trials comparing a single treatment with multiple treatments have established that SFRT provides equivalent rates of pain relief even when it may be required for a second time.9-12 Recommendations based on these trials have been incorporated into various treatment guidelines that widely acknowledge the efficacy of SFRT.13-15
For this reason, SFRT is often preferred at many centers because it is substantially more convenient for patients with cancer. It reduces travel time for daily radiation clinic visits, which allows for more time with loved ones outside the medical establishment. Furthermore, SFRT improves patient access to radiotherapy and reduces costs. The benefits can be direct as well as indirect to those who have to take time for numerous visits.
Longer courses of palliative radiotherapy can be burdensome for patients and primary care providers. Unnecessarily protracted courses of palliative radiotherapy also delay the receipt of systemic therapies because they are typically considered unsafe to administer concurrently. Moreover, when SFRT is unavailable, the burden of long-course palliation is known to discourage health care providers from referring patients since opioid therapy is more convenient, even though it exchanges lucidity for analgesia.16,17
For this reason, the authors believe that it is in the best interest for veterans with terminal cancers and their providers to be aware of the shorter SFRT for effective, convenient pain relief. This treatment option is particularly relevant for patients with a poor performance status, patients already in hospice care, or patient who travel long distances.
Author disclosures
The authors report no actual or potential conflicts of interest with regard to this article.
Disclaimer
The opinions expressed herein are those of the authors and do not necessarily reflect those of Federal Practitioner, Frontline Medical Communications Inc., the U.S. Government, or any of its agencies. This article may discuss unlabeled or investigational use of certain drugs. Please review complete prescribing information for specific drugs or drug combinations—including indications, contraindications, warnings, and adverse effects—before administering pharmacologic therapy to patients.
Click here to read the digital edition.
1. Zullig LL, Jackson GL, Dorn RA, et al. Cancer incidence among patients of the U.S. Veterans Affairs Health Care System. Mil Med. 2012;177(6):693-701.
2. Moghanaki D, Cheuk AV, Fosmire H, et al; U.S. Veterans Healthcare Administration National Palliative Radiotherapy Taskforce. Availability of single fraction palliative radiotherapy for cancer patients receiving end-of-life care within the Veterans Healthcare Administration. J Palliat Med. 2014;17(11):1221-1225.
3. Dawson GA, Glushko I, Hagan MP. A cross-sectional view of radiation dose fractionation schemes used for painful bone metastases cases within Veterans Health Administration Radiation Oncology Centers. J Clin Oncol. 2015;33(29 suppl):abstract 177.
4. Bekelman JE, Epstein AJ, Emanuel EJ. Single- vs multiple-fraction radiotherapy for bone metastases from prostate cancer. JAMA. 2013;310(14):1501-1502.
5. Galasko CSB. The anatomy and pathways of skeletal metastases. In: Weiss L, Gilbert AH, eds. Bone Metastasis. Boston, MA: GK Hall; 1981:49-63.
6. Bubendorf L, Schöpfer A, Wagner U, et al. Metastatic patterns in prostate cancer: an autopsy study of 1,589 patients. Hum Pathol. 2000;31(5):578-583.
7. Coleman RE. Clinical features of metastatic bone disease and risk of skeletal morbidity. Clin Cancer Res. 2006;12(20, pt 2):6243s-6249s.
8. Geriatrics and Extended Care Strategic Healthcare Group, National Pain Management Coordinating Committee, Veterans Health Administration. Pain as the 5th Vital Sign Toolkit. Rev. ed. Washington, DC: National Pain Management Coordinating Committee; 2000.
9. Hartsell WF, Scott CB, Bruner DW, et al. Randomized trial of short- versus long-course radiotherapy for palliation of painful bone metastases. J Natl Cancer Inst. 2005;97(11):798-804.
10. Chow E, Hoskins PJ, Wu J, et al. A phase III international randomised trial comparing single with multiple fractions for re-irradiation of painful bone metastases: National Cancer Institute of Canada Clinical Trials Group (NCTC CTG) SC 20. Clin Oncol (R Coll Radiol). 2006;18(2):125-128.
11. Fairchild A, Barnes E, Ghosh S, et al. International patterns of practice in palliative radiotherapy for painful bone metastases: evidence-based practice? Int J Radiat Oncol Biol Phys. 2009;75(5):1501-1510.
12. Chow E, van der Linden YM, Roos D, et al. Single fraction versus multiple fractions of repeat radiation for painful bone metastases: a randomised, controlled, non-inferiority trial. Lancet Oncol. 2014;15(2):164-171.
13. Lutz ST, Berk L, Chang E, et al; American Society for Radiation Oncology (ASTRO). Palliative radiotherapy for bone metastases: an ASTRO evidencebased guideline. Int J Radiat Oncol, Biol, Phys. 2011;79(4):965-976.
14. Expert Panel on Radiation Oncology-Bone Metastases, Lo SS, Lutz ST, Chang EL, et al. ACR Appropriateness Criteria® spinal bone metastases. J Palliat Med. 2013;16(1):9-19.
15. Expert Panel on Radiation Oncology-Bone Metastases, Lutz ST, Lo SS, Chang EL, et al. ACR Appropriateness Criteria® non-spinal bone metastases. J Palliative Med. 2012;15(5):521-526.
16. Guadagnolo BA, Liao KP, Elting L, Giordano S, Buchholz TA, Shih YC. Use of radiation therapy in the last 30 days of life among a large population-based cohort of elderly patients in the United States. J Clin Oncol. 2013;31(1):80-87.
17. Schuster J, Han T, Anscher M, Moghanaki D. Hospice providers awareness of the benefits and availability of single-fraction palliative radiotherapy. J Hospice Palliat Care Nurs. 2014;16(2):67-72.
18. Cheon PM, Wong E, Thavarajah N, et al. A definition of “uncomplicated bone metastases” based on previous bone metastases trials comparing single-fraction and multi-fraction radiation therapy. J Bone Oncol. 2015;4(1):13-17.
The authors would like to acknowledge Tony Quang, MD, JD, for the advice given on this project.
Palliative radiotherapy for bone metastases is typically delivered either as a short course of 1 to 5 fractions or protracted over longer courses of up to 20 treatments. These longer courses can be burdensome and discourage its utilization, despite a 50% to 80% likelihood of meaningful pain relief from only a single fraction of radiation therapy. Meanwhile, there are multiple randomized studies that have demonstrated that shorter course(s) are equivalent for pain control.
Although the VHA currently has 143 medical facilities that have cancer diagnostic and treatment capabilities, only 40 have radiation oncology services on-site.1 Thus, access to palliative radiotherapy may be limited for veterans who do not live close by, and many may seek care outside the VHA. At VHA radiation oncology centers, single-fraction radiation therapy (SFRT) is routinely offered by the majority of radiation oncologists.2,3 However, the longer course is commonly preferred outside the VA, and a recent SEER-Medicare analysis of more than 3,000 patients demonstrated that the majority of patients treated outside the VA actually receive more than 10 treatments.4 For this reason, the VA National Palliative Radiotherapy Task Force prepared this document to provide guidance for clinicians within and outside the VA to increase awareness of the appropriateness, effectiveness, and convenience of SFRT as opposed to longer courses of treatment that increase the burden of care at the end of life and often are unnecessary.
Veterans, Cancer, and Metastases
Within the VA, an estimated 40,000 new cancer cases are diagnosed each year, and 175,000 veterans undergo cancer care within the VHA annually.1 Unfortunately, the majority will develop bone metastases with postmortem examinations, suggesting that the rate can be as high as 90% at the end of life.5-7 For many, including veterans with cancer, pain control can be difficult, and access to palliative radiotherapy is critical.8
Single-Fraction Palliatiev Radiation Therapy
Historically, patients with painful bone metastases have been treated with courses of palliative radiotherapy ranging between 2 and 4 weeks of daily treatments. However, several large randomized clinical trials comparing a single treatment with multiple treatments have established that SFRT provides equivalent rates of pain relief even when it may be required for a second time.9-12 Recommendations based on these trials have been incorporated into various treatment guidelines that widely acknowledge the efficacy of SFRT.13-15
For this reason, SFRT is often preferred at many centers because it is substantially more convenient for patients with cancer. It reduces travel time for daily radiation clinic visits, which allows for more time with loved ones outside the medical establishment. Furthermore, SFRT improves patient access to radiotherapy and reduces costs. The benefits can be direct as well as indirect to those who have to take time for numerous visits.
Longer courses of palliative radiotherapy can be burdensome for patients and primary care providers. Unnecessarily protracted courses of palliative radiotherapy also delay the receipt of systemic therapies because they are typically considered unsafe to administer concurrently. Moreover, when SFRT is unavailable, the burden of long-course palliation is known to discourage health care providers from referring patients since opioid therapy is more convenient, even though it exchanges lucidity for analgesia.16,17
For this reason, the authors believe that it is in the best interest for veterans with terminal cancers and their providers to be aware of the shorter SFRT for effective, convenient pain relief. This treatment option is particularly relevant for patients with a poor performance status, patients already in hospice care, or patient who travel long distances.
Author disclosures
The authors report no actual or potential conflicts of interest with regard to this article.
Disclaimer
The opinions expressed herein are those of the authors and do not necessarily reflect those of Federal Practitioner, Frontline Medical Communications Inc., the U.S. Government, or any of its agencies. This article may discuss unlabeled or investigational use of certain drugs. Please review complete prescribing information for specific drugs or drug combinations—including indications, contraindications, warnings, and adverse effects—before administering pharmacologic therapy to patients.
Click here to read the digital edition.
1. Zullig LL, Jackson GL, Dorn RA, et al. Cancer incidence among patients of the U.S. Veterans Affairs Health Care System. Mil Med. 2012;177(6):693-701.
2. Moghanaki D, Cheuk AV, Fosmire H, et al; U.S. Veterans Healthcare Administration National Palliative Radiotherapy Taskforce. Availability of single fraction palliative radiotherapy for cancer patients receiving end-of-life care within the Veterans Healthcare Administration. J Palliat Med. 2014;17(11):1221-1225.
3. Dawson GA, Glushko I, Hagan MP. A cross-sectional view of radiation dose fractionation schemes used for painful bone metastases cases within Veterans Health Administration Radiation Oncology Centers. J Clin Oncol. 2015;33(29 suppl):abstract 177.
4. Bekelman JE, Epstein AJ, Emanuel EJ. Single- vs multiple-fraction radiotherapy for bone metastases from prostate cancer. JAMA. 2013;310(14):1501-1502.
5. Galasko CSB. The anatomy and pathways of skeletal metastases. In: Weiss L, Gilbert AH, eds. Bone Metastasis. Boston, MA: GK Hall; 1981:49-63.
6. Bubendorf L, Schöpfer A, Wagner U, et al. Metastatic patterns in prostate cancer: an autopsy study of 1,589 patients. Hum Pathol. 2000;31(5):578-583.
7. Coleman RE. Clinical features of metastatic bone disease and risk of skeletal morbidity. Clin Cancer Res. 2006;12(20, pt 2):6243s-6249s.
8. Geriatrics and Extended Care Strategic Healthcare Group, National Pain Management Coordinating Committee, Veterans Health Administration. Pain as the 5th Vital Sign Toolkit. Rev. ed. Washington, DC: National Pain Management Coordinating Committee; 2000.
9. Hartsell WF, Scott CB, Bruner DW, et al. Randomized trial of short- versus long-course radiotherapy for palliation of painful bone metastases. J Natl Cancer Inst. 2005;97(11):798-804.
10. Chow E, Hoskins PJ, Wu J, et al. A phase III international randomised trial comparing single with multiple fractions for re-irradiation of painful bone metastases: National Cancer Institute of Canada Clinical Trials Group (NCTC CTG) SC 20. Clin Oncol (R Coll Radiol). 2006;18(2):125-128.
11. Fairchild A, Barnes E, Ghosh S, et al. International patterns of practice in palliative radiotherapy for painful bone metastases: evidence-based practice? Int J Radiat Oncol Biol Phys. 2009;75(5):1501-1510.
12. Chow E, van der Linden YM, Roos D, et al. Single fraction versus multiple fractions of repeat radiation for painful bone metastases: a randomised, controlled, non-inferiority trial. Lancet Oncol. 2014;15(2):164-171.
13. Lutz ST, Berk L, Chang E, et al; American Society for Radiation Oncology (ASTRO). Palliative radiotherapy for bone metastases: an ASTRO evidencebased guideline. Int J Radiat Oncol, Biol, Phys. 2011;79(4):965-976.
14. Expert Panel on Radiation Oncology-Bone Metastases, Lo SS, Lutz ST, Chang EL, et al. ACR Appropriateness Criteria® spinal bone metastases. J Palliat Med. 2013;16(1):9-19.
15. Expert Panel on Radiation Oncology-Bone Metastases, Lutz ST, Lo SS, Chang EL, et al. ACR Appropriateness Criteria® non-spinal bone metastases. J Palliative Med. 2012;15(5):521-526.
16. Guadagnolo BA, Liao KP, Elting L, Giordano S, Buchholz TA, Shih YC. Use of radiation therapy in the last 30 days of life among a large population-based cohort of elderly patients in the United States. J Clin Oncol. 2013;31(1):80-87.
17. Schuster J, Han T, Anscher M, Moghanaki D. Hospice providers awareness of the benefits and availability of single-fraction palliative radiotherapy. J Hospice Palliat Care Nurs. 2014;16(2):67-72.
18. Cheon PM, Wong E, Thavarajah N, et al. A definition of “uncomplicated bone metastases” based on previous bone metastases trials comparing single-fraction and multi-fraction radiation therapy. J Bone Oncol. 2015;4(1):13-17.
Treatment Guidelines for the Use of Antiretroviral Agents in HIV-Infected Adults and Adolescents: An Update
On April 8, 2015, HSS released updated HIV treatment guidelines.1 The original 1998 guidelines for the use of antiretroviral agents for treating adults and adolescents infected with HIV emphasized the benefit of potent combination antiretroviral therapies (ARTs) that included protease inhibitors (PIs).2,3 Since then there have been more than 25 HSS guidelines focusing primarily on when to initiate ART and which ART to prescribe. The question of when to start ART had been controversial, but the most recently issued guidelines have addressed this question. For the first time, HSS recommends ART for all individuals infected with HIV regardless of CD4+ T-cell count.1 The timely initiation of effective ART with an associated reduction in HIV viremia benefits patients infected with HIV and substantially decreases transmission of HIV to uninfected sexual partners.3
Three large, international randomized placebo-controlled studies conducted between 2002 and 2015 provide evidence that the benefits of ART outweigh the potential deleterious effects of long-term ART. The Strategies for Management of Antiretroviral Therapy (SMART) was the first published study in this trifecta.4,5 Given concern about the adverse effects (AEs) of ART, particularly PIs, this study was designed to investigate whether long-term ART was associated with more toxicities than was deferred therapy, determined by CD4+ cell counts. The study was halted prematurely, because the risk of death or grade-4 toxicity was statistically greater among those receiving episodic ART than among those on continuous therapy. The SMART trial demonstrated that ART therapy was beneficial, but it did not determine when to initiate ART, particularly in asymptomatic persons.5
It was thought that the risk of transmission of HIV through sexual contact or shared drug paraphernalia was significantly lower for patients on ART who achieve viral suppression compared with those with uncontrolled viremia. The HIV Prevention Trials Network study enrolled HIV-serodiscordant couples to examine transmission of HIV. The trial compared HIV-positive patients who initiated ART when their CD4+ cell count was between 350 to 550 cells/mm3 with patients who began therapy when their CD4+ cell count was < 250 cells/mm3 or when an AIDS-defining illness was diagnosed. The difference in the rate of transmission to a HIV-negative partner was dramatic. The rate was 96% less among those in the early-therapy group vs those in the deferred-therapy group. In addition, there was a 40% reduction in the progression of HIV-related disease in the participants randomized to the early-therapy group.6
In March 2011, the International Network for Strategic Initiatives in Global HIV Trials (INSIGHT), which conducted SMART, initiated the Strategic Timing of AntiRetroviral Treatment (START) study to define the optimal time to begin ART among asymptomatic patients with a CD4+ count of > 350 cells/mm3. Patients with a CD4+ cell count of > 500 cells/mm3 were randomized to either initiate ART, or defer ART until the CD4+ cell count fell to < 350 cells/mm3 or until an AIDS-defining illness occurred.7 On May 15, 2015, the study was terminated early. Based on an interim analysis, the data safety and monitoring board announced that the risk for a serious AIDS-related event, serious non-AIDS-related event, or death from any cause was 57% less in the early treatment group. When compared with patients who delayed ART, for those on ART, serious AIDS-related events were reduced 72%, and serious non-AIDS events were reduced 39%.8 A similar study conducted in the Ivory Coast from March 2008 to January 2015 also favored early rather than deferred ART.9
Experience in clinical practice, these landmark clinical trials, and several cohort studies served as the basis of the changes in the new HSS guidelines that endorse ART for all HIV-infected persons. The World Health Organization (WHO) has recently published similar guidelines.10 It is yet to be determined whether the guidelines have been implemented successfully. Nonetheless, for both the clinician and the patient where access to ongoing care and ART are available, the new guidelines greatly simplify the treatment choices.
What's New in the Guidelines?
The Guidelines for the Use of Antiretroviral Agents in HIV-Infected Adults and Adolescents presents significant changes in several of the tables that are most clinically useful, including Tables 6, 7, and 8.1 Table 6 presents recommended, alternative, and other antiretroviral regimen options. The guidelines also added new tables describing antiretroviral regimen considerations for initial therapy and the mechanisms of antiretroviral-associated drug interactions.
Initial Combination Regimens for the Antiretroviral-Naïve Patient
Five regimens are now recommended for ART-naïve patients: 4 are integrase strand transfer inhibitor-based regimens, and 1 is a ritonavir-boosted PI-based regimen (Table 1). A nonnucleoside reverse transcriptase inhibitor-based regimen is no longer recommended. The guidelines include regimens that are now considered less favorable for a variety of reasons, including reduced virologic activity and greater risk of toxicities, higher pill burden, and more potential drug interactions. Several regimens that have been widely used are now included in this latter option, in particular efavirenz plus abacavir/lamivudine (3TC), lopinavir/ritonavir plus abacavir (ABC)/3TC, and tenofovir fumarate (TDF)/emtricitabine (FTC).
The most significant change in the guideline is the reclassification of efavirenz from a recommended to an alternative therapy. The principal reasons for this change are central nervous system (CNS) AEs, which can include depression and a reported 2-fold increase in the risk of suicide or suicidal ideation.11
In November 2015, the FDA approved Genvoya, a once-daily, fixed-dose combination tablet containing elvitegravir, cobicistat, FTC, and tenofovir alafenamide (TAF).12 With this approval, there are now 5 once-daily HIV treatment options. This new drug is similar to elvitegravir/cobicistat/TDF/FTC, but it substitutes TAF for TDF. The benefits of this substitution include less bone loss and decreased renal toxicity.13-15 Genvoya may be prescribed in patients with a 30 mL/min creatinine clearance. The TAF-containing once-daily formulation achieves higher intracellular levels and lower blood levels of TAF. Therefore, the cholesterol-lowering benefits are less than those of the TDF-containing alternative.
In the 2015 guidelines, Table 7 provides concise guidance on the selection of an ART regimen based on patient and regimen characteristics, including food-based AEs; the presence of other medical and/or psychiatric conditions; and the presence of co-infections, including hepatitis B virus (HBV), hepatitis C virus (HCV), and tuberculosis.1 In addition, Table 8 outlines the advantages and disadvantages of the different classes of ART.1 For example, dolutegravir may have a higher barrier to resistance than that of elvitegravir or raltegravir.16 It is now possible for those living with HIV to have ongoing viral suppression, which will not only improve their lives, but also decrease the risk of HIV transmission to sexual partners. Starting from the time of diagnosis, achieving viral suppression is dependent on a link to care with initiation of ART and retention in care. The 5 once-daily options should improve adherence. The infrastructure to ensure lifelong retention in care, medication availability, and adherence still poses many challenges.
Treatment-Experienced Patients
The guidelines were updated to include more direction on virologic failure to a first-line regimen as well as a second-line regimen failure or beyond. It includes a discussion of treatment options for achieving full virologic suppression. There also are treatment recommendations for patients with multidrug viral resistance in whom maximal viral suppression may not be achieved. For such patients, ART should be continued to preserve immunologic function, lessen clinical progression, and minimize resistance to drug classes that could include new efficacious drugs.17,18
There is also a discussion in the guidelines of the issues surrounding isolated CNS virologic failure and the onset of new neurologic symptoms. With CNS virologic failure, magnetic resonance brain imaging may be abnormal with a lymphocytic pleocytosis in the cerebrospinal fluid (CSF). If available to guide therapy, CSF HIV RNA should be measured, and HIV drug resistance in the CSF should be tested. Central nervous system viral escape should be differentiated from other CNS conditions, such as herpes zoster infection; incidental mild CSF HIV RNA increases; or the now relatively common but chronic neurocognitive impairment seen with HIV infection.19,20
Poor CD4+ Recovery and Persistent Inflammation Despite Viral Suppression
For patients on ART who achieve viral suppression but fail to have a significant increase in CD4+ cell count over time (particularly for the patient with a CD4+ cell count < 200 cells/mm3), the guidelines do not endorse additional ARTs or switching the regimen. However, there may be an increased risk of non-AIDS mortality and morbidity, including cardiovascular disease. For such patients, interleukin-2 adjunctive therapy has no demonstrated clinical benefit.21 Interleukin-7 and recombinant human growth hormone should be used only as part of a clinical trial.
It is now evident that immune activation and inflammation, although lessened, persist despite ART-mediated viral suppression.22,23 There is no recommendation to monitor markers of immune activation and inflammation. Efforts should focus on risk factor modifications, such as smoking cessation, improved diet, treatment of alcohol abuse and dependence, regular exercise, and maintenance of appropriate weight. Emphasis should be on treating chronic comorbidities, such as hypertension, diabetes, osteoporosis, and hyperlipidemia.
HIV/HCV Co-infection
According to the WHO, 130 to 150 million people worldwide have chronic HCV infection.24 In the U.S., it is estimated that up to one-quarter of HIV-infected persons have HCV co-infection.25 With the currently available oral direct-acting agents (DAAs) for the treatment of chronic HCV infection in patients with HIV/HCV co-infection, rates of sustained virologic response to treatment are comparable in patients with HIV/HCV co-infection with those of patients with HCV monoinfection.26 Accordingly, all HIV-infected patients should be screened for HCV infection, and HIV ART should not be deferred for most patients.
For patients with a CD4+ cell count of < 200 cells/mm3, treatment of HCV should be deferred until the patients are on a stable and effective ART regimen. Whereas for those with a CD4+ cell count > 500 cells/mm3, HCV can be treated before initiating HIV ART. When initiating
HCV therapy, clinicians must pay attention to drug-drug interactions. Patients with cirrhosis are particularly at risk. The most recent guidelines for the treatment of HCV co-infection should be reviewed when selecting a DAA to treat HCV.27 Many patients are now being treated successfully for HCV co-infection. Extending such therapy to all patients with HIV/HCV co-infection for whom treatment is appropriate should be a priority for clinicians, insurance providers, and policy makers.
Drug Interactions
Given the availability of numerous once-daily ART regimens, prescribing ART has been greatly simplified. Nonetheless, there are many pharmacokinetic drug-drug interactions between antiretroviral drugs and concomitant medications. When changing either the ART or adding or changing other medications, the clinician must always pay attention to potential drug-drug interactions. Consideration must be given to the interaction with drugs that affect antiretroviral absorption—particularly, acid-reducing agents and products that contain polyvalent cations, including calcium and magnesium.
When antiretrovirals that undergo hepatic metabolism are given with other drugs that also are metabolized by the cytochrome P450 enzyme system or other hepatic enzymes, the levels of antiretrovirals or other drug may be significantly increased or decreased.1 The 2 booster—cobicistat and ritonavir—used to increase certain antiretrovirals levels also may alter the metabolism of other drugs.28,29 The new guidelines contain updated and detailed tables on drug-drug interactions. Given the comorbid conditions, particularly among those aging with HIV, polypharmacy is an increasingly common concern. It is essential for clinicians to work with knowledgeable HIV pharmacists to ensure the correct and safe prescribing of all medications.
HIV/AIDS Demographics in U.S.
Of the more than 1.2 million people aged > 13 years in the U.S. living with HIV, about 1 in 8 are unaware of their infection.30 The Centers for Disease Control and Prevention (CDC) estimates that about 50,000 people are newly infected every year.31 Men who have sex with men (MSM) are the group most impacted by HIV, and African American MSM are disproportionately represented. Although MSM were only about 4% of the U.S. male population in 2010, 78% of the newly diagnosed HIV infections among males were in MSM (63% of all new HIV infections).32,33 The groups at greatest risk of HIV infection are now young black and Latino MSM aged 13 to 24 years.33 Decreasing the rate of new HIV infections in this high-risk population remains challenging.
Across the U.S., the HIV epidemic continues to disproportionately impact southern states. An estimated 44% of all people living with HIV in the U.S. reside in the District of Columbia and in 16 southern states.34 Among the 10 states with the highest death rate for persons diagnosed with HIV, 7 are southern states–Louisiana, Alabama, Mississippi, South Carolina, Kentucky, and Maryland.35,36 The HIV epidemic in southern states is not confined to urban centers but instead extends across rural areas that have limited access to adequate health care and high rates of poverty.37
HIV Care Continuum
In July 2013, President Obama established the HIV Continuum Care Initiative directing federal departments to accelerate efforts and direct resources to increase the proportion of HIV-infected persons successfully receiving care in each stage of the continuum as part of the National HIV/AIDS Strategy.38,39 In November 2014, the CDC released a report on HIV in the U.S. that found about 14% of those with HIV infection have never been diagnosed, and only 40% are receiving HIV medical care.40 Despite the much improved and simplified ART regimens, only 30% of those living with HIV infection in the U.S. have achieved viral suppression. The CDC has outlined 4 steps for achieving viral suppression, the ultimate goal of all HIV treatment (Table 2).41
In the U.S. and Canada, a person diagnosed with HIV aged 20 years who adheres to a HIV ART regimen has a life expectancy of 71 years. The same person not taking ART has a dramatically shortened life expectancy of 32 years.42 The successful implementation of ART can help those living with HIV to enjoy an average life expectancy no different from that of persons without HIV infection.
The Future of the HIV/AIDS Epidemic
In 2014, the Joint United Nations Program on HIV/ AIDS estimated that 35 million people were living with HIV/AIDS and that 13 million were receiving ART globally. Three of 5 people with HIV infection, about 22 million, did not have access to ART. Less than one quarter of HIV-infected children are on ART.43 Changing the course of the HIV/AIDS pandemic in the U.S. and worldwide is within reach, and the new HSS and WHO guidelines provide an evidence-based framework to alter this course. Significantly expanding screening for HIV and ensuring treatment access
for all persons diagnosed with HIV as well as appropriate provision of pre-exposure prophylaxis would irrevocably alter the lives of the millions of people living with HIV/AIDS and others in their communities. It remains to be seen whether the goal to eliminate AIDS by 2020, set in both the National HIV/AIDS Strategy and the UN global commitment will be achieved.
Click here to read the digital edition.
1. DHHS Panel on Antiretroviral Guidelines for Adults and Adolescents. Guidelines for the use of antiretroviral agents in HIV-1 infected adults and adolescents. AIDSinfo Website. https://aidsinfo.nih.gov/contentfiles/lvguidelines/adultandadolescentgl.pdf. Updated January 28, 2016. Accessed March 9, 2016.
2. NIH Panel to Define Principles of Therapy of HIV Infection. Report of the NIH panel to define principles of therapy of HIV infection and Guidelines for the Use of Antiretroviral Agents in HIV-Infected Adults and Adolescents. MMWR Recomm Rep. 1988;47(RR-5):1-41.
3. Stanley SK, Kaplan JE, National Center for HIV, STD, and TB Prevention Division of HIV/AIDS Prevention Surveillance, and Epidemiology. Guidelines for the use of antiretroviral agents in HIV-infected adults and adolescents. MMWR Recomm Rep. 1988;47(RR-5):42-82.
4. Fauci AS, Marston HD. Ending the HIV-AIDS pandemic—follow the science. N Engl J Med. 2015;373(23):2197-2199.
5. El-Sadr WM, Lundgren J, Neaton JD, et al; The Strategies for Management of Antiretroviral Therapy (SMART) Study Group. CD4+ count-guided interruption of antiretroviral treatment. N Engl J Med. 2006;355(22):2283-2296.
6. Cohen MS, Chen YQ, McCauley M. et al; HPTN 052 Study Team. Prevention of HIV-1 infection with early antiretroviral therapy. N Engl J Med. 2011;365(6):493-505.
7. Lundgren JD, Babiker AG, et al; The INSIGHT START Study Group. Initiation of antiretroviral therapy in early asymptomatic HIV infection. N Engl J Med. 2015;373(9):795-807.
8. National Institutes of Health. Starting antiretroviral therapy early improves outcomes for HIV-infected individuals [news release]. U.S. Dept. of Health and Human Services Website. http://www.nih.gov/news-events/news-releases/starting-antiretroviral-treatment-early-improves-outcomes-hiv-infected-individuals, Published May 27, 2015. Accessed March 9, 2016.
9. Danel C, Moh R, et al; The TEMPRANO ANRS 12136 Study Group. A trial of early antiretrovirals and isoniazid preventive therapy in Africa. N Engl J Med. 2015;373(9):808-822.
10. World Health Organization. Guidelines on when to start antiretroviral therapy and on pre-exposure prophylaxis for HIV. World Health Organization Website. http://apps.who.int/iris/bitstream/10665/186275/1/9789241509565_eng.pdf. Published September 2015. Accessed March 9, 2016.
11. Mollan KR, Smurzynski M, Eron JJ, et al. Association between efavirenz as initial therapy for HIV-1 infection and increased risk for suicidal ideation or attempted or completed suicide: an analysis of trial data. Ann Intern Med. 2014;161(1):1-10.
12. FDA approves new treatment for HIV [news release]. U.S. Food and Drug Administration Website. http://www.fda.gov/NewsEvents/Newsroom/PressAnnouncements/ucm471300.htm. Published November 5, 2015. Accessed March 9, 2016.
13. Mills A, Aribas JR, Andrade-Villanueve J, et al. Switching from tenofovir disoproxil fumarate to tenofovir alafenamide in antiretroviral regimens for virologically suppressed adults with HIV-1 infection: a randomized, active-controlled, multicentre, open-label, phase 3, non-inferiority study. Lancet Infect Dis. 2016;16(1):43-52.
14. Sax PE, Zolopa A, Brar I, et al. Tenofovir alafenamide vs. tenofovir disoproxil fumarate in single tablet regimens for initial HIV-1 therapy: a randomized phase 2 study. J Acquir Immune Defic Syndr. 2014;67(1):52-58.
15. Sax PE, Wohl A, Yin MT, et al; GS-US-292-0104/0111 Study Team. Tenofovir alafenamide versus tenofovir disoproxil fumarate, coformulated with elvitegravir, cobicistat, and emtricitabine, for initial treatment of HIV-1 infection: two randomised, double-blind, phase 3, non-inferiority trials. Lancet. 2015;385(9987):2602-2615.
16. Fanrauzzi A, Messaroma I. Dolutegravir: clinical efficacy and role in HIV therapy. Ther Adv Chronic Dis. 2014;5(4):164-177.
17. Miller V, Sabon C, Hertogs K, et al. Virological and immunological effects of treatment interruptions in HIV-1 infected patients with treatment failure. AIDS. 2000;14(18):2857-2867.
18. Raffanti SP, Fusco JS, Sherrill BH, et al; Collaborations in HIV Outcomes Research/United States Project. Effect of persistent moderate viremia on disease progression during HIV therapy. J Acquir Immune Defic Syndr. 2004;37(1):1174-1154.
19. Canestri A, Lescure FX, Jaureguiberry S, et al. Discordance between cerebral spinal fluid and plasma HIV replication in patients with neurological symptoms who are receiving suppressive antiretroviral therapy. Clin Infect Dis. 2010;50(5):773-778.
20. Peluso MJ, Ferretti F, Peterson J, et al. Cerebrospinal fluid HIV escape associated with progressive neurologic dysfunction in patients on antiretroviral therapy with well controlled plasma viral load. AIDS. 2012;26(14):1765-1774.
21. Abrams D, Levy Y, Losso MH, et al. Interleukin-2 therapy in patients with HIV infection. N Engl J Med. 2009;361(16):1548-1559.
22. Tien PC, Choi AI, Zolopa AR, et al. Inflammation and mortality in HIV-infected adults: analysis of the FRAM study cohort. J Acquir Immune Defic Syndr. 2010;55(3):316-322.
23. Lederman MM, Funderburg NT, Sekaly RP, Klatt NR, Hunt PW. Residual immune dysregulation syndrome in treated HIV infection. Adv Immunol. 2013;119:51-83.
24. Mohd Hanafiah K, Groeger J, Flaxman AD, Wiersma ST. Global epidemiology of hepatitis C virus infection new estimates of age-specific antibody to HCV seroprevalence. Hepatology. 2013;57(4):1333-1342.
25. Sherman KE, Rouster SD, Chung RT, Rajicic N. Hepatitis C virus prevalence among patients infected with human immunodeficiency virus: a crosssectional analysis of the US adult AIDS Clinical Trials Group. Clin Infect Dis. 2002;34(6):831-837.
26. Cachay ER, Wyles D, Hill L, et al. The impact of direct-acting antivirals in the hepatitis C-sustained viral response in human immunodeficiency virus-infected patients with ongoing barriers to care. Open Forum Infect Dis. 2015;2(4):ofv168.
27. American Association for the Study of Liver Diseases, Infectious Diseases Society of American. Recommendations for testing, managing, and treating hepatitis C. American Association for the Study of Liver Diseases and the Infectious Diseases Society of America Website. http://hcvguidelines.org/sites/default/files/HCV-Guidance_February_2016_a1.pdf. Updated February 24, 2016. Accessed March 8, 2016.
28. Shah BM, Schafer JJ, Priano J, Squires KE. Cobicistat: a new booster for the treatment of human immunodeficiency virus infection. Pharmacotherapy. 2013;33(10):1107-1116.
29. Hull MW, Montaner JS. Ritonavir-boosted protease inhibitors in HIV therapy. Ann Med. 2011;43(5):375-388.
30. Centers for Disease Control and Prevention. HIV in the United States: at a glance. Centers for Disease Control and Prevention Website. http://www.cdc.gov/hiv/statistics/overview/ataglance.html. Updated September 29, 2015. Accessed March 8, 2016.
31. Prejean J, Song R, Hernandez A, et al. Estimated HIV incidence in the United States, 2006-2009. PLoS One. 2011;6(8):e17502.
32. Purcell DW, Johnson CH, Lansky A, et al. Estimating the population size of men who have sex with men in the United States to obtain HIV and syphilis rates. Open AIDS J. 2012;6:98-107.
33. Centers for Disease Control and Prevention. Estimated HIV incidence in the United States, 2007-2010. HIV Surveillance Report: Supplemental Report 2012;17(4). http://www.cdc.gov/hiv/pdf/statistics_hssr_vol_17_no_4.pdf. Published December 2012. Accessed Mar 23, 2016.
34. Centers for Disease Control and Prevention. HIV in the Southern United States. Centers for Disease Control and Prevention Website. http://www.cdc.gov/hiv/pdf /policies/cdc-hiv-in-the-south-issue-brief.pdf. Published December 2015. Accessed March 22, 2016.
35. Centers for Disease Control and Prevention. Southern states lag behind the rest of the nation in HIV treatment, testing [release]. Centers for Disease Control and Prevention Website. http://www.cdc.gov/nchhstp/newsroom/2015 /nhpc-press-release-southern-states.html. Published December 6, 2015. Accessed March 23, 2016.
36. Krawczyk CS, Funkhouser E, Kilbe JM, Vermund SH. Delayed access to HIV diagnosis and care: special concerns for the Southern United States. AIDS Care. 2006;18(suppl 1):S35-S44.
37. Reif S, Pence BW, Hall I, Hu X, Whetten K, Wilson E. HIV diagnosis, prevalence and outcomes in nine southern states. J Community Health. 2015;40(4);642-651.
38. Office of National AIDS Policy. National HIV/AIDS strategy. Improving outcomes: accelerating progress along the HIV care continuum. White House Website. https://www.whitehouse.gov/sites/default/files/onap_nhas_improving_outcomes _dec_2013.pdf. Published December 2013. Accessed March 8, 2016.
39. The White House Office of National AIDS Policy. National HIV/AIDS Strategy: Federal implementation plan. White House Website. http://www.whitehouse.gov/files/documents/nhas-implementation.pdf. Published July 2010. Accessed March 8, 2016.
40. Bradley H, Hall HI, Wolitski RJ, et al. Vital signs: HIV diagnosis, care, and treatment among persons living with HIV—United States, 2011. MMWR Morb Mortal Wkly Rep. 2014;63(47):1113-1117.
41. Centers for Disease Control and Prevention. CDC Vitalsigns. HIV care saves lives: viral suppression is key. Centers for Disease Control and Prevention Website. http://www.cdc.gov/vitalsigns/hiv-aids-medical-care. Published November 2014. Accessed March 8, 2016.
42. Samji H, Cescon A, Hogg RS, et al; North American AIDS Cohort Collaboration on Research and Design (NA-ACCORD) of IeDEA. Closing the gap: increases in life expectancy among treated HIV-positive individuals in the United States and Canada. PLoS One. 2013;8(12):e81355.
43. Joint United Nations Programme on HIV/AIDS. UNAIDS report shows that 19 million of the 35 million people living with HIV today do not know that they have the virus [press release]. UNAIDS Website. http://www.unaids.org/sites/default/files/web_story/20140716_PR_GapReport_en.pdf. Published July 16, 2014. Accessed March 8, 2016.
On April 8, 2015, HSS released updated HIV treatment guidelines.1 The original 1998 guidelines for the use of antiretroviral agents for treating adults and adolescents infected with HIV emphasized the benefit of potent combination antiretroviral therapies (ARTs) that included protease inhibitors (PIs).2,3 Since then there have been more than 25 HSS guidelines focusing primarily on when to initiate ART and which ART to prescribe. The question of when to start ART had been controversial, but the most recently issued guidelines have addressed this question. For the first time, HSS recommends ART for all individuals infected with HIV regardless of CD4+ T-cell count.1 The timely initiation of effective ART with an associated reduction in HIV viremia benefits patients infected with HIV and substantially decreases transmission of HIV to uninfected sexual partners.3
Three large, international randomized placebo-controlled studies conducted between 2002 and 2015 provide evidence that the benefits of ART outweigh the potential deleterious effects of long-term ART. The Strategies for Management of Antiretroviral Therapy (SMART) was the first published study in this trifecta.4,5 Given concern about the adverse effects (AEs) of ART, particularly PIs, this study was designed to investigate whether long-term ART was associated with more toxicities than was deferred therapy, determined by CD4+ cell counts. The study was halted prematurely, because the risk of death or grade-4 toxicity was statistically greater among those receiving episodic ART than among those on continuous therapy. The SMART trial demonstrated that ART therapy was beneficial, but it did not determine when to initiate ART, particularly in asymptomatic persons.5
It was thought that the risk of transmission of HIV through sexual contact or shared drug paraphernalia was significantly lower for patients on ART who achieve viral suppression compared with those with uncontrolled viremia. The HIV Prevention Trials Network study enrolled HIV-serodiscordant couples to examine transmission of HIV. The trial compared HIV-positive patients who initiated ART when their CD4+ cell count was between 350 to 550 cells/mm3 with patients who began therapy when their CD4+ cell count was < 250 cells/mm3 or when an AIDS-defining illness was diagnosed. The difference in the rate of transmission to a HIV-negative partner was dramatic. The rate was 96% less among those in the early-therapy group vs those in the deferred-therapy group. In addition, there was a 40% reduction in the progression of HIV-related disease in the participants randomized to the early-therapy group.6
In March 2011, the International Network for Strategic Initiatives in Global HIV Trials (INSIGHT), which conducted SMART, initiated the Strategic Timing of AntiRetroviral Treatment (START) study to define the optimal time to begin ART among asymptomatic patients with a CD4+ count of > 350 cells/mm3. Patients with a CD4+ cell count of > 500 cells/mm3 were randomized to either initiate ART, or defer ART until the CD4+ cell count fell to < 350 cells/mm3 or until an AIDS-defining illness occurred.7 On May 15, 2015, the study was terminated early. Based on an interim analysis, the data safety and monitoring board announced that the risk for a serious AIDS-related event, serious non-AIDS-related event, or death from any cause was 57% less in the early treatment group. When compared with patients who delayed ART, for those on ART, serious AIDS-related events were reduced 72%, and serious non-AIDS events were reduced 39%.8 A similar study conducted in the Ivory Coast from March 2008 to January 2015 also favored early rather than deferred ART.9
Experience in clinical practice, these landmark clinical trials, and several cohort studies served as the basis of the changes in the new HSS guidelines that endorse ART for all HIV-infected persons. The World Health Organization (WHO) has recently published similar guidelines.10 It is yet to be determined whether the guidelines have been implemented successfully. Nonetheless, for both the clinician and the patient where access to ongoing care and ART are available, the new guidelines greatly simplify the treatment choices.
What's New in the Guidelines?
The Guidelines for the Use of Antiretroviral Agents in HIV-Infected Adults and Adolescents presents significant changes in several of the tables that are most clinically useful, including Tables 6, 7, and 8.1 Table 6 presents recommended, alternative, and other antiretroviral regimen options. The guidelines also added new tables describing antiretroviral regimen considerations for initial therapy and the mechanisms of antiretroviral-associated drug interactions.
Initial Combination Regimens for the Antiretroviral-Naïve Patient
Five regimens are now recommended for ART-naïve patients: 4 are integrase strand transfer inhibitor-based regimens, and 1 is a ritonavir-boosted PI-based regimen (Table 1). A nonnucleoside reverse transcriptase inhibitor-based regimen is no longer recommended. The guidelines include regimens that are now considered less favorable for a variety of reasons, including reduced virologic activity and greater risk of toxicities, higher pill burden, and more potential drug interactions. Several regimens that have been widely used are now included in this latter option, in particular efavirenz plus abacavir/lamivudine (3TC), lopinavir/ritonavir plus abacavir (ABC)/3TC, and tenofovir fumarate (TDF)/emtricitabine (FTC).
The most significant change in the guideline is the reclassification of efavirenz from a recommended to an alternative therapy. The principal reasons for this change are central nervous system (CNS) AEs, which can include depression and a reported 2-fold increase in the risk of suicide or suicidal ideation.11
In November 2015, the FDA approved Genvoya, a once-daily, fixed-dose combination tablet containing elvitegravir, cobicistat, FTC, and tenofovir alafenamide (TAF).12 With this approval, there are now 5 once-daily HIV treatment options. This new drug is similar to elvitegravir/cobicistat/TDF/FTC, but it substitutes TAF for TDF. The benefits of this substitution include less bone loss and decreased renal toxicity.13-15 Genvoya may be prescribed in patients with a 30 mL/min creatinine clearance. The TAF-containing once-daily formulation achieves higher intracellular levels and lower blood levels of TAF. Therefore, the cholesterol-lowering benefits are less than those of the TDF-containing alternative.
In the 2015 guidelines, Table 7 provides concise guidance on the selection of an ART regimen based on patient and regimen characteristics, including food-based AEs; the presence of other medical and/or psychiatric conditions; and the presence of co-infections, including hepatitis B virus (HBV), hepatitis C virus (HCV), and tuberculosis.1 In addition, Table 8 outlines the advantages and disadvantages of the different classes of ART.1 For example, dolutegravir may have a higher barrier to resistance than that of elvitegravir or raltegravir.16 It is now possible for those living with HIV to have ongoing viral suppression, which will not only improve their lives, but also decrease the risk of HIV transmission to sexual partners. Starting from the time of diagnosis, achieving viral suppression is dependent on a link to care with initiation of ART and retention in care. The 5 once-daily options should improve adherence. The infrastructure to ensure lifelong retention in care, medication availability, and adherence still poses many challenges.
Treatment-Experienced Patients
The guidelines were updated to include more direction on virologic failure to a first-line regimen as well as a second-line regimen failure or beyond. It includes a discussion of treatment options for achieving full virologic suppression. There also are treatment recommendations for patients with multidrug viral resistance in whom maximal viral suppression may not be achieved. For such patients, ART should be continued to preserve immunologic function, lessen clinical progression, and minimize resistance to drug classes that could include new efficacious drugs.17,18
There is also a discussion in the guidelines of the issues surrounding isolated CNS virologic failure and the onset of new neurologic symptoms. With CNS virologic failure, magnetic resonance brain imaging may be abnormal with a lymphocytic pleocytosis in the cerebrospinal fluid (CSF). If available to guide therapy, CSF HIV RNA should be measured, and HIV drug resistance in the CSF should be tested. Central nervous system viral escape should be differentiated from other CNS conditions, such as herpes zoster infection; incidental mild CSF HIV RNA increases; or the now relatively common but chronic neurocognitive impairment seen with HIV infection.19,20
Poor CD4+ Recovery and Persistent Inflammation Despite Viral Suppression
For patients on ART who achieve viral suppression but fail to have a significant increase in CD4+ cell count over time (particularly for the patient with a CD4+ cell count < 200 cells/mm3), the guidelines do not endorse additional ARTs or switching the regimen. However, there may be an increased risk of non-AIDS mortality and morbidity, including cardiovascular disease. For such patients, interleukin-2 adjunctive therapy has no demonstrated clinical benefit.21 Interleukin-7 and recombinant human growth hormone should be used only as part of a clinical trial.
It is now evident that immune activation and inflammation, although lessened, persist despite ART-mediated viral suppression.22,23 There is no recommendation to monitor markers of immune activation and inflammation. Efforts should focus on risk factor modifications, such as smoking cessation, improved diet, treatment of alcohol abuse and dependence, regular exercise, and maintenance of appropriate weight. Emphasis should be on treating chronic comorbidities, such as hypertension, diabetes, osteoporosis, and hyperlipidemia.
HIV/HCV Co-infection
According to the WHO, 130 to 150 million people worldwide have chronic HCV infection.24 In the U.S., it is estimated that up to one-quarter of HIV-infected persons have HCV co-infection.25 With the currently available oral direct-acting agents (DAAs) for the treatment of chronic HCV infection in patients with HIV/HCV co-infection, rates of sustained virologic response to treatment are comparable in patients with HIV/HCV co-infection with those of patients with HCV monoinfection.26 Accordingly, all HIV-infected patients should be screened for HCV infection, and HIV ART should not be deferred for most patients.
For patients with a CD4+ cell count of < 200 cells/mm3, treatment of HCV should be deferred until the patients are on a stable and effective ART regimen. Whereas for those with a CD4+ cell count > 500 cells/mm3, HCV can be treated before initiating HIV ART. When initiating
HCV therapy, clinicians must pay attention to drug-drug interactions. Patients with cirrhosis are particularly at risk. The most recent guidelines for the treatment of HCV co-infection should be reviewed when selecting a DAA to treat HCV.27 Many patients are now being treated successfully for HCV co-infection. Extending such therapy to all patients with HIV/HCV co-infection for whom treatment is appropriate should be a priority for clinicians, insurance providers, and policy makers.
Drug Interactions
Given the availability of numerous once-daily ART regimens, prescribing ART has been greatly simplified. Nonetheless, there are many pharmacokinetic drug-drug interactions between antiretroviral drugs and concomitant medications. When changing either the ART or adding or changing other medications, the clinician must always pay attention to potential drug-drug interactions. Consideration must be given to the interaction with drugs that affect antiretroviral absorption—particularly, acid-reducing agents and products that contain polyvalent cations, including calcium and magnesium.
When antiretrovirals that undergo hepatic metabolism are given with other drugs that also are metabolized by the cytochrome P450 enzyme system or other hepatic enzymes, the levels of antiretrovirals or other drug may be significantly increased or decreased.1 The 2 booster—cobicistat and ritonavir—used to increase certain antiretrovirals levels also may alter the metabolism of other drugs.28,29 The new guidelines contain updated and detailed tables on drug-drug interactions. Given the comorbid conditions, particularly among those aging with HIV, polypharmacy is an increasingly common concern. It is essential for clinicians to work with knowledgeable HIV pharmacists to ensure the correct and safe prescribing of all medications.
HIV/AIDS Demographics in U.S.
Of the more than 1.2 million people aged > 13 years in the U.S. living with HIV, about 1 in 8 are unaware of their infection.30 The Centers for Disease Control and Prevention (CDC) estimates that about 50,000 people are newly infected every year.31 Men who have sex with men (MSM) are the group most impacted by HIV, and African American MSM are disproportionately represented. Although MSM were only about 4% of the U.S. male population in 2010, 78% of the newly diagnosed HIV infections among males were in MSM (63% of all new HIV infections).32,33 The groups at greatest risk of HIV infection are now young black and Latino MSM aged 13 to 24 years.33 Decreasing the rate of new HIV infections in this high-risk population remains challenging.
Across the U.S., the HIV epidemic continues to disproportionately impact southern states. An estimated 44% of all people living with HIV in the U.S. reside in the District of Columbia and in 16 southern states.34 Among the 10 states with the highest death rate for persons diagnosed with HIV, 7 are southern states–Louisiana, Alabama, Mississippi, South Carolina, Kentucky, and Maryland.35,36 The HIV epidemic in southern states is not confined to urban centers but instead extends across rural areas that have limited access to adequate health care and high rates of poverty.37
HIV Care Continuum
In July 2013, President Obama established the HIV Continuum Care Initiative directing federal departments to accelerate efforts and direct resources to increase the proportion of HIV-infected persons successfully receiving care in each stage of the continuum as part of the National HIV/AIDS Strategy.38,39 In November 2014, the CDC released a report on HIV in the U.S. that found about 14% of those with HIV infection have never been diagnosed, and only 40% are receiving HIV medical care.40 Despite the much improved and simplified ART regimens, only 30% of those living with HIV infection in the U.S. have achieved viral suppression. The CDC has outlined 4 steps for achieving viral suppression, the ultimate goal of all HIV treatment (Table 2).41
In the U.S. and Canada, a person diagnosed with HIV aged 20 years who adheres to a HIV ART regimen has a life expectancy of 71 years. The same person not taking ART has a dramatically shortened life expectancy of 32 years.42 The successful implementation of ART can help those living with HIV to enjoy an average life expectancy no different from that of persons without HIV infection.
The Future of the HIV/AIDS Epidemic
In 2014, the Joint United Nations Program on HIV/ AIDS estimated that 35 million people were living with HIV/AIDS and that 13 million were receiving ART globally. Three of 5 people with HIV infection, about 22 million, did not have access to ART. Less than one quarter of HIV-infected children are on ART.43 Changing the course of the HIV/AIDS pandemic in the U.S. and worldwide is within reach, and the new HSS and WHO guidelines provide an evidence-based framework to alter this course. Significantly expanding screening for HIV and ensuring treatment access
for all persons diagnosed with HIV as well as appropriate provision of pre-exposure prophylaxis would irrevocably alter the lives of the millions of people living with HIV/AIDS and others in their communities. It remains to be seen whether the goal to eliminate AIDS by 2020, set in both the National HIV/AIDS Strategy and the UN global commitment will be achieved.
Click here to read the digital edition.
1. DHHS Panel on Antiretroviral Guidelines for Adults and Adolescents. Guidelines for the use of antiretroviral agents in HIV-1 infected adults and adolescents. AIDSinfo Website. https://aidsinfo.nih.gov/contentfiles/lvguidelines/adultandadolescentgl.pdf. Updated January 28, 2016. Accessed March 9, 2016.
2. NIH Panel to Define Principles of Therapy of HIV Infection. Report of the NIH panel to define principles of therapy of HIV infection and Guidelines for the Use of Antiretroviral Agents in HIV-Infected Adults and Adolescents. MMWR Recomm Rep. 1988;47(RR-5):1-41.
3. Stanley SK, Kaplan JE, National Center for HIV, STD, and TB Prevention Division of HIV/AIDS Prevention Surveillance, and Epidemiology. Guidelines for the use of antiretroviral agents in HIV-infected adults and adolescents. MMWR Recomm Rep. 1988;47(RR-5):42-82.
4. Fauci AS, Marston HD. Ending the HIV-AIDS pandemic—follow the science. N Engl J Med. 2015;373(23):2197-2199.
5. El-Sadr WM, Lundgren J, Neaton JD, et al; The Strategies for Management of Antiretroviral Therapy (SMART) Study Group. CD4+ count-guided interruption of antiretroviral treatment. N Engl J Med. 2006;355(22):2283-2296.
6. Cohen MS, Chen YQ, McCauley M. et al; HPTN 052 Study Team. Prevention of HIV-1 infection with early antiretroviral therapy. N Engl J Med. 2011;365(6):493-505.
7. Lundgren JD, Babiker AG, et al; The INSIGHT START Study Group. Initiation of antiretroviral therapy in early asymptomatic HIV infection. N Engl J Med. 2015;373(9):795-807.
8. National Institutes of Health. Starting antiretroviral therapy early improves outcomes for HIV-infected individuals [news release]. U.S. Dept. of Health and Human Services Website. http://www.nih.gov/news-events/news-releases/starting-antiretroviral-treatment-early-improves-outcomes-hiv-infected-individuals, Published May 27, 2015. Accessed March 9, 2016.
9. Danel C, Moh R, et al; The TEMPRANO ANRS 12136 Study Group. A trial of early antiretrovirals and isoniazid preventive therapy in Africa. N Engl J Med. 2015;373(9):808-822.
10. World Health Organization. Guidelines on when to start antiretroviral therapy and on pre-exposure prophylaxis for HIV. World Health Organization Website. http://apps.who.int/iris/bitstream/10665/186275/1/9789241509565_eng.pdf. Published September 2015. Accessed March 9, 2016.
11. Mollan KR, Smurzynski M, Eron JJ, et al. Association between efavirenz as initial therapy for HIV-1 infection and increased risk for suicidal ideation or attempted or completed suicide: an analysis of trial data. Ann Intern Med. 2014;161(1):1-10.
12. FDA approves new treatment for HIV [news release]. U.S. Food and Drug Administration Website. http://www.fda.gov/NewsEvents/Newsroom/PressAnnouncements/ucm471300.htm. Published November 5, 2015. Accessed March 9, 2016.
13. Mills A, Aribas JR, Andrade-Villanueve J, et al. Switching from tenofovir disoproxil fumarate to tenofovir alafenamide in antiretroviral regimens for virologically suppressed adults with HIV-1 infection: a randomized, active-controlled, multicentre, open-label, phase 3, non-inferiority study. Lancet Infect Dis. 2016;16(1):43-52.
14. Sax PE, Zolopa A, Brar I, et al. Tenofovir alafenamide vs. tenofovir disoproxil fumarate in single tablet regimens for initial HIV-1 therapy: a randomized phase 2 study. J Acquir Immune Defic Syndr. 2014;67(1):52-58.
15. Sax PE, Wohl A, Yin MT, et al; GS-US-292-0104/0111 Study Team. Tenofovir alafenamide versus tenofovir disoproxil fumarate, coformulated with elvitegravir, cobicistat, and emtricitabine, for initial treatment of HIV-1 infection: two randomised, double-blind, phase 3, non-inferiority trials. Lancet. 2015;385(9987):2602-2615.
16. Fanrauzzi A, Messaroma I. Dolutegravir: clinical efficacy and role in HIV therapy. Ther Adv Chronic Dis. 2014;5(4):164-177.
17. Miller V, Sabon C, Hertogs K, et al. Virological and immunological effects of treatment interruptions in HIV-1 infected patients with treatment failure. AIDS. 2000;14(18):2857-2867.
18. Raffanti SP, Fusco JS, Sherrill BH, et al; Collaborations in HIV Outcomes Research/United States Project. Effect of persistent moderate viremia on disease progression during HIV therapy. J Acquir Immune Defic Syndr. 2004;37(1):1174-1154.
19. Canestri A, Lescure FX, Jaureguiberry S, et al. Discordance between cerebral spinal fluid and plasma HIV replication in patients with neurological symptoms who are receiving suppressive antiretroviral therapy. Clin Infect Dis. 2010;50(5):773-778.
20. Peluso MJ, Ferretti F, Peterson J, et al. Cerebrospinal fluid HIV escape associated with progressive neurologic dysfunction in patients on antiretroviral therapy with well controlled plasma viral load. AIDS. 2012;26(14):1765-1774.
21. Abrams D, Levy Y, Losso MH, et al. Interleukin-2 therapy in patients with HIV infection. N Engl J Med. 2009;361(16):1548-1559.
22. Tien PC, Choi AI, Zolopa AR, et al. Inflammation and mortality in HIV-infected adults: analysis of the FRAM study cohort. J Acquir Immune Defic Syndr. 2010;55(3):316-322.
23. Lederman MM, Funderburg NT, Sekaly RP, Klatt NR, Hunt PW. Residual immune dysregulation syndrome in treated HIV infection. Adv Immunol. 2013;119:51-83.
24. Mohd Hanafiah K, Groeger J, Flaxman AD, Wiersma ST. Global epidemiology of hepatitis C virus infection new estimates of age-specific antibody to HCV seroprevalence. Hepatology. 2013;57(4):1333-1342.
25. Sherman KE, Rouster SD, Chung RT, Rajicic N. Hepatitis C virus prevalence among patients infected with human immunodeficiency virus: a crosssectional analysis of the US adult AIDS Clinical Trials Group. Clin Infect Dis. 2002;34(6):831-837.
26. Cachay ER, Wyles D, Hill L, et al. The impact of direct-acting antivirals in the hepatitis C-sustained viral response in human immunodeficiency virus-infected patients with ongoing barriers to care. Open Forum Infect Dis. 2015;2(4):ofv168.
27. American Association for the Study of Liver Diseases, Infectious Diseases Society of American. Recommendations for testing, managing, and treating hepatitis C. American Association for the Study of Liver Diseases and the Infectious Diseases Society of America Website. http://hcvguidelines.org/sites/default/files/HCV-Guidance_February_2016_a1.pdf. Updated February 24, 2016. Accessed March 8, 2016.
28. Shah BM, Schafer JJ, Priano J, Squires KE. Cobicistat: a new booster for the treatment of human immunodeficiency virus infection. Pharmacotherapy. 2013;33(10):1107-1116.
29. Hull MW, Montaner JS. Ritonavir-boosted protease inhibitors in HIV therapy. Ann Med. 2011;43(5):375-388.
30. Centers for Disease Control and Prevention. HIV in the United States: at a glance. Centers for Disease Control and Prevention Website. http://www.cdc.gov/hiv/statistics/overview/ataglance.html. Updated September 29, 2015. Accessed March 8, 2016.
31. Prejean J, Song R, Hernandez A, et al. Estimated HIV incidence in the United States, 2006-2009. PLoS One. 2011;6(8):e17502.
32. Purcell DW, Johnson CH, Lansky A, et al. Estimating the population size of men who have sex with men in the United States to obtain HIV and syphilis rates. Open AIDS J. 2012;6:98-107.
33. Centers for Disease Control and Prevention. Estimated HIV incidence in the United States, 2007-2010. HIV Surveillance Report: Supplemental Report 2012;17(4). http://www.cdc.gov/hiv/pdf/statistics_hssr_vol_17_no_4.pdf. Published December 2012. Accessed Mar 23, 2016.
34. Centers for Disease Control and Prevention. HIV in the Southern United States. Centers for Disease Control and Prevention Website. http://www.cdc.gov/hiv/pdf /policies/cdc-hiv-in-the-south-issue-brief.pdf. Published December 2015. Accessed March 22, 2016.
35. Centers for Disease Control and Prevention. Southern states lag behind the rest of the nation in HIV treatment, testing [release]. Centers for Disease Control and Prevention Website. http://www.cdc.gov/nchhstp/newsroom/2015 /nhpc-press-release-southern-states.html. Published December 6, 2015. Accessed March 23, 2016.
36. Krawczyk CS, Funkhouser E, Kilbe JM, Vermund SH. Delayed access to HIV diagnosis and care: special concerns for the Southern United States. AIDS Care. 2006;18(suppl 1):S35-S44.
37. Reif S, Pence BW, Hall I, Hu X, Whetten K, Wilson E. HIV diagnosis, prevalence and outcomes in nine southern states. J Community Health. 2015;40(4);642-651.
38. Office of National AIDS Policy. National HIV/AIDS strategy. Improving outcomes: accelerating progress along the HIV care continuum. White House Website. https://www.whitehouse.gov/sites/default/files/onap_nhas_improving_outcomes _dec_2013.pdf. Published December 2013. Accessed March 8, 2016.
39. The White House Office of National AIDS Policy. National HIV/AIDS Strategy: Federal implementation plan. White House Website. http://www.whitehouse.gov/files/documents/nhas-implementation.pdf. Published July 2010. Accessed March 8, 2016.
40. Bradley H, Hall HI, Wolitski RJ, et al. Vital signs: HIV diagnosis, care, and treatment among persons living with HIV—United States, 2011. MMWR Morb Mortal Wkly Rep. 2014;63(47):1113-1117.
41. Centers for Disease Control and Prevention. CDC Vitalsigns. HIV care saves lives: viral suppression is key. Centers for Disease Control and Prevention Website. http://www.cdc.gov/vitalsigns/hiv-aids-medical-care. Published November 2014. Accessed March 8, 2016.
42. Samji H, Cescon A, Hogg RS, et al; North American AIDS Cohort Collaboration on Research and Design (NA-ACCORD) of IeDEA. Closing the gap: increases in life expectancy among treated HIV-positive individuals in the United States and Canada. PLoS One. 2013;8(12):e81355.
43. Joint United Nations Programme on HIV/AIDS. UNAIDS report shows that 19 million of the 35 million people living with HIV today do not know that they have the virus [press release]. UNAIDS Website. http://www.unaids.org/sites/default/files/web_story/20140716_PR_GapReport_en.pdf. Published July 16, 2014. Accessed March 8, 2016.
Single-Tablet Regimens in the Treatment of HIV-1 Infection
Together with prophylaxis for opportunistic infections, the widespread use of combination antiretroviral therapy (ART)—known as highly active antiretroviral therapy (HAART)—led to substantial gains in the life expectancy of patients infected with human immunodeficiency virus type 1 (HIV-1).1-3 The emergence of HAARTs has decreased mortality, increased viral suppression, and significantly reduced the risk of the sexual transmission of HIV.4-6
Since its introduction, HAART has evolved significantly with more options for triple therapy combinations that show improved efficacy, convenience, and tolerability. Single-tablet regimens (STRs) are the culmination of this evolution. The first STR was introduced in 2006, and to date, there are 5 STR options approved for use. In this review, the authors discuss the rationale and path to development of STRs, compare the currently available STRs, and discuss practical considerations in their use for the treatment of HIV-1 infection.
Is Triple Therapy The Sweet Spot?
Because current ART cannot eradicate HIV-1 infection due to latently infected CD4+ T-cell reservoirs, the primary goals of ART according to the HHS guidelines are to (1) reduce HIV-associated morbidity and prolong the duration and quality of survival; (2) restore and preserve immunologic function; (3) maximally and durably suppress plasma HIV viral load; and (4) prevent HIV transmission.7
These goals currently seem to be optimally achieved by treatment with 3 active agents, usually consisting of 2 nucleos(t)ide reverse-transcriptase inhibitors (NRTIs) as a backbone plus a drug from 1 of 3 drug classes: an integrase strand transfer inhibitor (INSTI), a nonnucleoside reverse-transcriptase inhibitor (NNRTI), or a protease inhibitor (PI) boosted with ritonavir or cobicistat. The most widely used NRTI backbones are abacavir plus lamivudine (ABC/3TC) or tenofovir disoproxil fumarate plus emtricitabine (TDF/FTC). Attempts to increase the number of active drugs in a regimen (≥ 4) have generally failed to yield additional virologic or immunologic benefits. Conversely, recent attempts to decrease the number of drugs in a regimen (≤ 2) have met with mixed success.
Mega-HAART
The AIDS Clinical Trial Group (ACTG) 5095 was a randomized controlled trial (RCT) to compare the safety and efficacy of a 3-drug regimen (zidovudine/lamivudine [AZT/3TC] plus efavirenz [EFV]) vs a 4-drug regimen (AZT/3TC/ABC plus EFV) in the initial treatment of HIV-1 infection.8 There were no significant differences in virologic efficacy between the 3-drug and 4-drug regimens, findings that have been corroborated in subsequent studies.9,10 Intensified (≥ 4 drugs) regimens have also failed to lead to significant decay in viral reservoir.10,11
Dual Therapy With Newer Agents
Recent clinical studies have explored the use of fewer medications in treatment-naïve HIV-infected patients. In the GARDEL study, dual therapy consisting of lopinavir/ritonavir (LPV/RTV) plus 3TC proved to be virologically noninferior to triple therapy of LPV/RTV plus 2 NRTIs in a fixed-dose combination.12 In a large European clinical trial (NEAT001/ANRS143), the combination of darunavir/ritonavir (DRV/RTV) plus raltegravir (RAL) was noninferior to DRV/RTV plus TDF/FTC, although more virologic failures were seen in the dual-therapy arm for patients with high baseline HIV-1 RNA viral loads or low baseline CD4+ counts.13
Suboptimal virologic responses also were observed with the DRV/RTV plus RAL regimen in several smaller studies: ACTG 5262 and RADAR.14,15 Finally, a combination of DRV/RTV plus maraviroc proved virologically inferior to standard DRV/RTV plus TDF/FTC in the MODERN trial.16 Although some dual-agent regimens have shown promise, none have established consistent and durable virologic efficacy sufficient to supplant triple therapy, which is currently endorsed by treatment guidelines and forms the basis for current STRs.
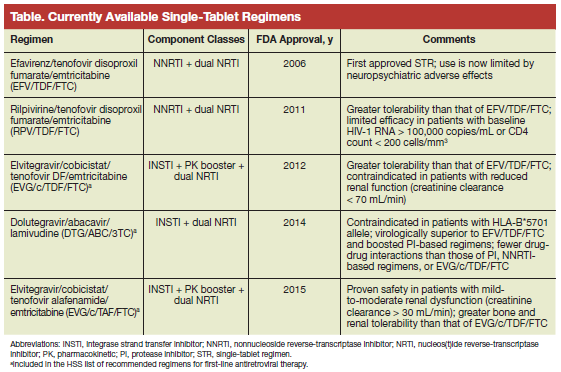
Current Single-Tablet Regimens
There are currently 5 STRs available for the treatment of HIV-1 infection, 3 are among the recommended regimens for ART in treatment-naïve patients. An older, triple NRTI-based STR (AZT/3TC/ABC) has fallen out of routine use due to inferior virologic efficacy, toxicities, and better-tolerated alternative agents.17 A review of the indications for use, major clinical trials, and unique features of available STRs follows and is summarized in the Table.
Efavirenz/tenofovir DF/emtricitabine
The first widely used STR, Atripla (Bristol-Myers Squibb and Gilead Sciences) combines the NRTIs tenofovir DF and FTC with the NNRTI EFV and was released in 2006. It is indicated for use alone or in combination with other ARTs for treatment of HIV-1 infection in adults or children aged > 12 years.18 Contraindications include hypersensitivity to efavirenz or coadministration with voriconazole. Major precautions are required for patients with severe psychiatric disease or suicidality; new or worsening renal impairment; women in the first trimester of pregnancy or of childbearing age not on effective contraception; or osteoporosis or history of fragility fractures. Patients with chronic liver disease also should be monitored for hepatotoxicity.
Large RCTs confirmed the potency and durability of viral suppression of EFV/TDF/FTC in treatment-naïve patients19,20 or in the context of antiretroviral switching for treatment simplification in patients previously suppressed with NNRTI- or PI-based regimens.21 This combination
has been shown to be noninferior or superior to multiple PI-based,22 NNRTI-based,23 and INSTI-based regimens.18 However, it recently was found to be associated with lower virologic response than was the INSTI-based regimen of ABC/3TC plus dolutegravir (DTG) and higher discontinuation rates than that of a TDF/FTC plus RAL regimen.24,25 Due to lingering concerns about an EFV association with suicidality26 and neural tube defects with first trimester exposure,27 EFV/TDF/FTC was downgraded to an alternative regimen for treatmentnaïve patients, because other available regimens are better tolerated with equal or superior efficacy.7
Rilpivirine/tenofovir DF/emtricitabine
Approved in 2011, Complera was the second STR (Gilead Sciences), combining the NNRTI rilpivirine (RPV) with the NRTI backbone TDF/FTC. It is indicated for use in (1) treatment-naïve adults with a baseline HIV-1 RNA ≤ 100,000 copies/mL and baseline CD4+ > 200 cells/mm3; or (2) switch therapy (changing from a previous antiretroviral regimen) in patients virologically suppressed (HIV-1 RNA ≤ 50 copies/mL) for at least 6 months without history of virologic failure or resistance to any of the component drugs.28 Contraindications include administration with other drugs that significantly lower RPV concentrations, such as certain acid-lowering drugs. Although not associated with as many neuropsychiatric or teratogenic effects as EFV/TDF/FTC, this combination still requires caution in circumstances of preexisting renal impairment, severe hepatic disease, or bone disease.
Two phase 3 studies and 1 open-label phase 3b study confirmed that RPV-based STRs were noninferior to EFVbased STRs overall.23,29 Importantly, patients with higher baseline viral loads experienced higher rates of virologic failure and higher rates of NRTI backbone resistance. Patients with baseline CD4+ < 200 cells/mm3 also had higher virologic failure rates. Because of these virologic and immunologic prerequisites for use, RPV/TDF/FTC is considered an alternative regimen for treatment-naïve patients.7 On the other hand, in the aforementioned studies,
fewer patients in the RPV arms discontinued therapy due to adverse events (AEs), and a switch from EFV/TDF/FTC to RPV/TDF/FTC was shown to be safe and effective.30 Its greater tolerability and safety profile make RPV/TDF/FTC an option for patients who do not tolerate EFV/TDF/3TC, who are pregnant, and who have a psychiatric illness.
Elvitegravir/cobicistat/tenofovir DF/emtricitabine
Released in 2012, Stribild (Gilead Sciences) was the first treatment to combine an INSTI and elvitegravir (EVG) with the pharmacologic booster cobicistat and the TDF/FTC backbone. It is indicated for use in treatmentnaïve adults or as switch therapy in patients virologically suppressed (HIV-1 RNA < 50 copies/mL) for at least 6 months without a history of virologic failure or resistance to any of the components.31
Two double-blind, active-controlled trials established that EVG/c/TDF/FTC was virologically noninferior and had greater safety and tolerability than that of EFV/TDF/FTC32 and ATV/RTV plus DF/FTC33 in treatment-naïve patients. It also maintained virologic suppression in patients switching from a boosted PI34 or an NNRTI-based regimen.35 On the basis of this efficacy and safety data, EVG/c/TDF/FTC is considered a recommended regimen for initial ART treatment.7 However, limitations to this regimen include significant drug-drug interactions due to potent CYP3A inhibition by cobicistat, potential renal and bone toxicity due to TDF, and cobicistat-induced inhibition of renal tubular creatinine secretion, which can lead to a mild creatinine increase (≤ 0.4 mg/dL) and may complicate renal function monitoring. Therefore, it is contraindicated
in patients concomitantly taking medications that are strong inducers of CYP3A or that are heavily metabolized by CYP3A for clearance, patients with reduced renal function (estimated creatinine clearance [CrCl] < 70 mL/min), and those receiving polyvalent cationic antacids or supplements.
Dolutegravir/abacavir/lamivudine
Approved in 2014, Triumeq (ViiV Healthcare) is the first and only currently available STR with an NRTI backbone of ABC/3TC rather than a tenofovir (TFV) derivative, combined with the INSTI DTG. It is indicated for the treatment of HIV-1 infection in patients without prior resistance to the INSTI class of ART or the other component drugs in this combination pill.36 The major contraindication is presence of the HLA-B*5701 allele, a polymorphism that predicts abacavir-related hypersensitivity, or moderate-tosevere hepatic impairment.37 Caution is required in patients with hepatitis B virus (HBV) co-infection due to the risk of 3TC drug resistance and subsequent acute exacerbation of HBV. Coadministration with dofetilide is contraindicated, and coadministration of some medications, most notably rifampin, requires an additional dose of DTG alone be given.36 Dolutegravir absorption is also decreased when coadministered with polyvalent cationic antacids or laxatives.
Dolutegravir-based regimens have been shown to be noninferior to RAL-based regimens38 and superior to EFV/TDF/FTC24 and boosted DRV-based regimens.39 Treatment-emergent resistance to DTG has been rare, suggesting a high genetic barrier to resistance compared with that of other INSTIs. On this basis, DTG/ABC/3TC is considered a recommended regimen for initial ART treatment.7 Another advantage of DTG/ABC/3TC is fewer drug-drug interactions than those of PI- or NNRTI-based regimens or the EVG/c/TDF/FTC STR.24,38,39 Limitations include the requirement to confirm a negative HLAB* 5701 allele, the potential association of abacavir with cardiovascular (CV) events seen in some but not all studies, and a small increase in creatinine due to DTG effects on renal tubular secretion.40-43
Elvitegravir/cobicistat/tenofovir alafenamide/emtricitabine
The latest STR, Genvoya (Gilead Sciences), approved in 2015, combines the INSTI elvitegravir and cobicistat with the novel NRTI backbone alafenamide(TAF)/FTC. Like TDF, TAF is an oral prodrug of TFV, but it achieves lower plasma and higher intracellular TFV levels than does TDF, potentially leading to improved bone and renal tolerability. This combination pill is indicated for use in treatment-naïve adults and children aged ≥ 12 years as switch therapy for patients virologically suppressed (HIV-1 RNA < 50 copies/mL) for at least 6 months without a history of virologic failure or resistance to any of the components.44 Contraindications include use of concomitant medications that are strong inducers of CYP3A or that are heavily metabolized by CYP3A for clearance. Initiation of this STR is also not recommended in patients with an estimated CrCl < 30 mL/min or with severe hepatic impairment.
In 2 phase 3 RCTs in treatment naïve patients, EVG/c/TAF/FTC was virologically noninferior to EVG/c/TDF/FTC.45 Patients in the TAF arms had smaller declines in estimated glomerular filtration (eGFR) and reductions in bone mineral density (BMD) but higher fasting lipids compared with that of patients in the TDF arms. Switching virologically suppressed patients with mild-tomoderate renal insufficiency (eGFR 30-69 mL/min) from TDF-containing regimens to EVG/c/TDF/FTC also has demonstrated maintenance of virologic response while improving BMD and markers of renal function.46
In November 2015, EVG/c/TAF/FTC was added as a recommended regimen for initial ART treatment in patients with CrCl ≥ 30 mL/min.7 Advantages of this regimen include its favorable safety profile mentioned earlier and the indication for use in patients with mildto-moderate renal impairment, which is unique among the STRs. However, limitations still remain, including significant drug-drug interactions due to potent CYP3A inhibition and cobicistat-induced inhibition of renal tubular creatinine secretion. Also, more clinical data are needed to confirm the durability of this regimen and to assess whether its improved safety profile translates into fewer clinical outcomes such as renal failure or fractures.
Single-Tablet Regimen Pros and Cons
The proportion of patients on STRs has significantly increased over the past several years. A recently published report of the Women’s Interagency HIV Study (WIHS), a longitudinal study of HIV infection in U.S. women, has analyzed the use of STR. The study showed that the use of STR among ART users increased from 7% in 2006 to 27% in 2013.47
Advantages of STRs
Potential advantages of STRs include simplicity, convenience, and adherence, especially by eliminating the risk of selective nonadherence to components of the regimens. Observational cohorts and meta-analyses are beginning to confirm these theoretical advantages. A meta-analysis of 19 RCTs including 6,312 patients demonstrated that regimens with lower pill burdens and once-daily dosing were both associated with better adherence, and fewer pills also led to improved virologic suppression.48 In the analysis of the WIHS cohort, STR use was significantly associated with increasedadherence (adjusted risk ratio: 1.05; 95% confidence interval: 1.03 to 1.08) and virologic suppression (risk ratio: 1.06; 95% confidence interval: 1.01 to 1.11).47 Another observational cohort analysis of commercially insured HIV-infected patients showed that patients on STRs were 1.3 times more likely to achieve at least 90% adherence.49
A recent RCT, which assigned 300 patients on stable ART to continue their current regimen or switch to EFV/TDF/FTC as an STR, demonstrated no difference in virologic suppression or patient-reported adherence between the 2 groups.21 However, 91% of patients in this study reported a preference for the STR regimen.50 Single-tablet regimen recipients also have been shown to be less likely to develop treatment-emergent, drug-resistance mutations (DRMs) at the time of virologic failure. In a recently published study, patients receiving the STR EFV/FTC/TDF had a significantly lower risk of DRMs on failure than did those receiving the same components individually in a non-STR regimen.51 Finally, recent data showed that prescription errors in inpatient ART are common and often go undetected, but coformulated regimens were associated with lower error rates.52
Disadvantages of STRs
Although outweighed by the advantages, there are potential disadvantages to the use of STRs. These include the inability to adjust dosages of components of the regimen for drug-drug or drug-food interactions. In particular, patients with preexisting renal impairment (estimated CrCl < 50 mL/min) have limited options and safety data for STRs. Also, STRs do not exist currently for all NRTI-anchor drug pairings. Notably, there is no available 2 NRTI plus boosted PI STR. This limitation may be important in treatment-experienced patients where PI-based regimens may be needed or in patients with comorbidities where a NRTI-sparing regimen would be considered.
Finally, at the population level, the potential benefits of STRs must be balanced with the increased costs compared with that of generic ART regimens with multiple pills. For example, a mathematical simulation model based on 2009 U.S. data suggested that switching all patients in the U.S. from the branded STR EFV/TDF/FTC to a triple regimen of generic EFV, 3TC, and branded TDF would have saved almost $1 billion per year with only a small decrement in virologic efficacy.53 More costeffectiveness analyses are needed, especially for the developing world, to inform strategies for the use of STRs to improve outcomes in the most costeffective way globally.
When to Use STRS?
For initial ART in treatment-naïve patients, 3 of the available STRs are listed as recommended regimens by the HHS guidelines: EVG/c/TDF/FTC, DTG/ABC/3TC, or EVG/c/TAF/FTC.7 In choosing an initial regimen, a number of factors must be considered, including baseline HIV-1 resistance, drug-drug interactions, medical comorbidities, food restrictions, patient preference and convenience, and cost. Patients with drug-resistant HIV-1 or significant renal impairment are less ideal candidates for STRs for initial therapy. Otherwise, the determination typically depends on which of the NRTI backbone drugs, TDF or TAF vs ABC, is most appropriate. Clinicians may favor TDF-containing or TAFcontaining regimens in patients with HBV coinfection, clinically significant CV disease, or patients with the HLA-B*5701 genetic polymorphism.
Conversely, clinicians may favor ABC-containing or TAF-containing regimens in patients at high risk or with preexisting metabolic bone disease or more mild renal impairment. Drug-drug and drug-supplement interactions must be carefully considered in all cases. Although listed as alternative regimens, the other available STRs—EFV/TDF/FTC or RPV/TDF/FTC—may still be the preferred regimen in select individual patients.
In patients already on ART, a switch to a STR may be considered in the following scenarios, with the caveat that most of the clinical trials evaluating switch therapy have been in patients who were virologically suppressed for 6 months on their prior regimens:
- Improve tolerability. In the STRATEGY-NNRTI trial, patients on a stable EFV-containing regimen experienced significant improvements in neuropsychiatric AEs after switching to EVG/c/TDF/FTC.35
- Virologically suppressed patients with multiple comorbidities. Difficulty managing dyslipidemia or high CV risk might necessitate a switch from a PI-containing regimen. From the results of the SPIRIT trial54 and the STRATEGY-PI trial,34 these patients could be switched safely to RPV/TDF/FTC or EVG/c/TDF/FTC, respectively.
- Management of virologic failure. This may be beneficial provided that drug resistance has not compromised the components of the regimen.
Conclusion
The potency and once-daily dosing of EFV-based regimens ushered in the era of STRs. The list of STRs has now expanded with the introduction of an RPV-based STR and, lately, 3 different INSTI-based STRs. In the current HHS guidelines, only the INSTI-based STRs are included in the recommended list, mostly because of poor tolerability of EFV/TDF/FTC and lower efficacy of RPV/TDF/FTC in patients with high baseline viremia. In general, the safety profile of STRs has been improving with newer iterations. Their main advantages are convenience, simplicity and improvements in adherence, and possibly reductions in medication errors. Due to these advantages, the percentage of patients on STRs is likely to continue rising. Further expansions of the ART armamentarium may include the development of boosted PI-based STRs as well as novel delivery strategies, such as long-acting injectable regimens.55 In the meantime, clinicians should develop a greater familiarity with the use of the currently available STRs.
Click here to read the digital edition.
1. Centers for Disease Control and Prevention. Update: trends in AIDS incidence, deaths, and prevalence—United States, 1996. MMWR Morb Mortal Wkly Rep.1997;46(8):165-173.
2. Palella FJ Jr, Delaney KM, Moorman AC, et al; HIV Outpatient Study Investigators. Declining morbidity and mortality among patients with advanced human immunodeficiency virus infection. N Engl J Med. 1998;338(13):853-860.
3. Crum NF, Riffenburgh RH, Wegner S, et al; Triservice AIDS Clinical Consortium. Comparisons of causes of death and mortality rates among HIV-infected persons:analysis of the pre-, early, and late HAART (highly active antiretroviral therapy) eras. J Acquir Immune Defic Syndr. 2006;41(2):194-200.
4. Bor J, Herbst AJ, Newell M-L, Bärnighausen T. Increases in adult life expectancy in rural South Africa: valuing the scale-up of HIV treatment. Science. 2013;339(6122):961-965.
5. Antiretroviral Therapy Cohort Collaboration. Life expectancy of individuals on combination antiretroviral therapy in high-income countries: a collaborative analysis of 14 cohort studies. Lancet. 2008;372(9635):293-299.
6. Cohen MS, Chen YQ, McCauley M, et al; the HPTN 052 Study Team. Prevention of HIV-1 infection with early antiretroviral therapy. N Engl J Med. 2011;365(6):493-505.
7. DHHS Panel on Antiretroviral Guidelines for Adults and Adolescents. Guidelines for the use of antiretroviral agents in HIV-1 infected adults and adolescents. AIDSinfo Website. https://aidsinfo.nih.gov/contentfiles/lvguidelines/adultandadolescentgl.pdf. Updated January 28, 2016. Accessed March 10, 2016.
8. Gulick RM, Ribaudo HJ, Shikuma CM, et al; AIDS Clinical Trials Group (ACTG) A5095 Study Team. Three- vs four-drug antiretroviral regimens for the initial treatment of HIV-1 infection: a randomized controlled trial. JAMA. 2006;296(7):769-781.
9. Orkin C, Stebbing J, Nelson M, et al. A randomized study comparing a three- and four-drug HAART regimen in first-line therapy (QUAD study). J Antimicrob Chemother. 2005;55(2):246-251.
10. Gandhi RT, Bosch RJ, Aga E, et al; AIDS Clinical Trials Group A5173 Team. No evidence for decay of the latent reservoir in HIV-1-infected patients receiving intensive enfuvirtide containing antiretroviral therapy. J Infect Dis. 2010;201(2): 293-296.
11. Chéret A, Nembot G, Mélard A, et al; OPTIPRIM ANRS Study Group. Intensive five-drug antiretroviral therapy regimen versus standard triple-drug therapy during primary HIV-1 infection (OPTIPRIM-ANRS 147): a randomised, open-label, phase 3 trial. Lancet Infect Dis. 2015;15(4):387-396.
12. Cahn P, Andrade-Villanueva J, Arribas JR, et al; GARDEL Study Group. Dual therapy with lopinavir and ritonavir plus lamivudine versus triple therapy with lopinavir and ritonavir plus two nucleoside reverse transcriptase inhibitors in antiretroviral-therapy-naive adults with HIV-1 infection: 48 week results of the randomised, open label, non-inferiority GARDEL trial. Lancet Infect Dis. 2014;14(7):572-580.
13. Raffi F, Babiker AG, Richert L, et al; for the NEAT001/ANRS143 Study Group. Ritonavir-boosted darunavir combined with raltegravir or tenofoviremtricitabine in antiretroviral-naive adults infected with HIV-1: 96 week results from the NEAT001/ANRS143 randomised non-inferiority trial. Lancet. 2014;384(9958):1942-1951.
14. Taiwo B, Zheng L, Gallien S, et al; ACTG A5262 Team. Efficacy of a nucleosidesparing regimen of darunavir/ritonavir plus raltegravir in treatment-naive HIV-1-infected patients (ACTG A5262). AIDS. 2011;25(17):2113-2122.
15. Bedimo RJ, Drechsler H, Jain M, et al. The RADAR study: week 48 safety and efficacy of RAltegravir combined with boosted DARunavir compared to tenofovir/emtricitabine combined with boosted darunavir in antiretroviral-naive patients. Impact on bone health. PLoS One. 2014;9(8):e106221.
16. Stellbrink HJ, Pulik P, Szlavik J, et al. Maraviroc (MVC) dosed once daily with darunavir/ritonavir (DRV/r) in a 2 drug-regimen compared to emtricitabine/tenofovir (TDF/FTC) with DRV/r; 48-week results from MODERN (Study A4001095) (Abstract). AIDS 2014 Website. http://pag.aids2014.org/Abstracts.aspx?SID=1139&AID=6180. Accessed March 11, 2016.
17. Gulick RM, Ribaudo HJ, Shikuma CM, et al; AIDS Clinical Trials Group Study A5095 Team. Triple-nucleoside regimens versus efavirenz-containing regimens for the initial treatment of HIV-1 infection. N Engl J Med. 2004;350(18):1850-1861.
18. Sax PE, DeJesus E, Mills A; GS-US-236-0102 study team. Co-formulated elvitegravir, cobicistat, emtricitabine, and tenofovir versus co-formulated efavirenz, emtricitabine, and tenofovir for initial treatment of HIV-1 infection: a randomised, double-blind, phase 3 trial, analysis of results after 48 weeks. Lancet. 2012;379(9835):2439-2448.
19. Gallant JE, DeJesus E, Arribas JR, et al; Study 934 Group. Tenofovir DF, emtricitabine, and efavirenz vs. zidovudine, lamivudine, and efavirenz for HIV. N Engl J Med. 2006;354(3):251-260.
20. Arribas JR, Pozniak AL, Gallant JE, et al. Tenofovir disoproxil fumarate, emtricitabine, and efavirenz compared with zidovudine/lamivudine and efavirenz in treatment-naive patients: 144-week analysis. J Acquir Immune Defic Syndr. 2008;47(1):74-78.
21. Dejesus E, Young B, Morales-Ramirez JO, et al; AI266073 Study Group. Simplification of antiretroviral therapy to a single-tablet regimen consisting of efavirenz, emtricitabine, and tenofovir disoproxil fumarate versus unmodified antiretroviral therapy in virologically suppressed HIV-1-infected patients. J Acquir Immune Defic Syndr. 2009;51(2):163-174.
22. Daar ES, Tierney C, Fischl MA, et al; AIDS Clinical Trials Group Study A5202 Team. Atazanavir plus ritonavir or efavirenz as part of a 3-drug regimen for initial treatment of HIV-1. Ann Intern Med. 2011;154(7):445-456.
23. Cohen CJ, Molina JM, Cassetti I, et al; ECHO, THRIVE study groups. Week 96 efficacy and safety of rilpivirine in treatment-naive, HIV-1 patients in two Phase III randomized trials. AIDS. 2013;27(6):939-950.
24. Walmsley SL, Antela A, Clumeck N, et al; SINGLE Investigators. Dolutegravir plus abacavir-lamivudine for the treatment of HIV-1 infection. N Engl J Med. 2013;369(19):1807-1818.
25. Rockstroh JK, DeJesus E, Lennox JL, et al; STARTMRK Investigators. Durable efficacy and safety of raltegravir versus efavirenz when combined with tenofovir/emtricitabine in treatment-naive HIV-1-infected patients: final 5-year results from STARTMRK. J Acquir Immune Defic Syndr. 2013;63(1):77-85.
26. Mollan KR, Smurzynski M, Eron JJ, et al. Association between efavirenz as initial therapy for HIV-1 infection and increased risk for suicidal ideation or attempted or completed suicide: an analysis of trial data. Ann Intern Med. 2014;161(1):1-10.
27. Fundarò C, Genovese O, Rendeli C, Tamburrini E, Salvaggio E. Myelomeningocele in a child with intrauterine exposure to efavirenz. AIDS. 2002;16(2):299-300.
28. Complera [package insert]. Foster City, CA: Gilead Sciences, Inc; 2016.
29. Cohen C, Wohl D, Arribas JR, et al. Week 48 results from a randomized clinical trial of rilpivirine/emtricitabine/tenofovir disoproxil fumarate vs. efavirenz/emtricitabine/tenofovir disoproxil fumarate in treatment-naive HIV-1-infected adults. AIDS. 2014;28(7):989-997.
30. Mills AM, Cohen C, DeJesus E, et al. Efficacy and safety 48 weeks after switching from efavirenz to rilpivirine using emtricitabine/tenofovir disoproxil fumaratebased single-tablet regimens. HIV Clin Trials. 2013;14(5):216-223.
31. Stribild [package insert]. Foster City, CA: Gilead Sciences, Inc; 2015.
32. Wohl DA, Cohen C, Gallant JE, et al; GS-US-236-0102 Study Team. A randomized, double-blind comparison of single-tablet regimen elvitegravir/cobicistat/emtricitabin/tenofovir DF versus single-tablet regimen efavirenz/emtricitabine/tenofovir DF for initial treatment of HIV-1 infection: analysis of week 144 results. J Acquir Immune Defic Syndr. 2014;65(3):e118-e120.
33. DeJesus E, Rockstroh JK, Henry K, et al; GS-236-0103 Study Team. Co-formulated elvitegravir, cobicistat, emtricitabine, and tenofovir disoproxil fumarate versus ritonavir-boosted atazanavir plus co-formulated emtricitabine and tenofovir disoproxil fumarate for initial treatment of HIV-1 infection: a randomised, doubleblind, phase 3, non-inferiority trial. Lancet. 2012;379(9835):2429-2438.
34. Arribas JR, Pialoux G, Gathe J, et al. Simplification to coformulated elvitegravir, cobicistat, emtricitabine, and tenofovir versus continuation of ritonavir-boosted protease inhibitor with emtricitabine and tenofovir in adults with virologically suppressed HIV (STRATEGY-PI): 48 week results of a randomised, open-label, phase 3b, non-inferiority trial. Lancet Infect Dis.
2014;14(7):581-589.
35. Pozniak A, Markowitz M, Mills A, et al. Switching to coformulated elvitegravir, cobicistat, emtricitabine, and tenofovir versus continuation of non-nucleoside reverse transcriptase inhibitor with emtricitabine and tenofovir in virologically suppressed adults with HIV (STRATEGY-NNRTI): 48 week results of a randomised, open-label, phase 3b non-inferiority trial. Lancet Infect Dis. 2014;14(7):590-599.
36. Triumeq [package insert]. Basingstoke, UK: ViiV Healthcare; 2014.
37. Mallal S, Phillips E, Carosi G, et al. HLA-B*5701 screening for hypersensitivity to abacavir. N Engl J Med. 2008;358(6):568-579.
38. Raffi F, Rachlis A, Stellbrink HJ, et al. Once-daily dolutegravir versus raltegravir in antiretroviral-naive adults with HIV-1 infection: 48 week results from the randomised, double-blind, non-inferiority SPRING-2 study. Lancet. 2013;381(9868):735-743.
39. Clotet B, Feinberg J, van Lunzen J, et al; ING114915 Study Team. Once-daily dolutegravir versus darunavir plus ritonavir in antiretroviral-naive adults with HIV-1 infection (FLAMINGO): 48 week results from the randomised open-label phase p3b study. Lancet. 2014;383(9936):2222-2231.
40. Strategies for Management of Anti-Retroviral Therapy/INSIGHT; DAD Study Groups. Use of nucleoside reverse transcriptase inhibitors and risk of myocardial infarction in HIV-infected patients. AIDS. 2008;22(14):F17-F24.
41. Bedimo RJ, Westfall AO, Drechsler H, Vidiella G, Tebas P. Abacavir use and risk of acute myocardial infarction and cerebrovascular events in the highly active antiretroviral therapy era. Clin Infect Dis. 2011;53(1):84-91.
42. Ding X, Andraca-Carrera E, Cooper C, et al. No association of abacavir use with myocardial infarction: findings of an FDA meta-analysis. J Acquir Immune Defic Syndr. 2012;61(4):441-447.
43. Desai M, Joyce V, Bendavid E, et al. Risk of cardiovascular events associated with
current exposure to HIV antiretroviral therapies in a US veteran population. Clin
Infect Dis. 2015;61(3):445-452.
44. Genvoya [package insert]. Foster City, CA: Gilead Sciences, Inc; 2015.
45. Sax PE, Wohl D, Yin MT, et al. Tenofovir alafenamide versus tenofovir disoproxil fumarate, coformulated with elvitegravir, cobicistat, and emtricitabine, for initial treatment of HIV-1 infection: two randomised, double-blind, phase 3, non-inferiority trials. Lancet. 2015;385(9987):2606-2615.
46. Mills A, Arribas JR, Andrade-Villanueva J, et al. Switching from tenofovir disoproxil fumarate to tenofovir alafenamide in antiretroviral regimens for virologically suppressed adults with HIV-1 infection: a randomised, active-controlled, multicentre, open-label, phase 3, non-inferiority study. Lancet Infect Dis. 2016;16(1):43-52.
47. Hanna DB, Hessol NA, Golub ET, et al. Increase in single-tablet regimen use and associated improvements in adherence-related outcomes in HIV-infected women. J Acquir Immune Defic Syndr. 2014;65(5):587-596.
48. Nachega JB, Parienti JJ, Uthman OA, et al. Lower pill burden and once-daily antiretroviral
treatment regimens for HIV infection: a meta-analysis of randomized controlled trials. Clin Infect Dis. 2014;58(9):1297-1307.
49. Cooke CE, Lee HY, Xing S. Adherence to antiretroviral therapy in managed care members in the United States: a retrospective claims analysis. J Manag Care Pharm. 2014;20(1):86-92.
50. Hodder SL, Mounzer K, DeJesus E, et al; AI266073 Study Group. Patient-reported outcomes in virologically suppressed, HIV-1-iInfected subjects after switching to a simplified, single-tablet regimen of efavirenz, emtricitabine, and tenofovir DF. AIDS Patient Care STDS. 2010;24(2):87-96.
51. Blanco JL, Montaner JS, Marconi VC, et al. Lower prevalence of drug resistance mutations at first-line virological failure to first-line therapy with atripla vs. tenofovir + emtricitabine/lamivudine + efavirenz administered on a multiple tablet therapy. AIDS. 2014;28(17):2531-2539.
52. Commers T, Swindells S, Sayles H, Gross AE, Devetten M, Sandkovsky U. Antiretroviral medication prescribing errors are common with hospitalization of HIV infected patients. J Antimicrob Chemother. 2014;69(1):262-267.
53. Walensky RP, Sax PE, Nakamura YM, et al. Economic savings versus health losses: the cost-effectiveness of generic antiretroviral therapy in the United States.
Ann Intern Med. 2013;158(2):84-92.
54. Palella FJ Jr, Fisher M, Tebas P, et al. Simplification to rilpivirine/emtricitabine/ tenofovir disoproxil fumarate from ritonavir-boosted protease inhibitor antiretroviral therapy in a randomized trial of HIV-1 RNA-suppressed participants. AIDS. 2014;28(3):335-344.
55. Gulick R. HIV treatment 2020: what will it look like? J Int AIDS Soc. 2014;17(4)(suppl 3):19528.
Together with prophylaxis for opportunistic infections, the widespread use of combination antiretroviral therapy (ART)—known as highly active antiretroviral therapy (HAART)—led to substantial gains in the life expectancy of patients infected with human immunodeficiency virus type 1 (HIV-1).1-3 The emergence of HAARTs has decreased mortality, increased viral suppression, and significantly reduced the risk of the sexual transmission of HIV.4-6
Since its introduction, HAART has evolved significantly with more options for triple therapy combinations that show improved efficacy, convenience, and tolerability. Single-tablet regimens (STRs) are the culmination of this evolution. The first STR was introduced in 2006, and to date, there are 5 STR options approved for use. In this review, the authors discuss the rationale and path to development of STRs, compare the currently available STRs, and discuss practical considerations in their use for the treatment of HIV-1 infection.
Is Triple Therapy The Sweet Spot?
Because current ART cannot eradicate HIV-1 infection due to latently infected CD4+ T-cell reservoirs, the primary goals of ART according to the HHS guidelines are to (1) reduce HIV-associated morbidity and prolong the duration and quality of survival; (2) restore and preserve immunologic function; (3) maximally and durably suppress plasma HIV viral load; and (4) prevent HIV transmission.7
These goals currently seem to be optimally achieved by treatment with 3 active agents, usually consisting of 2 nucleos(t)ide reverse-transcriptase inhibitors (NRTIs) as a backbone plus a drug from 1 of 3 drug classes: an integrase strand transfer inhibitor (INSTI), a nonnucleoside reverse-transcriptase inhibitor (NNRTI), or a protease inhibitor (PI) boosted with ritonavir or cobicistat. The most widely used NRTI backbones are abacavir plus lamivudine (ABC/3TC) or tenofovir disoproxil fumarate plus emtricitabine (TDF/FTC). Attempts to increase the number of active drugs in a regimen (≥ 4) have generally failed to yield additional virologic or immunologic benefits. Conversely, recent attempts to decrease the number of drugs in a regimen (≤ 2) have met with mixed success.
Mega-HAART
The AIDS Clinical Trial Group (ACTG) 5095 was a randomized controlled trial (RCT) to compare the safety and efficacy of a 3-drug regimen (zidovudine/lamivudine [AZT/3TC] plus efavirenz [EFV]) vs a 4-drug regimen (AZT/3TC/ABC plus EFV) in the initial treatment of HIV-1 infection.8 There were no significant differences in virologic efficacy between the 3-drug and 4-drug regimens, findings that have been corroborated in subsequent studies.9,10 Intensified (≥ 4 drugs) regimens have also failed to lead to significant decay in viral reservoir.10,11
Dual Therapy With Newer Agents
Recent clinical studies have explored the use of fewer medications in treatment-naïve HIV-infected patients. In the GARDEL study, dual therapy consisting of lopinavir/ritonavir (LPV/RTV) plus 3TC proved to be virologically noninferior to triple therapy of LPV/RTV plus 2 NRTIs in a fixed-dose combination.12 In a large European clinical trial (NEAT001/ANRS143), the combination of darunavir/ritonavir (DRV/RTV) plus raltegravir (RAL) was noninferior to DRV/RTV plus TDF/FTC, although more virologic failures were seen in the dual-therapy arm for patients with high baseline HIV-1 RNA viral loads or low baseline CD4+ counts.13
Suboptimal virologic responses also were observed with the DRV/RTV plus RAL regimen in several smaller studies: ACTG 5262 and RADAR.14,15 Finally, a combination of DRV/RTV plus maraviroc proved virologically inferior to standard DRV/RTV plus TDF/FTC in the MODERN trial.16 Although some dual-agent regimens have shown promise, none have established consistent and durable virologic efficacy sufficient to supplant triple therapy, which is currently endorsed by treatment guidelines and forms the basis for current STRs.
Current Single-Tablet Regimens
There are currently 5 STRs available for the treatment of HIV-1 infection, 3 are among the recommended regimens for ART in treatment-naïve patients. An older, triple NRTI-based STR (AZT/3TC/ABC) has fallen out of routine use due to inferior virologic efficacy, toxicities, and better-tolerated alternative agents.17 A review of the indications for use, major clinical trials, and unique features of available STRs follows and is summarized in the Table.
Efavirenz/tenofovir DF/emtricitabine
The first widely used STR, Atripla (Bristol-Myers Squibb and Gilead Sciences) combines the NRTIs tenofovir DF and FTC with the NNRTI EFV and was released in 2006. It is indicated for use alone or in combination with other ARTs for treatment of HIV-1 infection in adults or children aged > 12 years.18 Contraindications include hypersensitivity to efavirenz or coadministration with voriconazole. Major precautions are required for patients with severe psychiatric disease or suicidality; new or worsening renal impairment; women in the first trimester of pregnancy or of childbearing age not on effective contraception; or osteoporosis or history of fragility fractures. Patients with chronic liver disease also should be monitored for hepatotoxicity.
Large RCTs confirmed the potency and durability of viral suppression of EFV/TDF/FTC in treatment-naïve patients19,20 or in the context of antiretroviral switching for treatment simplification in patients previously suppressed with NNRTI- or PI-based regimens.21 This combination
has been shown to be noninferior or superior to multiple PI-based,22 NNRTI-based,23 and INSTI-based regimens.18 However, it recently was found to be associated with lower virologic response than was the INSTI-based regimen of ABC/3TC plus dolutegravir (DTG) and higher discontinuation rates than that of a TDF/FTC plus RAL regimen.24,25 Due to lingering concerns about an EFV association with suicidality26 and neural tube defects with first trimester exposure,27 EFV/TDF/FTC was downgraded to an alternative regimen for treatmentnaïve patients, because other available regimens are better tolerated with equal or superior efficacy.7
Rilpivirine/tenofovir DF/emtricitabine
Approved in 2011, Complera was the second STR (Gilead Sciences), combining the NNRTI rilpivirine (RPV) with the NRTI backbone TDF/FTC. It is indicated for use in (1) treatment-naïve adults with a baseline HIV-1 RNA ≤ 100,000 copies/mL and baseline CD4+ > 200 cells/mm3; or (2) switch therapy (changing from a previous antiretroviral regimen) in patients virologically suppressed (HIV-1 RNA ≤ 50 copies/mL) for at least 6 months without history of virologic failure or resistance to any of the component drugs.28 Contraindications include administration with other drugs that significantly lower RPV concentrations, such as certain acid-lowering drugs. Although not associated with as many neuropsychiatric or teratogenic effects as EFV/TDF/FTC, this combination still requires caution in circumstances of preexisting renal impairment, severe hepatic disease, or bone disease.
Two phase 3 studies and 1 open-label phase 3b study confirmed that RPV-based STRs were noninferior to EFVbased STRs overall.23,29 Importantly, patients with higher baseline viral loads experienced higher rates of virologic failure and higher rates of NRTI backbone resistance. Patients with baseline CD4+ < 200 cells/mm3 also had higher virologic failure rates. Because of these virologic and immunologic prerequisites for use, RPV/TDF/FTC is considered an alternative regimen for treatment-naïve patients.7 On the other hand, in the aforementioned studies,
fewer patients in the RPV arms discontinued therapy due to adverse events (AEs), and a switch from EFV/TDF/FTC to RPV/TDF/FTC was shown to be safe and effective.30 Its greater tolerability and safety profile make RPV/TDF/FTC an option for patients who do not tolerate EFV/TDF/3TC, who are pregnant, and who have a psychiatric illness.
Elvitegravir/cobicistat/tenofovir DF/emtricitabine
Released in 2012, Stribild (Gilead Sciences) was the first treatment to combine an INSTI and elvitegravir (EVG) with the pharmacologic booster cobicistat and the TDF/FTC backbone. It is indicated for use in treatmentnaïve adults or as switch therapy in patients virologically suppressed (HIV-1 RNA < 50 copies/mL) for at least 6 months without a history of virologic failure or resistance to any of the components.31
Two double-blind, active-controlled trials established that EVG/c/TDF/FTC was virologically noninferior and had greater safety and tolerability than that of EFV/TDF/FTC32 and ATV/RTV plus DF/FTC33 in treatment-naïve patients. It also maintained virologic suppression in patients switching from a boosted PI34 or an NNRTI-based regimen.35 On the basis of this efficacy and safety data, EVG/c/TDF/FTC is considered a recommended regimen for initial ART treatment.7 However, limitations to this regimen include significant drug-drug interactions due to potent CYP3A inhibition by cobicistat, potential renal and bone toxicity due to TDF, and cobicistat-induced inhibition of renal tubular creatinine secretion, which can lead to a mild creatinine increase (≤ 0.4 mg/dL) and may complicate renal function monitoring. Therefore, it is contraindicated
in patients concomitantly taking medications that are strong inducers of CYP3A or that are heavily metabolized by CYP3A for clearance, patients with reduced renal function (estimated creatinine clearance [CrCl] < 70 mL/min), and those receiving polyvalent cationic antacids or supplements.
Dolutegravir/abacavir/lamivudine
Approved in 2014, Triumeq (ViiV Healthcare) is the first and only currently available STR with an NRTI backbone of ABC/3TC rather than a tenofovir (TFV) derivative, combined with the INSTI DTG. It is indicated for the treatment of HIV-1 infection in patients without prior resistance to the INSTI class of ART or the other component drugs in this combination pill.36 The major contraindication is presence of the HLA-B*5701 allele, a polymorphism that predicts abacavir-related hypersensitivity, or moderate-tosevere hepatic impairment.37 Caution is required in patients with hepatitis B virus (HBV) co-infection due to the risk of 3TC drug resistance and subsequent acute exacerbation of HBV. Coadministration with dofetilide is contraindicated, and coadministration of some medications, most notably rifampin, requires an additional dose of DTG alone be given.36 Dolutegravir absorption is also decreased when coadministered with polyvalent cationic antacids or laxatives.
Dolutegravir-based regimens have been shown to be noninferior to RAL-based regimens38 and superior to EFV/TDF/FTC24 and boosted DRV-based regimens.39 Treatment-emergent resistance to DTG has been rare, suggesting a high genetic barrier to resistance compared with that of other INSTIs. On this basis, DTG/ABC/3TC is considered a recommended regimen for initial ART treatment.7 Another advantage of DTG/ABC/3TC is fewer drug-drug interactions than those of PI- or NNRTI-based regimens or the EVG/c/TDF/FTC STR.24,38,39 Limitations include the requirement to confirm a negative HLAB* 5701 allele, the potential association of abacavir with cardiovascular (CV) events seen in some but not all studies, and a small increase in creatinine due to DTG effects on renal tubular secretion.40-43
Elvitegravir/cobicistat/tenofovir alafenamide/emtricitabine
The latest STR, Genvoya (Gilead Sciences), approved in 2015, combines the INSTI elvitegravir and cobicistat with the novel NRTI backbone alafenamide(TAF)/FTC. Like TDF, TAF is an oral prodrug of TFV, but it achieves lower plasma and higher intracellular TFV levels than does TDF, potentially leading to improved bone and renal tolerability. This combination pill is indicated for use in treatment-naïve adults and children aged ≥ 12 years as switch therapy for patients virologically suppressed (HIV-1 RNA < 50 copies/mL) for at least 6 months without a history of virologic failure or resistance to any of the components.44 Contraindications include use of concomitant medications that are strong inducers of CYP3A or that are heavily metabolized by CYP3A for clearance. Initiation of this STR is also not recommended in patients with an estimated CrCl < 30 mL/min or with severe hepatic impairment.
In 2 phase 3 RCTs in treatment naïve patients, EVG/c/TAF/FTC was virologically noninferior to EVG/c/TDF/FTC.45 Patients in the TAF arms had smaller declines in estimated glomerular filtration (eGFR) and reductions in bone mineral density (BMD) but higher fasting lipids compared with that of patients in the TDF arms. Switching virologically suppressed patients with mild-tomoderate renal insufficiency (eGFR 30-69 mL/min) from TDF-containing regimens to EVG/c/TDF/FTC also has demonstrated maintenance of virologic response while improving BMD and markers of renal function.46
In November 2015, EVG/c/TAF/FTC was added as a recommended regimen for initial ART treatment in patients with CrCl ≥ 30 mL/min.7 Advantages of this regimen include its favorable safety profile mentioned earlier and the indication for use in patients with mildto-moderate renal impairment, which is unique among the STRs. However, limitations still remain, including significant drug-drug interactions due to potent CYP3A inhibition and cobicistat-induced inhibition of renal tubular creatinine secretion. Also, more clinical data are needed to confirm the durability of this regimen and to assess whether its improved safety profile translates into fewer clinical outcomes such as renal failure or fractures.
Single-Tablet Regimen Pros and Cons
The proportion of patients on STRs has significantly increased over the past several years. A recently published report of the Women’s Interagency HIV Study (WIHS), a longitudinal study of HIV infection in U.S. women, has analyzed the use of STR. The study showed that the use of STR among ART users increased from 7% in 2006 to 27% in 2013.47
Advantages of STRs
Potential advantages of STRs include simplicity, convenience, and adherence, especially by eliminating the risk of selective nonadherence to components of the regimens. Observational cohorts and meta-analyses are beginning to confirm these theoretical advantages. A meta-analysis of 19 RCTs including 6,312 patients demonstrated that regimens with lower pill burdens and once-daily dosing were both associated with better adherence, and fewer pills also led to improved virologic suppression.48 In the analysis of the WIHS cohort, STR use was significantly associated with increasedadherence (adjusted risk ratio: 1.05; 95% confidence interval: 1.03 to 1.08) and virologic suppression (risk ratio: 1.06; 95% confidence interval: 1.01 to 1.11).47 Another observational cohort analysis of commercially insured HIV-infected patients showed that patients on STRs were 1.3 times more likely to achieve at least 90% adherence.49
A recent RCT, which assigned 300 patients on stable ART to continue their current regimen or switch to EFV/TDF/FTC as an STR, demonstrated no difference in virologic suppression or patient-reported adherence between the 2 groups.21 However, 91% of patients in this study reported a preference for the STR regimen.50 Single-tablet regimen recipients also have been shown to be less likely to develop treatment-emergent, drug-resistance mutations (DRMs) at the time of virologic failure. In a recently published study, patients receiving the STR EFV/FTC/TDF had a significantly lower risk of DRMs on failure than did those receiving the same components individually in a non-STR regimen.51 Finally, recent data showed that prescription errors in inpatient ART are common and often go undetected, but coformulated regimens were associated with lower error rates.52
Disadvantages of STRs
Although outweighed by the advantages, there are potential disadvantages to the use of STRs. These include the inability to adjust dosages of components of the regimen for drug-drug or drug-food interactions. In particular, patients with preexisting renal impairment (estimated CrCl < 50 mL/min) have limited options and safety data for STRs. Also, STRs do not exist currently for all NRTI-anchor drug pairings. Notably, there is no available 2 NRTI plus boosted PI STR. This limitation may be important in treatment-experienced patients where PI-based regimens may be needed or in patients with comorbidities where a NRTI-sparing regimen would be considered.
Finally, at the population level, the potential benefits of STRs must be balanced with the increased costs compared with that of generic ART regimens with multiple pills. For example, a mathematical simulation model based on 2009 U.S. data suggested that switching all patients in the U.S. from the branded STR EFV/TDF/FTC to a triple regimen of generic EFV, 3TC, and branded TDF would have saved almost $1 billion per year with only a small decrement in virologic efficacy.53 More costeffectiveness analyses are needed, especially for the developing world, to inform strategies for the use of STRs to improve outcomes in the most costeffective way globally.
When to Use STRS?
For initial ART in treatment-naïve patients, 3 of the available STRs are listed as recommended regimens by the HHS guidelines: EVG/c/TDF/FTC, DTG/ABC/3TC, or EVG/c/TAF/FTC.7 In choosing an initial regimen, a number of factors must be considered, including baseline HIV-1 resistance, drug-drug interactions, medical comorbidities, food restrictions, patient preference and convenience, and cost. Patients with drug-resistant HIV-1 or significant renal impairment are less ideal candidates for STRs for initial therapy. Otherwise, the determination typically depends on which of the NRTI backbone drugs, TDF or TAF vs ABC, is most appropriate. Clinicians may favor TDF-containing or TAFcontaining regimens in patients with HBV coinfection, clinically significant CV disease, or patients with the HLA-B*5701 genetic polymorphism.
Conversely, clinicians may favor ABC-containing or TAF-containing regimens in patients at high risk or with preexisting metabolic bone disease or more mild renal impairment. Drug-drug and drug-supplement interactions must be carefully considered in all cases. Although listed as alternative regimens, the other available STRs—EFV/TDF/FTC or RPV/TDF/FTC—may still be the preferred regimen in select individual patients.
In patients already on ART, a switch to a STR may be considered in the following scenarios, with the caveat that most of the clinical trials evaluating switch therapy have been in patients who were virologically suppressed for 6 months on their prior regimens:
- Improve tolerability. In the STRATEGY-NNRTI trial, patients on a stable EFV-containing regimen experienced significant improvements in neuropsychiatric AEs after switching to EVG/c/TDF/FTC.35
- Virologically suppressed patients with multiple comorbidities. Difficulty managing dyslipidemia or high CV risk might necessitate a switch from a PI-containing regimen. From the results of the SPIRIT trial54 and the STRATEGY-PI trial,34 these patients could be switched safely to RPV/TDF/FTC or EVG/c/TDF/FTC, respectively.
- Management of virologic failure. This may be beneficial provided that drug resistance has not compromised the components of the regimen.
Conclusion
The potency and once-daily dosing of EFV-based regimens ushered in the era of STRs. The list of STRs has now expanded with the introduction of an RPV-based STR and, lately, 3 different INSTI-based STRs. In the current HHS guidelines, only the INSTI-based STRs are included in the recommended list, mostly because of poor tolerability of EFV/TDF/FTC and lower efficacy of RPV/TDF/FTC in patients with high baseline viremia. In general, the safety profile of STRs has been improving with newer iterations. Their main advantages are convenience, simplicity and improvements in adherence, and possibly reductions in medication errors. Due to these advantages, the percentage of patients on STRs is likely to continue rising. Further expansions of the ART armamentarium may include the development of boosted PI-based STRs as well as novel delivery strategies, such as long-acting injectable regimens.55 In the meantime, clinicians should develop a greater familiarity with the use of the currently available STRs.
Click here to read the digital edition.
1. Centers for Disease Control and Prevention. Update: trends in AIDS incidence, deaths, and prevalence—United States, 1996. MMWR Morb Mortal Wkly Rep.1997;46(8):165-173.
2. Palella FJ Jr, Delaney KM, Moorman AC, et al; HIV Outpatient Study Investigators. Declining morbidity and mortality among patients with advanced human immunodeficiency virus infection. N Engl J Med. 1998;338(13):853-860.
3. Crum NF, Riffenburgh RH, Wegner S, et al; Triservice AIDS Clinical Consortium. Comparisons of causes of death and mortality rates among HIV-infected persons:analysis of the pre-, early, and late HAART (highly active antiretroviral therapy) eras. J Acquir Immune Defic Syndr. 2006;41(2):194-200.
4. Bor J, Herbst AJ, Newell M-L, Bärnighausen T. Increases in adult life expectancy in rural South Africa: valuing the scale-up of HIV treatment. Science. 2013;339(6122):961-965.
5. Antiretroviral Therapy Cohort Collaboration. Life expectancy of individuals on combination antiretroviral therapy in high-income countries: a collaborative analysis of 14 cohort studies. Lancet. 2008;372(9635):293-299.
6. Cohen MS, Chen YQ, McCauley M, et al; the HPTN 052 Study Team. Prevention of HIV-1 infection with early antiretroviral therapy. N Engl J Med. 2011;365(6):493-505.
7. DHHS Panel on Antiretroviral Guidelines for Adults and Adolescents. Guidelines for the use of antiretroviral agents in HIV-1 infected adults and adolescents. AIDSinfo Website. https://aidsinfo.nih.gov/contentfiles/lvguidelines/adultandadolescentgl.pdf. Updated January 28, 2016. Accessed March 10, 2016.
8. Gulick RM, Ribaudo HJ, Shikuma CM, et al; AIDS Clinical Trials Group (ACTG) A5095 Study Team. Three- vs four-drug antiretroviral regimens for the initial treatment of HIV-1 infection: a randomized controlled trial. JAMA. 2006;296(7):769-781.
9. Orkin C, Stebbing J, Nelson M, et al. A randomized study comparing a three- and four-drug HAART regimen in first-line therapy (QUAD study). J Antimicrob Chemother. 2005;55(2):246-251.
10. Gandhi RT, Bosch RJ, Aga E, et al; AIDS Clinical Trials Group A5173 Team. No evidence for decay of the latent reservoir in HIV-1-infected patients receiving intensive enfuvirtide containing antiretroviral therapy. J Infect Dis. 2010;201(2): 293-296.
11. Chéret A, Nembot G, Mélard A, et al; OPTIPRIM ANRS Study Group. Intensive five-drug antiretroviral therapy regimen versus standard triple-drug therapy during primary HIV-1 infection (OPTIPRIM-ANRS 147): a randomised, open-label, phase 3 trial. Lancet Infect Dis. 2015;15(4):387-396.
12. Cahn P, Andrade-Villanueva J, Arribas JR, et al; GARDEL Study Group. Dual therapy with lopinavir and ritonavir plus lamivudine versus triple therapy with lopinavir and ritonavir plus two nucleoside reverse transcriptase inhibitors in antiretroviral-therapy-naive adults with HIV-1 infection: 48 week results of the randomised, open label, non-inferiority GARDEL trial. Lancet Infect Dis. 2014;14(7):572-580.
13. Raffi F, Babiker AG, Richert L, et al; for the NEAT001/ANRS143 Study Group. Ritonavir-boosted darunavir combined with raltegravir or tenofoviremtricitabine in antiretroviral-naive adults infected with HIV-1: 96 week results from the NEAT001/ANRS143 randomised non-inferiority trial. Lancet. 2014;384(9958):1942-1951.
14. Taiwo B, Zheng L, Gallien S, et al; ACTG A5262 Team. Efficacy of a nucleosidesparing regimen of darunavir/ritonavir plus raltegravir in treatment-naive HIV-1-infected patients (ACTG A5262). AIDS. 2011;25(17):2113-2122.
15. Bedimo RJ, Drechsler H, Jain M, et al. The RADAR study: week 48 safety and efficacy of RAltegravir combined with boosted DARunavir compared to tenofovir/emtricitabine combined with boosted darunavir in antiretroviral-naive patients. Impact on bone health. PLoS One. 2014;9(8):e106221.
16. Stellbrink HJ, Pulik P, Szlavik J, et al. Maraviroc (MVC) dosed once daily with darunavir/ritonavir (DRV/r) in a 2 drug-regimen compared to emtricitabine/tenofovir (TDF/FTC) with DRV/r; 48-week results from MODERN (Study A4001095) (Abstract). AIDS 2014 Website. http://pag.aids2014.org/Abstracts.aspx?SID=1139&AID=6180. Accessed March 11, 2016.
17. Gulick RM, Ribaudo HJ, Shikuma CM, et al; AIDS Clinical Trials Group Study A5095 Team. Triple-nucleoside regimens versus efavirenz-containing regimens for the initial treatment of HIV-1 infection. N Engl J Med. 2004;350(18):1850-1861.
18. Sax PE, DeJesus E, Mills A; GS-US-236-0102 study team. Co-formulated elvitegravir, cobicistat, emtricitabine, and tenofovir versus co-formulated efavirenz, emtricitabine, and tenofovir for initial treatment of HIV-1 infection: a randomised, double-blind, phase 3 trial, analysis of results after 48 weeks. Lancet. 2012;379(9835):2439-2448.
19. Gallant JE, DeJesus E, Arribas JR, et al; Study 934 Group. Tenofovir DF, emtricitabine, and efavirenz vs. zidovudine, lamivudine, and efavirenz for HIV. N Engl J Med. 2006;354(3):251-260.
20. Arribas JR, Pozniak AL, Gallant JE, et al. Tenofovir disoproxil fumarate, emtricitabine, and efavirenz compared with zidovudine/lamivudine and efavirenz in treatment-naive patients: 144-week analysis. J Acquir Immune Defic Syndr. 2008;47(1):74-78.
21. Dejesus E, Young B, Morales-Ramirez JO, et al; AI266073 Study Group. Simplification of antiretroviral therapy to a single-tablet regimen consisting of efavirenz, emtricitabine, and tenofovir disoproxil fumarate versus unmodified antiretroviral therapy in virologically suppressed HIV-1-infected patients. J Acquir Immune Defic Syndr. 2009;51(2):163-174.
22. Daar ES, Tierney C, Fischl MA, et al; AIDS Clinical Trials Group Study A5202 Team. Atazanavir plus ritonavir or efavirenz as part of a 3-drug regimen for initial treatment of HIV-1. Ann Intern Med. 2011;154(7):445-456.
23. Cohen CJ, Molina JM, Cassetti I, et al; ECHO, THRIVE study groups. Week 96 efficacy and safety of rilpivirine in treatment-naive, HIV-1 patients in two Phase III randomized trials. AIDS. 2013;27(6):939-950.
24. Walmsley SL, Antela A, Clumeck N, et al; SINGLE Investigators. Dolutegravir plus abacavir-lamivudine for the treatment of HIV-1 infection. N Engl J Med. 2013;369(19):1807-1818.
25. Rockstroh JK, DeJesus E, Lennox JL, et al; STARTMRK Investigators. Durable efficacy and safety of raltegravir versus efavirenz when combined with tenofovir/emtricitabine in treatment-naive HIV-1-infected patients: final 5-year results from STARTMRK. J Acquir Immune Defic Syndr. 2013;63(1):77-85.
26. Mollan KR, Smurzynski M, Eron JJ, et al. Association between efavirenz as initial therapy for HIV-1 infection and increased risk for suicidal ideation or attempted or completed suicide: an analysis of trial data. Ann Intern Med. 2014;161(1):1-10.
27. Fundarò C, Genovese O, Rendeli C, Tamburrini E, Salvaggio E. Myelomeningocele in a child with intrauterine exposure to efavirenz. AIDS. 2002;16(2):299-300.
28. Complera [package insert]. Foster City, CA: Gilead Sciences, Inc; 2016.
29. Cohen C, Wohl D, Arribas JR, et al. Week 48 results from a randomized clinical trial of rilpivirine/emtricitabine/tenofovir disoproxil fumarate vs. efavirenz/emtricitabine/tenofovir disoproxil fumarate in treatment-naive HIV-1-infected adults. AIDS. 2014;28(7):989-997.
30. Mills AM, Cohen C, DeJesus E, et al. Efficacy and safety 48 weeks after switching from efavirenz to rilpivirine using emtricitabine/tenofovir disoproxil fumaratebased single-tablet regimens. HIV Clin Trials. 2013;14(5):216-223.
31. Stribild [package insert]. Foster City, CA: Gilead Sciences, Inc; 2015.
32. Wohl DA, Cohen C, Gallant JE, et al; GS-US-236-0102 Study Team. A randomized, double-blind comparison of single-tablet regimen elvitegravir/cobicistat/emtricitabin/tenofovir DF versus single-tablet regimen efavirenz/emtricitabine/tenofovir DF for initial treatment of HIV-1 infection: analysis of week 144 results. J Acquir Immune Defic Syndr. 2014;65(3):e118-e120.
33. DeJesus E, Rockstroh JK, Henry K, et al; GS-236-0103 Study Team. Co-formulated elvitegravir, cobicistat, emtricitabine, and tenofovir disoproxil fumarate versus ritonavir-boosted atazanavir plus co-formulated emtricitabine and tenofovir disoproxil fumarate for initial treatment of HIV-1 infection: a randomised, doubleblind, phase 3, non-inferiority trial. Lancet. 2012;379(9835):2429-2438.
34. Arribas JR, Pialoux G, Gathe J, et al. Simplification to coformulated elvitegravir, cobicistat, emtricitabine, and tenofovir versus continuation of ritonavir-boosted protease inhibitor with emtricitabine and tenofovir in adults with virologically suppressed HIV (STRATEGY-PI): 48 week results of a randomised, open-label, phase 3b, non-inferiority trial. Lancet Infect Dis.
2014;14(7):581-589.
35. Pozniak A, Markowitz M, Mills A, et al. Switching to coformulated elvitegravir, cobicistat, emtricitabine, and tenofovir versus continuation of non-nucleoside reverse transcriptase inhibitor with emtricitabine and tenofovir in virologically suppressed adults with HIV (STRATEGY-NNRTI): 48 week results of a randomised, open-label, phase 3b non-inferiority trial. Lancet Infect Dis. 2014;14(7):590-599.
36. Triumeq [package insert]. Basingstoke, UK: ViiV Healthcare; 2014.
37. Mallal S, Phillips E, Carosi G, et al. HLA-B*5701 screening for hypersensitivity to abacavir. N Engl J Med. 2008;358(6):568-579.
38. Raffi F, Rachlis A, Stellbrink HJ, et al. Once-daily dolutegravir versus raltegravir in antiretroviral-naive adults with HIV-1 infection: 48 week results from the randomised, double-blind, non-inferiority SPRING-2 study. Lancet. 2013;381(9868):735-743.
39. Clotet B, Feinberg J, van Lunzen J, et al; ING114915 Study Team. Once-daily dolutegravir versus darunavir plus ritonavir in antiretroviral-naive adults with HIV-1 infection (FLAMINGO): 48 week results from the randomised open-label phase p3b study. Lancet. 2014;383(9936):2222-2231.
40. Strategies for Management of Anti-Retroviral Therapy/INSIGHT; DAD Study Groups. Use of nucleoside reverse transcriptase inhibitors and risk of myocardial infarction in HIV-infected patients. AIDS. 2008;22(14):F17-F24.
41. Bedimo RJ, Westfall AO, Drechsler H, Vidiella G, Tebas P. Abacavir use and risk of acute myocardial infarction and cerebrovascular events in the highly active antiretroviral therapy era. Clin Infect Dis. 2011;53(1):84-91.
42. Ding X, Andraca-Carrera E, Cooper C, et al. No association of abacavir use with myocardial infarction: findings of an FDA meta-analysis. J Acquir Immune Defic Syndr. 2012;61(4):441-447.
43. Desai M, Joyce V, Bendavid E, et al. Risk of cardiovascular events associated with
current exposure to HIV antiretroviral therapies in a US veteran population. Clin
Infect Dis. 2015;61(3):445-452.
44. Genvoya [package insert]. Foster City, CA: Gilead Sciences, Inc; 2015.
45. Sax PE, Wohl D, Yin MT, et al. Tenofovir alafenamide versus tenofovir disoproxil fumarate, coformulated with elvitegravir, cobicistat, and emtricitabine, for initial treatment of HIV-1 infection: two randomised, double-blind, phase 3, non-inferiority trials. Lancet. 2015;385(9987):2606-2615.
46. Mills A, Arribas JR, Andrade-Villanueva J, et al. Switching from tenofovir disoproxil fumarate to tenofovir alafenamide in antiretroviral regimens for virologically suppressed adults with HIV-1 infection: a randomised, active-controlled, multicentre, open-label, phase 3, non-inferiority study. Lancet Infect Dis. 2016;16(1):43-52.
47. Hanna DB, Hessol NA, Golub ET, et al. Increase in single-tablet regimen use and associated improvements in adherence-related outcomes in HIV-infected women. J Acquir Immune Defic Syndr. 2014;65(5):587-596.
48. Nachega JB, Parienti JJ, Uthman OA, et al. Lower pill burden and once-daily antiretroviral
treatment regimens for HIV infection: a meta-analysis of randomized controlled trials. Clin Infect Dis. 2014;58(9):1297-1307.
49. Cooke CE, Lee HY, Xing S. Adherence to antiretroviral therapy in managed care members in the United States: a retrospective claims analysis. J Manag Care Pharm. 2014;20(1):86-92.
50. Hodder SL, Mounzer K, DeJesus E, et al; AI266073 Study Group. Patient-reported outcomes in virologically suppressed, HIV-1-iInfected subjects after switching to a simplified, single-tablet regimen of efavirenz, emtricitabine, and tenofovir DF. AIDS Patient Care STDS. 2010;24(2):87-96.
51. Blanco JL, Montaner JS, Marconi VC, et al. Lower prevalence of drug resistance mutations at first-line virological failure to first-line therapy with atripla vs. tenofovir + emtricitabine/lamivudine + efavirenz administered on a multiple tablet therapy. AIDS. 2014;28(17):2531-2539.
52. Commers T, Swindells S, Sayles H, Gross AE, Devetten M, Sandkovsky U. Antiretroviral medication prescribing errors are common with hospitalization of HIV infected patients. J Antimicrob Chemother. 2014;69(1):262-267.
53. Walensky RP, Sax PE, Nakamura YM, et al. Economic savings versus health losses: the cost-effectiveness of generic antiretroviral therapy in the United States.
Ann Intern Med. 2013;158(2):84-92.
54. Palella FJ Jr, Fisher M, Tebas P, et al. Simplification to rilpivirine/emtricitabine/ tenofovir disoproxil fumarate from ritonavir-boosted protease inhibitor antiretroviral therapy in a randomized trial of HIV-1 RNA-suppressed participants. AIDS. 2014;28(3):335-344.
55. Gulick R. HIV treatment 2020: what will it look like? J Int AIDS Soc. 2014;17(4)(suppl 3):19528.
Hepatitis B: Screening, Awareness, and the Need to Treat
Globally, chronic hepatitis B virus (HBV) infection is the leading cause of liver-related morbidity and mortality. Worldwide, more than 2 billion people have been exposed to HBV, and about 250 million are chronically infected.1
The prevalence of hepatitis B surface antigen (HBsAg), the serologic marker of chronicity, varies significantly worldwide. The highest rates of HBsAg are reported in Asia, Sub-Saharan Africa, and the Amazon basin. The overall prevalence of chronic HBV infection in the U.S. is low, 800,000 to 1.4 million persons. The disease is predominantly seen in immigrants, with > 90% of cases in persons from countries of intermediate or high HBV prevalence, such as East Asia, Africa, Pacific Islands, parts of Africa, and Eastern Europe.2
The prevalence of chronic HBV infection in the U.S. may be underestimated and closer to 2.2 million persons, because many foreign-born persons are generally excluded from national prevalence surveys.3 More worrisome, studies suggest that a majority of individuals with chronic HBV infection are unaware of their diagnosis, and consequently, many patients who might benefit from therapy do not receive appropriate care or treatment.4 This review will discuss screening recommendations for HBV in the U.S., identify knowledge gaps regarding the disease, and present a cogent argument for why treatment-eligible patients should be entered into management programs and evaluated for therapy.
Hepatitis B Screening
Chronic hepatitis B meets the criteria established by the World Health Organization as a disease for which screening would be beneficial to public health. Chronic HBV infection is an important health problem that can result in serious sequelae, such as cirrhosis, hepatocellular carcinoma, and liver-related mortality. Moreover, persons unaware of their diagnosis may unwittingly transmit the virus to unprotected individuals.
A simple, relatively inexpensive test is widely available to identify chronic HBV infection. The test allows physicians to confirm a diagnosis before symptoms develop and offer a safe and effective therapy. Modeling studies suggest that screening populations with a prevalence of chronic HBV infection ≥ 2% also would be cost-effective in reducing the burden of HBV-associated liver cancer and chronic liver disease in high-risk populations.5,6 However, a number of barriers exist that limit screening (Table 1).
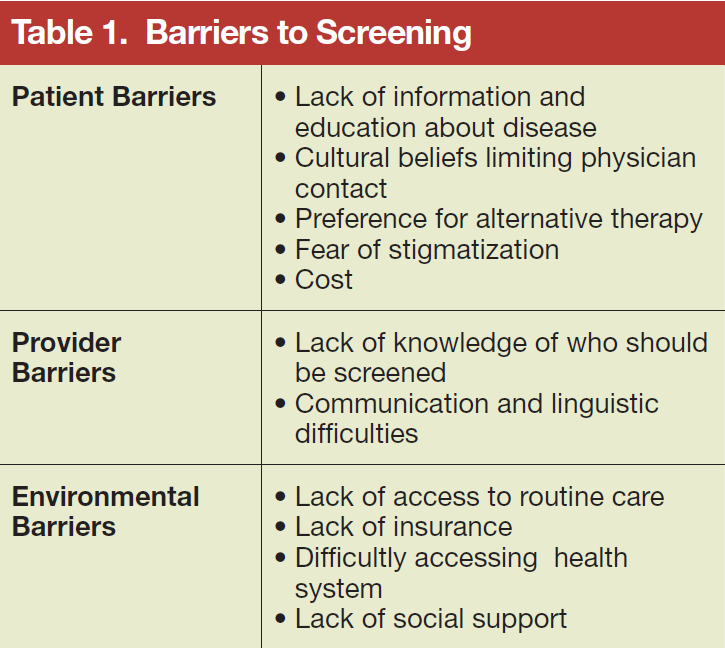
Who to Screen?
All guidelines recommend that persons at high risk for HBV infection should be screened. Broadly, these include persons from geographic areas with a high prevalence of chronic infection, persons at high risk for acquiring HBV infection, persons with increased risk of transmitting HBV, and persons at risk for reactivation of HBV. In addition to previous recommendations, the Centers for Disease Control and Prevention (CDC) updated 2008 guidelines now recommend testing all persons born in geographic areas with a HBsAg prevalence of ≥ 2%, U.S.-born persons not vaccinated as infants whose parents were born in regions with HBsAg prevalence ≥ 8%, persons who inject drugs, men who have sex with men, persons with elevated alanine transaminase and aspartate transaminase of unknown etiology, and persons with selected medical conditions that require immunosuppressive therapy (Table 2).7 In 2014, the U.S. Preventive Services Task Force provided updated guidance on screening of nonpregnant adolescents and adults that aligned with the CDC guidelines and also recommended screening individuals at high risk for HBV infection.8 The American Association for the Study of Liver Diseases and other professional liver organizations support these recommendations.9
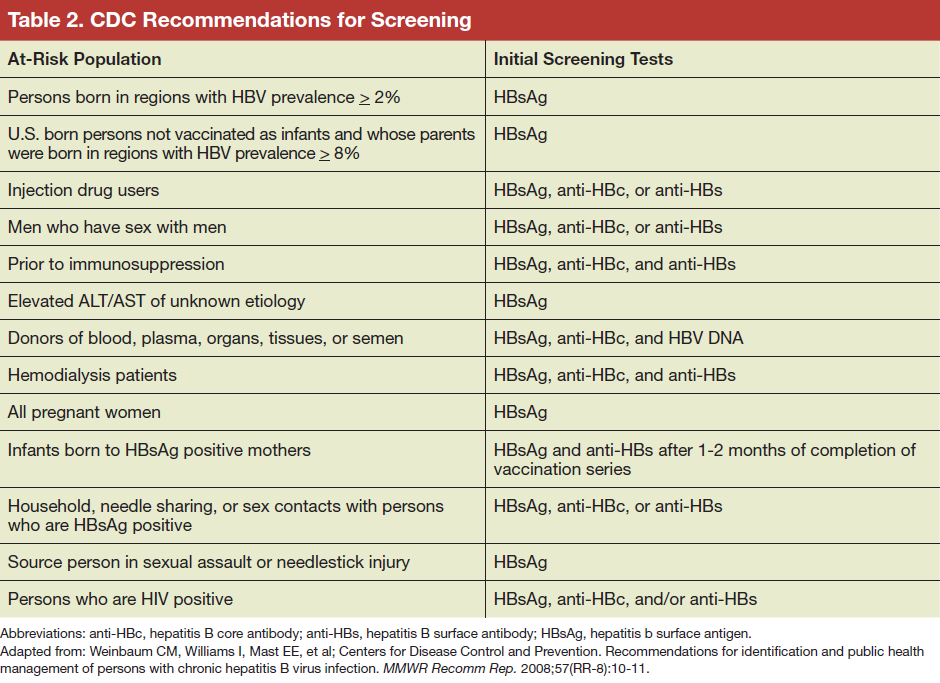
Which Test to Use
Serologic testing for HBsAg is the recommended method to identify persons with chronic HBV infection. Testing for HBV infection in high-risk groups should be performed with a FDA-licensed or FDA-approved serologic assay for HBsAg (sensitivity and specificity of > 98%) according to the manufacturer’s recommendations. Initially, reactive specimens should be confirmed with a licensed confirmatory test.
A positive HBsAg result indicates active infection, either acute or chronic. Other serological markers of HBV infection, such as presence of hepatitis B core IgM antibody, and the clinical context are used to differentiate between acute, chronic, or resolving infection. For identification of individuals who are at risk for chronic infection, the screening strategy should be with HBsAg only. For identifying susceptible persons who should be offered HBV vaccination, or patients that are at risk of reactivation or transmission of HBV, screening should include
testing for HBsAg, hepatitis B core antibody (anti-HBc) and hepatitis B surface antibody (anti-HBs).
The interpretation of HBV screening serology is shown in Table 3. Persons with chronic HBV infection are treated, if needed, per practice guidelines based on the initial test results and interpretation of the stage of the disease and counseled regarding transmission of infection. 9,10 Vaccination is recommended for uninfected persons.
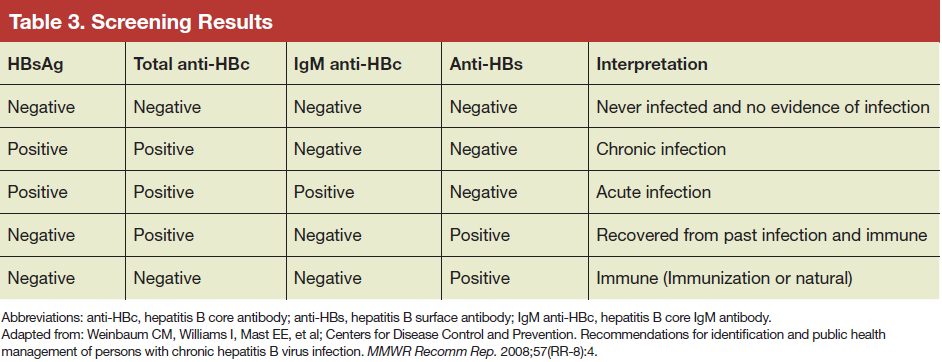
Hepatitis B Education
There is relatively poor awareness of HBV among highrisk individuals and health care professionals (HCPs). A study examining the prevalence of chronic hepatitis B in an Asian and Pacific Islander population reported that about 15% of participants had not been previously tested for hepatitis B.11 Another study that surveyed 3,163 Asian American adults in the San Francisco Bay Area found that of those screened and identified with chronic HBV infection (8.9%), two-thirds were unaware that they were infected.12
Primary care providers in San Francisco correctly identified that Chinese immigrants have a higher prevalence of chronic hepatitis B than that of non-Hispanic white or U.S.-born Chinese people, but the providers incorrectly identified persons with HIV infection, men who have sex with men, and persons who inject drugs as having higher prevalence than that of Chinese immigrants in a survey.13 Lack of awareness probably contributes to poor outcomes from the infection among at-risk persons as well as continued transmission to susceptible individuals. Furthermore, lack of knowledge is a barrier to testing, prevention, and care. Increased awareness to identify the at-risk population and early treatment is an important step to prevent morbidity and mortality from chronic hepatitis B.
Public Awareness
Many at-risk populations are unaware of HBV, its possible routes of transmission, or that a safe and effective vaccine exists for HBV prevention. Moreover, many foreign-born persons with chronic HBV infection feel stigmatized by others or have cultural barriers against Western medicine and prefer alternative therapies. As a result, the Institute of Medicine (IOM) has suggested that innovative approaches need to be developed to promote a better understanding of transmission, prevent and treat HBV, increase HBV vaccination rates among children and at-risk adults, educate women about vertical transmission risk, reduce stigmatization, and provide culturally sensitive and understandable educational material.14
Awareness Among Health Care Professionals
Studies have identified knowledge gaps among HCPs regarding the prevalence of HBV in the general U.S. population, outcome of infection, who should be screened and vaccinated against HBV, appropriate methods for screening and interpretation of serologic tests for HBV, and proper treatment of persons with chronic infection. As a consequence, the IOM recommended educational programs for HCPs on the prevalence of HBV infection in the general U.S. population and at-risk populations, particularly foreign-born persons. In addition, these educational programs should target all levels of HCPs, including undergraduates and postgraduates, and include information on screening and prevention, testing, and interpretation of tests.14
Need to Treat
The global HBV disease burden remains high despite the existence of an effective vaccine. Worldwide, there are an estimated 4.5 million new infections and 780,000 HBVrelated deaths each year.15 In the U.S., the highest rates of mortality are seen in Asians and Pacific Islanders and among persons aged 55 to 64 years. Asians and Pacific Islanders also have the highest rate of liver cancer deaths.16,17
The natural history of chronic hepatitis B is highly variable and dependent on a complex interplay between the virus and the host immune response. It is estimated that between 25% and 40% of persons with chronic hepatitis B will be at risk for progression to cirrhosis.7,18,19 In a study among persons with cirrhosis, the 5-year cumulative risk of developing hepatocellular carcinoma was 17% in Asian patients and 10% in white Americans and Europeans. The 5-year liver-related death rate was 14% among East Asians and 15% among white Europeans.18
A significant proportion of individuals infected with HBV are unaware of their diagnosis, not enrolled in care, or not receiving therapy.7,12,20-24 Data from several prospective and retrospective cohort studies have demonstrated that prolonged viral suppression achieved with therapy is associated with regression of fibrosis and reversal of cirrhosis in a substantial proportion of individuals.25,26 Treatment has also been associated with a reduction in rates of liver decompensation, HCC, liverrelated, and all-cause mortality among patients with liver cirrhosis.27
Given the risk of serious complications and the availability of safe and effective therapy, it is imperative that persons identified as having chronic hepatitis B be referred for evaluation to determine whether therapy is warranted. However, it is also important to recognize that a cure for HBV infection is currently not available, and most patients who initiate therapy will require longterm treatment. In addition, persons who are not currently treatment candidates may become candidates due to changes in disease activity. This underscores the point that patients with chronic hepatitis B require lifelong monitoring regardless of whether they are receiving treatment.
Conclusions
The primary reasons to screen for HBV are to reduce morbidity and mortality related to liver disease and to prevent transmission. Significant barriers remain to screening and referral for care for HBV in the U.S. Educational programs to increase knowledge and awareness among HCPs and the public together with improved access to care are critical to improve disease outcomes and prevent transmission. Despite the availability of an effective vaccine for 3 decades, the global prevalence of HBV has not substantially declined. Further research is needed to explore strategies to overcome screening barriers, improve vaccination rates, and to develop new models of health care delivery to reduce the burden of disease-related to HBV.
Click here to read the digital edition.
1. Schweitzer A, Horn J, Mikolajczyk RT, Krause G, Ott JJ. Estimations of worldwide prevalence of chronic hepatitis B virus infection: a systematic review of data published between 1965 and 2013. Lancet. 2015;386(10003):1546-1555.
2. Mitchell T, Armstrong GL, Hu DJ, Wasley A, Painter JA. The increasing burden of imported chronic hepatitis B--United States, 1974-2008. PLoS One. 2011;6(12):e27717.
3. Kowdley KV, Wang CC, Welch S, Roberts H, Brosgart CL. Prevalence of chronic hepatitis B among foreign-born persons living in the United States by country of origin. Hepatology. 2012;56(2):422-433.
4. Cohen C, Holmberg SD, McMahon BJ, et al. Is chronic hepatitis B being undertreated in the United States? J Viral Hepat. 2011;18(6):377-383.
5. Hutton DW, Tan D, So SK, Brandeau ML. Cost-effectiveness of screening and vaccinating Asian and Pacific Islander adults for hepatitis B. Ann Intern Med. 2007;147(7):460-469.
6. Eckman MH, Kaiser TE, Sherman KE. The cost-effectiveness of screening for chronic hepatitis B infection in the United States. Clin Infect Dis. 2011;52(11):1294-1306.
7. Weinbaum CM, Williams I, Mast EE, et al; Centers for Disease Control and Prevention (CDC). Recommendations for identification and public health management of persons with chronic hepatitis B virus infection. MMWR Recomm Rep. 2008;57(RR-8):1-20.
8. LeFevre ML; U.S. Preventive Services Task Force. Screening for hepatitis B virus infection in nonpregnant adolescents and adults: U.S. Preventive Services Task Force recommendation statement. Ann Intern Med. 2014;161(1):58-66.
9. Lok AS, McMahon BJ. Chronic hepatitis B: update 2009. Hepatology. 2009;50(3):661-662.
10. Terrault NA, Bzowej NH, Chang KM, Hwang JP, Jonas MM, Murad MH. AASLD guidelines for treatment of chronic hepatitis B. Hepatology. 2016;63(1):261-283.
11. Centers for Disease Control and Prevention (CDC). Screening for chronic hepatitis B among Asian/Pacific Islander populations--New York City, 2005. MMWR Morb Mortal Wkly Rep. 2006;55(18):505-509.
12. Lin SY, Chang ET, So SK. Why we should routinely screen Asian American adults for hepatitis B: a cross-sectional study of Asians in California. Hepatology. 2007;46(4):1034-1040.
13. Lai CJ, Nguyen TT, Hwang J, Stewart SL, Kwan A, McPhee SJ. Provider knowledge and practice regarding hepatitis B screening in Chinese-speaking patients. J Cancer Educ. 2007;22(1):37-41.
14. Colvin HM, Mitchell AE, eds; Committee on the Prevention and Control of Viral Hepatitis Infections Board on Population Health and Public Health Practice. Hepatitis and liver cancer: a national strategy for prevention and control of hepatitis B and C. Washington, DC: National Academies Press; 2010:xix, 232.
15. Hepatitis B Fact Sheet No. 204. World Health Organization Website. http://www.who.int/entity/mediacentre/factsheets/fs204/en/. Updated July 2015. Accessed March 17, 2016.
16. Perz JF, Openo K, Ahmed F, Bell BP. P.382 Trends in mortality from liver cancer in the USA, 1993-2002. J Clin Virol. 2006;36(suppl 2):S178.
17. Chang ET, Keegan TH, Gomez SL, et al. The burden of liver cancer in Asians and Pacific Islanders in the Greater San Francisco Bay Area, 1990 through 2004. Cancer. 2007;109(10):2100-2108.
18. Fattovich G1, Bortolotti F, Donato F. Natural history of chronic hepatitis B: special emphasis on disease progression and prognostic factors. J Hepatol. 2008;48(2):335-352.
19. Chou R, Dana T, Bougatsos C, Blazina I, Khangura J, Zakher B. Screening for hepatitis B virus infection in adolescents and adults: a systematic review to update the U.S. Preventive Services Task Force recommendation. Ann Intern Med. 2014;161(1):31-45.
20. Wan KJ, Miyoshi T, Fryer G, et al. Screening for hepatitis B virus infection by primary care physicians in New York City: are screening recommendations for persons born inendemic countries being followed?[abstract 1454]. Hepatology. 2007;46(suppl):889A-890A.
21. Thompson MJ, Taylor VM, Jackson JC, et al. Hepatitis B knowledge and practices among Chinese American women in Seattle, Washington. J Cancer Educ. 2002;17(4):222-226.
22. Ma GX, Fang CY, Shive SE, Toubbeh J, Tan Y, Siu P. Risk perceptions and barriers to hepatitis B screening and vaccination among Vietnamese immigrants. J Immigr Minor Health. 2007;9(3):213-220.
23. Taylor VM, Choe JH, Yasui Y, Li Lin, Burke N, Jackson JC. Hepatitis B awareness, testing, and knowledge among Vietnamese American men and women. J Community Health. 2005;30(6):477-490.
24. Weinbaum CM, Lyerla R, Mackellar DA, et al; Young Men’s Survey Study Group. The young men’s survey phase II: hepatitis B immunization and infection among young men who have sex with men. Am J Public Health. 2008;98(5):839-845.
25. Marcellin P, Gane E, Buti M. Regression of cirrhosis during treatment with tenofovir disoproxil fumarate for chronic hepatitis B: a 5-year open-label follow-up study. Lancet. 2013;381(9865):468-475.
26. Chang TT, Liaw YF, Wu SS. Long-term entecavir therapy results in the reversal of fibrosis/cirrhosis and continued histological improvement in patients with chronic hepatitis B. Hepatology. 2010;52(3):886-893.
27. Wong GL, Chan HL, Mak CW. Entecavir treatment reduces hepatic events and deaths in chronic hepatitis B patients with liver cirrhosis. Hepatology.2013;58(5):1537-1547.
Globally, chronic hepatitis B virus (HBV) infection is the leading cause of liver-related morbidity and mortality. Worldwide, more than 2 billion people have been exposed to HBV, and about 250 million are chronically infected.1
The prevalence of hepatitis B surface antigen (HBsAg), the serologic marker of chronicity, varies significantly worldwide. The highest rates of HBsAg are reported in Asia, Sub-Saharan Africa, and the Amazon basin. The overall prevalence of chronic HBV infection in the U.S. is low, 800,000 to 1.4 million persons. The disease is predominantly seen in immigrants, with > 90% of cases in persons from countries of intermediate or high HBV prevalence, such as East Asia, Africa, Pacific Islands, parts of Africa, and Eastern Europe.2
The prevalence of chronic HBV infection in the U.S. may be underestimated and closer to 2.2 million persons, because many foreign-born persons are generally excluded from national prevalence surveys.3 More worrisome, studies suggest that a majority of individuals with chronic HBV infection are unaware of their diagnosis, and consequently, many patients who might benefit from therapy do not receive appropriate care or treatment.4 This review will discuss screening recommendations for HBV in the U.S., identify knowledge gaps regarding the disease, and present a cogent argument for why treatment-eligible patients should be entered into management programs and evaluated for therapy.
Hepatitis B Screening
Chronic hepatitis B meets the criteria established by the World Health Organization as a disease for which screening would be beneficial to public health. Chronic HBV infection is an important health problem that can result in serious sequelae, such as cirrhosis, hepatocellular carcinoma, and liver-related mortality. Moreover, persons unaware of their diagnosis may unwittingly transmit the virus to unprotected individuals.
A simple, relatively inexpensive test is widely available to identify chronic HBV infection. The test allows physicians to confirm a diagnosis before symptoms develop and offer a safe and effective therapy. Modeling studies suggest that screening populations with a prevalence of chronic HBV infection ≥ 2% also would be cost-effective in reducing the burden of HBV-associated liver cancer and chronic liver disease in high-risk populations.5,6 However, a number of barriers exist that limit screening (Table 1).
Who to Screen?
All guidelines recommend that persons at high risk for HBV infection should be screened. Broadly, these include persons from geographic areas with a high prevalence of chronic infection, persons at high risk for acquiring HBV infection, persons with increased risk of transmitting HBV, and persons at risk for reactivation of HBV. In addition to previous recommendations, the Centers for Disease Control and Prevention (CDC) updated 2008 guidelines now recommend testing all persons born in geographic areas with a HBsAg prevalence of ≥ 2%, U.S.-born persons not vaccinated as infants whose parents were born in regions with HBsAg prevalence ≥ 8%, persons who inject drugs, men who have sex with men, persons with elevated alanine transaminase and aspartate transaminase of unknown etiology, and persons with selected medical conditions that require immunosuppressive therapy (Table 2).7 In 2014, the U.S. Preventive Services Task Force provided updated guidance on screening of nonpregnant adolescents and adults that aligned with the CDC guidelines and also recommended screening individuals at high risk for HBV infection.8 The American Association for the Study of Liver Diseases and other professional liver organizations support these recommendations.9
Which Test to Use
Serologic testing for HBsAg is the recommended method to identify persons with chronic HBV infection. Testing for HBV infection in high-risk groups should be performed with a FDA-licensed or FDA-approved serologic assay for HBsAg (sensitivity and specificity of > 98%) according to the manufacturer’s recommendations. Initially, reactive specimens should be confirmed with a licensed confirmatory test.
A positive HBsAg result indicates active infection, either acute or chronic. Other serological markers of HBV infection, such as presence of hepatitis B core IgM antibody, and the clinical context are used to differentiate between acute, chronic, or resolving infection. For identification of individuals who are at risk for chronic infection, the screening strategy should be with HBsAg only. For identifying susceptible persons who should be offered HBV vaccination, or patients that are at risk of reactivation or transmission of HBV, screening should include
testing for HBsAg, hepatitis B core antibody (anti-HBc) and hepatitis B surface antibody (anti-HBs).
The interpretation of HBV screening serology is shown in Table 3. Persons with chronic HBV infection are treated, if needed, per practice guidelines based on the initial test results and interpretation of the stage of the disease and counseled regarding transmission of infection. 9,10 Vaccination is recommended for uninfected persons.
Hepatitis B Education
There is relatively poor awareness of HBV among highrisk individuals and health care professionals (HCPs). A study examining the prevalence of chronic hepatitis B in an Asian and Pacific Islander population reported that about 15% of participants had not been previously tested for hepatitis B.11 Another study that surveyed 3,163 Asian American adults in the San Francisco Bay Area found that of those screened and identified with chronic HBV infection (8.9%), two-thirds were unaware that they were infected.12
Primary care providers in San Francisco correctly identified that Chinese immigrants have a higher prevalence of chronic hepatitis B than that of non-Hispanic white or U.S.-born Chinese people, but the providers incorrectly identified persons with HIV infection, men who have sex with men, and persons who inject drugs as having higher prevalence than that of Chinese immigrants in a survey.13 Lack of awareness probably contributes to poor outcomes from the infection among at-risk persons as well as continued transmission to susceptible individuals. Furthermore, lack of knowledge is a barrier to testing, prevention, and care. Increased awareness to identify the at-risk population and early treatment is an important step to prevent morbidity and mortality from chronic hepatitis B.
Public Awareness
Many at-risk populations are unaware of HBV, its possible routes of transmission, or that a safe and effective vaccine exists for HBV prevention. Moreover, many foreign-born persons with chronic HBV infection feel stigmatized by others or have cultural barriers against Western medicine and prefer alternative therapies. As a result, the Institute of Medicine (IOM) has suggested that innovative approaches need to be developed to promote a better understanding of transmission, prevent and treat HBV, increase HBV vaccination rates among children and at-risk adults, educate women about vertical transmission risk, reduce stigmatization, and provide culturally sensitive and understandable educational material.14
Awareness Among Health Care Professionals
Studies have identified knowledge gaps among HCPs regarding the prevalence of HBV in the general U.S. population, outcome of infection, who should be screened and vaccinated against HBV, appropriate methods for screening and interpretation of serologic tests for HBV, and proper treatment of persons with chronic infection. As a consequence, the IOM recommended educational programs for HCPs on the prevalence of HBV infection in the general U.S. population and at-risk populations, particularly foreign-born persons. In addition, these educational programs should target all levels of HCPs, including undergraduates and postgraduates, and include information on screening and prevention, testing, and interpretation of tests.14
Need to Treat
The global HBV disease burden remains high despite the existence of an effective vaccine. Worldwide, there are an estimated 4.5 million new infections and 780,000 HBVrelated deaths each year.15 In the U.S., the highest rates of mortality are seen in Asians and Pacific Islanders and among persons aged 55 to 64 years. Asians and Pacific Islanders also have the highest rate of liver cancer deaths.16,17
The natural history of chronic hepatitis B is highly variable and dependent on a complex interplay between the virus and the host immune response. It is estimated that between 25% and 40% of persons with chronic hepatitis B will be at risk for progression to cirrhosis.7,18,19 In a study among persons with cirrhosis, the 5-year cumulative risk of developing hepatocellular carcinoma was 17% in Asian patients and 10% in white Americans and Europeans. The 5-year liver-related death rate was 14% among East Asians and 15% among white Europeans.18
A significant proportion of individuals infected with HBV are unaware of their diagnosis, not enrolled in care, or not receiving therapy.7,12,20-24 Data from several prospective and retrospective cohort studies have demonstrated that prolonged viral suppression achieved with therapy is associated with regression of fibrosis and reversal of cirrhosis in a substantial proportion of individuals.25,26 Treatment has also been associated with a reduction in rates of liver decompensation, HCC, liverrelated, and all-cause mortality among patients with liver cirrhosis.27
Given the risk of serious complications and the availability of safe and effective therapy, it is imperative that persons identified as having chronic hepatitis B be referred for evaluation to determine whether therapy is warranted. However, it is also important to recognize that a cure for HBV infection is currently not available, and most patients who initiate therapy will require longterm treatment. In addition, persons who are not currently treatment candidates may become candidates due to changes in disease activity. This underscores the point that patients with chronic hepatitis B require lifelong monitoring regardless of whether they are receiving treatment.
Conclusions
The primary reasons to screen for HBV are to reduce morbidity and mortality related to liver disease and to prevent transmission. Significant barriers remain to screening and referral for care for HBV in the U.S. Educational programs to increase knowledge and awareness among HCPs and the public together with improved access to care are critical to improve disease outcomes and prevent transmission. Despite the availability of an effective vaccine for 3 decades, the global prevalence of HBV has not substantially declined. Further research is needed to explore strategies to overcome screening barriers, improve vaccination rates, and to develop new models of health care delivery to reduce the burden of disease-related to HBV.
Click here to read the digital edition.
1. Schweitzer A, Horn J, Mikolajczyk RT, Krause G, Ott JJ. Estimations of worldwide prevalence of chronic hepatitis B virus infection: a systematic review of data published between 1965 and 2013. Lancet. 2015;386(10003):1546-1555.
2. Mitchell T, Armstrong GL, Hu DJ, Wasley A, Painter JA. The increasing burden of imported chronic hepatitis B--United States, 1974-2008. PLoS One. 2011;6(12):e27717.
3. Kowdley KV, Wang CC, Welch S, Roberts H, Brosgart CL. Prevalence of chronic hepatitis B among foreign-born persons living in the United States by country of origin. Hepatology. 2012;56(2):422-433.
4. Cohen C, Holmberg SD, McMahon BJ, et al. Is chronic hepatitis B being undertreated in the United States? J Viral Hepat. 2011;18(6):377-383.
5. Hutton DW, Tan D, So SK, Brandeau ML. Cost-effectiveness of screening and vaccinating Asian and Pacific Islander adults for hepatitis B. Ann Intern Med. 2007;147(7):460-469.
6. Eckman MH, Kaiser TE, Sherman KE. The cost-effectiveness of screening for chronic hepatitis B infection in the United States. Clin Infect Dis. 2011;52(11):1294-1306.
7. Weinbaum CM, Williams I, Mast EE, et al; Centers for Disease Control and Prevention (CDC). Recommendations for identification and public health management of persons with chronic hepatitis B virus infection. MMWR Recomm Rep. 2008;57(RR-8):1-20.
8. LeFevre ML; U.S. Preventive Services Task Force. Screening for hepatitis B virus infection in nonpregnant adolescents and adults: U.S. Preventive Services Task Force recommendation statement. Ann Intern Med. 2014;161(1):58-66.
9. Lok AS, McMahon BJ. Chronic hepatitis B: update 2009. Hepatology. 2009;50(3):661-662.
10. Terrault NA, Bzowej NH, Chang KM, Hwang JP, Jonas MM, Murad MH. AASLD guidelines for treatment of chronic hepatitis B. Hepatology. 2016;63(1):261-283.
11. Centers for Disease Control and Prevention (CDC). Screening for chronic hepatitis B among Asian/Pacific Islander populations--New York City, 2005. MMWR Morb Mortal Wkly Rep. 2006;55(18):505-509.
12. Lin SY, Chang ET, So SK. Why we should routinely screen Asian American adults for hepatitis B: a cross-sectional study of Asians in California. Hepatology. 2007;46(4):1034-1040.
13. Lai CJ, Nguyen TT, Hwang J, Stewart SL, Kwan A, McPhee SJ. Provider knowledge and practice regarding hepatitis B screening in Chinese-speaking patients. J Cancer Educ. 2007;22(1):37-41.
14. Colvin HM, Mitchell AE, eds; Committee on the Prevention and Control of Viral Hepatitis Infections Board on Population Health and Public Health Practice. Hepatitis and liver cancer: a national strategy for prevention and control of hepatitis B and C. Washington, DC: National Academies Press; 2010:xix, 232.
15. Hepatitis B Fact Sheet No. 204. World Health Organization Website. http://www.who.int/entity/mediacentre/factsheets/fs204/en/. Updated July 2015. Accessed March 17, 2016.
16. Perz JF, Openo K, Ahmed F, Bell BP. P.382 Trends in mortality from liver cancer in the USA, 1993-2002. J Clin Virol. 2006;36(suppl 2):S178.
17. Chang ET, Keegan TH, Gomez SL, et al. The burden of liver cancer in Asians and Pacific Islanders in the Greater San Francisco Bay Area, 1990 through 2004. Cancer. 2007;109(10):2100-2108.
18. Fattovich G1, Bortolotti F, Donato F. Natural history of chronic hepatitis B: special emphasis on disease progression and prognostic factors. J Hepatol. 2008;48(2):335-352.
19. Chou R, Dana T, Bougatsos C, Blazina I, Khangura J, Zakher B. Screening for hepatitis B virus infection in adolescents and adults: a systematic review to update the U.S. Preventive Services Task Force recommendation. Ann Intern Med. 2014;161(1):31-45.
20. Wan KJ, Miyoshi T, Fryer G, et al. Screening for hepatitis B virus infection by primary care physicians in New York City: are screening recommendations for persons born inendemic countries being followed?[abstract 1454]. Hepatology. 2007;46(suppl):889A-890A.
21. Thompson MJ, Taylor VM, Jackson JC, et al. Hepatitis B knowledge and practices among Chinese American women in Seattle, Washington. J Cancer Educ. 2002;17(4):222-226.
22. Ma GX, Fang CY, Shive SE, Toubbeh J, Tan Y, Siu P. Risk perceptions and barriers to hepatitis B screening and vaccination among Vietnamese immigrants. J Immigr Minor Health. 2007;9(3):213-220.
23. Taylor VM, Choe JH, Yasui Y, Li Lin, Burke N, Jackson JC. Hepatitis B awareness, testing, and knowledge among Vietnamese American men and women. J Community Health. 2005;30(6):477-490.
24. Weinbaum CM, Lyerla R, Mackellar DA, et al; Young Men’s Survey Study Group. The young men’s survey phase II: hepatitis B immunization and infection among young men who have sex with men. Am J Public Health. 2008;98(5):839-845.
25. Marcellin P, Gane E, Buti M. Regression of cirrhosis during treatment with tenofovir disoproxil fumarate for chronic hepatitis B: a 5-year open-label follow-up study. Lancet. 2013;381(9865):468-475.
26. Chang TT, Liaw YF, Wu SS. Long-term entecavir therapy results in the reversal of fibrosis/cirrhosis and continued histological improvement in patients with chronic hepatitis B. Hepatology. 2010;52(3):886-893.
27. Wong GL, Chan HL, Mak CW. Entecavir treatment reduces hepatic events and deaths in chronic hepatitis B patients with liver cirrhosis. Hepatology.2013;58(5):1537-1547.
Willingness to Take Weight Loss Medication Among Obese Primary Care Patients
From Beth Israel Deaconess Medical Center and Harvard Medical School, Boston, MA.
Abstracts
- Objective: To identify patient factors associated with willingness to take daily weight loss medication and weight loss expectations using these medications.
- Methods: A random sample of 331 primary care patients aged 18–65 years with a BMI ≥ 35 kg/m2 were recruited from 4 diverse primary care practices in Boston, MA. We conducted telephone interviews and chart reviews to assess patients’ willingness to take a weight loss medication and their expectations for weight loss. We used sequential logistic regression models to identify demographic, clinical, and quality of life (QOL) factors associated with this willingness.
- Results: Of 331 subjects, 69% were women, 35% were white, 35% were black, and 25% were Hispanic; 249 (75%) of patients were willing to take a daily weight loss medication if recommended by their doctor but required a median weight loss of 15% to 24%; only 17% of patients were willing to take a medication for ≤ 10% weight loss. Men were significantly more willing than women (1.2 [95% CI 1.0–1.4]). Diabetes was the only comorbidity associated with willingness to consider pharmacotherapy (1.2 [1.0–1.3]) but only modestly improved model performance (C-statistic increased from 0.59 to 0.60). In contrast, lower QOL, especially low self-esteem and sex life, were stronger correlates (C-statistic 0.72).
- Conclusion: A majority of obese primary care patients were willing to take a daily weight loss pill; however, most required more than 10% weight loss to consider pharmacotherapy worthwhile. Poor QOL, especially low self-esteem and poor sex life, were stronger correlates than having diabetes.
Key words: obesity; primary care; weight loss medication.
In the United States, obesity continues to be unrelentingly prevalent, affecting more than one-third of adults (34.9%) [1]. This statistic has ominous implications when considering that obesity is a risk factor for numerous chronic diseases, such as coronary heart disease, diabetes, sleep apnea, osteoarthritis, and some types of cancers [2]. Moreover, it is associated with increased risk of all-cause and cardiovascular disease mortality. Promisingly, an initial 5% to 10% weight loss over 6 months has been associated with improvement in LDL, HDL, triglycerides, glucose, hemoglobin A1C, diabetes risk, blood pressure, and medication use [2]. Therefore, although patients may not be able to achieve their ideal body weight or normal BMI, modest weight loss can still have beneficial health effects.
Weight loss medications are effective adjunctive therapies in helping patients lose up to 10% of their body weight on average when combined with diet and exercise [3–5]. There are currently 5 medications approved by the Food and Drug Administration for long-term use for weight loss: orlistat, lorcaserin, phentermine-topiramate, bupropion-naltrexone, and liraglutide. Despite their proven efficacy, there are barriers to initiating a long-term weight loss medication. Insurance reimbursement is limited for these medications, thus resulting in high out-of-pocket cost for patients that they may be unable or unwilling to pay [6]. There may also be safety concerns given that several weight loss medications, including fenfluramine, sibutramine, and rimonabant, have been withdrawn from the market because of adverse effects [7]. Thus, in deciding whether to initiate a pharmacologic weight loss regimen, patients must believe that the weight loss benefits will exceed the potential risks.
Little is known, however, about patients’ willingness to take weight loss medications or the minimum weight loss they expect to lose to make pharmacotherapy worthwhile. Only a few studies have investigated patient willingness to adopt pharmacotherapy as part of a weight loss regimen, and only one investigated obese patients in the United States [8]. In this context, we surveyed a sociodemographically diverse group of primary care patients with moderate to severe obesity to examine patient characteristics associated with willingness to pursue weight loss pharmacotherapy. We also aimed to evaluate how much weight patients expected to lose in order to make taking a daily medication worth the effort. Characterizing patients seen in primary care who are willing to adopt pharmacotherapy to lose weight may guide weight loss counseling in the primary care setting. Furthermore, determining whether patients have realistic weight loss expectations can help clinicians better counsel their patients on weight loss goals.
Methods
Study Sample
We recruited 337 subjects from 4 diverse primary care practices in Boston, Massachusetts: a large hospital-based academic practice, a community practice in a working-class suburb, a community practice in an affluent suburb, and a health center serving a predominantly socially disadvantaged population. The primary goal of the parent study was to understand the preferences of patients for weight loss treatment, especially bariatric surgery. Therefore, to be included, patients needed to have a BMI ≥ 35 kg/m2 at the time of recruitment, been seen in clinic within the past year, be aged 18–65 years, and be English or Spanish speaking. By design, African-American and Hispanic patients were oversampled from an electronic list of potentially eligible patient groups so that we could examine for racial differences in treatment preferences. Study details have been previously described [9].
Data Collection and Measures
Trained interviewers conducted a 45- to 60-minute telephone interview with each participant in either English or Spanish. To assess willingness to use a daily weight loss medication, subjects were asked, “If your doctor recommended it, would you be willing to take a pill or medication every day in order to lose weight?” Those who answered affirmatively were then asked the minimum amount of weight they would have to lose to make taking a pill everyday worthwhile.
Subjects were also asked about demographic information (age, race, education, marital status) and comorbid health conditions commonly associated with obesity (diabetes mellitus, hypertension, asthma, obstructive sleep apnea, GERD, depression, anxiety, back pain, and cardiovascular problems). We assessed quality of life (QOL) using the Impact of Weight on Quality of Life-Lite (IWQOL-Lite), a 31-item instrument designed specifically to assess the impact of obesity on QOL capturing 5 domains (physical function, self-esteem, sexual life, public distress, and work). Subjects were asked to rate a series of statements beginning with “Because of my weight…” as “always true,” “usually true,” “sometimes true,” “rarely true,” or “never true.” Global and domain scores ranged from 0 to 100; higher scores reflected better QOL [10].
Data Analysis
We used descriptive statistics to characterize the proportion of subjects willing to use a daily weight loss medication and the weight loss required for patients to be willing to consider pharmacotherapy. We used a stepwise logistic model to examine demographic, QOL, and clinical factors associated with the willingness to take a weight loss medication as the outcome, with an entry criteria of P value of 0.1 and an exit criteria of 0.05. Log-Poisson distribution using the sandwich estimator was used to obtain relative risks for each significant variable. Adjusted models included age, BMI, sex, and race and any significant comorbidities. We added overall QOL score and individual QOL scores in subsequent models to examine the relative influence of overall vs. domain-specific QOL. Statistical analyses were conducted with SAS (SAS Institute, Cary, NC). We considered the change in model C-statistic when specific variables were added to the model to determine the importance of these factors in contributing to patients’ willingness to consider pharmacotherapy; larger changes in model C-statistic signifies a greater contribution.
Results
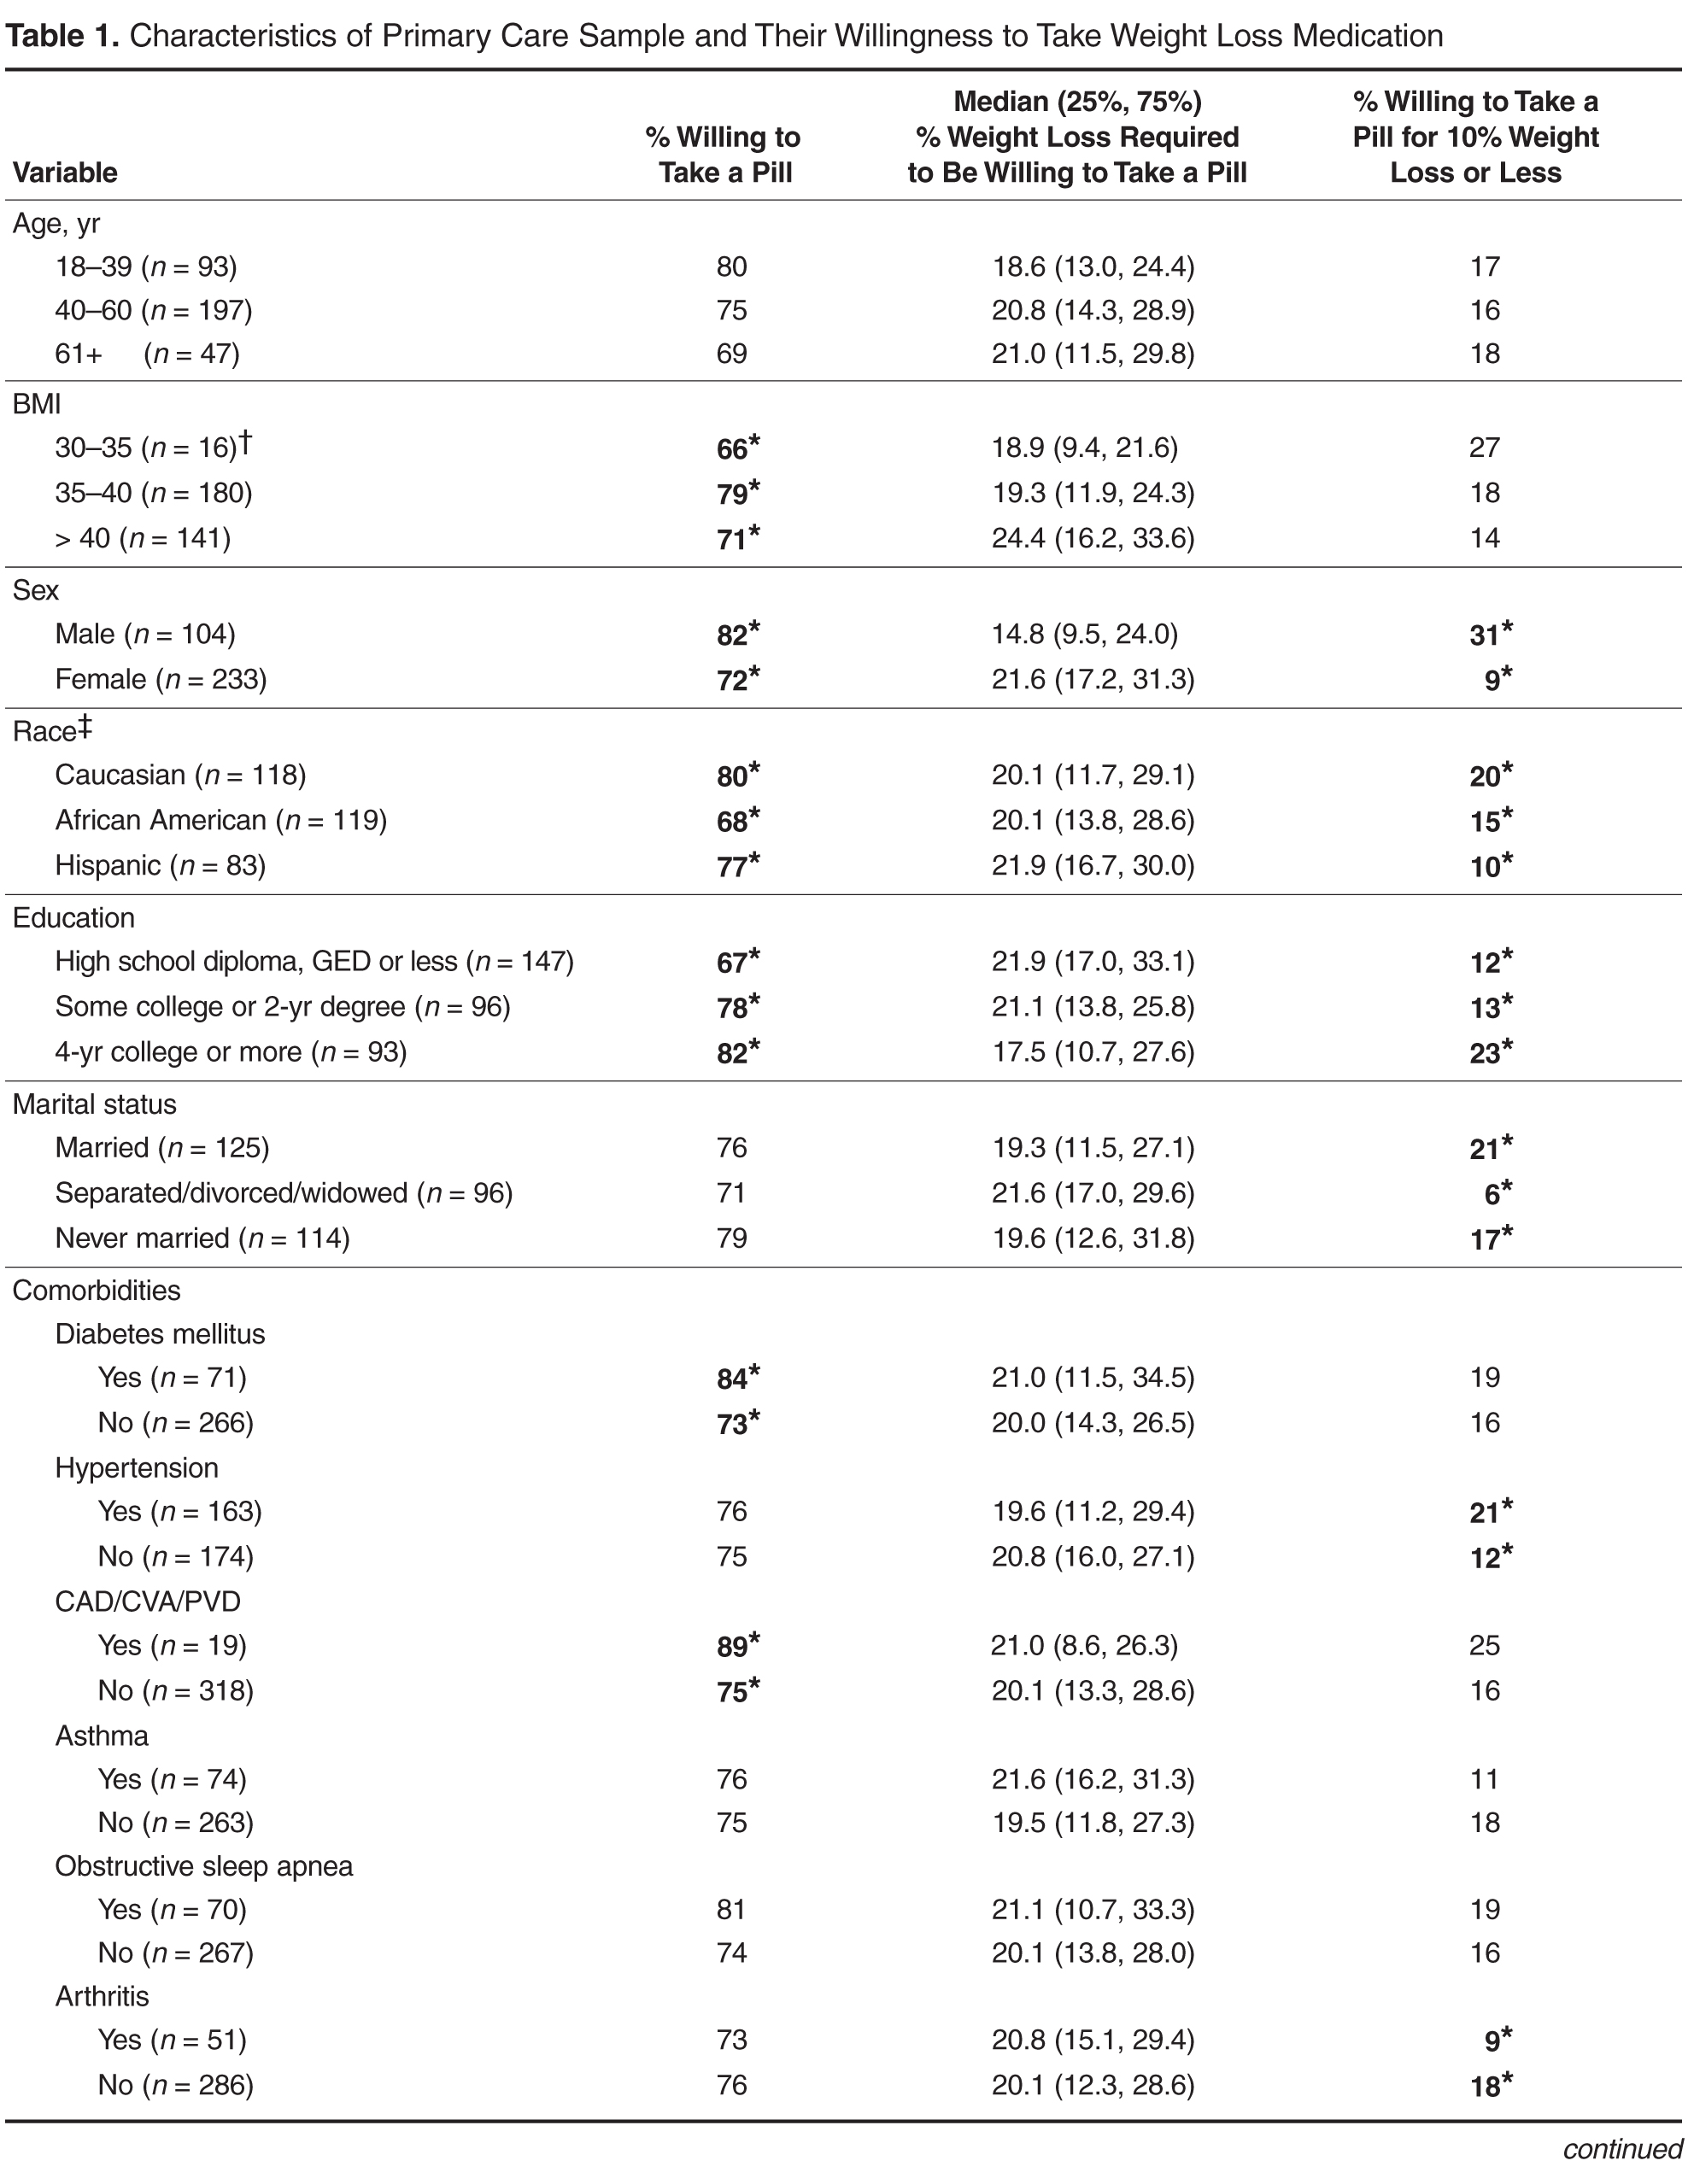
Table 2 displays sequentially adjusted models examining various demographic, clinical, and QOL factors associated with willingness to take a weight loss medication. 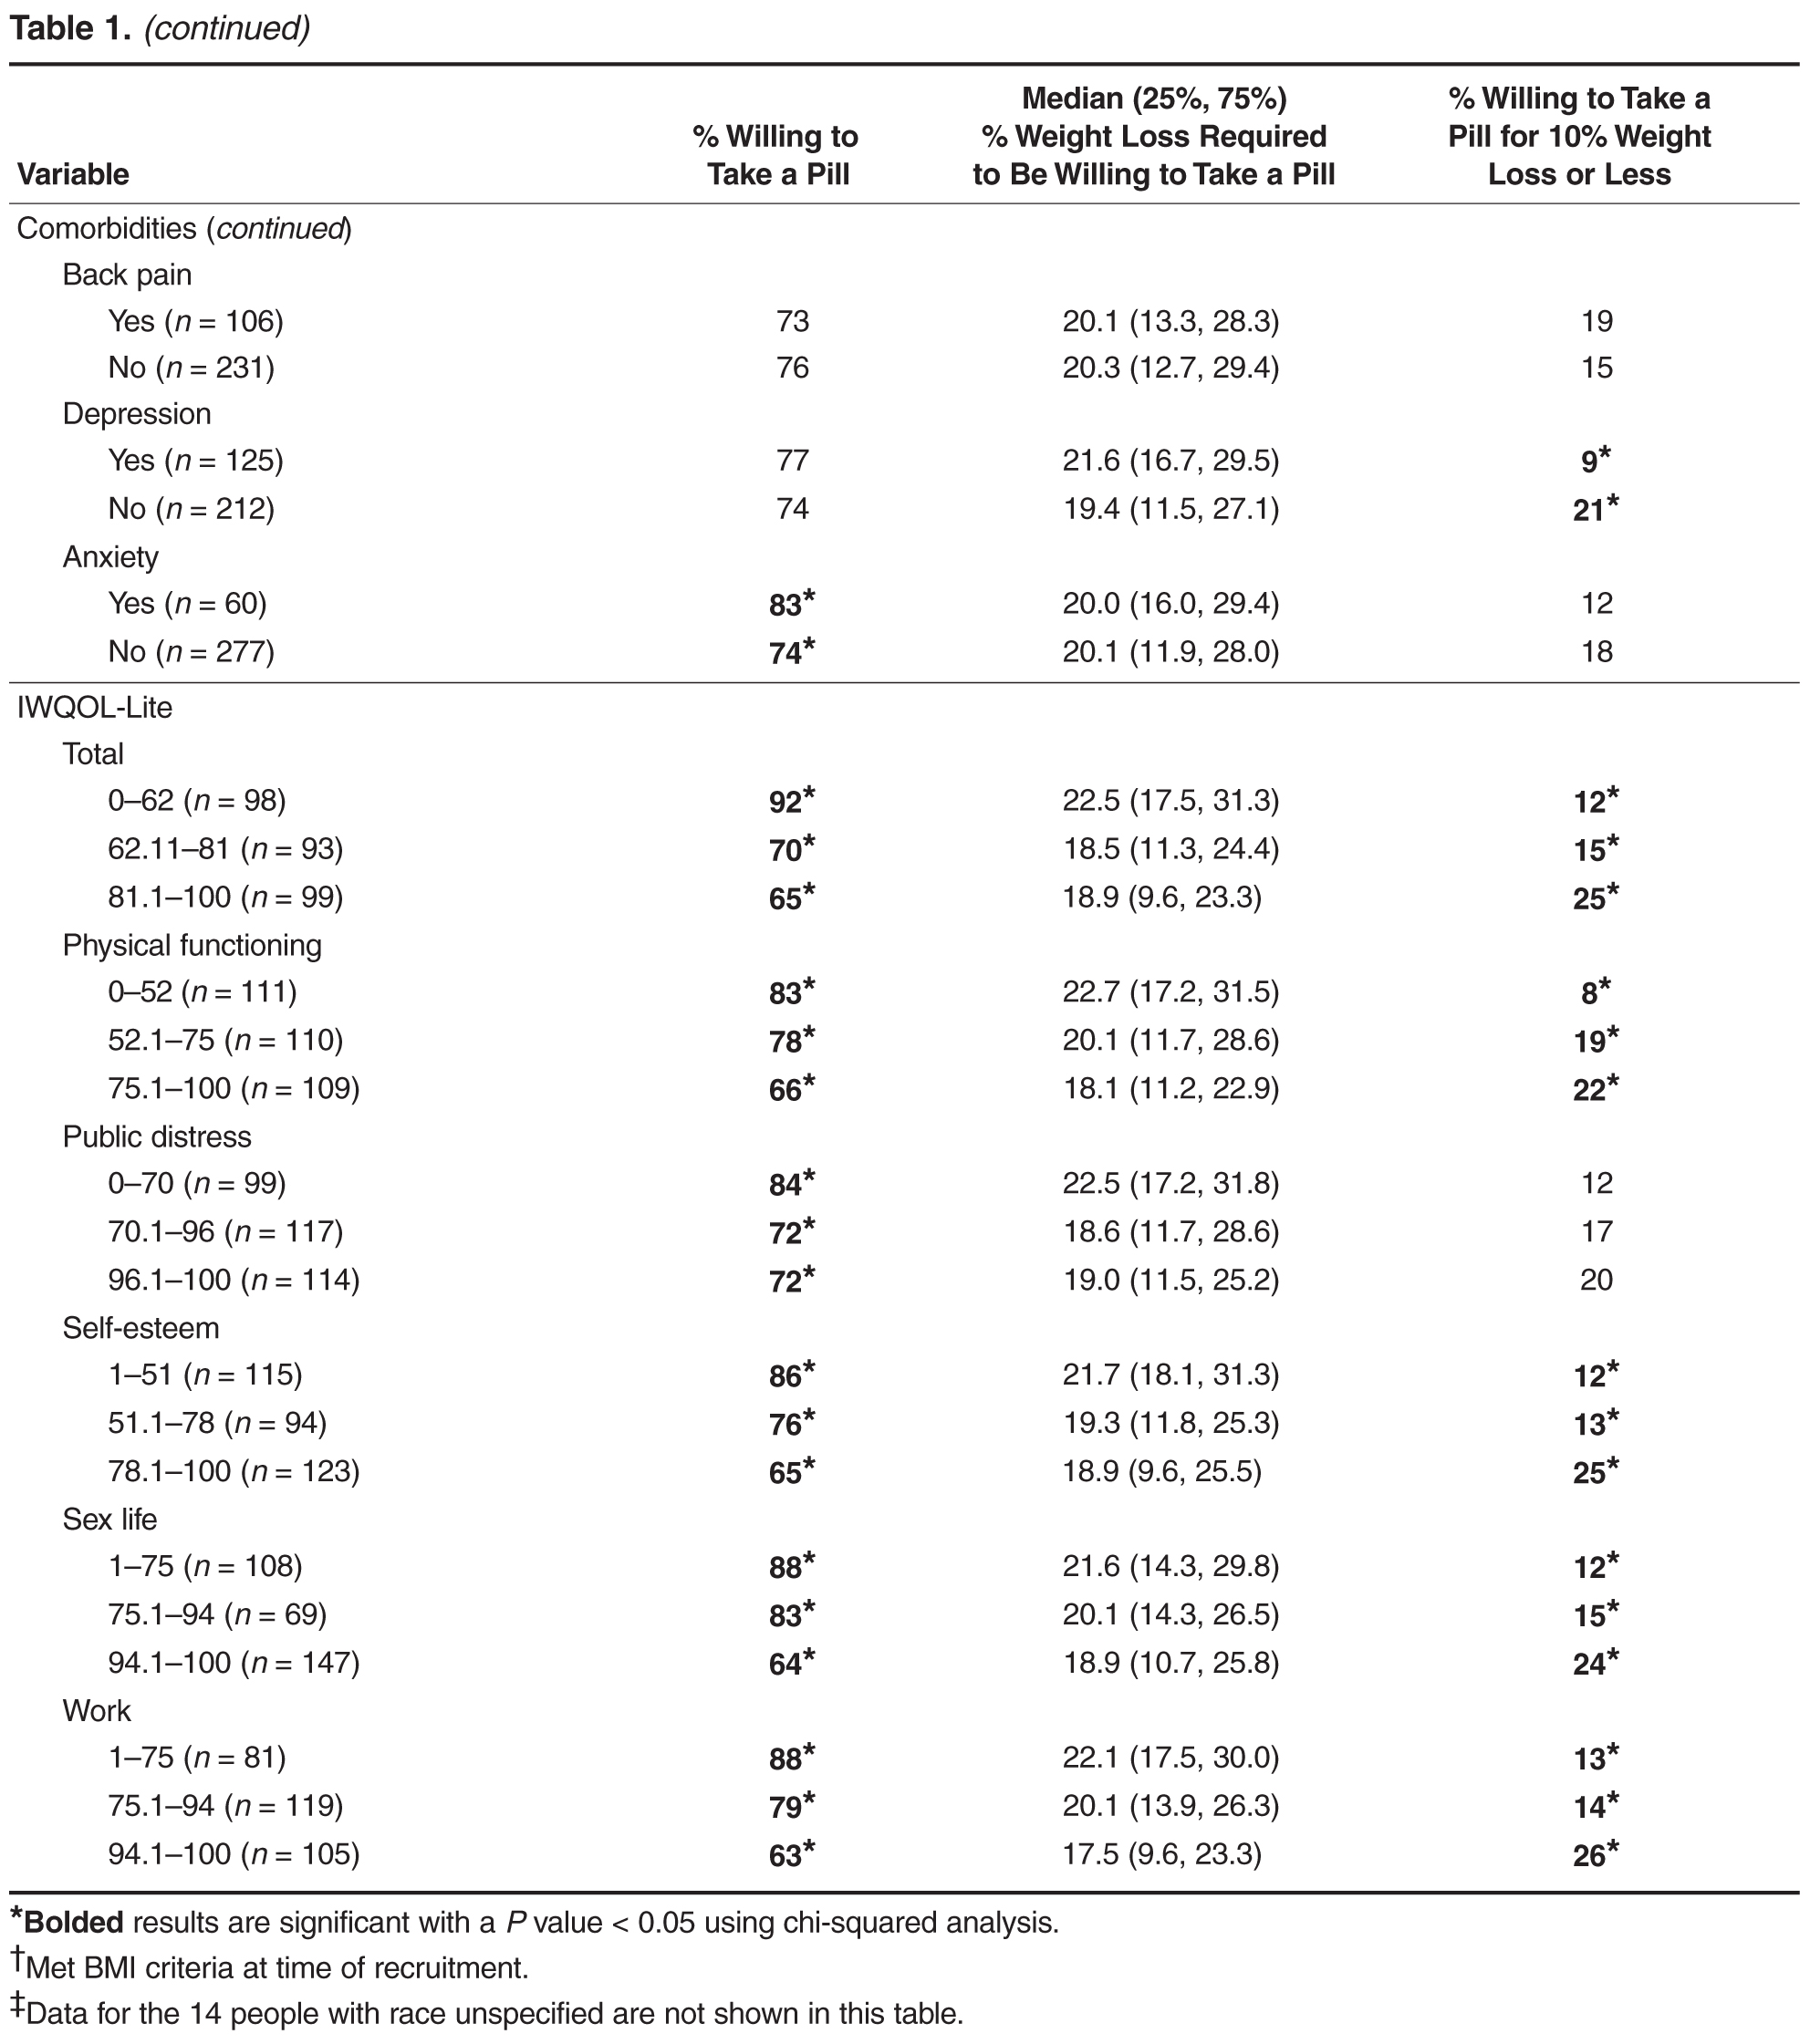

Discussion
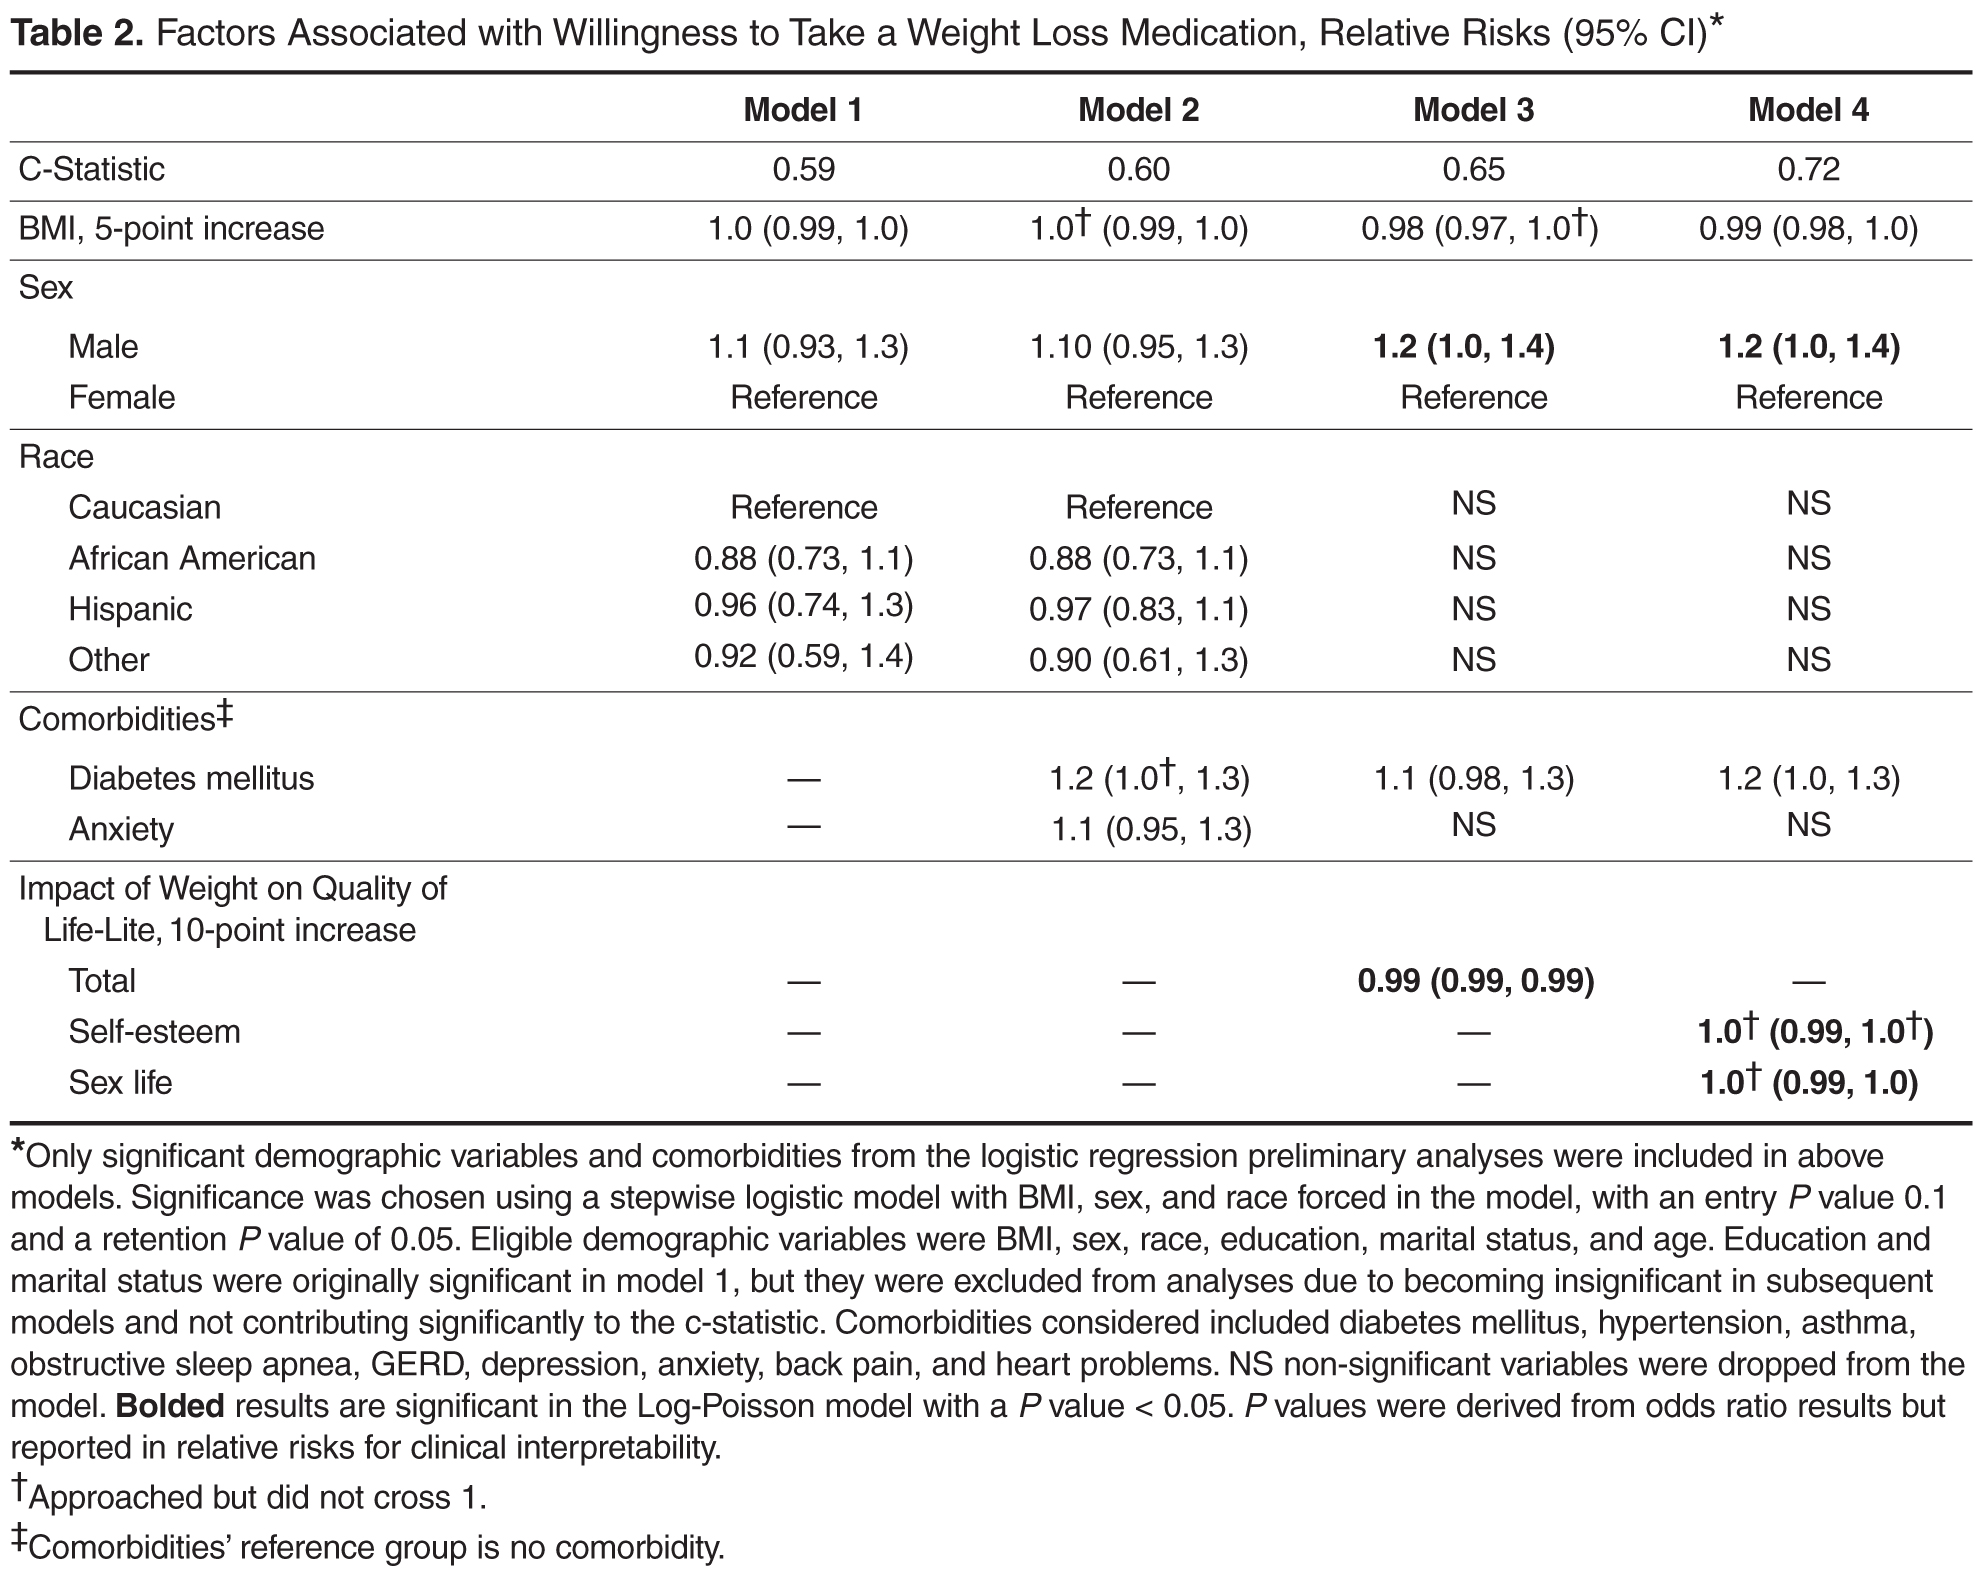
In our study, we found that a large proportion (75%) of primary care patients with at least moderate obesity were willing to take a daily weight loss medication if their doctor recommended it. After full adjustment, men, those with lower quality of life (QOL), and patients with diabetes were more likely to pursue weight loss pharmacotherapy than their counterparts. Moreover, QOL appeared more important than comorbid diagnoses in contributing to whether patients would consider taking a weight loss medication. Most patients expected to lose more than 10% of their weight to make taking a daily medication worthwhile.
Few studies have examined patients’ willingness to take a medication to lose weight. Tan et al [11] found that only about half of their surveyed outpatients were likely to take a medication to lose weight; however, approximately a quarter of the patients in that study were of normal BMI. In contrast, our study interviewed patients with at least a BMI of 35 kg/m2 and the majority of these patients reported a willingness to take a weight loss medication. Nevertheless, patients appear to have unrealistic expectations of the weight loss potential of pharmacotherapy. Only a minority of patients in our study would be willing to take a weight loss medication if the weight loss was no more than 10%, a level that is more consistent with the outcomes achievable in most clinical trials of weight loss medications [12]. Prior studies have also shown that patients often have unrealistic weight loss expectations and are unable to achieve their ideal body weight using diet, exercise, or pharmacotherapy [13,14]. Doyle et al found that percentage of weight loss was the most important treatment attribute when considering weight loss pharmacotherapy when compared to cost, health improvements, side effects, diet and exercise requirements, and method of medication administration [8]. Thus it is important to educate patients on realistic goal setting and the benefits of modest weight loss when considering pharmacotherapy. The weight loss preferences expressed in our study may also influence the weight loss outcomes targets pursued in pharmaceutical development. Interestingly, after full adjustment, BMI did not correlate with willingness to take a weight loss medication. Given that all patients in our study had a BMI of ≥ 35 kg/m2, this may imply that variations beyond this BMI threshold did not significantly affect a patient’s willingness to use pharmacotherapy. In contrast, weight-related QOL was an important correlate.
Men were slightly more likely than women to be willing to take a weight loss medication, which is interesting since men have been shown to be less likely to participate in behavioral weight loss programs and diets [15]. One reason may be that many weight loss programs are delivered in group settings which may deter men from participating. Whether this hypothetical willingness to undergo pharmacotherapy would translate to actual use is unclear, especially since there are barriers to pharmacotherapy including out-of-pocket costs. In a prior study in the United Kingdom, women were more likely to have reported prior weight loss medication use than men [16].
Our study did not find differences in willingness to pursue weight loss medication by race or educational attainment. This is consistent with our prior work demonstrating that racial and ethnic minorities were no less likely to consider bariatric surgery if the treatment were recommended by their doctor [9]. However, our other work did suggest that clinicians may be less likely to recommend bariatric surgery to their medically eligible minority patients as compared to their Caucasian patients. Whether this may be the case for pharmacotherapy is unclear since this was not explicitly queried in our current study [9].
Our study also found that patients with diabetes but not other comorbidities were more likely to consider weight loss medication after adjusting for QOL. This may reflect a stronger link between diabetes and obesity perceived by patients. Our result is consistent with our earlier data showing that diabetes but not other comorbid conditions was associated with a higher likelihood of considering weight loss surgery [9]. Nevertheless, having diabetes contributed only modestly to the variation in patient preferences regarding pharmacotherapy as reflected by the trivial change in model C-statistic when diabetes status was added to the model.
In contrast, lower QOL scores, especially in the domains of self-esteem and sex life, were associated with increased willingness to take a weight loss medication and appeared to be a stronger predictor than individual comorbidities. This is consistent with other studies showing that patients seeking treatment for obesity tend to have lower health-related QOL [9,17]. Our findings are also consistent with our previous research demonstrating that impairments in specific QOL domains are often more important to patients and stronger drivers of diminished well-being than measures of overall QOL [18]. Hence, given their importance to patients, clinicians need to consider QOL benefits when counseling patients about the risks and benefits of various obesity treatments.
This study is the first to our knowledge to systematically characterize demographic factors associated with the likelihood of primary care patients with obesity considering weight loss pharmacotherapy. This information may aid outpatient weight loss counseling by increasing awareness of gender and patient specific preferences. The fact that many patients with obesity appear to be interested in pursuing weight loss medication may also support public health initiatives in providing equitable access to weight loss pharmacotherapy. As our study characterizes patients who are willing to pursue weight loss medications, future studies may include retrospective analyses on actual use of weight loss medications among various demographic groups. Further investigation on specific reasons why patients choose whether or not to use weight loss medication may also be helpful.
This study has important limitations. The sample size was modest and potentially underpowered to detect small differences across different subgroups. Our sample was also limited to practices in Boston, which limits generalizability; although, by design, we oversampled racial and ethnic subjects to ensure diverse representation. Finally, our study examined patients’ hypothetical willingness to take weight loss medications rather than their actual adherence to treatment if offered.
Conclusion
In this sample of obese primary care patients, we found that the majority of patients were willing to take a daily medication to lose weight; however, patients had expectations for weight loss that far exceeded the level achievable by patients in pharmaceutical trials of these agents. Men and patients with diabetes were more likely to be willing to pursue weight loss medication; however, lower weight-related QOL, especially low self-esteem and impaired sexual function, appeared to be a stronger correlate of willingness to consider pharmacotherapy than comorbid diagnoses.
Corresponding author: Christina C. Wee, MD, MPH, Beth Israel Deaconess Medical Center, 330 Brookline Ave., Boston, MA 02215, [email protected].
Funding/support: This study was funded by the National Institute of Diabetes, Digestive and Kidney Diseases (R01 DK073302, PI Wee). Dr. Wee is also supported by an NIH midcareer mentorship award (K24DK087932). The sponsor had no role in the design or conduct of the study; the collection, management, analysis, and interpretation of the data; or the preparation, review, or approval of the manuscript.
Financial disclosures: None reported.
1. Ogden CL, Carroll MD, Kit BK, Flegal KM. Prevalence of obesity among adults: United States, 2011–2012. NCHS Data Brief 2013;(131):1–8.
2. Jensen MD, Ryan DH, Apovian CM, et al. 2013 AHA/ACC/TOS guideline for the management of overweight and obesity in adults: a report of the American College of Cardiology/American Heart Association Task Force on Practice Guidelines and The Obesity Society. J Am Coll Cardiol 2014;63(25 Pt B):2985–3023.
3. Hauptman J, Lucas C, Boldrin MN, et al. Orlistat in the long-term treatment of obesity in primary care settings. Arch Fam Med 2000;9:160–7.
4. Kakkar AK, Dahiya N. Drug treatment of obesity: current status and future prospects. Eur J Intern Med 2015;26:89–94.
5. Allison DB, Gadde KM, Garvey WT, et al. Controlled-release phentermine/topiramate in severely obese adults: a randomized controlled trial (EQUIP). Obesity (Silver Spring). 2012;20:330–42.
6. Fabricatore AN, Wadden TA. Obesity. Annu Rev Clin Psychol 2006;2:357–77.
7. Cheung BM, Cheung TT, Samaranayake NR. Safety of antiobesity drugs. Ther Adv Drug Saf 2013;4:171–81.
8. Doyle S, Lloyd A, Birt J, et al. Willingness to pay for obesity pharmacotherapy. Obesity (Silver Spring) 2012;20:2019–26.
9. Wee CC HK, Bolcic-Jankovic D, Colten ME, et al. Sex, race, and consideration of bariatric surgery among primary care patients with moderate to severe obesity. J Gen Intern Med 2014;29:68–75.
10. Kolotkin RL, Crosby RD, Kosloski KD, Williams GR. Development of a brief measure to assess quality of life in obesity. Obes Res 2001;9:102–11.
11. Tan DZN, Dennis SM, Vagholkar S. Weight management in general practice: what do patients want? Med J Aust 2006;185:73–5.
12. Yanovski SZ, Yanovski JA. Long-term drug treatment for obesity: a systematic and clinical review. JAMA 2014;311:74–86.
13. Foster GD, Wadden TA, Vogt RA, Brewer G. What is a reasonable weight loss? Patients’ expectations and evaluations of obesity treatment outcomes. J Consult Clin Psychol 1997;65:79–85.
14. Fabricatore AN, Wadden TA, Womble LG, et al. The role of patients’ expectations and goals in the behavioral and pharmacological treatment of obesity. Int J Obes (Lond) 2007;31:1739–45.
15. Robertson C, Archibald D, Avenell A, et al. Systematic reviews of and integrated report on the quantitative, qualitative and economic evidence base for the management of obesity in men. Health Technol Assess 2014;18:1–424.
16. Thompson RL, Thomas DE. A cross-sectional survey of the opinions on weight loss treatments of adult obese patients attending a dietetic clinic. Int J Obes Relat Metab Disord 2000;24:164–70.
17. Kolotkin RL, Crosby RD, Williams GR. Health-related quality of life varies among obese subgroups. Obes Res 2002;10:748–56.
18. Wee C, Davis R, Chiodi S, et al. Sex, race, and the adverse effects of social stigma vs. other quality of life factors among primary care patients with moderate to severe obesity. J Gen Intern Med 2015;30:229–35.
From Beth Israel Deaconess Medical Center and Harvard Medical School, Boston, MA.
Abstracts
- Objective: To identify patient factors associated with willingness to take daily weight loss medication and weight loss expectations using these medications.
- Methods: A random sample of 331 primary care patients aged 18–65 years with a BMI ≥ 35 kg/m2 were recruited from 4 diverse primary care practices in Boston, MA. We conducted telephone interviews and chart reviews to assess patients’ willingness to take a weight loss medication and their expectations for weight loss. We used sequential logistic regression models to identify demographic, clinical, and quality of life (QOL) factors associated with this willingness.
- Results: Of 331 subjects, 69% were women, 35% were white, 35% were black, and 25% were Hispanic; 249 (75%) of patients were willing to take a daily weight loss medication if recommended by their doctor but required a median weight loss of 15% to 24%; only 17% of patients were willing to take a medication for ≤ 10% weight loss. Men were significantly more willing than women (1.2 [95% CI 1.0–1.4]). Diabetes was the only comorbidity associated with willingness to consider pharmacotherapy (1.2 [1.0–1.3]) but only modestly improved model performance (C-statistic increased from 0.59 to 0.60). In contrast, lower QOL, especially low self-esteem and sex life, were stronger correlates (C-statistic 0.72).
- Conclusion: A majority of obese primary care patients were willing to take a daily weight loss pill; however, most required more than 10% weight loss to consider pharmacotherapy worthwhile. Poor QOL, especially low self-esteem and poor sex life, were stronger correlates than having diabetes.
Key words: obesity; primary care; weight loss medication.
In the United States, obesity continues to be unrelentingly prevalent, affecting more than one-third of adults (34.9%) [1]. This statistic has ominous implications when considering that obesity is a risk factor for numerous chronic diseases, such as coronary heart disease, diabetes, sleep apnea, osteoarthritis, and some types of cancers [2]. Moreover, it is associated with increased risk of all-cause and cardiovascular disease mortality. Promisingly, an initial 5% to 10% weight loss over 6 months has been associated with improvement in LDL, HDL, triglycerides, glucose, hemoglobin A1C, diabetes risk, blood pressure, and medication use [2]. Therefore, although patients may not be able to achieve their ideal body weight or normal BMI, modest weight loss can still have beneficial health effects.
Weight loss medications are effective adjunctive therapies in helping patients lose up to 10% of their body weight on average when combined with diet and exercise [3–5]. There are currently 5 medications approved by the Food and Drug Administration for long-term use for weight loss: orlistat, lorcaserin, phentermine-topiramate, bupropion-naltrexone, and liraglutide. Despite their proven efficacy, there are barriers to initiating a long-term weight loss medication. Insurance reimbursement is limited for these medications, thus resulting in high out-of-pocket cost for patients that they may be unable or unwilling to pay [6]. There may also be safety concerns given that several weight loss medications, including fenfluramine, sibutramine, and rimonabant, have been withdrawn from the market because of adverse effects [7]. Thus, in deciding whether to initiate a pharmacologic weight loss regimen, patients must believe that the weight loss benefits will exceed the potential risks.
Little is known, however, about patients’ willingness to take weight loss medications or the minimum weight loss they expect to lose to make pharmacotherapy worthwhile. Only a few studies have investigated patient willingness to adopt pharmacotherapy as part of a weight loss regimen, and only one investigated obese patients in the United States [8]. In this context, we surveyed a sociodemographically diverse group of primary care patients with moderate to severe obesity to examine patient characteristics associated with willingness to pursue weight loss pharmacotherapy. We also aimed to evaluate how much weight patients expected to lose in order to make taking a daily medication worth the effort. Characterizing patients seen in primary care who are willing to adopt pharmacotherapy to lose weight may guide weight loss counseling in the primary care setting. Furthermore, determining whether patients have realistic weight loss expectations can help clinicians better counsel their patients on weight loss goals.
Methods
Study Sample
We recruited 337 subjects from 4 diverse primary care practices in Boston, Massachusetts: a large hospital-based academic practice, a community practice in a working-class suburb, a community practice in an affluent suburb, and a health center serving a predominantly socially disadvantaged population. The primary goal of the parent study was to understand the preferences of patients for weight loss treatment, especially bariatric surgery. Therefore, to be included, patients needed to have a BMI ≥ 35 kg/m2 at the time of recruitment, been seen in clinic within the past year, be aged 18–65 years, and be English or Spanish speaking. By design, African-American and Hispanic patients were oversampled from an electronic list of potentially eligible patient groups so that we could examine for racial differences in treatment preferences. Study details have been previously described [9].
Data Collection and Measures
Trained interviewers conducted a 45- to 60-minute telephone interview with each participant in either English or Spanish. To assess willingness to use a daily weight loss medication, subjects were asked, “If your doctor recommended it, would you be willing to take a pill or medication every day in order to lose weight?” Those who answered affirmatively were then asked the minimum amount of weight they would have to lose to make taking a pill everyday worthwhile.
Subjects were also asked about demographic information (age, race, education, marital status) and comorbid health conditions commonly associated with obesity (diabetes mellitus, hypertension, asthma, obstructive sleep apnea, GERD, depression, anxiety, back pain, and cardiovascular problems). We assessed quality of life (QOL) using the Impact of Weight on Quality of Life-Lite (IWQOL-Lite), a 31-item instrument designed specifically to assess the impact of obesity on QOL capturing 5 domains (physical function, self-esteem, sexual life, public distress, and work). Subjects were asked to rate a series of statements beginning with “Because of my weight…” as “always true,” “usually true,” “sometimes true,” “rarely true,” or “never true.” Global and domain scores ranged from 0 to 100; higher scores reflected better QOL [10].
Data Analysis
We used descriptive statistics to characterize the proportion of subjects willing to use a daily weight loss medication and the weight loss required for patients to be willing to consider pharmacotherapy. We used a stepwise logistic model to examine demographic, QOL, and clinical factors associated with the willingness to take a weight loss medication as the outcome, with an entry criteria of P value of 0.1 and an exit criteria of 0.05. Log-Poisson distribution using the sandwich estimator was used to obtain relative risks for each significant variable. Adjusted models included age, BMI, sex, and race and any significant comorbidities. We added overall QOL score and individual QOL scores in subsequent models to examine the relative influence of overall vs. domain-specific QOL. Statistical analyses were conducted with SAS (SAS Institute, Cary, NC). We considered the change in model C-statistic when specific variables were added to the model to determine the importance of these factors in contributing to patients’ willingness to consider pharmacotherapy; larger changes in model C-statistic signifies a greater contribution.
Results
Table 2 displays sequentially adjusted models examining various demographic, clinical, and QOL factors associated with willingness to take a weight loss medication.
Discussion
In our study, we found that a large proportion (75%) of primary care patients with at least moderate obesity were willing to take a daily weight loss medication if their doctor recommended it. After full adjustment, men, those with lower quality of life (QOL), and patients with diabetes were more likely to pursue weight loss pharmacotherapy than their counterparts. Moreover, QOL appeared more important than comorbid diagnoses in contributing to whether patients would consider taking a weight loss medication. Most patients expected to lose more than 10% of their weight to make taking a daily medication worthwhile.
Few studies have examined patients’ willingness to take a medication to lose weight. Tan et al [11] found that only about half of their surveyed outpatients were likely to take a medication to lose weight; however, approximately a quarter of the patients in that study were of normal BMI. In contrast, our study interviewed patients with at least a BMI of 35 kg/m2 and the majority of these patients reported a willingness to take a weight loss medication. Nevertheless, patients appear to have unrealistic expectations of the weight loss potential of pharmacotherapy. Only a minority of patients in our study would be willing to take a weight loss medication if the weight loss was no more than 10%, a level that is more consistent with the outcomes achievable in most clinical trials of weight loss medications [12]. Prior studies have also shown that patients often have unrealistic weight loss expectations and are unable to achieve their ideal body weight using diet, exercise, or pharmacotherapy [13,14]. Doyle et al found that percentage of weight loss was the most important treatment attribute when considering weight loss pharmacotherapy when compared to cost, health improvements, side effects, diet and exercise requirements, and method of medication administration [8]. Thus it is important to educate patients on realistic goal setting and the benefits of modest weight loss when considering pharmacotherapy. The weight loss preferences expressed in our study may also influence the weight loss outcomes targets pursued in pharmaceutical development. Interestingly, after full adjustment, BMI did not correlate with willingness to take a weight loss medication. Given that all patients in our study had a BMI of ≥ 35 kg/m2, this may imply that variations beyond this BMI threshold did not significantly affect a patient’s willingness to use pharmacotherapy. In contrast, weight-related QOL was an important correlate.
Men were slightly more likely than women to be willing to take a weight loss medication, which is interesting since men have been shown to be less likely to participate in behavioral weight loss programs and diets [15]. One reason may be that many weight loss programs are delivered in group settings which may deter men from participating. Whether this hypothetical willingness to undergo pharmacotherapy would translate to actual use is unclear, especially since there are barriers to pharmacotherapy including out-of-pocket costs. In a prior study in the United Kingdom, women were more likely to have reported prior weight loss medication use than men [16].
Our study did not find differences in willingness to pursue weight loss medication by race or educational attainment. This is consistent with our prior work demonstrating that racial and ethnic minorities were no less likely to consider bariatric surgery if the treatment were recommended by their doctor [9]. However, our other work did suggest that clinicians may be less likely to recommend bariatric surgery to their medically eligible minority patients as compared to their Caucasian patients. Whether this may be the case for pharmacotherapy is unclear since this was not explicitly queried in our current study [9].
Our study also found that patients with diabetes but not other comorbidities were more likely to consider weight loss medication after adjusting for QOL. This may reflect a stronger link between diabetes and obesity perceived by patients. Our result is consistent with our earlier data showing that diabetes but not other comorbid conditions was associated with a higher likelihood of considering weight loss surgery [9]. Nevertheless, having diabetes contributed only modestly to the variation in patient preferences regarding pharmacotherapy as reflected by the trivial change in model C-statistic when diabetes status was added to the model.
In contrast, lower QOL scores, especially in the domains of self-esteem and sex life, were associated with increased willingness to take a weight loss medication and appeared to be a stronger predictor than individual comorbidities. This is consistent with other studies showing that patients seeking treatment for obesity tend to have lower health-related QOL [9,17]. Our findings are also consistent with our previous research demonstrating that impairments in specific QOL domains are often more important to patients and stronger drivers of diminished well-being than measures of overall QOL [18]. Hence, given their importance to patients, clinicians need to consider QOL benefits when counseling patients about the risks and benefits of various obesity treatments.
This study is the first to our knowledge to systematically characterize demographic factors associated with the likelihood of primary care patients with obesity considering weight loss pharmacotherapy. This information may aid outpatient weight loss counseling by increasing awareness of gender and patient specific preferences. The fact that many patients with obesity appear to be interested in pursuing weight loss medication may also support public health initiatives in providing equitable access to weight loss pharmacotherapy. As our study characterizes patients who are willing to pursue weight loss medications, future studies may include retrospective analyses on actual use of weight loss medications among various demographic groups. Further investigation on specific reasons why patients choose whether or not to use weight loss medication may also be helpful.
This study has important limitations. The sample size was modest and potentially underpowered to detect small differences across different subgroups. Our sample was also limited to practices in Boston, which limits generalizability; although, by design, we oversampled racial and ethnic subjects to ensure diverse representation. Finally, our study examined patients’ hypothetical willingness to take weight loss medications rather than their actual adherence to treatment if offered.
Conclusion
In this sample of obese primary care patients, we found that the majority of patients were willing to take a daily medication to lose weight; however, patients had expectations for weight loss that far exceeded the level achievable by patients in pharmaceutical trials of these agents. Men and patients with diabetes were more likely to be willing to pursue weight loss medication; however, lower weight-related QOL, especially low self-esteem and impaired sexual function, appeared to be a stronger correlate of willingness to consider pharmacotherapy than comorbid diagnoses.
Corresponding author: Christina C. Wee, MD, MPH, Beth Israel Deaconess Medical Center, 330 Brookline Ave., Boston, MA 02215, [email protected].
Funding/support: This study was funded by the National Institute of Diabetes, Digestive and Kidney Diseases (R01 DK073302, PI Wee). Dr. Wee is also supported by an NIH midcareer mentorship award (K24DK087932). The sponsor had no role in the design or conduct of the study; the collection, management, analysis, and interpretation of the data; or the preparation, review, or approval of the manuscript.
Financial disclosures: None reported.
1. Ogden CL, Carroll MD, Kit BK, Flegal KM. Prevalence of obesity among adults: United States, 2011–2012. NCHS Data Brief 2013;(131):1–8.
2. Jensen MD, Ryan DH, Apovian CM, et al. 2013 AHA/ACC/TOS guideline for the management of overweight and obesity in adults: a report of the American College of Cardiology/American Heart Association Task Force on Practice Guidelines and The Obesity Society. J Am Coll Cardiol 2014;63(25 Pt B):2985–3023.
3. Hauptman J, Lucas C, Boldrin MN, et al. Orlistat in the long-term treatment of obesity in primary care settings. Arch Fam Med 2000;9:160–7.
4. Kakkar AK, Dahiya N. Drug treatment of obesity: current status and future prospects. Eur J Intern Med 2015;26:89–94.
5. Allison DB, Gadde KM, Garvey WT, et al. Controlled-release phentermine/topiramate in severely obese adults: a randomized controlled trial (EQUIP). Obesity (Silver Spring). 2012;20:330–42.
6. Fabricatore AN, Wadden TA. Obesity. Annu Rev Clin Psychol 2006;2:357–77.
7. Cheung BM, Cheung TT, Samaranayake NR. Safety of antiobesity drugs. Ther Adv Drug Saf 2013;4:171–81.
8. Doyle S, Lloyd A, Birt J, et al. Willingness to pay for obesity pharmacotherapy. Obesity (Silver Spring) 2012;20:2019–26.
9. Wee CC HK, Bolcic-Jankovic D, Colten ME, et al. Sex, race, and consideration of bariatric surgery among primary care patients with moderate to severe obesity. J Gen Intern Med 2014;29:68–75.
10. Kolotkin RL, Crosby RD, Kosloski KD, Williams GR. Development of a brief measure to assess quality of life in obesity. Obes Res 2001;9:102–11.
11. Tan DZN, Dennis SM, Vagholkar S. Weight management in general practice: what do patients want? Med J Aust 2006;185:73–5.
12. Yanovski SZ, Yanovski JA. Long-term drug treatment for obesity: a systematic and clinical review. JAMA 2014;311:74–86.
13. Foster GD, Wadden TA, Vogt RA, Brewer G. What is a reasonable weight loss? Patients’ expectations and evaluations of obesity treatment outcomes. J Consult Clin Psychol 1997;65:79–85.
14. Fabricatore AN, Wadden TA, Womble LG, et al. The role of patients’ expectations and goals in the behavioral and pharmacological treatment of obesity. Int J Obes (Lond) 2007;31:1739–45.
15. Robertson C, Archibald D, Avenell A, et al. Systematic reviews of and integrated report on the quantitative, qualitative and economic evidence base for the management of obesity in men. Health Technol Assess 2014;18:1–424.
16. Thompson RL, Thomas DE. A cross-sectional survey of the opinions on weight loss treatments of adult obese patients attending a dietetic clinic. Int J Obes Relat Metab Disord 2000;24:164–70.
17. Kolotkin RL, Crosby RD, Williams GR. Health-related quality of life varies among obese subgroups. Obes Res 2002;10:748–56.
18. Wee C, Davis R, Chiodi S, et al. Sex, race, and the adverse effects of social stigma vs. other quality of life factors among primary care patients with moderate to severe obesity. J Gen Intern Med 2015;30:229–35.
Oral Contraceptives for Acne Treatment: US Dermatologists’ Knowledge, Comfort, and Prescribing Practices
The incidence of acne in adult females is rising,1 and treatment with combined oral contraceptive pills (OCPs) is becoming an increasingly important therapy for women with acne. Prior reports have indicated that OCPs were as effective as systemic antibiotics in reducing inflammatory, noninflammatory, and total facial acne lesions after 6 months of treatment.2,3 The acne management guidelines of the American Academy of Dermatology confer OCPs a grade A recommendation based on consistent and good-quality patient-oriented evidence.4
The US Food and Drug Administration (FDA) has approved 3 OCPs for the treatment of acne in adult women: norgestimate–ethinyl estradiol in 1997, norethindrone acetate–ethinyl estradiol in 2001, and drospirenone–ethinyl estradiol in 2007.5 However, the use of these OCPs is poorly understood by many dermatologists. One study showed that dermatologists prescribed OCPs in only 2% of visits with female patients aged 12 to 55 years who presented for acne treatment, which is less often than obstetrician/gynecologists (36%) and internists (11%),6 perhaps due to perceived risks or unfamiliarity with OCP formulations and guidelines among dermatologists.7 Adverse effects of OCPs include venous thromboembolism (VTE), myocardial infarction, and hypertension,8 but they generally are well tolerated.9
Even less is known about dermatologists’ use of drospirenone-containing OCPs (DCOCPs), which contain the only FDA-approved progestin that blocks androgen receptors. In prior studies, treatment with DCOCPs was associated with greater reductions in total lesion count and investigator-graded acne severity compared to early-generation OCPs.10,11 However, DCOCPs have been associated with a greater risk for VTE (4.0–6.3 times higher than OCP nonuse; 1.0–3.3 times higher than levonorgestrel-containing OCPs),12 which may explain the decline in DCOCP prescriptions among gynecologists in Germany from 23.8% of OCP prescriptions in 2007 to 11.4% in 2011.13
In this study, we surveyed US dermatologists about their knowledge, comfort, and prescribing practices pertaining to the use of OCPs. We compare OCP-prescribing to nonprescribing dermatologists, and those frequently prescribing DCOCPs to those who infrequently prescribe DCOCPs.
Methods
Survey Design
We performed a cross-sectional survey study using convenience sampling. The instrument was designed based on primary literature on OCPs in acne treatment and questionnaires assessing the use of OCPs in other specialties. Topics included prescribing practices, contraindications for OCPs defined by the Centers for Disease Control and Prevention (CDC),14 VTE risk, patient selection for hormonal acne therapy, comfort with prescribing OCP therapy, and participant demographics.
Skip logic was employed (ie, subsequent questions depended on prior answers). A pilot study surveyed 9 board-certified dermatologists at our home institution (Weill Cornell Medical College, New York, New York).
Data Collection
Eligible participants were board-certified US dermatologists. Data were collected and managed using an electronic data capture tool through the Weill Cornell Medical College Clinical & Translational Science Center. Surveys were distributed electronically to dermatologic society members, university alumni networks, investigators’ professional contacts, and dermatologists whose contact information was purchased from an email marketing company. Chain-referral sampling (ie, participants’ recruitment among their colleagues) was used. Surveys were distributed at a regional dermatology meeting. Responses were collected from November 2014 to April 2015. This study was approved by the institutional review board.
Statistical Analysis
For the descriptive data, all responses including pilot study participants were analyzed regardless of survey completion and were summarized using frequency counts and percentages (N=130).
For the analysis of OCP prescription predictors, the sample included all respondents answering the demographic questions and indicating if they prescribe OCPs (N=116). One respondent was excluded for answering other for current practice setting. Demographic predictors of OCP prescription were physician characteristics, geographic region, practice location population density, practice attributes, time spent on medical versus pediatric dermatology, number of weekly acne patients, and percentage of total patients who are female. Medical school graduation year was a categorical variable and was categorized as prior to 1997 (when norgestimate–ethinyl estradiol was FDA approved for acne5) versus 1997 or later. Respondents’ practice states were analyzed according to US regions—Northeast, Midwest, South, West/Pacific—and population density (persons per square mile) using US Census Bureau data.15,16
Univariate logistic regressions modeling OCP prescribing probability were performed for each demographic variable; a multivariable logistic model was constructed including all variables significant at α=.20 from univariate modeling.
To compare frequent prescribers versus infrequent prescribers of DCOCPs, we included all respondents answering whether they frequently prescribe DCOCPs and whether they believed the risk for VTE associated with DCOCPs differed from other OCPs (n=68). A univariate logistic regression was performed to model the probability of responding “Yes, they pose a greater risk” versus any of the other 3 responses by whether or not the respondent frequently prescribed DCOCPs for acne, and an unadjusted odds ratio was obtained. All P values were 2-tailed with statistical significance evaluated at α=.05. Ninety-five percent confidence intervals were calculated to assess precision of obtained estimates. Analyses were performed using SAS software version 9.4.
Results
Demographics
Participant demographics as predictors of OCP prescription practices are described in Table 1.
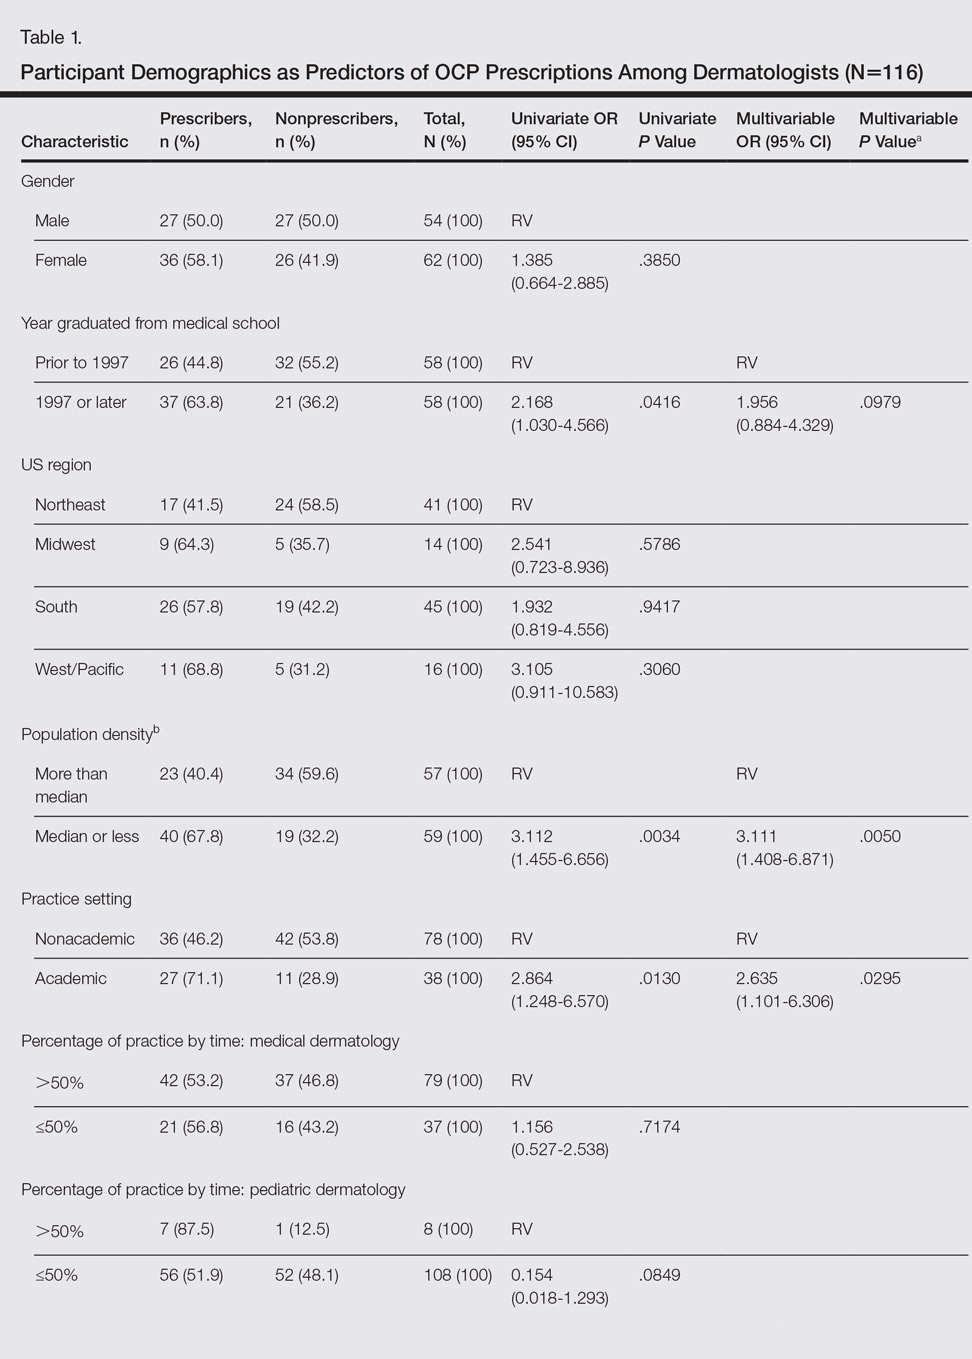
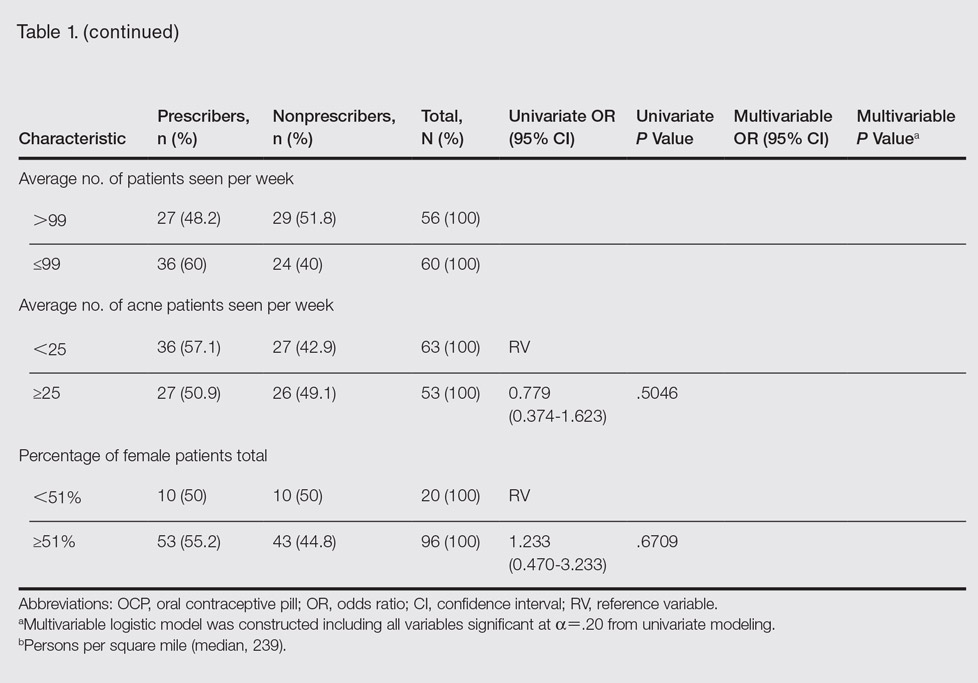
Knowledge
Oral contraceptive pills were endorsed as effective in the treatment of acne in women by 95.4% (124/130) of respondents. Among prescribers of OCPs for acne, 94.2% (65/69) believed OCPs were associated with an increased risk for VTE, no respondents thought OCPs were associated with a decreased VTE risk, 2.9% (2/69) believed OCPs did not affect VTE risk, and 2.9% (2/69) were unsure.
Among prescribers of OCPs for acne, 46.4% (32/69) believed DCOCPs posed a greater VTE risk than other OCPs. Odds of this response did not differ with frequent DCOCP prescribers versus infrequent prescribers (odds ratio, 0.731 [95% confidence interval, 0.272-1.964]; P=.5342). Participant responses on VTE risk and DCOCPs are provided in Table 2.

Dermatologists prescribing OCPs for acne endorsed greater likelihood of doing so in cases of cyclical flares with menstrual cycle (94.2% [65/69]), acne unresponsive to conventional therapy (87.0% [60/69]), acne on the lower half of the face (78.3% [54/69]), diagnosis of polycystic ovary syndrome (PCOS)(76.8% [53/69]), clinical suspicion of PCOS (71.0% [49/69]), concomitant hirsutism (71.0% [49/69]), late- or adult-onset acne (66.7% [46/69]), laboratory evidence of hyperandrogenism (60.9% [42/69]), and concomitant androgenetic alopecia (49.3% [34/69]).
Among dermatologists who prescribed OCPs for acne, CDC-defined absolute contraindications identified correctly were blood pressure of 160/100 mm Hg (59.4% [41/69]) and history of migraine with focal neurologic symptoms (49.3% [34/69]). The CDC-defined relative contraindications identified correctly were history of deep vein thrombosis or pulmonary embolism (1.4% [1/69]), breast cancer history with 5 years of no disease (15.9% [11/69]), hyperlipidemia (42.0% [29/69]), and 36 years or older smoking fewer than 15 cigarettes per day (21.7% [15/69]).
Comfort
Dermatologist self-reported comfort levels in prescribing OCPs for acne are shown in Table 3.

Prescribing Practices
Among all respondents, acne medications prescribed often included oral antibiotics (76.9% [100/130]), isotretinoin (41.5% [54/130]), and spironolactone (40.8% [53/130]).
Overall, 55.4% (72/130) of respondents prescribed OCPs for the following uses: acne (95.8% [69/72]), concomitant treatment with teratogenic medication (48.6% [35/72]), PCOS (34.7% [25/72]), hirsutism (26.4% [19/72]), androgenetic alopecia (19.4% [14/72]), SAHA (seborrhea, acne, hirsutism, alopecia) syndrome (12.5% [9/72]), and HAIR-AN (hyperandrogenism, insulin resistance, acanthosis nigricans) syndrome (11.1% [8/72]). For teratogenic medications, dermatologists prescribing OCPs did so with isotretinoin (77.8% [56/72]), spironolactone (73.6% [53/72]), tetracycline antibiotics (37.5% [27/72]), and other (34.7% [25/72]).
Of dermatologists prescribing OCPs for acne, frequency included often (19% [13/69]), sometimes (45% [31/69]), and rarely (36% [25/69]). The most frequently prescribed OCPs included Ortho Tri-Cyclen (Janssen Pharmaceuticals, Inc)(80% [55/69]), Yaz (Bayer)(64% [44/69]), and Estrostep (Warner Chilcott)(19% [13/69]). Fill-in responses included Desogen (Merck & Co, Inc)(3/69 [4%]), Alesse (Wyeth Pharmaceuticals, Inc)(3/69 [4%]), Lutera (Watson Pharma, Inc)(1/69 [1%]), Loestrin (Warner Chilcott)(1/69 [1%]), and Yasmin (Bayer)(1/69 [1%]).
In univariate regressions, graduation from medical school in 1997 or later (P=.0416), academic practice setting (P=.0130), and low-density practice setting (P=.0034) were significant predictors of prescribing OCPs. In multivariable regression, only academic practice setting (P=.0295) and low-density practice setting (P=.0050) remained significant predictors. Demographic predictors are summarized in Table 1.
Comment
Our results suggest that most dermatologists (95.4%) believe OCPs effectively treat acne; however, only 54% of respondents reported prescribing them. Academic dermatologists were more likely to prescribe OCPs than nonacademic dermatologists, possibly indicating that academic dermatologists are more familiar with the literature on the efficacy and use of OCPs. Nearly half of respondents seeing 25 or more acne patients weekly did not prescribe OCPs, suggesting a notable practice gap. Dermatologists in less dense US regions were more likely to prescribe OCPs, perhaps because dermatologists may be more likely to prescribe OCPs than refer patients in health care access–limited areas, just as primary care providers treat a broader range of conditions in low-density rural areas than urban ones.17 Exploring all dermatologists’ referral patterns for OCPs is warranted.
A strong knowledge area revealed from this study was hormonal treatment of acne in women, a vital area because appropriate patient selection is key to treatment success.8 Weaker knowledge areas included OCP contraindications and differences in VTE risk between formulations containing drospirenone and those not containing drospirenone. Only half the sample identified CDC-defined absolute contraindications, suggesting an education target for dermatologists to ensure patient safety. In contrast, respondents were conservative about relative contraindications, with most identifying deep vein thrombosis or pulmonary embolism, remote breast cancer history, and light smoking at 36 years or older as absolute contraindications. These results could reflect weighing the risk of relative contraindications against the benefit in acne, resulting in appropriately more conservative management than overall guidelines suggest. If so, it may suggest that dermatologists are adapting overall guidelines appropriately for use of OCPs in skin conditions.
Nearly all respondents knew that OCPs are associated with an increased risk for VTE. Approximately half understood that DCOCPs are associated with a greater VTE risk than other OCPs, with no difference between frequent and infrequent prescribers. Comparing these results to the findings on OCP prescribing overall, some dermatologists’ risk-benefit calculation for VTE differs from other specialties because DCOCPs have superior efficacy in acne, whereas DCOCPs have similar contraceptive efficacy to other OCPs.18 The fact that more dermatologists believed VTE to be an absolute contraindication than hypertension suggests dermatologists have a heightened awareness of VTE risk but prescribe DCOCPs for acne despite it.
Most OCP prescribers felt very comfortable selecting good candidates for OCPs (55.5%) and counseling on treatment initiation (45.8%) and side effects (48.6%). Only 22.2%, by contrast, were very comfortable managing side effects. This finding likely reflects the notion that VTEs are not most appropriately managed by a dermatologist. Exploring if a greater comfort level in managing side effects would make dermatologists more likely to prescribe OCPs is worthwhile. Additionally, exploring why many dermatologists do not prescribe OCPs despite believing they are effective for acne is warranted.
Study limitations included the use of convenience sampling. Additionally, our study did not investigate dermatologists’ reasons for not prescribing OCPs.
Conclusion
This study demonstrates that dermatologists believe OCPs effectively treat acne in women and that most dermatologists prescribing OCPs do so for acne treatment. Academic practice setting was associated with higher odds of prescribing OCPs than a nonacademic setting, but the number of weekly acne patients did not impact the likelihood of prescribing OCPs, which suggests a treatment gap warranting education efforts for dermatologists in nonacademic settings seeing many acne patients. Our study also suggests that awareness of the increased risk for VTE associated with DCOCPs is not associated with lower likelihood of prescribing DCOCPs, suggesting dermatologists may find greater treatment efficacy to be worth the higher risk.
Acknowledgments
We are grateful to the Department of Dermatology at the Weill Cornell College of Medicine (New York, New York) for providing funding to complete this study. We also acknowledge Paul Christos, DrPH, MS (New York, New York), and Xuming Sun, MS (New York, New York), for their assistance with the survey design. We also are indebted to numerous dermatologic professional societies for allowing the survey to be distributed to their membership.
- Kim GK, Michaels BB. Post-adolescent acne in women: more common and more clinical considerations. J Drugs Dermatol. 2012;11:708-713.
- Arowojolu AO, Gallo MF, Lopez LM, et al. Combined oral contraceptive pills for treatment of acne. Cochrane Database Syst Rev. July 11, 2012:CD004425.
- Koo EB, Petersen TD, Kimball AB. Meta-analysis comparing efficacy of antibiotics versus oral contraceptives in acne vulgaris. J Am Acad Dermatol. 2014;71:450-459.
- Strauss JS, Krowchuk DP, Leyden JJ, et al; American Academy of Dermatology/American Academy of Dermatology Association. Guidelines of care for acne vulgaris management. J Am Acad Dermatol. 2007;56:651-663.
- Harper JC. Should dermatologists prescribe hormonal contraceptives for acne? Dermatol Ther. 2009;22:452-457.
- Landis ET, Levender MM, Davis SA, et al. Isotretinoin and oral contraceptive use in female acne patients varies by physician specialty: analysis of data from the National Ambulatory Medical Care Survey. J Dermatol Treat. 2012;23:272-277.
- Lam C, Zaenglein AL. Contraceptive use in acne. Clin Dermatol. 2014;32:502-515.
- Katsambas AD, Dessinioti C. Hormonal therapy for acne: why not as first line therapy? facts and controversies. Clin Dermatol. 2010;28:17-23.
- Dragoman MV. The combined oral contraceptive pill—recent developments, risks and benefits. Best Pract Res Clin Obstet Gynaecol. 2014;28:825-834.
- Thorneycroft IH, Gollnick H, Schellschmidt I. Superiority of a combined contraceptive containing drospirenone to a triphasic preparation containing norgestimate in acne treatment. Cutis. 2004;74:123-130.
- Mansour D, Verhoeven C, Sommer W, et al. Efficacy and tolerability of a monophasic combined oral contraceptive containing nomegestrol acetate and 17β-oestradiol in a 24/4 regimen, in comparison to an oral contraceptive containing ethinylestradiol and drospirenone in a 21/7 regimen. Eur J Contracept Reproduct Health Care. 2011;16:430-443.
- Wu CQ, Grandi SM, Filion KB, et al. Drospirenone-containing oral contraceptive pills and the risk of venous and arterial thrombosis: a systematic review. BJOG. 2013;120:801-810.
- Ziller M, Rashed AN, Ziller V, et al. The prescribing of contraceptives for adolescents in German gynecologic practices in 2007 and 2011: a retrospective database analysis. J Pediatr Adolesc Gynecol. 2013;26:261-264.
- Centers for Disease Control and Prevention. US medical eligibility criteria for contraceptive use, 2010. MMWR Recomm Rep. 2010;59(RR-4):1-86.
- United States Census Bureau. Census Regions and Divisions of the United States. New York, NY: United States Department of Commerce; 2010.
- Resident Population Data—Population Density, 1910 to 2010. U.S. Census Bureau; 2012. http ://www.census.gov/2010census/data/apportionment-dens-text.php. Accessed January 9, 2017.
- Reschovsky A, Zahner SJ. Forecasting the revenues of local public health departments in the shadows of the “Great Recession.” J Public Health Manag Pract. 2016;22:120-128.
- Klipping C, Duijkers I, Fortier MP, et al. Contraceptive efficacy and tolerability of ethinylestradiol 20 μg/drospirenone 3 mg in a flexible extended regimen: an open-label, multicentre, randomised, controlled study. J Fam Plann Reprod Health Care. 2012;38:73-83.
The incidence of acne in adult females is rising,1 and treatment with combined oral contraceptive pills (OCPs) is becoming an increasingly important therapy for women with acne. Prior reports have indicated that OCPs were as effective as systemic antibiotics in reducing inflammatory, noninflammatory, and total facial acne lesions after 6 months of treatment.2,3 The acne management guidelines of the American Academy of Dermatology confer OCPs a grade A recommendation based on consistent and good-quality patient-oriented evidence.4
The US Food and Drug Administration (FDA) has approved 3 OCPs for the treatment of acne in adult women: norgestimate–ethinyl estradiol in 1997, norethindrone acetate–ethinyl estradiol in 2001, and drospirenone–ethinyl estradiol in 2007.5 However, the use of these OCPs is poorly understood by many dermatologists. One study showed that dermatologists prescribed OCPs in only 2% of visits with female patients aged 12 to 55 years who presented for acne treatment, which is less often than obstetrician/gynecologists (36%) and internists (11%),6 perhaps due to perceived risks or unfamiliarity with OCP formulations and guidelines among dermatologists.7 Adverse effects of OCPs include venous thromboembolism (VTE), myocardial infarction, and hypertension,8 but they generally are well tolerated.9
Even less is known about dermatologists’ use of drospirenone-containing OCPs (DCOCPs), which contain the only FDA-approved progestin that blocks androgen receptors. In prior studies, treatment with DCOCPs was associated with greater reductions in total lesion count and investigator-graded acne severity compared to early-generation OCPs.10,11 However, DCOCPs have been associated with a greater risk for VTE (4.0–6.3 times higher than OCP nonuse; 1.0–3.3 times higher than levonorgestrel-containing OCPs),12 which may explain the decline in DCOCP prescriptions among gynecologists in Germany from 23.8% of OCP prescriptions in 2007 to 11.4% in 2011.13
In this study, we surveyed US dermatologists about their knowledge, comfort, and prescribing practices pertaining to the use of OCPs. We compare OCP-prescribing to nonprescribing dermatologists, and those frequently prescribing DCOCPs to those who infrequently prescribe DCOCPs.
Methods
Survey Design
We performed a cross-sectional survey study using convenience sampling. The instrument was designed based on primary literature on OCPs in acne treatment and questionnaires assessing the use of OCPs in other specialties. Topics included prescribing practices, contraindications for OCPs defined by the Centers for Disease Control and Prevention (CDC),14 VTE risk, patient selection for hormonal acne therapy, comfort with prescribing OCP therapy, and participant demographics.
Skip logic was employed (ie, subsequent questions depended on prior answers). A pilot study surveyed 9 board-certified dermatologists at our home institution (Weill Cornell Medical College, New York, New York).
Data Collection
Eligible participants were board-certified US dermatologists. Data were collected and managed using an electronic data capture tool through the Weill Cornell Medical College Clinical & Translational Science Center. Surveys were distributed electronically to dermatologic society members, university alumni networks, investigators’ professional contacts, and dermatologists whose contact information was purchased from an email marketing company. Chain-referral sampling (ie, participants’ recruitment among their colleagues) was used. Surveys were distributed at a regional dermatology meeting. Responses were collected from November 2014 to April 2015. This study was approved by the institutional review board.
Statistical Analysis
For the descriptive data, all responses including pilot study participants were analyzed regardless of survey completion and were summarized using frequency counts and percentages (N=130).
For the analysis of OCP prescription predictors, the sample included all respondents answering the demographic questions and indicating if they prescribe OCPs (N=116). One respondent was excluded for answering other for current practice setting. Demographic predictors of OCP prescription were physician characteristics, geographic region, practice location population density, practice attributes, time spent on medical versus pediatric dermatology, number of weekly acne patients, and percentage of total patients who are female. Medical school graduation year was a categorical variable and was categorized as prior to 1997 (when norgestimate–ethinyl estradiol was FDA approved for acne5) versus 1997 or later. Respondents’ practice states were analyzed according to US regions—Northeast, Midwest, South, West/Pacific—and population density (persons per square mile) using US Census Bureau data.15,16
Univariate logistic regressions modeling OCP prescribing probability were performed for each demographic variable; a multivariable logistic model was constructed including all variables significant at α=.20 from univariate modeling.
To compare frequent prescribers versus infrequent prescribers of DCOCPs, we included all respondents answering whether they frequently prescribe DCOCPs and whether they believed the risk for VTE associated with DCOCPs differed from other OCPs (n=68). A univariate logistic regression was performed to model the probability of responding “Yes, they pose a greater risk” versus any of the other 3 responses by whether or not the respondent frequently prescribed DCOCPs for acne, and an unadjusted odds ratio was obtained. All P values were 2-tailed with statistical significance evaluated at α=.05. Ninety-five percent confidence intervals were calculated to assess precision of obtained estimates. Analyses were performed using SAS software version 9.4.
Results
Demographics
Participant demographics as predictors of OCP prescription practices are described in Table 1.
Knowledge
Oral contraceptive pills were endorsed as effective in the treatment of acne in women by 95.4% (124/130) of respondents. Among prescribers of OCPs for acne, 94.2% (65/69) believed OCPs were associated with an increased risk for VTE, no respondents thought OCPs were associated with a decreased VTE risk, 2.9% (2/69) believed OCPs did not affect VTE risk, and 2.9% (2/69) were unsure.
Among prescribers of OCPs for acne, 46.4% (32/69) believed DCOCPs posed a greater VTE risk than other OCPs. Odds of this response did not differ with frequent DCOCP prescribers versus infrequent prescribers (odds ratio, 0.731 [95% confidence interval, 0.272-1.964]; P=.5342). Participant responses on VTE risk and DCOCPs are provided in Table 2.
Dermatologists prescribing OCPs for acne endorsed greater likelihood of doing so in cases of cyclical flares with menstrual cycle (94.2% [65/69]), acne unresponsive to conventional therapy (87.0% [60/69]), acne on the lower half of the face (78.3% [54/69]), diagnosis of polycystic ovary syndrome (PCOS)(76.8% [53/69]), clinical suspicion of PCOS (71.0% [49/69]), concomitant hirsutism (71.0% [49/69]), late- or adult-onset acne (66.7% [46/69]), laboratory evidence of hyperandrogenism (60.9% [42/69]), and concomitant androgenetic alopecia (49.3% [34/69]).
Among dermatologists who prescribed OCPs for acne, CDC-defined absolute contraindications identified correctly were blood pressure of 160/100 mm Hg (59.4% [41/69]) and history of migraine with focal neurologic symptoms (49.3% [34/69]). The CDC-defined relative contraindications identified correctly were history of deep vein thrombosis or pulmonary embolism (1.4% [1/69]), breast cancer history with 5 years of no disease (15.9% [11/69]), hyperlipidemia (42.0% [29/69]), and 36 years or older smoking fewer than 15 cigarettes per day (21.7% [15/69]).
Comfort
Dermatologist self-reported comfort levels in prescribing OCPs for acne are shown in Table 3.
Prescribing Practices
Among all respondents, acne medications prescribed often included oral antibiotics (76.9% [100/130]), isotretinoin (41.5% [54/130]), and spironolactone (40.8% [53/130]).
Overall, 55.4% (72/130) of respondents prescribed OCPs for the following uses: acne (95.8% [69/72]), concomitant treatment with teratogenic medication (48.6% [35/72]), PCOS (34.7% [25/72]), hirsutism (26.4% [19/72]), androgenetic alopecia (19.4% [14/72]), SAHA (seborrhea, acne, hirsutism, alopecia) syndrome (12.5% [9/72]), and HAIR-AN (hyperandrogenism, insulin resistance, acanthosis nigricans) syndrome (11.1% [8/72]). For teratogenic medications, dermatologists prescribing OCPs did so with isotretinoin (77.8% [56/72]), spironolactone (73.6% [53/72]), tetracycline antibiotics (37.5% [27/72]), and other (34.7% [25/72]).
Of dermatologists prescribing OCPs for acne, frequency included often (19% [13/69]), sometimes (45% [31/69]), and rarely (36% [25/69]). The most frequently prescribed OCPs included Ortho Tri-Cyclen (Janssen Pharmaceuticals, Inc)(80% [55/69]), Yaz (Bayer)(64% [44/69]), and Estrostep (Warner Chilcott)(19% [13/69]). Fill-in responses included Desogen (Merck & Co, Inc)(3/69 [4%]), Alesse (Wyeth Pharmaceuticals, Inc)(3/69 [4%]), Lutera (Watson Pharma, Inc)(1/69 [1%]), Loestrin (Warner Chilcott)(1/69 [1%]), and Yasmin (Bayer)(1/69 [1%]).
In univariate regressions, graduation from medical school in 1997 or later (P=.0416), academic practice setting (P=.0130), and low-density practice setting (P=.0034) were significant predictors of prescribing OCPs. In multivariable regression, only academic practice setting (P=.0295) and low-density practice setting (P=.0050) remained significant predictors. Demographic predictors are summarized in Table 1.
Comment
Our results suggest that most dermatologists (95.4%) believe OCPs effectively treat acne; however, only 54% of respondents reported prescribing them. Academic dermatologists were more likely to prescribe OCPs than nonacademic dermatologists, possibly indicating that academic dermatologists are more familiar with the literature on the efficacy and use of OCPs. Nearly half of respondents seeing 25 or more acne patients weekly did not prescribe OCPs, suggesting a notable practice gap. Dermatologists in less dense US regions were more likely to prescribe OCPs, perhaps because dermatologists may be more likely to prescribe OCPs than refer patients in health care access–limited areas, just as primary care providers treat a broader range of conditions in low-density rural areas than urban ones.17 Exploring all dermatologists’ referral patterns for OCPs is warranted.
A strong knowledge area revealed from this study was hormonal treatment of acne in women, a vital area because appropriate patient selection is key to treatment success.8 Weaker knowledge areas included OCP contraindications and differences in VTE risk between formulations containing drospirenone and those not containing drospirenone. Only half the sample identified CDC-defined absolute contraindications, suggesting an education target for dermatologists to ensure patient safety. In contrast, respondents were conservative about relative contraindications, with most identifying deep vein thrombosis or pulmonary embolism, remote breast cancer history, and light smoking at 36 years or older as absolute contraindications. These results could reflect weighing the risk of relative contraindications against the benefit in acne, resulting in appropriately more conservative management than overall guidelines suggest. If so, it may suggest that dermatologists are adapting overall guidelines appropriately for use of OCPs in skin conditions.
Nearly all respondents knew that OCPs are associated with an increased risk for VTE. Approximately half understood that DCOCPs are associated with a greater VTE risk than other OCPs, with no difference between frequent and infrequent prescribers. Comparing these results to the findings on OCP prescribing overall, some dermatologists’ risk-benefit calculation for VTE differs from other specialties because DCOCPs have superior efficacy in acne, whereas DCOCPs have similar contraceptive efficacy to other OCPs.18 The fact that more dermatologists believed VTE to be an absolute contraindication than hypertension suggests dermatologists have a heightened awareness of VTE risk but prescribe DCOCPs for acne despite it.
Most OCP prescribers felt very comfortable selecting good candidates for OCPs (55.5%) and counseling on treatment initiation (45.8%) and side effects (48.6%). Only 22.2%, by contrast, were very comfortable managing side effects. This finding likely reflects the notion that VTEs are not most appropriately managed by a dermatologist. Exploring if a greater comfort level in managing side effects would make dermatologists more likely to prescribe OCPs is worthwhile. Additionally, exploring why many dermatologists do not prescribe OCPs despite believing they are effective for acne is warranted.
Study limitations included the use of convenience sampling. Additionally, our study did not investigate dermatologists’ reasons for not prescribing OCPs.
Conclusion
This study demonstrates that dermatologists believe OCPs effectively treat acne in women and that most dermatologists prescribing OCPs do so for acne treatment. Academic practice setting was associated with higher odds of prescribing OCPs than a nonacademic setting, but the number of weekly acne patients did not impact the likelihood of prescribing OCPs, which suggests a treatment gap warranting education efforts for dermatologists in nonacademic settings seeing many acne patients. Our study also suggests that awareness of the increased risk for VTE associated with DCOCPs is not associated with lower likelihood of prescribing DCOCPs, suggesting dermatologists may find greater treatment efficacy to be worth the higher risk.
Acknowledgments
We are grateful to the Department of Dermatology at the Weill Cornell College of Medicine (New York, New York) for providing funding to complete this study. We also acknowledge Paul Christos, DrPH, MS (New York, New York), and Xuming Sun, MS (New York, New York), for their assistance with the survey design. We also are indebted to numerous dermatologic professional societies for allowing the survey to be distributed to their membership.
- Kim GK, Michaels BB. Post-adolescent acne in women: more common and more clinical considerations. J Drugs Dermatol. 2012;11:708-713.
- Arowojolu AO, Gallo MF, Lopez LM, et al. Combined oral contraceptive pills for treatment of acne. Cochrane Database Syst Rev. July 11, 2012:CD004425.
- Koo EB, Petersen TD, Kimball AB. Meta-analysis comparing efficacy of antibiotics versus oral contraceptives in acne vulgaris. J Am Acad Dermatol. 2014;71:450-459.
- Strauss JS, Krowchuk DP, Leyden JJ, et al; American Academy of Dermatology/American Academy of Dermatology Association. Guidelines of care for acne vulgaris management. J Am Acad Dermatol. 2007;56:651-663.
- Harper JC. Should dermatologists prescribe hormonal contraceptives for acne? Dermatol Ther. 2009;22:452-457.
- Landis ET, Levender MM, Davis SA, et al. Isotretinoin and oral contraceptive use in female acne patients varies by physician specialty: analysis of data from the National Ambulatory Medical Care Survey. J Dermatol Treat. 2012;23:272-277.
- Lam C, Zaenglein AL. Contraceptive use in acne. Clin Dermatol. 2014;32:502-515.
- Katsambas AD, Dessinioti C. Hormonal therapy for acne: why not as first line therapy? facts and controversies. Clin Dermatol. 2010;28:17-23.
- Dragoman MV. The combined oral contraceptive pill—recent developments, risks and benefits. Best Pract Res Clin Obstet Gynaecol. 2014;28:825-834.
- Thorneycroft IH, Gollnick H, Schellschmidt I. Superiority of a combined contraceptive containing drospirenone to a triphasic preparation containing norgestimate in acne treatment. Cutis. 2004;74:123-130.
- Mansour D, Verhoeven C, Sommer W, et al. Efficacy and tolerability of a monophasic combined oral contraceptive containing nomegestrol acetate and 17β-oestradiol in a 24/4 regimen, in comparison to an oral contraceptive containing ethinylestradiol and drospirenone in a 21/7 regimen. Eur J Contracept Reproduct Health Care. 2011;16:430-443.
- Wu CQ, Grandi SM, Filion KB, et al. Drospirenone-containing oral contraceptive pills and the risk of venous and arterial thrombosis: a systematic review. BJOG. 2013;120:801-810.
- Ziller M, Rashed AN, Ziller V, et al. The prescribing of contraceptives for adolescents in German gynecologic practices in 2007 and 2011: a retrospective database analysis. J Pediatr Adolesc Gynecol. 2013;26:261-264.
- Centers for Disease Control and Prevention. US medical eligibility criteria for contraceptive use, 2010. MMWR Recomm Rep. 2010;59(RR-4):1-86.
- United States Census Bureau. Census Regions and Divisions of the United States. New York, NY: United States Department of Commerce; 2010.
- Resident Population Data—Population Density, 1910 to 2010. U.S. Census Bureau; 2012. http ://www.census.gov/2010census/data/apportionment-dens-text.php. Accessed January 9, 2017.
- Reschovsky A, Zahner SJ. Forecasting the revenues of local public health departments in the shadows of the “Great Recession.” J Public Health Manag Pract. 2016;22:120-128.
- Klipping C, Duijkers I, Fortier MP, et al. Contraceptive efficacy and tolerability of ethinylestradiol 20 μg/drospirenone 3 mg in a flexible extended regimen: an open-label, multicentre, randomised, controlled study. J Fam Plann Reprod Health Care. 2012;38:73-83.
Practice Points
- In prior reports, oral contraceptive pills (OCPs) were found to be as effective as systemic antibiotics in reducing acne lesion counts at 6 months of treatment.
- Most dermatologists have prescribed OCPs and most believed they were an effective treatment for acne in women.
