User login
Dialing back opioids for chronic pain one conversation at a time
ABSTRACT
Purpose Our study examined the efficacy of a primary-care intervention in reducing opioid use among patients who have chronic non-cancer pain (CNCP). We also recorded the intervention’s effect on patients’ decisions to leave (or stay) with the primary-care practice.
Methods A family physician (FP) identified 41 patients in his practice who had CNCP of at least 6 month’s duration and were using opioids. The intervention with each patient involved an initial discussion of ethical principles, evidence-based practice, and current published guidelines. Following the discussion, patients self-selected to participate with their FP in a continuing tapering program or to accept referral to a pain center for management of their opioid medications. Tapering ranged from a 10% reduction per week to a more rapid 25% to 50% reduction every few days. Twenty-seven patients continued tapering with their FP, and 6 months later were retrospectively placed in the Taper Group. Fourteen patients chose not to pursue the tapering option and were referred to a single-modality medical pain clinic (MPC). All patients had the option of staying with the FP for other medical care.
Results At baseline and again at 6 months post-initial intervention, the MPC Group was taking significantly higher daily doses of morphine equivalents than the Taper Group. The Taper Group at 6 months was taking significantly lower average daily narcotic doses in morphine equivalents than at baseline. No significant baseline-to-6 month differences were found in the MPC Group. Contrary to many physicians’ fear of losing patients following candid discussions about opioid use, 40 of the 41 patients continued with the FP for other health needs.
Conclusions FPs can frankly discuss opioid use with their patients based on ethical principles and evidence-based recommendations and employ a tapering protocol consistent with current opioid treatment guidelines without jeopardizing the patient-physician relationship.
[polldaddy:10180698]
Opioid prescriptions for chronic noncancer pain (CNCP) have increased significantly over the past 25 years in the United States.1 Despite methodologic concerns surrounding research on opioid harms, prescription opioid misuse among CNCP patients is estimated to be 21% to 29% and prescription addiction 8% to 12%.2 Tragically, with the overall increase in opioid use for CNCP, substance-related hospital admissions and deaths due to opioid overdose have also risen.3
Increased opioid use began in 1985 when the World Health Organization expanded its ethical mandate for pain relief in dying patients to include relief from all cancer pain.3 Opioid use then accelerated following Portenoy and Foley’s 1986 article4 and the 1997 consensus statement by the American Academy of Pain Medicine (AAPM) and the American Pain Society (APS),5 with both organizations arguing that opioids have a role in the treatment of CNCP. Increased use of opioids for CNCP continued throughout the 1990s and 2000s, as many states passed legislation removing sanctions on prescribing long-term and high-dose opioid therapy, and pharmaceutical companies aggressively marketed sustained-release opioids.3
A balanced approach to opioids. While acknowledging the serious public health problems of drug abuse, addiction, and diversion of opioids from licit to illicit uses, clinical research and regulation leaders have called for a balanced approach that recognizes the legitimate medical need for opioids for CNCP. In 2009 the APS, in partnership with the AAPM, published evidence-based guidelines on chronic opioid therapy (COT) for adults with CNCP.6 In developing these guidelines, a multidisciplinary panel of experts conducted systematic reviews of available evidence and made recommendations on formulating COT for individuals, initiating and titrating therapy, regularly monitoring patients, and managing opioid-related adverse effects. Additional recommendations addressed the use of therapies focusing on psychosocial factors. The APS-AAPM guidelines received the highest rating in a systematic review critically appraising 13 guidelines that address the use of opioids for CNCP.7
Continue to: When opioid use is prolonged...
When opioid use is prolonged. Most primary care physicians are aware of the risks of prolonged opioid use, and many have successfully tapered or discontinued opioid medications for patients in acute or pre-chronic stages of pain.8 However, many physicians face the challenge of patients who have used COT for a longer time. The APS-AAPM guidelines may help primary care physicians at any stage of treating CNCP patients.
METHODS
Purpose and design. This retrospective study, which reviewed pretest-posttest findings between and within study groups, received an exempt status from Creighton University’s institutional review board. We designed the study to determine the efficacy of an intervention protocol to reduce opioid use by patients with CNCP who had been in a family physician (FP)'s panel for quite some time. Furthermore, because a common fear among primary care providers is that raising concerns with patients about their opioid use may cause those patients to leave their panel,9 our study also recorded how many patients stayed with their FP after initiation of the opioid management protocol.
Subjects. This study tracked 41 patients with CNCP in 1 FP’s panel. Inclusion criteria for participation was: 1) presence of CNCP for at least 6 months, 2) current use of opioid medication for CNCP, 3) age of at least 16 years, and 4) ability to read and write English. Two exclusion criteria were the presence of a surgically correctable condition or an organic brain syndrome or psychosis.
Clinical intervention. The FP identified eligible patients in his practice that were taking opioids for CNCP and initiated a discussion with each of them emphasizing his desire to follow the ethical principles of beneficence, nonmaleficence, respect for autonomy, and justice.10 The FP also presented his reasons for wanting the patient to stop using opioid medication. They included his beliefs that:
1) COT was not safe for the patient based on a growing body of published evidence of harm and death from COT3;
2) long-term use of opioids could lead to misuse, abuse, or addiction2;
3) prolonged opioid use paradoxically increases pain sensitivity that does not resolve
4) the patient’s current pain medications were not in line with published guidelines for use of opioids for CNCP.6
Initially, 45 patients were eligible for the study, but 4 declined participation before the intervention discussion and were immediately referred to a single-modality medical pain clinic (MPC). These patients were not included in subsequent analyses. Of the remaining 41 patients, all had a discussion with the MD about ethical principles, practice guidelines, and the importance of opioid tapering. After the discussion, patients decided whether to continue with the plan to taper their opioid therapy or to not taper their therapy and so receive a referral to an MPC.
Continue to: The 27 patients who chose to work with...
The 27 patients who chose to work with their FP started an individually tailored opioid-tapering program and were retrospectively placed in the Taper Group 6 months later. Tapering ranged from a slow 10% reduction in dosage per week to a more rapid 25% to 50% reduction every few days. Although evidence to guide specific recommendations on the rate of reduction is lacking, a slower rate may reduce unpleasant symptoms of opioid withdrawal.6 Following the patient-FP discussion, the 14 patients who chose not to pursue the tapering option were referred to an MPC for pain management, but could opt to remain with the FP for all other medical care. At 6 months post-discussion, we retrospectively assigned these 14 patients to the MPC Group.
Measures. We obtained demographic and medical information, including age, gender, race, marital status, and medication level in morphine equivalents, from the electronic health record. Medication level in morphine equivalents was recorded at the beginning of the intervention and again 6 months later. All analyses were conducted using SPSS Version 24 (IBM Corp, Armonk, NY) with P<.05 used to indicate statistical significance.
RESULTS
Between-group differences. The Taper and MPC groups did not differ significantly on demographic variables, with mean ages, respectively, at 57 and 51 years, sex 56% and 50% female, race 74% and 79% white, and marital status 48% and 50% married.
We found significant differences between the Taper and MPC groups on total daily dose in morphine equivalents at baseline and at 6 months following initial intervention. The Levene’s test for equality of variances was statistically significant, indicating unequal variances between the groups. In our SPSS analyses, we therefore used the option “equal variances not assumed.” TABLE 1 lists resultant means, standard deviations, individual sample t-test scores, and confidence intervals. The MPC Group was taking significantly higher daily doses of morphine equivalents than the Taper Group both at baseline and at 6 months following initial intervention.

Within-group differences. Paired sample t tests indicated significant differences between baseline and 6-month average daily narcotic doses in morphine equivalents for the Taper Group. No significant difference was found between baseline and 6-month daily morphine equivalents for the MPC group. These results indicated that patients who continued opioid tapering with the FP significantly reduced their daily morphine equivalents over the 6 months of the study. Patients in the MPC Group reduced morphine equivalents over the 6 months, but the reduction was not statistically significant. Paired sample t test results are presented in TABLE 2.

Continue to: Patient retention
Patient retention. All but one of the 41 patients in the Tapering and MPC groups continued with the FP for the remainder of their health care needs. Contrary to some physicians’ fears, the patients in this study maintained continuity with their FP.
DISCUSSION
Results of this study indicate that an intervention consisting of a physician-patient discussion of ethical principles and evidence-based practice, followed by individualized opioid tapering per published guidelines, led to a significant reduction in opioid use in patients with CNCP. The Taper Group, which completed the intervention, exhibited significant morphine reductions between baseline and 6-month follow-up. This did not hold true for the MPC Group.
The MPC Group, despite participating in the discussion with the FP, chose not to complete the tapering program and was referred to a single-modality MPC where opioids were managed rather than tapered. While the MPC group reduced daily opioid dose levels, the reduction was not statistically significant. A possible reason for no difference within the MPC Group may be that they had greater dependence on opioids, as their baseline average daily dose was much higher than that in the Taper Group (173 mg vs 31 mg, respectively). Although we did not assess anxiety directly, we speculate that the MPC Group was more anxious about opioid reduction than the Taper Group, and that this anxiety potentially led 4 patients to opt out of the initial FP discussion and 14 patients to self-select out of the tapering program following the discussion.
The FP intervention was successful for the Taper Group. For MPC patients, an enhanced intervention including behavior health strategies13 might have reduced anxiety and increased motivation14 to continue tapering. Based on moderate-quality evidence, APS-AAPM guidelines strongly recommend that CNCP be viewed as a complex biopsychosocial condition. Therefore, clinicians who prescribe opioids should routinely integrate psychotherapeutic interventions, functional restoration, interdisciplinary therapy, and other adjunctive nonopioid therapies.6
Opioid tapering within multidisciplinary rehabilitation programs is possible without significant worsening of pain, mood, and function.15 Recently, an outpatient opioid-tapering support intervention showed promise for efficacy in reducing prescription opioid doses without resultant increases in pain intensity or pain interference.16
Continue to: The tapering protocol in our study...
The tapering protocol in our study and the inclusion of behavioral health co-interventions are also recommended by the 2016 guidelines published by the Center for Disease Control and Prevention.17 More information on the similarities and differences among the various guidelines is available online.18,19
Caveats with our study. Patients’ entry into the Taper or MPC groups occurred through self-selection rather than random assignment. Thus, caution is recommended in interpreting findings of the FP intervention. And, we did not measure patients’ levels of pain, so differences between groups may have been possible. In addition, the number of patients per group was relatively small, which may have accounted for the lack of significance in the MPC Group findings. Conversely, significant reductions in opioid use in the small tapering sample suggests a relatively robust intervention, despite a lack of random assignment to treatment conditions.
These findings suggest that FPs can have a frank conversation about opioid use with their patients based on ethical principles and evidence-based practice, and employ a tapering protocol consistent with current opioid treatment guidelines. Furthermore, this approach appears not to jeopardize the patient-physician relationship.
CORRESPONDENCE
Thomas P. Guck, PhD, Creighton University School of Medicine, 2412 Cuming Street, Omaha, NE 68131; [email protected].
1. Manchikanti L, Helm S, Fellows B, et al. Opioid epidemic in the United States. Pain Physician. 2012;15:ES9-ES38.
2. Vowles KE, McEntee ML, Julnes PS, et al. Rates of opioid misuse, abuse, and addiction in chronic pain: a systematic review and data synthesis. Pain. 2015;156:569-576.
3. Sullivan MD, Howe CQ. Opioid therapy for chronic pain in the United States: promises and perils. Pain. 2013;154:S94-S100.
4. Portenoy RK, Foley KM. Chronic use of opioid analgesics in non-malignant pain: report of 38 cases. Pain. 1986;25:171-186.
5. The use of opioids for the treatment of chronic pain. A consensus statement from the American Academy of Pain Medicine and the American Pain Society. Clin J Pain. 1997;13:6-8.
6. Chou R, Fanciullo GJ, Fine PG, et al. Clinical guidelines for the use of chronic opioid therapy in chronic noncancer pain. J Pain. 2009;10:113-130.
7. Nuckols TK, Anderson L, Popescu I, et al. Opioid prescribing: a systematic review and critical appraisal of guidelines for chronic pain. Ann Intern Med. 2014;160:38-47.
8. Hwang CS, Turner LW, Kruszewski SP, et al. Primary care physicians’ knowledge and attitudes regarding prescription opioid abuse and diversion. Clin J Pain. 2016;279-284.
9. Top 15 challenges facing physicians in 2015. Medical Economics. http://www.medicaleconomics.com/medical-economics/news/top-15-challenges-facing-physicians-2015?page=0,12. Accessed October 18, 2018.
10. Kotalik J. Controlling pain and reducing misuse of opioids: ethical considerations. Can Fam Physician. 2012;58:381-385.
11. Angst MS, Clark JD. Opioid-induced hyperalgesia: a qualitative systematic review. Anesthesiology. 2006;104:570-587.
12. Wachholtz A, Gonzalez G. Co-morbid pain and opioid addiction: long term effect of opioid maintenance on acute pain. Drug Alcohol Depend. 2014;145:143-149.
13. Hunter CL, Goodie JL, Oordt MS, Dobmeyer AC. Integrated Behavioral Health in Primary Care. 2nd ed. Washington DC: American Psychological Association; 2017.
14. Miller WR, Rollnick S. Motivational Interviewing: Helping People Change. 3rd ed. New York, NY: The Guilford Press; 2013.
15. Townsend CO, Kerkvliet JL, Bruce BK, et al. A longitudinal study of the efficacy of a comprehensive pain rehabilitation program with opioid withdrawal: comparison of treatment outcomes based on opioid use status at admission. Pain. 2008;140:177-189.
16. Sullivan MD, Turner JA, DiLodovico C, et al. Prescription opioid taper support for outpatients with chronic pain: a randomized controlled trial. J Pain. 2017;18:308-318.
17. Dowell D, Haegerich TM, Chou R. CDC Guideline for prescribing opioids for chronic pain - United States, 2016. MMWR Recomm Rep. 2016;65:1-49.
18. Barth KS, Guille C, McCauley J, et al. Targeting practitioners: a review of guidelines, training, and policy in pain management. Drug Alcohol Depend. 2017;173:S22-S30.
19. CDC. Common Elements in Guidelines for Prescribing Opioids for Chronic Pain. Injury Prevention & Control: Prescription Drug Overdose 2016. http://www.cdc.gov/drugoverdose/prescribing/common-elements.html. Accessed October 18, 2018.
ABSTRACT
Purpose Our study examined the efficacy of a primary-care intervention in reducing opioid use among patients who have chronic non-cancer pain (CNCP). We also recorded the intervention’s effect on patients’ decisions to leave (or stay) with the primary-care practice.
Methods A family physician (FP) identified 41 patients in his practice who had CNCP of at least 6 month’s duration and were using opioids. The intervention with each patient involved an initial discussion of ethical principles, evidence-based practice, and current published guidelines. Following the discussion, patients self-selected to participate with their FP in a continuing tapering program or to accept referral to a pain center for management of their opioid medications. Tapering ranged from a 10% reduction per week to a more rapid 25% to 50% reduction every few days. Twenty-seven patients continued tapering with their FP, and 6 months later were retrospectively placed in the Taper Group. Fourteen patients chose not to pursue the tapering option and were referred to a single-modality medical pain clinic (MPC). All patients had the option of staying with the FP for other medical care.
Results At baseline and again at 6 months post-initial intervention, the MPC Group was taking significantly higher daily doses of morphine equivalents than the Taper Group. The Taper Group at 6 months was taking significantly lower average daily narcotic doses in morphine equivalents than at baseline. No significant baseline-to-6 month differences were found in the MPC Group. Contrary to many physicians’ fear of losing patients following candid discussions about opioid use, 40 of the 41 patients continued with the FP for other health needs.
Conclusions FPs can frankly discuss opioid use with their patients based on ethical principles and evidence-based recommendations and employ a tapering protocol consistent with current opioid treatment guidelines without jeopardizing the patient-physician relationship.
[polldaddy:10180698]
Opioid prescriptions for chronic noncancer pain (CNCP) have increased significantly over the past 25 years in the United States.1 Despite methodologic concerns surrounding research on opioid harms, prescription opioid misuse among CNCP patients is estimated to be 21% to 29% and prescription addiction 8% to 12%.2 Tragically, with the overall increase in opioid use for CNCP, substance-related hospital admissions and deaths due to opioid overdose have also risen.3
Increased opioid use began in 1985 when the World Health Organization expanded its ethical mandate for pain relief in dying patients to include relief from all cancer pain.3 Opioid use then accelerated following Portenoy and Foley’s 1986 article4 and the 1997 consensus statement by the American Academy of Pain Medicine (AAPM) and the American Pain Society (APS),5 with both organizations arguing that opioids have a role in the treatment of CNCP. Increased use of opioids for CNCP continued throughout the 1990s and 2000s, as many states passed legislation removing sanctions on prescribing long-term and high-dose opioid therapy, and pharmaceutical companies aggressively marketed sustained-release opioids.3
A balanced approach to opioids. While acknowledging the serious public health problems of drug abuse, addiction, and diversion of opioids from licit to illicit uses, clinical research and regulation leaders have called for a balanced approach that recognizes the legitimate medical need for opioids for CNCP. In 2009 the APS, in partnership with the AAPM, published evidence-based guidelines on chronic opioid therapy (COT) for adults with CNCP.6 In developing these guidelines, a multidisciplinary panel of experts conducted systematic reviews of available evidence and made recommendations on formulating COT for individuals, initiating and titrating therapy, regularly monitoring patients, and managing opioid-related adverse effects. Additional recommendations addressed the use of therapies focusing on psychosocial factors. The APS-AAPM guidelines received the highest rating in a systematic review critically appraising 13 guidelines that address the use of opioids for CNCP.7
Continue to: When opioid use is prolonged...
When opioid use is prolonged. Most primary care physicians are aware of the risks of prolonged opioid use, and many have successfully tapered or discontinued opioid medications for patients in acute or pre-chronic stages of pain.8 However, many physicians face the challenge of patients who have used COT for a longer time. The APS-AAPM guidelines may help primary care physicians at any stage of treating CNCP patients.
METHODS
Purpose and design. This retrospective study, which reviewed pretest-posttest findings between and within study groups, received an exempt status from Creighton University’s institutional review board. We designed the study to determine the efficacy of an intervention protocol to reduce opioid use by patients with CNCP who had been in a family physician (FP)'s panel for quite some time. Furthermore, because a common fear among primary care providers is that raising concerns with patients about their opioid use may cause those patients to leave their panel,9 our study also recorded how many patients stayed with their FP after initiation of the opioid management protocol.
Subjects. This study tracked 41 patients with CNCP in 1 FP’s panel. Inclusion criteria for participation was: 1) presence of CNCP for at least 6 months, 2) current use of opioid medication for CNCP, 3) age of at least 16 years, and 4) ability to read and write English. Two exclusion criteria were the presence of a surgically correctable condition or an organic brain syndrome or psychosis.
Clinical intervention. The FP identified eligible patients in his practice that were taking opioids for CNCP and initiated a discussion with each of them emphasizing his desire to follow the ethical principles of beneficence, nonmaleficence, respect for autonomy, and justice.10 The FP also presented his reasons for wanting the patient to stop using opioid medication. They included his beliefs that:
1) COT was not safe for the patient based on a growing body of published evidence of harm and death from COT3;
2) long-term use of opioids could lead to misuse, abuse, or addiction2;
3) prolonged opioid use paradoxically increases pain sensitivity that does not resolve
4) the patient’s current pain medications were not in line with published guidelines for use of opioids for CNCP.6
Initially, 45 patients were eligible for the study, but 4 declined participation before the intervention discussion and were immediately referred to a single-modality medical pain clinic (MPC). These patients were not included in subsequent analyses. Of the remaining 41 patients, all had a discussion with the MD about ethical principles, practice guidelines, and the importance of opioid tapering. After the discussion, patients decided whether to continue with the plan to taper their opioid therapy or to not taper their therapy and so receive a referral to an MPC.
Continue to: The 27 patients who chose to work with...
The 27 patients who chose to work with their FP started an individually tailored opioid-tapering program and were retrospectively placed in the Taper Group 6 months later. Tapering ranged from a slow 10% reduction in dosage per week to a more rapid 25% to 50% reduction every few days. Although evidence to guide specific recommendations on the rate of reduction is lacking, a slower rate may reduce unpleasant symptoms of opioid withdrawal.6 Following the patient-FP discussion, the 14 patients who chose not to pursue the tapering option were referred to an MPC for pain management, but could opt to remain with the FP for all other medical care. At 6 months post-discussion, we retrospectively assigned these 14 patients to the MPC Group.
Measures. We obtained demographic and medical information, including age, gender, race, marital status, and medication level in morphine equivalents, from the electronic health record. Medication level in morphine equivalents was recorded at the beginning of the intervention and again 6 months later. All analyses were conducted using SPSS Version 24 (IBM Corp, Armonk, NY) with P<.05 used to indicate statistical significance.
RESULTS
Between-group differences. The Taper and MPC groups did not differ significantly on demographic variables, with mean ages, respectively, at 57 and 51 years, sex 56% and 50% female, race 74% and 79% white, and marital status 48% and 50% married.
We found significant differences between the Taper and MPC groups on total daily dose in morphine equivalents at baseline and at 6 months following initial intervention. The Levene’s test for equality of variances was statistically significant, indicating unequal variances between the groups. In our SPSS analyses, we therefore used the option “equal variances not assumed.” TABLE 1 lists resultant means, standard deviations, individual sample t-test scores, and confidence intervals. The MPC Group was taking significantly higher daily doses of morphine equivalents than the Taper Group both at baseline and at 6 months following initial intervention.
Within-group differences. Paired sample t tests indicated significant differences between baseline and 6-month average daily narcotic doses in morphine equivalents for the Taper Group. No significant difference was found between baseline and 6-month daily morphine equivalents for the MPC group. These results indicated that patients who continued opioid tapering with the FP significantly reduced their daily morphine equivalents over the 6 months of the study. Patients in the MPC Group reduced morphine equivalents over the 6 months, but the reduction was not statistically significant. Paired sample t test results are presented in TABLE 2.
Continue to: Patient retention
Patient retention. All but one of the 41 patients in the Tapering and MPC groups continued with the FP for the remainder of their health care needs. Contrary to some physicians’ fears, the patients in this study maintained continuity with their FP.
DISCUSSION
Results of this study indicate that an intervention consisting of a physician-patient discussion of ethical principles and evidence-based practice, followed by individualized opioid tapering per published guidelines, led to a significant reduction in opioid use in patients with CNCP. The Taper Group, which completed the intervention, exhibited significant morphine reductions between baseline and 6-month follow-up. This did not hold true for the MPC Group.
The MPC Group, despite participating in the discussion with the FP, chose not to complete the tapering program and was referred to a single-modality MPC where opioids were managed rather than tapered. While the MPC group reduced daily opioid dose levels, the reduction was not statistically significant. A possible reason for no difference within the MPC Group may be that they had greater dependence on opioids, as their baseline average daily dose was much higher than that in the Taper Group (173 mg vs 31 mg, respectively). Although we did not assess anxiety directly, we speculate that the MPC Group was more anxious about opioid reduction than the Taper Group, and that this anxiety potentially led 4 patients to opt out of the initial FP discussion and 14 patients to self-select out of the tapering program following the discussion.
The FP intervention was successful for the Taper Group. For MPC patients, an enhanced intervention including behavior health strategies13 might have reduced anxiety and increased motivation14 to continue tapering. Based on moderate-quality evidence, APS-AAPM guidelines strongly recommend that CNCP be viewed as a complex biopsychosocial condition. Therefore, clinicians who prescribe opioids should routinely integrate psychotherapeutic interventions, functional restoration, interdisciplinary therapy, and other adjunctive nonopioid therapies.6
Opioid tapering within multidisciplinary rehabilitation programs is possible without significant worsening of pain, mood, and function.15 Recently, an outpatient opioid-tapering support intervention showed promise for efficacy in reducing prescription opioid doses without resultant increases in pain intensity or pain interference.16
Continue to: The tapering protocol in our study...
The tapering protocol in our study and the inclusion of behavioral health co-interventions are also recommended by the 2016 guidelines published by the Center for Disease Control and Prevention.17 More information on the similarities and differences among the various guidelines is available online.18,19
Caveats with our study. Patients’ entry into the Taper or MPC groups occurred through self-selection rather than random assignment. Thus, caution is recommended in interpreting findings of the FP intervention. And, we did not measure patients’ levels of pain, so differences between groups may have been possible. In addition, the number of patients per group was relatively small, which may have accounted for the lack of significance in the MPC Group findings. Conversely, significant reductions in opioid use in the small tapering sample suggests a relatively robust intervention, despite a lack of random assignment to treatment conditions.
These findings suggest that FPs can have a frank conversation about opioid use with their patients based on ethical principles and evidence-based practice, and employ a tapering protocol consistent with current opioid treatment guidelines. Furthermore, this approach appears not to jeopardize the patient-physician relationship.
CORRESPONDENCE
Thomas P. Guck, PhD, Creighton University School of Medicine, 2412 Cuming Street, Omaha, NE 68131; [email protected].
1. Manchikanti L, Helm S, Fellows B, et al. Opioid epidemic in the United States. Pain Physician. 2012;15:ES9-ES38.
2. Vowles KE, McEntee ML, Julnes PS, et al. Rates of opioid misuse, abuse, and addiction in chronic pain: a systematic review and data synthesis. Pain. 2015;156:569-576.
3. Sullivan MD, Howe CQ. Opioid therapy for chronic pain in the United States: promises and perils. Pain. 2013;154:S94-S100.
4. Portenoy RK, Foley KM. Chronic use of opioid analgesics in non-malignant pain: report of 38 cases. Pain. 1986;25:171-186.
5. The use of opioids for the treatment of chronic pain. A consensus statement from the American Academy of Pain Medicine and the American Pain Society. Clin J Pain. 1997;13:6-8.
6. Chou R, Fanciullo GJ, Fine PG, et al. Clinical guidelines for the use of chronic opioid therapy in chronic noncancer pain. J Pain. 2009;10:113-130.
7. Nuckols TK, Anderson L, Popescu I, et al. Opioid prescribing: a systematic review and critical appraisal of guidelines for chronic pain. Ann Intern Med. 2014;160:38-47.
8. Hwang CS, Turner LW, Kruszewski SP, et al. Primary care physicians’ knowledge and attitudes regarding prescription opioid abuse and diversion. Clin J Pain. 2016;279-284.
9. Top 15 challenges facing physicians in 2015. Medical Economics. http://www.medicaleconomics.com/medical-economics/news/top-15-challenges-facing-physicians-2015?page=0,12. Accessed October 18, 2018.
10. Kotalik J. Controlling pain and reducing misuse of opioids: ethical considerations. Can Fam Physician. 2012;58:381-385.
11. Angst MS, Clark JD. Opioid-induced hyperalgesia: a qualitative systematic review. Anesthesiology. 2006;104:570-587.
12. Wachholtz A, Gonzalez G. Co-morbid pain and opioid addiction: long term effect of opioid maintenance on acute pain. Drug Alcohol Depend. 2014;145:143-149.
13. Hunter CL, Goodie JL, Oordt MS, Dobmeyer AC. Integrated Behavioral Health in Primary Care. 2nd ed. Washington DC: American Psychological Association; 2017.
14. Miller WR, Rollnick S. Motivational Interviewing: Helping People Change. 3rd ed. New York, NY: The Guilford Press; 2013.
15. Townsend CO, Kerkvliet JL, Bruce BK, et al. A longitudinal study of the efficacy of a comprehensive pain rehabilitation program with opioid withdrawal: comparison of treatment outcomes based on opioid use status at admission. Pain. 2008;140:177-189.
16. Sullivan MD, Turner JA, DiLodovico C, et al. Prescription opioid taper support for outpatients with chronic pain: a randomized controlled trial. J Pain. 2017;18:308-318.
17. Dowell D, Haegerich TM, Chou R. CDC Guideline for prescribing opioids for chronic pain - United States, 2016. MMWR Recomm Rep. 2016;65:1-49.
18. Barth KS, Guille C, McCauley J, et al. Targeting practitioners: a review of guidelines, training, and policy in pain management. Drug Alcohol Depend. 2017;173:S22-S30.
19. CDC. Common Elements in Guidelines for Prescribing Opioids for Chronic Pain. Injury Prevention & Control: Prescription Drug Overdose 2016. http://www.cdc.gov/drugoverdose/prescribing/common-elements.html. Accessed October 18, 2018.

Barriers to Early Hospital Discharge: A Cross-Sectional Study at Five Academic Hospitals
Hospital discharges frequently occur in the afternoon or evening hours.1-5 Late discharges can adversely affect patient flow throughout the hospital,3,6-9 which, in turn, can result in delays in care,10-16 more medication errors,17 increased mortality,18-20 longer lengths of stay,20-22 higher costs,23 and lower patient satisfaction.24
Various interventions have been employed in the attempts to find ways of moving discharge times to earlier in the day, including preparing the discharge paperwork and medications the previous night,25 using checklists,1,25 team huddles,2 providing real-time feedback to unit staff,1 and employing multidisciplinary teamwork.1,2,6,25,26
The purpose of this study was to identify and determine the relative frequency of barriers to writing discharge orders in the hopes of identifying issues that might be addressed by targeted interventions. We also assessed the effects of daily team census, patients being on teaching versus nonteaching services, and how daily rounds were structured at the time that the discharge orders were written.
METHODS
Study Design, Setting, and Participants
We conducted a prospective, cross-sectional survey of house-staff and attending physicians on general medicine teaching and nonteaching services from November 13, 2014, through May 31, 2016. The study was conducted at the following five hospitals: Denver Health Medical Center (DHMC) and Presbyterian/Saint Luke’s Medical Center (PSL) in Denver, Colorado; Ronald Reagan University (UCLA) and Los Angeles County/University of Southern California Medical Center (LAC+USC) in Los Angeles, California; and Harborview Medical Center (HMC) in Seattle, Washington. The study was approved by the Colorado Multi-Institutional Review Board as well as by the review boards of the other participating sites.
Data Collection
The results of the focus groups composed of attending physicians at DHMC were used to develop our initial data collection template. Additional sites joining the study provided feedback, leading to modifications (Appendix 1).
Physicians were surveyed at three different time points on study days that were selected according to the convenience of the investigators. The sampling occurred only on weekdays and was done based on the investigators’ availability. Investigators would attempt to survey as many teams as they were able to but, secondary to feasibility, not all teams could be surveyed on study days. The specific time points varied as a function of physician workflows but were standardized as much as possible to occur in the early morning, around noon, and midafternoon on weekdays. Physicians were contacted either in person or by telephone for verbal consent prior to administering the first survey. All general medicine teams were eligible. For teaching teams, the order of contact was resident, intern, and then attending based on which physician was available at the time of the survey and on which member of the team was thought to know the patients the best. For the nonteaching services, the attending physicians were contacted.
During the initial survey, the investigators assessed the provider role (ie, attending or housestaff), whether the service was a teaching or a nonteaching service, and the starting patient census on that service primarily based on interviewing the provider of record for the team and looking at team census lists. Physicians were asked about their rounding style (ie, sickest patients first, patients likely to be discharged first, room-by-room, most recently admitted patients first, patients on the team the longest, or other) and then to identify all patients they thought would be definite discharges sometime during the day of the survey. Definite discharges were defined as patients whom the provider thought were either currently ready for discharge or who had only minor barriers that, if unresolved, would not prevent same-day discharge. They were asked if the discharge order had been entered and, if not, what was preventing them from doing so, if the discharge could in their opinion have occurred the day prior and, if so, why this did not occur. We also obtained the date and time of the admission and discharge orders, the actual discharge time, as well as the length of stay either through chart review (majority of sites) or from data warehouses (Denver Health and Presbyterian St. Lukes had length of stay data retrieved from their data warehouse).
Physicians were also asked to identify all patients whom they thought might possibly be discharged that day. Possible discharges were defined as patients with barriers to discharge that, if unresolved, would prevent same-day discharge. For each of these, the physicians were asked to list whatever issues needed to be resolved prior to placing the discharge order (Appendix 1).
The second survey was administered late morning on the same day, typically between 11
The third survey was administered midafternoon, typically around 3 PM similar to the first two surveys, with the exception that the third survey did not attempt to identify new definite or possible discharges.
Sample Size
We stopped collecting data after obtaining a convenience sample of 5% of total discharges at each study site or on the study end date, which was May 31, 2016, whichever came first.
Data Analysis
Data were collected and managed using a secure, web-based application electronic data capture tool (REDCap), hosted at Denver Health. REDCap (Research Electronic Data Capture, Nashville, Tennessee) is designed to support data collection for research studies.27 Data were then analyzed using SAS Enterprise Guide 5.1 (SAS Institute, Inc., Cary, North Carolina). All data entered into REDCap were reviewed by the principal investigator to ensure that data were not missing, and when there were missing data, a query was sent to verify if the data were retrievable. If retrievable, then the data would be entered. The volume of missing data that remained is described in our results.
Continuous variables were described using means and standard deviations (SD) or medians and interquartile ranges (IQR) based on tests of normality. Differences in the time that the discharge orders were placed in the electronic medical record according to morning patient census, teaching versus nonteaching service, and rounding style were compared using the Wilcoxon rank sum test. Linear regression was used to evaluate the effect of patient census on discharge order time. P < .05 was considered as significant.
RESULTS
We conducted 1,584 patient evaluations through surveys of 254 physicians over 156 days. Given surveys coincided with the existing work we had full participation (ie, 100% participation) and no dropout during the study days. Median (IQR) survey time points were 8:30
The characteristics of the five hospitals participating in the study, the patients’ final discharge status, the types of physicians surveyed, the services on which they were working, the rounding styles employed, and the median starting daily census are summarized in Table 1. The majority of the physicians surveyed were housestaff working on teaching services, and only a small minority structured rounds such that patients ready for discharge were seen first.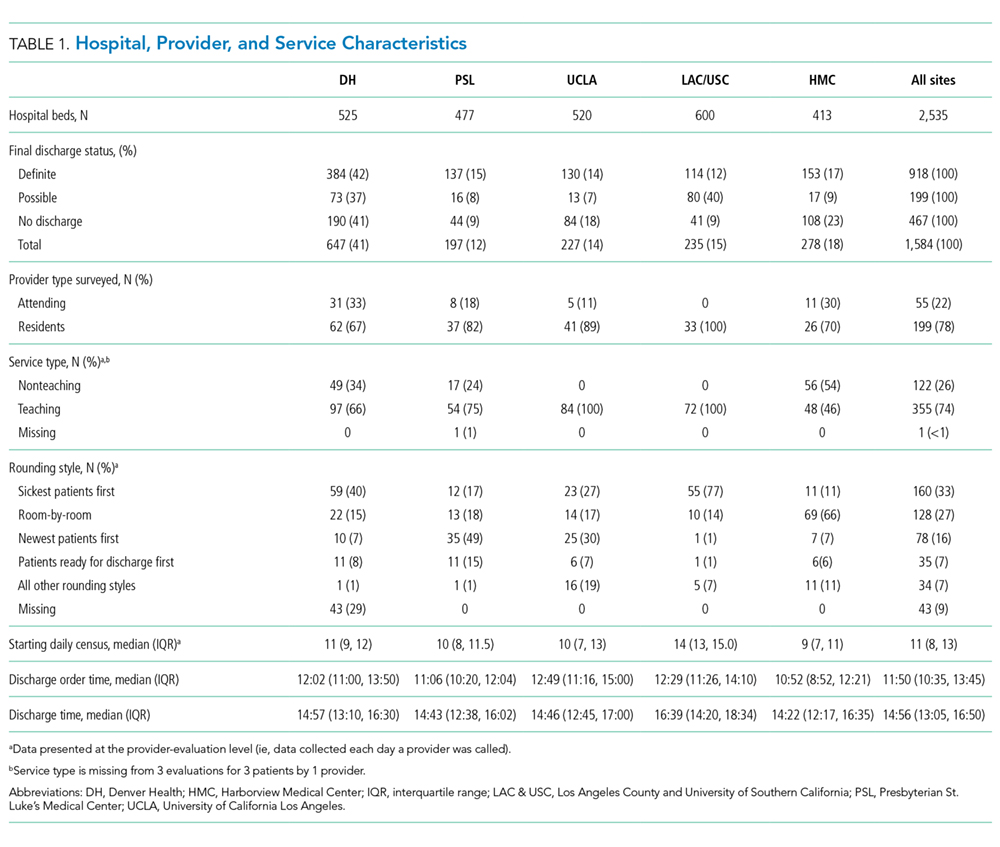
Over the course of the three surveys, 949 patients were identified as being definite discharges at any time point, and the large majority of these (863, 91%) were discharged on the day of the survey. The median (IQR) time that the discharge orders were written was 11:50
During the initial morning survey, 314 patients were identified as being definite discharges for that day (representing approximately 6% of the total number of patients being cared for, or 33% of the patients identified as definite discharges throughout the day). Of these, the physicians thought that 44 (<1% of the total number of patients being cared for on the services) could have been discharged on the previous day. The most frequent reasons cited for why these patients were not discharged on the previous day were “Patient did not want to leave” (n = 15, 34%), “Too late in the day” (n = 10, 23%), and “No ride” (n = 9, 20%). The remaining 10 patients (23%) had a variety of reasons related to system or social issues (ie, shelter not available, miscommunication).
At the morning time point, the most common barriers to discharge identified were that the physicians had not finished rounding on their team of patients and that the housestaff needed to staff their patients with their attending. At noon, caring for other patients and tending to the discharge processes were most commonly cited, and in the afternoon, the most common barriers were that the physicians were in the process of completing the discharge paperwork for those patients or were discharging other patients (Table 2). When comparing barriers on teaching to nonteaching teams, a higher proportion of teaching teams were still rounding on all patients and were working on discharge paperwork at the second survey. Barriers cited by sites were similar; however, the frequency at which the barriers were mentioned varied (data not shown).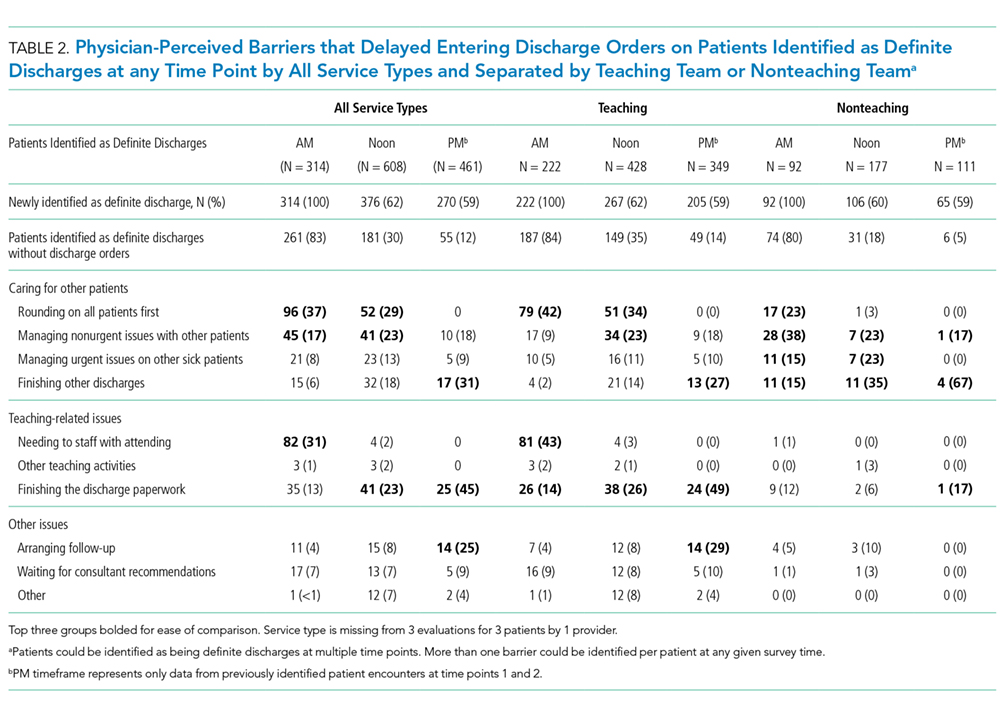
The physicians identified 1,237 patients at any time point as being possible discharges during the day of the survey and these had a mean (±SD) of 1.3 (±0.5) barriers cited for why these patients were possible rather than definite discharges. The most common were that clinical improvement was needed, one or more pending issues related to their care needed to be resolved, and/or awaiting pending test results. The need to see clinical improvement generally decreased throughout the day as did the need to staff patients with an attending physician, but barriers related to consultant recommendations or completing procedures increased (Table 3). Of the 1,237 patients ever identified as possible discharges, 594 (48%) became a definite discharge by the third call and 444 (36%) became a no discharge as their final status. As with definite discharges, barriers cited by sites were similar; however, the frequency at which the barriers were mentioned varied.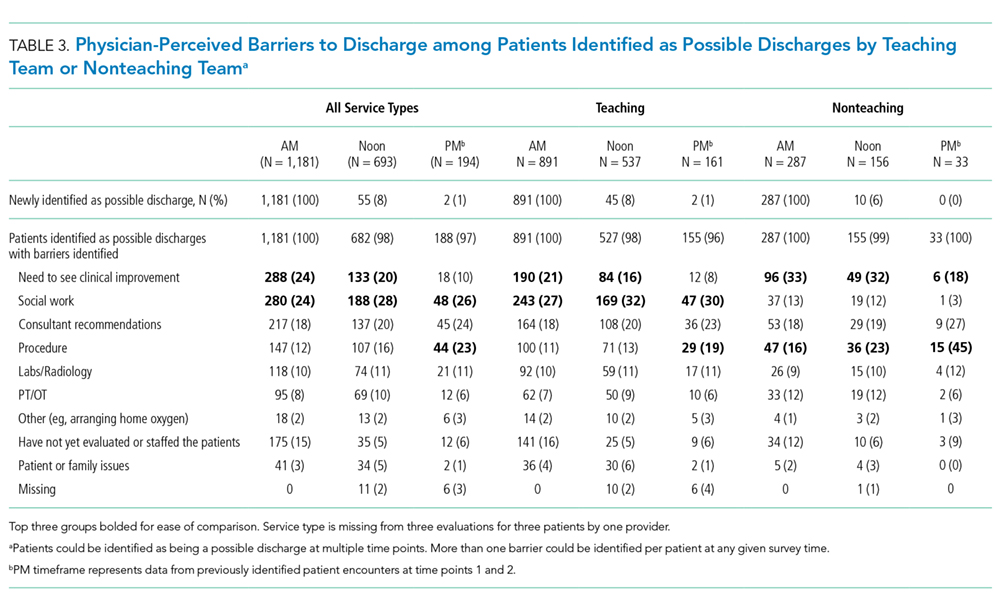
Among the 949 and 1,237 patients who were ever identified as definite or possible discharges, respectively, at any time point during the study day, 28 (3%) and 444 (36%), respectively, had their discharge status changed to no discharge, most commonly because their clinical condition either worsened or expected improvements did not occur or that barriers pertaining to social work, physical therapy, or occupational therapy were not resolved.
The median time that the discharge orders were entered into the electronic medical record was 43 minutes earlier if patients were on teams with a lower versus a higher starting census (P = .0003), 48 minutes earlier if they were seen by physicians whose rounding style was to see patients first who potentially could be discharged (P = .0026), and 58 minutes earlier if they were on nonteaching versus teaching services (P < .0001; Table 4). For every one-person increase in census, the discharge order time increased by 6 minutes (β = 5.6, SE = 1.6, P = .0003).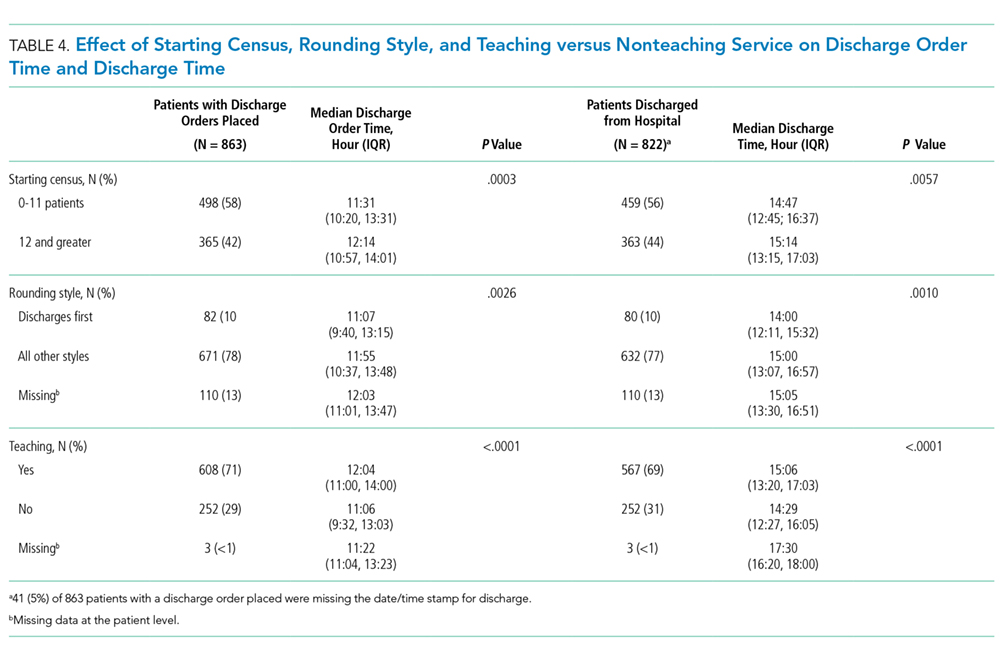
DISCUSSION
The important findings of this study are that (1) the large majority of issues thought to delay discharging patients identified as definite discharges were related to physicians caring for other patients on their team, (2) although 91% of patients ever identified as being definite discharges were discharged on the day of the survey, only 48% of those identified as possible discharges became definite discharges by the afternoon time point, largely because the anticipated clinical improvement did not occur or care being provided by ancillary services had not been completed, and (3) discharge orders on patients identified as definite discharges were written on average 50 minutes earlier by physicians on teams with a smaller starting patient census, on nonteaching services, or when the rounding style was to see patients ready for discharges first.
Previous research has reported that physician-perceived barriers to discharge were extrinsic to providers and even extrinsic to the hospital setting (eg, awaiting subacute nursing placement and transportation).28,29 However, many of the barriers that we identified were related directly to the providers’ workload and rounding styles and whether the patients were on teaching versus nonteaching services. We also found that delays in the ability of hospital services to complete care also contributed to delayed discharges.
Our observational data suggest that delays resulting from caring for other patients might be reduced by changing rounding styles such that patients ready for discharge are seen first and are discharged prior to seeing other patients on the team, as previously reported by Beck et al.30 Intuitively, this would seem to be a straightforward way of freeing up beds earlier in the day, but such a change will, of necessity, lead to delaying care for other patients, which, in turn, could increase their length of stays. Durvasula et al. suggested that discharges could be moved to earlier in the day by completing orders and paperwork the day prior to discharge.25 Such an approach might be effective on an Obstetrical or elective Orthopedic service on which patients predictably are hospitalized for a fixed number of days (or even hours) but may be less relevant to patients on internal medicine services where lengths of stay are less predictable. Interventions to improve discharge times have resulted in earlier discharge times in some studies,2,4 but the overall length of stay either did not decrease25 or increased31 in others. Werthheimer et al.1 did find earlier discharge times, but other interventions also occurred during the study period (eg, extending social work services to include weekends).1,32
We found that discharge times were approximately 50 minutes earlier on teams with a smaller starting census, on nonteaching compared with teaching services, or when the attending’s rounding style was to see patients ready for discharges first. Although 50 minutes may seem like a small change in discharge time, Khanna et al.33 found that when discharges occur even 1 hour earlier, hospital overcrowding is reduced. To have a lower team census would require having more teams and more providers to staff these teams, raising cost-effectiveness concerns. Moving to more nonteaching services could represent a conflict with respect to one of the missions of teaching hospitals and raises a cost-benefit issue as several teaching hospitals receive substantial funding in support of their teaching activities and housestaff would have to be replaced with more expensive providers.
Delays attributable to ancillary services indicate imbalances between demand and availability of these services. Inappropriate demand and inefficiencies could be reduced by systems redesign, but in at least some instances, additional resources will be needed to add staff, increase space, or add additional equipment.
Our study has several limitations. First, we surveyed only physicians working in university-affiliated hospitals, and three of these were public safety-net hospitals. Accordingly, our results may not be generalizable to different patient populations. Second, we surveyed only physicians, and Minichiello et al.29 found that barriers to discharge perceived by physicians were different from those of other staff. Third, our data were observational and were collected only on weekdays. Fourth, we did not differentiate interns from residents, and thus, potentially the level of training could have affected these results. Similarly, the decision for a “possible” and a “definite” discharge is likely dependent on the knowledge base of the participant, such that less experienced participants may have had differing perspectives than someone with more experience. Fifth, the sites did vary based on the infrastructure and support but also had several similarities. All sites had social work and case management involved in care, although at some sites, they were assigned according to team and at others according to geographic location. Similarly, rounding times varied. Most of the services surveyed did not utilize advanced practice providers (the exception was the nonteaching services at Denver Health, and their presence was variable). These differences in staffing models could also have affected these results.
Our study also has a number of strengths. First, we assessed the barriers at five different hospitals. Second, we collected real-time data related to specific barriers at multiple time points throughout the day, allowing us to assess the dynamic nature of identifying patients as being ready or nearly ready for discharge. Third, we assessed the perceptions of barriers to discharge from physicians working on teaching as well as nonteaching services and from physicians utilizing a variety of rounding styles. Fourth, we had a very high participation rate (100%), probably due to the fact that our study was strategically aligned with participants’ daily work activities.
In conclusion, we found two distinct categories of issues that physicians perceived as most commonly delaying writing discharge orders on their patients. The first pertained to patients thought to definitely be ready for discharge and was related to the physicians having to care for other patients on their team. The second pertained to patients identified as possibly ready for discharge and was related to the need for care to be completed by a variety of ancillary services. Addressing each of these barriers would require different interventions and a need to weigh the potential improvements that could be achieved against the increased costs and/or delays in care for other patients that may result.
Disclosures
The authors report no conflicts of interest relevant to this work.
1. Wertheimer B, Jacobs RE, Bailey M, et al. Discharge before noon: an achievable hospital goal. J Hosp Med. 2014;9(4):210-214. doi: 10.1002/jhm.2154. PubMed
2. Kane M, Weinacker A, Arthofer R, et al. A multidisciplinary initiative to increase inpatient discharges before noon. J Nurs Adm. 2016;46(12):630-635. doi: 10.1097/NNA.0000000000000418. PubMed
3. Khanna S, Sier D, Boyle J, Zeitz K. Discharge timeliness and its impact on hospital crowding and emergency department flow performance. Emerg Med Australas. 2016;28(2):164-170. doi: 10.1111/1742-6723.12543. PubMed
4. Kravet SJ, Levine RB, Rubin HR, Wright SM. Discharging patients earlier in the day: a concept worth evaluating. Health Care Manag (Frederick). 2007;26:142-146. doi: 10.1097/01.HCM.0000268617.33491.60. PubMed
5. Khanna S, Boyle J, Good N, Lind J. Impact of admission and discharge peak times on hospital overcrowding. Stud Health Technol Inform. 2011;168:82-88. doi: 10.3233/978-1-60750-791-8-82. PubMed
6. McGowan JE, Truwit JD, Cipriano P, et al. Operating room efficiency and hospital capacity: factors affecting operating room use during maximum hospital census. J Am Coll Surg. 2007;204(5):865-871; discussion 71-72. doi: 10.1016/j.jamcollsurg.2007.01.052 PubMed
7. Khanna S, Boyle J, Good N, Lind J. Early discharge and its effect on ED length of stay and access block. Stud Health Technol Inform. 2012;178:92-98. doi: 10.3233/978-1-61499-078-9-92 PubMed
8. Powell ES, Khare RK, Venkatesh AK, Van Roo BD, Adams JG, Reinhardt G. The relationship between inpatient discharge timing and emergency department boarding. J Emerg Med. 2012;42(2):186-196. doi: 10.1016/j.jemermed.2010.06.028. PubMed
9. Wertheimer B, Jacobs RE, Iturrate E, Bailey M, Hochman K. Discharge before noon: Effect on throughput and sustainability. J Hosp Med. 2015;10(10):664-669. doi: 10.1002/jhm.2412. PubMed
10. Sikka R, Mehta S, Kaucky C, Kulstad EB. ED crowding is associated with an increased time to pneumonia treatment. Am J Emerg Med. 2010;28(7):809-812. doi: 10.1016/j.ajem.2009.06.023. PubMed
11. Coil CJ, Flood JD, Belyeu BM, Young P, Kaji AH, Lewis RJ. The effect of emergency department boarding on order completion. Ann Emerg Med. 2016;67:730-736 e2. doi: 10.1016/j.annemergmed.2015.09.018. PubMed
12. Gaieski DF, Agarwal AK, Mikkelsen ME, et al. The impact of ED crowding on early interventions and mortality in patients with severe sepsis. Am J Emerg Med. 2017;35:953-960. doi: 10.1016/j.ajem.2017.01.061. PubMed
13. Pines JM, Localio AR, Hollander JE, et al. The impact of emergency department crowding measures on time to antibiotics for patients with community-acquired pneumonia. Ann Emerg Med. 2007;50(5):510-516. doi: 10.1016/j.annemergmed.2007.07.021. PubMed
14. Hwang U, Richardson L, Livote E, Harris B, Spencer N, Sean Morrison R. Emergency department crowding and decreased quality of pain care. Acad Emerg Med. 2008;15:1248-1255. doi: 10.1111/j.1553-2712.2008.00267.x. PubMed
15. Mills AM, Shofer FS, Chen EH, Hollander JE, Pines JM. The association between emergency department crowding and analgesia administration in acute abdominal pain patients. Acad Emerg Med. 2009;16:603-608. doi: 10.1111/j.1553-2712.2009.00441.x. PubMed
16. Pines JM, Shofer FS, Isserman JA, Abbuhl SB, Mills AM. The effect of emergency department crowding on analgesia in patients with back pain in two hospitals. Acad Emerg Med. 2010;17(3):276-283. doi: 10.1111/j.1553-2712.2009.00676.x. PubMed
17. Kulstad EB, Sikka R, Sweis RT, Kelley KM, Rzechula KH. ED overcrowding is associated with an increased frequency of medication errors. Am J Emerg Med. 2010;28:304-309. doi: 10.1016/j.ajem.2008.12.014. PubMed
18. Richardson DB. Increase in patient mortality at 10 days associated with emergency department overcrowding. Med J Aust. 2006;184(5):213-216. PubMed
19. Hoot NR, Aronsky D. Systematic review of emergency department crowding: causes, effects, and solutions. Ann Emerg Med. 2008;52(2):126-136. doi: 10.1016/j.annemergmed.2008.03.014. PubMed
20. Singer AJ, Thode HC, Jr., Viccellio P, Pines JM. The association between length of emergency department boarding and mortality. Acad Emerg Med. 2011;18(12):1324-1329. doi: 10.1111/j.1553-2712.2011.01236.x. PubMed
21. White BA, Biddinger PD, Chang Y, Grabowski B, Carignan S, Brown DF. Boarding inpatients in the emergency department increases discharged patient length of stay. J Emerg Med. 2013;44(1):230-235. doi: 10.1016/j.jemermed.2012.05.007. PubMed
22. Forster AJ, Stiell I, Wells G, Lee AJ, van Walraven C. The effect of hospital occupancy on emergency department length of stay and patient disposition. Acad Emerg Med. 2003;10(2):127-133. doi: 10.1197/aemj.10.2.127. PubMed
23. Foley M, Kifaieh N, Mallon WK. Financial impact of emergency department crowding. West J Emerg Med. 2011;12(2):192-197. PubMed
24. Pines JM, Iyer S, Disbot M, Hollander JE, Shofer FS, Datner EM. The effect of emergency department crowding on patient satisfaction for admitted patients. Acad Emerg Med. 2008;15(9):825-831. doi: 10.1111/j.1553-2712.2008.00200.x. PubMed
25. Durvasula R, Kayihan A, Del Bene S, et al. A multidisciplinary care pathway significantly increases the number of early morning discharges in a large academic medical center. Qual Manag Health Care. 2015;24:45-51. doi: 10.1097/QMH.0000000000000049. PubMed
26. Cho HJ, Desai N, Florendo A, et al. E-DIP: Early Discharge Project. A Model for Throughput and Early Discharge for 1-Day Admissions. BMJ Qual Improv Rep. 2016;5(1): pii: u210035.w4128. doi: 10.1136/bmjquality.u210035.w4128. PubMed
27. Harris PA, Taylor R, Thielke R, Payne J, Gonzalez N, Conde JG. Research electronic data capture (REDCap)--a metadata-driven methodology and workflow process for providing translational research informatics support. J Biomed Inform. 2009;42(2):377-381. doi: 10.1016/j.jbi.2008.08.010. PubMed
28. Patel H, Fang MC, Mourad M, et al. Hospitalist and internal medicine leaders’ perspectives of early discharge challenges at academic medical centers. J Hosp Med. 2018;13(6):388-391. doi: 10.12788/jhm.2885. PubMed
29. Minichiello TM, Auerbach AD, Wachter RM. Caregiver perceptions of the reasons for delayed hospital discharge. Eff Clin Pract. 2001;4(6):250-255. PubMed
30. Beck MJ, Okerblom D, Kumar A, Bandyopadhyay S, Scalzi LV. Lean intervention improves patient discharge times, improves emergency department throughput and reduces congestion. Hosp Pract (1995). 2016;44(5):252-259. doi: 10.1080/21548331.2016.1254559. PubMed
31. Rajkomar A, Valencia V, Novelero M, Mourad M, Auerbach A. The association between discharge before noon and length of stay in medical and surgical patients. J Hosp Med. 2016;11(12):859-861. doi: 10.1002/jhm.2529. PubMed
32. Shine D. Discharge before noon: an urban legend. Am J Med. 2015;128(5):445-446. doi: 10.1016/j.amjmed.2014.12.011. PubMed 33. Khanna S, Boyle J, Good N, Lind J. Unravelling relationships: Hospital occupancy levels, discharge timing and emergency department access block. Emerg Med Australas. 2012;24(5):510-517. doi: 10.1111/j.1742-6723.2012.01587.x. PubMed
Hospital discharges frequently occur in the afternoon or evening hours.1-5 Late discharges can adversely affect patient flow throughout the hospital,3,6-9 which, in turn, can result in delays in care,10-16 more medication errors,17 increased mortality,18-20 longer lengths of stay,20-22 higher costs,23 and lower patient satisfaction.24
Various interventions have been employed in the attempts to find ways of moving discharge times to earlier in the day, including preparing the discharge paperwork and medications the previous night,25 using checklists,1,25 team huddles,2 providing real-time feedback to unit staff,1 and employing multidisciplinary teamwork.1,2,6,25,26
The purpose of this study was to identify and determine the relative frequency of barriers to writing discharge orders in the hopes of identifying issues that might be addressed by targeted interventions. We also assessed the effects of daily team census, patients being on teaching versus nonteaching services, and how daily rounds were structured at the time that the discharge orders were written.
METHODS
Study Design, Setting, and Participants
We conducted a prospective, cross-sectional survey of house-staff and attending physicians on general medicine teaching and nonteaching services from November 13, 2014, through May 31, 2016. The study was conducted at the following five hospitals: Denver Health Medical Center (DHMC) and Presbyterian/Saint Luke’s Medical Center (PSL) in Denver, Colorado; Ronald Reagan University (UCLA) and Los Angeles County/University of Southern California Medical Center (LAC+USC) in Los Angeles, California; and Harborview Medical Center (HMC) in Seattle, Washington. The study was approved by the Colorado Multi-Institutional Review Board as well as by the review boards of the other participating sites.
Data Collection
The results of the focus groups composed of attending physicians at DHMC were used to develop our initial data collection template. Additional sites joining the study provided feedback, leading to modifications (Appendix 1).
Physicians were surveyed at three different time points on study days that were selected according to the convenience of the investigators. The sampling occurred only on weekdays and was done based on the investigators’ availability. Investigators would attempt to survey as many teams as they were able to but, secondary to feasibility, not all teams could be surveyed on study days. The specific time points varied as a function of physician workflows but were standardized as much as possible to occur in the early morning, around noon, and midafternoon on weekdays. Physicians were contacted either in person or by telephone for verbal consent prior to administering the first survey. All general medicine teams were eligible. For teaching teams, the order of contact was resident, intern, and then attending based on which physician was available at the time of the survey and on which member of the team was thought to know the patients the best. For the nonteaching services, the attending physicians were contacted.
During the initial survey, the investigators assessed the provider role (ie, attending or housestaff), whether the service was a teaching or a nonteaching service, and the starting patient census on that service primarily based on interviewing the provider of record for the team and looking at team census lists. Physicians were asked about their rounding style (ie, sickest patients first, patients likely to be discharged first, room-by-room, most recently admitted patients first, patients on the team the longest, or other) and then to identify all patients they thought would be definite discharges sometime during the day of the survey. Definite discharges were defined as patients whom the provider thought were either currently ready for discharge or who had only minor barriers that, if unresolved, would not prevent same-day discharge. They were asked if the discharge order had been entered and, if not, what was preventing them from doing so, if the discharge could in their opinion have occurred the day prior and, if so, why this did not occur. We also obtained the date and time of the admission and discharge orders, the actual discharge time, as well as the length of stay either through chart review (majority of sites) or from data warehouses (Denver Health and Presbyterian St. Lukes had length of stay data retrieved from their data warehouse).
Physicians were also asked to identify all patients whom they thought might possibly be discharged that day. Possible discharges were defined as patients with barriers to discharge that, if unresolved, would prevent same-day discharge. For each of these, the physicians were asked to list whatever issues needed to be resolved prior to placing the discharge order (Appendix 1).
The second survey was administered late morning on the same day, typically between 11
The third survey was administered midafternoon, typically around 3 PM similar to the first two surveys, with the exception that the third survey did not attempt to identify new definite or possible discharges.
Sample Size
We stopped collecting data after obtaining a convenience sample of 5% of total discharges at each study site or on the study end date, which was May 31, 2016, whichever came first.
Data Analysis
Data were collected and managed using a secure, web-based application electronic data capture tool (REDCap), hosted at Denver Health. REDCap (Research Electronic Data Capture, Nashville, Tennessee) is designed to support data collection for research studies.27 Data were then analyzed using SAS Enterprise Guide 5.1 (SAS Institute, Inc., Cary, North Carolina). All data entered into REDCap were reviewed by the principal investigator to ensure that data were not missing, and when there were missing data, a query was sent to verify if the data were retrievable. If retrievable, then the data would be entered. The volume of missing data that remained is described in our results.
Continuous variables were described using means and standard deviations (SD) or medians and interquartile ranges (IQR) based on tests of normality. Differences in the time that the discharge orders were placed in the electronic medical record according to morning patient census, teaching versus nonteaching service, and rounding style were compared using the Wilcoxon rank sum test. Linear regression was used to evaluate the effect of patient census on discharge order time. P < .05 was considered as significant.
RESULTS
We conducted 1,584 patient evaluations through surveys of 254 physicians over 156 days. Given surveys coincided with the existing work we had full participation (ie, 100% participation) and no dropout during the study days. Median (IQR) survey time points were 8:30
The characteristics of the five hospitals participating in the study, the patients’ final discharge status, the types of physicians surveyed, the services on which they were working, the rounding styles employed, and the median starting daily census are summarized in Table 1. The majority of the physicians surveyed were housestaff working on teaching services, and only a small minority structured rounds such that patients ready for discharge were seen first.
Over the course of the three surveys, 949 patients were identified as being definite discharges at any time point, and the large majority of these (863, 91%) were discharged on the day of the survey. The median (IQR) time that the discharge orders were written was 11:50
During the initial morning survey, 314 patients were identified as being definite discharges for that day (representing approximately 6% of the total number of patients being cared for, or 33% of the patients identified as definite discharges throughout the day). Of these, the physicians thought that 44 (<1% of the total number of patients being cared for on the services) could have been discharged on the previous day. The most frequent reasons cited for why these patients were not discharged on the previous day were “Patient did not want to leave” (n = 15, 34%), “Too late in the day” (n = 10, 23%), and “No ride” (n = 9, 20%). The remaining 10 patients (23%) had a variety of reasons related to system or social issues (ie, shelter not available, miscommunication).
At the morning time point, the most common barriers to discharge identified were that the physicians had not finished rounding on their team of patients and that the housestaff needed to staff their patients with their attending. At noon, caring for other patients and tending to the discharge processes were most commonly cited, and in the afternoon, the most common barriers were that the physicians were in the process of completing the discharge paperwork for those patients or were discharging other patients (Table 2). When comparing barriers on teaching to nonteaching teams, a higher proportion of teaching teams were still rounding on all patients and were working on discharge paperwork at the second survey. Barriers cited by sites were similar; however, the frequency at which the barriers were mentioned varied (data not shown).
The physicians identified 1,237 patients at any time point as being possible discharges during the day of the survey and these had a mean (±SD) of 1.3 (±0.5) barriers cited for why these patients were possible rather than definite discharges. The most common were that clinical improvement was needed, one or more pending issues related to their care needed to be resolved, and/or awaiting pending test results. The need to see clinical improvement generally decreased throughout the day as did the need to staff patients with an attending physician, but barriers related to consultant recommendations or completing procedures increased (Table 3). Of the 1,237 patients ever identified as possible discharges, 594 (48%) became a definite discharge by the third call and 444 (36%) became a no discharge as their final status. As with definite discharges, barriers cited by sites were similar; however, the frequency at which the barriers were mentioned varied.
Among the 949 and 1,237 patients who were ever identified as definite or possible discharges, respectively, at any time point during the study day, 28 (3%) and 444 (36%), respectively, had their discharge status changed to no discharge, most commonly because their clinical condition either worsened or expected improvements did not occur or that barriers pertaining to social work, physical therapy, or occupational therapy were not resolved.
The median time that the discharge orders were entered into the electronic medical record was 43 minutes earlier if patients were on teams with a lower versus a higher starting census (P = .0003), 48 minutes earlier if they were seen by physicians whose rounding style was to see patients first who potentially could be discharged (P = .0026), and 58 minutes earlier if they were on nonteaching versus teaching services (P < .0001; Table 4). For every one-person increase in census, the discharge order time increased by 6 minutes (β = 5.6, SE = 1.6, P = .0003).
DISCUSSION
The important findings of this study are that (1) the large majority of issues thought to delay discharging patients identified as definite discharges were related to physicians caring for other patients on their team, (2) although 91% of patients ever identified as being definite discharges were discharged on the day of the survey, only 48% of those identified as possible discharges became definite discharges by the afternoon time point, largely because the anticipated clinical improvement did not occur or care being provided by ancillary services had not been completed, and (3) discharge orders on patients identified as definite discharges were written on average 50 minutes earlier by physicians on teams with a smaller starting patient census, on nonteaching services, or when the rounding style was to see patients ready for discharges first.
Previous research has reported that physician-perceived barriers to discharge were extrinsic to providers and even extrinsic to the hospital setting (eg, awaiting subacute nursing placement and transportation).28,29 However, many of the barriers that we identified were related directly to the providers’ workload and rounding styles and whether the patients were on teaching versus nonteaching services. We also found that delays in the ability of hospital services to complete care also contributed to delayed discharges.
Our observational data suggest that delays resulting from caring for other patients might be reduced by changing rounding styles such that patients ready for discharge are seen first and are discharged prior to seeing other patients on the team, as previously reported by Beck et al.30 Intuitively, this would seem to be a straightforward way of freeing up beds earlier in the day, but such a change will, of necessity, lead to delaying care for other patients, which, in turn, could increase their length of stays. Durvasula et al. suggested that discharges could be moved to earlier in the day by completing orders and paperwork the day prior to discharge.25 Such an approach might be effective on an Obstetrical or elective Orthopedic service on which patients predictably are hospitalized for a fixed number of days (or even hours) but may be less relevant to patients on internal medicine services where lengths of stay are less predictable. Interventions to improve discharge times have resulted in earlier discharge times in some studies,2,4 but the overall length of stay either did not decrease25 or increased31 in others. Werthheimer et al.1 did find earlier discharge times, but other interventions also occurred during the study period (eg, extending social work services to include weekends).1,32
We found that discharge times were approximately 50 minutes earlier on teams with a smaller starting census, on nonteaching compared with teaching services, or when the attending’s rounding style was to see patients ready for discharges first. Although 50 minutes may seem like a small change in discharge time, Khanna et al.33 found that when discharges occur even 1 hour earlier, hospital overcrowding is reduced. To have a lower team census would require having more teams and more providers to staff these teams, raising cost-effectiveness concerns. Moving to more nonteaching services could represent a conflict with respect to one of the missions of teaching hospitals and raises a cost-benefit issue as several teaching hospitals receive substantial funding in support of their teaching activities and housestaff would have to be replaced with more expensive providers.
Delays attributable to ancillary services indicate imbalances between demand and availability of these services. Inappropriate demand and inefficiencies could be reduced by systems redesign, but in at least some instances, additional resources will be needed to add staff, increase space, or add additional equipment.
Our study has several limitations. First, we surveyed only physicians working in university-affiliated hospitals, and three of these were public safety-net hospitals. Accordingly, our results may not be generalizable to different patient populations. Second, we surveyed only physicians, and Minichiello et al.29 found that barriers to discharge perceived by physicians were different from those of other staff. Third, our data were observational and were collected only on weekdays. Fourth, we did not differentiate interns from residents, and thus, potentially the level of training could have affected these results. Similarly, the decision for a “possible” and a “definite” discharge is likely dependent on the knowledge base of the participant, such that less experienced participants may have had differing perspectives than someone with more experience. Fifth, the sites did vary based on the infrastructure and support but also had several similarities. All sites had social work and case management involved in care, although at some sites, they were assigned according to team and at others according to geographic location. Similarly, rounding times varied. Most of the services surveyed did not utilize advanced practice providers (the exception was the nonteaching services at Denver Health, and their presence was variable). These differences in staffing models could also have affected these results.
Our study also has a number of strengths. First, we assessed the barriers at five different hospitals. Second, we collected real-time data related to specific barriers at multiple time points throughout the day, allowing us to assess the dynamic nature of identifying patients as being ready or nearly ready for discharge. Third, we assessed the perceptions of barriers to discharge from physicians working on teaching as well as nonteaching services and from physicians utilizing a variety of rounding styles. Fourth, we had a very high participation rate (100%), probably due to the fact that our study was strategically aligned with participants’ daily work activities.
In conclusion, we found two distinct categories of issues that physicians perceived as most commonly delaying writing discharge orders on their patients. The first pertained to patients thought to definitely be ready for discharge and was related to the physicians having to care for other patients on their team. The second pertained to patients identified as possibly ready for discharge and was related to the need for care to be completed by a variety of ancillary services. Addressing each of these barriers would require different interventions and a need to weigh the potential improvements that could be achieved against the increased costs and/or delays in care for other patients that may result.
Disclosures
The authors report no conflicts of interest relevant to this work.
1. Wertheimer B, Jacobs RE, Bailey M, et al. Discharge before noon: an achievable hospital goal. J Hosp Med. 2014;9(4):210-214. doi: 10.1002/jhm.2154. PubMed
2. Kane M, Weinacker A, Arthofer R, et al. A multidisciplinary initiative to increase inpatient discharges before noon. J Nurs Adm. 2016;46(12):630-635. doi: 10.1097/NNA.0000000000000418. PubMed
3. Khanna S, Sier D, Boyle J, Zeitz K. Discharge timeliness and its impact on hospital crowding and emergency department flow performance. Emerg Med Australas. 2016;28(2):164-170. doi: 10.1111/1742-6723.12543. PubMed
4. Kravet SJ, Levine RB, Rubin HR, Wright SM. Discharging patients earlier in the day: a concept worth evaluating. Health Care Manag (Frederick). 2007;26:142-146. doi: 10.1097/01.HCM.0000268617.33491.60. PubMed
5. Khanna S, Boyle J, Good N, Lind J. Impact of admission and discharge peak times on hospital overcrowding. Stud Health Technol Inform. 2011;168:82-88. doi: 10.3233/978-1-60750-791-8-82. PubMed
6. McGowan JE, Truwit JD, Cipriano P, et al. Operating room efficiency and hospital capacity: factors affecting operating room use during maximum hospital census. J Am Coll Surg. 2007;204(5):865-871; discussion 71-72. doi: 10.1016/j.jamcollsurg.2007.01.052 PubMed
7. Khanna S, Boyle J, Good N, Lind J. Early discharge and its effect on ED length of stay and access block. Stud Health Technol Inform. 2012;178:92-98. doi: 10.3233/978-1-61499-078-9-92 PubMed
8. Powell ES, Khare RK, Venkatesh AK, Van Roo BD, Adams JG, Reinhardt G. The relationship between inpatient discharge timing and emergency department boarding. J Emerg Med. 2012;42(2):186-196. doi: 10.1016/j.jemermed.2010.06.028. PubMed
9. Wertheimer B, Jacobs RE, Iturrate E, Bailey M, Hochman K. Discharge before noon: Effect on throughput and sustainability. J Hosp Med. 2015;10(10):664-669. doi: 10.1002/jhm.2412. PubMed
10. Sikka R, Mehta S, Kaucky C, Kulstad EB. ED crowding is associated with an increased time to pneumonia treatment. Am J Emerg Med. 2010;28(7):809-812. doi: 10.1016/j.ajem.2009.06.023. PubMed
11. Coil CJ, Flood JD, Belyeu BM, Young P, Kaji AH, Lewis RJ. The effect of emergency department boarding on order completion. Ann Emerg Med. 2016;67:730-736 e2. doi: 10.1016/j.annemergmed.2015.09.018. PubMed
12. Gaieski DF, Agarwal AK, Mikkelsen ME, et al. The impact of ED crowding on early interventions and mortality in patients with severe sepsis. Am J Emerg Med. 2017;35:953-960. doi: 10.1016/j.ajem.2017.01.061. PubMed
13. Pines JM, Localio AR, Hollander JE, et al. The impact of emergency department crowding measures on time to antibiotics for patients with community-acquired pneumonia. Ann Emerg Med. 2007;50(5):510-516. doi: 10.1016/j.annemergmed.2007.07.021. PubMed
14. Hwang U, Richardson L, Livote E, Harris B, Spencer N, Sean Morrison R. Emergency department crowding and decreased quality of pain care. Acad Emerg Med. 2008;15:1248-1255. doi: 10.1111/j.1553-2712.2008.00267.x. PubMed
15. Mills AM, Shofer FS, Chen EH, Hollander JE, Pines JM. The association between emergency department crowding and analgesia administration in acute abdominal pain patients. Acad Emerg Med. 2009;16:603-608. doi: 10.1111/j.1553-2712.2009.00441.x. PubMed
16. Pines JM, Shofer FS, Isserman JA, Abbuhl SB, Mills AM. The effect of emergency department crowding on analgesia in patients with back pain in two hospitals. Acad Emerg Med. 2010;17(3):276-283. doi: 10.1111/j.1553-2712.2009.00676.x. PubMed
17. Kulstad EB, Sikka R, Sweis RT, Kelley KM, Rzechula KH. ED overcrowding is associated with an increased frequency of medication errors. Am J Emerg Med. 2010;28:304-309. doi: 10.1016/j.ajem.2008.12.014. PubMed
18. Richardson DB. Increase in patient mortality at 10 days associated with emergency department overcrowding. Med J Aust. 2006;184(5):213-216. PubMed
19. Hoot NR, Aronsky D. Systematic review of emergency department crowding: causes, effects, and solutions. Ann Emerg Med. 2008;52(2):126-136. doi: 10.1016/j.annemergmed.2008.03.014. PubMed
20. Singer AJ, Thode HC, Jr., Viccellio P, Pines JM. The association between length of emergency department boarding and mortality. Acad Emerg Med. 2011;18(12):1324-1329. doi: 10.1111/j.1553-2712.2011.01236.x. PubMed
21. White BA, Biddinger PD, Chang Y, Grabowski B, Carignan S, Brown DF. Boarding inpatients in the emergency department increases discharged patient length of stay. J Emerg Med. 2013;44(1):230-235. doi: 10.1016/j.jemermed.2012.05.007. PubMed
22. Forster AJ, Stiell I, Wells G, Lee AJ, van Walraven C. The effect of hospital occupancy on emergency department length of stay and patient disposition. Acad Emerg Med. 2003;10(2):127-133. doi: 10.1197/aemj.10.2.127. PubMed
23. Foley M, Kifaieh N, Mallon WK. Financial impact of emergency department crowding. West J Emerg Med. 2011;12(2):192-197. PubMed
24. Pines JM, Iyer S, Disbot M, Hollander JE, Shofer FS, Datner EM. The effect of emergency department crowding on patient satisfaction for admitted patients. Acad Emerg Med. 2008;15(9):825-831. doi: 10.1111/j.1553-2712.2008.00200.x. PubMed
25. Durvasula R, Kayihan A, Del Bene S, et al. A multidisciplinary care pathway significantly increases the number of early morning discharges in a large academic medical center. Qual Manag Health Care. 2015;24:45-51. doi: 10.1097/QMH.0000000000000049. PubMed
26. Cho HJ, Desai N, Florendo A, et al. E-DIP: Early Discharge Project. A Model for Throughput and Early Discharge for 1-Day Admissions. BMJ Qual Improv Rep. 2016;5(1): pii: u210035.w4128. doi: 10.1136/bmjquality.u210035.w4128. PubMed
27. Harris PA, Taylor R, Thielke R, Payne J, Gonzalez N, Conde JG. Research electronic data capture (REDCap)--a metadata-driven methodology and workflow process for providing translational research informatics support. J Biomed Inform. 2009;42(2):377-381. doi: 10.1016/j.jbi.2008.08.010. PubMed
28. Patel H, Fang MC, Mourad M, et al. Hospitalist and internal medicine leaders’ perspectives of early discharge challenges at academic medical centers. J Hosp Med. 2018;13(6):388-391. doi: 10.12788/jhm.2885. PubMed
29. Minichiello TM, Auerbach AD, Wachter RM. Caregiver perceptions of the reasons for delayed hospital discharge. Eff Clin Pract. 2001;4(6):250-255. PubMed
30. Beck MJ, Okerblom D, Kumar A, Bandyopadhyay S, Scalzi LV. Lean intervention improves patient discharge times, improves emergency department throughput and reduces congestion. Hosp Pract (1995). 2016;44(5):252-259. doi: 10.1080/21548331.2016.1254559. PubMed
31. Rajkomar A, Valencia V, Novelero M, Mourad M, Auerbach A. The association between discharge before noon and length of stay in medical and surgical patients. J Hosp Med. 2016;11(12):859-861. doi: 10.1002/jhm.2529. PubMed
32. Shine D. Discharge before noon: an urban legend. Am J Med. 2015;128(5):445-446. doi: 10.1016/j.amjmed.2014.12.011. PubMed33. Khanna S, Boyle J, Good N, Lind J. Unravelling relationships: Hospital occupancy levels, discharge timing and emergency department access block. Emerg Med Australas. 2012;24(5):510-517. doi: 10.1111/j.1742-6723.2012.01587.x. PubMed

Predictors of Clinically Significant Echocardiography Findings in Older Adults with Syncope: A Secondary Analysis
Syncope, defined as a transient loss of consciousness and postural tone followed by complete, spontaneous return to neurological baseline, accounts for over 1 million (or approximately 1%) of all emergency department (ED) visits per year in the United States (US).12 Given the breadth of etiologies for syncope, including certain life-threatening conditions, extensive diagnostic evaluation and hospitalization for this complaint is common.3-7 The estimated costs of syncope-related hospitalizations are over $2.4 billion annually in the US.8
The 2011 American College of Cardiology Foundation appropriate use criteria for echocardiography state that syncope is an appropriate indication for transthoracic echocardiography (TTE) even when there are no other symptoms or signs of cardiovascular disease.9 This broad recommendation may be appropriate since a finding of severe valvular disease would generally merit consultation with a cardiothoracic surgeon to assess the potential for surgical intervention.10 However, routine use of echocardiogram in all syncope patients could result in increased healthcare costs, patient discomfort, and incidental findings of unclear significance, while rarely changing diagnosis or management.11,12
In an attempt to reduce potentially unnecessary TTE testing, several studies have tried to identify patients at very low risk of structural heart disease.13-17 These investigations suggest that TTE is not indicated in syncope patients with a normal ECG and a normal cardiac exam. However, this literature is limited by retrospective study design and/or small sample sizes. The 2017 American Heart Association/American College of Cardiology/Heart Rhythm Society syncope guidelines recommend TTE for a patient in whom structural heart disease is suspected, but they are not explicit about how to make this determination. 18 Thus, it is still unclear which syncope patients require TTE since a standardized approach to assessing risk of clinically significant findings on TTE has not yet been rigorously developed.
The objective of this study was to develop a risk-stratification tool to identify older adults at very low risk of having a major, clinically significant finding on rest TTE after presenting to the ED with syncope or near-syncope. Using clinical, ECG, and cardiac biomarker data, we created the ROMEO (Risk Of Major Echocardiography findings in Older adults with syncope) score to help optimize resource utilization for syncope.
METHODS
Study Design and Setting
We conducted a large, multicenter, prospective, observational cohort study of older adults who presented to an ED with syncope or near-syncope (ClinicalTrials.gov identifier: NCT01802398). The study was approved by the institutional review boards at all sites and written informed consent was obtained from all participating subjects. The study was conducted at 11 academic EDs across the US (See Appendix Table 1).
Study Population
Patient inclusion criteria for eligibility were age ≥60 years with a complaint of syncope or near-syncope. Syncope was defined as transient loss of consciousness, associated with postural loss of tone, with immediate, spontaneous, and complete recovery. Near syncope was defined as the sensation of imminent loss of consciousness. Patients were excluded if their symptoms were thought to be due to intoxication, seizure, stroke, head trauma, or hypoglycemia. Additional exclusion criteria were the need for medical intervention to restore consciousness (eg, defibrillation), new or worsening confusion, and inability to obtain informed consent from the patient or a legally authorized representative.
This analysis included only patients who received a TTE during the index visit (either in the ED, observation unit, or while admitted to the hospital). This dataset was also used for other analyses addressing questions relevant to the ED management of syncope.
Measurements
All patients underwent a standardized history, physical examination, laboratory, and 12-lead ECG testing. Trained research assistants (RA) directly queried patients about symptoms associated with the syncopal episode. Data on the patient’s past medical history, medications, and physical examination findings were collected prospectively from treating providers.
Research staff obtained blood samples for testing at a core laboratory (University of Rochester, Rochester, NY). Two assays were performed using the Roche Elecsys platform: N-terminal pro B-type natriuretic peptide (NT-proBNP) and the 5th generation high-sensitivity cardiac troponin T (hs-TnT). NT-proBNP was classified as abnormal above a cutoff of 125 pg/mL. Hs-TnT was classified as abnormal above the 99th percentile for a reference population (14 pg/mL). Although hs-TnT was not approved by the U.S. Food and Drug Administration (FDA) at the time of the study, we anticipated that this assay would receive approval and be integrated into future standard of care (FDA approval was granted in January 2017). Rest TTEs were ordered at the discretion of the treating providers.
Outcome Measures
The primary outcome for this secondary analysis was a major, clinically significant finding on TTE.13,14,16,19 These included severe aortic stenosis (<1 cm2), severe mitral stenosis, severe aortic/mitral regurgitation, reduced ejection fraction (defined either quantitatively as less than 45% or qualitatively as “severe left ventricular dysfunction”), hypertrophic cardiomyopathy with outflow tract obstruction, severe pulmonary hypertension, right ventricular dysfunction/strain, large pericardial effusion, atrial myxoma, or regional wall motion abnormalities.
All echocardiogram reports were independently reviewed by two research physicians. Discrepant reviews were resolved by the research physicians and two of the study investigators (BS, CB). Of note, all the TTEs obtained were formal echocardiographic studies, not bedside ultrasonography performed by the emergency physician.
Candidate Predictors
Potential candidate predictors were identified through a prior expert panel process.20,21 Candidate predictors included age, sex, abnormal heart sounds, exertional syncope, shortness of breath, chest pain, near-syncope, family history of sudden cardiac death, high (>180 mm Hg) or low (<90 mm Hg) systolic blood pressure, abnormal ECG, elevated hs-TnT, elevated NT-proBNP, and history of the following: hypertension, cardiac dysrhythmia, renal failure, diabetes, congestive heart failure (CHF), and coronary artery disease (CAD).
The first obtained ECG was abstracted by one of five research study physicians blinded to all clinical data. Research study physicians demonstrated high interrater reliability (kappa > 0.80) in distinguishing normal from abnormal ECGs in a training set of 50 ECGs. Abnormal ECG interpretations included nonsinus rhythms (including paced rhythms), multiple premature ventricular complexes, sinus bradycardias (≤40 bpm), ventricular hypertrophies, short PR segment intervals (<100 milliseconds [ms]), axis deviations, first degree blocks (>200 ms), complete bundle branch blocks, Brugada patterns, Wolff-Parkinson-White patterns, abnormal QRS duration (>120 ms) or abnormal QTc prolongations (>450 ms), and Q/ST/T segment abnormalities suggestive of acute or chronic ischemia.
Statistical Analysis
We calculated descriptive statistics for each predictor variable, stratified by the presence or absence of TTE findings. Chi-square and t-tests were used to test associations between categorical or continuous variables and TTE findings using a significance level of 0.05 and 2-sided hypothesis testing. To identify a robust set of predictors of the primary outcome, we used multivariate logistic regression with the LASSO (Least Absolute Shrinkage and Selection Operator) to fit a parsimonious model.22 The LASSO selects variables and shrinks the associated coefficients to avoid overfitting.23-25 We then used a bootstrap to generate confidence intervals for coefficient estimates. Cases with missing echocardiography reports were excluded from the analysis. Bootstrap results were summarized as the percentage of bootstrap iterations in which each variable’s coefficient was 1) chosen and negative, 2) shrunk to zero, or 3) chosen and positive.
We assessed different weighting schemes to generate a risk score from significant variables identified by regression modeling. These included weighting by regression coefficients rounded to the nearest integer and simple summation of the presence or absence of each variable.
Based on these results, a predictive score was developed to risk stratify patients on their probability of major, clinically significant findings on TTE. The sensitivity and specificity of a score of zero to predict findings on TTE was calculated. For confidence intervals, we used Wilson’s method for binomial confidence intervals.26 The receiver operating characteristic (ROC) curve and its associated area under the curve (AUC) were calculated, and a confidence interval for the AUC was obtained through bootstrap resampling with 2,000 iterations. As part of our sensitivity analyses, we also calculated the ROC curve and AUC after excluding the patients with a known history of CHF and significant finding on TTE. Data analyses were performed in R.27 Two sensitivity analyses were performed: 1) we used multiple imputation to impute 1,000 complete data sets and then used the same LASSO methodology as with the complete data to assess whether incorporating missing data changed the results; and 2) we simulated a conventional troponin assay by raising the positive threshold for hs-TnT to >30 pg/mL (corresponding to the limit of detection for conventional troponin).28
RESULTS
Characteristics of Study Subjects
Patient screening occurred from April 2013 to September 2016. There were 6,930 patients who met eligibility criteria, of whom 3,686 (53%) consented and enrolled in the study (See Figure 1). Of these, 995 (27%) received TTE. The mean age of patients receiving TTE was 74 years; 55% were male. Characteristics of patients obtaining and not obtaining TTE are presented in Appendix Table 2. Patients who received TTE were more likely to be older, have abnormal heart sounds, abnormal EKGs, elevated hs-TnT, elevated NT-proBNP, and have a history of CHF. Of the 995 subjects receiving TTE, 215 (21.6%) had a major, clinically significant finding.
Main Results
Univariate analysis identified 14 variables significantly associated with major findings on TTE. These included male gender, shortness of breath, abnormal heart sounds, history of renal failure, diabetes, CHF, CAD, abnormal ECG, and elevated cardiac biomarkers, among others (See Table 1). The most common major finding on TTE was regional wall motion abnormality, followed by reduced left ventricular ejection fraction (See Table 2). Of the 995 patients who received TTE, 20 (2%) were discharged directly from the ED, 444 (45%) were observed, and 531 (53%) were admitted. On average, patients who received TTE had a longer length of stay than did those that did not (3.4 days vs 1.9 days).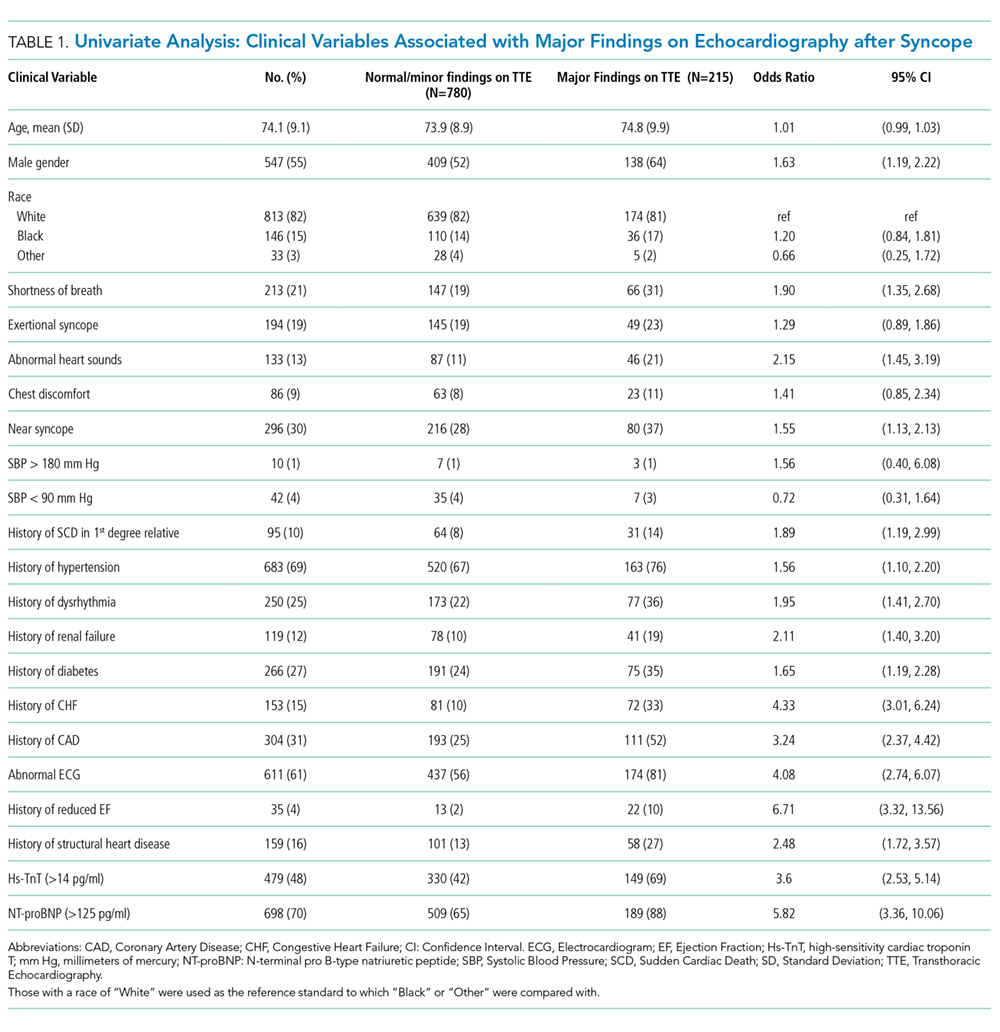
LASSO multivariable logistic regression produced five predictors associated with major findings on TTE: 1) history of CHF, 2) history of CAD, 3) abnormal ECG, 4) hs-TnT above 14 pg/mL, and 5) NT-proBNP above 125 pg/mL (See Table 3).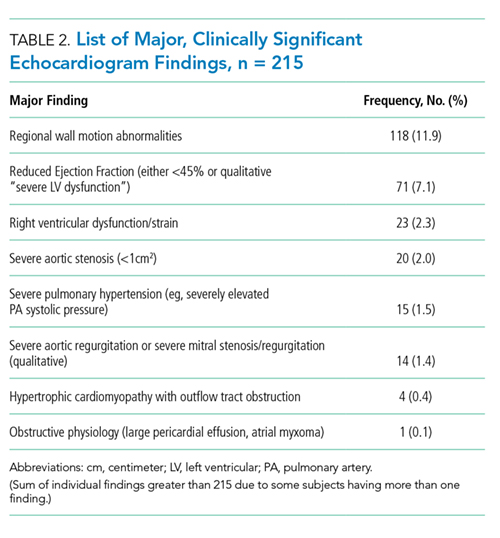
These five high-risk clinical variables retained their importance after multivariate analysis and form the ROMEO score.
The sensitivity and specificity of a ROMEO score of zero for excluding major findings on TTE was 99.5% (95% CI: 97.4%-99.9%) and 15.4% (95% CI: 13.0%-18.1%), respectively. Patients with a ROMEO score of 0 were at very low risk of having a major finding on TTE: 0.8% (95% CI: 0.02%-4.5%; Appendix Table 3). Only one out of 121 patients with none of the ROMEO criteria was found to have a major finding on TTE (regional wall motion abnormality). Patients with a score of 1 or more were at moderate-to-high risk of having a major finding (7.3% to 55.6%).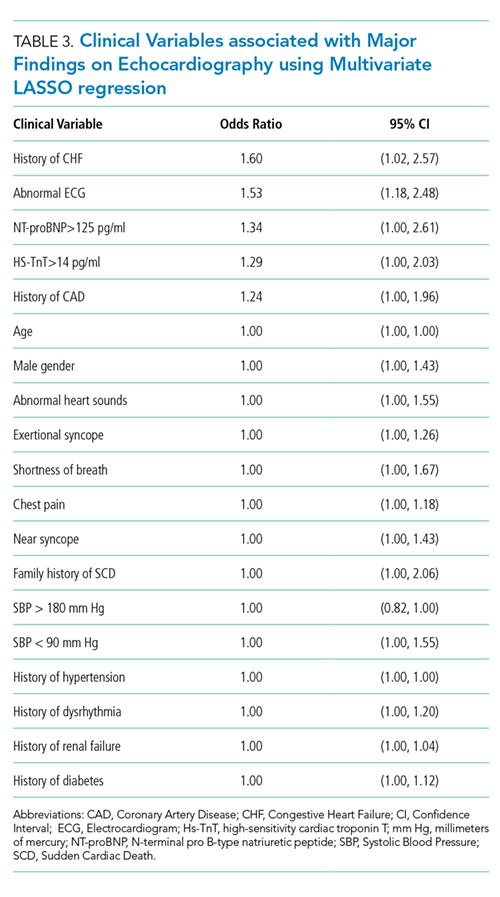
There was a linear relationship between the ROMEO score and probability of major findings on TTE (See Appendix Figure 1). The AUC was 0.77 (95% CI = 0.72-0.79) indicating good accuracy of the combination of the five high-risk clinical variables to predict major findings on TTE (See Appendix Figure 2). After excluding the 72 patients with known CHF and significant findings on TTE, the AUC was similar: 0.73 (95% CI: 0.69-0.77). There were 139 patients with at least one missing variable (14%) (See Appendix Table 4). A multiple imputation sensitivity analysis identified the same five high-risk clinical variables in 85% of imputations.
There were 253 patients with high-sensitivity troponin levels between 15 and 30 pg/mL (inclusive). Using a higher hs-TnT threshold (>30 pg/mL) to simulate a conventional troponin assay again identified the same five high-risk variables along with shortness of breath as a potential sixth variable though with an odds ratio approaching unity (See Appendix Table 5). The ROMEO score would have missed two additional patients with major findings if the troponin cutoff were raised to 30 pg/mL from 14 pg/mL, ie, it would have identified 212/215 (98.6%) of the major findings rather than 214/215 (99.5%).
DISCUSSION
Older adults with syncope often present to the ED and undergo a variety of diagnostic tests, including TTE, and a significant proportion are admitted to the hospital.2 There is currently no standardized, evidence-based approach to guide TTE ordering for these patients. Using a large, prospective dataset of syncope patients, we sought to develop a risk-stratification tool to help clinicians identify which syncope patients would be at very low risk for clinically significant findings on TTE. We found that in the absence of these five high-risk clinical variables, the rate of significant findings on TTE in our sample was less than 1%. All five high-risk variables included in the tool remained predictive in our sensitivity analyses, speaking to the robustness of our model.
Other retrospective, and smaller prospective, studies have identified a combination of low-risk criteria including: a normal ECG alone,15 a normal physical exam and normal ECG,14,17 a negative cardiac history and normal ECG.16 Han et al. performed a chart review of 241 patients presenting to the ED with syncope and identified three risk factors for abnormal TTE findings using multiple logistic regression: age, abnormal ECG, and BNP greater than 100 pg/mL.13 While these studies’ results are generally consistent with ours, the retrospective nature and small sample size of these studies limit the generalizability of these results. Thus, using a large, multicenter prospective dataset, we derived a clinical decision instrument (the ROMEO score) to determine which older adults with syncope are at very low risk for major, clinically significant findings on TTE.
Our results add to the recent American College of Cardiology/American Heart Association/Heart Rhythm Society guidelines on the management of syncope which recommend TTE in “selected patients presenting with syncope if structural heart disease is suspected.”18 Our risk-stratification tool offers a simple, standardized approach to determine specifically when to defer TTE testing.
Our findings can guide clinicians in deciding when to obtain TTE for ED syncope patients in the following way: Older adults presenting with syncope or near-syncope to the ED who have none of the ROMEO criteria are at extremely low risk for clinically significant findings on TTE and thus need not undergo such testing solely because of the syncopal event. Patients who have only one or more high-risk clinical variables are at higher risk (7.3%-56%) of significant TTE findings. In this subset, other factors, (eg, physician gestalt, recent previous echocardiography, patient preference, availability of echocardiography) can help guide TTE ordering. Patients with a greater number of high-risk variables may benefit from a more urgent echocardiographic evaluation.
Although on average, patients undergoing TTE had a longer length of stay than those that did not, this finding does not necessarily imply that ordering a TTE was the cause of the increased length of stay. It is possible that this positive association was due to greater underlying medical complexity or acuity of illness that resulted in a greater likelihood of admission/observation, and in turn, a greater length of stay.
Prior to implementation, our results should be externally validated in other clinical settings. In the interim, this risk-stratification tool may be used by clinicians, in conjunction with clinical judgement, to help guide the appropriate use of TTE in older adults presenting with syncope.
Our study has certain limitations. As we only enrolled patients 60 years and older, our findings may not necessarily be valid in younger populations of syncope patients. However, structural heart disease is less common in younger patients and is generally more of a concern for clinicians when evaluating syncope patients in the older age range.29 In our study, 47% of eligible patients declined to participate and thus sampling bias may have occurred. TTEs were ordered at the discretion of treating providers, which was likely subject to physician, institutional, and regional variation; the prevalence of major TTE findings may be lower in the overall cohort than in patients who received TTE. Prior TTE reports were not available; therefore, we were not able to determine if these major findings were previously known. Importantly, we did not perform an internal or external validation of the ROMEO score due to time and resource constraints. Thus, this study represents a derivation of the score solely and would require external validation prior to clinical implementation. Also, to calculate the ROMEO score, both an hs-TnT and NT-proBNP level must be obtained. Thus, the cost savings of any potential reduction in TTE ordering may be partially offset by the costs of increased laboratory testing. Lastly, hs-TnT assays are not currently widely available in hospitals in the United States; earlier generation cardiac troponin assays may not be a perfect substitute for hs-TnT assays. Our sensitivity analysis using an elevated threshold for hs-TnT attempted to mitigate this limitation and resulted in similar findings.
In summary, this risk-stratification tool, using five simple criteria, could help clinicians determine which older adult syncope patients can safely forgo TTE. If validated, this tool could help optimize resource utilization, and increase the value of healthcare for patients presenting with syncope.
Acknowledgments
The authors would like to thank the research assistants at all 11 sites who enrolled patients and collected data for this study.
Disclosures
Dr. Adler has received research funding from Roche. Dr. Bastani has received research funding from Radiometer and Portola and has been a consultant for Portola. Dr. Baugh has received advisory board and speaker’s fees from Roche, research funding from Janssen and Boehringer Ingelheim, and consulting and advisory board fees from Janssen. Dr. Casterino has received funding from Astra Zeneca. Dr. Clark has received research funding from Radiometer, Ortho Clinical Trials, Janssen, Pfizer, NIH, Portola, Biocryst, Glaxo Smith Klein, Hospital Quality Foundation, and Abbott. She is a consultant for Portola, Janssen, and Hospital Quality Foundation. Dr. Diercks is a consultant for Siemens, Janssen, and Roche has received institutional research support from Novartis, Ortho Scientific, and Roche. Dr. Hollander has received research funding from Alere, Siemens, Roche, Portola, and Trinity. Dr. Hollander has also received royalties from UpToDate. Dr. Nishijima has received an honorarium from Pfizer. Dr. Storrow is a consultant for Siemens and Quidel, has received speaking fees from MCM Education, and is on the Data and Safety Monitoring Board for Trevena. Dr. Sun is a consultant for Medtronic. The other authors report no relevant conflicts of interest.
Funding
This project was supported by the National Heart, Lung, And Blood Institute of the National Institutes of Health under Award Number R01 HL111033. Dr. Probst is supported by the National Heart, Lung, And Blood Institute of the National Institutes of Health under Award Number K23HL132052-02. The content is solely the responsibility of the authors and does not necessarily represent the official views of the National Institutes of Health. Roche Diagnostics supplied the high-sensitivity troponin-T assays. The sponsoring organizations had no role in the design and conduct of the study; collection, management, analysis, and interpretation of the data; and preparation, or review of the manuscript.
1. Sun BC, Emond JA, Camargo CA, Jr. Characteristics and admission patterns of patients presenting with syncope to U.S. emergency departments, 1992-2000. Acad Emerg Med. 2004;11(10):1029-1034. doi: 10.1197/j.aem.2004.05.032. PubMed
2. Probst MA, Kanzaria HK, Gbedemah M, Richardson LD, Sun BC. National trends in resource utilization associated with ED visits for syncope. Am J Emerg Med. 2015;33(8):998-1001. doi: 10.1016/j.ajem.2015.04.030. PubMed
3. Kapoor WN, Karpf M, Maher Y, Miller RA, Levey GS. Syncope of unknown origin. The need for a more cost-effective approach to its diagnosis evaluation. JAMA. 1982;247(19):2687-2691. doi: 10.1001/jama.247.19.2687. PubMed
4. Pires LA, Ganji JR, Jarandila R, Steele R. Diagnostic patterns and temporal trends in the evaluation of adult patients hospitalized with syncope. Arch Intern Med. 2001;161(15):1889-1895. doi: 10.1001/archinte.161.15.1889. PubMed
5. Quinn JV, Stiell IG, McDermott DA, Sellers KL, Kohn MA, Wells GA. Derivation of the San Francisco Syncope Rule to predict patients with short-term serious outcomes. Ann Emerg Med. 2004;43(2):224-232. doi: 10.1016/S0196064403008230. PubMed
6. Linzer M, Yang EH, Estes NA, 3rd, Wang P, Vorperian VR, Kapoor WN. Diagnosing syncope. Part 1: Value of history, physical examination, and electrocardiography. Clinical Efficacy Assessment Project of the American College of Physicians. Ann Intern Med. 1997;126(12):989-996. doi: 10.7326/0003-4819-126-12-199706150-00012. PubMed
7. Linzer M, Yang EH, Estes NA, 3rd, Wang P, Vorperian VR, Kapoor WN. Diagnosing syncope. Part 2: Unexplained syncope. Clinical Efficacy Assessment Project of the American College of Physicians. Ann Intern Med. 1997;127(1):76-86. doi: 10.7326/0003-4819-127-1-199707010-00014. PubMed
8. Sun BC, Emond JA, Camargo CA, Jr. Direct medical costs of syncope-related hospitalizations in the United States. Am J Cardiol. 2005;95(5):668-671. doi: 10.1016/j.amjcard.2004.11.013. PubMed
9. American College of Cardiology Foundation. Appropriate Use Criteria Task F, American Society of Echocardiography, American Heart Association, et al. ACCF/ASE/AHA/ASNC/HFSA/HRS/SCAI/SCCM/SCCT/SCMR 2011 Appropriate Use Criteria for Echocardiography. A Report of the American College of Cardiology Foundation Appropriate Use Criteria Task Force, American Society of Echocardiography, American Heart Association, American Society of Nuclear Cardiology, Heart Failure Society of America, Heart Rhythm Society, Society for Cardiovascular Angiography and Interventions, Society of Critical Care Medicine, Society of Cardiovascular Computed Tomography, and Society for Cardiovascular Magnetic Resonance Endorsed by the American College of Chest Physicians. J Am Coll Cardiol. 2011;57(9):1126-1166. doi: 10.1016/j.echo.2010.12.008.
10. Maganti K, Rigolin VH, Sarano ME, Bonow RO. Valvular heart disease: diagnosis and management. Mayo Clin Proc. 2010;85(5):483-500. doi: 10.4065/mcp.2009.0706. PubMed
11. Mendu ML, McAvay G, Lampert R, Stoehr J, Tinetti ME. Yield of diagnostic tests in evaluating syncopal episodes in older patients. Arch Intern Med. 2009;169(14):1299-1305. doi: 10.1001/archinternmed.2009.204. PubMed
12. Madeira CL, Craig MJ, Donohoe A, Stephens JR. Things we do for no reason: echocardiogram in unselected patients with syncope. J Hosp Med. 2017;12(12):984–988. doi: http://dx.doi.org/10.12788/jhm.2864. PubMed
13. Han SK, Yeom SR, Lee SH, et al. Transthoracic echocardiogram in syncope patients with normal initial evaluation. Am J Emerg Med. 2017;35(2):281-284. doi: 10.1016/j.ajem.2016.10.078. PubMed
14. Chang NL, Shah P, Bajaj S, Virk H, Bikkina M, Shamoon F. Diagnostic yield of echocardiography in syncope patients with normal ECG. Cardiol Res Pract. 2016;2016:1251637. doi: http://dx.doi.org/10.1155/2016/1251637. PubMed
15. Anderson KL, Limkakeng A, Damuth E, Chandra A. Cardiac evaluation for structural abnormalities may not be required in patients presenting with syncope and a normal ECG result in an observation unit setting. Ann Emerg Med. 2012;60(4):478–84.e1. doi: 10.1016/j.annemergmed.2012.04.023. PubMed
16. Sarasin FP, Junod AF, Carballo D, Slama S, Unger PF, Louis-Simonet M. Role of echocardiography in the evaluation of syncope: a prospective study. Heart. 2002;88(4):363-367. doi: 10.1136/heart.88.4.363. PubMed
17. Recchia D, Barzilai B. Echocardiography in the evaluation of patients with syncope. J Gen Intern Med. 1995;10(12):649-655. doi: 10.1007/BF02602755. PubMed
18. Shen WK, Sheldon RS, Benditt DG, et al. ACC/AHA/HRS guideline for the evaluation and management of patients With syncope: executive summary: A report of the American College of Cardiology/American Heart Association Task Force on Clinical Practice Guidelines and the Heart Rhythm Society. J Am Coll Cardiol. 2017;2017(70(5)):620-663. PubMed
19. Chiu DT, Shapiro NI, Sun BC, Mottley JL, Grossman SA. Are echocardiography, telemetry, ambulatory electrocardiography monitoring, and cardiac enzymes in emergency department patients presenting with syncope useful tests? A preliminary investigation. J Emerg Med. 2014;47(1):113-118. doi: 10.1016/j.jemermed.2014.01.018. PubMed
20. Sun BC, Costantino G, Barbic F, et al. Priorities for emergency department syncope research. Ann Emerg Med. 2014;64(6):649–55.e2. doi: 10.1016/j.annemergmed.2014.04.014. PubMed
21. Sun BC, Derose SF, Liang LJ, et al. Predictors of 30-day serious events in older patients with syncope. Ann Emerg Med. 2009;54(6):769–778.e1-5. doi: 10.1016/j.annemergmed.2009.07.027. PubMed
22. Tibshirani R. Regression shrinkage and selection via the lasso. J R Stat Soc. 1996;58(1):267-288.
23. Friedman J, Hastie T, Tibshirani R. He Elements of Statistical Learning;Vol 1. New York, NY: Springer-Verlag; 2001. PubMed
24. Friedman J, Hastie T, Tibshirani R. Regularization paths for generalized linear models via coordinate descent. J Stat Softw. 2010;33(1):1-22. doi: 10.18637/jss.v033.i01. PubMed
25. James G, Witten D, Hastie T, Tibshirani R. An Introduction to Statistical Learning;Vol 112. New York, NY: Springer-Verlag; 2013.
26. Wilson EB. Probable inference, the law of succession, and statistical inference. J Am Stat Assoc. 1927 ;22(158):209-212. doi: 10.1080/01621459.1927.10502953. PubMed
27. R Core Team (2018). R: A language and environment for statistical computing. R Foundation for Statistical Computing, Vienna, Austria. URL http://www.R-project.org/.
28. Chew DP, Zeitz C, Worthley M, et al. Randomized comparison of high-sensitivity troponin reporting in undifferentiated chest pain assessment. Circ Cardiovasc Qual Outcomes. 2016;9(5):542-553. doi: 10.1161/CIRCOUTCOMES.115.002488. PubMed
29. Chen RS, Bivens MJ, Grossman SA. Diagnosis and management of valvular heart disease in emergency medicine. Emerg Med Clin North Am. 2011;29(4):801–10, vii. doi: 10.1016/j.emc.2011.08.001. PubMed
Syncope, defined as a transient loss of consciousness and postural tone followed by complete, spontaneous return to neurological baseline, accounts for over 1 million (or approximately 1%) of all emergency department (ED) visits per year in the United States (US).12 Given the breadth of etiologies for syncope, including certain life-threatening conditions, extensive diagnostic evaluation and hospitalization for this complaint is common.3-7 The estimated costs of syncope-related hospitalizations are over $2.4 billion annually in the US.8
The 2011 American College of Cardiology Foundation appropriate use criteria for echocardiography state that syncope is an appropriate indication for transthoracic echocardiography (TTE) even when there are no other symptoms or signs of cardiovascular disease.9 This broad recommendation may be appropriate since a finding of severe valvular disease would generally merit consultation with a cardiothoracic surgeon to assess the potential for surgical intervention.10 However, routine use of echocardiogram in all syncope patients could result in increased healthcare costs, patient discomfort, and incidental findings of unclear significance, while rarely changing diagnosis or management.11,12
In an attempt to reduce potentially unnecessary TTE testing, several studies have tried to identify patients at very low risk of structural heart disease.13-17 These investigations suggest that TTE is not indicated in syncope patients with a normal ECG and a normal cardiac exam. However, this literature is limited by retrospective study design and/or small sample sizes. The 2017 American Heart Association/American College of Cardiology/Heart Rhythm Society syncope guidelines recommend TTE for a patient in whom structural heart disease is suspected, but they are not explicit about how to make this determination. 18 Thus, it is still unclear which syncope patients require TTE since a standardized approach to assessing risk of clinically significant findings on TTE has not yet been rigorously developed.
The objective of this study was to develop a risk-stratification tool to identify older adults at very low risk of having a major, clinically significant finding on rest TTE after presenting to the ED with syncope or near-syncope. Using clinical, ECG, and cardiac biomarker data, we created the ROMEO (Risk Of Major Echocardiography findings in Older adults with syncope) score to help optimize resource utilization for syncope.
METHODS
Study Design and Setting
We conducted a large, multicenter, prospective, observational cohort study of older adults who presented to an ED with syncope or near-syncope (ClinicalTrials.gov identifier: NCT01802398). The study was approved by the institutional review boards at all sites and written informed consent was obtained from all participating subjects. The study was conducted at 11 academic EDs across the US (See Appendix Table 1).
Study Population
Patient inclusion criteria for eligibility were age ≥60 years with a complaint of syncope or near-syncope. Syncope was defined as transient loss of consciousness, associated with postural loss of tone, with immediate, spontaneous, and complete recovery. Near syncope was defined as the sensation of imminent loss of consciousness. Patients were excluded if their symptoms were thought to be due to intoxication, seizure, stroke, head trauma, or hypoglycemia. Additional exclusion criteria were the need for medical intervention to restore consciousness (eg, defibrillation), new or worsening confusion, and inability to obtain informed consent from the patient or a legally authorized representative.
This analysis included only patients who received a TTE during the index visit (either in the ED, observation unit, or while admitted to the hospital). This dataset was also used for other analyses addressing questions relevant to the ED management of syncope.
Measurements
All patients underwent a standardized history, physical examination, laboratory, and 12-lead ECG testing. Trained research assistants (RA) directly queried patients about symptoms associated with the syncopal episode. Data on the patient’s past medical history, medications, and physical examination findings were collected prospectively from treating providers.
Research staff obtained blood samples for testing at a core laboratory (University of Rochester, Rochester, NY). Two assays were performed using the Roche Elecsys platform: N-terminal pro B-type natriuretic peptide (NT-proBNP) and the 5th generation high-sensitivity cardiac troponin T (hs-TnT). NT-proBNP was classified as abnormal above a cutoff of 125 pg/mL. Hs-TnT was classified as abnormal above the 99th percentile for a reference population (14 pg/mL). Although hs-TnT was not approved by the U.S. Food and Drug Administration (FDA) at the time of the study, we anticipated that this assay would receive approval and be integrated into future standard of care (FDA approval was granted in January 2017). Rest TTEs were ordered at the discretion of the treating providers.
Outcome Measures
The primary outcome for this secondary analysis was a major, clinically significant finding on TTE.13,14,16,19 These included severe aortic stenosis (<1 cm2), severe mitral stenosis, severe aortic/mitral regurgitation, reduced ejection fraction (defined either quantitatively as less than 45% or qualitatively as “severe left ventricular dysfunction”), hypertrophic cardiomyopathy with outflow tract obstruction, severe pulmonary hypertension, right ventricular dysfunction/strain, large pericardial effusion, atrial myxoma, or regional wall motion abnormalities.
All echocardiogram reports were independently reviewed by two research physicians. Discrepant reviews were resolved by the research physicians and two of the study investigators (BS, CB). Of note, all the TTEs obtained were formal echocardiographic studies, not bedside ultrasonography performed by the emergency physician.
Candidate Predictors
Potential candidate predictors were identified through a prior expert panel process.20,21 Candidate predictors included age, sex, abnormal heart sounds, exertional syncope, shortness of breath, chest pain, near-syncope, family history of sudden cardiac death, high (>180 mm Hg) or low (<90 mm Hg) systolic blood pressure, abnormal ECG, elevated hs-TnT, elevated NT-proBNP, and history of the following: hypertension, cardiac dysrhythmia, renal failure, diabetes, congestive heart failure (CHF), and coronary artery disease (CAD).
The first obtained ECG was abstracted by one of five research study physicians blinded to all clinical data. Research study physicians demonstrated high interrater reliability (kappa > 0.80) in distinguishing normal from abnormal ECGs in a training set of 50 ECGs. Abnormal ECG interpretations included nonsinus rhythms (including paced rhythms), multiple premature ventricular complexes, sinus bradycardias (≤40 bpm), ventricular hypertrophies, short PR segment intervals (<100 milliseconds [ms]), axis deviations, first degree blocks (>200 ms), complete bundle branch blocks, Brugada patterns, Wolff-Parkinson-White patterns, abnormal QRS duration (>120 ms) or abnormal QTc prolongations (>450 ms), and Q/ST/T segment abnormalities suggestive of acute or chronic ischemia.
Statistical Analysis
We calculated descriptive statistics for each predictor variable, stratified by the presence or absence of TTE findings. Chi-square and t-tests were used to test associations between categorical or continuous variables and TTE findings using a significance level of 0.05 and 2-sided hypothesis testing. To identify a robust set of predictors of the primary outcome, we used multivariate logistic regression with the LASSO (Least Absolute Shrinkage and Selection Operator) to fit a parsimonious model.22 The LASSO selects variables and shrinks the associated coefficients to avoid overfitting.23-25 We then used a bootstrap to generate confidence intervals for coefficient estimates. Cases with missing echocardiography reports were excluded from the analysis. Bootstrap results were summarized as the percentage of bootstrap iterations in which each variable’s coefficient was 1) chosen and negative, 2) shrunk to zero, or 3) chosen and positive.
We assessed different weighting schemes to generate a risk score from significant variables identified by regression modeling. These included weighting by regression coefficients rounded to the nearest integer and simple summation of the presence or absence of each variable.
Based on these results, a predictive score was developed to risk stratify patients on their probability of major, clinically significant findings on TTE. The sensitivity and specificity of a score of zero to predict findings on TTE was calculated. For confidence intervals, we used Wilson’s method for binomial confidence intervals.26 The receiver operating characteristic (ROC) curve and its associated area under the curve (AUC) were calculated, and a confidence interval for the AUC was obtained through bootstrap resampling with 2,000 iterations. As part of our sensitivity analyses, we also calculated the ROC curve and AUC after excluding the patients with a known history of CHF and significant finding on TTE. Data analyses were performed in R.27 Two sensitivity analyses were performed: 1) we used multiple imputation to impute 1,000 complete data sets and then used the same LASSO methodology as with the complete data to assess whether incorporating missing data changed the results; and 2) we simulated a conventional troponin assay by raising the positive threshold for hs-TnT to >30 pg/mL (corresponding to the limit of detection for conventional troponin).28
RESULTS
Characteristics of Study Subjects
Patient screening occurred from April 2013 to September 2016. There were 6,930 patients who met eligibility criteria, of whom 3,686 (53%) consented and enrolled in the study (See Figure 1). Of these, 995 (27%) received TTE. The mean age of patients receiving TTE was 74 years; 55% were male. Characteristics of patients obtaining and not obtaining TTE are presented in Appendix Table 2. Patients who received TTE were more likely to be older, have abnormal heart sounds, abnormal EKGs, elevated hs-TnT, elevated NT-proBNP, and have a history of CHF. Of the 995 subjects receiving TTE, 215 (21.6%) had a major, clinically significant finding.
Main Results
Univariate analysis identified 14 variables significantly associated with major findings on TTE. These included male gender, shortness of breath, abnormal heart sounds, history of renal failure, diabetes, CHF, CAD, abnormal ECG, and elevated cardiac biomarkers, among others (See Table 1). The most common major finding on TTE was regional wall motion abnormality, followed by reduced left ventricular ejection fraction (See Table 2). Of the 995 patients who received TTE, 20 (2%) were discharged directly from the ED, 444 (45%) were observed, and 531 (53%) were admitted. On average, patients who received TTE had a longer length of stay than did those that did not (3.4 days vs 1.9 days).
LASSO multivariable logistic regression produced five predictors associated with major findings on TTE: 1) history of CHF, 2) history of CAD, 3) abnormal ECG, 4) hs-TnT above 14 pg/mL, and 5) NT-proBNP above 125 pg/mL (See Table 3).
These five high-risk clinical variables retained their importance after multivariate analysis and form the ROMEO score.
The sensitivity and specificity of a ROMEO score of zero for excluding major findings on TTE was 99.5% (95% CI: 97.4%-99.9%) and 15.4% (95% CI: 13.0%-18.1%), respectively. Patients with a ROMEO score of 0 were at very low risk of having a major finding on TTE: 0.8% (95% CI: 0.02%-4.5%; Appendix Table 3). Only one out of 121 patients with none of the ROMEO criteria was found to have a major finding on TTE (regional wall motion abnormality). Patients with a score of 1 or more were at moderate-to-high risk of having a major finding (7.3% to 55.6%).
There was a linear relationship between the ROMEO score and probability of major findings on TTE (See Appendix Figure 1). The AUC was 0.77 (95% CI = 0.72-0.79) indicating good accuracy of the combination of the five high-risk clinical variables to predict major findings on TTE (See Appendix Figure 2). After excluding the 72 patients with known CHF and significant findings on TTE, the AUC was similar: 0.73 (95% CI: 0.69-0.77). There were 139 patients with at least one missing variable (14%) (See Appendix Table 4). A multiple imputation sensitivity analysis identified the same five high-risk clinical variables in 85% of imputations.
There were 253 patients with high-sensitivity troponin levels between 15 and 30 pg/mL (inclusive). Using a higher hs-TnT threshold (>30 pg/mL) to simulate a conventional troponin assay again identified the same five high-risk variables along with shortness of breath as a potential sixth variable though with an odds ratio approaching unity (See Appendix Table 5). The ROMEO score would have missed two additional patients with major findings if the troponin cutoff were raised to 30 pg/mL from 14 pg/mL, ie, it would have identified 212/215 (98.6%) of the major findings rather than 214/215 (99.5%).
DISCUSSION
Older adults with syncope often present to the ED and undergo a variety of diagnostic tests, including TTE, and a significant proportion are admitted to the hospital.2 There is currently no standardized, evidence-based approach to guide TTE ordering for these patients. Using a large, prospective dataset of syncope patients, we sought to develop a risk-stratification tool to help clinicians identify which syncope patients would be at very low risk for clinically significant findings on TTE. We found that in the absence of these five high-risk clinical variables, the rate of significant findings on TTE in our sample was less than 1%. All five high-risk variables included in the tool remained predictive in our sensitivity analyses, speaking to the robustness of our model.
Other retrospective, and smaller prospective, studies have identified a combination of low-risk criteria including: a normal ECG alone,15 a normal physical exam and normal ECG,14,17 a negative cardiac history and normal ECG.16 Han et al. performed a chart review of 241 patients presenting to the ED with syncope and identified three risk factors for abnormal TTE findings using multiple logistic regression: age, abnormal ECG, and BNP greater than 100 pg/mL.13 While these studies’ results are generally consistent with ours, the retrospective nature and small sample size of these studies limit the generalizability of these results. Thus, using a large, multicenter prospective dataset, we derived a clinical decision instrument (the ROMEO score) to determine which older adults with syncope are at very low risk for major, clinically significant findings on TTE.
Our results add to the recent American College of Cardiology/American Heart Association/Heart Rhythm Society guidelines on the management of syncope which recommend TTE in “selected patients presenting with syncope if structural heart disease is suspected.”18 Our risk-stratification tool offers a simple, standardized approach to determine specifically when to defer TTE testing.
Our findings can guide clinicians in deciding when to obtain TTE for ED syncope patients in the following way: Older adults presenting with syncope or near-syncope to the ED who have none of the ROMEO criteria are at extremely low risk for clinically significant findings on TTE and thus need not undergo such testing solely because of the syncopal event. Patients who have only one or more high-risk clinical variables are at higher risk (7.3%-56%) of significant TTE findings. In this subset, other factors, (eg, physician gestalt, recent previous echocardiography, patient preference, availability of echocardiography) can help guide TTE ordering. Patients with a greater number of high-risk variables may benefit from a more urgent echocardiographic evaluation.
Although on average, patients undergoing TTE had a longer length of stay than those that did not, this finding does not necessarily imply that ordering a TTE was the cause of the increased length of stay. It is possible that this positive association was due to greater underlying medical complexity or acuity of illness that resulted in a greater likelihood of admission/observation, and in turn, a greater length of stay.
Prior to implementation, our results should be externally validated in other clinical settings. In the interim, this risk-stratification tool may be used by clinicians, in conjunction with clinical judgement, to help guide the appropriate use of TTE in older adults presenting with syncope.
Our study has certain limitations. As we only enrolled patients 60 years and older, our findings may not necessarily be valid in younger populations of syncope patients. However, structural heart disease is less common in younger patients and is generally more of a concern for clinicians when evaluating syncope patients in the older age range.29 In our study, 47% of eligible patients declined to participate and thus sampling bias may have occurred. TTEs were ordered at the discretion of treating providers, which was likely subject to physician, institutional, and regional variation; the prevalence of major TTE findings may be lower in the overall cohort than in patients who received TTE. Prior TTE reports were not available; therefore, we were not able to determine if these major findings were previously known. Importantly, we did not perform an internal or external validation of the ROMEO score due to time and resource constraints. Thus, this study represents a derivation of the score solely and would require external validation prior to clinical implementation. Also, to calculate the ROMEO score, both an hs-TnT and NT-proBNP level must be obtained. Thus, the cost savings of any potential reduction in TTE ordering may be partially offset by the costs of increased laboratory testing. Lastly, hs-TnT assays are not currently widely available in hospitals in the United States; earlier generation cardiac troponin assays may not be a perfect substitute for hs-TnT assays. Our sensitivity analysis using an elevated threshold for hs-TnT attempted to mitigate this limitation and resulted in similar findings.
In summary, this risk-stratification tool, using five simple criteria, could help clinicians determine which older adult syncope patients can safely forgo TTE. If validated, this tool could help optimize resource utilization, and increase the value of healthcare for patients presenting with syncope.
Acknowledgments
The authors would like to thank the research assistants at all 11 sites who enrolled patients and collected data for this study.
Disclosures
Dr. Adler has received research funding from Roche. Dr. Bastani has received research funding from Radiometer and Portola and has been a consultant for Portola. Dr. Baugh has received advisory board and speaker’s fees from Roche, research funding from Janssen and Boehringer Ingelheim, and consulting and advisory board fees from Janssen. Dr. Casterino has received funding from Astra Zeneca. Dr. Clark has received research funding from Radiometer, Ortho Clinical Trials, Janssen, Pfizer, NIH, Portola, Biocryst, Glaxo Smith Klein, Hospital Quality Foundation, and Abbott. She is a consultant for Portola, Janssen, and Hospital Quality Foundation. Dr. Diercks is a consultant for Siemens, Janssen, and Roche has received institutional research support from Novartis, Ortho Scientific, and Roche. Dr. Hollander has received research funding from Alere, Siemens, Roche, Portola, and Trinity. Dr. Hollander has also received royalties from UpToDate. Dr. Nishijima has received an honorarium from Pfizer. Dr. Storrow is a consultant for Siemens and Quidel, has received speaking fees from MCM Education, and is on the Data and Safety Monitoring Board for Trevena. Dr. Sun is a consultant for Medtronic. The other authors report no relevant conflicts of interest.
Funding
This project was supported by the National Heart, Lung, And Blood Institute of the National Institutes of Health under Award Number R01 HL111033. Dr. Probst is supported by the National Heart, Lung, And Blood Institute of the National Institutes of Health under Award Number K23HL132052-02. The content is solely the responsibility of the authors and does not necessarily represent the official views of the National Institutes of Health. Roche Diagnostics supplied the high-sensitivity troponin-T assays. The sponsoring organizations had no role in the design and conduct of the study; collection, management, analysis, and interpretation of the data; and preparation, or review of the manuscript.
1. Sun BC, Emond JA, Camargo CA, Jr. Characteristics and admission patterns of patients presenting with syncope to U.S. emergency departments, 1992-2000. Acad Emerg Med. 2004;11(10):1029-1034. doi: 10.1197/j.aem.2004.05.032. PubMed
2. Probst MA, Kanzaria HK, Gbedemah M, Richardson LD, Sun BC. National trends in resource utilization associated with ED visits for syncope. Am J Emerg Med. 2015;33(8):998-1001. doi: 10.1016/j.ajem.2015.04.030. PubMed
3. Kapoor WN, Karpf M, Maher Y, Miller RA, Levey GS. Syncope of unknown origin. The need for a more cost-effective approach to its diagnosis evaluation. JAMA. 1982;247(19):2687-2691. doi: 10.1001/jama.247.19.2687. PubMed
4. Pires LA, Ganji JR, Jarandila R, Steele R. Diagnostic patterns and temporal trends in the evaluation of adult patients hospitalized with syncope. Arch Intern Med. 2001;161(15):1889-1895. doi: 10.1001/archinte.161.15.1889. PubMed
5. Quinn JV, Stiell IG, McDermott DA, Sellers KL, Kohn MA, Wells GA. Derivation of the San Francisco Syncope Rule to predict patients with short-term serious outcomes. Ann Emerg Med. 2004;43(2):224-232. doi: 10.1016/S0196064403008230. PubMed
6. Linzer M, Yang EH, Estes NA, 3rd, Wang P, Vorperian VR, Kapoor WN. Diagnosing syncope. Part 1: Value of history, physical examination, and electrocardiography. Clinical Efficacy Assessment Project of the American College of Physicians. Ann Intern Med. 1997;126(12):989-996. doi: 10.7326/0003-4819-126-12-199706150-00012. PubMed
7. Linzer M, Yang EH, Estes NA, 3rd, Wang P, Vorperian VR, Kapoor WN. Diagnosing syncope. Part 2: Unexplained syncope. Clinical Efficacy Assessment Project of the American College of Physicians. Ann Intern Med. 1997;127(1):76-86. doi: 10.7326/0003-4819-127-1-199707010-00014. PubMed
8. Sun BC, Emond JA, Camargo CA, Jr. Direct medical costs of syncope-related hospitalizations in the United States. Am J Cardiol. 2005;95(5):668-671. doi: 10.1016/j.amjcard.2004.11.013. PubMed
9. American College of Cardiology Foundation. Appropriate Use Criteria Task F, American Society of Echocardiography, American Heart Association, et al. ACCF/ASE/AHA/ASNC/HFSA/HRS/SCAI/SCCM/SCCT/SCMR 2011 Appropriate Use Criteria for Echocardiography. A Report of the American College of Cardiology Foundation Appropriate Use Criteria Task Force, American Society of Echocardiography, American Heart Association, American Society of Nuclear Cardiology, Heart Failure Society of America, Heart Rhythm Society, Society for Cardiovascular Angiography and Interventions, Society of Critical Care Medicine, Society of Cardiovascular Computed Tomography, and Society for Cardiovascular Magnetic Resonance Endorsed by the American College of Chest Physicians. J Am Coll Cardiol. 2011;57(9):1126-1166. doi: 10.1016/j.echo.2010.12.008.
10. Maganti K, Rigolin VH, Sarano ME, Bonow RO. Valvular heart disease: diagnosis and management. Mayo Clin Proc. 2010;85(5):483-500. doi: 10.4065/mcp.2009.0706. PubMed
11. Mendu ML, McAvay G, Lampert R, Stoehr J, Tinetti ME. Yield of diagnostic tests in evaluating syncopal episodes in older patients. Arch Intern Med. 2009;169(14):1299-1305. doi: 10.1001/archinternmed.2009.204. PubMed
12. Madeira CL, Craig MJ, Donohoe A, Stephens JR. Things we do for no reason: echocardiogram in unselected patients with syncope. J Hosp Med. 2017;12(12):984–988. doi: http://dx.doi.org/10.12788/jhm.2864. PubMed
13. Han SK, Yeom SR, Lee SH, et al. Transthoracic echocardiogram in syncope patients with normal initial evaluation. Am J Emerg Med. 2017;35(2):281-284. doi: 10.1016/j.ajem.2016.10.078. PubMed
14. Chang NL, Shah P, Bajaj S, Virk H, Bikkina M, Shamoon F. Diagnostic yield of echocardiography in syncope patients with normal ECG. Cardiol Res Pract. 2016;2016:1251637. doi: http://dx.doi.org/10.1155/2016/1251637. PubMed
15. Anderson KL, Limkakeng A, Damuth E, Chandra A. Cardiac evaluation for structural abnormalities may not be required in patients presenting with syncope and a normal ECG result in an observation unit setting. Ann Emerg Med. 2012;60(4):478–84.e1. doi: 10.1016/j.annemergmed.2012.04.023. PubMed
16. Sarasin FP, Junod AF, Carballo D, Slama S, Unger PF, Louis-Simonet M. Role of echocardiography in the evaluation of syncope: a prospective study. Heart. 2002;88(4):363-367. doi: 10.1136/heart.88.4.363. PubMed
17. Recchia D, Barzilai B. Echocardiography in the evaluation of patients with syncope. J Gen Intern Med. 1995;10(12):649-655. doi: 10.1007/BF02602755. PubMed
18. Shen WK, Sheldon RS, Benditt DG, et al. ACC/AHA/HRS guideline for the evaluation and management of patients With syncope: executive summary: A report of the American College of Cardiology/American Heart Association Task Force on Clinical Practice Guidelines and the Heart Rhythm Society. J Am Coll Cardiol. 2017;2017(70(5)):620-663. PubMed
19. Chiu DT, Shapiro NI, Sun BC, Mottley JL, Grossman SA. Are echocardiography, telemetry, ambulatory electrocardiography monitoring, and cardiac enzymes in emergency department patients presenting with syncope useful tests? A preliminary investigation. J Emerg Med. 2014;47(1):113-118. doi: 10.1016/j.jemermed.2014.01.018. PubMed
20. Sun BC, Costantino G, Barbic F, et al. Priorities for emergency department syncope research. Ann Emerg Med. 2014;64(6):649–55.e2. doi: 10.1016/j.annemergmed.2014.04.014. PubMed
21. Sun BC, Derose SF, Liang LJ, et al. Predictors of 30-day serious events in older patients with syncope. Ann Emerg Med. 2009;54(6):769–778.e1-5. doi: 10.1016/j.annemergmed.2009.07.027. PubMed
22. Tibshirani R. Regression shrinkage and selection via the lasso. J R Stat Soc. 1996;58(1):267-288.
23. Friedman J, Hastie T, Tibshirani R. He Elements of Statistical Learning;Vol 1. New York, NY: Springer-Verlag; 2001. PubMed
24. Friedman J, Hastie T, Tibshirani R. Regularization paths for generalized linear models via coordinate descent. J Stat Softw. 2010;33(1):1-22. doi: 10.18637/jss.v033.i01. PubMed
25. James G, Witten D, Hastie T, Tibshirani R. An Introduction to Statistical Learning;Vol 112. New York, NY: Springer-Verlag; 2013.
26. Wilson EB. Probable inference, the law of succession, and statistical inference. J Am Stat Assoc. 1927 ;22(158):209-212. doi: 10.1080/01621459.1927.10502953. PubMed
27. R Core Team (2018). R: A language and environment for statistical computing. R Foundation for Statistical Computing, Vienna, Austria. URL http://www.R-project.org/.
28. Chew DP, Zeitz C, Worthley M, et al. Randomized comparison of high-sensitivity troponin reporting in undifferentiated chest pain assessment. Circ Cardiovasc Qual Outcomes. 2016;9(5):542-553. doi: 10.1161/CIRCOUTCOMES.115.002488. PubMed
29. Chen RS, Bivens MJ, Grossman SA. Diagnosis and management of valvular heart disease in emergency medicine. Emerg Med Clin North Am. 2011;29(4):801–10, vii. doi: 10.1016/j.emc.2011.08.001. PubMed
© 2018 Society of Hospital Medicine
Electronic Order Volume as a Meaningful Component in Estimating Patient Complexity and Resident Physician Workload
Resident physician workload has traditionally been measured by patient census.1,2 However, census and other volume-based metrics such as daily admissions may not accurately reflect workload due to variation in patient complexity. Relative value units (RVUs) are another commonly used marker of workload, but the validity of this metric relies on accurate coding, usually done by the attending physician, and is less directly related to resident physician workload. Because much of hospital-based medicine is mediated through the electronic health record (EHR), which can capture differences in patient complexity,3 electronic records could be harnessed to more comprehensively describe residents’ work. Current government estimates indicate that several hundred companies offer certified EHRs, thanks in large part to the Health Information Technology for Economic and Clinical Health (HITECH) Act of 2009, which aimed to promote adoption and meaningful use of health information technology.4, 5 These systems can collect important data about the usage and operating patterns of physicians, which may provide an insight into workload.6-8
Accurately measuring workload is important because of the direct link that has been drawn between physician workload and quality metrics. In a study of attending hospitalists, higher workload, as measured by patient census and RVUs, was associated with longer lengths of stay and higher costs of hospitalization.9 Another study among medical residents found that as daily admissions increased, length of stay, cost, and inpatient mortality appeared to rise.10 Although these studies used only volume-based workload metrics, the implication that high workload may negatively impact patient care hints at a possible trade-off between the two that should inform discussions of physician productivity.
In the current study, we examine whether data obtained from the EHR, particularly electronic order volume, could provide valuable information, in addition to patient volume, about resident physician workload. We first tested the feasibility and validity of using electronic order volume as an important component of clinical workload by examining the relationship between electronic order volume and well-established factors that are likely to increase the workload of residents, including patient level of care and severity of illness. Then, using order volume as a marker for workload, we sought to describe whether higher order volumes were associated with two discharge-related quality metrics, completion of a high-quality after-visit summary and timely discharge summary, postulating that quality metrics may suffer when residents are busier.
METHODS
Study Design and Setting
We performed a single-center retrospective cohort study of patients admitted to the internal medicine service at the University of California, San Francisco (UCSF) Medical Center between May 1, 2015 and July 31, 2016. UCSF is a 600-bed academic medical center, and the inpatient internal medicine teaching service manages an average daily census of 80-90 patients. Medicine teams care for patients on the general acute-care wards, the step-down units (for patients with higher acuity of care), and also patients in the intensive care unit (ICU). ICU patients are comanaged by general medicine teams and intensive care teams; internal medicine teams enter all electronic orders for ICU patients, except for orders for respiratory care or sedating medications. The inpatient internal medicine teaching service comprises eight teams each supervised by an attending physician, a senior resident (in the second or third year of residency training), two interns, and a third- and/or fourth-year medical student. Residents place all clinical orders and complete all clinical documentation through the EHR (Epic Systems, Verona, Wisconsin).11 Typically, the bulk of the orders and documentation, including discharge documentation, is performed by interns; however, the degree of senior resident involvement in these tasks is variable and team-dependent. In addition to the eight resident teams, there are also four attending hospitalist-only internal medicine teams, who manage a service of ~30-40 patients.
Study Population
Our study population comprised all hospitalized adults admitted to the eight resident-run teams on the internal medicine teaching service. Patients cared for by hospitalist-only teams were not included in this analysis. Because the focus of our study was on hospitalizations, individual patients may have been included multiple times over the course of the study. Hospitalizations were excluded if they did not have complete Medicare Severity-Diagnosis Related Group (MS-DRG) data,12 since this was used as our severity of illness marker. This occurred either because patients were not discharged by the end of the study period or because they had a length of stay of less than one day, because this metric was not assigned to these short-stay (observation) patients.
Data Collection
All electronic orders placed during the study period were obtained by extracting data from Epic’s Clarity database. Our EHR allows for the use of order sets; each order in these sets was counted individually, so that an order set with several orders would not be identified as one order. We identified the time and date that the order was placed, the ordering physician, the identity of the patient for which the order was placed, and the location of the patient when the order was placed, to determine the level of care (ICU, step-down, or general medicine unit). To track the composite volume of orders placed by resident teams, we matched each ordering physician to his or her corresponding resident team using our physician scheduling database, Amion (Spiral Software). We obtained team census by tabulating the total number of patients that a single resident team placed orders on over the course of a given calendar day. From billing data, we identified the MS-DRG weight that was assigned at the end of each hospitalization. Finally, we collected data on adherence to two discharge-related quality metrics to determine whether increased order volume was associated with decreased rates of adherence to these metrics. Using departmental patient-level quality improvement data, we determined whether each metric was met on discharge at the patient level. We also extracted patient-level demographic data, including age, sex, and insurance status, from this departmental quality improvement database.
Discharge Quality Outcome Metrics
We hypothesized that as the total daily electronic orders of a resident team increased, the rate of completion of two discharge-related quality metrics would decline due to the greater time constraints placed on the teams. The first metric we used was the completion of a high-quality after-visit summary (AVS), which has been described by the Centers for Medicare and Medicaid Services as part of its Meaningful Use Initiative.13 It was selected by the residents in our program as a particularly high-priority quality metric. Our institution specifically defines a “high-quality” AVS as including the following three components: a principal hospital problem, patient instructions, and follow-up information. The second discharge-related quality metric was the completion of a timely discharge summary, another measure recognized as a critical component in high-quality care.14 To be considered timely, the discharge summary had to be filed no later than 24 hours after the discharge order was entered into the EHR. This metric was more recently tracked by the internal medicine department and was not selected by the residents as a high-priority metric.
Statistical Analysis
To examine how the order volume per day changed throughout each sequential day of hospital admission, mean orders per hospital day with 95% CIs were plotted. We performed an aggregate analysis of all orders placed for each patient per day across three different levels of care (ICU, step-down, and general medicine). For each day of the study period, we summed all orders for all patients according to their location and divided by the number of total patients in each location to identify the average number of orders written for an ICU, step-down, and general medicine patient that day. We then calculated the mean daily orders for an ICU, step-down, and general medicine patient over the entire study period. We used ANOVA to test for statistically significant differences between the mean daily orders between these locations.
To examine the relationship between severity of illness and order volume, we performed an unadjusted patient-level analysis of orders per patient in the first three days of each hospitalization and stratified the data by the MS-DRG payment weight, which we divided into four quartiles. For each quartile, we calculated the mean number of orders placed in the first three days of admission and used ANOVA to test for statistically significant differences. We restricted the orders to the first three days of hospitalization instead of calculating mean orders per day of hospitalization because we postulated that the majority of orders were entered in these first few days and that with increasing length of stay (which we expected to occur with higher MS-DRG weight), the order volume becomes highly variable, which would tend to skew the mean orders per day.
We used multivariable logistic regression to determine whether the volume of electronic orders on the day of a given patient’s discharge, and also on the day before a given patient’s discharge, was a significant predictor of receiving a high-quality AVS. We adjusted for team census on the day of discharge, MS-DRG weight, age, sex, and insurance status. We then conducted a separate analysis of the association between electronic order volume and likelihood of completing a timely discharge summary among patients where discharge summary data were available. Logistic regression for each case was performed independently, so that team orders on the day prior to a patient’s discharge were not included in the model for the relationship between team orders on the day of a patient’s discharge and the discharge-related quality metric of interest, and vice versa, since including both in the model would be potentially disruptive given that orders on the day before and day of a patient’s discharge are likely correlated.
We also performed a subanalysis in which we restricted orders to only those placed during the daytime hours (7
IRB Approval
The study was approved by the UCSF Institutional Review Board and was granted a waiver of informed consent.
RESULTS
Population
We identified 7,296 eligible hospitalizations during the study period. After removing hospitalizations according to our exclusion criteria (Figure 1), there were 5,032 hospitalizations that were used in the analysis for which a total of 929,153 orders were written. The vast majority of patients received at least one order per day; fewer than 1% of encounter-days had zero associated orders. The top 10 discharge diagnoses identified in the cohort are listed in Appendix Table 1. A breakdown of orders by order type, across the entire cohort, is displayed in Appendix Table 2. The mean number of orders per patient per day of hospitalization is plotted in the Appendix Figure, which indicates that the number of orders is highest on the day of admission, decreases significantly after the first few days, and becomes increasingly variable with longer lengths of stay.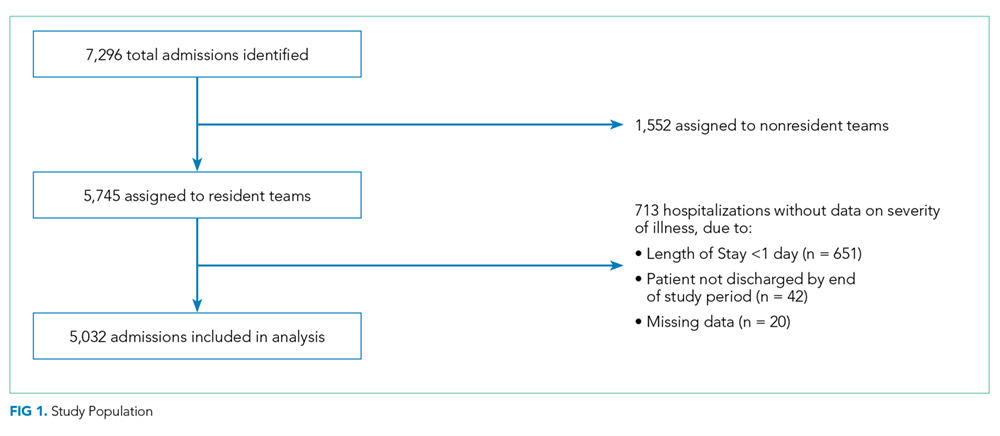
Patient Level of Care and Severity of Illness Metrics
Patients at a higher level of care had, on average, more orders entered per day. The mean order frequency was 40 orders per day for an ICU patient (standard deviation [SD] 13, range 13-134), 24 for a step-down patient (SD 6, range 11-48), and 19 for a general medicine unit patient (SD 3, range 10-31). The difference in mean daily orders was statistically significant (P < .001, Figure 2a).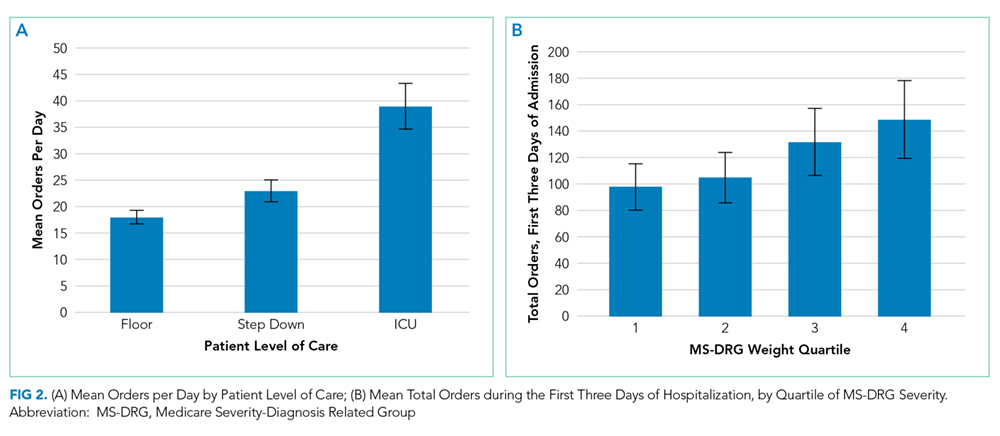
Orders also correlated with increasing severity of illness. Patients in the lowest quartile of MS-DRG weight received, on average, 98 orders in the first three days of hospitalization (SD 35, range 2-349), those in the second quartile received 105 orders (SD 38, range 10-380), those in the third quartile received 132 orders (SD 51, range 17-436), and those in the fourth and highest quartile received 149 orders (SD 59, range 32-482). Comparisons between each of these severity of illness categories were significant (P < .001, Figure 2b).
Discharge-Related Quality Metrics
The median number of orders per internal medicine team per day was 343 (IQR 261- 446). Of the 5,032 total discharged patients, 3,657 (73%) received a high-quality AVS on discharge. After controlling for team census, severity of illness, and demographic factors, there was no statistically significant association between total orders on the day of discharge and odds of receiving a high-quality AVS (OR 1.01; 95% CI 0.96-1.06), or between team orders placed the day prior to discharge and odds of receiving a high-quality AVS (OR 0.99; 95% CI 0.95-1.04; Table 1). When we restricted our analysis to orders placed during daytime hours (7 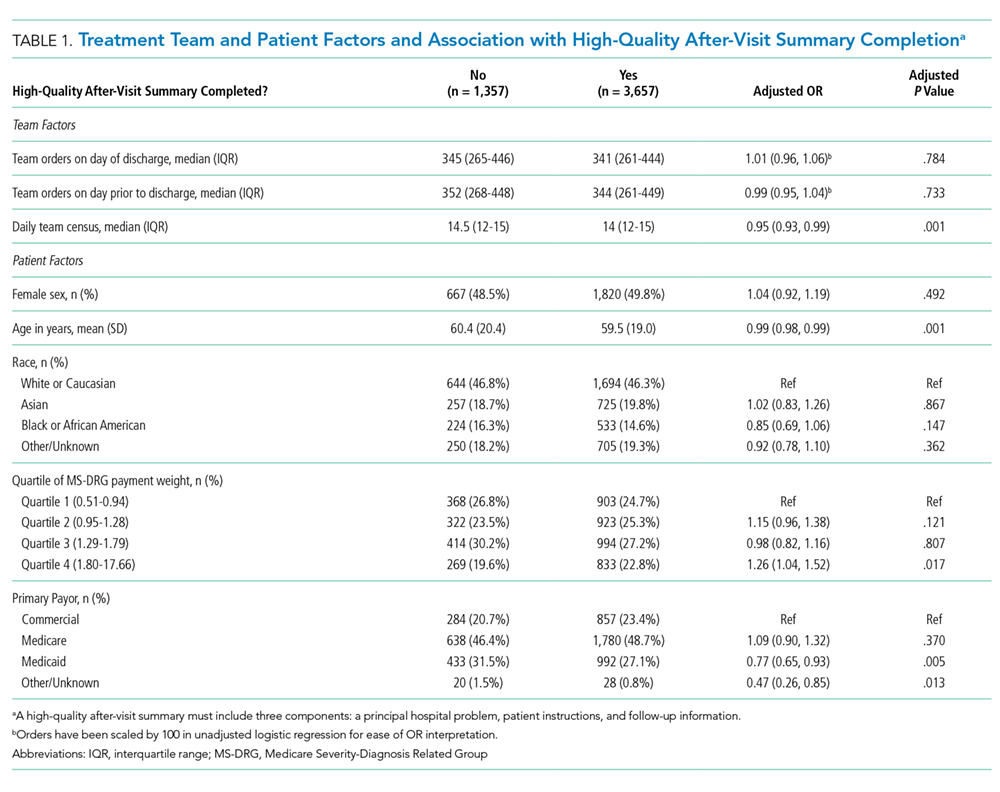
There were 3,835 patients for whom data on timing of discharge summary were available. Of these, 3,455 (91.2%) had a discharge summary completed within 24 hours. After controlling for team census, severity of illness, and demographic factors, there was no statistically significant association between total orders placed by the team on a patient’s day of discharge and odds of receiving a timely discharge summary (OR 0.96; 95% CI 0.88-1.05). However, patients were 12% less likely to receive a timely discharge summary for every 100 extra orders the team placed on the day prior to discharge (OR 0.88, 95% CI 0.82-0.95). Patients who received a timely discharge summary were cared for by teams who placed a median of 345 orders the day prior to their discharge, whereas those that did not receive a timely discharge summary were cared for by teams who placed a significantly higher number of orders (375) on the day prior to discharge (Table 2). When we restricted our analysis to only daytime orders, there were no significant changes in the findings (OR 1.00; 95% CI 0.88-1.14 for orders on the day of discharge; OR 0.84; 95% CI 0.75-0.95 for orders on the day prior to discharge).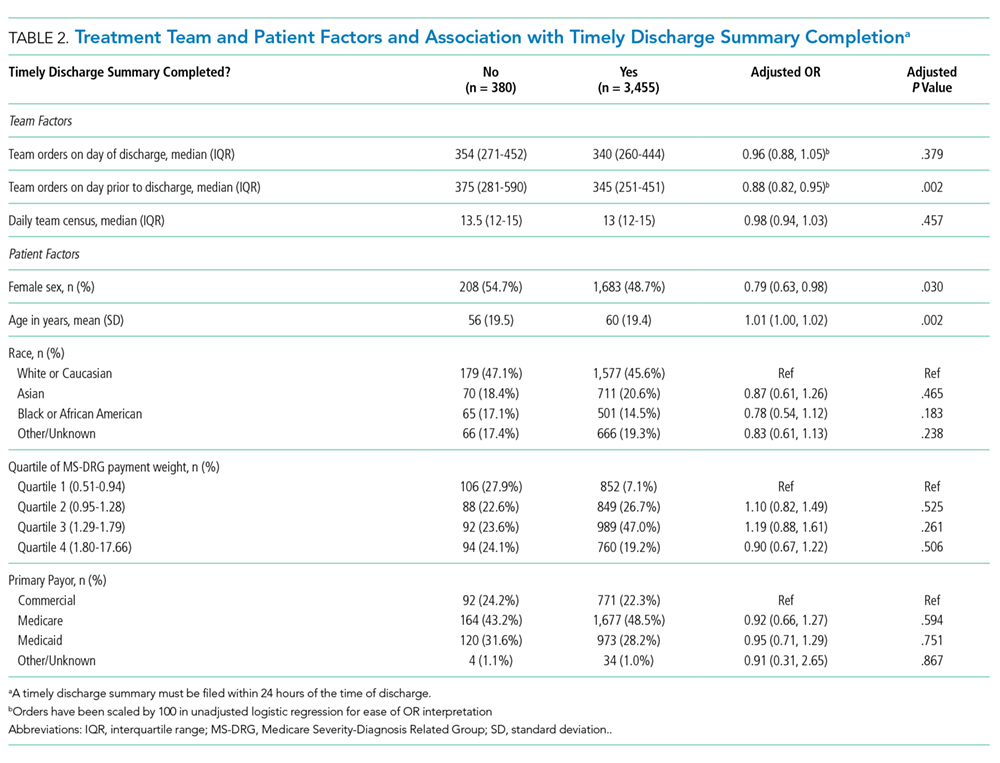
DISCUSSION
We found that electronic order volume may be a marker for patient complexity, which encompasses both level of care and severity of illness, and could be a marker of resident physician workload that harnesses readily available data from an EHR. Recent time-motion studies of internal medicine residents indicate that the majority of trainees’ time is spent on computers, engaged in indirect patient care activities such as reading electronic charts, entering electronic orders, and writing computerized notes.15-18 Capturing these tasks through metrics such as electronic order volume, as we did in this study, can provide valuable insights into resident physician workflow.
We found that ICU patients received more than twice as many orders per day than did general acute care-level patients. Furthermore, we found that patients whose hospitalizations fell into the highest MS-DRG weight quartile received approximately 50% more orders during the first three days of admission compared to that of patients whose hospitalizations fell into the lowest quartile. This strong association indicates that electronic order volume could provide meaningful additional information, in concert with other factors such as census, to describe resident physician workload.
We did not find that our workload measure was significantly associated with high-quality AVS completion. There are several possible explanations for this finding. First, adherence to this quality metric may be independent of workload, possibly because it is highly prioritized by residents at our institution. Second, adherence may only be impacted at levels of workload greater than what was experienced by the residents in our study. Finally, electronic order volume may not encompass enough of total workload to be reliably representative of resident work. However, the tight correlation between electronic order volume with severity of illness and level of care, in conjunction with the finding that patients were less likely to receive a timely discharge summary when workload was high on the day prior to a patient’s discharge, suggests that electronic order volume does indeed encompass a meaningful component of workload, and that with higher workload, adherence to some quality metrics may decline. We found that patients who received a timely discharge summary were discharged by teams who entered 30 fewer orders on the day before discharge compared with patients who did not receive a timely discharge summary. In addition to being statistically significant, it is also likely that this difference is clinically significant, although a determination of clinical significance is outside the scope of this study. Further exploration into the relationship between order volume and other quality metrics that are perhaps more sensitive to workload would be interesting.
The primary strength of our study is in how it demonstrates that EHRs can be harnessed to provide additional insights into clinical workload in a quantifiable and automated manner. Although there are a wide range of EHRs currently in use across the country, the capability to track electronic orders is common and could therefore be used broadly across institutions, with tailoring and standardization specific to each site. This technique is similar to that used by prior investigators who characterized the workload of pediatric residents by orders entered and notes written in the electronic medical record.19 However, our study is unique, in that we explored the relationship between electronic order volume and patient-level severity metrics as well as discharge-related quality metrics.
Our study is limited by several factors. When conceptualizing resident workload, several other elements that contribute to a sense of “busyness” may be independent of electronic orders and were not measured in our study.20 These include communication factors (such as language discordance, discussion with consulting services, and difficult end-of-life discussions), environmental factors (such as geographic localization), resident physician team factors (such as competing clinical or educational responsibilities), timing (in terms of day of week as well as time of year, since residents in July likely feel “busier” than residents in May), and ultimate discharge destination for patients (those going to a skilled nursing facility may require discharge documentation more urgently). Additionally, we chose to focus on the workload of resident teams, as represented by team orders, as opposed to individual work, which may be more directly correlated to our outcomes of interest, completion of a high-quality AVS, and timely discharge summary, which are usually performed by individuals.
Furthermore, we did not measure the relationship between our objective measure of workload and clinical endpoints. Instead, we chose to focus on process measures because they are less likely to be confounded by clinical factors independent of physician workload.21 Future studies should also consider obtaining direct resident-level measures of “busyness” or burnout, or other resident-centered endpoints, such as whether residents left the hospital at times consistent with duty hour regulations or whether they were able to attend educational conferences.
These limitations pose opportunities for further efforts to more comprehensively characterize clinical workload. Additional research is needed to understand and quantify the impact of patient, physician, and environmental factors that are not reflected by electronic order volume. Furthermore, an exploration of other electronic surrogates for clinical workload, such as paging volume and other EHR-derived data points, could also prove valuable in further describing the clinical workload. Future studies should also examine whether there is a relationship between these novel markers of workload and further outcomes, including both process measures and clinical endpoints.
CONCLUSIONS
Electronic order volume may provide valuable additional information for estimating the workload of resident physicians caring for hospitalized patients. Further investigation to determine whether the statistically significant differences identified in this study are clinically significant, how the technique used in this work may be applied to different EHRs, an examination of other EHR-derived metrics that may represent workload, and an exploration of additional patient-centered outcomes may be warranted.
Disclosures
Rajkomar reports personal fees from Google LLC, outside the submitted work. Dr. Khanna reports that during the conduct of the study, his salary, and the development of CareWeb (a communication platform that includes a smartphone-based paging application in use in several inpatient clinical units at University of California, San Francisco [UCSF] Medical Center) were supported by funding from the Center for Digital Health Innovation at UCSF. The CareWeb software has been licensed by Voalte.
Disclaimer
The views expressed in the submitted article are of the authors and not an official position of the institution.
1. Lurie JD, Wachter RM. Hospitalist staffing requirements. Eff Clin Pract. 1999;2(3):126-30. PubMed
2. Wachter RM. Hospitalist workload: The search for the magic number. JAMA Intern Med. 2014;174(5):794-795. doi: 10.1001/jamainternmed.2014.18. PubMed
3. Adler-Milstein J, DesRoches CM, Kralovec P, et al. Electronic health record adoption in US hospitals: progress continues, but challenges persist. Health Aff (Millwood). 2015;34(12):2174-2180. doi: 10.1377/hlthaff.2015.0992. PubMed
4. The Office of the National Coordinator for Health Information Technology, Health IT Dashboard. [cited 2018 April 4]. https://dashboard.healthit.gov/quickstats/quickstats.php Accessed June 28, 2018.
5. Index for Excerpts from the American Recovery and Reinvestment Act of 2009. Health Information Technology (HITECH) Act 2009. p. 112-164.
6. van der Sijs H, Aarts J, Vulto A, Berg M. Overriding of drug safety alerts in computerized physician order entry. J Am Med Inform Assoc. 2006;13(2):138-147. doi: 10.1197/jamia.M1809. PubMed
7. Ancker JS, Kern LM1, Edwards A, et al. How is the electronic health record being used? Use of EHR data to assess physician-level variability in technology use. J Am Med Inform Assoc. 2014;21(6):1001-1008. doi: 10.1136/amiajnl-2013-002627. PubMed
8. Hendey GW, Barth BE, Soliz T. Overnight and postcall errors in medication orders. Acad Emerg Med. 2005;12(7):629-634. doi: 10.1197/j.aem.2005.02.009. PubMed
9. Elliott DJ, Young RS2, Brice J3, Aguiar R4, Kolm P. Effect of hospitalist workload on the quality and efficiency of care. JAMA Intern Med. 2014;174(5):786-793. doi: 10.1001/jamainternmed.2014.300. PubMed
10. Ong M, Bostrom A, Vidyarthi A, McCulloch C, Auerbach A. House staff team workload and organization effects on patient outcomes in an academic general internal medicine inpatient service. Arch Intern Med. 2007;167(1):47-52. doi: 10.1001/archinte.167.1.47. PubMed
11. Epic Systems. [cited 2017 March 28]; Available from: http://www.epic.com/. Accessed June 28, 2018.
12. MS-DRG Classifications and software. https://www.cms.gov/Medicare/Medicare-Fee-for-Service-Payment/AcuteInpatientPPS/MS-DRG-Classifications-and-Software.html. Accessed June 28, 2018.
13. Hummel J, Evans P. Providing Clinical Summaries to Patients after Each Office Visit: A Technical Guide. [cited 2017 March 27]. https://www.healthit.gov/sites/default/files/measure-tools/avs-tech-guide.pdf. Accessed June 28, 2018.
14. Haycock M, Stuttaford L, Ruscombe-King O, Barker Z, Callaghan K, Davis T. Improving the percentage of electronic discharge summaries completed within 24 hours of discharge. BMJ Qual Improv Rep. 2014;3(1) pii: u205963.w2604. doi: 10.1136/bmjquality.u205963.w2604. PubMed
15. Block L, Habicht R, Wu AW, et al. In the wake of the 2003 and 2011 duty hours regulations, how do internal medicine interns spend their time? J Gen Intern Med. 2013;28(8):1042-1047. doi: 10.1007/s11606-013-2376-6. PubMed
16. Wenger N, Méan M, Castioni J, Marques-Vidal P, Waeber G, Garnier A. Allocation of internal medicine resident time in a Swiss hospital: a time and motion study of day and evening shifts. Ann Intern Med. 2017;166(8):579-586. doi: 10.7326/M16-2238. PubMed
17. Mamykina L, Vawdrey DK, Hripcsak G. How do residents spend their shift time? A time and motion study with a particular focus on the use of computers. Acad Med. 2016;91(6):827-832. doi: 10.1097/ACM.0000000000001148. PubMed
18. Fletcher KE, Visotcky AM, Slagle JM, Tarima S, Weinger MB, Schapira MM. The composition of intern work while on call. J Gen Intern Med. 2012;27(11):1432-1437. doi: 10.1007/s11606-012-2120-7. PubMed
19. Was A, Blankenburg R, Park KT. Pediatric resident workload intensity and variability. Pediatrics 2016;138(1):e20154371. doi: 10.1542/peds.2015-4371. PubMed
20. Michtalik HJ, Pronovost PJ, Marsteller JA, Spetz J, Brotman DJ. Developing a model for attending physician workload and outcomes. JAMA Intern Med. 2013;173(11):1026-1028. doi: 10.1001/jamainternmed.2013.405. PubMed
21. Mant J. Process versus outcome indicators in the assessment of quality of health care. Int J Qual Health Care. 2001;13(6):475-480. doi: 10.1093/intqhc/13.6.475. PubMed
Resident physician workload has traditionally been measured by patient census.1,2 However, census and other volume-based metrics such as daily admissions may not accurately reflect workload due to variation in patient complexity. Relative value units (RVUs) are another commonly used marker of workload, but the validity of this metric relies on accurate coding, usually done by the attending physician, and is less directly related to resident physician workload. Because much of hospital-based medicine is mediated through the electronic health record (EHR), which can capture differences in patient complexity,3 electronic records could be harnessed to more comprehensively describe residents’ work. Current government estimates indicate that several hundred companies offer certified EHRs, thanks in large part to the Health Information Technology for Economic and Clinical Health (HITECH) Act of 2009, which aimed to promote adoption and meaningful use of health information technology.4, 5 These systems can collect important data about the usage and operating patterns of physicians, which may provide an insight into workload.6-8
Accurately measuring workload is important because of the direct link that has been drawn between physician workload and quality metrics. In a study of attending hospitalists, higher workload, as measured by patient census and RVUs, was associated with longer lengths of stay and higher costs of hospitalization.9 Another study among medical residents found that as daily admissions increased, length of stay, cost, and inpatient mortality appeared to rise.10 Although these studies used only volume-based workload metrics, the implication that high workload may negatively impact patient care hints at a possible trade-off between the two that should inform discussions of physician productivity.
In the current study, we examine whether data obtained from the EHR, particularly electronic order volume, could provide valuable information, in addition to patient volume, about resident physician workload. We first tested the feasibility and validity of using electronic order volume as an important component of clinical workload by examining the relationship between electronic order volume and well-established factors that are likely to increase the workload of residents, including patient level of care and severity of illness. Then, using order volume as a marker for workload, we sought to describe whether higher order volumes were associated with two discharge-related quality metrics, completion of a high-quality after-visit summary and timely discharge summary, postulating that quality metrics may suffer when residents are busier.
METHODS
Study Design and Setting
We performed a single-center retrospective cohort study of patients admitted to the internal medicine service at the University of California, San Francisco (UCSF) Medical Center between May 1, 2015 and July 31, 2016. UCSF is a 600-bed academic medical center, and the inpatient internal medicine teaching service manages an average daily census of 80-90 patients. Medicine teams care for patients on the general acute-care wards, the step-down units (for patients with higher acuity of care), and also patients in the intensive care unit (ICU). ICU patients are comanaged by general medicine teams and intensive care teams; internal medicine teams enter all electronic orders for ICU patients, except for orders for respiratory care or sedating medications. The inpatient internal medicine teaching service comprises eight teams each supervised by an attending physician, a senior resident (in the second or third year of residency training), two interns, and a third- and/or fourth-year medical student. Residents place all clinical orders and complete all clinical documentation through the EHR (Epic Systems, Verona, Wisconsin).11 Typically, the bulk of the orders and documentation, including discharge documentation, is performed by interns; however, the degree of senior resident involvement in these tasks is variable and team-dependent. In addition to the eight resident teams, there are also four attending hospitalist-only internal medicine teams, who manage a service of ~30-40 patients.
Study Population
Our study population comprised all hospitalized adults admitted to the eight resident-run teams on the internal medicine teaching service. Patients cared for by hospitalist-only teams were not included in this analysis. Because the focus of our study was on hospitalizations, individual patients may have been included multiple times over the course of the study. Hospitalizations were excluded if they did not have complete Medicare Severity-Diagnosis Related Group (MS-DRG) data,12 since this was used as our severity of illness marker. This occurred either because patients were not discharged by the end of the study period or because they had a length of stay of less than one day, because this metric was not assigned to these short-stay (observation) patients.
Data Collection
All electronic orders placed during the study period were obtained by extracting data from Epic’s Clarity database. Our EHR allows for the use of order sets; each order in these sets was counted individually, so that an order set with several orders would not be identified as one order. We identified the time and date that the order was placed, the ordering physician, the identity of the patient for which the order was placed, and the location of the patient when the order was placed, to determine the level of care (ICU, step-down, or general medicine unit). To track the composite volume of orders placed by resident teams, we matched each ordering physician to his or her corresponding resident team using our physician scheduling database, Amion (Spiral Software). We obtained team census by tabulating the total number of patients that a single resident team placed orders on over the course of a given calendar day. From billing data, we identified the MS-DRG weight that was assigned at the end of each hospitalization. Finally, we collected data on adherence to two discharge-related quality metrics to determine whether increased order volume was associated with decreased rates of adherence to these metrics. Using departmental patient-level quality improvement data, we determined whether each metric was met on discharge at the patient level. We also extracted patient-level demographic data, including age, sex, and insurance status, from this departmental quality improvement database.
Discharge Quality Outcome Metrics
We hypothesized that as the total daily electronic orders of a resident team increased, the rate of completion of two discharge-related quality metrics would decline due to the greater time constraints placed on the teams. The first metric we used was the completion of a high-quality after-visit summary (AVS), which has been described by the Centers for Medicare and Medicaid Services as part of its Meaningful Use Initiative.13 It was selected by the residents in our program as a particularly high-priority quality metric. Our institution specifically defines a “high-quality” AVS as including the following three components: a principal hospital problem, patient instructions, and follow-up information. The second discharge-related quality metric was the completion of a timely discharge summary, another measure recognized as a critical component in high-quality care.14 To be considered timely, the discharge summary had to be filed no later than 24 hours after the discharge order was entered into the EHR. This metric was more recently tracked by the internal medicine department and was not selected by the residents as a high-priority metric.
Statistical Analysis
To examine how the order volume per day changed throughout each sequential day of hospital admission, mean orders per hospital day with 95% CIs were plotted. We performed an aggregate analysis of all orders placed for each patient per day across three different levels of care (ICU, step-down, and general medicine). For each day of the study period, we summed all orders for all patients according to their location and divided by the number of total patients in each location to identify the average number of orders written for an ICU, step-down, and general medicine patient that day. We then calculated the mean daily orders for an ICU, step-down, and general medicine patient over the entire study period. We used ANOVA to test for statistically significant differences between the mean daily orders between these locations.
To examine the relationship between severity of illness and order volume, we performed an unadjusted patient-level analysis of orders per patient in the first three days of each hospitalization and stratified the data by the MS-DRG payment weight, which we divided into four quartiles. For each quartile, we calculated the mean number of orders placed in the first three days of admission and used ANOVA to test for statistically significant differences. We restricted the orders to the first three days of hospitalization instead of calculating mean orders per day of hospitalization because we postulated that the majority of orders were entered in these first few days and that with increasing length of stay (which we expected to occur with higher MS-DRG weight), the order volume becomes highly variable, which would tend to skew the mean orders per day.
We used multivariable logistic regression to determine whether the volume of electronic orders on the day of a given patient’s discharge, and also on the day before a given patient’s discharge, was a significant predictor of receiving a high-quality AVS. We adjusted for team census on the day of discharge, MS-DRG weight, age, sex, and insurance status. We then conducted a separate analysis of the association between electronic order volume and likelihood of completing a timely discharge summary among patients where discharge summary data were available. Logistic regression for each case was performed independently, so that team orders on the day prior to a patient’s discharge were not included in the model for the relationship between team orders on the day of a patient’s discharge and the discharge-related quality metric of interest, and vice versa, since including both in the model would be potentially disruptive given that orders on the day before and day of a patient’s discharge are likely correlated.
We also performed a subanalysis in which we restricted orders to only those placed during the daytime hours (7
IRB Approval
The study was approved by the UCSF Institutional Review Board and was granted a waiver of informed consent.
RESULTS
Population
We identified 7,296 eligible hospitalizations during the study period. After removing hospitalizations according to our exclusion criteria (Figure 1), there were 5,032 hospitalizations that were used in the analysis for which a total of 929,153 orders were written. The vast majority of patients received at least one order per day; fewer than 1% of encounter-days had zero associated orders. The top 10 discharge diagnoses identified in the cohort are listed in Appendix Table 1. A breakdown of orders by order type, across the entire cohort, is displayed in Appendix Table 2. The mean number of orders per patient per day of hospitalization is plotted in the Appendix Figure, which indicates that the number of orders is highest on the day of admission, decreases significantly after the first few days, and becomes increasingly variable with longer lengths of stay.
Patient Level of Care and Severity of Illness Metrics
Patients at a higher level of care had, on average, more orders entered per day. The mean order frequency was 40 orders per day for an ICU patient (standard deviation [SD] 13, range 13-134), 24 for a step-down patient (SD 6, range 11-48), and 19 for a general medicine unit patient (SD 3, range 10-31). The difference in mean daily orders was statistically significant (P < .001, Figure 2a).
Orders also correlated with increasing severity of illness. Patients in the lowest quartile of MS-DRG weight received, on average, 98 orders in the first three days of hospitalization (SD 35, range 2-349), those in the second quartile received 105 orders (SD 38, range 10-380), those in the third quartile received 132 orders (SD 51, range 17-436), and those in the fourth and highest quartile received 149 orders (SD 59, range 32-482). Comparisons between each of these severity of illness categories were significant (P < .001, Figure 2b).
Discharge-Related Quality Metrics
The median number of orders per internal medicine team per day was 343 (IQR 261- 446). Of the 5,032 total discharged patients, 3,657 (73%) received a high-quality AVS on discharge. After controlling for team census, severity of illness, and demographic factors, there was no statistically significant association between total orders on the day of discharge and odds of receiving a high-quality AVS (OR 1.01; 95% CI 0.96-1.06), or between team orders placed the day prior to discharge and odds of receiving a high-quality AVS (OR 0.99; 95% CI 0.95-1.04; Table 1). When we restricted our analysis to orders placed during daytime hours (7
There were 3,835 patients for whom data on timing of discharge summary were available. Of these, 3,455 (91.2%) had a discharge summary completed within 24 hours. After controlling for team census, severity of illness, and demographic factors, there was no statistically significant association between total orders placed by the team on a patient’s day of discharge and odds of receiving a timely discharge summary (OR 0.96; 95% CI 0.88-1.05). However, patients were 12% less likely to receive a timely discharge summary for every 100 extra orders the team placed on the day prior to discharge (OR 0.88, 95% CI 0.82-0.95). Patients who received a timely discharge summary were cared for by teams who placed a median of 345 orders the day prior to their discharge, whereas those that did not receive a timely discharge summary were cared for by teams who placed a significantly higher number of orders (375) on the day prior to discharge (Table 2). When we restricted our analysis to only daytime orders, there were no significant changes in the findings (OR 1.00; 95% CI 0.88-1.14 for orders on the day of discharge; OR 0.84; 95% CI 0.75-0.95 for orders on the day prior to discharge).
DISCUSSION
We found that electronic order volume may be a marker for patient complexity, which encompasses both level of care and severity of illness, and could be a marker of resident physician workload that harnesses readily available data from an EHR. Recent time-motion studies of internal medicine residents indicate that the majority of trainees’ time is spent on computers, engaged in indirect patient care activities such as reading electronic charts, entering electronic orders, and writing computerized notes.15-18 Capturing these tasks through metrics such as electronic order volume, as we did in this study, can provide valuable insights into resident physician workflow.
We found that ICU patients received more than twice as many orders per day than did general acute care-level patients. Furthermore, we found that patients whose hospitalizations fell into the highest MS-DRG weight quartile received approximately 50% more orders during the first three days of admission compared to that of patients whose hospitalizations fell into the lowest quartile. This strong association indicates that electronic order volume could provide meaningful additional information, in concert with other factors such as census, to describe resident physician workload.
We did not find that our workload measure was significantly associated with high-quality AVS completion. There are several possible explanations for this finding. First, adherence to this quality metric may be independent of workload, possibly because it is highly prioritized by residents at our institution. Second, adherence may only be impacted at levels of workload greater than what was experienced by the residents in our study. Finally, electronic order volume may not encompass enough of total workload to be reliably representative of resident work. However, the tight correlation between electronic order volume with severity of illness and level of care, in conjunction with the finding that patients were less likely to receive a timely discharge summary when workload was high on the day prior to a patient’s discharge, suggests that electronic order volume does indeed encompass a meaningful component of workload, and that with higher workload, adherence to some quality metrics may decline. We found that patients who received a timely discharge summary were discharged by teams who entered 30 fewer orders on the day before discharge compared with patients who did not receive a timely discharge summary. In addition to being statistically significant, it is also likely that this difference is clinically significant, although a determination of clinical significance is outside the scope of this study. Further exploration into the relationship between order volume and other quality metrics that are perhaps more sensitive to workload would be interesting.
The primary strength of our study is in how it demonstrates that EHRs can be harnessed to provide additional insights into clinical workload in a quantifiable and automated manner. Although there are a wide range of EHRs currently in use across the country, the capability to track electronic orders is common and could therefore be used broadly across institutions, with tailoring and standardization specific to each site. This technique is similar to that used by prior investigators who characterized the workload of pediatric residents by orders entered and notes written in the electronic medical record.19 However, our study is unique, in that we explored the relationship between electronic order volume and patient-level severity metrics as well as discharge-related quality metrics.
Our study is limited by several factors. When conceptualizing resident workload, several other elements that contribute to a sense of “busyness” may be independent of electronic orders and were not measured in our study.20 These include communication factors (such as language discordance, discussion with consulting services, and difficult end-of-life discussions), environmental factors (such as geographic localization), resident physician team factors (such as competing clinical or educational responsibilities), timing (in terms of day of week as well as time of year, since residents in July likely feel “busier” than residents in May), and ultimate discharge destination for patients (those going to a skilled nursing facility may require discharge documentation more urgently). Additionally, we chose to focus on the workload of resident teams, as represented by team orders, as opposed to individual work, which may be more directly correlated to our outcomes of interest, completion of a high-quality AVS, and timely discharge summary, which are usually performed by individuals.
Furthermore, we did not measure the relationship between our objective measure of workload and clinical endpoints. Instead, we chose to focus on process measures because they are less likely to be confounded by clinical factors independent of physician workload.21 Future studies should also consider obtaining direct resident-level measures of “busyness” or burnout, or other resident-centered endpoints, such as whether residents left the hospital at times consistent with duty hour regulations or whether they were able to attend educational conferences.
These limitations pose opportunities for further efforts to more comprehensively characterize clinical workload. Additional research is needed to understand and quantify the impact of patient, physician, and environmental factors that are not reflected by electronic order volume. Furthermore, an exploration of other electronic surrogates for clinical workload, such as paging volume and other EHR-derived data points, could also prove valuable in further describing the clinical workload. Future studies should also examine whether there is a relationship between these novel markers of workload and further outcomes, including both process measures and clinical endpoints.
CONCLUSIONS
Electronic order volume may provide valuable additional information for estimating the workload of resident physicians caring for hospitalized patients. Further investigation to determine whether the statistically significant differences identified in this study are clinically significant, how the technique used in this work may be applied to different EHRs, an examination of other EHR-derived metrics that may represent workload, and an exploration of additional patient-centered outcomes may be warranted.
Disclosures
Rajkomar reports personal fees from Google LLC, outside the submitted work. Dr. Khanna reports that during the conduct of the study, his salary, and the development of CareWeb (a communication platform that includes a smartphone-based paging application in use in several inpatient clinical units at University of California, San Francisco [UCSF] Medical Center) were supported by funding from the Center for Digital Health Innovation at UCSF. The CareWeb software has been licensed by Voalte.
Disclaimer
The views expressed in the submitted article are of the authors and not an official position of the institution.
1. Lurie JD, Wachter RM. Hospitalist staffing requirements. Eff Clin Pract. 1999;2(3):126-30. PubMed
2. Wachter RM. Hospitalist workload: The search for the magic number. JAMA Intern Med. 2014;174(5):794-795. doi: 10.1001/jamainternmed.2014.18. PubMed
3. Adler-Milstein J, DesRoches CM, Kralovec P, et al. Electronic health record adoption in US hospitals: progress continues, but challenges persist. Health Aff (Millwood). 2015;34(12):2174-2180. doi: 10.1377/hlthaff.2015.0992. PubMed
4. The Office of the National Coordinator for Health Information Technology, Health IT Dashboard. [cited 2018 April 4]. https://dashboard.healthit.gov/quickstats/quickstats.php Accessed June 28, 2018.
5. Index for Excerpts from the American Recovery and Reinvestment Act of 2009. Health Information Technology (HITECH) Act 2009. p. 112-164.
6. van der Sijs H, Aarts J, Vulto A, Berg M. Overriding of drug safety alerts in computerized physician order entry. J Am Med Inform Assoc. 2006;13(2):138-147. doi: 10.1197/jamia.M1809. PubMed
7. Ancker JS, Kern LM1, Edwards A, et al. How is the electronic health record being used? Use of EHR data to assess physician-level variability in technology use. J Am Med Inform Assoc. 2014;21(6):1001-1008. doi: 10.1136/amiajnl-2013-002627. PubMed
8. Hendey GW, Barth BE, Soliz T. Overnight and postcall errors in medication orders. Acad Emerg Med. 2005;12(7):629-634. doi: 10.1197/j.aem.2005.02.009. PubMed
9. Elliott DJ, Young RS2, Brice J3, Aguiar R4, Kolm P. Effect of hospitalist workload on the quality and efficiency of care. JAMA Intern Med. 2014;174(5):786-793. doi: 10.1001/jamainternmed.2014.300. PubMed
10. Ong M, Bostrom A, Vidyarthi A, McCulloch C, Auerbach A. House staff team workload and organization effects on patient outcomes in an academic general internal medicine inpatient service. Arch Intern Med. 2007;167(1):47-52. doi: 10.1001/archinte.167.1.47. PubMed
11. Epic Systems. [cited 2017 March 28]; Available from: http://www.epic.com/. Accessed June 28, 2018.
12. MS-DRG Classifications and software. https://www.cms.gov/Medicare/Medicare-Fee-for-Service-Payment/AcuteInpatientPPS/MS-DRG-Classifications-and-Software.html. Accessed June 28, 2018.
13. Hummel J, Evans P. Providing Clinical Summaries to Patients after Each Office Visit: A Technical Guide. [cited 2017 March 27]. https://www.healthit.gov/sites/default/files/measure-tools/avs-tech-guide.pdf. Accessed June 28, 2018.
14. Haycock M, Stuttaford L, Ruscombe-King O, Barker Z, Callaghan K, Davis T. Improving the percentage of electronic discharge summaries completed within 24 hours of discharge. BMJ Qual Improv Rep. 2014;3(1) pii: u205963.w2604. doi: 10.1136/bmjquality.u205963.w2604. PubMed
15. Block L, Habicht R, Wu AW, et al. In the wake of the 2003 and 2011 duty hours regulations, how do internal medicine interns spend their time? J Gen Intern Med. 2013;28(8):1042-1047. doi: 10.1007/s11606-013-2376-6. PubMed
16. Wenger N, Méan M, Castioni J, Marques-Vidal P, Waeber G, Garnier A. Allocation of internal medicine resident time in a Swiss hospital: a time and motion study of day and evening shifts. Ann Intern Med. 2017;166(8):579-586. doi: 10.7326/M16-2238. PubMed
17. Mamykina L, Vawdrey DK, Hripcsak G. How do residents spend their shift time? A time and motion study with a particular focus on the use of computers. Acad Med. 2016;91(6):827-832. doi: 10.1097/ACM.0000000000001148. PubMed
18. Fletcher KE, Visotcky AM, Slagle JM, Tarima S, Weinger MB, Schapira MM. The composition of intern work while on call. J Gen Intern Med. 2012;27(11):1432-1437. doi: 10.1007/s11606-012-2120-7. PubMed
19. Was A, Blankenburg R, Park KT. Pediatric resident workload intensity and variability. Pediatrics 2016;138(1):e20154371. doi: 10.1542/peds.2015-4371. PubMed
20. Michtalik HJ, Pronovost PJ, Marsteller JA, Spetz J, Brotman DJ. Developing a model for attending physician workload and outcomes. JAMA Intern Med. 2013;173(11):1026-1028. doi: 10.1001/jamainternmed.2013.405. PubMed
21. Mant J. Process versus outcome indicators in the assessment of quality of health care. Int J Qual Health Care. 2001;13(6):475-480. doi: 10.1093/intqhc/13.6.475. PubMed
Health Care Barriers and Quality of Life in Central Centrifugal Cicatricial Alopecia Patients
The etiology of central centrifugal cicatricial alopecia (CCCA), a clinical and histological pattern of hair loss on the central scalp, has been well studied. This disease is chronic and progressive, with extensive follicular destruction and eventual burnout.1,2 Central centrifugal cicatricial alopecia is most commonly seen in patients of African descent and has been shown to be 1 of the 5 most common dermatologic diagnoses in black patients.3,4 The top 5 dermatologic diagnoses within this population include acne vulgaris (28.4%), dyschromia (19.9%), eczema (9.1%), alopecia (8.3%), and seborrheic dermatitis (6.7%).4 The incidence rate of CCCA is estimated to be 5.6%.3,5 Most patients are women, with onset between the second and fourth decades of life.6
Central centrifugal cicatricial alopecia treatment efficacy is inversely correlated with disease duration. The primary goal of treatment is to prevent progression. Efforts are made to stimulate regrowth in areas that are not permanently scarred. When patients present with a substantial amount of scarring hair loss, dermatologists often are limited in their ability to achieve a cosmetically acceptable pattern of growth. Generally, hair is connected to a sense of self-worth in black women, and any type of hair loss has been shown to lead to frustration and decreased self-esteem.7 A 1994 study showed that 75% (44/58) of women with androgenetic alopecia had decreased self-esteem and 50% (29/58) had social challenges.8
The purpose of this pilot study was to determine the personal, historical, logistical, or environmental factors that preclude women from obtaining medical care for CCCA and to investigate how CCCA affects quality of life (QOL) and psychological well-being.
Methods
The investigators designed a survey study of adult, English-speaking, black women diagnosed with CCCA at the Northwestern University Department of Dermatology (Chicago, Illinois) between 2011 and 2017. Patients were selected from the electronic data warehouse compiled by the Department of Dermatology and were included if they fulfilled the following criteria: evaluated in the dermatology department between September 1, 2011, and September 30, 2017, by any faculty physician; diagnosed with CCCA; and aged 18 years or older. Patients were excluded if they did not speak English, as interpreters were not available. All patients who fulfilled the inclusion criteria provided signed informed consent prior to participation. All surveys were disseminated in the office or via telephone from fall 2016 to spring 2017 and took 10 to 15 minutes to complete. The research was approved by the authors’ institutional review board (IRB ID STU00203449).
Survey Instrument
The
Data Analysis
Analyses were completed using data analysis software JMP Pro 13 from SAS and a Microsoft Excel spreadsheet. Continuous data were presented as mean, SD, median, minimum, and maximum. Categorical data were presented as counts and percentages. Nine QOL items were aggregated into a self-esteem category (questions 30–38).
Cronbach α, a statistical measure of internal consistency and how closely related items are in a group, was used to evaluate internal consistency reliability; values of 0.70 or greater indicate acceptable reliability.
Results
Of 501 individuals contacted, 34 completed the survey (7% completion rate). Nonrespondents included 7 who refused to participate and 460 who could not be contacted. All respondents self-identified as black women. Median age at time of survey administration was 46 years (range, 28–79 years); median age at CCCA diagnosis was 42 years (range, 15–73 years). Respondents did not significantly differ in age from nonrespondents (P=.46). The majority of respondents had an associate’s degree, bachelor’s degree, or advanced degree of education (master of arts, doctor of medicine, doctor of jurisprudence, doctor of philosophy); however, 8 women reported completing some college, 1 reported completing high school, and 1 reported no schooling. Three respondents had no health insurance.
Initial Hair Loss Discovery
The majority of respondents (22/34 [65%]) were first to notice their hair loss, while 5 (15%) reported hairstylists as the initial observers. Twelve respondents (35%) initially went to a physician to learn why they were losing hair; 6 (18%) instead utilized hairstylists or the Internet. Fifteen women (44%) waited more than 1 month up to 6 months after noticing hair loss before seeing a physician instead of going immediately within a 4-week period, and 16 (47%) waited 1 year or more.
Nondermatologist Consultation
Almost half (16/34 [47%]) of the women went to a nondermatologist physician regarding their hair loss; of them, half (8/16 [50%]) reported their physician did not examine the scalp, 3 (19%) reported their physician offered a biopsy, and none of them reported that their physician diagnosed them with CCCA. The median patient rating of their nondermatologist physician interactions was good (3 on a 5-point scale). Table 1 and Figure 1 show responses to individual items.
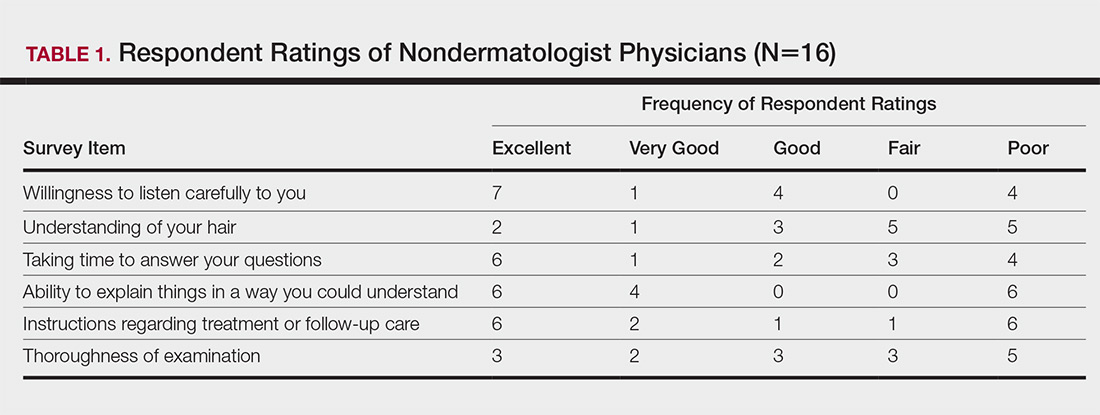
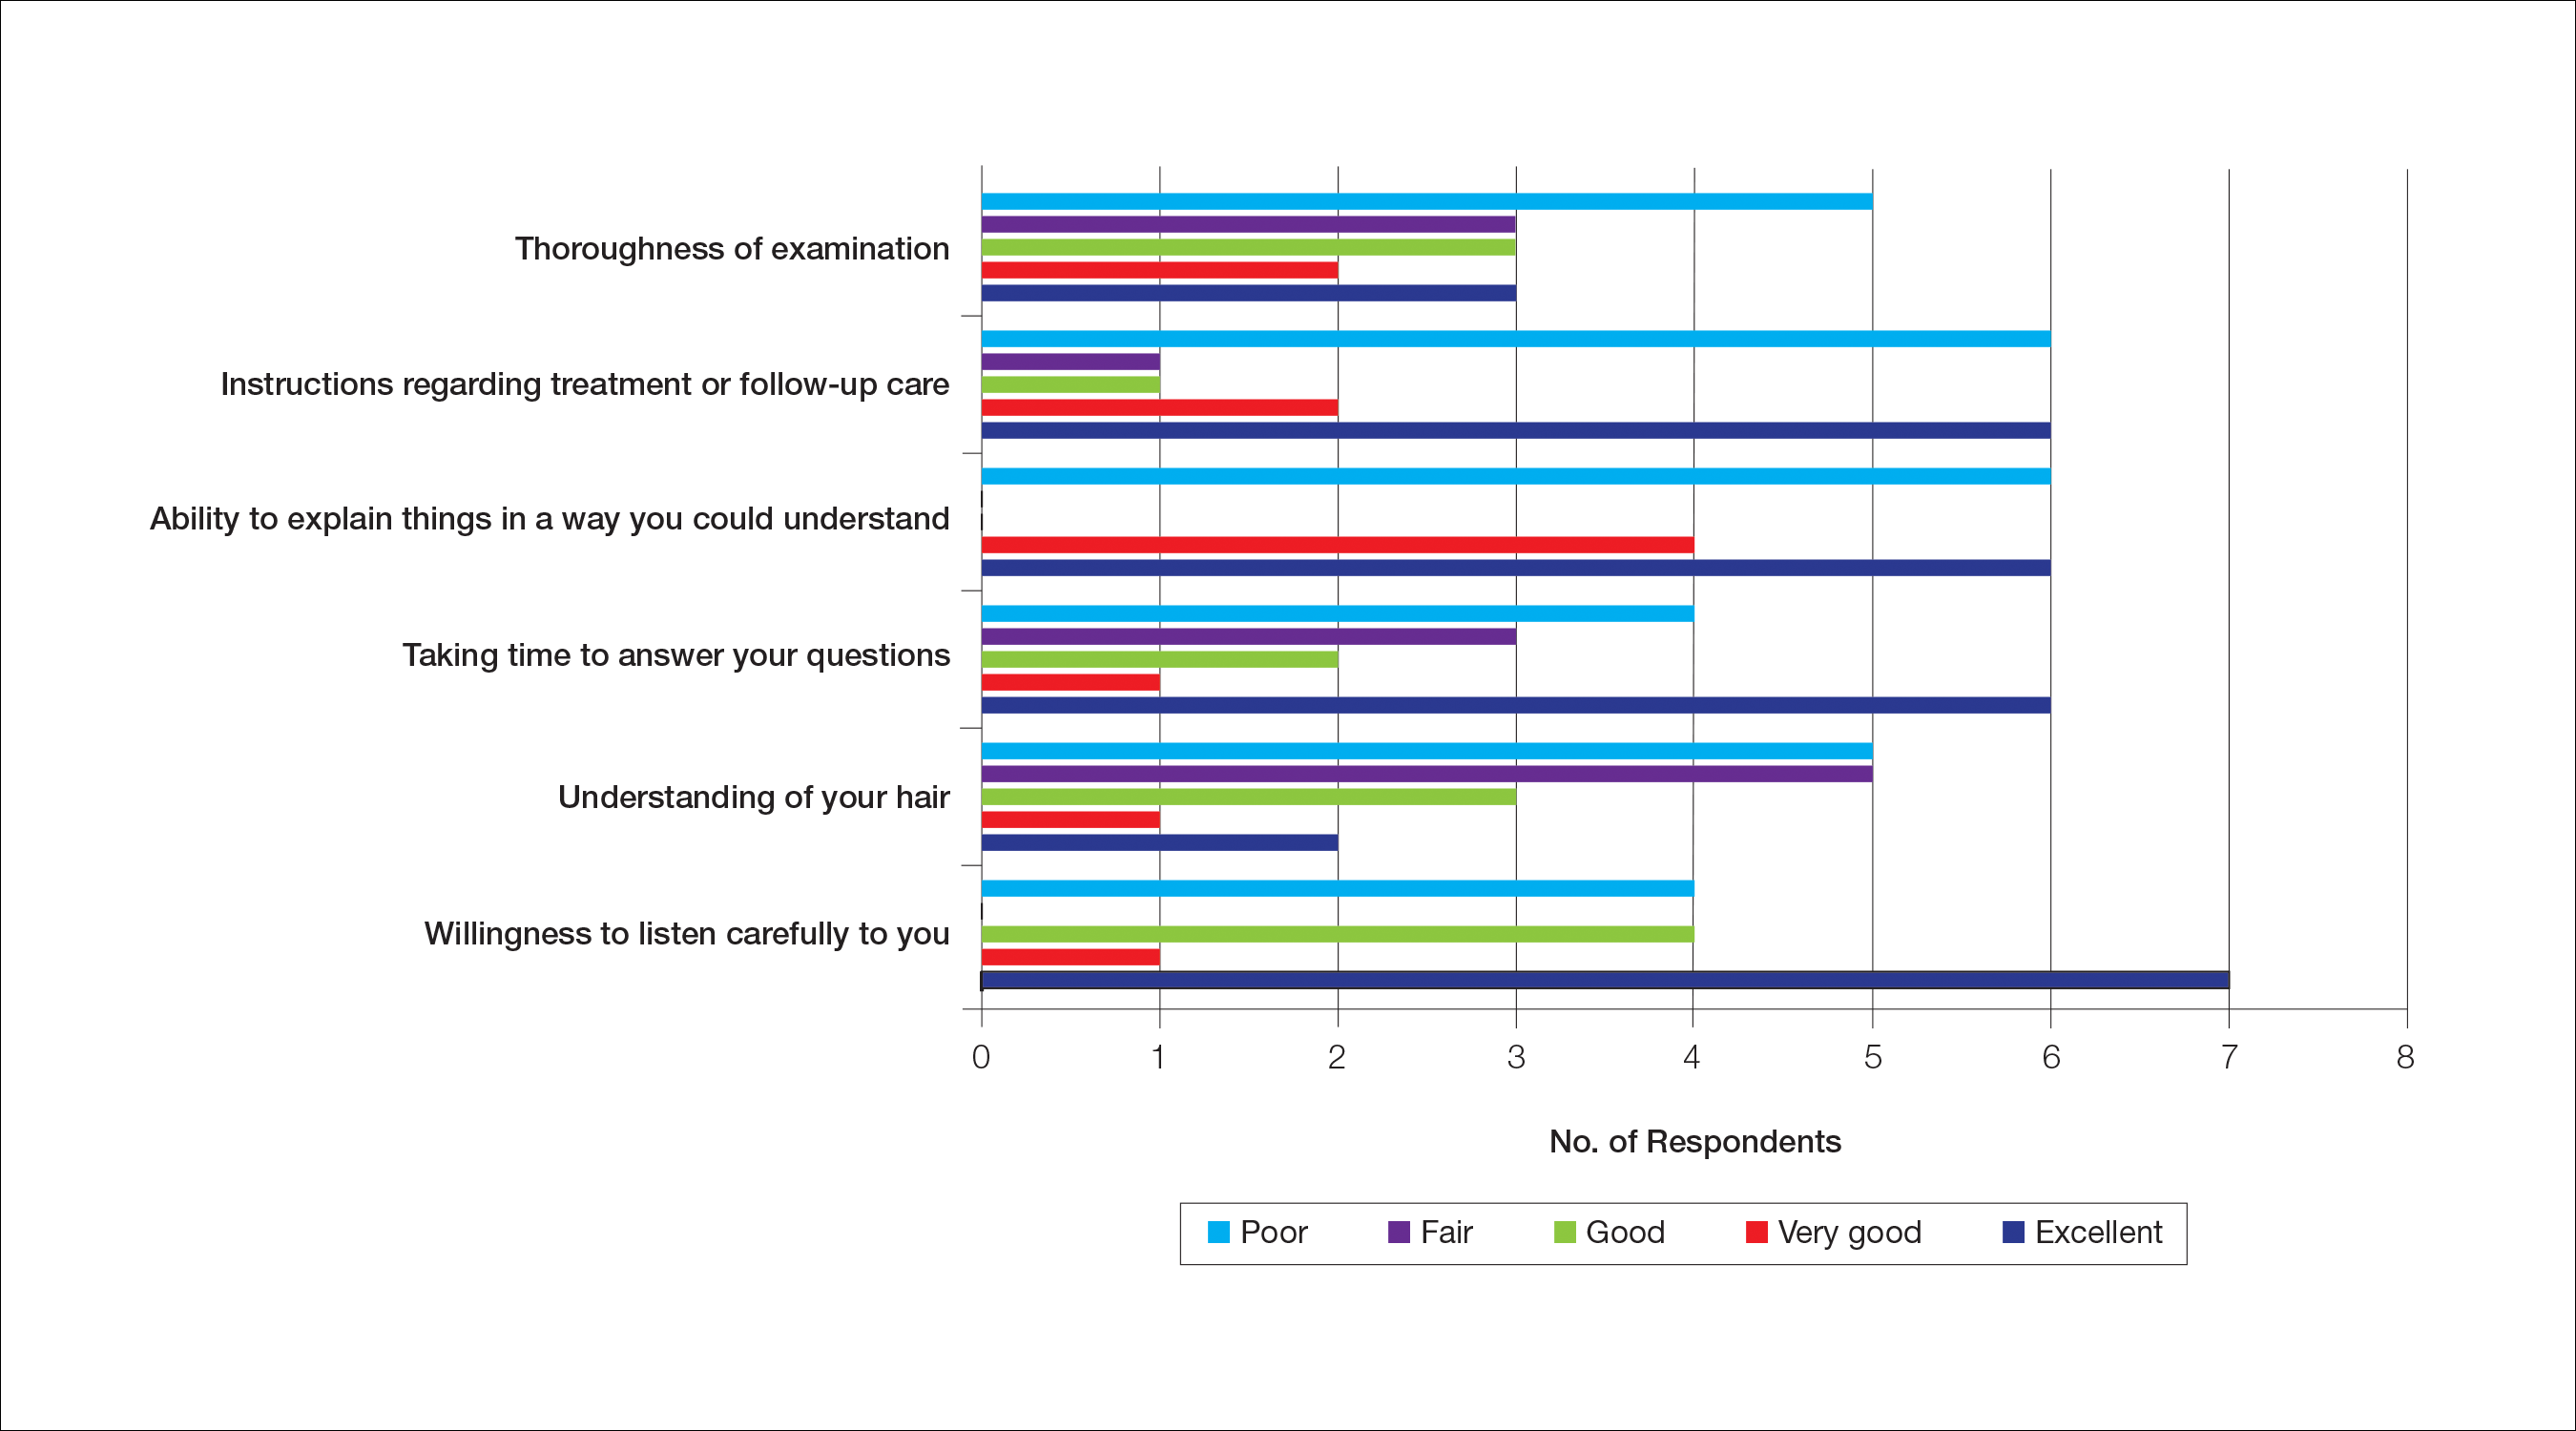
Dermatologist Consultation
All 34 respondents presented to a dermatologist. The majority of respondents (22/34 [65%]) saw either 1 or 2 dermatologists for their hair loss. Three (9%) reported their dermatologist did not examine their scalp. Twelve respondents (35%) reported their dermatologist did not offer a biopsy. Twenty-one respondents (62%) reported a CCCA diagnosis from the first dermatologist they saw. Twenty-three respondents (68%) were diagnosed by dermatologists with expertise in hair disorders. Sixteen (47%) were diagnosed by dermatologists within a skin-of-color center. Fourteen (41%) initial dermatology consultations were race concordant.
The median patient rating of their dermatologist interactions was excellent (5 on a 5-point scale). Table 2 and Figure 2 show responses to individual items. Respondents saw an average of 3 different providers, both dermatologists and otherwise.
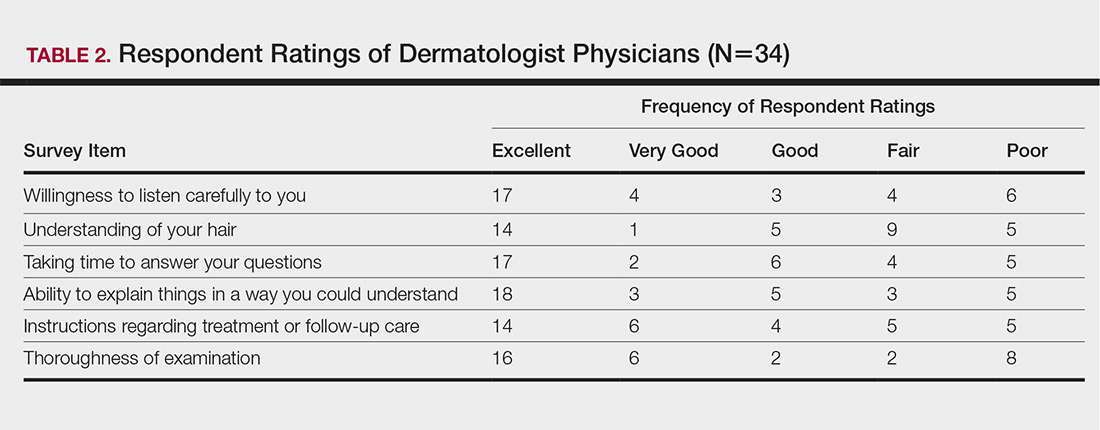
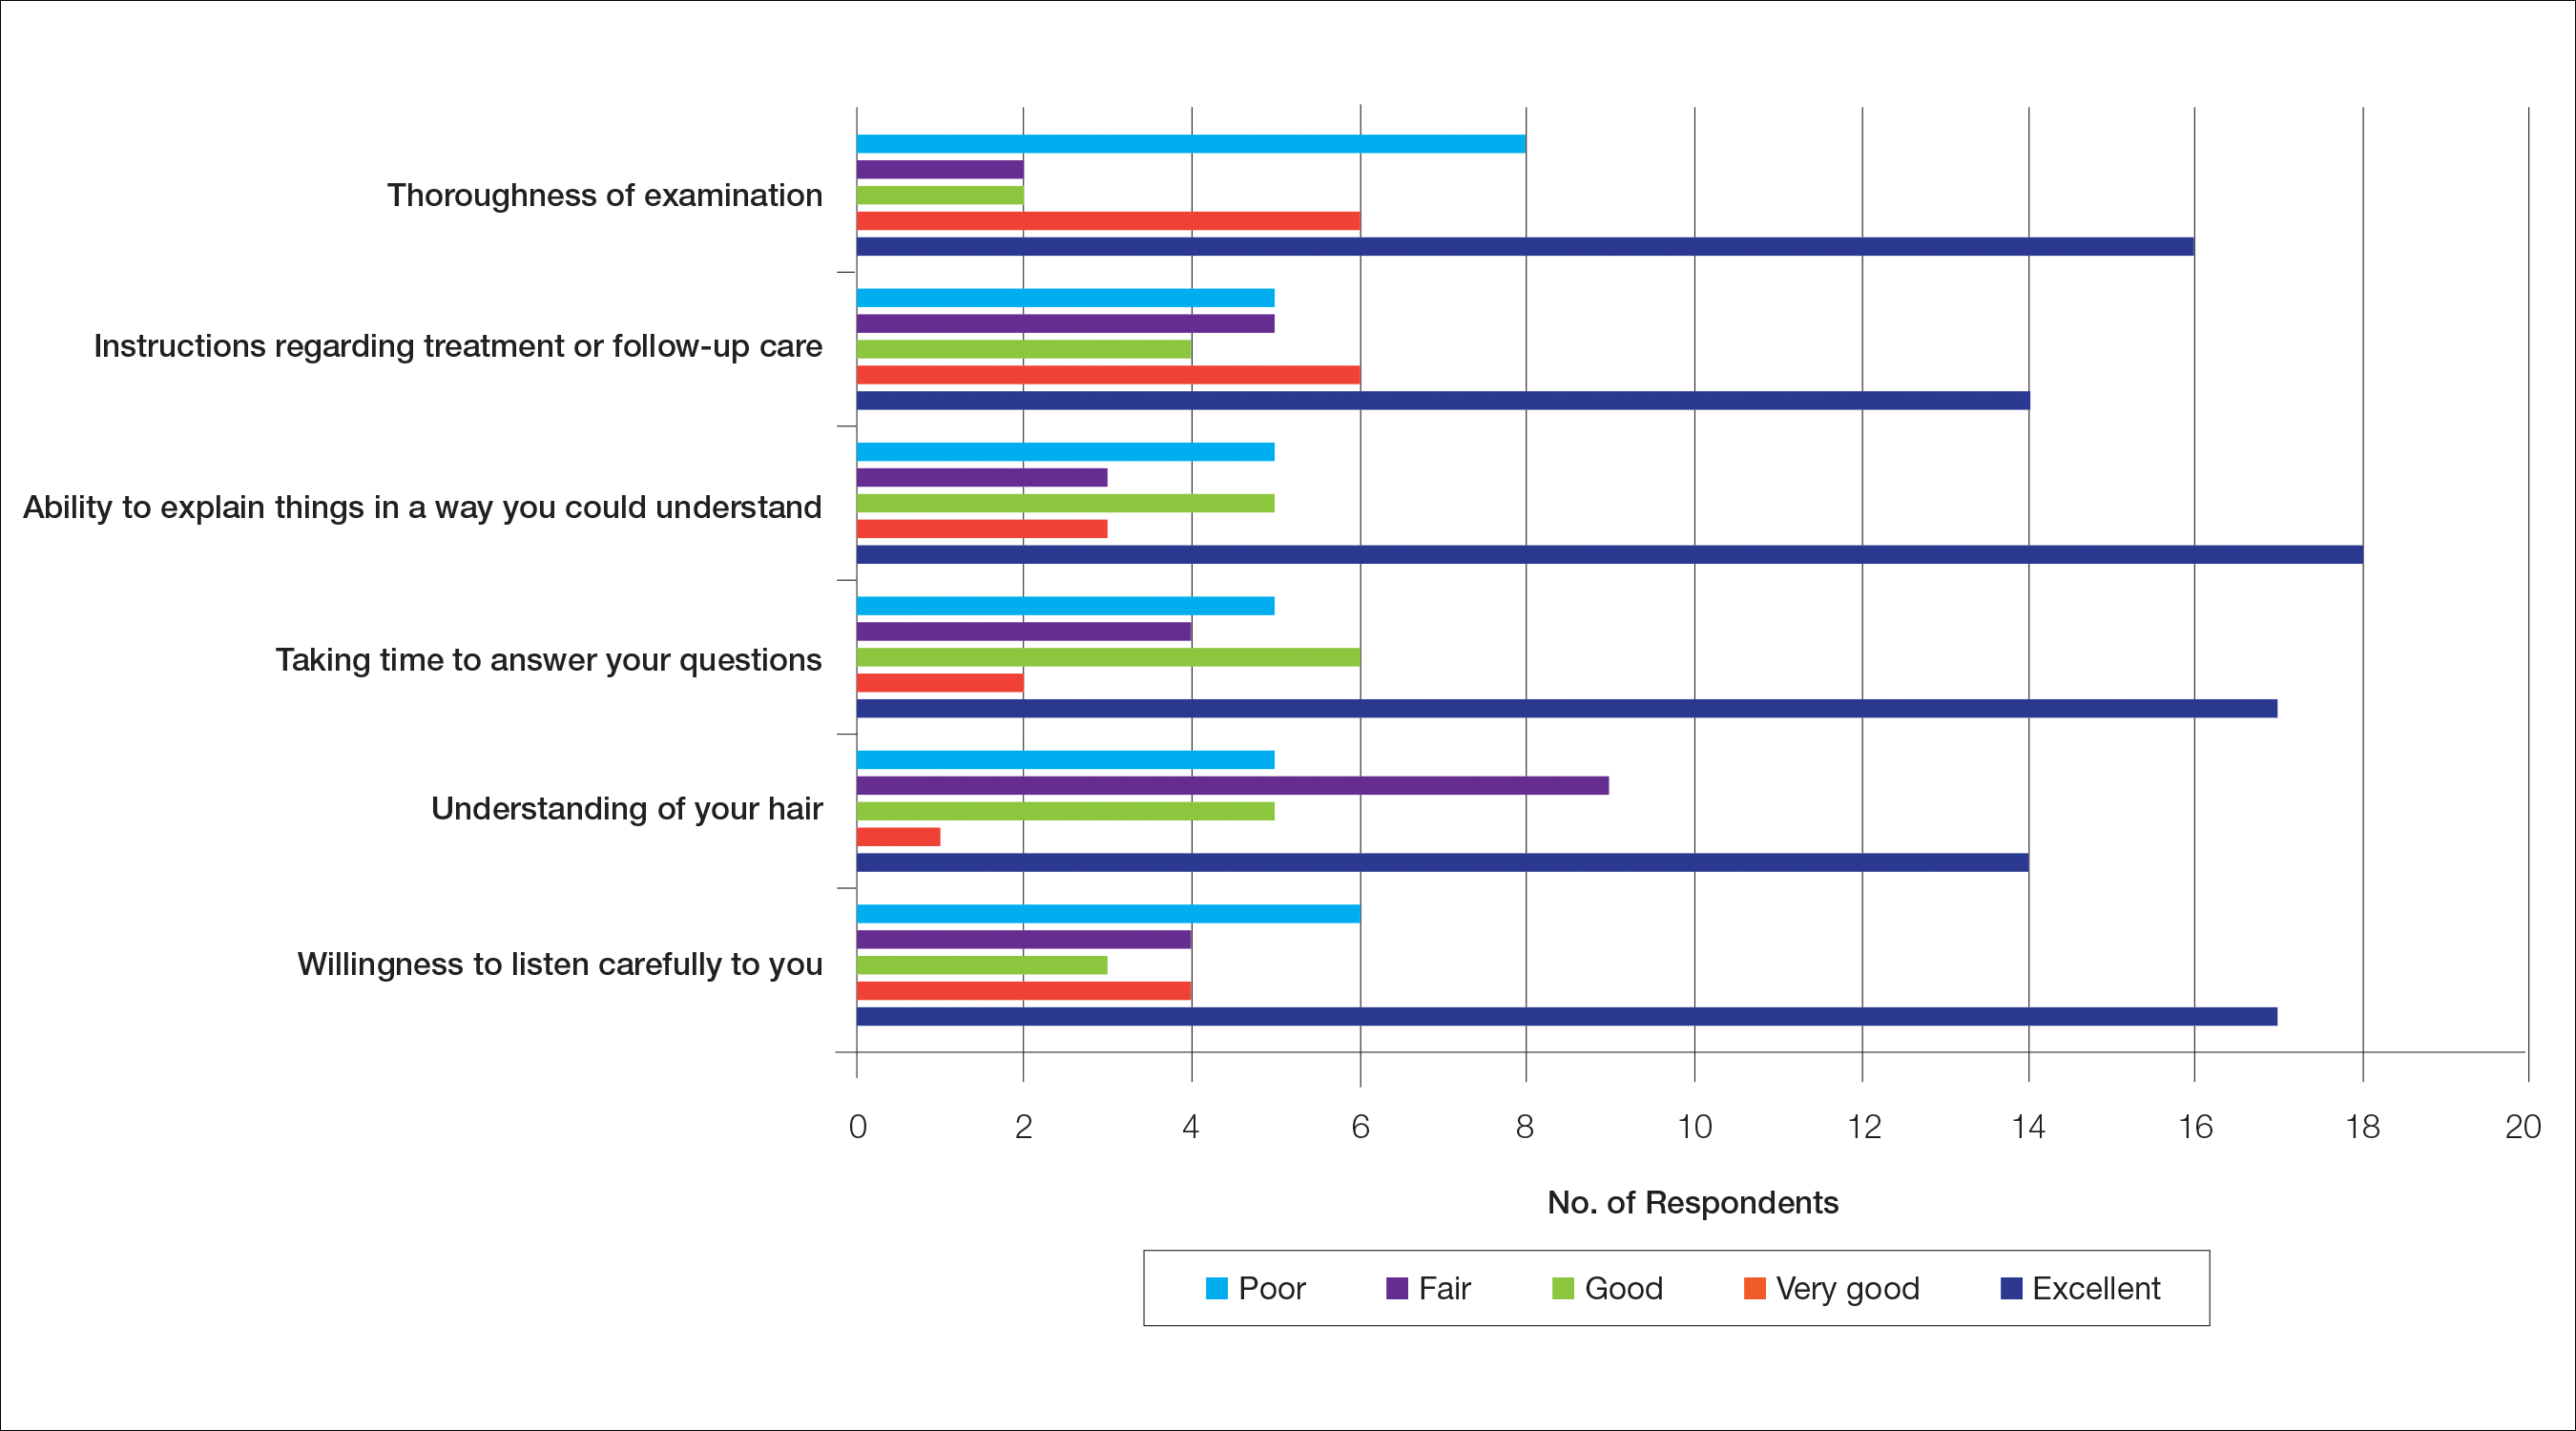
Waiting to See a Dermatologist
Nearly all respondents (31/34 [91%]) recommended that other women with hair loss immediately go see a dermatologist.
Barriers to Care
The top 5 factors reported as most important when initially seeking care included the physician’s experience with black hair and CCCA, the patient’s personal hairstyling practices, the physician’s ethnicity, availability of effective treatment options, and treatment cost. Table 3 shows frequency counts for these freely reported factors.
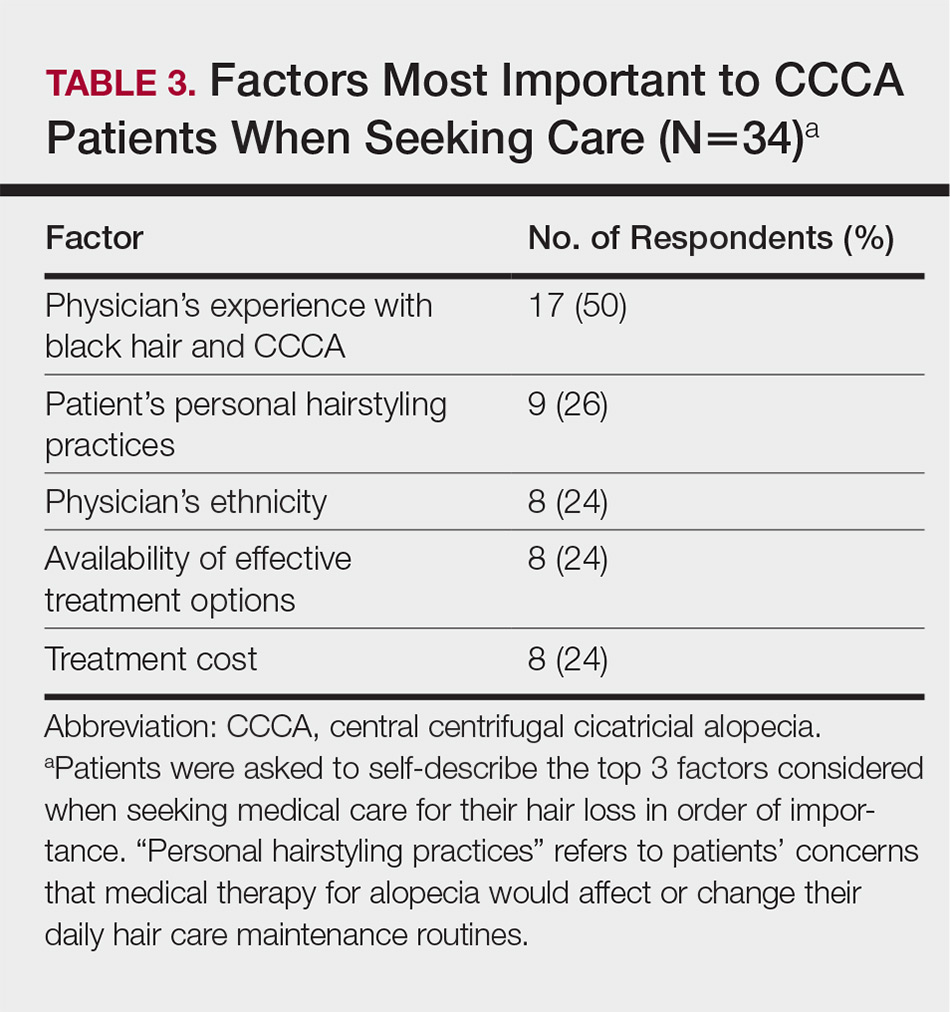
Quality of Life
The median score on 9 aggregated self-esteem items was 4 on a 5-point scale, representing an agree response to statements such as “I feel embarrassed, self-conscious, or frustrated about my hair loss” (28/34 [82%]) and “My hair loss bothers me” (28/34 [82%])(Table 4). Cronbach α for self-esteem survey items was 0.7826.
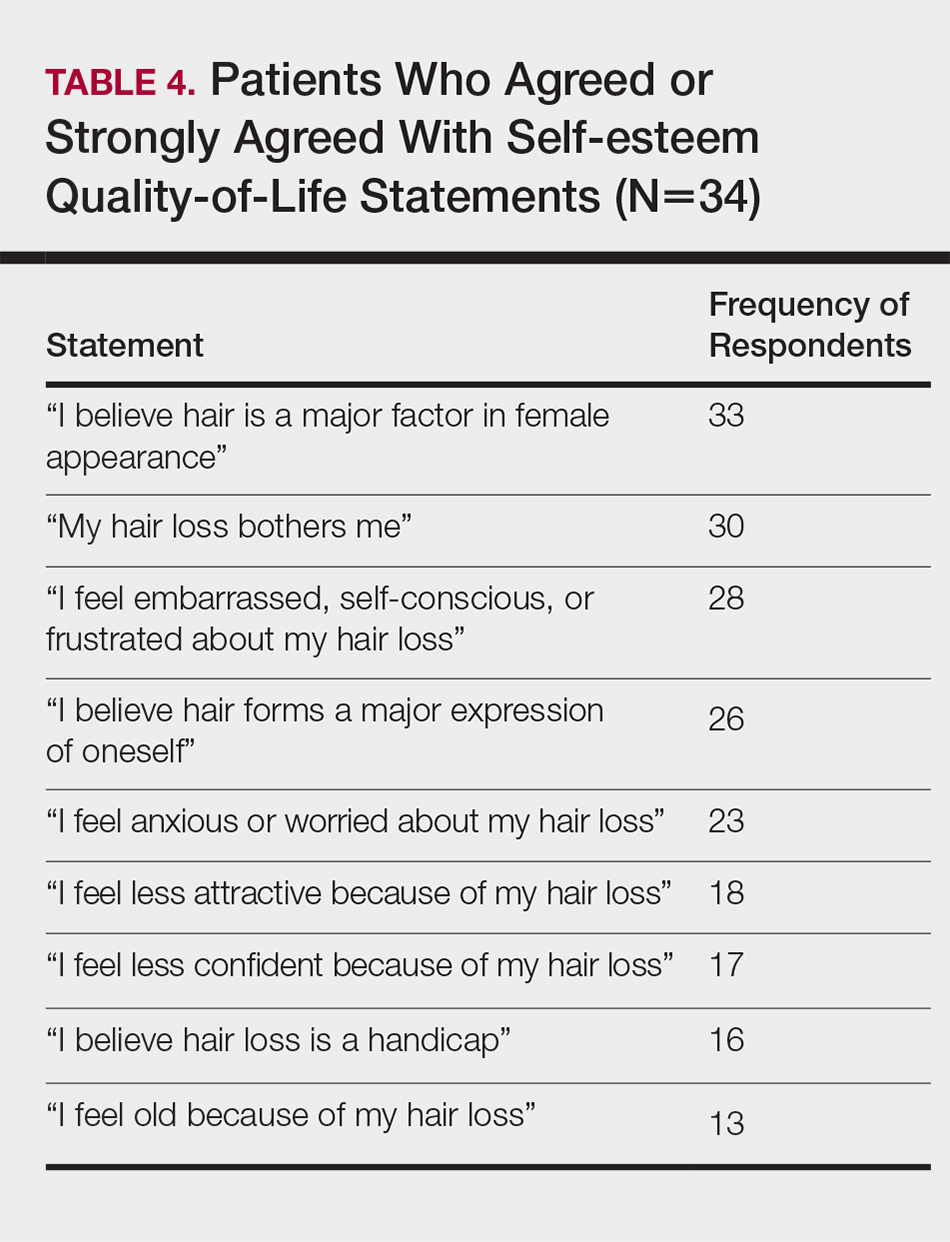
For the nonaggregated items, many respondents strongly disagreed with statements pertaining to activities of daily living, including “I take care of where I sit or stand at social gatherings due to my hair loss” (18/34 [53%]), “My hair loss makes it difficult for me to go to the grocery store” (29/34 [85%]), “My hair loss makes it difficult for me to attend faith-based activities” (30/34 [88%]), “My hair loss makes it difficult for me to exercise” (23/34 [68%]), “My hair loss makes it difficult for me to go to work and/or school” (24/34 [71%]), “My hair loss makes it difficult for me to go out with a significant other” (24/34 [71%]), “My hair loss makes it difficult for me to spend time with family” (27/34 [79%]), and “My hair loss makes it difficult for me to go to a hairstylist” (16/34 [47%]).
Comment
The majority of respondents were first to discover their hair loss. Harbingers of CCCA hair loss include paresthesia, tenderness, and itch,6 symptoms that are hard to ignore. Unfortunately, many patients notice hair thinning years after the scarring process has begun and a notable amount of hair has already been lost.6,9
Fifteen percent of respondents learned about their hair loss from their hairstylist. Women of African descent often maintain hairstyles that require frequent interactions with a hair care professional.7,10 As a result, hairstylists are at the forefront of early alopecia detection and are a valued resource in the black community. Open dialogue between dermatologists and hair care professionals could funnel women with hair loss into treatment before extensive damage.
Fifteen women (44%) recalled a waiting period of several months before seeking medical assistance, and 16 (47%) reported waiting 1 year or more. However, 91% of respondents indicated that women with hair loss should immediately see a physician for evaluation, thus patient experiences underscore the importance of early treatment. In our experience, many patients wait years before presenting to a physician. Some work with their hairstylists first to address the issue, while others do not realize how notable the loss has become. Some have a negative experience with one provider or are told there is nothing that can be done and then wait many years to see a second provider. Proper education of patients, physicians, and hairstylists is important in the identification and prompt treatment of this condition.
It is perhaps to be expected that patients rated interactions with dermatologists as excellent and very good more frequently than interactions with nondermatologists, which may be due to an absence of thorough hair evaluation with nondermatologists. Respondents reported that only half of nondermatologist providers actually examined their scalp during an initial encounter. However, both physician groups had the lowest frequencies of excellent and very good ratings on “understanding of your hair” (Tables 1 and 2). Patients with hair loss seek immediate answers, and often it is the specialist that can give them a firm diagnosis as opposed to a primary care provider. The fact that dermatologists and nondermatologists alike scored poorly on patient-perceived understanding of CCCA indicates an area for improvement within patient-physician interactions and physician knowledge.
The top 5 factors important to respondents when obtaining medical care included the physician’s experience with black hair and CCCA, the patient’s personal hairstyling practices, the physician’s ethnicity, availability of effective treatment options, and treatment cost. Patients with CCCA seeing dermatologists may discern a lack of experience with ethnic hair that leads patients to doubt their physicians’ ability to provide adequate care and decreased shared decision-making.11,12 These patient perceptions are not unfounded; a 2008 study showed that dermatology residents are not uniformly trained in diseases pertaining to patients with skin of color.13 Thus, incorporation of education on skin of color in dermatology training programs is critical.
Finally, hair loss patients often have concerns regarding how medical therapeutics could adversely affect personal hair care regimens, including washing and hairstyling practices. Current research demonstrates that patients consider treatment effectiveness and ability to be integrated into daily routines after establishing medical care.14 The present study shows that some CCCA patients contemplate how well a therapy will work before seeking medical care, demonstrating that patients continue to have these concerns after establishing medical care. Consideration of treatment effectiveness is important for both patients and providers, as there is minimal evidence behind current CCCA management practices. The ability for treatments to be easily integrated into daily hair care habits is important to maintain patient compliance.
Participants’ median self-esteem scores indicate the effect of CCCA on morale and self-perception. Items scrutinizing this construct had acceptable internal consistency reliability. It is interesting to note that activities of daily living were not impacted by hair loss. Examination of self-esteem is important in the alopecia population because the effect of hair loss on mental status is well documented.15-17 Low self-esteem has been reported as a prospective risk factor for clinical depression.18-20 In black patients, clinical depression rates surpass those of Hispanics and non-Hispanic white individuals.21 Dermatologists must consider the psychological status of all patients, particularly populations at risk for severe disease.
Limitations of this study include the small (34 participants) and mostly highly educated sample size, limited survey validity, and potential patient bias. Because many patients changed their address and/or telephone number in the time between CCCA diagnosis and the present study, we were left with a small pilot study, which minimizes the impact of our findings. Furthermore, our survey was created by a single expert’s opinion and modeling from preexisting alopecia questionnaires16; full validity procedures analyzing face, content, and criterion validity were not undertaken. Finally, the majority of respondents were patients of one of the study’s authors (S.S.L.P.), which could influence survey responses. The fact that some providers were hair experts and some were race concordant with their patients also could potentially affect the responses received, which was not analyzed in the present study. Future studies with more respondents from multiple providers would help clarify our preliminary findings.
Conclusion
Analysis of barriers to care and QOL in patients with skin of color is an essential addition to dermatologic discourse. Alopecia is particularly important to investigate, as prior research has found it to be one of the top 5 diagnoses made in patients with skin of color.3,4 Alopecia has been shown to negatively affect QOL.15,22,23 This study, although limited by small sample size, suggests CCCA also is a contributor to self-esteem challenges, similar to other forms of hair loss. Patient-physician interactions and personal hairstyling practices are prominent barriers to care for CCCA patients, demonstrating the need for quality education on skin of color and cultural competency in dermatology residencies across the country.
- Ogunleye TA, McMichael A, Olsen EA. Central centrifugal cicatricial alopecia: what has been achieved, current clues for future research. Dermatol Clin. 2014;32:173-181.
- Sperling LC. Scarring alopecia and the dermatopathologist. J Cutan Pathol. 2001;28:333-342.
- Halder RM, Grimes PE, McLaurin CI, et al. Incidence of common dermatoses in a predominantly black dermatologic practice. Cutis. 1983;32:388, 390.
- Alexis AF, Sergay AB, Taylor SC. Common dermatologic disorders in skin of color: a comparative practice survey. Cutis. 2007;80:387-394.
- Olsen EA, Callender V, McMichael A, et al. Central hair loss in African American women: incidence and potential risk factors. J Am Acad Dermatol. 2011;64:245-252.
- Gathers RC, Lim HW. Central centrifugal cicatricial alopecia: past, present, and future. J Am Acad Dermatol. 2009;60:660-668.
- Gathers RC, Mahan MG. African american women, hair care, and health barriers. J Clin Aesthet Dermatol. 2014;7:26-29.
- Van Der Donk J, Hunfeld JA, Passchier J, et al. Quality of life and maladjustment associated with hair loss in women with alopecia androgenetica. Social Sci Med. 1994;38:159-163.
- Sperling LC, Sau P. The follicular degeneration syndrome in black patients. ‘hot comb alopecia’ revisited and revised. Arch Dermatol. 1992;128:68-74.
- Gathers RC, Jankowski M, Eide M, et al. Hair grooming practices and central centrifugal cicatricial alopecia. J Am Acad Dermatol. 2009;60:574-578.
- Harvey VM, Ozoemena U, Paul J, et al. Patient-provider communication, concordance, and ratings of care in dermatology: results of a cross-sectional study. Dermatol Online J. 2016;22. pii: 13030/qt06j6p7gh.
- Laveist TA, Nuru-Jeter A. Is doctor-patient race concordance associated with greater satisfaction with care? J Health Soc Behav. 2002;43:296-306.
- Nijhawan RI, Jacob SE, Woolery-Lloyd H. Skin of color education in dermatology residency programs: does residency training reflect the changing demographics of the United States? J Am Acad Dermatol. 2008;59:615-618.
- Suchonwanit P, Hector CE, Bin Saif GA, et al. Factors affecting the severity of central centrifugal cicatricial alopecia. Int J Dermatol. 2016;55:E338-E343.
- Williamson D, Gonzalez M, Finlay AY. The effect of hair loss on quality of life. J Eur Acad Dermatol Venereol. 2001;15:137-139.
- Fabbrocini G, Panariello L, De Vita V, et al. Quality of life in alopecia areata: a disease-specific questionnaire. J Eur Acad Dermatol Venereol. 2013;27:E276-E281.
- Ramos PM, Miot HA. Female pattern hair loss: a clinical and pathophysiological review. An Bras Dermatol. 2015;90:529-543.
- Sowislo JF, Orth U. Does low self-esteem predict depression and anxiety? a meta-analysis of longitudinal studies. Psychol Bull. 2013;139:213-240.
- Steiger AE, Allemand M, Robins RW, et al. Low and decreasing self-esteem during adolescence predict adult depression two decades later. J Pers Soc Psychol. 2014;106:325-338.
- Wegener I, Geiser F, Alfter S, et al. Changes of explicitly and implicitly measured self-esteem in the treatment of major depression: evidence for implicit self-esteem compensation. Compr Psychiatry. 2015;58:57-67.
- Pratt LAB, Brody DJ. Depression in the U.S. Household Population, 2009-2012. Hyattsville, MD: National Center for Health Statistics; 2014. NCHS Data Brief, No. 172. https://www.cdc.gov/nchs/data/databriefs/db172.pdf. Published December 2014. Accessed November 19, 2018.
- Schmidt S, Fischer TW, Chren MM, et al. Strategies of coping and quality of life in women with alopecia. Br J Dermatol. 2001;144:1038-1043.
- Hunt N, McHale S. The psychological impact of alopecia. Br Med J. 2005;331:951-953.
The etiology of central centrifugal cicatricial alopecia (CCCA), a clinical and histological pattern of hair loss on the central scalp, has been well studied. This disease is chronic and progressive, with extensive follicular destruction and eventual burnout.1,2 Central centrifugal cicatricial alopecia is most commonly seen in patients of African descent and has been shown to be 1 of the 5 most common dermatologic diagnoses in black patients.3,4 The top 5 dermatologic diagnoses within this population include acne vulgaris (28.4%), dyschromia (19.9%), eczema (9.1%), alopecia (8.3%), and seborrheic dermatitis (6.7%).4 The incidence rate of CCCA is estimated to be 5.6%.3,5 Most patients are women, with onset between the second and fourth decades of life.6
Central centrifugal cicatricial alopecia treatment efficacy is inversely correlated with disease duration. The primary goal of treatment is to prevent progression. Efforts are made to stimulate regrowth in areas that are not permanently scarred. When patients present with a substantial amount of scarring hair loss, dermatologists often are limited in their ability to achieve a cosmetically acceptable pattern of growth. Generally, hair is connected to a sense of self-worth in black women, and any type of hair loss has been shown to lead to frustration and decreased self-esteem.7 A 1994 study showed that 75% (44/58) of women with androgenetic alopecia had decreased self-esteem and 50% (29/58) had social challenges.8
The purpose of this pilot study was to determine the personal, historical, logistical, or environmental factors that preclude women from obtaining medical care for CCCA and to investigate how CCCA affects quality of life (QOL) and psychological well-being.
Methods
The investigators designed a survey study of adult, English-speaking, black women diagnosed with CCCA at the Northwestern University Department of Dermatology (Chicago, Illinois) between 2011 and 2017. Patients were selected from the electronic data warehouse compiled by the Department of Dermatology and were included if they fulfilled the following criteria: evaluated in the dermatology department between September 1, 2011, and September 30, 2017, by any faculty physician; diagnosed with CCCA; and aged 18 years or older. Patients were excluded if they did not speak English, as interpreters were not available. All patients who fulfilled the inclusion criteria provided signed informed consent prior to participation. All surveys were disseminated in the office or via telephone from fall 2016 to spring 2017 and took 10 to 15 minutes to complete. The research was approved by the authors’ institutional review board (IRB ID STU00203449).
Survey Instrument
The
Data Analysis
Analyses were completed using data analysis software JMP Pro 13 from SAS and a Microsoft Excel spreadsheet. Continuous data were presented as mean, SD, median, minimum, and maximum. Categorical data were presented as counts and percentages. Nine QOL items were aggregated into a self-esteem category (questions 30–38).
Cronbach α, a statistical measure of internal consistency and how closely related items are in a group, was used to evaluate internal consistency reliability; values of 0.70 or greater indicate acceptable reliability.
Results
Of 501 individuals contacted, 34 completed the survey (7% completion rate). Nonrespondents included 7 who refused to participate and 460 who could not be contacted. All respondents self-identified as black women. Median age at time of survey administration was 46 years (range, 28–79 years); median age at CCCA diagnosis was 42 years (range, 15–73 years). Respondents did not significantly differ in age from nonrespondents (P=.46). The majority of respondents had an associate’s degree, bachelor’s degree, or advanced degree of education (master of arts, doctor of medicine, doctor of jurisprudence, doctor of philosophy); however, 8 women reported completing some college, 1 reported completing high school, and 1 reported no schooling. Three respondents had no health insurance.
Initial Hair Loss Discovery
The majority of respondents (22/34 [65%]) were first to notice their hair loss, while 5 (15%) reported hairstylists as the initial observers. Twelve respondents (35%) initially went to a physician to learn why they were losing hair; 6 (18%) instead utilized hairstylists or the Internet. Fifteen women (44%) waited more than 1 month up to 6 months after noticing hair loss before seeing a physician instead of going immediately within a 4-week period, and 16 (47%) waited 1 year or more.
Nondermatologist Consultation
Almost half (16/34 [47%]) of the women went to a nondermatologist physician regarding their hair loss; of them, half (8/16 [50%]) reported their physician did not examine the scalp, 3 (19%) reported their physician offered a biopsy, and none of them reported that their physician diagnosed them with CCCA. The median patient rating of their nondermatologist physician interactions was good (3 on a 5-point scale). Table 1 and Figure 1 show responses to individual items.
Dermatologist Consultation
All 34 respondents presented to a dermatologist. The majority of respondents (22/34 [65%]) saw either 1 or 2 dermatologists for their hair loss. Three (9%) reported their dermatologist did not examine their scalp. Twelve respondents (35%) reported their dermatologist did not offer a biopsy. Twenty-one respondents (62%) reported a CCCA diagnosis from the first dermatologist they saw. Twenty-three respondents (68%) were diagnosed by dermatologists with expertise in hair disorders. Sixteen (47%) were diagnosed by dermatologists within a skin-of-color center. Fourteen (41%) initial dermatology consultations were race concordant.
The median patient rating of their dermatologist interactions was excellent (5 on a 5-point scale). Table 2 and Figure 2 show responses to individual items. Respondents saw an average of 3 different providers, both dermatologists and otherwise.
Waiting to See a Dermatologist
Nearly all respondents (31/34 [91%]) recommended that other women with hair loss immediately go see a dermatologist.
Barriers to Care
The top 5 factors reported as most important when initially seeking care included the physician’s experience with black hair and CCCA, the patient’s personal hairstyling practices, the physician’s ethnicity, availability of effective treatment options, and treatment cost. Table 3 shows frequency counts for these freely reported factors.
Quality of Life
The median score on 9 aggregated self-esteem items was 4 on a 5-point scale, representing an agree response to statements such as “I feel embarrassed, self-conscious, or frustrated about my hair loss” (28/34 [82%]) and “My hair loss bothers me” (28/34 [82%])(Table 4). Cronbach α for self-esteem survey items was 0.7826.
For the nonaggregated items, many respondents strongly disagreed with statements pertaining to activities of daily living, including “I take care of where I sit or stand at social gatherings due to my hair loss” (18/34 [53%]), “My hair loss makes it difficult for me to go to the grocery store” (29/34 [85%]), “My hair loss makes it difficult for me to attend faith-based activities” (30/34 [88%]), “My hair loss makes it difficult for me to exercise” (23/34 [68%]), “My hair loss makes it difficult for me to go to work and/or school” (24/34 [71%]), “My hair loss makes it difficult for me to go out with a significant other” (24/34 [71%]), “My hair loss makes it difficult for me to spend time with family” (27/34 [79%]), and “My hair loss makes it difficult for me to go to a hairstylist” (16/34 [47%]).
Comment
The majority of respondents were first to discover their hair loss. Harbingers of CCCA hair loss include paresthesia, tenderness, and itch,6 symptoms that are hard to ignore. Unfortunately, many patients notice hair thinning years after the scarring process has begun and a notable amount of hair has already been lost.6,9
Fifteen percent of respondents learned about their hair loss from their hairstylist. Women of African descent often maintain hairstyles that require frequent interactions with a hair care professional.7,10 As a result, hairstylists are at the forefront of early alopecia detection and are a valued resource in the black community. Open dialogue between dermatologists and hair care professionals could funnel women with hair loss into treatment before extensive damage.
Fifteen women (44%) recalled a waiting period of several months before seeking medical assistance, and 16 (47%) reported waiting 1 year or more. However, 91% of respondents indicated that women with hair loss should immediately see a physician for evaluation, thus patient experiences underscore the importance of early treatment. In our experience, many patients wait years before presenting to a physician. Some work with their hairstylists first to address the issue, while others do not realize how notable the loss has become. Some have a negative experience with one provider or are told there is nothing that can be done and then wait many years to see a second provider. Proper education of patients, physicians, and hairstylists is important in the identification and prompt treatment of this condition.
It is perhaps to be expected that patients rated interactions with dermatologists as excellent and very good more frequently than interactions with nondermatologists, which may be due to an absence of thorough hair evaluation with nondermatologists. Respondents reported that only half of nondermatologist providers actually examined their scalp during an initial encounter. However, both physician groups had the lowest frequencies of excellent and very good ratings on “understanding of your hair” (Tables 1 and 2). Patients with hair loss seek immediate answers, and often it is the specialist that can give them a firm diagnosis as opposed to a primary care provider. The fact that dermatologists and nondermatologists alike scored poorly on patient-perceived understanding of CCCA indicates an area for improvement within patient-physician interactions and physician knowledge.
The top 5 factors important to respondents when obtaining medical care included the physician’s experience with black hair and CCCA, the patient’s personal hairstyling practices, the physician’s ethnicity, availability of effective treatment options, and treatment cost. Patients with CCCA seeing dermatologists may discern a lack of experience with ethnic hair that leads patients to doubt their physicians’ ability to provide adequate care and decreased shared decision-making.11,12 These patient perceptions are not unfounded; a 2008 study showed that dermatology residents are not uniformly trained in diseases pertaining to patients with skin of color.13 Thus, incorporation of education on skin of color in dermatology training programs is critical.
Finally, hair loss patients often have concerns regarding how medical therapeutics could adversely affect personal hair care regimens, including washing and hairstyling practices. Current research demonstrates that patients consider treatment effectiveness and ability to be integrated into daily routines after establishing medical care.14 The present study shows that some CCCA patients contemplate how well a therapy will work before seeking medical care, demonstrating that patients continue to have these concerns after establishing medical care. Consideration of treatment effectiveness is important for both patients and providers, as there is minimal evidence behind current CCCA management practices. The ability for treatments to be easily integrated into daily hair care habits is important to maintain patient compliance.
Participants’ median self-esteem scores indicate the effect of CCCA on morale and self-perception. Items scrutinizing this construct had acceptable internal consistency reliability. It is interesting to note that activities of daily living were not impacted by hair loss. Examination of self-esteem is important in the alopecia population because the effect of hair loss on mental status is well documented.15-17 Low self-esteem has been reported as a prospective risk factor for clinical depression.18-20 In black patients, clinical depression rates surpass those of Hispanics and non-Hispanic white individuals.21 Dermatologists must consider the psychological status of all patients, particularly populations at risk for severe disease.
Limitations of this study include the small (34 participants) and mostly highly educated sample size, limited survey validity, and potential patient bias. Because many patients changed their address and/or telephone number in the time between CCCA diagnosis and the present study, we were left with a small pilot study, which minimizes the impact of our findings. Furthermore, our survey was created by a single expert’s opinion and modeling from preexisting alopecia questionnaires16; full validity procedures analyzing face, content, and criterion validity were not undertaken. Finally, the majority of respondents were patients of one of the study’s authors (S.S.L.P.), which could influence survey responses. The fact that some providers were hair experts and some were race concordant with their patients also could potentially affect the responses received, which was not analyzed in the present study. Future studies with more respondents from multiple providers would help clarify our preliminary findings.
Conclusion
Analysis of barriers to care and QOL in patients with skin of color is an essential addition to dermatologic discourse. Alopecia is particularly important to investigate, as prior research has found it to be one of the top 5 diagnoses made in patients with skin of color.3,4 Alopecia has been shown to negatively affect QOL.15,22,23 This study, although limited by small sample size, suggests CCCA also is a contributor to self-esteem challenges, similar to other forms of hair loss. Patient-physician interactions and personal hairstyling practices are prominent barriers to care for CCCA patients, demonstrating the need for quality education on skin of color and cultural competency in dermatology residencies across the country.
- Ogunleye TA, McMichael A, Olsen EA. Central centrifugal cicatricial alopecia: what has been achieved, current clues for future research. Dermatol Clin. 2014;32:173-181.
- Sperling LC. Scarring alopecia and the dermatopathologist. J Cutan Pathol. 2001;28:333-342.
- Halder RM, Grimes PE, McLaurin CI, et al. Incidence of common dermatoses in a predominantly black dermatologic practice. Cutis. 1983;32:388, 390.
- Alexis AF, Sergay AB, Taylor SC. Common dermatologic disorders in skin of color: a comparative practice survey. Cutis. 2007;80:387-394.
- Olsen EA, Callender V, McMichael A, et al. Central hair loss in African American women: incidence and potential risk factors. J Am Acad Dermatol. 2011;64:245-252.
- Gathers RC, Lim HW. Central centrifugal cicatricial alopecia: past, present, and future. J Am Acad Dermatol. 2009;60:660-668.
- Gathers RC, Mahan MG. African american women, hair care, and health barriers. J Clin Aesthet Dermatol. 2014;7:26-29.
- Van Der Donk J, Hunfeld JA, Passchier J, et al. Quality of life and maladjustment associated with hair loss in women with alopecia androgenetica. Social Sci Med. 1994;38:159-163.
- Sperling LC, Sau P. The follicular degeneration syndrome in black patients. ‘hot comb alopecia’ revisited and revised. Arch Dermatol. 1992;128:68-74.
- Gathers RC, Jankowski M, Eide M, et al. Hair grooming practices and central centrifugal cicatricial alopecia. J Am Acad Dermatol. 2009;60:574-578.
- Harvey VM, Ozoemena U, Paul J, et al. Patient-provider communication, concordance, and ratings of care in dermatology: results of a cross-sectional study. Dermatol Online J. 2016;22. pii: 13030/qt06j6p7gh.
- Laveist TA, Nuru-Jeter A. Is doctor-patient race concordance associated with greater satisfaction with care? J Health Soc Behav. 2002;43:296-306.
- Nijhawan RI, Jacob SE, Woolery-Lloyd H. Skin of color education in dermatology residency programs: does residency training reflect the changing demographics of the United States? J Am Acad Dermatol. 2008;59:615-618.
- Suchonwanit P, Hector CE, Bin Saif GA, et al. Factors affecting the severity of central centrifugal cicatricial alopecia. Int J Dermatol. 2016;55:E338-E343.
- Williamson D, Gonzalez M, Finlay AY. The effect of hair loss on quality of life. J Eur Acad Dermatol Venereol. 2001;15:137-139.
- Fabbrocini G, Panariello L, De Vita V, et al. Quality of life in alopecia areata: a disease-specific questionnaire. J Eur Acad Dermatol Venereol. 2013;27:E276-E281.
- Ramos PM, Miot HA. Female pattern hair loss: a clinical and pathophysiological review. An Bras Dermatol. 2015;90:529-543.
- Sowislo JF, Orth U. Does low self-esteem predict depression and anxiety? a meta-analysis of longitudinal studies. Psychol Bull. 2013;139:213-240.
- Steiger AE, Allemand M, Robins RW, et al. Low and decreasing self-esteem during adolescence predict adult depression two decades later. J Pers Soc Psychol. 2014;106:325-338.
- Wegener I, Geiser F, Alfter S, et al. Changes of explicitly and implicitly measured self-esteem in the treatment of major depression: evidence for implicit self-esteem compensation. Compr Psychiatry. 2015;58:57-67.
- Pratt LAB, Brody DJ. Depression in the U.S. Household Population, 2009-2012. Hyattsville, MD: National Center for Health Statistics; 2014. NCHS Data Brief, No. 172. https://www.cdc.gov/nchs/data/databriefs/db172.pdf. Published December 2014. Accessed November 19, 2018.
- Schmidt S, Fischer TW, Chren MM, et al. Strategies of coping and quality of life in women with alopecia. Br J Dermatol. 2001;144:1038-1043.
- Hunt N, McHale S. The psychological impact of alopecia. Br Med J. 2005;331:951-953.
Practice Points
- Central centrifugal cicatricial alopecia (CCCA) presents a unique set of challenges for both patients and providers.
- Lack of physician experience with black hair/CCCA and the potential impact of care on personal hairstyling practices are 2 barriers to care for many patients with this disease.
- There is a need for improved patient-provider communication strategies, quality education on hair in skin of color patients, and cultural competency training in dermatology residencies across the country.
Safety and Efficacy of Percutaneous Injection of Lipogems Micro-Fractured Adipose Tissue for Osteoarthritic Knees
ABSTRACT
The aim of this study was to evaluate the safety and efficacy of using autologous, micro-fractured, minimally manipulated adipose tissue in patients with refractory knee osteoarthritis (OA). A total of 17 subjects (26 knees) with a median age of 72 years (range: 54-78 years) and a history of knee OA (Kellgren–Lawrence, grade of 3 or 4) underwent treatment with ultrasound-guided injection of micro-fractured adipose tissue. Micro-fractured fat was obtained using a minimal manipulation technique in a closed system (Lipogems), without the addition of enzymes or any other additives. The study subjects were clinically evaluated using the numerical pain rating scale (NPRS), the 100-point Knee Society Score (KSS) with its functional component (FXN), and the lower extremity activity scale (LEAS) at 6 weeks, 6 months, and 12 months following this procedure.
When compared with baseline, significant improvements were noted in the mean values of NPRS, FXN, and LEAS at 6 weeks, 6 months, and 12 months. The mean KSS significantly improved at 6 weeks and 12 months. In particular, the average KSS score improved from 74 to 82, the FXN score improved from 65 to 76, and the LEAS score improved from 36 to 47. These values were significantly greater than the previously published minimal clinically important difference described for KSS and FXN in patients who underwent total knee arthroplasty for primary OA. No serious adverse events were reported. The injection of autologous, micro-fractured, minimally manipulated adipose tissue appears to be a safe and effective treatment option for patients with refractory, severe (grade 3 or 4) knee OA.
This study demonstrated significant improvements in pain, quality of life, and function for at least 12 months in this study population. This intervention may represent a nonsurgical treatment option to avoid knee joint replacement in this population; however, further investigation is needed.
Continue to: Knee OA is...
Knee OA is a chronic disease that affects all races, genders, and ages, but it is most prevalent in obese and elderly people. Worldwide, arthritis is considered to be the fourth leading cause of disability.1 In developing and developed countries, knee OA may cause a significant decline in the quality of life for individuals >65 years due to joint pain and disability.1 Nonoperative treatment can be successful in patients with mild to moderate arthritis with pain.
Current treatment options for knee OA, including physical therapy and anti-inflammatory drugs, aim to remedy the symptoms, but they do little to treat the underlying causes of knee OA pain. When a patient presents with advanced arthritis of the knee as confirmed by radiographic findings (classified as Kellgren–Lawrence grade of 3 or 4), the standard approach has been a total knee arthroplasty (TKA) after the patient has failed conservative treatment. The annual rate of total knee replacement in the United States has doubled since 2000, especially in those 45 – 65 years.2 The total number of procedures performed each year now exceeds 640,000, at a total annual cost of about $10.2 billion.2 Multiple studies show that TKA has favorable outcomes in pain relief and functional improvement in patients >60 years when evaluated at a follow-up of 10 years after surgery.2
However, some patients are hesitant to proceed with surgery due to fear of surgical pain and procedural complications. The known complications include deep vein thrombosis, pulmonary embolism, nerve injury, and infection. In addition, up to 20% of patients continue to complain of pain following a total knee replacement.3 Finally, in the young population (<50 years), there are concerns related to the potential need of revision knee surgery in the future.3
Alternative treatments for knee OA have recently emerged, including the use of platelet-rich plasma (PRP). A recent meta-analysis that included 10 randomized controlled trials with a total of 1069 patients demonstrated that, compared with hyaluronic acid and saline, intra-articular PRP injection may have more benefits in pain relief and functional improvement in patients with symptomatic knee OA at 1-year post-injection.4 Another smaller study examined patients who had experienced mild knee OA (Kellgren–Lawrence grade <3) for an average of 14 months. Each patient underwent magnetic resonance imaging for the evaluation of joint damage and then received a single PRP injection. The patients were assessed at regular intervals, with improvement in pain lasting up to 12 months.5
Additional orthobiologic options include the use of bone marrow and adipose-derived stem cell (ASC) injections for a variety of knee conditions, including knee OA. Mesenchymal stem cells (MSCs) are multipotent cells that have been used for the treatment of OA in clinical trials because of their regeneration potential and anti-inflammatory effects.6 Bone marrow stem cells (BMSCs) were first used to repair cartilage damage in humans in 1998. However, BMSCs had particular challenges, including low stem cell yield, pain, and possible morbidities during bone marrow aspiration. An alternative is ASCs, which may be more suitable clinically because of the high stem cell yield from lipoaspirates, faster cell proliferation, and less discomfort and morbidities during the harvesting procedure.7 In addition, these adult stem cells can contribute to the chondrogenic, osteogenic, adipogenic, myogenic, and neurogenic lineages.8 One study demonstrated that the contents of cartilage glycosaminoglycans significantly increased in specific areas of a knee joint treated with ASCs.9,10 This increased glycosaminoglycan content in hyaline cartilage may explain the observed visual analog score (VAS) improvement and clinical results. Other studies suggest that the chondrogenic action of ASCs may depend more on regenerative signaling by activated perivascular cells and signaling of trophic and paracrine mediators, such as vascular endothelial growth factor.9,10 Finally, the mechanism of action may include providing volume, support, cushioning, and filling of soft tissue defects.11
The Lipogems method and device, approved by the U.S. Food and Drug Administration, is used to harvest ASCs, cleanse, and micro-fracture adipose tissue while maintaining the perivascular niche that contains pericytes. The purpose of this study was to evaluate the safety and efficacy of using autologous, micro-fractured, minimally manipulated adipose tissue in patients with severe refractory knee OA.
Continue to: This report details...
STUDY PRESENTATION
This report details the outcome of an IRB-approved study of 17 subjects with 26 symptomatic knees with a history of knee OA (Kellgren–Lawrence grade of 3 or 4) diagnosed by a radiograph. Patient demographics are described in the Table.
TABLE. Patient Demographics | |
Male n (%) | 10 (58.8) |
Age, mean ± SD (range) | 68.27 ± 7.43 |
BMI, mean ± SD (range) | 28.98 ± 4.50 |
Kellgren–Lawrence grade 3 (n) | 7 |
Kellgren–Lawrence grade 4 (n) | 19 |
Abbreviation: BMI, body mass index.
The study patients were evaluated by an orthopedic surgeon, Mitchell Sheinkop, who commonly performs total joint replacement in his practice and considers potential patients as candidates for TKA. These patients presented with a Kellgren-Lawrence grade of 3 or 4 knee OA, and all had significant pain that was refractory to conservative treatment, which included medications, physical therapy, and injections. The study patients were offered the Lipogems procedure as an alternative to TKA. Following this procedure, the study subjects were clinically evaluated using the numerical pain rating scale (NPRS), the 100-point Knee Society Score (KSS) with its functional component (FXN), and the lower extremity activity scale (LEAS) at 6 weeks, 6 months, and 12 months. The 1989 KSS12 was used for this study. Adverse reactions were also monitored throughout the study period.
METHODS
After obtaining informed consent, the subjects were taken into the operating room, moved to the procedure table, and placed in the prone position for aspiration. After scrubbing with Betadine and draping, 1 mL of lidocaine was used to anesthetize the skin, and a pre-prepared preparation of lidocaine, epinephrine, and sterile saline was infused into the subcutaneous tissue. The micro-fragmented adipose tissue was obtained with minimal manipulation using Lipogems, a closed system using mild mechanical forces and reduction filters. The system processes the lipoaspirate without the addition of enzymes or any other additives. The final product consists of adipose tissue clusters with preserved vascular stromal niche of approximately 500 microns. The lipoaspirate was processed in the same room via a closed system. During the processing, the subject’s puncture wounds were dressed. The knee injection site was prepped with a Betadine swab and DuraPrep. Then, Lipogems was injected intra-articularly under ultrasound guidance.
After the completion of the injection, manual range of motion was administered to the treated joint. The subject was then transferred to the recovery room where vital signs were monitored. Post-procedure instructions were reviewed with the patient by the study staff. The subject was instructed to use an assistive device and avoid weight-bearing for 48 hours and maintain the activities of daily living to a minimum on the day of the procedure. Non-weight-bearing for 48 hours was recommended for reducing discomfort to avoid the use of opioids. Nonsteroidal anti-inflammatory drugs, alcohol, and marijuana must be avoided for 4 weeks after the procedure. Pretreatment and post-treatment outcomes were collected using the NPRS, the 100-point KSS with its FXN, and the LEAS at 6 weeks, 6 months, and 12 months after this procedure. The 1989 KSS12 was used for this study since the same scale was used for previous TKA procedures by our authors, allowing for future comparisons of results.
STATISTICAL ANALYSIS
Mean and standard deviation were used to estimate central tendency and variability. Outcome measures were analyzed using the t test, with the pairwise t test was used for paired and subsequent measurements of the same patient or a knee. All analyses were performed with significance set at P <.05. The minimal clinically important difference (MCID) in patients who underwent TKA for primary OA was between 5.3 and 5.9 for KSS, while the MCID for FXN was between 6.1 and 6.4.13 These values were referenced for our analysis.
Continue to: No significant adverse...
RESULTS
No significant adverse events were reported in the subjects of this study. Common minor adverse events included pain and swelling, which generally resolved in 48 to 72 hours after the procedure.

Compared with baseline, significant improvements were noted in the mean values of NPRS (Figure 1) at 6 weeks, 6 months, and 12 months. The mean KSS significantly improved from baseline at 6 weeks and 12 months (Figure 2). Significant improvements were also noted in the mean values of FXN (Figure 3) and the mean LEAS significantly improved from baseline at 6 weeks and 6 months (Figure 4).

DISCUSSION
Knee OA is a disabling condition that affects a substantial proportion of the aging population. The current treatment methods do little to address the degenerative environment of the joint, which includes cytokines such as IL-1 and IL-2. Orthobiologic agents have been used recently to address these issues, which include PRP and MSCs from various sources, including bone marrow and adipose tissue.

A recent meta-analysis conducted by Cui and colleagues14 evaluated 18 studies of MSC treatment for knee OA with a total of 565 participants (226 males and 339 females). The duration from the onset of knee pain to registration in each study ranged from 3 months to ≥7 years. The follow-up period was 3 months -24 months. The majority of studies recruited patients with knee OA with a severity grade of 1-4 on the K-L scale; K-L grades 1 and 2 and grades 3 and 4 were defined as early OA and advanced OA, respectively. The results suggested that MSC treatment significantly improved pain and functional status, relative to the baseline evaluations in knee OA, and the beneficial effect was maintained for 2 years after treatment. Furthermore, the treatment effectiveness was not reduced over time.14

Included in the abovementioned meta-analysis were 2 papers by Koh and colleagues in 2012 and 2013 on the use of AMSCs for the treatment of OA. 15,16 The first study included 18 patients whose adipose tissue was harvested from the inner side of the infrapatellar fat pad via a skin incision after arthroscopic debridement. The cells were centrifuged and injected into the patient’s knee the same day. The results showed a significant reduction of pain and an increased quality of life for all patients, and a positive correlation was found between the number of cells injected and pain improvements. The authors concluded that AMSCs were a valid cell source for treating cartilage damage.15
In their second study, Koh and colleagues reported their results of treating 30 elderly patients with OA (≥65 years), who had failed conventional treatment, using intra-articular injections of AMSCs.16 This patient population is important since OA most commonly occurs in the elderly population. Patients underwent arthroscopic lavage and cartilage evaluation before receiving an injection of AMSCs delivered in PRP. The authors demonstrated that AMSC therapy for elderly patients with mild to moderate OA was an effective treatment resulting in reduction of pain and regeneration of cartilage.16
In another study, Adriani and colleagues17 performed autologous percutaneous fat injection from January 2012 to March 2015 for the treatment of knee OA. Their 30 patients (12 males and 18 females; mean age of 63.3 years; mean body mass index of 25.1) had stable or progressive knee OA for at least 12 months, no other injection treatments during the previous 12 months, and no prior knee surgeries. The patients were evaluated at baseline and 1 week and at 1, 3, 6, and 12 months after treatment using the NPRS and the Western Ontario and McMaster Universities Osteoarthritis Index (WOMAC) as outcome measures. The average VAS was 7.7 at baseline and improved to 4.3 at 3-month follow-up; however, a slight deterioration (VAS 5.0) was noted at 1 year. Total WOMAC score was 89.9 at baseline, 68.6 at 3 months, and 73.2 at 12-month follow-up.17
Continue to: The results of...
The results of this study demonstrated significant improvements in pain, quality of life, and function at 12 months after ultrasound-guided injection of ASCs in patients with severe knee OA. Significant improvement that was noted at 6 weeks was maintained through 12 months after the treatment. Improvement was noted in all scales, including the NPRS, the KSS, and the FXN beginning at 3 months and continuing through 12 months. The LEAS was statistically significant through 6 months after the treatment but not significant at 12 months. No serious adverse events were recorded.
In a study by Lee and colleagues,13 the MCID was described for KSS and FXN in patients who underwent TKA for primary OA. This is the minimal change in a scoring measure that is perceived by the patient to be beneficial or harmful. The MCID for KSS was noted to be between 5.3 and 5.9, while the MCID for FXN was between 6.1 and 6.4.13 In our study, the KSS score improved from an average of 74.0 at baseline to 79.6 at 6 months and 81.6 at 12 months (a difference of 5.6 and 7.6; P = .18 and.014, respectively). The FXN improved from an average of 65.4 at baseline to 75.2 at 6 months and 76.4 at 12 months (a difference of 9.9 and 11; P = .041 and.014, respectively). Therefore, a clinically important difference of KSS and FXN scores was noted at both 6 and 12 months.
The technique used in this study provides autologous, minimally manipulated, fat graft performed in a short time (60-90 minutes), without expansion and/or enzymatic treatment. In addition, the harvesting and the injection of stem cells on the same day is a simple, office-based procedure, and compliant with the U. S. Food and Drug Administration regulations.18 The cost of the procedure averages $3500.
A study limitation is that it is a case series with relatively small numbers and not a randomized controlled study. Therefore, a placebo effect may play a role in our results. Further study with a larger number of patients and randomized controlled studies would be beneficial to support the findings of this study.
CONCLUSION
The injection of autologous, micro-fractured, minimally manipulated adipose tissue appears to be a safe and effective treatment option in patients with refractory severe (grade 3 or 4) knee OA. This study showed significant improvements in pain, quality of life, and function for at least 12 months in this study population. This intervention may represent a nonsurgical treatment option to avoid knee joint replacement in this population; however, further investigation is needed.
- Yubo M, Yanyan L, Li L, Tao S, Bo L, Lin C. Clinical efficacy and safety of mesenchymal stem cell transplantation for osteoarthritis treatment: A meta-analysis. PLoS One. 2017;12(4):e0175449.
- Jauregui JJ, Cherian JJ, Pierce TP, Beaver WB, Issa K, Mont MA. Long-Term Survivorship and Clinical Outcomes Following Total Knee Arthroplasty. J Arthroplasty. 2015;30(12):2164-2166.
- Bourne RB, Chesworth BM, Davis AM, Mahomed NN, Charron KD. Patient satisfaction after total knee arthroplasty: who is satisfied and who is not? Clin Orthop Relat Res. 2010;468(1):57-63.
- Dai W-L, Zhou A-G, Zhang H, Zhang J. Efficacy of Platelet-Rich Plasma in the Treatment of Knee Osteoarthritis: A Meta-analysis of Randomized Controlled Trials. Arthroscopy.33(3):659-670.e651.
- Halpern B CS, Rodeo SA, Hayter C, Bogner E, Potter HG, Nguyen J. Clinical and MRI outcomes after platelet-rich plasma treatment for knee osteoarthritis. Clin J Sport Med. 2013 May;23.
- Mamidi MK, Das AK, Zakaria Z, Bhonde R. Mesenchymal stromal cells for cartilage repair in osteoarthritis. Osteoarthritis Cartilage. 2016;24(8):1307-1316.
- Tang Y, Pan ZY, Zou Y, et al. A comparative assessment of adipose-derived stem cells from subcutaneous and visceral fat as a potential cell source for knee osteoarthritis treatment. J Cell Mol Med. 2017.
- Izadpanah R, Trygg C, Patel B, et al. Biologic properties of mesenchymal stem cells derived from bone marrow and adipose tissue. Journal of cellular biochemistry. 2006;99(5):1285-1297.
- Ankrum J, Karp JM. Mesenchymal stem cell therapy: Two steps forward, one step back. Trends Mol Med. 2010;16(5):203-209.
- Togel F, Weiss K, Yang Y, Hu Z, Zhang P, Westenfelder C. Vasculotropic, paracrine actions of infused mesenchymal stem cells are important to the recovery from acute kidney injury. A J Physiol Renal Physiol. 2007;292(5):F1626-1635.
- Mestak O, Sukop A, Hsueh YS, et al. Centrifugation versus PureGraft for fatgrafting to the breast after breast-conserving therapy. World J Surg Oncol. 2014;12:178.
- Insall JN DL, Scott RD, Scott WN. Rationale of the Knee Society clinical rating system. Clin Orthop Relat Res. 1989 Nov;(248):13-4.
- Lee WC, Kwan YH, Chong HC, Yeo SJ. The minimal clinically important difference for Knee Society Clinical Rating System after total knee arthroplasty for primary osteoarthritis. Knee Surgery, Sports Traumatology, Arthroscopy. 2016.
- Cui GH, Wang YY, Li CJ, Shi CH, Wang WS. Efficacy of mesenchymal stem cells in treating patients with osteoarthritis of the knee: A meta-analysis. Exp Ther Med. 2016;12(5):3390-3400.
- Koh Y-GC, Yun-Jin. Infrapatellar fat pad-derived mesenchymal stem cell therapy for knee osteoarthritis. Knee. 2012;19(6):902-907.
- Koh Y-GC, Yun-Jin. Mesenchymal stem cell injections improve symptoms of knee osteoarthritis. Arthroscopy. 2013;29(4):748-755.
- Adriani E. MM, et al. Percutaneous Fat Transfer to Treat Knee Osteoarthritis Symptoms: Preliminary Results. Joints. 2017.
- Bianchi F, Maioli M, Leonardi E, et al. A New Nonenzymatic Method and Device to Obtain a Fat Tissue Derivative Highly Enriched in Pericyte-Like Elements by Mild Mechanical Forces From Human Lipoaspirates. Cell Transplantation. 2013;22(11):2063-2077
ABSTRACT
The aim of this study was to evaluate the safety and efficacy of using autologous, micro-fractured, minimally manipulated adipose tissue in patients with refractory knee osteoarthritis (OA). A total of 17 subjects (26 knees) with a median age of 72 years (range: 54-78 years) and a history of knee OA (Kellgren–Lawrence, grade of 3 or 4) underwent treatment with ultrasound-guided injection of micro-fractured adipose tissue. Micro-fractured fat was obtained using a minimal manipulation technique in a closed system (Lipogems), without the addition of enzymes or any other additives. The study subjects were clinically evaluated using the numerical pain rating scale (NPRS), the 100-point Knee Society Score (KSS) with its functional component (FXN), and the lower extremity activity scale (LEAS) at 6 weeks, 6 months, and 12 months following this procedure.
When compared with baseline, significant improvements were noted in the mean values of NPRS, FXN, and LEAS at 6 weeks, 6 months, and 12 months. The mean KSS significantly improved at 6 weeks and 12 months. In particular, the average KSS score improved from 74 to 82, the FXN score improved from 65 to 76, and the LEAS score improved from 36 to 47. These values were significantly greater than the previously published minimal clinically important difference described for KSS and FXN in patients who underwent total knee arthroplasty for primary OA. No serious adverse events were reported. The injection of autologous, micro-fractured, minimally manipulated adipose tissue appears to be a safe and effective treatment option for patients with refractory, severe (grade 3 or 4) knee OA.
This study demonstrated significant improvements in pain, quality of life, and function for at least 12 months in this study population. This intervention may represent a nonsurgical treatment option to avoid knee joint replacement in this population; however, further investigation is needed.
Continue to: Knee OA is...
Knee OA is a chronic disease that affects all races, genders, and ages, but it is most prevalent in obese and elderly people. Worldwide, arthritis is considered to be the fourth leading cause of disability.1 In developing and developed countries, knee OA may cause a significant decline in the quality of life for individuals >65 years due to joint pain and disability.1 Nonoperative treatment can be successful in patients with mild to moderate arthritis with pain.
Current treatment options for knee OA, including physical therapy and anti-inflammatory drugs, aim to remedy the symptoms, but they do little to treat the underlying causes of knee OA pain. When a patient presents with advanced arthritis of the knee as confirmed by radiographic findings (classified as Kellgren–Lawrence grade of 3 or 4), the standard approach has been a total knee arthroplasty (TKA) after the patient has failed conservative treatment. The annual rate of total knee replacement in the United States has doubled since 2000, especially in those 45 – 65 years.2 The total number of procedures performed each year now exceeds 640,000, at a total annual cost of about $10.2 billion.2 Multiple studies show that TKA has favorable outcomes in pain relief and functional improvement in patients >60 years when evaluated at a follow-up of 10 years after surgery.2
However, some patients are hesitant to proceed with surgery due to fear of surgical pain and procedural complications. The known complications include deep vein thrombosis, pulmonary embolism, nerve injury, and infection. In addition, up to 20% of patients continue to complain of pain following a total knee replacement.3 Finally, in the young population (<50 years), there are concerns related to the potential need of revision knee surgery in the future.3
Alternative treatments for knee OA have recently emerged, including the use of platelet-rich plasma (PRP). A recent meta-analysis that included 10 randomized controlled trials with a total of 1069 patients demonstrated that, compared with hyaluronic acid and saline, intra-articular PRP injection may have more benefits in pain relief and functional improvement in patients with symptomatic knee OA at 1-year post-injection.4 Another smaller study examined patients who had experienced mild knee OA (Kellgren–Lawrence grade <3) for an average of 14 months. Each patient underwent magnetic resonance imaging for the evaluation of joint damage and then received a single PRP injection. The patients were assessed at regular intervals, with improvement in pain lasting up to 12 months.5
Additional orthobiologic options include the use of bone marrow and adipose-derived stem cell (ASC) injections for a variety of knee conditions, including knee OA. Mesenchymal stem cells (MSCs) are multipotent cells that have been used for the treatment of OA in clinical trials because of their regeneration potential and anti-inflammatory effects.6 Bone marrow stem cells (BMSCs) were first used to repair cartilage damage in humans in 1998. However, BMSCs had particular challenges, including low stem cell yield, pain, and possible morbidities during bone marrow aspiration. An alternative is ASCs, which may be more suitable clinically because of the high stem cell yield from lipoaspirates, faster cell proliferation, and less discomfort and morbidities during the harvesting procedure.7 In addition, these adult stem cells can contribute to the chondrogenic, osteogenic, adipogenic, myogenic, and neurogenic lineages.8 One study demonstrated that the contents of cartilage glycosaminoglycans significantly increased in specific areas of a knee joint treated with ASCs.9,10 This increased glycosaminoglycan content in hyaline cartilage may explain the observed visual analog score (VAS) improvement and clinical results. Other studies suggest that the chondrogenic action of ASCs may depend more on regenerative signaling by activated perivascular cells and signaling of trophic and paracrine mediators, such as vascular endothelial growth factor.9,10 Finally, the mechanism of action may include providing volume, support, cushioning, and filling of soft tissue defects.11
The Lipogems method and device, approved by the U.S. Food and Drug Administration, is used to harvest ASCs, cleanse, and micro-fracture adipose tissue while maintaining the perivascular niche that contains pericytes. The purpose of this study was to evaluate the safety and efficacy of using autologous, micro-fractured, minimally manipulated adipose tissue in patients with severe refractory knee OA.
Continue to: This report details...
STUDY PRESENTATION
This report details the outcome of an IRB-approved study of 17 subjects with 26 symptomatic knees with a history of knee OA (Kellgren–Lawrence grade of 3 or 4) diagnosed by a radiograph. Patient demographics are described in the Table.
TABLE. Patient Demographics | |
Male n (%) | 10 (58.8) |
Age, mean ± SD (range) | 68.27 ± 7.43 |
BMI, mean ± SD (range) | 28.98 ± 4.50 |
Kellgren–Lawrence grade 3 (n) | 7 |
Kellgren–Lawrence grade 4 (n) | 19 |
Abbreviation: BMI, body mass index.
The study patients were evaluated by an orthopedic surgeon, Mitchell Sheinkop, who commonly performs total joint replacement in his practice and considers potential patients as candidates for TKA. These patients presented with a Kellgren-Lawrence grade of 3 or 4 knee OA, and all had significant pain that was refractory to conservative treatment, which included medications, physical therapy, and injections. The study patients were offered the Lipogems procedure as an alternative to TKA. Following this procedure, the study subjects were clinically evaluated using the numerical pain rating scale (NPRS), the 100-point Knee Society Score (KSS) with its functional component (FXN), and the lower extremity activity scale (LEAS) at 6 weeks, 6 months, and 12 months. The 1989 KSS12 was used for this study. Adverse reactions were also monitored throughout the study period.
METHODS
After obtaining informed consent, the subjects were taken into the operating room, moved to the procedure table, and placed in the prone position for aspiration. After scrubbing with Betadine and draping, 1 mL of lidocaine was used to anesthetize the skin, and a pre-prepared preparation of lidocaine, epinephrine, and sterile saline was infused into the subcutaneous tissue. The micro-fragmented adipose tissue was obtained with minimal manipulation using Lipogems, a closed system using mild mechanical forces and reduction filters. The system processes the lipoaspirate without the addition of enzymes or any other additives. The final product consists of adipose tissue clusters with preserved vascular stromal niche of approximately 500 microns. The lipoaspirate was processed in the same room via a closed system. During the processing, the subject’s puncture wounds were dressed. The knee injection site was prepped with a Betadine swab and DuraPrep. Then, Lipogems was injected intra-articularly under ultrasound guidance.
After the completion of the injection, manual range of motion was administered to the treated joint. The subject was then transferred to the recovery room where vital signs were monitored. Post-procedure instructions were reviewed with the patient by the study staff. The subject was instructed to use an assistive device and avoid weight-bearing for 48 hours and maintain the activities of daily living to a minimum on the day of the procedure. Non-weight-bearing for 48 hours was recommended for reducing discomfort to avoid the use of opioids. Nonsteroidal anti-inflammatory drugs, alcohol, and marijuana must be avoided for 4 weeks after the procedure. Pretreatment and post-treatment outcomes were collected using the NPRS, the 100-point KSS with its FXN, and the LEAS at 6 weeks, 6 months, and 12 months after this procedure. The 1989 KSS12 was used for this study since the same scale was used for previous TKA procedures by our authors, allowing for future comparisons of results.
STATISTICAL ANALYSIS
Mean and standard deviation were used to estimate central tendency and variability. Outcome measures were analyzed using the t test, with the pairwise t test was used for paired and subsequent measurements of the same patient or a knee. All analyses were performed with significance set at P <.05. The minimal clinically important difference (MCID) in patients who underwent TKA for primary OA was between 5.3 and 5.9 for KSS, while the MCID for FXN was between 6.1 and 6.4.13 These values were referenced for our analysis.
Continue to: No significant adverse...
RESULTS
No significant adverse events were reported in the subjects of this study. Common minor adverse events included pain and swelling, which generally resolved in 48 to 72 hours after the procedure.
Compared with baseline, significant improvements were noted in the mean values of NPRS (Figure 1) at 6 weeks, 6 months, and 12 months. The mean KSS significantly improved from baseline at 6 weeks and 12 months (Figure 2). Significant improvements were also noted in the mean values of FXN (Figure 3) and the mean LEAS significantly improved from baseline at 6 weeks and 6 months (Figure 4).
DISCUSSION
Knee OA is a disabling condition that affects a substantial proportion of the aging population. The current treatment methods do little to address the degenerative environment of the joint, which includes cytokines such as IL-1 and IL-2. Orthobiologic agents have been used recently to address these issues, which include PRP and MSCs from various sources, including bone marrow and adipose tissue.
A recent meta-analysis conducted by Cui and colleagues14 evaluated 18 studies of MSC treatment for knee OA with a total of 565 participants (226 males and 339 females). The duration from the onset of knee pain to registration in each study ranged from 3 months to ≥7 years. The follow-up period was 3 months -24 months. The majority of studies recruited patients with knee OA with a severity grade of 1-4 on the K-L scale; K-L grades 1 and 2 and grades 3 and 4 were defined as early OA and advanced OA, respectively. The results suggested that MSC treatment significantly improved pain and functional status, relative to the baseline evaluations in knee OA, and the beneficial effect was maintained for 2 years after treatment. Furthermore, the treatment effectiveness was not reduced over time.14
Included in the abovementioned meta-analysis were 2 papers by Koh and colleagues in 2012 and 2013 on the use of AMSCs for the treatment of OA. 15,16 The first study included 18 patients whose adipose tissue was harvested from the inner side of the infrapatellar fat pad via a skin incision after arthroscopic debridement. The cells were centrifuged and injected into the patient’s knee the same day. The results showed a significant reduction of pain and an increased quality of life for all patients, and a positive correlation was found between the number of cells injected and pain improvements. The authors concluded that AMSCs were a valid cell source for treating cartilage damage.15
In their second study, Koh and colleagues reported their results of treating 30 elderly patients with OA (≥65 years), who had failed conventional treatment, using intra-articular injections of AMSCs.16 This patient population is important since OA most commonly occurs in the elderly population. Patients underwent arthroscopic lavage and cartilage evaluation before receiving an injection of AMSCs delivered in PRP. The authors demonstrated that AMSC therapy for elderly patients with mild to moderate OA was an effective treatment resulting in reduction of pain and regeneration of cartilage.16
In another study, Adriani and colleagues17 performed autologous percutaneous fat injection from January 2012 to March 2015 for the treatment of knee OA. Their 30 patients (12 males and 18 females; mean age of 63.3 years; mean body mass index of 25.1) had stable or progressive knee OA for at least 12 months, no other injection treatments during the previous 12 months, and no prior knee surgeries. The patients were evaluated at baseline and 1 week and at 1, 3, 6, and 12 months after treatment using the NPRS and the Western Ontario and McMaster Universities Osteoarthritis Index (WOMAC) as outcome measures. The average VAS was 7.7 at baseline and improved to 4.3 at 3-month follow-up; however, a slight deterioration (VAS 5.0) was noted at 1 year. Total WOMAC score was 89.9 at baseline, 68.6 at 3 months, and 73.2 at 12-month follow-up.17
Continue to: The results of...
The results of this study demonstrated significant improvements in pain, quality of life, and function at 12 months after ultrasound-guided injection of ASCs in patients with severe knee OA. Significant improvement that was noted at 6 weeks was maintained through 12 months after the treatment. Improvement was noted in all scales, including the NPRS, the KSS, and the FXN beginning at 3 months and continuing through 12 months. The LEAS was statistically significant through 6 months after the treatment but not significant at 12 months. No serious adverse events were recorded.
In a study by Lee and colleagues,13 the MCID was described for KSS and FXN in patients who underwent TKA for primary OA. This is the minimal change in a scoring measure that is perceived by the patient to be beneficial or harmful. The MCID for KSS was noted to be between 5.3 and 5.9, while the MCID for FXN was between 6.1 and 6.4.13 In our study, the KSS score improved from an average of 74.0 at baseline to 79.6 at 6 months and 81.6 at 12 months (a difference of 5.6 and 7.6; P = .18 and.014, respectively). The FXN improved from an average of 65.4 at baseline to 75.2 at 6 months and 76.4 at 12 months (a difference of 9.9 and 11; P = .041 and.014, respectively). Therefore, a clinically important difference of KSS and FXN scores was noted at both 6 and 12 months.
The technique used in this study provides autologous, minimally manipulated, fat graft performed in a short time (60-90 minutes), without expansion and/or enzymatic treatment. In addition, the harvesting and the injection of stem cells on the same day is a simple, office-based procedure, and compliant with the U. S. Food and Drug Administration regulations.18 The cost of the procedure averages $3500.
A study limitation is that it is a case series with relatively small numbers and not a randomized controlled study. Therefore, a placebo effect may play a role in our results. Further study with a larger number of patients and randomized controlled studies would be beneficial to support the findings of this study.
CONCLUSION
The injection of autologous, micro-fractured, minimally manipulated adipose tissue appears to be a safe and effective treatment option in patients with refractory severe (grade 3 or 4) knee OA. This study showed significant improvements in pain, quality of life, and function for at least 12 months in this study population. This intervention may represent a nonsurgical treatment option to avoid knee joint replacement in this population; however, further investigation is needed.
- Yubo M, Yanyan L, Li L, Tao S, Bo L, Lin C. Clinical efficacy and safety of mesenchymal stem cell transplantation for osteoarthritis treatment: A meta-analysis. PLoS One. 2017;12(4):e0175449.
- Jauregui JJ, Cherian JJ, Pierce TP, Beaver WB, Issa K, Mont MA. Long-Term Survivorship and Clinical Outcomes Following Total Knee Arthroplasty. J Arthroplasty. 2015;30(12):2164-2166.
- Bourne RB, Chesworth BM, Davis AM, Mahomed NN, Charron KD. Patient satisfaction after total knee arthroplasty: who is satisfied and who is not? Clin Orthop Relat Res. 2010;468(1):57-63.
- Dai W-L, Zhou A-G, Zhang H, Zhang J. Efficacy of Platelet-Rich Plasma in the Treatment of Knee Osteoarthritis: A Meta-analysis of Randomized Controlled Trials. Arthroscopy.33(3):659-670.e651.
- Halpern B CS, Rodeo SA, Hayter C, Bogner E, Potter HG, Nguyen J. Clinical and MRI outcomes after platelet-rich plasma treatment for knee osteoarthritis. Clin J Sport Med. 2013 May;23.
- Mamidi MK, Das AK, Zakaria Z, Bhonde R. Mesenchymal stromal cells for cartilage repair in osteoarthritis. Osteoarthritis Cartilage. 2016;24(8):1307-1316.
- Tang Y, Pan ZY, Zou Y, et al. A comparative assessment of adipose-derived stem cells from subcutaneous and visceral fat as a potential cell source for knee osteoarthritis treatment. J Cell Mol Med. 2017.
- Izadpanah R, Trygg C, Patel B, et al. Biologic properties of mesenchymal stem cells derived from bone marrow and adipose tissue. Journal of cellular biochemistry. 2006;99(5):1285-1297.
- Ankrum J, Karp JM. Mesenchymal stem cell therapy: Two steps forward, one step back. Trends Mol Med. 2010;16(5):203-209.
- Togel F, Weiss K, Yang Y, Hu Z, Zhang P, Westenfelder C. Vasculotropic, paracrine actions of infused mesenchymal stem cells are important to the recovery from acute kidney injury. A J Physiol Renal Physiol. 2007;292(5):F1626-1635.
- Mestak O, Sukop A, Hsueh YS, et al. Centrifugation versus PureGraft for fatgrafting to the breast after breast-conserving therapy. World J Surg Oncol. 2014;12:178.
- Insall JN DL, Scott RD, Scott WN. Rationale of the Knee Society clinical rating system. Clin Orthop Relat Res. 1989 Nov;(248):13-4.
- Lee WC, Kwan YH, Chong HC, Yeo SJ. The minimal clinically important difference for Knee Society Clinical Rating System after total knee arthroplasty for primary osteoarthritis. Knee Surgery, Sports Traumatology, Arthroscopy. 2016.
- Cui GH, Wang YY, Li CJ, Shi CH, Wang WS. Efficacy of mesenchymal stem cells in treating patients with osteoarthritis of the knee: A meta-analysis. Exp Ther Med. 2016;12(5):3390-3400.
- Koh Y-GC, Yun-Jin. Infrapatellar fat pad-derived mesenchymal stem cell therapy for knee osteoarthritis. Knee. 2012;19(6):902-907.
- Koh Y-GC, Yun-Jin. Mesenchymal stem cell injections improve symptoms of knee osteoarthritis. Arthroscopy. 2013;29(4):748-755.
- Adriani E. MM, et al. Percutaneous Fat Transfer to Treat Knee Osteoarthritis Symptoms: Preliminary Results. Joints. 2017.
- Bianchi F, Maioli M, Leonardi E, et al. A New Nonenzymatic Method and Device to Obtain a Fat Tissue Derivative Highly Enriched in Pericyte-Like Elements by Mild Mechanical Forces From Human Lipoaspirates. Cell Transplantation. 2013;22(11):2063-2077
TAKE-HOME POINTS
- Severe knee osteoarthritis causes pain and limits functions in a substantial proportion of the aging population.
- Total knee arthroplasty is often recommended in this group of patients when conservative management has failed.
- Many patients in this group continue to seek a nonsurgical option for this process.
- Autologous, micro-fractured, minimally manipulated adipose tissue is easy to harvest, and injection into a knee joint resulted in significant improvement in pain and function for at least 12 months in this study population.
- This intervention may represent a nonsurgical treatment option to avoid knee joint replacement in this population.
Readmissions after Pediatric Hospitalization for Suicide Ideation and Suicide Attempt
Suicide is a leading cause of death among 10- to 34-year-olds in the United States.1,2 During the past two decades, the youth suicide death rate has risen by 24%, and more than 5,000 young people die from suicide each year.3 Suicide ideation (SI) and suicide attempts (SAs) are well-established risk factors for suicide death and a source of morbidity for patients and families. One-third of youth with SI attempt suicide at some point in their lifetime.4 Approximately 11% of youth SAs result in suicide death, and 2% of youth who attempt suicide subsequently go on to die from suicide after recovering from a prior SA.5 More than 60,000 youth are hospitalized for SI or SA each year,6 and young people hospitalized for SA are at high short-term risk of repeat SA and suicide death.7 Hospitals need strategies for measuring the quality of SI and SA hospitalizations, monitoring postdischarge outcomes, and identifying the patients at the highest risk of poor outcomes. Readmissions are a useful hospital quality measure that can indicate re-emergence of SI, repeat SA, or inadequate community-based mental health treatment, and interventions designed for patients with readmissions can potentially avert morbidity or mortality.
The National Committee on Quality Assurance recommends measurement of quality metrics for 30-day mental health follow-up after psychiatric hospitalizations, 30-day readmissions after adult (but not pediatric) psychiatric hospitalizations, and 30-day readmissions in pediatric medical and surgical hospitalizations. Readmission measures are not consistently used to evaluate pediatric psychiatric hospitalizations, and psychiatric quality measures are not used to evaluate medical or surgical hospitalizations for SA. Recent research has investigated transfers to postacute care,8 readmission prevalence, variation in hospital readmission performance, and risk factors for readmissions after pediatric psychiatric hospitalizations.9–11 However, no national study has investigated 30-day readmissions in youth hospitalized specifically for SI or SA.
To inform hospital quality measurement and improve hospital and postdischarge care for youth at risk of suicide, more information is needed about the characteristics of and the risk factors for readmissions after index SI/SA hospitalization. To address this knowledge gap, among SI/SA hospitalizations in 6- to 17-year-olds, we examined (1) unplanned 30-day readmissions and characteristics of hospitalizations by 30-day readmission status; (2) patient, hospital, and regional characteristics associated with 30-day readmissions; and (3) characteristics of 30-day readmissions.
METHODS
Study Design and Data Source
We conducted a national, retrospective cohort study of hospitalizations for patients aged 6-17 years using the Agency for Healthcare Research and Quality (AHRQ) 2013 and 2014 Nationwide Readmissions Database (NRD). The combined 2013-2014 NRD includes administrative data from a nationally representative sample of 29 million hospitalizations in 22 states, accounting for 49.3% of all US hospitalizations, and is weighted for national projections. The NRD includes hospital information, patient demographic information, and International Classification of Diseases, Ninth Revision, Clinical Modification (ICD-9-CM) diagnosis, procedure, and external cause of injury codes (E-codes). The database includes one primary diagnosis, up to 24 additional diagnoses, and up to 4 E-codes for each hospitalization. The NRD includes information about hospitalizations in acute-care general hospitals (including their psychiatric units) but not from specialty psychiatric hospitals. The database also includes de-identified, verified patient linkage numbers so that patients can be tracked across multiple hospitalizations at the same institution or different institutions within the same state. This study was considered to be exempt from review by the Children’s Hospital of Philadelphia Institutional Review Board.
Sample
We identified a sample of 181,575 hospitalizations for SI (n = 119,037) or SA (n = 62,538) among 6- to 17-year-olds between January 1, 2013, and December 31, 2014 (Figure). We included children as young as 6 years because validated methods exist to identify SI and SA in this age group,12 and because suicide deaths have recently increased among younger children.3 We excluded patients aged 18 years and older from this study since delivery of mental health services differs for adults.13 To create the sample, we first identified all hospitalizations of patients aged 6-17 years. We then used a validated algorithm relying on ICD-9-CM diagnosis codes for poisonings and E-codes for self-injury (E950-959) to identify hospitalizations related to SA.12 Because E-code completeness varies among states,14 we also used the combination of having both a diagnosis code for injury (800-999) and an ICD-9-CM code for SI (V62.84) as a proxy for SA. Among hospitalizations without SA, we identified hospitalizations with SI using the ICD-9-CM code for SI (V62.84) in any position.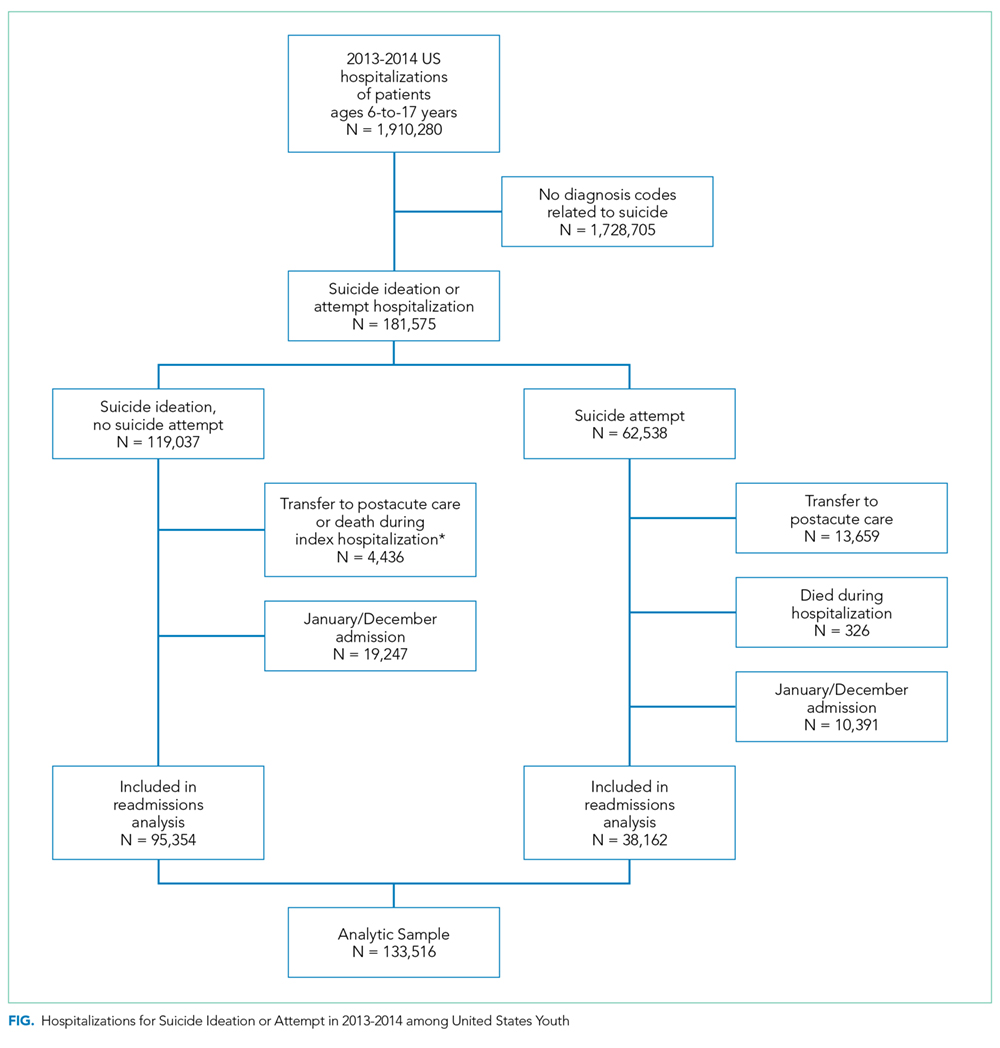
We identified 133,516 index hospitalizations with complete data at risk for an unplanned readmission. Because NRD data cannot be linked between calendar years, we limited the study time period for each calendar year to 10 months. We excluded hospitalizations in January because the full 30-day time frame to determine whether a hospitalization had occurred in the preceding 30 days, a known risk factor for readmissions in other samples,15 was not available. We excluded index hospitalizations occurring in December, because the full 30-day time frame to ascertain readmissions was not available. We excluded hospitalizations resulting in death, since these are not at risk for readmission, and hospitalizations resulting in transfer, since the timing of discharge to the community was not known. Readmission hospitalizations were eligible to be included as index hospitalizations if they met sample inclusion criteria. The final sample for readmission analyses included 95,354 SI hospitalizations and 38,162 SA hospitalizations (Figure).
Primary Outcome
The primary outcome was any unplanned, all-cause readmission within 30 days of index hospitalization for SI or SA. Among 30-day readmissions, we examined readmission timing, whether the readmission was to the same hospital or a different hospital, length of stay, and indication for readmission (medical/surgical or psychiatric, and presence of SI or SA diagnoses). Planned readmissions were identified using measure specifications endorsed by the AHRQ and the National Quality Forum16 and excluded from measurement.
Among index hospitalizations for SI, we specifically examined 30-day readmissions for subsequent SA, since one objective of hospitalization for SI is to prevent progression to SA or death. We could not identify hospitalizations for repeat SA after index hospitalization for SA, because diagnosis codes did not differentiate between readmission for complications of index SA and readmission for repeat SA.
Independent Variables
We analyzed demographic, clinical, and hospital factors associated with readmissions in other samples.17–20 Demographic characteristics included patient gender and age, urban or rural residence, payer, and median national income quartile for a patient’s ZIP code. Race and ethnicity data are not available in the NRD.
Clinical characteristics included hospitalization in the 30-days preceding the index hospitalization, index hospitalization length of stay, and admission via the emergency department (ED) versus direct admission. A patient’s chronic condition profile was determined using index hospitalization diagnosis codes. Complex chronic conditions (eg, cancer, cystic fibrosis) were identified using a classification system used in several prior studies of hospital administrative datasets,21 and other noncomplex chronic medical conditions (eg, asthma, obesity) were identified using the Healthcare Cost and Utilization Project (HCUP) chronic condition indicator system.22 Psychiatric conditions (eg, anxiety disorders, substance abuse, autism) were identified and categorized using a classification system used in studies of hospital administrative datasets.23 The number of psychiatric conditions was determined by counting the number of psychiatric condition categories in which a patient had a diagnosis. SA was categorized as having lower risk of death (eg, medication overdose, injury from cutting or piercing) or higher risk of death (eg, hanging, suffocation, or firearm injury).24
Because of known temporal trends in SI and SA,25,26 the month and year of admission were included as covariates. Hospital characteristics included teaching hospital and children’s hospital designations.
Statistical Analysis
We compared descriptive, summary statistics for characteristics of index hospitalizations with and without a 30-day readmission using Rao-Scott chi-square tests. In multivariable analyses, we derived logistic regression models to measure the associations of patient, hospital, and temporal factors with 30-day hospital readmissions. Analyses were conducted in SAS PROC SURVEYLOGISTIC and were weighted to achieve national estimates, clustered by sample stratum and hospital to account for the complex survey design,27 clustered by patients to account for multiple index visits per patient, and adjusted for clinical, demographic, and hospital characteristics. SAS version 9.4 (SAS Institute, Cary, North Carolina) was used for all analyses. All tests were two-sided, and a P value <.05 was considered as statistically significant.
RESULTS
Sample Characteristics
In the weighted analyses, we identified 133,516 hospitalizations in acute-care hospitals for SI or SA, and 8.5% (n = 11,375) of hospitalizations had at least one unplanned 30-day readmission to an acute-care hospital. Unweighted, the sample included 37,683 patients and 42,198 hospitalizations. Among all patients represented in the sample, 90.5% had only a single SI or SA hospitalization, 7.7% had two hospitalizations, and 1.8% had >2 hospitalizations in one year.
Table 1 summarizes the sample characteristics and displays the demographic, clinical, and hospital characteristics of index hospitalizations by the 30-day readmission status. Patients represented in the index hospitalizations were 64.9% female, 3.6% were aged 6-9 years, 40.1% were aged 10-14 years, and 56.3% were aged 15-17 years. Nearly half of the patients (49.1%) used public insurance. Nearly half (44.9%) lived in metropolitan areas with >1 million residents, 36.1% lived in metropolitan areas with 50,000 to 1 million residents, and 14.7% lived in rural areas.
Median length of stay for the index hospitalization was 5 days (interquartile range [IQR] 3-7). Nearly one-third (32.3%) of patients had a noncomplex chronic medical condition, 7.8% had a complex chronic medical condition, and 98.1% had a psychiatric condition. The most common psychiatric conditions were depressive disorders (60.0%) and anxiety disorders (42.2%). More than half (55.0%) of the patients had >2 psychiatric conditions. Most hospitalizations in the sample had SI only (71.4%). Among patients with SA, 81.0% had a lower lethality mechanism of injury and 19.0% had a higher lethality mechanism.
Patients experiencing a readmission were more likely to be 10-14 years old and use public insurance than patients without a readmission (P < .001 for both). For clinical characteristics, patients with a readmission were more likely to have longer index hospital stays (6 vs. 5 days), >2 psychiatric conditions (SI vs. SA), a prior admission in the 30 days preceding the index hospitalization, and admission via the ED (vs. direct admission) (P < .001 for all).
Association of Patient and Hospital Characteristics with Readmissions
Table 2 displays the patient and hospital characteristics associated with readmissions. Among demographic characteristics, 10- to 14-year-old patients had higher odds of readmission (odds ratio [OR]: 1.18, 95% confidence interval [CI]: 1.07-1.29) than 15- to 17-year-old patients. Having public insurance was associated with higher odds of readmission (OR: 1.14, 95% CI: 1.04-1.25). We found no differences in readmission rates based on sex, urban or rural location, or patient’s ZIP code income quartile.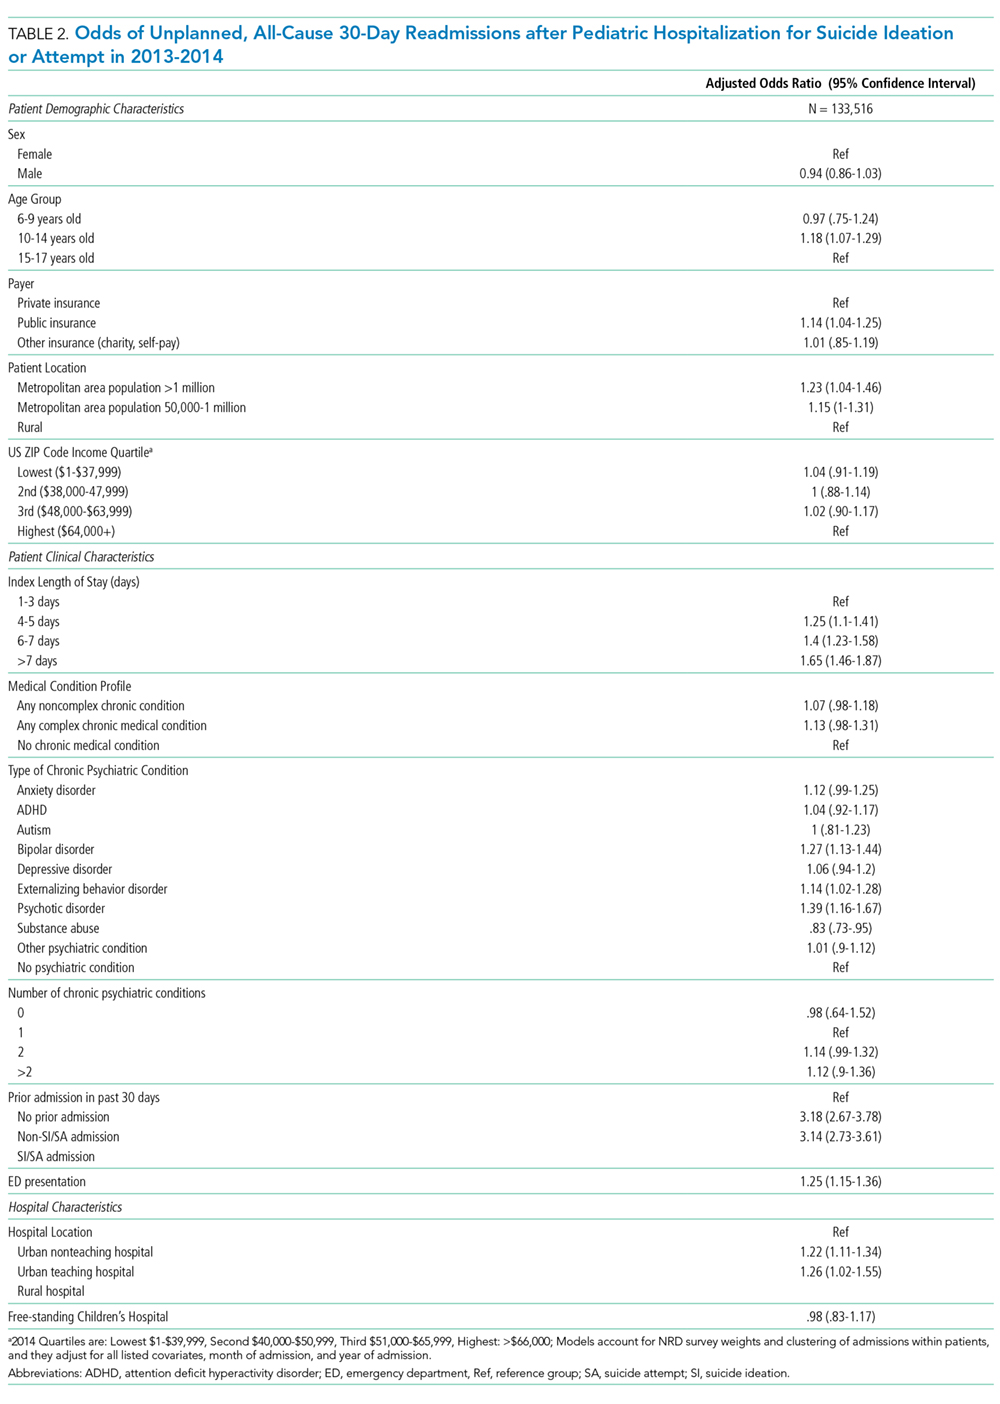
Among clinical characteristics, hospitalizations with an admission for SI or SA in the preceding 30 days, meaning that the index hospitalization itself was a readmission, had the strongest association with readmissions (OR: 3.14, 95% CI: 2.73-3.61). In addition, patients admitted via the ED for the index hospitalization had higher odds of readmission (OR: 1.25, 95% CI: 1.15-1.36). Chronic psychiatric conditions associated with higher odds of readmission included psychotic disorders (OR: 1.39, 95% CI: 1.16-1.67) and bipolar disorder (OR: 1.27, 95% CI: 1.13-1.44).
Characteristics of 30-day Readmissions
Table 3 displays the characteristics of readmissions after SI compared to that after SA. Among the combined sample of 11,375 30-day readmissions, 34.1% occurred within 7 days, and 65.9% in 8-30 days. Eleven percent of patients with any readmission had more than one readmission within 30 days. Among readmissions, 94.5% were for a psychiatric problem and 5.5% were for a medical or surgical problem. A total of 43.9% had a diagnosis of SI and 19.5% a diagnosis of SA. Readmissions were more likely to occur at a different hospital after SI than after SA (48.1% vs. 31.3%, P < .001). Medical and surgical indications for readmission were less common after SI than after SA (4.4% vs. 8.7%, P < .001). Only 1.2% of SI hospitalizations had a readmission for SA within 30 days. Of these cases, 55.6% were aged 15-17 years, 43.3% were aged 10-14 years, and 1.1% were aged 6-9 years; 73.1% of the patients were female, and 49.1% used public insurance.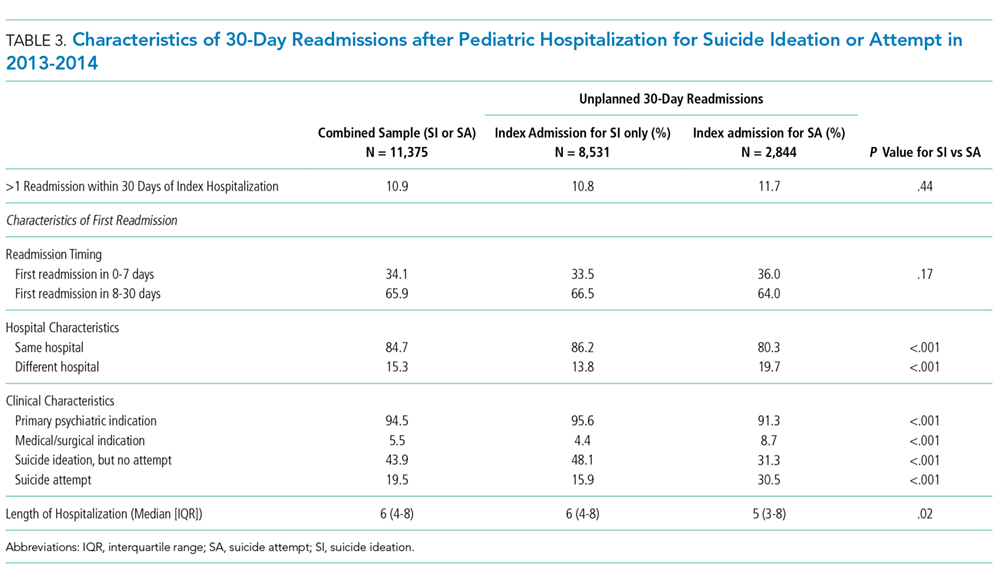
DISCUSSION
SI and SA in children and adolescents are substantial public health problems associated with significant hospital resource utilization. In 2013 and 2014, there were 181,575 pediatric acute-care hospitalizations for SI or SA, accounting for 9.5% of all hospitalizations in 6- to 17-year-old patients nationally. Among acute-care SI and SA hospitalizations, 8.5% had a readmission to an acute-care hospital within 30 days. The study data source did not include psychiatric specialty hospitals, and the number of index hospitalizations is likely substantially higher when psychiatric specialty hospitalizations are included. Readmissions may also be higher if patients were readmitted to psychiatric specialty hospitals after discharge from acute-care hospitals. The strongest risk factor for unplanned 30-day readmissions was a previous hospitalization in the 30 days before the index admission, likely a marker for severity or complexity of psychiatric illness. Other characteristics associated with higher odds of readmission were bipolar disorder, psychotic disorders, and age 10-14 years. More than one-third of readmissions occurred within the first 7 days after hospital discharge. The prevalence of SI and SA hospitalizations and readmissions was similar to findings in previous analyses of mental health hospitalizations.10,28
A patient’s psychiatric illness type and severity, as evidenced by the need for frequent repeat hospitalizations, was highly associated with the risk of 30-day readmission. Any hospitalization in the 30 days preceding the index hospitalization, whether for SI/SA or for another problem, was a strong risk factor for readmissions. We suspect that prior SI/SA hospitalizations reflect a patient’s chronic elevated risk for suicide. Prior hospitalizations not for SI or SA could be hospitalizations for mental illness exacerbations that increase the risk of SI or SA, eg, bipolar disorder with acute mania, or they could represent physical health problems. Chronic physical health problems are a known risk factor for SI and SA.29
A knowledge of those characteristics that increase the readmission risk can inform future resource allocation, research, and policy in several ways. First, longer hospital stays could mitigate readmission risk in some patients with severe psychiatric illness. European studies in older adolescents and adults show that for severe psychiatric illness, a longer hospital stay is associated with a lower risk of hospital readmission.15,30 Second, better access to intensive community-based mental health (MH) services, including evidence-based psychotherapy and medication management, improves symptoms in young people.31 Access to these services likely affects the risk of hospital readmission. We found that readmission risk was highest in 10- to 14-year-olds. Taken in the context of existing evidence that suicide rates are rising in younger patients,1,3 our findings suggest that particular attention to community services for younger patients is needed. Third, care coordination could help patients access beneficial services to reduce readmissions and improve other outcomes. Enhanced discharge care coordination reduced suicide deaths in high-risk populations in Europe32 and Japan33 and improved attendance at mental health follow-up after pediatric ED discharge in a small United States sample.34 Given that one-third of readmissions occurred within seven days, care coordination designed to ensure access to ambulatory services in the immediate postdischarge period may be particularly beneficial.
We found that ZIP code income quartile was not associated with readmissions. We suspect that poverty is not as closely correlated with MH hospitalization outcomes as it is with physical health hospitalization outcomes for several reasons. Medicaid insurance historically has more robust coverage of mental health services than some private insurance plans, which might offset some of the risk of poor mental health outcomes associated with poverty. Low-income families are eligible to use social services, and families accessing social services might have more opportunities to become familiar with community mental health programs. Further, the expectation of high achievement found in some higher income families is associated with MH problems in children and adolescents.35 Therefore, being in a higher income quartile might not be as protective against poor mental health outcomes as it is against poor physical health outcomes.
Although the NRD provides a rich source of readmission data across hospitals nationally, several limitations are inherent to this administrative dataset. First, data from specialty psychiatric hospitals were not included in the NRD. The study underestimates the total number of index hospitalizations and readmissions, since index SI/SA hospitalizations at psychiatric hospitals are not included, and readmissions are not included if they occurred at specialty psychiatric hospitals. Second, because data cannot be linked between calendar years, we excluded January and December hospitalizations, and findings might not generalize to hospitalizations in January and December. Seasonal trends in SI/SA hospitalizations are known to occur.36 Third, race, ethnicity, primary language, gender identity, and sexual orientation are not available in the NRD, and we could not examine the association of these characteristics with the likelihood of readmissions. Fourth, we did not have information about pre- or posthospitalization insurance enrollment or outpatient services that could affect the risk of readmission. Nevertheless, this study offers information on the characteristics of readmissions after hospitalizations for SI and SA in a large nationally representative sample of youth, and the findings can inform resource planning to prevent suicides.
CONCLUSION
Hospital readmissions are common in patients with SI and SA, and patients with a recent previous hospitalization have the highest risk of readmission. More than one-third of readmissions after SI or SA occurred within the first seven days. Due to the dearth of mental health services in the community, hospitals offer an important safety net for youth experiencing acute suicidal crises. Strategies to improve the continuum of care for patients at risk of suicide that solely focus on reducing readmissions are not likely to benefit patients. However, readmissions can identify opportunities for improving hospital discharge processes and outpatient services. Future research and clinical innovation to investigate and improve hospital discharge planning and access to community mental health services is likely to benefit patients and could reduce 30-day hospital readmissions.
Acknowledgments
The authors thank John Lawlor for his assistance with the analysis.
Disclosures
The authors have no potential conflicts of interest to disclose.
Funding
Dr. Zima received funding from the Behavioral Health Centers of Excellence for California (SB852).
1. Sheftall AH, Asti L, Horowitz LM, et al. Suicide in elementary school-aged children and early adolescents. Pediatrics. 2016;138(4):e20160436. doi: 10.1542/peds.2016-0436. PubMed
2. Prevention CNC for I. Suicide facts at a Glance 2015 nonfatal suicidal thoughts and behavior. In: 2015:3-4. https://stacks.cdc.gov/view/cdc/34181/cdc_34181_DS1.pdf. Accessed September 30, 2016.
3. Curtin S, Warner M, Hedegaard H. Increase in Suicide in the United States, 1999-2014. Hyattsville, MD; 2016. http://www.cdc.gov/nchs/data/databriefs/db241.pdf. Accessed November 7, 2016. PubMed
4. Nock MK, Green JG, Hwang I, et al. Prevalence, correlates, and treatment of lifetime suicidal behavior among adolescents: results from the national comorbidity survey replication adolescent supplement. JAMA Psychiatry. 2013;70(3):300. doi: 10.1001/2013.jamapsychiatry.55. PubMed
5. Bostwick JM, Pabbati C, Geske JR, Mckean AJ. Suicide attempt as a risk factor for completed suicide: even more lethal than we knew. Am J Psychiatry. 2016;173(11):1094-1100. doi: 10.1176/appi.ajp.2016.15070854. PubMed
6. Torio CM, Encinosa W, Berdahl T, McCormick MC, Simpson LA. Annual report on health care for children and youth in the united states: national estimates of cost, utilization and expenditures for children with mental health conditions. Acad Pediatr. 2015;15(1):19-35. doi: 10.1016/j.acap.2014.07.007. PubMed
7. Olfson M, Wall M, Wang S, et al. Suicide after deliberate self-harm in adolescents and young adults. Pediatrics. 2018;141(4):e20173517. doi: 10.1542/peds.2017-3517. PubMed
8. Gay JC, Zima BT, Coker TR, et al. Postacute care after pediatric hospitalizations for a primary mental health condition. J Pediatr. 2018;193:222-228.e1. doi: 10.1016/j.jpeds.2017.09.058. PubMed
9. Heslin KC, Weiss AJ. Hospital Readmissions Involving Psychiatric Disorders, 2012. 2015. https://www.ncbi.nlm.nih.gov/books/NBK305353/pdf/Bookshelf_NBK305353.pdf. Accessed September 8, 2017. PubMed
10. Feng JY, Toomey SL, Zaslavsky AM, Nakamura MM, Schuster MA. Readmission after pediatric mental health admissions. Pediatrics. 2017;140(6):e20171571. doi: 10.1542/peds.2017-1571. PubMed
11. Bardach NS, Vittinghoff E, Asteria-Peñaloza R, et al. Measuring hospital quality using pediatric readmission and revisit rates. Pediatrics. 2013;132(3):429-436. doi: 10.1542/peds.2012-3527. PubMed
12. Callahan ST, Fuchs DC, Shelton RC, et al. Identifying suicidal behavior among adolescents using administrative claims data. Pharmacoepidemiol Drug Saf. 2013;22(7):769-775. doi: 10.1002/pds.3421. PubMed
13. SAMHSA, HHS, Synectics for Management Decisions, Mathematica Policy Research. National Mental Health Services Survey: 2010: Data on Mental Health Treatment Facilities. http://media.samhsa.gov/data/DASIS/NMHSS2010D/NMHSS2010_Web.pdf. Accessed November 13, 2015.
14. Patrick AR, Miller M, Barber CW, Wang PS, Canning CF, Schneeweiss S. Identification of hospitalizations for intentional self-harm when E-codes are incompletely recorded. Pharmacoepidemiol Drug Saf. 2010;19(12):1263-1275. doi: 10.1002/pds.2037. PubMed
15. Mellesdal L, Mehlum L, Wentzel-Larsen T, Kroken R, Jørgensen HA. Suicide risk and acute psychiatric readmissions: a prospective cohort study. Psychiatr Serv. 2010;61(1):25-31. doi: 10.1176/appi.ps.61.1.25. PubMed
16. Agency for Healthcare Research and Quality, Centers for Medicare and Medicaid. Measure: Pediatric All-Condition Readmission Measure Measure Developer: Center of Excellence for Pediatric Quality Measurement (CEPQM). https://www.ahrq.gov/sites/default/files/wysiwyg/policymakers/chipra/factsheets/chipra_14-p008-1-ef.pdf. Accessed November 15, 2017.
17. Cancino RS, Culpepper L, Sadikova E, Martin J, Jack BW, Mitchell SE. Dose-response relationship between depressive symptoms and hospital readmission. J Hosp Med. 2014;9(6):358-364. doi: 10.1002/jhm.2180. PubMed
18. Carlisle CE, Mamdani M, Schachar R, To T. Aftercare, emergency department visits, and readmission in adolescents. J Am Acad Child Adolesc Psychiatry. 2012;51(3):283-293. http://www.sciencedirect.com/science/article/pii/S0890856711011002. Accessed November 2, 2015. PubMed
19. Fadum EA, Stanley B, Qin P, Diep LM, Mehlum L. Self-poisoning with medications in adolescents: a national register study of hospital admissions and readmissions. Gen Hosp Psychiatry. 2014;36(6):709-715. doi: 10.1016/j.genhosppsych.2014.09.004. PubMed
20. Bernet AC. Predictors of psychiatric readmission among veterans at high risk of suicide: the impact of post-discharge aftercare. Arch Psychiatr Nurs. 2013;27(5):260-261. doi: 10.1016/j.apnu.2013.07.001. PubMed
21. Feudtner C, Feinstein JA, Zhong W, Hall M, Dai D. Pediatric complex chronic conditions classification system version 2: updated for ICD-10 and complex medical technology dependence and transplantation. BMC Pediatr. 2014;14(1):199. doi: 10.1186/1471-2431-14-199. PubMed
22. HCUP. HCUP-US Tools & Software Page. http://www.hcup-us.ahrq.gov/toolssoftware/chronic/chronic.jsp. Published 2015. Accessed October 30, 2015.
23. Zima BT, Rodean J, Hall M, Bardach NS, Coker TR, Berry JG. Psychiatric disorders and trends in resource use in pediatric hospitals. Pediatrics. 2016;138(5):e20160909-e20160909. doi: 10.1542/peds.2016-0909. PubMed
24. Spicer RS, Miller TR. Suicide acts in 8 states: incidence and case fatality rates by demographics and method. Am J Public Health. 2000;90(12):1885-1891. doi: 10.2105/AJPH.90.12.1885. PubMed
25. Hansen B, Lang M. Back to school blues: Seasonality of youth suicide and the academic calendar. Econ Educ Rev. 2011;30(5):850-861. doi: 10.1016/j.econedurev.2011.04.012.
26. Lueck C, Kearl L, Lam CN, Claudius I. Do emergency pediatric psychiatric visits for danger to self or others correspond to times of school attendance? Am J Emerg Med. 2015;33(5):682-684. doi: 10.1016/J.AJEM.2015.02.055. PubMed
27. Healthcare Cost And Utilization Project. Introduction to the HCUP Nationwide Readmissions Database. Rockville, MD; 2017. https://www.hcup-us.ahrq.gov/db/nation/nrd/Introduction_NRD_2010-2014.pdf. Accessed November 14, 2017.
28. Bardach NS, Coker TR, Zima BT, et al. Common and costly hospitalizations for pediatric mental health disorders. Pediatrics. 2014;133(4):602-609. doi: 10.1542/peds.2013-3165. PubMed
29. Ahmedani BK, Peterson EL, Hu Y, et al. Major physical health conditions and risk of suicide. Am J Prev Med. 2017;53(3):308-315. doi: 10.1016/J.AMEPRE.2017.04.001. PubMed
30. Gunnell D, Hawton K, Ho D, et al. Hospital admissions for self harm after discharge from psychiatric inpatient care: cohort study. BMJ. 2008;337:a2278. doi: 10.1136/bmj.a2278. PubMed
31. The TADS Team. The treatment for adolescents with depression study (TADS). Arch Gen Psychiatry. 2007;64(10):1132. doi: 10.1001/archpsyc.64.10.1132. PubMed
32. While D, Bickley H, Roscoe A, et al. Implementation of mental health service recommendations in England and Wales and suicide rates, 1997-2006: A cross-sectional and before-and-after observational study. Lancet. 2012;379(9820):1005-1012. doi: 10.1016/S0140-6736(11)61712-1. PubMed
33. Kawanishi C, Aruga T, Ishizuka N, et al. Assertive case management versus enhanced usual care for people with mental health problems who had attempted suicide and were admitted to hospital emergency departments in Japan (ACTION-J): a multicentre, randomised controlled trial. Lancet Psychiatry. 2014;1(3):193-201. doi: 10.1016/S2215-0366(14)70259-7. PubMed
34. Grupp-Phelan J, McGuire L, Husky MM, Olfson M. A randomized controlled trial to engage in care of adolescent emergency department patients with mental health problems that increase suicide risk. Pediatr Emerg Care. 2012;28(12):1263-1268. doi: 10.1097/PEC.0b013e3182767ac8. PubMed
35. Ciciolla L, Curlee AS, Karageorge J, Luthar SS. When mothers and fathers are seen as disproportionately valuing achievements: implications for adjustment among upper middle class youth. J Youth Adolesc. 2017;46(5):1057-1075. doi: 10.1007/s10964-016-0596-x. PubMed
36. Plemmons G, Hall M, Doupnik S, et al. Hospitalization for suicide ideation or attempt: 2008–2015. Pediatrics. May 2018:e20172426. doi: 10.1542/peds.2017-2426. PubMed
Suicide is a leading cause of death among 10- to 34-year-olds in the United States.1,2 During the past two decades, the youth suicide death rate has risen by 24%, and more than 5,000 young people die from suicide each year.3 Suicide ideation (SI) and suicide attempts (SAs) are well-established risk factors for suicide death and a source of morbidity for patients and families. One-third of youth with SI attempt suicide at some point in their lifetime.4 Approximately 11% of youth SAs result in suicide death, and 2% of youth who attempt suicide subsequently go on to die from suicide after recovering from a prior SA.5 More than 60,000 youth are hospitalized for SI or SA each year,6 and young people hospitalized for SA are at high short-term risk of repeat SA and suicide death.7 Hospitals need strategies for measuring the quality of SI and SA hospitalizations, monitoring postdischarge outcomes, and identifying the patients at the highest risk of poor outcomes. Readmissions are a useful hospital quality measure that can indicate re-emergence of SI, repeat SA, or inadequate community-based mental health treatment, and interventions designed for patients with readmissions can potentially avert morbidity or mortality.
The National Committee on Quality Assurance recommends measurement of quality metrics for 30-day mental health follow-up after psychiatric hospitalizations, 30-day readmissions after adult (but not pediatric) psychiatric hospitalizations, and 30-day readmissions in pediatric medical and surgical hospitalizations. Readmission measures are not consistently used to evaluate pediatric psychiatric hospitalizations, and psychiatric quality measures are not used to evaluate medical or surgical hospitalizations for SA. Recent research has investigated transfers to postacute care,8 readmission prevalence, variation in hospital readmission performance, and risk factors for readmissions after pediatric psychiatric hospitalizations.9–11 However, no national study has investigated 30-day readmissions in youth hospitalized specifically for SI or SA.
To inform hospital quality measurement and improve hospital and postdischarge care for youth at risk of suicide, more information is needed about the characteristics of and the risk factors for readmissions after index SI/SA hospitalization. To address this knowledge gap, among SI/SA hospitalizations in 6- to 17-year-olds, we examined (1) unplanned 30-day readmissions and characteristics of hospitalizations by 30-day readmission status; (2) patient, hospital, and regional characteristics associated with 30-day readmissions; and (3) characteristics of 30-day readmissions.
METHODS
Study Design and Data Source
We conducted a national, retrospective cohort study of hospitalizations for patients aged 6-17 years using the Agency for Healthcare Research and Quality (AHRQ) 2013 and 2014 Nationwide Readmissions Database (NRD). The combined 2013-2014 NRD includes administrative data from a nationally representative sample of 29 million hospitalizations in 22 states, accounting for 49.3% of all US hospitalizations, and is weighted for national projections. The NRD includes hospital information, patient demographic information, and International Classification of Diseases, Ninth Revision, Clinical Modification (ICD-9-CM) diagnosis, procedure, and external cause of injury codes (E-codes). The database includes one primary diagnosis, up to 24 additional diagnoses, and up to 4 E-codes for each hospitalization. The NRD includes information about hospitalizations in acute-care general hospitals (including their psychiatric units) but not from specialty psychiatric hospitals. The database also includes de-identified, verified patient linkage numbers so that patients can be tracked across multiple hospitalizations at the same institution or different institutions within the same state. This study was considered to be exempt from review by the Children’s Hospital of Philadelphia Institutional Review Board.
Sample
We identified a sample of 181,575 hospitalizations for SI (n = 119,037) or SA (n = 62,538) among 6- to 17-year-olds between January 1, 2013, and December 31, 2014 (Figure). We included children as young as 6 years because validated methods exist to identify SI and SA in this age group,12 and because suicide deaths have recently increased among younger children.3 We excluded patients aged 18 years and older from this study since delivery of mental health services differs for adults.13 To create the sample, we first identified all hospitalizations of patients aged 6-17 years. We then used a validated algorithm relying on ICD-9-CM diagnosis codes for poisonings and E-codes for self-injury (E950-959) to identify hospitalizations related to SA.12 Because E-code completeness varies among states,14 we also used the combination of having both a diagnosis code for injury (800-999) and an ICD-9-CM code for SI (V62.84) as a proxy for SA. Among hospitalizations without SA, we identified hospitalizations with SI using the ICD-9-CM code for SI (V62.84) in any position.
We identified 133,516 index hospitalizations with complete data at risk for an unplanned readmission. Because NRD data cannot be linked between calendar years, we limited the study time period for each calendar year to 10 months. We excluded hospitalizations in January because the full 30-day time frame to determine whether a hospitalization had occurred in the preceding 30 days, a known risk factor for readmissions in other samples,15 was not available. We excluded index hospitalizations occurring in December, because the full 30-day time frame to ascertain readmissions was not available. We excluded hospitalizations resulting in death, since these are not at risk for readmission, and hospitalizations resulting in transfer, since the timing of discharge to the community was not known. Readmission hospitalizations were eligible to be included as index hospitalizations if they met sample inclusion criteria. The final sample for readmission analyses included 95,354 SI hospitalizations and 38,162 SA hospitalizations (Figure).
Primary Outcome
The primary outcome was any unplanned, all-cause readmission within 30 days of index hospitalization for SI or SA. Among 30-day readmissions, we examined readmission timing, whether the readmission was to the same hospital or a different hospital, length of stay, and indication for readmission (medical/surgical or psychiatric, and presence of SI or SA diagnoses). Planned readmissions were identified using measure specifications endorsed by the AHRQ and the National Quality Forum16 and excluded from measurement.
Among index hospitalizations for SI, we specifically examined 30-day readmissions for subsequent SA, since one objective of hospitalization for SI is to prevent progression to SA or death. We could not identify hospitalizations for repeat SA after index hospitalization for SA, because diagnosis codes did not differentiate between readmission for complications of index SA and readmission for repeat SA.
Independent Variables
We analyzed demographic, clinical, and hospital factors associated with readmissions in other samples.17–20 Demographic characteristics included patient gender and age, urban or rural residence, payer, and median national income quartile for a patient’s ZIP code. Race and ethnicity data are not available in the NRD.
Clinical characteristics included hospitalization in the 30-days preceding the index hospitalization, index hospitalization length of stay, and admission via the emergency department (ED) versus direct admission. A patient’s chronic condition profile was determined using index hospitalization diagnosis codes. Complex chronic conditions (eg, cancer, cystic fibrosis) were identified using a classification system used in several prior studies of hospital administrative datasets,21 and other noncomplex chronic medical conditions (eg, asthma, obesity) were identified using the Healthcare Cost and Utilization Project (HCUP) chronic condition indicator system.22 Psychiatric conditions (eg, anxiety disorders, substance abuse, autism) were identified and categorized using a classification system used in studies of hospital administrative datasets.23 The number of psychiatric conditions was determined by counting the number of psychiatric condition categories in which a patient had a diagnosis. SA was categorized as having lower risk of death (eg, medication overdose, injury from cutting or piercing) or higher risk of death (eg, hanging, suffocation, or firearm injury).24
Because of known temporal trends in SI and SA,25,26 the month and year of admission were included as covariates. Hospital characteristics included teaching hospital and children’s hospital designations.
Statistical Analysis
We compared descriptive, summary statistics for characteristics of index hospitalizations with and without a 30-day readmission using Rao-Scott chi-square tests. In multivariable analyses, we derived logistic regression models to measure the associations of patient, hospital, and temporal factors with 30-day hospital readmissions. Analyses were conducted in SAS PROC SURVEYLOGISTIC and were weighted to achieve national estimates, clustered by sample stratum and hospital to account for the complex survey design,27 clustered by patients to account for multiple index visits per patient, and adjusted for clinical, demographic, and hospital characteristics. SAS version 9.4 (SAS Institute, Cary, North Carolina) was used for all analyses. All tests were two-sided, and a P value <.05 was considered as statistically significant.
RESULTS
Sample Characteristics
In the weighted analyses, we identified 133,516 hospitalizations in acute-care hospitals for SI or SA, and 8.5% (n = 11,375) of hospitalizations had at least one unplanned 30-day readmission to an acute-care hospital. Unweighted, the sample included 37,683 patients and 42,198 hospitalizations. Among all patients represented in the sample, 90.5% had only a single SI or SA hospitalization, 7.7% had two hospitalizations, and 1.8% had >2 hospitalizations in one year.
Table 1 summarizes the sample characteristics and displays the demographic, clinical, and hospital characteristics of index hospitalizations by the 30-day readmission status. Patients represented in the index hospitalizations were 64.9% female, 3.6% were aged 6-9 years, 40.1% were aged 10-14 years, and 56.3% were aged 15-17 years. Nearly half of the patients (49.1%) used public insurance. Nearly half (44.9%) lived in metropolitan areas with >1 million residents, 36.1% lived in metropolitan areas with 50,000 to 1 million residents, and 14.7% lived in rural areas.
Median length of stay for the index hospitalization was 5 days (interquartile range [IQR] 3-7). Nearly one-third (32.3%) of patients had a noncomplex chronic medical condition, 7.8% had a complex chronic medical condition, and 98.1% had a psychiatric condition. The most common psychiatric conditions were depressive disorders (60.0%) and anxiety disorders (42.2%). More than half (55.0%) of the patients had >2 psychiatric conditions. Most hospitalizations in the sample had SI only (71.4%). Among patients with SA, 81.0% had a lower lethality mechanism of injury and 19.0% had a higher lethality mechanism.
Patients experiencing a readmission were more likely to be 10-14 years old and use public insurance than patients without a readmission (P < .001 for both). For clinical characteristics, patients with a readmission were more likely to have longer index hospital stays (6 vs. 5 days), >2 psychiatric conditions (SI vs. SA), a prior admission in the 30 days preceding the index hospitalization, and admission via the ED (vs. direct admission) (P < .001 for all).
Association of Patient and Hospital Characteristics with Readmissions
Table 2 displays the patient and hospital characteristics associated with readmissions. Among demographic characteristics, 10- to 14-year-old patients had higher odds of readmission (odds ratio [OR]: 1.18, 95% confidence interval [CI]: 1.07-1.29) than 15- to 17-year-old patients. Having public insurance was associated with higher odds of readmission (OR: 1.14, 95% CI: 1.04-1.25). We found no differences in readmission rates based on sex, urban or rural location, or patient’s ZIP code income quartile.
Among clinical characteristics, hospitalizations with an admission for SI or SA in the preceding 30 days, meaning that the index hospitalization itself was a readmission, had the strongest association with readmissions (OR: 3.14, 95% CI: 2.73-3.61). In addition, patients admitted via the ED for the index hospitalization had higher odds of readmission (OR: 1.25, 95% CI: 1.15-1.36). Chronic psychiatric conditions associated with higher odds of readmission included psychotic disorders (OR: 1.39, 95% CI: 1.16-1.67) and bipolar disorder (OR: 1.27, 95% CI: 1.13-1.44).
Characteristics of 30-day Readmissions
Table 3 displays the characteristics of readmissions after SI compared to that after SA. Among the combined sample of 11,375 30-day readmissions, 34.1% occurred within 7 days, and 65.9% in 8-30 days. Eleven percent of patients with any readmission had more than one readmission within 30 days. Among readmissions, 94.5% were for a psychiatric problem and 5.5% were for a medical or surgical problem. A total of 43.9% had a diagnosis of SI and 19.5% a diagnosis of SA. Readmissions were more likely to occur at a different hospital after SI than after SA (48.1% vs. 31.3%, P < .001). Medical and surgical indications for readmission were less common after SI than after SA (4.4% vs. 8.7%, P < .001). Only 1.2% of SI hospitalizations had a readmission for SA within 30 days. Of these cases, 55.6% were aged 15-17 years, 43.3% were aged 10-14 years, and 1.1% were aged 6-9 years; 73.1% of the patients were female, and 49.1% used public insurance.
DISCUSSION
SI and SA in children and adolescents are substantial public health problems associated with significant hospital resource utilization. In 2013 and 2014, there were 181,575 pediatric acute-care hospitalizations for SI or SA, accounting for 9.5% of all hospitalizations in 6- to 17-year-old patients nationally. Among acute-care SI and SA hospitalizations, 8.5% had a readmission to an acute-care hospital within 30 days. The study data source did not include psychiatric specialty hospitals, and the number of index hospitalizations is likely substantially higher when psychiatric specialty hospitalizations are included. Readmissions may also be higher if patients were readmitted to psychiatric specialty hospitals after discharge from acute-care hospitals. The strongest risk factor for unplanned 30-day readmissions was a previous hospitalization in the 30 days before the index admission, likely a marker for severity or complexity of psychiatric illness. Other characteristics associated with higher odds of readmission were bipolar disorder, psychotic disorders, and age 10-14 years. More than one-third of readmissions occurred within the first 7 days after hospital discharge. The prevalence of SI and SA hospitalizations and readmissions was similar to findings in previous analyses of mental health hospitalizations.10,28
A patient’s psychiatric illness type and severity, as evidenced by the need for frequent repeat hospitalizations, was highly associated with the risk of 30-day readmission. Any hospitalization in the 30 days preceding the index hospitalization, whether for SI/SA or for another problem, was a strong risk factor for readmissions. We suspect that prior SI/SA hospitalizations reflect a patient’s chronic elevated risk for suicide. Prior hospitalizations not for SI or SA could be hospitalizations for mental illness exacerbations that increase the risk of SI or SA, eg, bipolar disorder with acute mania, or they could represent physical health problems. Chronic physical health problems are a known risk factor for SI and SA.29
A knowledge of those characteristics that increase the readmission risk can inform future resource allocation, research, and policy in several ways. First, longer hospital stays could mitigate readmission risk in some patients with severe psychiatric illness. European studies in older adolescents and adults show that for severe psychiatric illness, a longer hospital stay is associated with a lower risk of hospital readmission.15,30 Second, better access to intensive community-based mental health (MH) services, including evidence-based psychotherapy and medication management, improves symptoms in young people.31 Access to these services likely affects the risk of hospital readmission. We found that readmission risk was highest in 10- to 14-year-olds. Taken in the context of existing evidence that suicide rates are rising in younger patients,1,3 our findings suggest that particular attention to community services for younger patients is needed. Third, care coordination could help patients access beneficial services to reduce readmissions and improve other outcomes. Enhanced discharge care coordination reduced suicide deaths in high-risk populations in Europe32 and Japan33 and improved attendance at mental health follow-up after pediatric ED discharge in a small United States sample.34 Given that one-third of readmissions occurred within seven days, care coordination designed to ensure access to ambulatory services in the immediate postdischarge period may be particularly beneficial.
We found that ZIP code income quartile was not associated with readmissions. We suspect that poverty is not as closely correlated with MH hospitalization outcomes as it is with physical health hospitalization outcomes for several reasons. Medicaid insurance historically has more robust coverage of mental health services than some private insurance plans, which might offset some of the risk of poor mental health outcomes associated with poverty. Low-income families are eligible to use social services, and families accessing social services might have more opportunities to become familiar with community mental health programs. Further, the expectation of high achievement found in some higher income families is associated with MH problems in children and adolescents.35 Therefore, being in a higher income quartile might not be as protective against poor mental health outcomes as it is against poor physical health outcomes.
Although the NRD provides a rich source of readmission data across hospitals nationally, several limitations are inherent to this administrative dataset. First, data from specialty psychiatric hospitals were not included in the NRD. The study underestimates the total number of index hospitalizations and readmissions, since index SI/SA hospitalizations at psychiatric hospitals are not included, and readmissions are not included if they occurred at specialty psychiatric hospitals. Second, because data cannot be linked between calendar years, we excluded January and December hospitalizations, and findings might not generalize to hospitalizations in January and December. Seasonal trends in SI/SA hospitalizations are known to occur.36 Third, race, ethnicity, primary language, gender identity, and sexual orientation are not available in the NRD, and we could not examine the association of these characteristics with the likelihood of readmissions. Fourth, we did not have information about pre- or posthospitalization insurance enrollment or outpatient services that could affect the risk of readmission. Nevertheless, this study offers information on the characteristics of readmissions after hospitalizations for SI and SA in a large nationally representative sample of youth, and the findings can inform resource planning to prevent suicides.
CONCLUSION
Hospital readmissions are common in patients with SI and SA, and patients with a recent previous hospitalization have the highest risk of readmission. More than one-third of readmissions after SI or SA occurred within the first seven days. Due to the dearth of mental health services in the community, hospitals offer an important safety net for youth experiencing acute suicidal crises. Strategies to improve the continuum of care for patients at risk of suicide that solely focus on reducing readmissions are not likely to benefit patients. However, readmissions can identify opportunities for improving hospital discharge processes and outpatient services. Future research and clinical innovation to investigate and improve hospital discharge planning and access to community mental health services is likely to benefit patients and could reduce 30-day hospital readmissions.
Acknowledgments
The authors thank John Lawlor for his assistance with the analysis.
Disclosures
The authors have no potential conflicts of interest to disclose.
Funding
Dr. Zima received funding from the Behavioral Health Centers of Excellence for California (SB852).
1. Sheftall AH, Asti L, Horowitz LM, et al. Suicide in elementary school-aged children and early adolescents. Pediatrics. 2016;138(4):e20160436. doi: 10.1542/peds.2016-0436. PubMed
2. Prevention CNC for I. Suicide facts at a Glance 2015 nonfatal suicidal thoughts and behavior. In: 2015:3-4. https://stacks.cdc.gov/view/cdc/34181/cdc_34181_DS1.pdf. Accessed September 30, 2016.
3. Curtin S, Warner M, Hedegaard H. Increase in Suicide in the United States, 1999-2014. Hyattsville, MD; 2016. http://www.cdc.gov/nchs/data/databriefs/db241.pdf. Accessed November 7, 2016. PubMed
4. Nock MK, Green JG, Hwang I, et al. Prevalence, correlates, and treatment of lifetime suicidal behavior among adolescents: results from the national comorbidity survey replication adolescent supplement. JAMA Psychiatry. 2013;70(3):300. doi: 10.1001/2013.jamapsychiatry.55. PubMed
5. Bostwick JM, Pabbati C, Geske JR, Mckean AJ. Suicide attempt as a risk factor for completed suicide: even more lethal than we knew. Am J Psychiatry. 2016;173(11):1094-1100. doi: 10.1176/appi.ajp.2016.15070854. PubMed
6. Torio CM, Encinosa W, Berdahl T, McCormick MC, Simpson LA. Annual report on health care for children and youth in the united states: national estimates of cost, utilization and expenditures for children with mental health conditions. Acad Pediatr. 2015;15(1):19-35. doi: 10.1016/j.acap.2014.07.007. PubMed
7. Olfson M, Wall M, Wang S, et al. Suicide after deliberate self-harm in adolescents and young adults. Pediatrics. 2018;141(4):e20173517. doi: 10.1542/peds.2017-3517. PubMed
8. Gay JC, Zima BT, Coker TR, et al. Postacute care after pediatric hospitalizations for a primary mental health condition. J Pediatr. 2018;193:222-228.e1. doi: 10.1016/j.jpeds.2017.09.058. PubMed
9. Heslin KC, Weiss AJ. Hospital Readmissions Involving Psychiatric Disorders, 2012. 2015. https://www.ncbi.nlm.nih.gov/books/NBK305353/pdf/Bookshelf_NBK305353.pdf. Accessed September 8, 2017. PubMed
10. Feng JY, Toomey SL, Zaslavsky AM, Nakamura MM, Schuster MA. Readmission after pediatric mental health admissions. Pediatrics. 2017;140(6):e20171571. doi: 10.1542/peds.2017-1571. PubMed
11. Bardach NS, Vittinghoff E, Asteria-Peñaloza R, et al. Measuring hospital quality using pediatric readmission and revisit rates. Pediatrics. 2013;132(3):429-436. doi: 10.1542/peds.2012-3527. PubMed
12. Callahan ST, Fuchs DC, Shelton RC, et al. Identifying suicidal behavior among adolescents using administrative claims data. Pharmacoepidemiol Drug Saf. 2013;22(7):769-775. doi: 10.1002/pds.3421. PubMed
13. SAMHSA, HHS, Synectics for Management Decisions, Mathematica Policy Research. National Mental Health Services Survey: 2010: Data on Mental Health Treatment Facilities. http://media.samhsa.gov/data/DASIS/NMHSS2010D/NMHSS2010_Web.pdf. Accessed November 13, 2015.
14. Patrick AR, Miller M, Barber CW, Wang PS, Canning CF, Schneeweiss S. Identification of hospitalizations for intentional self-harm when E-codes are incompletely recorded. Pharmacoepidemiol Drug Saf. 2010;19(12):1263-1275. doi: 10.1002/pds.2037. PubMed
15. Mellesdal L, Mehlum L, Wentzel-Larsen T, Kroken R, Jørgensen HA. Suicide risk and acute psychiatric readmissions: a prospective cohort study. Psychiatr Serv. 2010;61(1):25-31. doi: 10.1176/appi.ps.61.1.25. PubMed
16. Agency for Healthcare Research and Quality, Centers for Medicare and Medicaid. Measure: Pediatric All-Condition Readmission Measure Measure Developer: Center of Excellence for Pediatric Quality Measurement (CEPQM). https://www.ahrq.gov/sites/default/files/wysiwyg/policymakers/chipra/factsheets/chipra_14-p008-1-ef.pdf. Accessed November 15, 2017.
17. Cancino RS, Culpepper L, Sadikova E, Martin J, Jack BW, Mitchell SE. Dose-response relationship between depressive symptoms and hospital readmission. J Hosp Med. 2014;9(6):358-364. doi: 10.1002/jhm.2180. PubMed
18. Carlisle CE, Mamdani M, Schachar R, To T. Aftercare, emergency department visits, and readmission in adolescents. J Am Acad Child Adolesc Psychiatry. 2012;51(3):283-293. http://www.sciencedirect.com/science/article/pii/S0890856711011002. Accessed November 2, 2015. PubMed
19. Fadum EA, Stanley B, Qin P, Diep LM, Mehlum L. Self-poisoning with medications in adolescents: a national register study of hospital admissions and readmissions. Gen Hosp Psychiatry. 2014;36(6):709-715. doi: 10.1016/j.genhosppsych.2014.09.004. PubMed
20. Bernet AC. Predictors of psychiatric readmission among veterans at high risk of suicide: the impact of post-discharge aftercare. Arch Psychiatr Nurs. 2013;27(5):260-261. doi: 10.1016/j.apnu.2013.07.001. PubMed
21. Feudtner C, Feinstein JA, Zhong W, Hall M, Dai D. Pediatric complex chronic conditions classification system version 2: updated for ICD-10 and complex medical technology dependence and transplantation. BMC Pediatr. 2014;14(1):199. doi: 10.1186/1471-2431-14-199. PubMed
22. HCUP. HCUP-US Tools & Software Page. http://www.hcup-us.ahrq.gov/toolssoftware/chronic/chronic.jsp. Published 2015. Accessed October 30, 2015.
23. Zima BT, Rodean J, Hall M, Bardach NS, Coker TR, Berry JG. Psychiatric disorders and trends in resource use in pediatric hospitals. Pediatrics. 2016;138(5):e20160909-e20160909. doi: 10.1542/peds.2016-0909. PubMed
24. Spicer RS, Miller TR. Suicide acts in 8 states: incidence and case fatality rates by demographics and method. Am J Public Health. 2000;90(12):1885-1891. doi: 10.2105/AJPH.90.12.1885. PubMed
25. Hansen B, Lang M. Back to school blues: Seasonality of youth suicide and the academic calendar. Econ Educ Rev. 2011;30(5):850-861. doi: 10.1016/j.econedurev.2011.04.012.
26. Lueck C, Kearl L, Lam CN, Claudius I. Do emergency pediatric psychiatric visits for danger to self or others correspond to times of school attendance? Am J Emerg Med. 2015;33(5):682-684. doi: 10.1016/J.AJEM.2015.02.055. PubMed
27. Healthcare Cost And Utilization Project. Introduction to the HCUP Nationwide Readmissions Database. Rockville, MD; 2017. https://www.hcup-us.ahrq.gov/db/nation/nrd/Introduction_NRD_2010-2014.pdf. Accessed November 14, 2017.
28. Bardach NS, Coker TR, Zima BT, et al. Common and costly hospitalizations for pediatric mental health disorders. Pediatrics. 2014;133(4):602-609. doi: 10.1542/peds.2013-3165. PubMed
29. Ahmedani BK, Peterson EL, Hu Y, et al. Major physical health conditions and risk of suicide. Am J Prev Med. 2017;53(3):308-315. doi: 10.1016/J.AMEPRE.2017.04.001. PubMed
30. Gunnell D, Hawton K, Ho D, et al. Hospital admissions for self harm after discharge from psychiatric inpatient care: cohort study. BMJ. 2008;337:a2278. doi: 10.1136/bmj.a2278. PubMed
31. The TADS Team. The treatment for adolescents with depression study (TADS). Arch Gen Psychiatry. 2007;64(10):1132. doi: 10.1001/archpsyc.64.10.1132. PubMed
32. While D, Bickley H, Roscoe A, et al. Implementation of mental health service recommendations in England and Wales and suicide rates, 1997-2006: A cross-sectional and before-and-after observational study. Lancet. 2012;379(9820):1005-1012. doi: 10.1016/S0140-6736(11)61712-1. PubMed
33. Kawanishi C, Aruga T, Ishizuka N, et al. Assertive case management versus enhanced usual care for people with mental health problems who had attempted suicide and were admitted to hospital emergency departments in Japan (ACTION-J): a multicentre, randomised controlled trial. Lancet Psychiatry. 2014;1(3):193-201. doi: 10.1016/S2215-0366(14)70259-7. PubMed
34. Grupp-Phelan J, McGuire L, Husky MM, Olfson M. A randomized controlled trial to engage in care of adolescent emergency department patients with mental health problems that increase suicide risk. Pediatr Emerg Care. 2012;28(12):1263-1268. doi: 10.1097/PEC.0b013e3182767ac8. PubMed
35. Ciciolla L, Curlee AS, Karageorge J, Luthar SS. When mothers and fathers are seen as disproportionately valuing achievements: implications for adjustment among upper middle class youth. J Youth Adolesc. 2017;46(5):1057-1075. doi: 10.1007/s10964-016-0596-x. PubMed
36. Plemmons G, Hall M, Doupnik S, et al. Hospitalization for suicide ideation or attempt: 2008–2015. Pediatrics. May 2018:e20172426. doi: 10.1542/peds.2017-2426. PubMed
© 2018 Society of Hospital Medicine
The Virtual Hospitalist: A Single-Site Implementation Bringing Hospitalist Coverage to Critical Access Hospitals
Through increased involvement with families and caregivers, community hospitals can deliver better healthcare to patients.1,2 Furthermore, when patients bypass local hospitals and directly present to tertiary care, mortality for time-sensitive illnesses, such as sepsis, increases.3 Unfortunately, although critical access hospitals (CAHs) had an equivalent risk-adjusted mortality in 2002, they have failed to improve their performance at the same rate as that of larger hospitals and lag in quality metrics.4,5
One potential contributor to the lagging performance may be the low uptake of the hospitalist model at these facilities.6 Although dedicated hospitalists have improved patient outcomes and decreased spending in large hospitals,7-9 implementing the hospitalist medicine model on a smaller scale remains difficult. Approximately 1,300 CAHs provide necessary emergency room and inpatient services in the rural United States.10 Assuming 12-hour shifts and every-other-week assignments, providing continuous, on-location hospitalist coverage would require more than 10% of the total hospitalist workforce to cover less than 3% of all hospital admissions.11-13
Telemedicine allows content experts, including hospitalists, to supervise patient care remotely. This provides a potential solution to the logistical challenges of supplying continuous hospitalist coverage to a remote facility with a low daily census. We hypothesized that providing continuous “virtual hospitalist” coverage through telemedicine could increase the ability of a CAH to care for patients locally, decreasing the number of transfers to tertiary care centers and improving patient and provider satisfaction. We aimed to create a 25% relative reduction in CAH Emergency Department (ED) patient encounters resulting in transfer to outside hospitals within 6 months.
This quality improvement project was exempt from Institutional Review Board review.
METHODS
Setting
The University of Iowa Hospitals and Clinics (UIHC) is a 750-bed teaching hospital based in a suburban community in Eastern Iowa and the only tertiary care hospital in the state of Iowa. The UIHC Hospitalist group contains 44 staff physicians and covers more than 12 service lines (both faculty-only and resident-covered) at this facility.
Van Buren County Hospital (VBCH) is a 24-bed CAH offering emergency, internal medicine, and obstetrical services and located 80 miles southwest of UIHC. X-ray and CT scan services are available continuously, but ultrasound and magnetic resonance imaging services are available only 2-3 times per week. While tertiary care patients were transferred to UIHC, patients requiring specialty care but with less complex illnesses (eg, stable myocardial infarction) were referred to closer facilities.
Prior to implementation, coverage of the acute inpatient ward and the emergency room at VBCH was simultaneously provided by a single physician or advanced practice providers (APPs). When APPs provided coverage, a physician was required to be notified of any new admissions and was immediately available for medical emergencies. The VBCH providers worked alone in 48- to 72-hour continuous shifts as the sole coverage for both ED and inpatient units. It was frequently necessary to bring in outside providers through locum tenens agencies to fill gaps in the provider schedule. Both VBCH and UIHC used a shared electronic medical record (EMR), which was a key consideration in choosing VBCH as our pilot site. Providers at both institutions had access to identical patient information through the EMR, including radiology images, laboratory results, and provider notes.
Intervention Development and Implementation
A site visit by clinical and administrative project leads to VBCH identified three deficits that we could address through telemedicine: (1) The extended duration of VBCH shifts was detrimental to provider experience and retention; (2) Lack of local expertise in hospital medicine led to limited comfort in caring for patients with stable but medically complex conditions (eg, drug-resistant urinary tract infection); and (3) Patient transitions between VBCH and UIHC during acute care transfer were frustrating and led to negative experiences with providers and patients.
We developed a model to address these deficits using the minimum number of specialties and employees to facilitate rapid implementation. Although local care ED and inpatient care was provided by 3 APPS and a single physician provider, we mandated the coverage of all acute inpatients by the virtual hospitalists. This coverage included daily videoconference patient rounds, continuous pager coverage for new acute issues, and listing the virtual hospitalists as the attending of record for patient admissions. We scheduled contact times in the morning and afternoon to accelerate familiarity and comfort with the technology. We used a secure, Health Insurance Portability and Accountability Act of 1996 (HIPAA)-compliant platform for videoconferencing, accessible through personal computers or portable smart devices (Vidyo, VidyoInc, Hackensack, New Jersey). At VBCH, two tablet computers were provided to serve as portable platforms to use either in provider conference rooms or to be taken into patient rooms. Twice a day, at 8:45
Outcome Measures
Outcome measures were divided into three categories: (1) clinical and utilization outcomes; (2) virtual hospitalist outcomes; and (3) satisfaction outcomes. The primary clinical outcome was the percentage of ED encounters resulting in transfer to a different acute care hospital. We also monitored alternative ED dispositions, including local inpatient admission. Additional clinical and utilization outcomes after ED admission included the mean daily inpatient census at VBCH and the case mix index (CMI). We selected the mean length of stay, the percentage of inpatients transferred to other hospitals, and the inpatient mortality as balance measures due to concerns of increasing the acuity of the inpatient wards beyond the comfort and expertise of local staff. Virtual hospitalist outcomes included the mean daily time commitment and the mean time commitment per patient. Virtual hospitalists self-reported their time commitments as part of their daily documentation. We chose these measures in anticipation of expanding this program to other institutions in the future. Satisfaction outcomes included a weekly survey to all VBCH physicians and nursing staff (Appendix 1), weekly group discussions with virtual hospitalists and CAH staff, and 3 interviews with patients and family members after discharge (Appendix 2).
Statistical Analysis
Baseline data collected over a period of 24 weeks were used to measure pre-implementation performance and trends at VBCH. The virtual hospitalist service was started on November 15, 2016, and the two weeks before and two weeks after this date were excluded from analysis as a transition period. To account for weekend variation, we reported data in consecutive 28-day blocks. We used Chi-square tests to compare proportional outcomes and Student’s t-tests for continuous variables. Statistical Process Control charts were used to evaluate for temporal trends in quantitative data.
Funding
Development of this project was funded through the University of Iowa Hospitalist group and the Signal Center for Health Innovations at UI Health Ventures. Virtual hospitalist clinical time was paid for by the CAH on a fractional basis of a traditional hospitalist based on projected patient volumes through analysis of baseline data. Patients were not directly billed for virtual hospitalist service but were charged for the services provided by CAH providers.
RESULTS
Clinical and Utilization Outcomes
During the 24-week baseline period, VBCH had 947 ED encounters and 176 combined acute inpatient and observation admissions. For the 24 weeks following the transition, there were 930 ED visits and 186 admissions. We observed a 36% (157/947 to 98/930, P < .001) decrease in ED encounters ending in patient transfer to another hospital (Figure). In parallel, VBCH ED visits leading to local admission increased by 62% of baseline (39/947 to 62/930, P = .014). There was no significant change in the fraction of ED encounters resulting in an observation stay (104/947 to 99/930, P = .814). Daily ED visits did not change after virtual hospitalist coverage began (5.64 to 5.54 visits/day, P = .734), but the percentage of ED visits ending in discharge to a nonmedical setting increased from 79.0% to 82.7% (748/947 to 769/930, P = .042).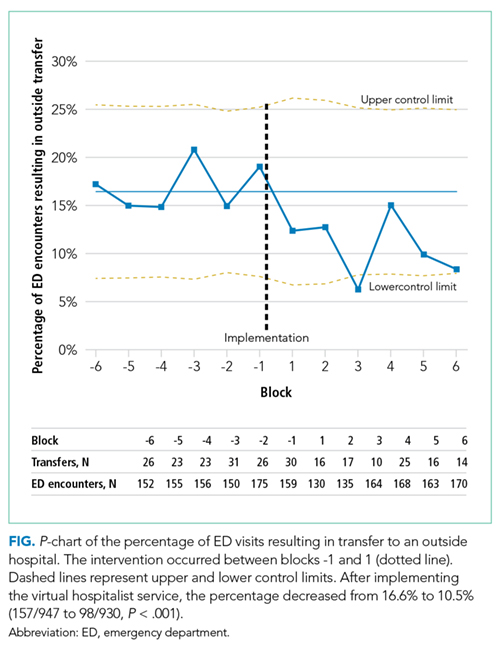
The implementation did not have a significant impact on ward census or patient complexity (Table 1). Both CMI and mean length of stay did not change after starting the service. The study was underpowered to detect differences in rare events, including inpatient mortality and transfer after admission. Despite the decrease in transfers, inpatient census was unchanged. This coincides with a 17% decrease (196/947 to 160/930, P = .054) in the proportion of ED patients referred for admission either locally or at an outside hospital.
Virtual Hospitalist Outcomes
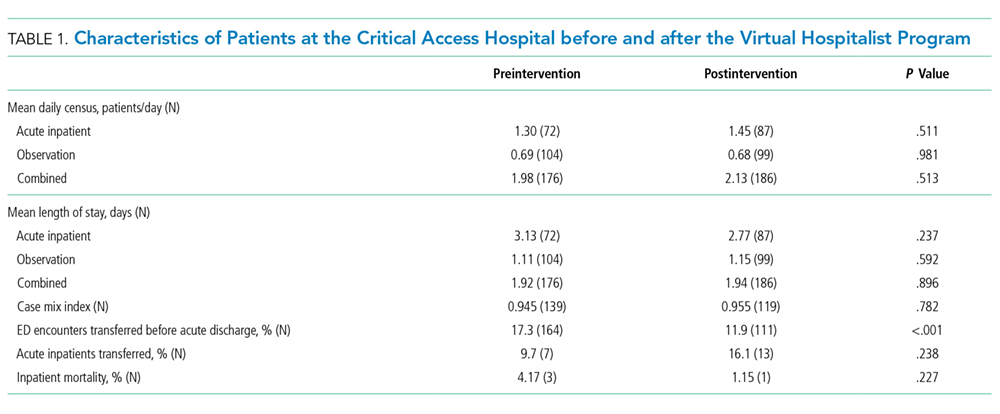
Satisfaction Outcomes
The staff at VBCH identified several benefits to the virtual hospitalist service. Survey responses (N = 18) were positive, with staff expressing specific gratitude for the additional education and training provided by the virtual hospitalists. On a Likert scale ranging from 1 (very poor) to 5 (excellent), the respondents gave high mean scores to the overall service experience (4.8) and the effectiveness of care delivered (4.9) but were more critical of the ability to keep patients locally (4.5) and the experience with transferring patients (3.9). We also collected free-text feedback from both patients and staff at VBCH (Table 2).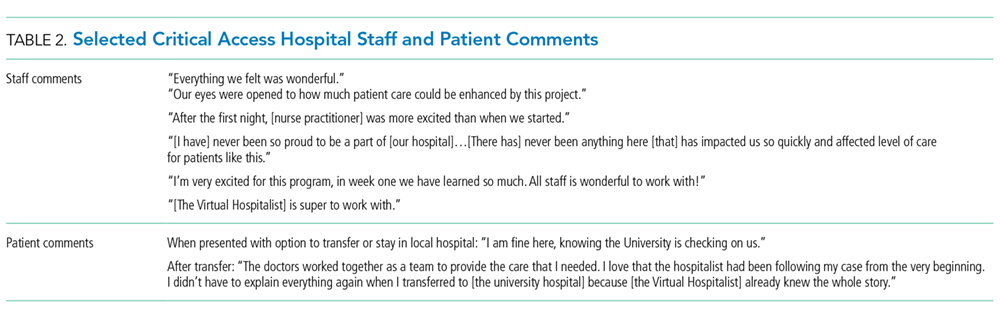
DISCUSSION
The virtual hospitalist service allowed a higher percentage of acute inpatients to receive care in their local hospital and was positively perceived by providers and patients. The per-patient time commitment by virtual hospitalists was similar to traditional hospitalist coverage14 and could scale to multiple simultaneous institutions.
Despite the increase in the proportion of patients admitted locally, neither the mean inpatient census nor the complexity of patients (as measured by CMI) increased. The increase in patients admitted locally was offset by a parallel increase in the number of ED patients discharged home. Although virtual hospitalists were available to consult on ED patients, this consultation was not mandatory unless the CAH provider felt that admission was indicated. It remains unclear whether the changes in ED disposition were due to direct intervention by virtual hospitalists, increasing local expertise with inpatient medicine, or unrelated local factors.
Although outside transfers directly from the ED dropped, there was a potential increase in acute inpatients transferred after admission that failed to reach statistical significance. We anticipated increased transfers after admission as a potential consequence of accepting more complex patients for CAH admission. Reasons for transfer included emergent transfers for medically unstable patients and scheduled transfer for subspecialist evaluation or testing. Despite the possible increase in delayed transfers, there was no significant change in CAH inpatient mortality, and the total fraction of combined ED and inpatients transferred decreased after the intervention.
Despite the benefits of keeping patients within their communities, 20%-60% of rural patients bypass their local facilities when seeking emergent care.15 Despite publicity on local media,16 we did not observe an increase in daily ED visits after implementation. Although some investigators have found that increasing the services offered decreases in rural bypass,17 others have found no or mixed effects.18,19 Further investigations into the local factors contributing to rural bypass may yield important insights, and future implementations should not rely on rapid increases in patient volume to establish economic viability.
Although telemedicine has been applied to a variety of previous settings, to our knowledge, this marks the first collaboration between an academic medical center and a CAH to provide continuous hospitalist coverage. A previous model for pediatric inpatients showed a similar decrease in patients transferred to tertiary centers.20 Virtual hospitalists differ from other adult telemedicine projects, which focused on subspecialty care or overnight coverage.21 The advantages of our model include the ability to proactively address deficits, even when local providers are unaware of changes to the standards of care. We believe that mandatory scheduled interactions decreased the barriers to communication and increased provider reassurance in telemedicine management of their patients. The scheduled interactions also provided additional training and development for CAH personnel, were well received by local staff, and may contribute to local provider job satisfaction, retention, and recruitment.
Past efforts to integrate academic hospitalists into CAHs improved quality metrics and provider satisfaction but were economically infeasible due to low patient volumes.22 In contrast, virtual providers can distribute their efforts across multiple areas, including covering additional CAHs, providing local patient care at their home facility, or completing academic projects. By combining two or more CAHs into a single provider, sufficient patient volume can be generated to dedicated personnel.
There were several limitations to this initial investigation:
- As a pilot between two specific institutions, modifications will be required to replicate in other CAHs or academic centers.
- Generating sufficient revenue to cover a full hospitalist salary will require adding additional responsibilities, either covering multiple CAHs simultaneously or combining virtual coverage with in-person responsibilities.
- The accuracy of the self-report remains unmeasured, and the impact of combining two or more CAHs may not be strictly additive. Attempts to supplement the self-reported time spent with additional information from the EMR and cell phone logs were complicated by the use of multiple platforms in parallel, interruptions in provider workflow, and provider multitasking.
- Due to the need for reliable local physical examinations and regulations on telehealth reimbursement, local APPs were necessary for this implementation. Although most of the CAHs have an on-site provider to provide ED coverage, CAHs with sufficient volume to necessitate separating ED and inpatient ward coverage may have difficulty supporting both APP and virtual hospitalist coverage, even on a fractional basis.
- This study was underpowered to detect rare events with significant consequences, including inpatient mortality and inpatient transfer. Although CMI suggests similar complexity in CAH patients, we have insufficient data to draw further comparisons on patient characteristics before and after the intervention.
- The analysis may be vulnerable to secular trends in the CAH patient population, as only 24 weeks of data were used as a baseline for comparison (although no significant seasonal variation was detected during that time). Extending the baseline data to include an additional 30 weeks ED encounters did not significantly alter our conclusions.
- Virtual hospitalists were dependent on physical examinations performed independently by local APPs.
- Although virtual providers were obligated to be available for videoconferencing within 60 minutes, more urgent medical decisions were sometimes made based on phone conferences between VBCH and the virtual hospitalist without video or direct patient assessment.
- We selected a CAH utilizing an identical instance of our EMR. Although this increased the ability of virtual hospitalists to split their time between virtual and local patient encounters, this limits our ability to spread this intervention beyond institutions already partnering with the UIHC.
CONCLUSIONS
We succeeded in reducing outside transfers at a CAH by implementing a sustainable virtual hospitalist service. This model allows patients to receive more of their care within their local communities and provides an improved inpatient experience. Next steps include expanding this service to other CAHs within our region, both to understand if this model is applicable beyond our initial site and to monitor for complications induced by scaling. If successful, virtual hospitalist coverage can provide a sustainable solution to providing the latest innovations in hospital medicine even to the most rural communities.
ACKNOWLEDGMENTS
The authors thank Ray Brownsworth, CEO of Van Buren County Hospital, as well as all the providers and staff who worked with them to implement and improve their services. The authors also thank Pat Brophy, founder of The Signal Center for Health Innovation, for providing leadership, support, and resources for innovation.
Disclosures
None of the authors have identified a conflict of interest in relation to this manuscript.
Funding
This project was funded through the University of Iowa Health Care and the Signal Center for Health Innovations at UI Health Ventures.
Compliance With Ethical Standards
This quality improvement project was exempt from Institutional Review Board review
1. Kripalani S, Jackson AT, Schnipper JL, Coleman EA. Promoting effective transitions of care at hospital discharge: a review of key issues for hospitalists. J Hosp Med. 2007;2(5):314-323. doi: 10.1002/jhm.228.
2. Potter AJ, Ward MM, Natafgi N, et al. Perceptions of the benefits of telemedicine in rural communities. Perspect Health Inform Manag. 2016;Summer:1-13.
3. Mohr NM, Harland KK, Shane DM, et al. Rural patients with severe sepsis or septic shock who bypass rural hospitals have increased mortality: an instrumental variables approach. Crit Care Med. 2017;45(1):85-93. doi: 10.1097/CCM.0000000000002026.
4. Joynt KE, Orav EJ, Jha AK. Mortality rates for medicare beneficiaries admitted to critical access and non-critical access hospitals, 2002-2010. JAMA. 2013;309(13):1379-1387. doi: 10.1001/jama.2013.2366.
5. Joynt KE, Harris Y, Orav EJ, Jha AK. Quality of care and patient outcomes in critical access rural hospitals. JAMA. 2011;306(1):45-52. doi: 10.1001/jama.2011.902.
6. Association AH. AHA Annual Survey Database. Washington, DC: American Hospital Association; 2005.
7. Wachter RM, Katz P, Showstack J, Bindman AB, Goldman L. Reorganizing an academic medical service: impact on cost, quality, patient satisfaction, and education. JAMA. 1998;279(19):1560-1565. doi: 10.1001/jama.279.19.1560.
8. Peterson MC. A systematic review of outcomes and quality measures in adult patients cared for by hospitalists vs nonhospitalists. Mayo Clin Proc. 2009;84(3):248-254. doi: 10.1016/S0025-6196(11)61142-7.
9. Auerbach AD, Wachter RM, Katz P, et al. Implementation of a voluntary hospitalist service at a community teaching hospital: improved clinical efficiency and patient outcomes. Ann Intern Med. 2002;137(11):859-865. doi: 10.7326/0003-4819-137-11-200212030-00006.
10. Moscovice I, Coburn A, Holmes M, et al. Flex Monitoring Team. http://www.flexmonitoring.org/. Accessed December 19, 2016.
11. In Critical Condition the Fragile State of Critical Access Hospitals; 2013. http://www.aha.org/research/policy/infographics/pdf/info-cah.pdf. Accessed March 23, 2017.
12. Wachter RM, Goldman L. Zero to 50,000—the 20th anniversary of the hospitalist. N Engl J Med. 2016;375(11):1009-1011. doi: 10.1056/NEJMp1607958.
13. Aj W, AE. Overview of Hospital Stays in the United States; 2012. http://www.hcup-us.ahrq.gov/reports/statbriefs/sb180-Hospitalizations-United-States-2012.pdf. Accessed February 7, 2017.
14. Tipping MD, Forth VE, O’Leary KJ, et al. Where did the day go?—A time‐motion study of hospitalists. J Hosp Med. 2010;5(6):323-328. doi: 10.1002/jhm.790.
15. Liu JJ, Bellamy GR, McCormick M. Patient bypass behavior and critical access hospitals: implications for patient retention. J Rural Health. 2007;23(1):17-24 doi: http://dx.doi.org/10.1111/j.1748-0361.2006.00063.x.
16. Keenan C. Iowa’s rural hospitals balance tight budgets with patient needs. The Gazette. July 10, 2017.
17. Escarce JJ, Kapur K. Do patients bypass rural hospitals? Determinants of inpatient hospital choice in rural California. J Health Care Poor Underserved. 2009;20(3):625-644. doi: 10.1353/hpu.0.0178.
18. Liu JJ, Bellamy G, Barnet B, Weng S. Bypass of local primary care in rural counties: effect of patient and community characteristics. Ann Fam Med. 2008;6(2):124-130. doi: 10.1370/afm.794.
19. Weigel PAM, Ullrich F, Ward MM. Rural bypass of critical access hospitals in Iowa: do visiting surgical specialists make a difference? J Rural Health. 2018;34 Supplement 1:s21-s29. doi: 10.1111/jrh.12220.
20. LaBarbera JM, Ellenby MS, Bouressa P, et al. The impact of telemedicine intensivist support and a pediatric hospitalist program on a community hospital. Telemed J E Health. 2013;19(10):760-766. doi: 10.1089/tmj.2012.0303.
21. AlDossary S, Martin-Khan MG, Bradford NK, Smith AC. A systematic review of the methodologies used to evaluate telemedicine service initiatives in hospital facilities. Int J Med Inform. 2017;97:171-194. doi: 10.1016/j.ijmedinf.2016.10.012.
22. Dougan BM, Montori VM, Carlson KW. Implementing a Hospitalist Program in a Critical Access Hospital. J Rural Health. 2018;34(1):109-115. doi: 10.1111/jrh.12190.
Through increased involvement with families and caregivers, community hospitals can deliver better healthcare to patients.1,2 Furthermore, when patients bypass local hospitals and directly present to tertiary care, mortality for time-sensitive illnesses, such as sepsis, increases.3 Unfortunately, although critical access hospitals (CAHs) had an equivalent risk-adjusted mortality in 2002, they have failed to improve their performance at the same rate as that of larger hospitals and lag in quality metrics.4,5
One potential contributor to the lagging performance may be the low uptake of the hospitalist model at these facilities.6 Although dedicated hospitalists have improved patient outcomes and decreased spending in large hospitals,7-9 implementing the hospitalist medicine model on a smaller scale remains difficult. Approximately 1,300 CAHs provide necessary emergency room and inpatient services in the rural United States.10 Assuming 12-hour shifts and every-other-week assignments, providing continuous, on-location hospitalist coverage would require more than 10% of the total hospitalist workforce to cover less than 3% of all hospital admissions.11-13
Telemedicine allows content experts, including hospitalists, to supervise patient care remotely. This provides a potential solution to the logistical challenges of supplying continuous hospitalist coverage to a remote facility with a low daily census. We hypothesized that providing continuous “virtual hospitalist” coverage through telemedicine could increase the ability of a CAH to care for patients locally, decreasing the number of transfers to tertiary care centers and improving patient and provider satisfaction. We aimed to create a 25% relative reduction in CAH Emergency Department (ED) patient encounters resulting in transfer to outside hospitals within 6 months.
This quality improvement project was exempt from Institutional Review Board review.
METHODS
Setting
The University of Iowa Hospitals and Clinics (UIHC) is a 750-bed teaching hospital based in a suburban community in Eastern Iowa and the only tertiary care hospital in the state of Iowa. The UIHC Hospitalist group contains 44 staff physicians and covers more than 12 service lines (both faculty-only and resident-covered) at this facility.
Van Buren County Hospital (VBCH) is a 24-bed CAH offering emergency, internal medicine, and obstetrical services and located 80 miles southwest of UIHC. X-ray and CT scan services are available continuously, but ultrasound and magnetic resonance imaging services are available only 2-3 times per week. While tertiary care patients were transferred to UIHC, patients requiring specialty care but with less complex illnesses (eg, stable myocardial infarction) were referred to closer facilities.
Prior to implementation, coverage of the acute inpatient ward and the emergency room at VBCH was simultaneously provided by a single physician or advanced practice providers (APPs). When APPs provided coverage, a physician was required to be notified of any new admissions and was immediately available for medical emergencies. The VBCH providers worked alone in 48- to 72-hour continuous shifts as the sole coverage for both ED and inpatient units. It was frequently necessary to bring in outside providers through locum tenens agencies to fill gaps in the provider schedule. Both VBCH and UIHC used a shared electronic medical record (EMR), which was a key consideration in choosing VBCH as our pilot site. Providers at both institutions had access to identical patient information through the EMR, including radiology images, laboratory results, and provider notes.
Intervention Development and Implementation
A site visit by clinical and administrative project leads to VBCH identified three deficits that we could address through telemedicine: (1) The extended duration of VBCH shifts was detrimental to provider experience and retention; (2) Lack of local expertise in hospital medicine led to limited comfort in caring for patients with stable but medically complex conditions (eg, drug-resistant urinary tract infection); and (3) Patient transitions between VBCH and UIHC during acute care transfer were frustrating and led to negative experiences with providers and patients.
We developed a model to address these deficits using the minimum number of specialties and employees to facilitate rapid implementation. Although local care ED and inpatient care was provided by 3 APPS and a single physician provider, we mandated the coverage of all acute inpatients by the virtual hospitalists. This coverage included daily videoconference patient rounds, continuous pager coverage for new acute issues, and listing the virtual hospitalists as the attending of record for patient admissions. We scheduled contact times in the morning and afternoon to accelerate familiarity and comfort with the technology. We used a secure, Health Insurance Portability and Accountability Act of 1996 (HIPAA)-compliant platform for videoconferencing, accessible through personal computers or portable smart devices (Vidyo, VidyoInc, Hackensack, New Jersey). At VBCH, two tablet computers were provided to serve as portable platforms to use either in provider conference rooms or to be taken into patient rooms. Twice a day, at 8:45
Outcome Measures
Outcome measures were divided into three categories: (1) clinical and utilization outcomes; (2) virtual hospitalist outcomes; and (3) satisfaction outcomes. The primary clinical outcome was the percentage of ED encounters resulting in transfer to a different acute care hospital. We also monitored alternative ED dispositions, including local inpatient admission. Additional clinical and utilization outcomes after ED admission included the mean daily inpatient census at VBCH and the case mix index (CMI). We selected the mean length of stay, the percentage of inpatients transferred to other hospitals, and the inpatient mortality as balance measures due to concerns of increasing the acuity of the inpatient wards beyond the comfort and expertise of local staff. Virtual hospitalist outcomes included the mean daily time commitment and the mean time commitment per patient. Virtual hospitalists self-reported their time commitments as part of their daily documentation. We chose these measures in anticipation of expanding this program to other institutions in the future. Satisfaction outcomes included a weekly survey to all VBCH physicians and nursing staff (Appendix 1), weekly group discussions with virtual hospitalists and CAH staff, and 3 interviews with patients and family members after discharge (Appendix 2).
Statistical Analysis
Baseline data collected over a period of 24 weeks were used to measure pre-implementation performance and trends at VBCH. The virtual hospitalist service was started on November 15, 2016, and the two weeks before and two weeks after this date were excluded from analysis as a transition period. To account for weekend variation, we reported data in consecutive 28-day blocks. We used Chi-square tests to compare proportional outcomes and Student’s t-tests for continuous variables. Statistical Process Control charts were used to evaluate for temporal trends in quantitative data.
Funding
Development of this project was funded through the University of Iowa Hospitalist group and the Signal Center for Health Innovations at UI Health Ventures. Virtual hospitalist clinical time was paid for by the CAH on a fractional basis of a traditional hospitalist based on projected patient volumes through analysis of baseline data. Patients were not directly billed for virtual hospitalist service but were charged for the services provided by CAH providers.
RESULTS
Clinical and Utilization Outcomes
During the 24-week baseline period, VBCH had 947 ED encounters and 176 combined acute inpatient and observation admissions. For the 24 weeks following the transition, there were 930 ED visits and 186 admissions. We observed a 36% (157/947 to 98/930, P < .001) decrease in ED encounters ending in patient transfer to another hospital (Figure). In parallel, VBCH ED visits leading to local admission increased by 62% of baseline (39/947 to 62/930, P = .014). There was no significant change in the fraction of ED encounters resulting in an observation stay (104/947 to 99/930, P = .814). Daily ED visits did not change after virtual hospitalist coverage began (5.64 to 5.54 visits/day, P = .734), but the percentage of ED visits ending in discharge to a nonmedical setting increased from 79.0% to 82.7% (748/947 to 769/930, P = .042).
The implementation did not have a significant impact on ward census or patient complexity (Table 1). Both CMI and mean length of stay did not change after starting the service. The study was underpowered to detect differences in rare events, including inpatient mortality and transfer after admission. Despite the decrease in transfers, inpatient census was unchanged. This coincides with a 17% decrease (196/947 to 160/930, P = .054) in the proportion of ED patients referred for admission either locally or at an outside hospital.
Virtual Hospitalist Outcomes
Satisfaction Outcomes
The staff at VBCH identified several benefits to the virtual hospitalist service. Survey responses (N = 18) were positive, with staff expressing specific gratitude for the additional education and training provided by the virtual hospitalists. On a Likert scale ranging from 1 (very poor) to 5 (excellent), the respondents gave high mean scores to the overall service experience (4.8) and the effectiveness of care delivered (4.9) but were more critical of the ability to keep patients locally (4.5) and the experience with transferring patients (3.9). We also collected free-text feedback from both patients and staff at VBCH (Table 2).
DISCUSSION
The virtual hospitalist service allowed a higher percentage of acute inpatients to receive care in their local hospital and was positively perceived by providers and patients. The per-patient time commitment by virtual hospitalists was similar to traditional hospitalist coverage14 and could scale to multiple simultaneous institutions.
Despite the increase in the proportion of patients admitted locally, neither the mean inpatient census nor the complexity of patients (as measured by CMI) increased. The increase in patients admitted locally was offset by a parallel increase in the number of ED patients discharged home. Although virtual hospitalists were available to consult on ED patients, this consultation was not mandatory unless the CAH provider felt that admission was indicated. It remains unclear whether the changes in ED disposition were due to direct intervention by virtual hospitalists, increasing local expertise with inpatient medicine, or unrelated local factors.
Although outside transfers directly from the ED dropped, there was a potential increase in acute inpatients transferred after admission that failed to reach statistical significance. We anticipated increased transfers after admission as a potential consequence of accepting more complex patients for CAH admission. Reasons for transfer included emergent transfers for medically unstable patients and scheduled transfer for subspecialist evaluation or testing. Despite the possible increase in delayed transfers, there was no significant change in CAH inpatient mortality, and the total fraction of combined ED and inpatients transferred decreased after the intervention.
Despite the benefits of keeping patients within their communities, 20%-60% of rural patients bypass their local facilities when seeking emergent care.15 Despite publicity on local media,16 we did not observe an increase in daily ED visits after implementation. Although some investigators have found that increasing the services offered decreases in rural bypass,17 others have found no or mixed effects.18,19 Further investigations into the local factors contributing to rural bypass may yield important insights, and future implementations should not rely on rapid increases in patient volume to establish economic viability.
Although telemedicine has been applied to a variety of previous settings, to our knowledge, this marks the first collaboration between an academic medical center and a CAH to provide continuous hospitalist coverage. A previous model for pediatric inpatients showed a similar decrease in patients transferred to tertiary centers.20 Virtual hospitalists differ from other adult telemedicine projects, which focused on subspecialty care or overnight coverage.21 The advantages of our model include the ability to proactively address deficits, even when local providers are unaware of changes to the standards of care. We believe that mandatory scheduled interactions decreased the barriers to communication and increased provider reassurance in telemedicine management of their patients. The scheduled interactions also provided additional training and development for CAH personnel, were well received by local staff, and may contribute to local provider job satisfaction, retention, and recruitment.
Past efforts to integrate academic hospitalists into CAHs improved quality metrics and provider satisfaction but were economically infeasible due to low patient volumes.22 In contrast, virtual providers can distribute their efforts across multiple areas, including covering additional CAHs, providing local patient care at their home facility, or completing academic projects. By combining two or more CAHs into a single provider, sufficient patient volume can be generated to dedicated personnel.
There were several limitations to this initial investigation:
- As a pilot between two specific institutions, modifications will be required to replicate in other CAHs or academic centers.
- Generating sufficient revenue to cover a full hospitalist salary will require adding additional responsibilities, either covering multiple CAHs simultaneously or combining virtual coverage with in-person responsibilities.
- The accuracy of the self-report remains unmeasured, and the impact of combining two or more CAHs may not be strictly additive. Attempts to supplement the self-reported time spent with additional information from the EMR and cell phone logs were complicated by the use of multiple platforms in parallel, interruptions in provider workflow, and provider multitasking.
- Due to the need for reliable local physical examinations and regulations on telehealth reimbursement, local APPs were necessary for this implementation. Although most of the CAHs have an on-site provider to provide ED coverage, CAHs with sufficient volume to necessitate separating ED and inpatient ward coverage may have difficulty supporting both APP and virtual hospitalist coverage, even on a fractional basis.
- This study was underpowered to detect rare events with significant consequences, including inpatient mortality and inpatient transfer. Although CMI suggests similar complexity in CAH patients, we have insufficient data to draw further comparisons on patient characteristics before and after the intervention.
- The analysis may be vulnerable to secular trends in the CAH patient population, as only 24 weeks of data were used as a baseline for comparison (although no significant seasonal variation was detected during that time). Extending the baseline data to include an additional 30 weeks ED encounters did not significantly alter our conclusions.
- Virtual hospitalists were dependent on physical examinations performed independently by local APPs.
- Although virtual providers were obligated to be available for videoconferencing within 60 minutes, more urgent medical decisions were sometimes made based on phone conferences between VBCH and the virtual hospitalist without video or direct patient assessment.
- We selected a CAH utilizing an identical instance of our EMR. Although this increased the ability of virtual hospitalists to split their time between virtual and local patient encounters, this limits our ability to spread this intervention beyond institutions already partnering with the UIHC.
CONCLUSIONS
We succeeded in reducing outside transfers at a CAH by implementing a sustainable virtual hospitalist service. This model allows patients to receive more of their care within their local communities and provides an improved inpatient experience. Next steps include expanding this service to other CAHs within our region, both to understand if this model is applicable beyond our initial site and to monitor for complications induced by scaling. If successful, virtual hospitalist coverage can provide a sustainable solution to providing the latest innovations in hospital medicine even to the most rural communities.
ACKNOWLEDGMENTS
The authors thank Ray Brownsworth, CEO of Van Buren County Hospital, as well as all the providers and staff who worked with them to implement and improve their services. The authors also thank Pat Brophy, founder of The Signal Center for Health Innovation, for providing leadership, support, and resources for innovation.
Disclosures
None of the authors have identified a conflict of interest in relation to this manuscript.
Funding
This project was funded through the University of Iowa Health Care and the Signal Center for Health Innovations at UI Health Ventures.
Compliance With Ethical Standards
This quality improvement project was exempt from Institutional Review Board review
1. Kripalani S, Jackson AT, Schnipper JL, Coleman EA. Promoting effective transitions of care at hospital discharge: a review of key issues for hospitalists. J Hosp Med. 2007;2(5):314-323. doi: 10.1002/jhm.228.
2. Potter AJ, Ward MM, Natafgi N, et al. Perceptions of the benefits of telemedicine in rural communities. Perspect Health Inform Manag. 2016;Summer:1-13.
3. Mohr NM, Harland KK, Shane DM, et al. Rural patients with severe sepsis or septic shock who bypass rural hospitals have increased mortality: an instrumental variables approach. Crit Care Med. 2017;45(1):85-93. doi: 10.1097/CCM.0000000000002026.
4. Joynt KE, Orav EJ, Jha AK. Mortality rates for medicare beneficiaries admitted to critical access and non-critical access hospitals, 2002-2010. JAMA. 2013;309(13):1379-1387. doi: 10.1001/jama.2013.2366.
5. Joynt KE, Harris Y, Orav EJ, Jha AK. Quality of care and patient outcomes in critical access rural hospitals. JAMA. 2011;306(1):45-52. doi: 10.1001/jama.2011.902.
6. Association AH. AHA Annual Survey Database. Washington, DC: American Hospital Association; 2005.
7. Wachter RM, Katz P, Showstack J, Bindman AB, Goldman L. Reorganizing an academic medical service: impact on cost, quality, patient satisfaction, and education. JAMA. 1998;279(19):1560-1565. doi: 10.1001/jama.279.19.1560.
8. Peterson MC. A systematic review of outcomes and quality measures in adult patients cared for by hospitalists vs nonhospitalists. Mayo Clin Proc. 2009;84(3):248-254. doi: 10.1016/S0025-6196(11)61142-7.
9. Auerbach AD, Wachter RM, Katz P, et al. Implementation of a voluntary hospitalist service at a community teaching hospital: improved clinical efficiency and patient outcomes. Ann Intern Med. 2002;137(11):859-865. doi: 10.7326/0003-4819-137-11-200212030-00006.
10. Moscovice I, Coburn A, Holmes M, et al. Flex Monitoring Team. http://www.flexmonitoring.org/. Accessed December 19, 2016.
11. In Critical Condition the Fragile State of Critical Access Hospitals; 2013. http://www.aha.org/research/policy/infographics/pdf/info-cah.pdf. Accessed March 23, 2017.
12. Wachter RM, Goldman L. Zero to 50,000—the 20th anniversary of the hospitalist. N Engl J Med. 2016;375(11):1009-1011. doi: 10.1056/NEJMp1607958.
13. Aj W, AE. Overview of Hospital Stays in the United States; 2012. http://www.hcup-us.ahrq.gov/reports/statbriefs/sb180-Hospitalizations-United-States-2012.pdf. Accessed February 7, 2017.
14. Tipping MD, Forth VE, O’Leary KJ, et al. Where did the day go?—A time‐motion study of hospitalists. J Hosp Med. 2010;5(6):323-328. doi: 10.1002/jhm.790.
15. Liu JJ, Bellamy GR, McCormick M. Patient bypass behavior and critical access hospitals: implications for patient retention. J Rural Health. 2007;23(1):17-24 doi: http://dx.doi.org/10.1111/j.1748-0361.2006.00063.x.
16. Keenan C. Iowa’s rural hospitals balance tight budgets with patient needs. The Gazette. July 10, 2017.
17. Escarce JJ, Kapur K. Do patients bypass rural hospitals? Determinants of inpatient hospital choice in rural California. J Health Care Poor Underserved. 2009;20(3):625-644. doi: 10.1353/hpu.0.0178.
18. Liu JJ, Bellamy G, Barnet B, Weng S. Bypass of local primary care in rural counties: effect of patient and community characteristics. Ann Fam Med. 2008;6(2):124-130. doi: 10.1370/afm.794.
19. Weigel PAM, Ullrich F, Ward MM. Rural bypass of critical access hospitals in Iowa: do visiting surgical specialists make a difference? J Rural Health. 2018;34 Supplement 1:s21-s29. doi: 10.1111/jrh.12220.
20. LaBarbera JM, Ellenby MS, Bouressa P, et al. The impact of telemedicine intensivist support and a pediatric hospitalist program on a community hospital. Telemed J E Health. 2013;19(10):760-766. doi: 10.1089/tmj.2012.0303.
21. AlDossary S, Martin-Khan MG, Bradford NK, Smith AC. A systematic review of the methodologies used to evaluate telemedicine service initiatives in hospital facilities. Int J Med Inform. 2017;97:171-194. doi: 10.1016/j.ijmedinf.2016.10.012.
22. Dougan BM, Montori VM, Carlson KW. Implementing a Hospitalist Program in a Critical Access Hospital. J Rural Health. 2018;34(1):109-115. doi: 10.1111/jrh.12190.
© 2018 Society of Hospital Medicine
Limitations of Using Pediatric Respiratory Illness Readmissions to Compare Hospital Performance
Respiratory illnesses are the leading causes of pediatric hospitalizations in the United States.1 The 30-day hospital readmission rate for respiratory illnesses is being considered for implementation as a national hospital performance measure, as it may be an indicator of lower quality care (eg, poor hospital management of disease, inadequate patient/caretaker education prior to discharge). In adult populations, readmissions can be used to reliably identify variation in hospital performance and successfully drive efforts to improve the value of care.2, 3 In contrast, there are persistent concerns about using pediatric readmissions to identify variation in hospital performance, largely due to lower patient volumes.4-7 To increase the value of pediatric hospital care, it is important to develop ways to meaningfully measure quality of care and further, to better understand the relationship between measures of quality and healthcare costs.
In December 2016, the National Quality Forum (NQF) endorsed a Pediatric Lower Respiratory Infection (LRI) Readmission Measure.8 This measure was developed by the Pediatric Quality Measurement Program, through the Agency for Healthcare Research and Quality. The goal of this program was to “increase the portfolio of evidence-based, consensus pediatric quality measures available to public and private purchasers of children’s healthcare services, providers, and consumers.”9
In anticipation of the national implementation of pediatric readmission measures, we examined whether the Pediatric LRI Readmission Measure could meaningfully identify high and low performers across all types of hospitals admitting children (general hospitals and children’s hospitals) using an all-payer claims database. A recent analysis by Nakamura et al. identified high and low performers using this measure10 but limited the analysis to hospitals with >50 pediatric LRI admissions per year, an approach that excludes many general hospitals. Since general hospitals provide the majority of care for children hospitalized with respiratory infections,11 we aimed to evaluate the measure in a broadly inclusive analysis that included all hospital types. Because low patient volumes might limit use of the measure,4,6 we tested several broadened variations of the measure. We also examined the relationship between hospital performance in pediatric LRI readmissions and healthcare costs.
Our analysis is intended to inform utilizers of pediatric quality metrics and policy makers about the feasibility of using these metrics to publicly report hospital performance and/or identify exceptional hospitals for understanding best practices in pediatric inpatient care.12
METHODS
Study Design and Data Source
We conducted an observational, retrospective cohort analysis using the 2012-2014 California Office of Statewide Health Planning and Development (OSHPD) nonpublic inpatient and emergency department databases.13 The OSHPD databases are compiled annually through mandatory reporting by all licensed nonfederal hospitals in California. The databases contain demographic (eg, age, gender) and utilization data (eg, charges) and can track readmissions to hospitals other than the index hospital. The databases capture administrative claims from approximately 450 hospitals, composed of 16 million inpatients, emergency department patients, and ambulatory surgery patients annually. Data quality is monitored through the California OSHPD.
Study Population
Our study included children aged ≤18 years with LRI, defined using the NQF Pediatric LRI Readmissions Measure: a primary diagnosis of bronchiolitis, influenza, or pneumonia, or a secondary diagnosis of bronchiolitis, influenza, or pneumonia, with a primary diagnosis of asthma, respiratory failure, sepsis, or bacteremia.8 International classification of Diseases, 9th edition (ICD-9) diagnostic codes used are in Appendix 1.
Per the NQF measure specifications,8 records were excluded if they were from hospitals with <80% of records complete with core elements (unique patient identifier, admission date, end-of-service date, and ICD-9 primary diagnosis code). In addition, records were excluded for the following reasons: (1) individual record missing core elements, (2) discharge disposition “death,” (3) 30-day follow-up data not available, (4) primary “newborn” or mental health diagnosis, or (5) primary ICD-9 procedure code for a planned procedure or chemotherapy.
Patient characteristics for hospital admissions with and without 30-day readmissions or 30-day emergency department (ED) revisits were summarized. For the continuous variable age, mean and standard deviation for each group were calculated. For categorical variables (sex, race, payer, and number of chronic conditions), numbers and proportions were determined. Univariate tests of comparison were carried out using the Student’s t test for age and chi-square tests for all categorical variables. Categories of payer with small values were combined for ease of description (categories combined into “other:” workers’ compensation, county indigent programs, other government, other indigent, self-pay, other payer). We identified chronic conditions using the Agency for Healthcare Research and Quality Chronic Condition Indicator (CCI) system, which classifies ICD-9-CM diagnosis codes as chronic or acute and places each code into 1 of 18 mutually exclusive categories (organ systems, disease categories, or other categories). The case-mix adjustment model incorporates a binary variable for each CCI category (0-1, 2, 3, or >4 chronic conditions) per the NQF measure specifications.8 This study was approved by the University of California, San Francisco Institutional Review Board.
Outcomes
Our primary outcome was the hospital-level rate of 30-day readmission after hospital discharge, consistent with the NQF measure.8 We identified outlier hospitals for 30-day readmission rate using the Centers for Medicare and Medicaid Services (CMS) methodology, which defines outlier hospitals as those for whom adjusted readmission rate confidence intervals do not overlap with the overall group mean rate.5, 14
We also determined the hospital-level average cost per index hospitalization (not including costs of readmissions). Since costs of care often differ substantially from charges,15 costs were calculated using cost-to-charge ratios for each hospital (annual total operating expenses/total gross patient revenue, as reported to the OSHPD).16 Costs were subdivided into categories representing $5,000 increments and a top category of >$40,000. Outlier hospitals for costs were defined as those for whom the cost random effect was either greater than the third quartile of the distribution of values by more than 1.5 times the interquartile range or less than the first quartile of the distribution of values by more than 1.5 times the interquartile range.17
ANALYSIS
Primary Analysis
For our primary analysis of 30-day hospital readmission rates, we used hierarchical logistic regression models with hospitals as random effects, adjusting for patient age, sex, and the presence and number of body systems affected by chronic conditions.8 These 4 patient characteristics were selected by the NQF measure developers “because distributions of these characteristics vary across hospitals, and although they are associated with readmission risk, they are independent of hospital quality of care.”10
Because the Centers for Medicare and Medicaid Services (CMS) are in the process of selecting pediatric quality measures for meaningful use reporting,18 we utilized CMS hospital readmissions methodology to calculate risk-adjusted rates and identify outlier hospitals. The CMS modeling strategy stabilizes performance estimates for low-volume hospitals and avoids penalizing these hospitals for high readmission rates that may be due to chance (random effects logistic model to obtain best linear unbiased predictions). This is particularly important in pediatrics, given the low pediatric volumes in many hospitals admitting children.4,19 We then identified outlier hospitals for the 30-day readmission rate using CMS methodology (hospital’s adjusted readmission rate confidence interval does not overlap the overall group mean rate).5, 4 CMS uses this approach for public reporting on HospitalCompare.20
Sensitivity Analyses
We tested several broadening variations of the NQF measure: (1) addition of children admitted with a primary diagnosis of asthma (without requiring LRI as a secondary diagnosis) or a secondary diagnosis of asthma exacerbation (LRIA), (2) inclusion of 30-day ED revisits as an outcome, and (3) merging of 3 years of data. These analyses were all performed using the same modeling strategy as in our primary analysis.
Secondary Outcome Analyses
Our analysis of hospital costs used costs for index admissions over 3 years (2012–2014) and included admissions for asthma. We used hierarchical regression models with hospitals as random effects, adjusting for age, gender, and the presence and number of chronic conditions. The distribution of cost values was highly skewed, so ordinal models were selected after several other modeling approaches failed (log transformation linear model, gamma model, Poisson model, zero-truncated Poisson model).
The relationship between hospital-level costs and hospital-level 30-day readmission or ED revisit rates was analyzed using Spearman’s rank correlation coefficient. Statistical analysis was performed using SAS version 9.4 software (SAS Institute; Cary, North Carolina).
RESULTS
Primary Analysis of 30-day Readmissions (per National Quality Forum Measure)
Our analysis of the 2014 OSHPD database using the specifications of the NQF Pediatric LRI Readmission Measure included a total of 5550 hospitalizations from 174 hospitals, with a mean of 12 eligible hospitalizations per hospital. The mean risk-adjusted readmission rate was 6.5% (362 readmissions). There were no hospitals that were considered outliers based on the risk-adjusted readmission rates (Table 1).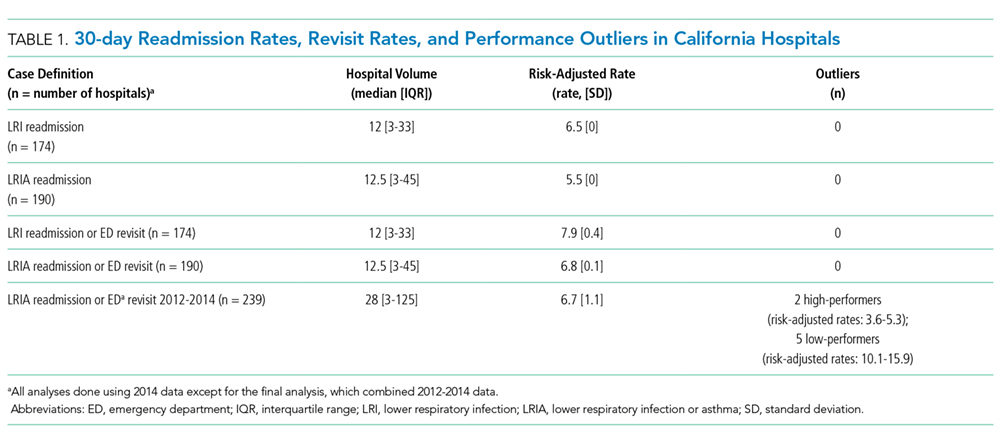
Sensitivity Analyses (Broadening Definitions of National Quality Forum Measure)
We report our testing of the broadened variations of the NQF measure in Table 1. Broadening the population to include children with asthma as a primary diagnosis and children with asthma exacerbations as a secondary diagnosis (LRIA) increased the size of our analysis to 8402 hospitalizations from 190 hospitals. The mean risk-adjusted readmission rate was 5.5%, and no outlier hospitals were identified.
Using the same inclusion criteria of the NQF measure but including 30-day ED revisits as an outcome, we analyzed a total of 5500 hospitalizations from 174 hospitals. The mean risk-adjusted event rate was higher at 7.9%, but there were still no outlier hospitals identified.
Using the broadened population definition (LRIA) and including 30-day ED revisits as an outcome, we analyzed a total of 8402 hospitalizations from 190 hospitals. The mean risk-adjusted event rate was 6.8%, but there were still no outlier hospitals identified.
In our final iteration, we merged 3 years of hospital data (2012-2014) using the broader population definition (LRIA) and including 30-day ED revisits as an outcome. This resulted in 27,873 admissions from 239 hospitals for this analysis, with a mean of 28 eligible hospitalizations per hospital. The mean risk-adjusted event rate was 6.7%, and this approach identified 2 high-performing (risk-adjusted rates: 3.6-5.3) and 7 low-performing hospitals (risk-adjusted rates: 10.1-15.9).
Table 2 presents the demographics of children included in this analysis. Children who had readmissions/revisits were younger, more likely to be white, less likely to have private insurance, and more likely to have a greater number of chronic conditions compared to children without readmissions/revisits.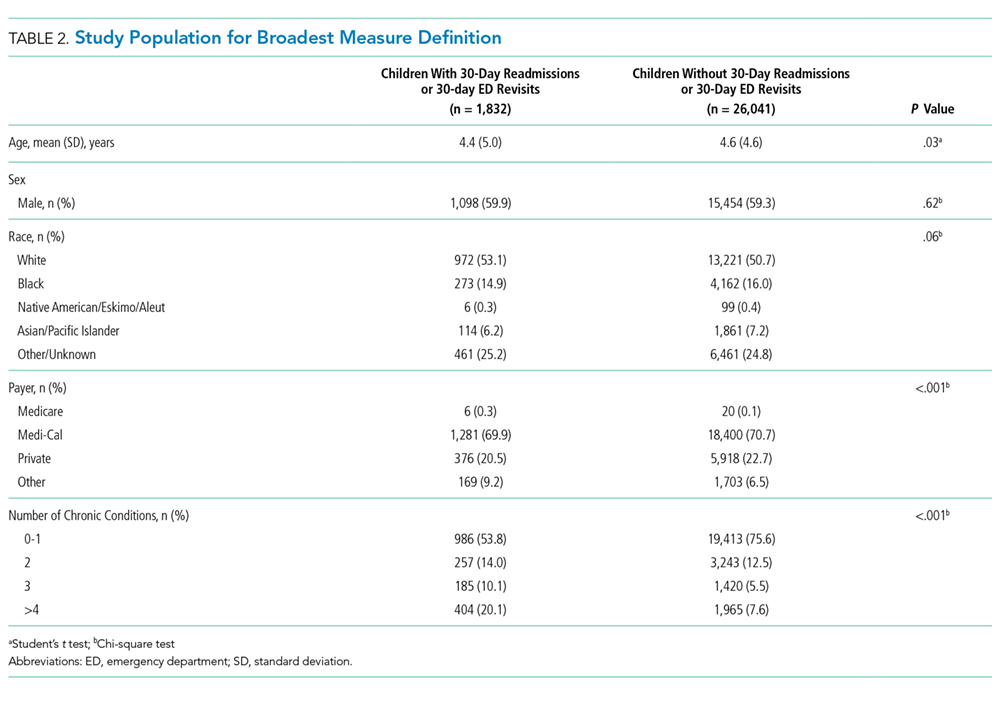
Secondary Outcome: Hospital Costs
In the analysis of hospital-level costs, we found only 1 outlier high-cost hospital. There was a 20% probability of a hospital respiratory admission costing ≥$40,000 at this hospital. We found no overall relationship between hospital 30-day respiratory readmission rate and hospital costs (Figure 1). However, the hospitals that were outliers for low readmission rates also had low probabilities of excessive hospital costs (3% probability of costs >$40,000; Figure 2).
DISCUSSION
We used a nationally endorsed pediatric quality measure to evaluate hospital performance, defined as 30-day readmission rates for children with respiratory illness. We examined all-payer data from California, which is the most populous state in the country and home to 1 in 8 American children. In this large California dataset, we were unable to identify meaningful variation in hospital performance due to low hospital volumes and event rates. However, when we broadened the measure definition, we were able to identify performance variation. Our findings underscore the importance of testing and potentially modifying existing quality measures in order to more accurately capture the quality of care delivered at hospitals with lower volumes of pediatric patients.21
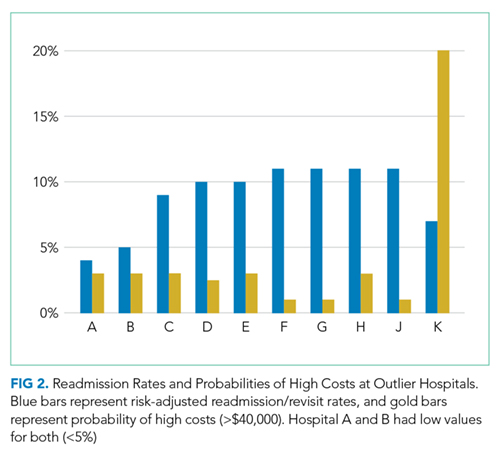
Our underlying assumption, in light of these prior studies, was that increasing the eligible sample in each hospital by combining respiratory diseases and by using an all-payer claims database rather than a Medicaid-only database would increase the number of detectable outlier hospitals. However, we found that these approaches did not ameliorate the limitations of small volumes. Only through aggregating data over 3 years was it possible to identify any outliers, and this approach identified only 3% of hospitals as outliers. Hence, our analysis reinforces concerns raised by several prior analyses4-7 regarding the limited ability of current pediatric readmission measures to detect meaningful, actionable differences in performance across all types of hospitals (including general/nonchildren’s hospitals). This issue is of particular concern for common pediatric conditions like respiratory illnesses, for which >70% of hospitalizations occur in general hospitals.11
Developers and utilizers of pediatric quality metrics should consider strategies for identifying meaningful, actionable variation in pediatric quality of care at general hospitals. These strategies might include our approach of combining several years of hospital data in order to reach adequate volumes for measuring performance. The potential downside to this approach is performance lag—specifically, hospitals implementing quality improvement readmissions programs may not see changes in their performance for a year or two on a measure aggregating 3 years of data. Alternatively, it is possible that the measure might be used more appropriately across a larger group of hospitals, either to assess performance for multihospital accountable care organization (ACO), or to assess performance for a service area or county. An aggregated group of hospitals would increase the eligible patient volume and, if there is an ACO relationship established, coordinated interventions could be implemented across the hospitals.
We examined the 30-day readmission rate because it is the current standard used by CMS and all NQF-endorsed readmission measures.22,23 Another potential approach is to analyze the 7- or 15-day readmission rate. However, these rates may be similarly limited in identifying hospital performance due to low volumes and event rates. An analysis by Wallace et al. of preventable readmissions to a tertiary children’s hospital found that, while many occurred within 7 days or 15 days, 27% occurred after 7 days and 22%, after 15.24 However, an analysis of several adult 30-day readmission measures used by CMS found that the contribution of hospital-level quality to the readmission rate (measured by intracluster correlation coefficient) reached a nadir at 7 days, which suggests that most readmissions after the seventh day postdischarge were explained by community- and household-level factors beyond hospitals’ control.22 Hence, though 7- or 15-day readmission rates may better represent preventable outcomes under the hospital’s control, the lower event rates and low hospital volumes likely similarly limit the feasibility of their use for performance measurement.
Pediatric quality measures are additionally intended to drive improvements in the value of pediatric care, defined as quality relative to costs.25 In order to better understand the relationship of hospital performance across both the domains of readmissions (quality) and costs, we examined hospital-level costs for care of pediatric respiratory illnesses. We found no overall relationship between hospital readmission rates and costs; however, we found 2 hospitals in California that had significantly lower readmission rates as well as low costs. Close examination of hospitals such as these, which demonstrate exceptional performance in quality and costs, may promote the discovery and dissemination of strategies to improve the value of pediatric care.12
Our study had several limitations. First, the OSHPD database lacked detailed clinical variables to correct for additional case-mix differences between hospitals. However, we used the approach of case-mix adjustment outlined by an NQF-endorsed national quality metric.8 Secondly, since our data were limited to a single state, analyses of other databases may have yielded different results. However, prior analyses using other multistate databases reported similar limitations,5,6 likely due to the limitations of patient volume that are generalizable to settings outside of California. In addition, our cost analysis was performed using cost-to-charge ratios that represent total annual expenses/revenue for the whole hospital.16 These ratios may not be reflective of the specific services provided for children in our analysis; however, service-specific costs were not available, and cost-to-charge ratios are commonly used to report costs.
CONCLUSION
The ability of a nationally-endorsed pediatric respiratory readmissions measure to meaningfully identify variation in hospital performance is limited. General hospitals, which provide the majority of pediatric care for common conditions such as LRI, likely cannot be accurately evaluated using national pediatric quality metrics as they are currently designed. Modifying measures in order to increase hospital-level pediatric patient volumes may facilitate more meaningful evaluation of the quality of pediatric care in general hospitals and identification of exceptional hospitals for understanding best practices in pediatric inpatient care.
Disclosures
Regina Lam consulted for Proximity Health doing market research during the course of developing this manuscript, but this work did not involve any content related to quality metrics, and this entity did not play any role in the development of this manuscript. The remaining authors have no conflicts of interest relevant to this article to disclose.
Funding
Supported by the Agency for Healthcare Research and Quality (K08 HS24592 to SVK and U18HS25297 to MDC and NSB) and the National Institute of Child Health and Human Development (K23HD065836 to NSB). The funding agency played no role in the study design; the collection, analysis, and interpretation of data; the writing of the report; or the decision to submit the manuscript for publication.
1. Agency for Healthcare Research and Quality. Overview of hospital stays for children in the United States. https://www.hcup-us.ahrq.gov/reports/statbriefs/sb187-Hospital-Stays-Children-2012.jsp. Accessed September 1, 2017; 2012. PubMed
2. Mendelson A, Kondo K, Damberg C, et al. The effects of pay-for-performance programs on health, health care use, and processes of care: A systematic review. Ann Intern Med. 2017;166(5):341-353. doi: 10.7326/M16-1881. PubMed
3. Zuckerman RB, Sheingold SH, Orav EJ, Ruhter J, Epstein AM. Readmissions, observation, and the hospital readmissions reduction program. N Engl J Med. 2016;374(16):1543-1551. doi: 10.1056/NEJMsa1513024. PubMed
4. Bardach NS, Chien AT, Dudley RA. Small numbers limit the use of the inpatient pediatric quality indicators for hospital comparison. Acad Pediatr. 2010;10(4):266-273. doi: 10.1016/j.acap.2010.04.025. PubMed
5. Bardach NS, Vittinghoff E, Asteria-Peñaloza R, et al. Measuring hospital quality using pediatric readmission and revisit rates. Pediatrics. 2013;132(3):429-436. doi: 10.1542/peds.2012-3527. PubMed
6. Berry JG, Zaslavsky AM, Toomey SL, et al. Recognizing differences in hospital quality performance for pediatric inpatient care. Pediatrics. 2015;136(2):251-262. doi: 10.1542/peds.2014-3131. PubMed
7. Hain PD, Gay JC, Berutti TW, Whitney GM, Wang W, Saville BR. Preventability of early readmissions at a children’s hospital. Pediatrics. 2013;131(1):e171-e181. doi: 10.1542/peds.2012-0820. PubMed
8. Agency for Healthcare Research and Quality. Pediatric lower respiratory infection readmission measure. https://www.ahrq.gov/sites/default/files/wysiwyg/policymakers/chipra/factsheets/chipra_1415-p008-2-ef.pdf. Accessed September 3, 2017.
9. Agency for Healthcare Research and Quality. CHIPRA Pediatric Quality Measures Program. https://archive.ahrq.gov/policymakers/chipra/pqmpback.html. Accessed October 10, 2017.
10. Nakamura MM, Zaslavsky AM, Toomey SL, et al. Pediatric readmissions After hospitalizations for lower respiratory infections. Pediatrics. 2017;140(2). doi: 10.1542/peds.2016-0938. PubMed
11. Leyenaar JK, Ralston SL, Shieh MS, Pekow PS, Mangione-Smith R, Lindenauer PK. Epidemiology of pediatric hospitalizations at general hospitals and freestanding children’s hospitals in the United States. J Hosp Med. 2016;11(11):743-749. doi: 10.1002/jhm.2624. PubMed
12. Bradley EH, Curry LA, Ramanadhan S, Rowe L, Nembhard IM, Krumholz HM. Research in action: using positive deviance to improve quality of health care. Implement Sci. 2009;4:25. doi: 10.1186/1748-5908-4-25. PubMed
13. California Office of Statewide Health Planning and Development. Data and reports. https://www.oshpd.ca.gov/HID/. Accessed September 3, 2017.
14. QualityNet. Measure methodology reports. https://www.qualitynet.org/dcs/ContentServer?c=Page&pagename=QnetPublic%2FPage%2FQnetTier4&cid=1219069855841. Accessed October 10, 2017.
15. Riley GF. Administrative and claims records as sources of health care cost data. Med Care. 2009;47(7 Suppl 1):S51-S55. doi: 10.1097/MLR.0b013e31819c95aa. PubMed
16. California Office of Statewide Health Planning and Development. Annual financial data. https://www.oshpd.ca.gov/HID/Hospital-Financial.asp. Accessed September 3, 2017.
17. Tukey J. Exploratory Data Analysis: Pearson; London, United Kingdom. 1977.
18. Centers for Medicare and Medicaid Services. Core measures. https://www.cms.gov/Medicare/Quality-Initiatives-Patient-Assessment-Instruments/QualityMeasures/Core-Measures.html. Accessed September 1, 2017.
19. Berry JG, Toomey SL, Zaslavsky AM, et al. Pediatric readmission prevalence and variability across hospitals. JAMA. 2013;309(4):372-380. doi: 10.1001/jama.2012.188351. PubMed
20. Centers for Medicare and Medicaid Services. HospitalCompare. https://www.medicare.gov/hospitalcompare/search.html. Accessed on October 10, 2017.
21. Mangione-Smith R. The challenges of addressing pediatric quality measurement gaps. Pediatrics. 2017;139(4). doi: 10.1542/peds.2017-0174. PubMed
22. Chin DL, Bang H, Manickam RN, Romano PS. Rethinking thirty-day hospital readmissions: shorter intervals might be better indicators of quality of care. Health Aff (Millwood). 2016;35(10):1867-1875. doi: 10.1377/hlthaff.2016.0205. PubMed
23. National Quality Forum. Measures, reports, and tools. http://www.qualityforum.org/Measures_Reports_Tools.aspx. Accessed March 1, 2018.
24. Wallace SS, Keller SL, Falco CN, et al. An examination of physician-, caregiver-, and disease-related factors associated With readmission From a pediatric hospital medicine service. Hosp Pediatr. 2015;5(11):566-573. doi: 10.1542/hpeds.2015-0015. PubMed
25. Porter ME. What is value in health care? N Engl J Med. 2010;363(26):2477-2481. doi: 10.1056/NEJMp1011024. PubMed
Respiratory illnesses are the leading causes of pediatric hospitalizations in the United States.1 The 30-day hospital readmission rate for respiratory illnesses is being considered for implementation as a national hospital performance measure, as it may be an indicator of lower quality care (eg, poor hospital management of disease, inadequate patient/caretaker education prior to discharge). In adult populations, readmissions can be used to reliably identify variation in hospital performance and successfully drive efforts to improve the value of care.2, 3 In contrast, there are persistent concerns about using pediatric readmissions to identify variation in hospital performance, largely due to lower patient volumes.4-7 To increase the value of pediatric hospital care, it is important to develop ways to meaningfully measure quality of care and further, to better understand the relationship between measures of quality and healthcare costs.
In December 2016, the National Quality Forum (NQF) endorsed a Pediatric Lower Respiratory Infection (LRI) Readmission Measure.8 This measure was developed by the Pediatric Quality Measurement Program, through the Agency for Healthcare Research and Quality. The goal of this program was to “increase the portfolio of evidence-based, consensus pediatric quality measures available to public and private purchasers of children’s healthcare services, providers, and consumers.”9
In anticipation of the national implementation of pediatric readmission measures, we examined whether the Pediatric LRI Readmission Measure could meaningfully identify high and low performers across all types of hospitals admitting children (general hospitals and children’s hospitals) using an all-payer claims database. A recent analysis by Nakamura et al. identified high and low performers using this measure10 but limited the analysis to hospitals with >50 pediatric LRI admissions per year, an approach that excludes many general hospitals. Since general hospitals provide the majority of care for children hospitalized with respiratory infections,11 we aimed to evaluate the measure in a broadly inclusive analysis that included all hospital types. Because low patient volumes might limit use of the measure,4,6 we tested several broadened variations of the measure. We also examined the relationship between hospital performance in pediatric LRI readmissions and healthcare costs.
Our analysis is intended to inform utilizers of pediatric quality metrics and policy makers about the feasibility of using these metrics to publicly report hospital performance and/or identify exceptional hospitals for understanding best practices in pediatric inpatient care.12
METHODS
Study Design and Data Source
We conducted an observational, retrospective cohort analysis using the 2012-2014 California Office of Statewide Health Planning and Development (OSHPD) nonpublic inpatient and emergency department databases.13 The OSHPD databases are compiled annually through mandatory reporting by all licensed nonfederal hospitals in California. The databases contain demographic (eg, age, gender) and utilization data (eg, charges) and can track readmissions to hospitals other than the index hospital. The databases capture administrative claims from approximately 450 hospitals, composed of 16 million inpatients, emergency department patients, and ambulatory surgery patients annually. Data quality is monitored through the California OSHPD.
Study Population
Our study included children aged ≤18 years with LRI, defined using the NQF Pediatric LRI Readmissions Measure: a primary diagnosis of bronchiolitis, influenza, or pneumonia, or a secondary diagnosis of bronchiolitis, influenza, or pneumonia, with a primary diagnosis of asthma, respiratory failure, sepsis, or bacteremia.8 International classification of Diseases, 9th edition (ICD-9) diagnostic codes used are in Appendix 1.
Per the NQF measure specifications,8 records were excluded if they were from hospitals with <80% of records complete with core elements (unique patient identifier, admission date, end-of-service date, and ICD-9 primary diagnosis code). In addition, records were excluded for the following reasons: (1) individual record missing core elements, (2) discharge disposition “death,” (3) 30-day follow-up data not available, (4) primary “newborn” or mental health diagnosis, or (5) primary ICD-9 procedure code for a planned procedure or chemotherapy.
Patient characteristics for hospital admissions with and without 30-day readmissions or 30-day emergency department (ED) revisits were summarized. For the continuous variable age, mean and standard deviation for each group were calculated. For categorical variables (sex, race, payer, and number of chronic conditions), numbers and proportions were determined. Univariate tests of comparison were carried out using the Student’s t test for age and chi-square tests for all categorical variables. Categories of payer with small values were combined for ease of description (categories combined into “other:” workers’ compensation, county indigent programs, other government, other indigent, self-pay, other payer). We identified chronic conditions using the Agency for Healthcare Research and Quality Chronic Condition Indicator (CCI) system, which classifies ICD-9-CM diagnosis codes as chronic or acute and places each code into 1 of 18 mutually exclusive categories (organ systems, disease categories, or other categories). The case-mix adjustment model incorporates a binary variable for each CCI category (0-1, 2, 3, or >4 chronic conditions) per the NQF measure specifications.8 This study was approved by the University of California, San Francisco Institutional Review Board.
Outcomes
Our primary outcome was the hospital-level rate of 30-day readmission after hospital discharge, consistent with the NQF measure.8 We identified outlier hospitals for 30-day readmission rate using the Centers for Medicare and Medicaid Services (CMS) methodology, which defines outlier hospitals as those for whom adjusted readmission rate confidence intervals do not overlap with the overall group mean rate.5, 14
We also determined the hospital-level average cost per index hospitalization (not including costs of readmissions). Since costs of care often differ substantially from charges,15 costs were calculated using cost-to-charge ratios for each hospital (annual total operating expenses/total gross patient revenue, as reported to the OSHPD).16 Costs were subdivided into categories representing $5,000 increments and a top category of >$40,000. Outlier hospitals for costs were defined as those for whom the cost random effect was either greater than the third quartile of the distribution of values by more than 1.5 times the interquartile range or less than the first quartile of the distribution of values by more than 1.5 times the interquartile range.17
ANALYSIS
Primary Analysis
For our primary analysis of 30-day hospital readmission rates, we used hierarchical logistic regression models with hospitals as random effects, adjusting for patient age, sex, and the presence and number of body systems affected by chronic conditions.8 These 4 patient characteristics were selected by the NQF measure developers “because distributions of these characteristics vary across hospitals, and although they are associated with readmission risk, they are independent of hospital quality of care.”10
Because the Centers for Medicare and Medicaid Services (CMS) are in the process of selecting pediatric quality measures for meaningful use reporting,18 we utilized CMS hospital readmissions methodology to calculate risk-adjusted rates and identify outlier hospitals. The CMS modeling strategy stabilizes performance estimates for low-volume hospitals and avoids penalizing these hospitals for high readmission rates that may be due to chance (random effects logistic model to obtain best linear unbiased predictions). This is particularly important in pediatrics, given the low pediatric volumes in many hospitals admitting children.4,19 We then identified outlier hospitals for the 30-day readmission rate using CMS methodology (hospital’s adjusted readmission rate confidence interval does not overlap the overall group mean rate).5, 4 CMS uses this approach for public reporting on HospitalCompare.20
Sensitivity Analyses
We tested several broadening variations of the NQF measure: (1) addition of children admitted with a primary diagnosis of asthma (without requiring LRI as a secondary diagnosis) or a secondary diagnosis of asthma exacerbation (LRIA), (2) inclusion of 30-day ED revisits as an outcome, and (3) merging of 3 years of data. These analyses were all performed using the same modeling strategy as in our primary analysis.
Secondary Outcome Analyses
Our analysis of hospital costs used costs for index admissions over 3 years (2012–2014) and included admissions for asthma. We used hierarchical regression models with hospitals as random effects, adjusting for age, gender, and the presence and number of chronic conditions. The distribution of cost values was highly skewed, so ordinal models were selected after several other modeling approaches failed (log transformation linear model, gamma model, Poisson model, zero-truncated Poisson model).
The relationship between hospital-level costs and hospital-level 30-day readmission or ED revisit rates was analyzed using Spearman’s rank correlation coefficient. Statistical analysis was performed using SAS version 9.4 software (SAS Institute; Cary, North Carolina).
RESULTS
Primary Analysis of 30-day Readmissions (per National Quality Forum Measure)
Our analysis of the 2014 OSHPD database using the specifications of the NQF Pediatric LRI Readmission Measure included a total of 5550 hospitalizations from 174 hospitals, with a mean of 12 eligible hospitalizations per hospital. The mean risk-adjusted readmission rate was 6.5% (362 readmissions). There were no hospitals that were considered outliers based on the risk-adjusted readmission rates (Table 1).
Sensitivity Analyses (Broadening Definitions of National Quality Forum Measure)
We report our testing of the broadened variations of the NQF measure in Table 1. Broadening the population to include children with asthma as a primary diagnosis and children with asthma exacerbations as a secondary diagnosis (LRIA) increased the size of our analysis to 8402 hospitalizations from 190 hospitals. The mean risk-adjusted readmission rate was 5.5%, and no outlier hospitals were identified.
Using the same inclusion criteria of the NQF measure but including 30-day ED revisits as an outcome, we analyzed a total of 5500 hospitalizations from 174 hospitals. The mean risk-adjusted event rate was higher at 7.9%, but there were still no outlier hospitals identified.
Using the broadened population definition (LRIA) and including 30-day ED revisits as an outcome, we analyzed a total of 8402 hospitalizations from 190 hospitals. The mean risk-adjusted event rate was 6.8%, but there were still no outlier hospitals identified.
In our final iteration, we merged 3 years of hospital data (2012-2014) using the broader population definition (LRIA) and including 30-day ED revisits as an outcome. This resulted in 27,873 admissions from 239 hospitals for this analysis, with a mean of 28 eligible hospitalizations per hospital. The mean risk-adjusted event rate was 6.7%, and this approach identified 2 high-performing (risk-adjusted rates: 3.6-5.3) and 7 low-performing hospitals (risk-adjusted rates: 10.1-15.9).
Table 2 presents the demographics of children included in this analysis. Children who had readmissions/revisits were younger, more likely to be white, less likely to have private insurance, and more likely to have a greater number of chronic conditions compared to children without readmissions/revisits.
Secondary Outcome: Hospital Costs
In the analysis of hospital-level costs, we found only 1 outlier high-cost hospital. There was a 20% probability of a hospital respiratory admission costing ≥$40,000 at this hospital. We found no overall relationship between hospital 30-day respiratory readmission rate and hospital costs (Figure 1). However, the hospitals that were outliers for low readmission rates also had low probabilities of excessive hospital costs (3% probability of costs >$40,000; Figure 2).
DISCUSSION
We used a nationally endorsed pediatric quality measure to evaluate hospital performance, defined as 30-day readmission rates for children with respiratory illness. We examined all-payer data from California, which is the most populous state in the country and home to 1 in 8 American children. In this large California dataset, we were unable to identify meaningful variation in hospital performance due to low hospital volumes and event rates. However, when we broadened the measure definition, we were able to identify performance variation. Our findings underscore the importance of testing and potentially modifying existing quality measures in order to more accurately capture the quality of care delivered at hospitals with lower volumes of pediatric patients.21
Our underlying assumption, in light of these prior studies, was that increasing the eligible sample in each hospital by combining respiratory diseases and by using an all-payer claims database rather than a Medicaid-only database would increase the number of detectable outlier hospitals. However, we found that these approaches did not ameliorate the limitations of small volumes. Only through aggregating data over 3 years was it possible to identify any outliers, and this approach identified only 3% of hospitals as outliers. Hence, our analysis reinforces concerns raised by several prior analyses4-7 regarding the limited ability of current pediatric readmission measures to detect meaningful, actionable differences in performance across all types of hospitals (including general/nonchildren’s hospitals). This issue is of particular concern for common pediatric conditions like respiratory illnesses, for which >70% of hospitalizations occur in general hospitals.11
Developers and utilizers of pediatric quality metrics should consider strategies for identifying meaningful, actionable variation in pediatric quality of care at general hospitals. These strategies might include our approach of combining several years of hospital data in order to reach adequate volumes for measuring performance. The potential downside to this approach is performance lag—specifically, hospitals implementing quality improvement readmissions programs may not see changes in their performance for a year or two on a measure aggregating 3 years of data. Alternatively, it is possible that the measure might be used more appropriately across a larger group of hospitals, either to assess performance for multihospital accountable care organization (ACO), or to assess performance for a service area or county. An aggregated group of hospitals would increase the eligible patient volume and, if there is an ACO relationship established, coordinated interventions could be implemented across the hospitals.
We examined the 30-day readmission rate because it is the current standard used by CMS and all NQF-endorsed readmission measures.22,23 Another potential approach is to analyze the 7- or 15-day readmission rate. However, these rates may be similarly limited in identifying hospital performance due to low volumes and event rates. An analysis by Wallace et al. of preventable readmissions to a tertiary children’s hospital found that, while many occurred within 7 days or 15 days, 27% occurred after 7 days and 22%, after 15.24 However, an analysis of several adult 30-day readmission measures used by CMS found that the contribution of hospital-level quality to the readmission rate (measured by intracluster correlation coefficient) reached a nadir at 7 days, which suggests that most readmissions after the seventh day postdischarge were explained by community- and household-level factors beyond hospitals’ control.22 Hence, though 7- or 15-day readmission rates may better represent preventable outcomes under the hospital’s control, the lower event rates and low hospital volumes likely similarly limit the feasibility of their use for performance measurement.
Pediatric quality measures are additionally intended to drive improvements in the value of pediatric care, defined as quality relative to costs.25 In order to better understand the relationship of hospital performance across both the domains of readmissions (quality) and costs, we examined hospital-level costs for care of pediatric respiratory illnesses. We found no overall relationship between hospital readmission rates and costs; however, we found 2 hospitals in California that had significantly lower readmission rates as well as low costs. Close examination of hospitals such as these, which demonstrate exceptional performance in quality and costs, may promote the discovery and dissemination of strategies to improve the value of pediatric care.12
Our study had several limitations. First, the OSHPD database lacked detailed clinical variables to correct for additional case-mix differences between hospitals. However, we used the approach of case-mix adjustment outlined by an NQF-endorsed national quality metric.8 Secondly, since our data were limited to a single state, analyses of other databases may have yielded different results. However, prior analyses using other multistate databases reported similar limitations,5,6 likely due to the limitations of patient volume that are generalizable to settings outside of California. In addition, our cost analysis was performed using cost-to-charge ratios that represent total annual expenses/revenue for the whole hospital.16 These ratios may not be reflective of the specific services provided for children in our analysis; however, service-specific costs were not available, and cost-to-charge ratios are commonly used to report costs.
CONCLUSION
The ability of a nationally-endorsed pediatric respiratory readmissions measure to meaningfully identify variation in hospital performance is limited. General hospitals, which provide the majority of pediatric care for common conditions such as LRI, likely cannot be accurately evaluated using national pediatric quality metrics as they are currently designed. Modifying measures in order to increase hospital-level pediatric patient volumes may facilitate more meaningful evaluation of the quality of pediatric care in general hospitals and identification of exceptional hospitals for understanding best practices in pediatric inpatient care.
Disclosures
Regina Lam consulted for Proximity Health doing market research during the course of developing this manuscript, but this work did not involve any content related to quality metrics, and this entity did not play any role in the development of this manuscript. The remaining authors have no conflicts of interest relevant to this article to disclose.
Funding
Supported by the Agency for Healthcare Research and Quality (K08 HS24592 to SVK and U18HS25297 to MDC and NSB) and the National Institute of Child Health and Human Development (K23HD065836 to NSB). The funding agency played no role in the study design; the collection, analysis, and interpretation of data; the writing of the report; or the decision to submit the manuscript for publication.
1. Agency for Healthcare Research and Quality. Overview of hospital stays for children in the United States. https://www.hcup-us.ahrq.gov/reports/statbriefs/sb187-Hospital-Stays-Children-2012.jsp. Accessed September 1, 2017; 2012. PubMed
2. Mendelson A, Kondo K, Damberg C, et al. The effects of pay-for-performance programs on health, health care use, and processes of care: A systematic review. Ann Intern Med. 2017;166(5):341-353. doi: 10.7326/M16-1881. PubMed
3. Zuckerman RB, Sheingold SH, Orav EJ, Ruhter J, Epstein AM. Readmissions, observation, and the hospital readmissions reduction program. N Engl J Med. 2016;374(16):1543-1551. doi: 10.1056/NEJMsa1513024. PubMed
4. Bardach NS, Chien AT, Dudley RA. Small numbers limit the use of the inpatient pediatric quality indicators for hospital comparison. Acad Pediatr. 2010;10(4):266-273. doi: 10.1016/j.acap.2010.04.025. PubMed
5. Bardach NS, Vittinghoff E, Asteria-Peñaloza R, et al. Measuring hospital quality using pediatric readmission and revisit rates. Pediatrics. 2013;132(3):429-436. doi: 10.1542/peds.2012-3527. PubMed
6. Berry JG, Zaslavsky AM, Toomey SL, et al. Recognizing differences in hospital quality performance for pediatric inpatient care. Pediatrics. 2015;136(2):251-262. doi: 10.1542/peds.2014-3131. PubMed
7. Hain PD, Gay JC, Berutti TW, Whitney GM, Wang W, Saville BR. Preventability of early readmissions at a children’s hospital. Pediatrics. 2013;131(1):e171-e181. doi: 10.1542/peds.2012-0820. PubMed
8. Agency for Healthcare Research and Quality. Pediatric lower respiratory infection readmission measure. https://www.ahrq.gov/sites/default/files/wysiwyg/policymakers/chipra/factsheets/chipra_1415-p008-2-ef.pdf. Accessed September 3, 2017.
9. Agency for Healthcare Research and Quality. CHIPRA Pediatric Quality Measures Program. https://archive.ahrq.gov/policymakers/chipra/pqmpback.html. Accessed October 10, 2017.
10. Nakamura MM, Zaslavsky AM, Toomey SL, et al. Pediatric readmissions After hospitalizations for lower respiratory infections. Pediatrics. 2017;140(2). doi: 10.1542/peds.2016-0938. PubMed
11. Leyenaar JK, Ralston SL, Shieh MS, Pekow PS, Mangione-Smith R, Lindenauer PK. Epidemiology of pediatric hospitalizations at general hospitals and freestanding children’s hospitals in the United States. J Hosp Med. 2016;11(11):743-749. doi: 10.1002/jhm.2624. PubMed
12. Bradley EH, Curry LA, Ramanadhan S, Rowe L, Nembhard IM, Krumholz HM. Research in action: using positive deviance to improve quality of health care. Implement Sci. 2009;4:25. doi: 10.1186/1748-5908-4-25. PubMed
13. California Office of Statewide Health Planning and Development. Data and reports. https://www.oshpd.ca.gov/HID/. Accessed September 3, 2017.
14. QualityNet. Measure methodology reports. https://www.qualitynet.org/dcs/ContentServer?c=Page&pagename=QnetPublic%2FPage%2FQnetTier4&cid=1219069855841. Accessed October 10, 2017.
15. Riley GF. Administrative and claims records as sources of health care cost data. Med Care. 2009;47(7 Suppl 1):S51-S55. doi: 10.1097/MLR.0b013e31819c95aa. PubMed
16. California Office of Statewide Health Planning and Development. Annual financial data. https://www.oshpd.ca.gov/HID/Hospital-Financial.asp. Accessed September 3, 2017.
17. Tukey J. Exploratory Data Analysis: Pearson; London, United Kingdom. 1977.
18. Centers for Medicare and Medicaid Services. Core measures. https://www.cms.gov/Medicare/Quality-Initiatives-Patient-Assessment-Instruments/QualityMeasures/Core-Measures.html. Accessed September 1, 2017.
19. Berry JG, Toomey SL, Zaslavsky AM, et al. Pediatric readmission prevalence and variability across hospitals. JAMA. 2013;309(4):372-380. doi: 10.1001/jama.2012.188351. PubMed
20. Centers for Medicare and Medicaid Services. HospitalCompare. https://www.medicare.gov/hospitalcompare/search.html. Accessed on October 10, 2017.
21. Mangione-Smith R. The challenges of addressing pediatric quality measurement gaps. Pediatrics. 2017;139(4). doi: 10.1542/peds.2017-0174. PubMed
22. Chin DL, Bang H, Manickam RN, Romano PS. Rethinking thirty-day hospital readmissions: shorter intervals might be better indicators of quality of care. Health Aff (Millwood). 2016;35(10):1867-1875. doi: 10.1377/hlthaff.2016.0205. PubMed
23. National Quality Forum. Measures, reports, and tools. http://www.qualityforum.org/Measures_Reports_Tools.aspx. Accessed March 1, 2018.
24. Wallace SS, Keller SL, Falco CN, et al. An examination of physician-, caregiver-, and disease-related factors associated With readmission From a pediatric hospital medicine service. Hosp Pediatr. 2015;5(11):566-573. doi: 10.1542/hpeds.2015-0015. PubMed
25. Porter ME. What is value in health care? N Engl J Med. 2010;363(26):2477-2481. doi: 10.1056/NEJMp1011024. PubMed
© 2018 Society of Hospital Medicine