User login
The Adoption of an Online Journal Club to Improve Research Dissemination and Social Media Engagement Among Hospitalists
Clinicians, educators, and medical journals are increasingly using the social media outlet, Twitter, as a medium to connect and engage with their colleagues. In particular, online journal clubs have created a space for the timely discussion of research, creation of online communities, and dissemination of research.
Social media-based journal clubs are thought to be one way in which journals can leverage the power of social networks so that researchers can engage with a diverse range of end users4 (including bedside clinicians, administrators, and patients). Several examples of these models exist. For example, #GeriMedJC acts as a complimentary, synchronous chat that takes place at the same time as a live, in-person journal club. #NephJC offers multiple 1-hour chats per month and provides an in-depth summary and analysis of each article, while #UroJC is an asynchronous discussion that takes place over 48 hours. Few data exist to describe whether any of these programs produce measurable improvements in indicators of engagement or dissemination of results.
In 2015, the Journal of Hospital Medicine (JHM) began producing a Twitter-based journal club as a means to connect and engage the Hospital Medicine community and allow for discussion and rapid exchange of information and opinions around a specific clinical topic. This study aims to describe the implementation of the first Journal-sponsored, Twitter-based online journal club and ascertain its impact on both Twitter and journal metrics.
METHODS
#JHMChat was launched in October 2015, and was initially held every 2-3 months until January 2017, when chats began to take place monthly. Each 1-hour chat focused on a recently published article in JHM, was moderated by a JHM social media editor (C.M.W., V.M.A.), and included at least 1 study author or guest expert. Articles were chosen by the social media editors based on the following criteria: (1) attractiveness to possible participants, (2) providing topic variety within the journal club series, and (3) sustainability and topic conduciveness to the online chat model. Chats were held at 9 PM EST in order to engage hospitalists across all US time zones and on different days to accommodate authors’ availability. All sessions were framed by 3-4 questions intended to encourage discussion and presented to chat participants at spaced intervals so as to stimulate a current of responses.
Chats were promoted by way of the JHM (@JHospMedicine, 3400 followers) and Society of Hospital Medicine (SHM; @SHMLive, 5800 followers) Twitter feeds beginning 1 month prior to each session. Visual Abstracts5,6 were used to publicize the sessions, also via Twitter, starting in February 2017.
Continuing Medical Education (CME) credits were offered through the SHM to registered participants, starting in July 2016.7 All sessions were cosponsored by the American Board of Internal Medicine (ABIM) Foundation and the Costs of Care Organization, a non-profit organization aimed at improving healthcare value.
Twitter Metrics
After each session, the following Twitter-based engagement metrics were obtained using the Symplur© Healthcare Hashtag project;8 total number of participants and tweets, tweets/participant, and total impressions (calculated as the number of tweets from each participant multiplied by the number of followers that participant currently had then summed up for all participants). Simply put, impressions can also be thought of as the number of times a single Tweet makes it into someone else’s Twitter feed. So as to avoid artificially inflated metrics, all were obtained 2 hours after the end of the journal club. Participants were defined as anyone who posted an original tweet or retweeted during the session and were encouraged to tag their tweets with the hashtag #JHMChat for post-discussion indexing and measurement. Because authors’ or guests’ popularity on Twitter may influence participation rates, we also assessed the number of followers for each participating author. Spearman’s rank correlation was calculated (Microsoft ExcelTM) where appropriate.
Altmetrics and Page Views
As a means to measure exposure and dissemination external to Twitter, we assessed the change (“Delta”) in the each article’s Altmetric score9, a digital-based metric that quantifies the attention received by a scientific publication on various online platforms including news, blogs, and social media. Delta Altmetric scores were calculated as the difference between the scores on the day of the session and 2 weeks after the respective session, with higher scores indicating greater global online discussion. By measuring the Altmetric score on the day of the discussion, we established a baseline score for comparison purposes. Additionally, this allowed us to better attribute any changes that may have occurred to the discussion itself.
Additionally, using information provided by the journal publisher (John Wiley & Sons Publishing) in 2016, we assessed the effect of #JHMChat on the number of article page views on the JHM website relative to the release of the electronic Table of Contents (eTOC). The eTOC release was chosen as it is historically associated with a high number of page views. In order to isolate the effect of #JHMChat, we only reviewed months in which #JHMChat was not held within 3 days of the eTOC release. Because JHM changed publishers in January 2017, we only assessed page view data on 2016 sessions, as the new publisher lacked enhanced search optimization to obtain these data.
Thematic Analysis
In addition to the above measurements, a thematic analysis of each article was conducted to assess any common themes that would influence our chosen metrics. Themes were assessed and ascribed by one author (C.M.W.) and verified by another (V.M.A.).
Participant and Author Experience
To assess the participant experience, responses to a post-session CME questionnaire that assessed (1) overall quality, (2) comprehensiveness of the discussion, (3) whether the participant would recommend the chat to a colleague, and (4) whether participation would lead to practice-changing measures were reviewed. Registration of each session for CME was also quantified. Finally, each participating author was asked to fill out an electronic post-chat survey (SurveyMonkey®) meant to assess the authors’ experience with the journal club (Appendix).
RESULTS
Between October 2015 and November 2017, a total of 15 sessions were held with a mean of 2.17 (±0.583) million impressions/session, 499 (±129) total tweets/session, and 73 (±24) participants/session (compared to a range of 21-58 participants/session from other online journal clubs, where reported) with 7.2 (±2.0) tweets/participant (Table 1). The total number of participants for all sessions was 1096. Participating authors had on average 1389 (±2714) followers, ranging from a low of 37 to a high of 10,376 (Appendix). No correlation between author following and number of participants (r = 0.19), impressions (r = 0.05), or change in Altmetric score (r = 0.17) was seen.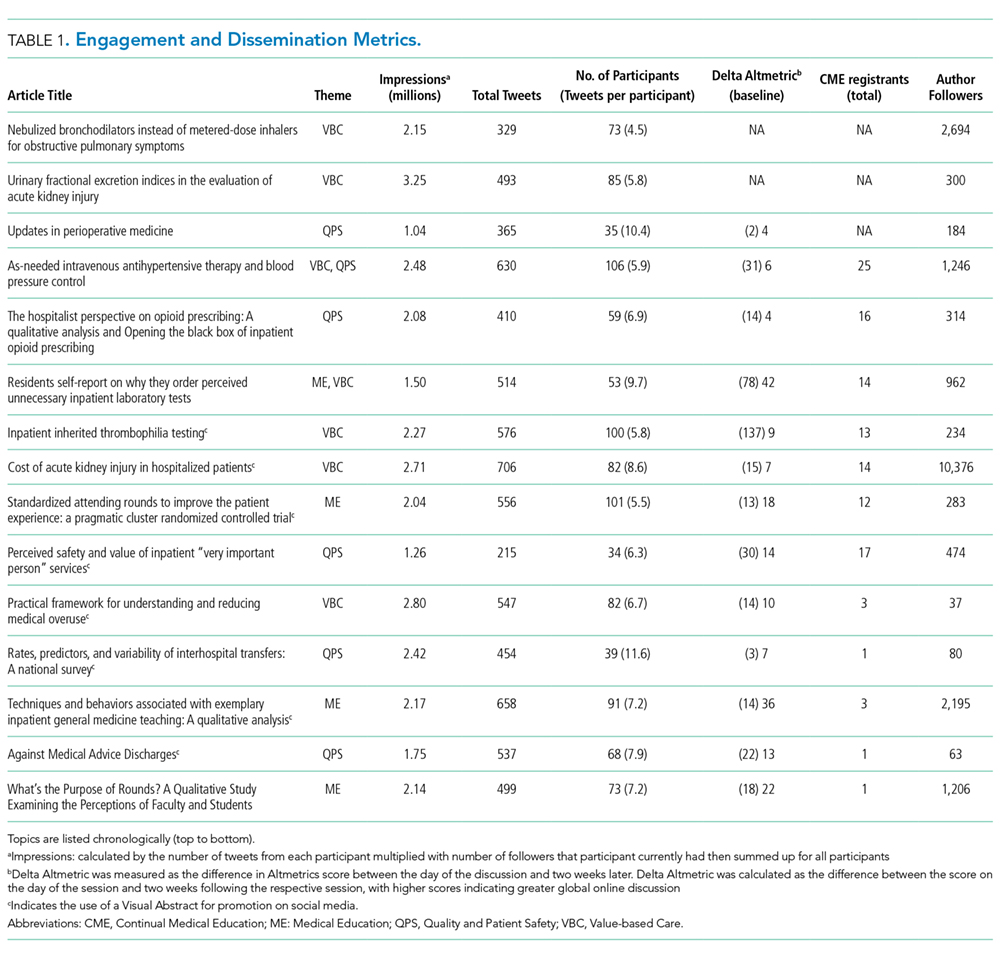
Thematic analysis revealed 3 predominant themes among the chosen articles: Value-based care (VBC), Quality and Patient Safety (QPS), and Medical Education (ME). Articles focused on VBC had the greatest number of impressions (mean ±SD: 2.61 ± 0.55 million) and participants (mean ±SD: 90 ± 12), while QPS articles had the fewest impressions (mean ±SD: 1.71 ± 0.59 million) and number of participants (mean ±SD: 47 ± 16). The mean increase in the Altmetric score among all discussed articles was 14 (±12), from an average baseline of 30 (±37). Medical Education-themed articles appeared to garner the greatest increase in Altmetric scores, averaging an increase of 32 points, compared with an average baseline score of 31 (±32). In contrast, VBC and QPS articles averaged an increase of 8.6 and 8.4 points, from average baselines of 55 (±53) and 17 (±13), respectively. A 2-month analysis of JHM articles not included in these discussions, in which Altmetric scores were measured in the same way as those from the discussion, revealed a baseline Altmetric score of 27 (±24) with an average increase of 8 (±6) 2 weeks following the chat.
Four articles met the inclusion criteria for page view analysis and suggested that article page views increased to similar levels as the eTOC release (mean: 2668 vs. 2998, respectively; P = .35) (Figure). These increases equate to a 33% and 50% increase in average daily page views (2002) for the chat and eTOC release, respectively.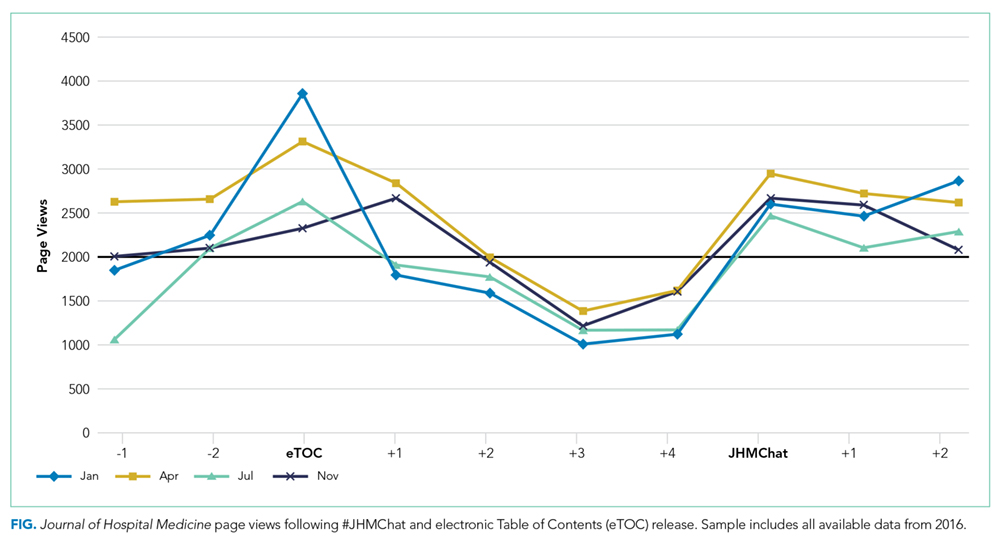
Ninety-three percent (14/15) of the participating authors responded to the post-discussion survey. All strongly agreed (5/5 on a Likert scale) that the venue allowed for an in-depth discussion about processes and challenges in conducting the study and allowed for greater dissemination and visibility of their work (5/5). Additionally, authors agreed that the journal club was a valuable experience for themselves (4.88/5) and other practitioners (4.88/5). Most agreed that the journal club allowed them to share their work with a different group of participants than usual (4.75/5) and that the experience changed how they would discuss their manuscripts in the future (4.75/5.0); Table 2).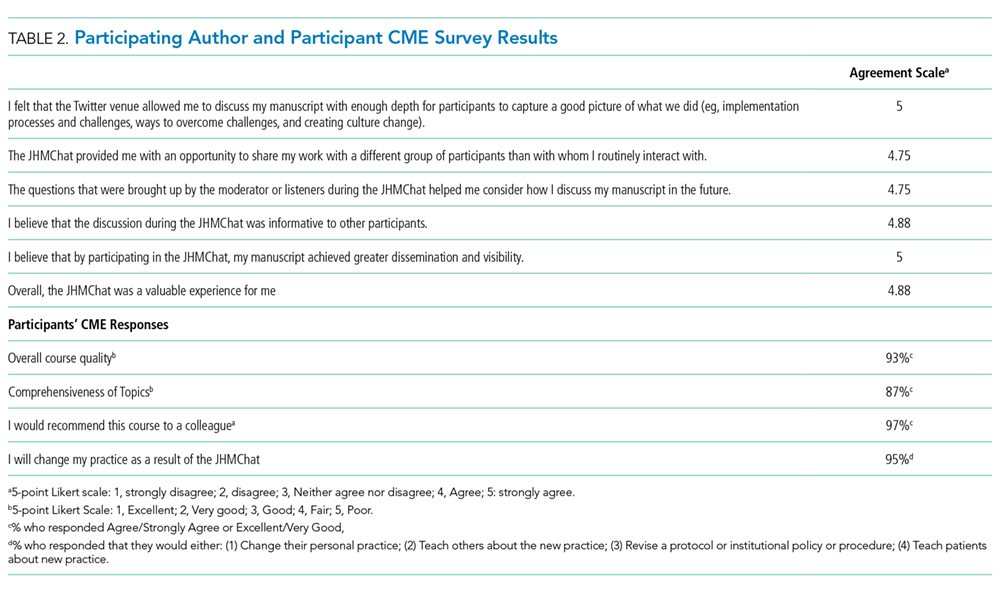
DISCUSSION
The Twitter-based journal club #JHMChat appears to increase social media awareness and dissemination of journal articles and was considered a useful engagement platform by both authors and participants.
Articles with a focus on VBC and ME had the greatest impact on dissemination metrics, particularly, total impressions and Altmetric scores, respectively. Given the strong presence and interest in these topics within Twitter and social media, these findings are not surprising.10,11 For example, over the past several years, the VBC movement has taken shape and grown alongside the expansion of social media, thus giving a space for this community to grow and engage. Of note, the cosponsorship relationship with the ABIM Foundation (which works closely with the Choosing Wisely™ campaign) and the Costs of Care Organization could have influenced the participation and dissemination rates of VBC articles. Medical education articles were also popular and appeared to have increased uptake after chats, based on their Altmetric scores. This may be explained by the fact that medical educators have long utilized social media as a means to connect and engage within their community.12–14 It is also possible that the use of Twitter by trainees (residents, students) may have driven some of the dissemination of ME articles, as this group may not be regular subscribers to JHM.
Online journal clubs offer distinct advantages over traditional in-person journal clubs. First, online journal clubs allow for increased connectivity among online communities, bringing together participants from different geographic areas with diverse training and clinical experiences. Subsequently, this allows for the rapid exchange of both personal and organizational approaches to the topic of discussion.15–17 Second, online journal clubs allow for continual access to the discussion material. For example, while the metrics used in this study only assessed active, synchronous participation, anecdotal evidence and feedback to the authors suggests that many individuals passively engaged by following along or reviewed the chat feed post hoc at their convenience. This asynchronous access is a quality not found in more traditional journal club formats. Finally, because online journal clubs commonly operate with a flattened hierarchy,18 they can break down access barriers to both the researchers who performed the study and thought leaders who commonly participate.17
Several insightful lessons were gleaned in the production and management of this online journal club. On the implementation side, promotion, preparation, and continued organization of an online journal club requires a fair amount of work. In this case, the required time and resources were provided by 2 social media editors in addition to administrative assistance from the SHM. The high attrition rate of online journal clubs over the years attests to these difficulties.24 Additionally, finding incentives to attract and sustain participation can be difficult, as we noted that neither CME nor author popularity (based on their Twitter following) appeared to influence engagement metrics (number of participants, total tweets, and tweets/participant). We also found that partnering with other journal club communities, in particular #NephJC, lead to greater participation rates and impressions. Thus, leveraging connections and topics that span clinical domains may be one way to improve and broaden engagement within these forums. Finally, feedback from participants revealed that the timing of the journal club and the inability to have in-depth discussions, a characteristic commonly associated with traditional journal clubs, were problematic.
This study has several limitations. First, the metrics used to assess social media engagement and dissemination can be easily skewed. For instance, the activity of 1 or 2 individuals with large followings can dramatically influence the number of impressions, giving a falsely elevated sense of broad dissemination. Conversely, there may have been some participants who did not use the #JHMChat hashtag, thus leading to an underestimation in these metrics. Second, while we report total impressions as a measure of dissemination, this metric represents possible interactions and does not guarantee interaction or visualization of that tweet. Additionally, we were unable to characterize our participants and their participation rates over time, as this information is not made available through Symplur© analytics. Third, our page view assessment was limited to 2016 sessions only; therefore, these data may not be an accurate reflection of the impact of #JHMChat on this metric. Fourth, given the marginal response rate to our CME questionnaire, a selection bias could have occurred. Finally, whether social media discussions such as online journal clubs act as leading indicators for future citations remains unclear, as some research has shown an association between increased Altmetric scores and increased citation rates,19-21 while others have not.22,23 Our study was not equipped to assess this correlation.
CONCLUSION
Online journal clubs create new opportunities to connect, engage, and disseminate medical research. These developing forums provide journal editors, researchers, patients, and clinicians with a means to connect and discuss research in ways that were not previously possible. In order to continue to evolve and grow, future research in online journal clubs should explore the downstream effects on citation rates, clinical uptake, and participant knowledge after the sessions.
Acknowledgments
The authors would like to thank Felicia Steele for her assistance in organizing and promoting the chats. Additionally, the authors would like to thank all the authors, guests and participants who took time from their families, work, and daily lives to participate in these activities. Your time and presence were truly appreciated.
Disclosures
The authors of this article operate as the Social Media Editors (C.M.W., V.M.A.) and the Editor-in-Chief (A.A.) for the Journal of Hospital Medicine. Dr. Wray had full access to all the data in the project, takes responsibility for the integrity of the data, and the accuracy of the data analysis.
1. Topf JM, Sparks MA, Phelan PJ, et al. The evolution of the journal club: from osler to twitter. Am J Kidney Dis Off J Natl Kidney Found. 2017;69(6):827-836. doi: 10.1053/j.ajkd.2016.12.012. PubMed
2. Thangasamy IA, Leveridge M, Davies BJ, Finelli A, Stork B, Woo HH. International urology journal club via Twitter: 12-month experience. Eur Urol. 2014;66(1):112-117. doi: 10.1016/j.eururo.2014.01.034. PubMed
3. Gardhouse AI, Budd L, Yang SYC, Wong CL. #GeriMedJC: the Twitter complement to the traditional-format geriatric medicine journal club. J Am Geriatr Soc. 2017;65(6):1347-1351. doi: 10.1111/jgs.14920. PubMed
4. Duque L. How academics and researchers can get more out of social media. Harvard Business Review. https://hbr.org/2016/06/how-academics-and-researchers-can-get-more-out-of-social-media. Accessed November 9, 2017.
5. Wray CM, Arora VM. #VisualAbstract: a revolution in communicating science? Ann Surg. 2017;266(6):e49-e50. doi: 10.1097/SLA.0000000000002339. PubMed
6. Ibrahim AM. Seeing is believing: using visual abstracts to disseminate scientific research. Am J Gastroenterol. 2017:ajg2017268. doi: 10.1038/ajg.2017.268. PubMed
7. #JHMChat. http://shm.hospitalmedicine.org/acton/media/25526/jhmchat. Accessed November 9, 2017.
8. #JHMChat-healthcare social media. Symplur. https://www.symplur.com/search/%23JHMChat. Accessed November 9, 2017.
9. Altmetric. Altmetric. https://www.altmetric.com/. Accessed November 9, 2017.
10. value-based healthcare | Symplur. https://www.symplur.com/topic/value-based-healthcare/. Accessed November 17, 2017.
11. medical education | Symplur. https://www.symplur.com/topic/medical-education/. Accessed November 17, 2017.
12. Sterling M, Leung P, Wright D, Bishop TF. The use of social media in graduate medical education: a systematic review. Acad Med. 2017;92(7):1043. doi: 10.1097/ACM.0000000000001617. PubMed
13. Davis WM, Ho K, Last J. Advancing social media in medical education. CMAJ Can Med Assoc J. 2015;187(8):549-550. doi: 10.1503/cmaj.141417. PubMed
14. Hillman T, Sherbino J. Social media in medical education: a new pedagogical paradigm? Postgrad Med J. 2015;91(1080):544-545. doi: 10.1136/postgradmedj-2015-133686. PubMed
15. Gerds AT, Chan T. Social media in hematology in 2017: dystopia, utopia, or somewhere in-between? Curr Hematol Malig Rep. 2017;12(6):582-591. doi: 10.1007/s11899-017-0424-8. PubMed
16. Mehta N, Flickinger T. The times they are a-changin’: academia, social media and the JGIM Twitter Journal Club. J Gen Intern Med. 2014;29(10):1317-1318. doi: 10.1007/s11606-014-2976-9. PubMed
17. Chan T, Trueger NS, Roland D, Thoma B. Evidence-based medicine in the era of social media: scholarly engagement through participation and online interaction. CJEM. 2017:1-6. doi: 10.1017/cem.2016.407. PubMed
18. Utengen A. The flattening of healthcare: breaking down of barriers in healthcare social media-twitter visualized. https://www.symplur.com/shorts/the-flattening-of-healthcare-twitter-visualized/. Accessed November 8, 2017.
19. Thelwall M, Haustein S, Larivière V, Sugimoto CR. Do altmetrics work? Twitter and ten other social web services. PloS One. 2013;8(5):e64841. doi: 10.1371/journal.pone.0064841. PubMed
20. Peoples BK, Midway SR, Sackett D, Lynch A, Cooney PB. Twitter predicts citation rates of ecological research. PloS One. 2016;11(11):e0166570. doi: 10.1371/journal.pone.0166570. PubMed
21. Eysenbach G. Can tweets predict citations? Metrics of social impact based on Twitter and correlation with traditional metrics of scientific impact. J Med Internet Res. 2011;13(4):e123. doi: 10.2196/jmir.2012. PubMed
22. Winter JCF de. The relationship between tweets, citations, and article views for PLOS ONE articles. Scientometrics. 2015;102(2):1773-1779. doi: 10.1007/s11192-014-1445-x.
23. Haustein S, Peters I, Sugimoto CR, Thelwall M, Larivière V. Tweeting biomedicine: an analysis of tweets and citations in the biomedical literature. J Assoc Inf Sci Technol. 2014;65(4):656-669. doi: 10.1002/asi.23101.
24. Journal club. In: Wikipedia. 2017. https://en.wikipedia.org/w/index.php?title=Journal_club&oldid=807037773. Accessed November 9, 2017.
Clinicians, educators, and medical journals are increasingly using the social media outlet, Twitter, as a medium to connect and engage with their colleagues. In particular, online journal clubs have created a space for the timely discussion of research, creation of online communities, and dissemination of research.
Social media-based journal clubs are thought to be one way in which journals can leverage the power of social networks so that researchers can engage with a diverse range of end users4 (including bedside clinicians, administrators, and patients). Several examples of these models exist. For example, #GeriMedJC acts as a complimentary, synchronous chat that takes place at the same time as a live, in-person journal club. #NephJC offers multiple 1-hour chats per month and provides an in-depth summary and analysis of each article, while #UroJC is an asynchronous discussion that takes place over 48 hours. Few data exist to describe whether any of these programs produce measurable improvements in indicators of engagement or dissemination of results.
In 2015, the Journal of Hospital Medicine (JHM) began producing a Twitter-based journal club as a means to connect and engage the Hospital Medicine community and allow for discussion and rapid exchange of information and opinions around a specific clinical topic. This study aims to describe the implementation of the first Journal-sponsored, Twitter-based online journal club and ascertain its impact on both Twitter and journal metrics.
METHODS
#JHMChat was launched in October 2015, and was initially held every 2-3 months until January 2017, when chats began to take place monthly. Each 1-hour chat focused on a recently published article in JHM, was moderated by a JHM social media editor (C.M.W., V.M.A.), and included at least 1 study author or guest expert. Articles were chosen by the social media editors based on the following criteria: (1) attractiveness to possible participants, (2) providing topic variety within the journal club series, and (3) sustainability and topic conduciveness to the online chat model. Chats were held at 9 PM EST in order to engage hospitalists across all US time zones and on different days to accommodate authors’ availability. All sessions were framed by 3-4 questions intended to encourage discussion and presented to chat participants at spaced intervals so as to stimulate a current of responses.
Chats were promoted by way of the JHM (@JHospMedicine, 3400 followers) and Society of Hospital Medicine (SHM; @SHMLive, 5800 followers) Twitter feeds beginning 1 month prior to each session. Visual Abstracts5,6 were used to publicize the sessions, also via Twitter, starting in February 2017.
Continuing Medical Education (CME) credits were offered through the SHM to registered participants, starting in July 2016.7 All sessions were cosponsored by the American Board of Internal Medicine (ABIM) Foundation and the Costs of Care Organization, a non-profit organization aimed at improving healthcare value.
Twitter Metrics
After each session, the following Twitter-based engagement metrics were obtained using the Symplur© Healthcare Hashtag project;8 total number of participants and tweets, tweets/participant, and total impressions (calculated as the number of tweets from each participant multiplied by the number of followers that participant currently had then summed up for all participants). Simply put, impressions can also be thought of as the number of times a single Tweet makes it into someone else’s Twitter feed. So as to avoid artificially inflated metrics, all were obtained 2 hours after the end of the journal club. Participants were defined as anyone who posted an original tweet or retweeted during the session and were encouraged to tag their tweets with the hashtag #JHMChat for post-discussion indexing and measurement. Because authors’ or guests’ popularity on Twitter may influence participation rates, we also assessed the number of followers for each participating author. Spearman’s rank correlation was calculated (Microsoft ExcelTM) where appropriate.
Altmetrics and Page Views
As a means to measure exposure and dissemination external to Twitter, we assessed the change (“Delta”) in the each article’s Altmetric score9, a digital-based metric that quantifies the attention received by a scientific publication on various online platforms including news, blogs, and social media. Delta Altmetric scores were calculated as the difference between the scores on the day of the session and 2 weeks after the respective session, with higher scores indicating greater global online discussion. By measuring the Altmetric score on the day of the discussion, we established a baseline score for comparison purposes. Additionally, this allowed us to better attribute any changes that may have occurred to the discussion itself.
Additionally, using information provided by the journal publisher (John Wiley & Sons Publishing) in 2016, we assessed the effect of #JHMChat on the number of article page views on the JHM website relative to the release of the electronic Table of Contents (eTOC). The eTOC release was chosen as it is historically associated with a high number of page views. In order to isolate the effect of #JHMChat, we only reviewed months in which #JHMChat was not held within 3 days of the eTOC release. Because JHM changed publishers in January 2017, we only assessed page view data on 2016 sessions, as the new publisher lacked enhanced search optimization to obtain these data.
Thematic Analysis
In addition to the above measurements, a thematic analysis of each article was conducted to assess any common themes that would influence our chosen metrics. Themes were assessed and ascribed by one author (C.M.W.) and verified by another (V.M.A.).
Participant and Author Experience
To assess the participant experience, responses to a post-session CME questionnaire that assessed (1) overall quality, (2) comprehensiveness of the discussion, (3) whether the participant would recommend the chat to a colleague, and (4) whether participation would lead to practice-changing measures were reviewed. Registration of each session for CME was also quantified. Finally, each participating author was asked to fill out an electronic post-chat survey (SurveyMonkey®) meant to assess the authors’ experience with the journal club (Appendix).
RESULTS
Between October 2015 and November 2017, a total of 15 sessions were held with a mean of 2.17 (±0.583) million impressions/session, 499 (±129) total tweets/session, and 73 (±24) participants/session (compared to a range of 21-58 participants/session from other online journal clubs, where reported) with 7.2 (±2.0) tweets/participant (Table 1). The total number of participants for all sessions was 1096. Participating authors had on average 1389 (±2714) followers, ranging from a low of 37 to a high of 10,376 (Appendix). No correlation between author following and number of participants (r = 0.19), impressions (r = 0.05), or change in Altmetric score (r = 0.17) was seen.
Thematic analysis revealed 3 predominant themes among the chosen articles: Value-based care (VBC), Quality and Patient Safety (QPS), and Medical Education (ME). Articles focused on VBC had the greatest number of impressions (mean ±SD: 2.61 ± 0.55 million) and participants (mean ±SD: 90 ± 12), while QPS articles had the fewest impressions (mean ±SD: 1.71 ± 0.59 million) and number of participants (mean ±SD: 47 ± 16). The mean increase in the Altmetric score among all discussed articles was 14 (±12), from an average baseline of 30 (±37). Medical Education-themed articles appeared to garner the greatest increase in Altmetric scores, averaging an increase of 32 points, compared with an average baseline score of 31 (±32). In contrast, VBC and QPS articles averaged an increase of 8.6 and 8.4 points, from average baselines of 55 (±53) and 17 (±13), respectively. A 2-month analysis of JHM articles not included in these discussions, in which Altmetric scores were measured in the same way as those from the discussion, revealed a baseline Altmetric score of 27 (±24) with an average increase of 8 (±6) 2 weeks following the chat.
Four articles met the inclusion criteria for page view analysis and suggested that article page views increased to similar levels as the eTOC release (mean: 2668 vs. 2998, respectively; P = .35) (Figure). These increases equate to a 33% and 50% increase in average daily page views (2002) for the chat and eTOC release, respectively.
Ninety-three percent (14/15) of the participating authors responded to the post-discussion survey. All strongly agreed (5/5 on a Likert scale) that the venue allowed for an in-depth discussion about processes and challenges in conducting the study and allowed for greater dissemination and visibility of their work (5/5). Additionally, authors agreed that the journal club was a valuable experience for themselves (4.88/5) and other practitioners (4.88/5). Most agreed that the journal club allowed them to share their work with a different group of participants than usual (4.75/5) and that the experience changed how they would discuss their manuscripts in the future (4.75/5.0); Table 2).
DISCUSSION
The Twitter-based journal club #JHMChat appears to increase social media awareness and dissemination of journal articles and was considered a useful engagement platform by both authors and participants.
Articles with a focus on VBC and ME had the greatest impact on dissemination metrics, particularly, total impressions and Altmetric scores, respectively. Given the strong presence and interest in these topics within Twitter and social media, these findings are not surprising.10,11 For example, over the past several years, the VBC movement has taken shape and grown alongside the expansion of social media, thus giving a space for this community to grow and engage. Of note, the cosponsorship relationship with the ABIM Foundation (which works closely with the Choosing Wisely™ campaign) and the Costs of Care Organization could have influenced the participation and dissemination rates of VBC articles. Medical education articles were also popular and appeared to have increased uptake after chats, based on their Altmetric scores. This may be explained by the fact that medical educators have long utilized social media as a means to connect and engage within their community.12–14 It is also possible that the use of Twitter by trainees (residents, students) may have driven some of the dissemination of ME articles, as this group may not be regular subscribers to JHM.
Online journal clubs offer distinct advantages over traditional in-person journal clubs. First, online journal clubs allow for increased connectivity among online communities, bringing together participants from different geographic areas with diverse training and clinical experiences. Subsequently, this allows for the rapid exchange of both personal and organizational approaches to the topic of discussion.15–17 Second, online journal clubs allow for continual access to the discussion material. For example, while the metrics used in this study only assessed active, synchronous participation, anecdotal evidence and feedback to the authors suggests that many individuals passively engaged by following along or reviewed the chat feed post hoc at their convenience. This asynchronous access is a quality not found in more traditional journal club formats. Finally, because online journal clubs commonly operate with a flattened hierarchy,18 they can break down access barriers to both the researchers who performed the study and thought leaders who commonly participate.17
Several insightful lessons were gleaned in the production and management of this online journal club. On the implementation side, promotion, preparation, and continued organization of an online journal club requires a fair amount of work. In this case, the required time and resources were provided by 2 social media editors in addition to administrative assistance from the SHM. The high attrition rate of online journal clubs over the years attests to these difficulties.24 Additionally, finding incentives to attract and sustain participation can be difficult, as we noted that neither CME nor author popularity (based on their Twitter following) appeared to influence engagement metrics (number of participants, total tweets, and tweets/participant). We also found that partnering with other journal club communities, in particular #NephJC, lead to greater participation rates and impressions. Thus, leveraging connections and topics that span clinical domains may be one way to improve and broaden engagement within these forums. Finally, feedback from participants revealed that the timing of the journal club and the inability to have in-depth discussions, a characteristic commonly associated with traditional journal clubs, were problematic.
This study has several limitations. First, the metrics used to assess social media engagement and dissemination can be easily skewed. For instance, the activity of 1 or 2 individuals with large followings can dramatically influence the number of impressions, giving a falsely elevated sense of broad dissemination. Conversely, there may have been some participants who did not use the #JHMChat hashtag, thus leading to an underestimation in these metrics. Second, while we report total impressions as a measure of dissemination, this metric represents possible interactions and does not guarantee interaction or visualization of that tweet. Additionally, we were unable to characterize our participants and their participation rates over time, as this information is not made available through Symplur© analytics. Third, our page view assessment was limited to 2016 sessions only; therefore, these data may not be an accurate reflection of the impact of #JHMChat on this metric. Fourth, given the marginal response rate to our CME questionnaire, a selection bias could have occurred. Finally, whether social media discussions such as online journal clubs act as leading indicators for future citations remains unclear, as some research has shown an association between increased Altmetric scores and increased citation rates,19-21 while others have not.22,23 Our study was not equipped to assess this correlation.
CONCLUSION
Online journal clubs create new opportunities to connect, engage, and disseminate medical research. These developing forums provide journal editors, researchers, patients, and clinicians with a means to connect and discuss research in ways that were not previously possible. In order to continue to evolve and grow, future research in online journal clubs should explore the downstream effects on citation rates, clinical uptake, and participant knowledge after the sessions.
Acknowledgments
The authors would like to thank Felicia Steele for her assistance in organizing and promoting the chats. Additionally, the authors would like to thank all the authors, guests and participants who took time from their families, work, and daily lives to participate in these activities. Your time and presence were truly appreciated.
Disclosures
The authors of this article operate as the Social Media Editors (C.M.W., V.M.A.) and the Editor-in-Chief (A.A.) for the Journal of Hospital Medicine. Dr. Wray had full access to all the data in the project, takes responsibility for the integrity of the data, and the accuracy of the data analysis.
1. Topf JM, Sparks MA, Phelan PJ, et al. The evolution of the journal club: from osler to twitter. Am J Kidney Dis Off J Natl Kidney Found. 2017;69(6):827-836. doi: 10.1053/j.ajkd.2016.12.012. PubMed
2. Thangasamy IA, Leveridge M, Davies BJ, Finelli A, Stork B, Woo HH. International urology journal club via Twitter: 12-month experience. Eur Urol. 2014;66(1):112-117. doi: 10.1016/j.eururo.2014.01.034. PubMed
3. Gardhouse AI, Budd L, Yang SYC, Wong CL. #GeriMedJC: the Twitter complement to the traditional-format geriatric medicine journal club. J Am Geriatr Soc. 2017;65(6):1347-1351. doi: 10.1111/jgs.14920. PubMed
4. Duque L. How academics and researchers can get more out of social media. Harvard Business Review. https://hbr.org/2016/06/how-academics-and-researchers-can-get-more-out-of-social-media. Accessed November 9, 2017.
5. Wray CM, Arora VM. #VisualAbstract: a revolution in communicating science? Ann Surg. 2017;266(6):e49-e50. doi: 10.1097/SLA.0000000000002339. PubMed
6. Ibrahim AM. Seeing is believing: using visual abstracts to disseminate scientific research. Am J Gastroenterol. 2017:ajg2017268. doi: 10.1038/ajg.2017.268. PubMed
7. #JHMChat. http://shm.hospitalmedicine.org/acton/media/25526/jhmchat. Accessed November 9, 2017.
8. #JHMChat-healthcare social media. Symplur. https://www.symplur.com/search/%23JHMChat. Accessed November 9, 2017.
9. Altmetric. Altmetric. https://www.altmetric.com/. Accessed November 9, 2017.
10. value-based healthcare | Symplur. https://www.symplur.com/topic/value-based-healthcare/. Accessed November 17, 2017.
11. medical education | Symplur. https://www.symplur.com/topic/medical-education/. Accessed November 17, 2017.
12. Sterling M, Leung P, Wright D, Bishop TF. The use of social media in graduate medical education: a systematic review. Acad Med. 2017;92(7):1043. doi: 10.1097/ACM.0000000000001617. PubMed
13. Davis WM, Ho K, Last J. Advancing social media in medical education. CMAJ Can Med Assoc J. 2015;187(8):549-550. doi: 10.1503/cmaj.141417. PubMed
14. Hillman T, Sherbino J. Social media in medical education: a new pedagogical paradigm? Postgrad Med J. 2015;91(1080):544-545. doi: 10.1136/postgradmedj-2015-133686. PubMed
15. Gerds AT, Chan T. Social media in hematology in 2017: dystopia, utopia, or somewhere in-between? Curr Hematol Malig Rep. 2017;12(6):582-591. doi: 10.1007/s11899-017-0424-8. PubMed
16. Mehta N, Flickinger T. The times they are a-changin’: academia, social media and the JGIM Twitter Journal Club. J Gen Intern Med. 2014;29(10):1317-1318. doi: 10.1007/s11606-014-2976-9. PubMed
17. Chan T, Trueger NS, Roland D, Thoma B. Evidence-based medicine in the era of social media: scholarly engagement through participation and online interaction. CJEM. 2017:1-6. doi: 10.1017/cem.2016.407. PubMed
18. Utengen A. The flattening of healthcare: breaking down of barriers in healthcare social media-twitter visualized. https://www.symplur.com/shorts/the-flattening-of-healthcare-twitter-visualized/. Accessed November 8, 2017.
19. Thelwall M, Haustein S, Larivière V, Sugimoto CR. Do altmetrics work? Twitter and ten other social web services. PloS One. 2013;8(5):e64841. doi: 10.1371/journal.pone.0064841. PubMed
20. Peoples BK, Midway SR, Sackett D, Lynch A, Cooney PB. Twitter predicts citation rates of ecological research. PloS One. 2016;11(11):e0166570. doi: 10.1371/journal.pone.0166570. PubMed
21. Eysenbach G. Can tweets predict citations? Metrics of social impact based on Twitter and correlation with traditional metrics of scientific impact. J Med Internet Res. 2011;13(4):e123. doi: 10.2196/jmir.2012. PubMed
22. Winter JCF de. The relationship between tweets, citations, and article views for PLOS ONE articles. Scientometrics. 2015;102(2):1773-1779. doi: 10.1007/s11192-014-1445-x.
23. Haustein S, Peters I, Sugimoto CR, Thelwall M, Larivière V. Tweeting biomedicine: an analysis of tweets and citations in the biomedical literature. J Assoc Inf Sci Technol. 2014;65(4):656-669. doi: 10.1002/asi.23101.
24. Journal club. In: Wikipedia. 2017. https://en.wikipedia.org/w/index.php?title=Journal_club&oldid=807037773. Accessed November 9, 2017.
© 2018 Society of Hospital Medicine
“We’ve Learned It’s a Medical Illness, Not a Moral Choice”: Qualitative Study of the Effects of a Multicomponent Addiction Intervention on Hospital Providers’ Attitudes and Experiences
Substance use disorders (SUD) represent a national epidemic with death rates exceeding those of HIV at its peak.1 Hospitals are increasingly filled with people suffering from medical complications of addiction.2,3 While the US health system spends billions of dollars annually on hospital care for medical problems resulting from SUD,4 most hospitals lack expertise or care systems to directly address SUD or connect people to treatment after discharge. 5,6
Patients with SUD often feel stigmatized in healthcare settings and want providers who understand SUD and how to treat it.7 Providers feel underprepared8 and commonly have negative attitudes toward patients with SUD.9,10 Caring for patients can be a source of resentment, dissatisfaction, and burnout.9 Such negative attitudes can adversely affect patient care. Studies show that patients who perceive discrimination by providers are less likely to complete treatment11 and providers’ negative attitudes may disempower patients.9
Evaluations of hospital interventions for adults with SUD focus primarily on patient-level outcomes of SUD severity,12 healthcare utilization,13 and treatment engagement.14,15 Little is known about how such interventions can affect interprofessional providers’ attitudes and experiences, or how systems-level interventions influence hospital culture.16
We performed a qualitative study of multidisciplinary hospital providers to 1) understand the challenges that hospital providers face in managing care for patients with SUD, and 2) explore how integrating SUD treatment in a hospital setting affects providers’ attitudes, experiences, and perceptions of the care environment. This study was part of a formative evaluation of the Improving Addiction Care Team (IMPACT). IMPACT includes a hospital-based, interprofessional addiction medicine consultation service and rapid-access pathways to community addiction care after hospitalization.17. IMPACT is an intensive intervention that includes SUD assessments, withdrawal management, medications for addiction (eg, methadone, buprenorphine induction), counseling and behavioral SUD treatment, peer engagement and support, and linkages to community-based addiction care. We described the rationale and design of IMPACT in earlier publications.7,17
METHODS
Setting
We conducted in-person interviews and focus groups (FGs) with interprofessional hospital providers at a single urban academic medical center between February and July 2016, six months after starting IMPACT implementation. Oregon Health and Science University’s (OHSU) institutional review board approved the protocol.
Participants
We conducted 12 individual informant interviews (IIs) and 6 (FGs) (each comprising 3-6 participants) with a wide range of providers, including physicians, nurses, social workers, residents, patient advocates, case managers, and pharmacists. In total, 34 providers participated. We used purposive sampling to choose participants with experience both caring for patients with SUD and with exposure to IMPACT. Participant characteristics are summarized in Table 1.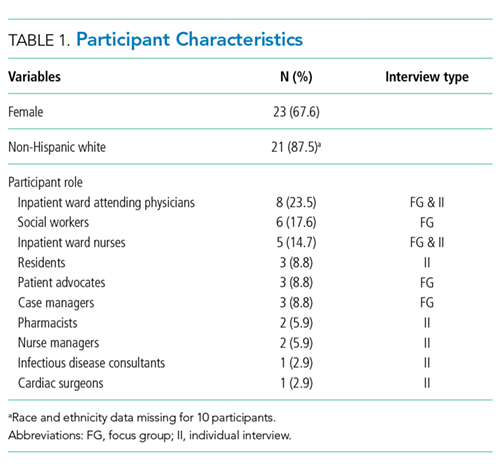
Data Collection
We employed 2 different types of interviews. In situations where multiple providers occupied a similar role (eg, social workers), we chose to use a focus group format to elicit a range of perspectives and experiences through participant interaction.18 We conducted individual interviews to gain input from key informants who had unique roles in the program (eg, a cardiac surgeon) and to include providers who would otherwise be unable to participate due to scheduling barriers (eg, residents). We interviewed all participants using a semi-structured interview guide that was developed by an interdisciplinary team, including expert qualitative researchers, IMPACT clinical team members, and other OHSU clinicians (Appendix A). An interviewer who was not a part of the IMPACT clinical team asked all participants about their experience caring for patients with SUD, their experience with IMPACT, and how they might improve care. FGs lasted between 41-57 minutes, and individual key informant interviews lasted between 11-38 minutes. We ended recruitment after reaching theme saturation. Our goal was to achieve saturation across the sample as a whole and not within distinct participant groups. We noted if certain themes were more salient for 1 particular group. We audio-recorded all interviews and FGs. Recordings were transcribed, de-identified, and transferred to ATLAS.ti for data analysis.
Analysis
We conducted a thematic analysis using an inductive approach at the semantic level.19 Using an iterative process, we generated a preliminary coding schema after reviewing an initial selection of transcripts. Coders then independently coded transcripts and met in dyads to both discuss and reconcile codes, and resolve any discrepancies through discussion until reaching a consensus. One coder (DC) coded all transcripts; 3 coders (EP, SPP, MR) divided the transcripts evenly. All authors met periodically to discuss codebook revisions and emergent themes. We identified themes that represented patterns, had meaning to study participants, and captured important findings related to our research questions.19
As expected, the style of IIs differed from that of FGs and informants were able to provide information specific to their roles. Overall, the information provided by IIs was complementary to that of FGs and helped triangulate findings. Thus, we combined them in the results.18
RESULTS
We organized our findings into 3 main groupings, including (1) care before IMPACT, (2) care with IMPACT, and (3) perceived limitations of IMPACT. We included a table (Table 2) with additional quotations, beyond those in the body of the results, to support emergent themes described below.
Care before IMPACT
Providers felt hospitalization did not address addiction for many reasons, including ethical and legal concerns, medical knowledge gaps, and lack of treatment options.
Before IMPACT, many participants noted that hospitalization ignored or avoided addressing addiction, leading to a chaotic care environment that adversely affected patient care and provider experience. As one social worker stated, “prior to IMPACT we provided assessments, and we provided resources. But we didn’t address addiction.”
Providers cited multiple explanations for this, including the common misperception that using methadone to treat withdrawal violated federal regulations, and concerns about the ethicality of using opioids in patients with SUD. Across disciplines, providers described a “huge knowledge gap” and little confidence in addressing withdrawal, complex chronic pain, medications for addiction, and challenging patient behaviors. Providers also described limited expertise and scarce treatment options as a deterrent. As one attending reflected, “I would ask those questions [about SUD] before, but then … I had the information, but I couldn’t do anything with it.”
Providers felt the failure to address SUD adversely affected patient care, leading to untreated withdrawal, disruptive behaviors, and patients leaving against medical advice (AMA).
Participants across disciplines described wide variability in the medical management of SUD, particularly around the management of opioid withdrawal and pain, with some providers who “simply wouldn’t prescribe methadone or any opiates” and others who prescribed high doses without anticipating risks. As one attending recalled:
“You would see this pattern, especially in the intravenous drug-using population: left AMA, left AMA, left AMA … nine times out of ten, nobody was dealing with the fact that they were gonna go into withdrawal.”
Respondents recalled that disruptive behaviors from patients’ active use or withdrawal frequently threatened safety; imposed a tremendous burden on staff time and morale; and were a consistent source of providers’ distress. As one patient advocate explained:
“[Providers] get called to the unit because the person is yelling and throwing things or comes back after being gone for a long period and appears impaired … it often blows up, and they get discharged or they leave against medical advice or they go out and don’t come back. We don’t really know what happened to them, and they’re vulnerable. And the staff are vulnerable. And other patients are distressed by the disruption and commotion.”
Absent standards and systems to address SUD, providers felt they were “left to their own,” resulting in a reactive and chaotic care environment.
Providers noted inconsistent rules and policies regarding smoke breaks, room searches, and visitors. As a result, care felt “reckless and risky” and led to a “nonalliance” across disciplines. Providers frequently described inconsistent and loose expectations until an event -- often active use – triggered an ad hoc ratcheting up of the rules, damaging patient-provider relationships and limiting providers’ ability to provide medical care. Facing these conflicts, “staff gets escalated, and everybody gets kind of spun up.” As one attending reflected:
“I could not get any sort of engagement even in just her medical issues … I was trying to talk to her and educate her about heart failure and salt intake and food intake, but every time I walked in the room … I’d have to come in and be like, ‘your UDS [urine drug screen] was positive again, so here’s the changes to your behavioral plan, and OK, let’s talk about your heart failure …’ At that point, the relationship had completely disintegrated until it was very nonproductive.”
Providers described widespread “moral distress,” burnout, and feelings of futility before IMPACT.
Consequently, providers felt that caring for people with SUD was “very emotionally draining and very time consuming.” As one patient advocate described:
“We’ve been watching staff try to manage these patients for years without the experts and the resources and the skills that they need … As a result, there was a crescendo effect of moral distress, and [staff] bring in all of their past experiences which influence the interaction … Some staff are very skilled, but you also saw some really punitive responses.”
Many felt that providing intensive medical care without addressing people’s underlying SUD was a waste of time and resources. As one cardiac surgeon reflected:
“[Patients] ended up either dead or reinfected. Nobody wanted to do stuff because we felt it was futile. Well, of course, it’s futile …. you’re basically trying to fix the symptoms. It’s like having a leaky roof and just running around with a bunch of buckets, which is like surgery. You gotta fix the roof…otherwise they will continue to inject bacteria into their bodies.”
Care with IMPACT:
Providers felt integrating hospital-based systems to address SUD legitimized addiction as a treatable disease.
Participants described IMPACT as a “sea change” that “completely reframes” addiction as “a medical condition that actually has a treatment.” As one social worker observed, “when it’s somebody in a white coat with expertise who’s talking to another doctor it really can shift mindsets in an amazing way.” Others echoed this, stating that an addiction team “legitimized the fact that this is an actual disease that we need to treat - and a failure to treat it is a failure to be a good doctor.”
Providers felt that by addressing addiction directly, “IMPACT elevated the consciousness of providers and nurses … that substance use disorders are brain disorders and not bad behavior.” They described that this legitimization, combined with seeing firsthand the stabilizing effects of medications for addiction, allowed providers to understand SUD as a chronic disease, and not a moral failing.
Providers felt IMPACT improved patient engagement and humanized care by treating withdrawal, directly communicating about SUD, and modeling compassionate care.
Providers noted that treating withdrawal had a dramatic effect on patient engagement and care. One surgeon explained, “by managing their opioid dependence and other substance abuse issues … it’s easier for the staff to take care of them, it’s safer, and the patients feel better taken care of because the staff will engage with them.” Many noted that conflict-ridden “conversations were able to go to the side, and we were able to talk about other things to build rapport.” Others noted that this shift felt like “more productive time.”
In addition, providers repeatedly emphasized that having clear hospital standards and a process to engage patients “really helps … establish rapport with patients: ‘This is how we work this. These are your boundaries. And this is what will happen if you push those boundaries.’ There it is.” Providers attributed improved patient-provider communication to “frank conversation,” “the right amount of empathy,” and a less judgmental environment. As one attending described, “I don’t know if it gives them a voice or allows us to hear them better … but something’s happening with communication.”
Many participants highlighted that IMPACT modeled compassionate bedside interactions, exposed the role of trauma in many patients’ lives, and helped providers see SUD as a disease spectrum. One attending noted that to “actually appreciate the subtleties – just the severity of the disorder – has been powerful.” One resident said:
“There’s definitely a lot of stigma around patients with use disorders that probably shows itself in subtle ways throughout their hospitalization. I think IMPACT does a good job … keeping the patient in the center and keeping their use disorder contextualized in the greater person … [IMPACT] role models bedside interactions and how to treat people like humans.”
Providers valued post-hospital SUD treatment pathways.
Providers valued previously nonexistent post-hospital SUD treatment pathways, stating “this relationship with [community treatment] … it’s like an answer to prayers,” and “this isn’t just like we’re being nicer.” One attending described:
“Starting them on [methadone or buprenorphine-naloxone] and then making the next step in the outpatient world happen has been huge. That transition is so critical … that’s been probably the biggest impact.”
Providers felt relief after IMPACT implementation.
Providers felt that by addressing SUD treatment gaps and providing addiction expertise, IMPACT helped alleviate the previously widespread feelings of “moral distress.” One resident explained “having [IMPACT] as a lifeline, it just feels so good.” As an infectious disease consultant noted, “it makes people more open to treating people if they don’t feel isolated and out of their depth.” Others noted that IMPACT supported better multidisciplinary collaboration, which “reduced a lot of tension between the teams.” One nurse summarized:
“I think you feel more empowered when you’ve got the right medication, … the knowledge, and you feel like you have the resources. You actually feel like you’re making a difference.”
Respondents acknowledged that even with IMPACT, some patients leave AMA or relapse. However, by understanding addiction as a relapsing and remitting disease, providers reconceptualized “success,” further reducing feelings of emotional burnout and stress: “there will be ups and downs, it’s not gonna be a straight linear success.” One case manager reflected,
“Maybe that’s part of the nature of the illness, you progress, and then you kind of hold your breath and then it slips again … at least with IMPACT at the table I can say we’ve done the best we can for this person.”
Perceived limitations of IMPACT:
Providers noted several key limitations of IMPACT, including that hospital-based interventions do not address poverty and have limited ability to address socioeconomic determinants such as “social support, … housing, or nutrition.” Providers also felt that IMPACT had limited ability to alleviate patients’ feelings of boredom and isolation associated with prolonged hospitalization, and that IMPACT had limited effectiveness for highly ambivalent patients (Table 2).
Finally, while many described increased confidence managing SUD after working with IMPACT, others cautioned against deferring too much to specialists. As one resident doctor said:
“We shouldn’t forget that all providers should know how to handle some form of people with addiction … I just don’t want it to be like, ‘oh, well, no, I don’t need to think about this … because we have an addiction specialist.’”
Participants across disciplines repeatedly suggested formal, ongoing initiatives to educate and train providers to manage SUD independently.
DISCUSSION
This study explores provider perspectives on care for hospitalized adults with SUD. Before IMPACT, providers felt care was chaotic, unsafe, and frustrating. Providers perceived variable care quality, resulting in untreated withdrawal, inconsistent care plans, and poor patient outcomes, leading to widespread “moral distress” and feelings of futility among providers. Yet this experience was not inevitable. Providers described that a hospital-based intervention to treat SUD reframed addiction as a treatable chronic disease, transformed culture, and improved patient care and provider experience.
Our findings are consistent with and build on previous research in several ways. First, widespread anxiety and difficulty managing patients with SUD was not unique to our hospital. In a systematic review, van Boekel and colleagues describe that healthcare providers perceived violence, manipulation, and poor motivation as factors impeding care for patients with SUD.9 Our study demonstrates the resulting feelings of powerlessness and frustration may be alleviated through an intervention that provides SUD care.
Second, our study is consistent with a recent survey-based study by Wakeman and colleagues that found that a hospital-based SUD intervention improved providers’ feelings of preparedness and satisfaction.20 Our study provides a rich qualitative description and elucidates mechanisms by which such interventions may work.
The finding that a hospital-based SUD intervention can shift providers’ views of addiction is important. Earlier studies have shown that providers who perceive addiction as a choice are more likely to have negative attitudes toward people with SUD.11 While our intervention did not provide formal education aimed at changing attitudes, participants reported that seeing firsthand effects of treatment on patient behaviors was a powerful tool that radically shifted providers’ understanding and reduced stigma.
Stigma can occur at both individual and organizational levels. Structural stigma refers to practices, policies, and norms of institutions that exclude needs of a particular group.21 The absence of systems to address SUD sends a message to both patients and providers that addiction is a not a treatable or worthy disease. IMPACT was in and of itself a systems-level intervention; by creating a consultation service, hospital-wide policies, and pathways to care after hospitalization, IMPACT ‘legitimized’ SUD and reduced institutional stigma.
Several studies have shown the feasibility and effectiveness of starting medications for addiction (MAT) in the hospital.13-15 Our study builds on this work by highlighting systems-level elements valued by providers. These elements may be important to support and scale widespread adoption of MAT in hospitals. Specifically, providers felt that IMPACT’s attention to hospital policies, use of addiction medicine specialists, and direct linkages to outpatient SUD treatment proved instrumental in shifting care systems.
Our study has several limitations. As a single-site study, our goal was not generalizability, but transferability. As such, we aimed to obtain rich, in-depth information that can inform implementation of similar efforts. Because our study was conducted after the implementation of IMPACT, providers’ perspectives on care before IMPACT may have been influenced by the intervention. However, this also strengthens our findings by allowing participants the opportunity for insights under a different system. It likely leads to distinct findings compared to what we might have uncovered in a pre-post study. While respondents noted perceived limitations of IMPACT, there were few instances of negative remarks in the data we collected. It is possible that providers with more negative interpretations chose not to participate in interviews; however, we elicited wide viewpoints and encouraged participants to share both strengths and weaknesses. Finally, IMPACT implementation depends on regional as well as local factors such as Medicaid expansion, community treatment resources, and the existence of addiction medicine expertise that will differ across settings.
Despite these limitations, our study has several important implications. For clinical practice, our findings highlight the importance of treating withdrawal to address challenging patient behaviors and the value of integrating MAT into the hospital setting. Our findings also underscore the role of expert consultation for addiction. Importantly, our results emphasize that reframing SUD as a brain disease can have significant implications for clinical care and providers’ well-being. Provider distress is not inevitable and can change with the right support and systems.
At the hospital and health systems level, our findings suggest that hospitals can and should address SUD. This may include forming interprofessional teams with SUD expertise, providing standardized guidelines for addiction care such as patient safety plans and methadone policies, and creating rapid-access pathways to outpatient SUD care. By addressing SUD, hospitals may simultaneously improve care and reduce provider burnout. Providers’ important concerns about shifting SUD treatment to a specialty team and their discomfort managing SUD pre-IMPACT suggest the need to integrate SUD education across all levels of interprofessional education. Furthermore, provider concerns that IMPACT has limited ability to engage ambivalent patients underscores the need for hospital-based approaches that emphasize harm reduction strategies.
As the SUD epidemic worsens, SUD-related hospitalizations are skyrocketing, and people are dying at unprecedented rates.2,3 Many efforts to address SUD have been in primary care or community settings. While important, many people with SUD are unable or unlikely to seek primary care. 22 Hospitals need a workforce and systems that can address both the physical and behavioral health needs of this population. By implementing SUD improvements, hospitals can support staff and reduce burnout, better engage patients, improve care, and reduce stigma from this devastating disease
Disclosures
The authors have no conflicts of interest to disclose.
1. Rossen L, Bastian B, Warner M, Khan D, Chong Y. Drug poisoning mortality: United States, 1999-2015. 2017; https://www.cdc.gov/nchs/data-visualization/drug-poisoning-mortality/. Accessed 7-11, 2017.
2. Tedesco D, Asch SM, Curtin C, et al. Opioid abuse and poisoning: trends in inpatient and emergency department discharges. Health Aff (Millwood). 2017;36(10):1748-1753. http:// doi.org/10.1377/hlthaff.2017.0260. PubMed
3. Weiss AJ, Elixhauser A, Barrett ML, Steiner CA, Bailey MK, O’Malley L. Statistical Brief #219: Opioid-Related Inpatient Stays and Emergency Department Visits by State, 2009-2014. 2017; https://hcup-us.ahrq.gov/reports/statbriefs/sb219-Opioid-Hospital-Stays-ED-Visits-by-State.jsp?utm_source=AHRQ&utm_medium=EN-2&utm_term=&utm_content=2&utm_campaign=AHRQ_EN12_20_2016. Accessed July 11, 2017. PubMed
4. Ronan MV, Herzig SJ. Hospitalizations related to opioid abuse/dependence and associated serious infections increased sharply, 2002-12. Health Aff (Millwood). 2016;35(5):832-837. http:// doi.org/10.1377/hlthaff.2015.1424. PubMed
5. Infectious Diseases Society of America Emerging Infections Network. Report for Query: ‘Injection Drug Use (IDU) and Infectious Disease Practice’. 2017; https://www.int-med.uiowa.edu/Research/EIN/FinalReport_IDUandID.pdf. Accessed July 11, 2017.
6. Rosenthal ES, Karchmer AW, Theisen-Toupal J, Castillo RA, Rowley CF. Suboptimal addiction interventions for patients hospitalized with injection drug use-associated infective endocarditis. Am J Med. 2016;129(5):481-485. http:// doi.org/10.1016/j.amjmed.2015.09.024. PubMed
7. Velez CM, Nicolaidis C, Korthuis PT, Englander H. “It’s been an Experience, a Life Learning Experience”: A qualitative study of hospitalized patients with substance use disorders. J Gen Intern Med. 2017;32(3):296-303. http:// doi.org/10.1007/s11606-016-3919-4. PubMed
8. Wakeman SE, Pham-Kanter G, Donelan K. Attitudes, practices, and preparedness to care for patients with substance use disorder: Results from a survey of general internists. Subst Abus. 2016;37(4):635-641. http:// doi.org/10.1080/08897077.2016.1187240. PubMed
9. van Boekel LC, Brouwers EP, van Weeghel J, Garretsen HF. Stigma among health professionals towards patients with substance use disorders and its consequences for healthcare delivery: systematic review. Drug Alcohol Depend. 2013;131(1-2):23-35. http:// doi.org/10.1016/j.drugalcdep.2013.02.018 PubMed
10. Merrill JO, Rhodes LA, Deyo RA, Marlatt GA, Bradley KA. Mutual mistrust in the medical care of drug users: the keys to the “narc” cabinet. J Gen Intern Med. 2002;17(5):327-333. http:// doi.org/10.1046/j.1525-1497.2002.10625.x. PubMed
11. Brener L, Von Hippel W, Kippax S, Preacher KJ. The role of physician and nurse attitudes in the health care of injecting drug users. Subst Use Misuse. 2010;45(7-8):1007-1018. http:// doi.org/10.3109/10826081003659543. PubMed
12. Wakeman SE, Metlay JP, Chang Y, Herman GE, Rigotti NA. Inpatient addiction consultation for hospitalized patients increases post-discharge abstinence and reduces addiction severity. J Gen Intern Med. 2017;32(8):909-916. http:// doi.org/10.1007/s11606-017-4077-z. PubMed
13. Wei J, Defries T, Lozada M, Young N, Huen W, Tulsky J. An inpatient treatment and discharge planning protocol for alcohol dependence: efficacy in reducing 30-day readmissions and emergency department visits. J Gen Intern Med. 2015;30(3):365-370. http:// doi.org/10.1007/s11606-014-2968-9. PubMed
14. Liebschutz JM, Crooks D, Herman D, et al. Buprenorphine treatment for hospitalized, opioid-dependent patients: a randomized clinical trial. JAMA Intern Med. 2014;174(8):1369-1376. http:// doi.org/10.1001/jamainternmed.2014.2556. PubMed
15. Shanahan CW, Beers D, Alford DP, Brigandi E, Samet JH. A transitional opioid program to engage hospitalized drug users. J Gen Intern Med. 2010;25(8):803-808. http:// doi.org/10.1007/s11606-010-1311-3. PubMed
16. Parmelli E, Flodgren G, Beyer F, Baillie N, Schaafsma ME, Eccles MP. The effectiveness of strategies to change organisational culture to improve healthcare performance: a systematic review. Implement Sci. 2011;6(1):33. http:// doi.org/10.1186/1748-5908-6-33. PubMed
17. Englander H, Weimer M, Solotaroff R, et al. Planning and designing the improving addiction care team (IMPACT) for hospitalized adults with substance use disorder. J Hosp Med. 2017;12(5):339-342. http:// doi.org/10.12788/jhm.2736. PubMed
18. Lambert SD, Loiselle CG. Combining individual interviews and focus groups to enhance data richness. J Adv Nurs. 2008;62(2):228-237. http:// doi.org/10.1111/j.1365-2648.2007.04559.x. PubMed
19. Braun VC, Victoria. Using thematic analysis in psychology. Qual Res Psychol. 2006;3:25. http://dx.doi.org/10.1191/1478088706qp063oa.
20. Wakeman SE, Kanter GP, Donelan K. Institutional substance use disorder intervention improves general internist preparedness, attitudes, and clinical practice. J Addict Med. 2017;11(4):308-314. http:// doi.org/10.1097/ADM.0000000000000314. PubMed
21. Paterson B, Hirsch G, Andres K. Structural factors that promote stigmatization of drug users with hepatitis C in hospital emergency departments. Int J Drug Policy. 2013;24(5):471-478. http:// doi.org/10.1016/j.drugpo.2013.01.008 PubMed
22. Ross LE, Vigod S, Wishart J, et al. Barriers and facilitators to primary care for people with mental health and/or substance use issues: a qualitative study. BMC Fam Pract. 2015;16:135. http:// doi.org/10.1186/s12875-015-0353-3. PubMed
Substance use disorders (SUD) represent a national epidemic with death rates exceeding those of HIV at its peak.1 Hospitals are increasingly filled with people suffering from medical complications of addiction.2,3 While the US health system spends billions of dollars annually on hospital care for medical problems resulting from SUD,4 most hospitals lack expertise or care systems to directly address SUD or connect people to treatment after discharge. 5,6
Patients with SUD often feel stigmatized in healthcare settings and want providers who understand SUD and how to treat it.7 Providers feel underprepared8 and commonly have negative attitudes toward patients with SUD.9,10 Caring for patients can be a source of resentment, dissatisfaction, and burnout.9 Such negative attitudes can adversely affect patient care. Studies show that patients who perceive discrimination by providers are less likely to complete treatment11 and providers’ negative attitudes may disempower patients.9
Evaluations of hospital interventions for adults with SUD focus primarily on patient-level outcomes of SUD severity,12 healthcare utilization,13 and treatment engagement.14,15 Little is known about how such interventions can affect interprofessional providers’ attitudes and experiences, or how systems-level interventions influence hospital culture.16
We performed a qualitative study of multidisciplinary hospital providers to 1) understand the challenges that hospital providers face in managing care for patients with SUD, and 2) explore how integrating SUD treatment in a hospital setting affects providers’ attitudes, experiences, and perceptions of the care environment. This study was part of a formative evaluation of the Improving Addiction Care Team (IMPACT). IMPACT includes a hospital-based, interprofessional addiction medicine consultation service and rapid-access pathways to community addiction care after hospitalization.17. IMPACT is an intensive intervention that includes SUD assessments, withdrawal management, medications for addiction (eg, methadone, buprenorphine induction), counseling and behavioral SUD treatment, peer engagement and support, and linkages to community-based addiction care. We described the rationale and design of IMPACT in earlier publications.7,17
METHODS
Setting
We conducted in-person interviews and focus groups (FGs) with interprofessional hospital providers at a single urban academic medical center between February and July 2016, six months after starting IMPACT implementation. Oregon Health and Science University’s (OHSU) institutional review board approved the protocol.
Participants
We conducted 12 individual informant interviews (IIs) and 6 (FGs) (each comprising 3-6 participants) with a wide range of providers, including physicians, nurses, social workers, residents, patient advocates, case managers, and pharmacists. In total, 34 providers participated. We used purposive sampling to choose participants with experience both caring for patients with SUD and with exposure to IMPACT. Participant characteristics are summarized in Table 1.
Data Collection
We employed 2 different types of interviews. In situations where multiple providers occupied a similar role (eg, social workers), we chose to use a focus group format to elicit a range of perspectives and experiences through participant interaction.18 We conducted individual interviews to gain input from key informants who had unique roles in the program (eg, a cardiac surgeon) and to include providers who would otherwise be unable to participate due to scheduling barriers (eg, residents). We interviewed all participants using a semi-structured interview guide that was developed by an interdisciplinary team, including expert qualitative researchers, IMPACT clinical team members, and other OHSU clinicians (Appendix A). An interviewer who was not a part of the IMPACT clinical team asked all participants about their experience caring for patients with SUD, their experience with IMPACT, and how they might improve care. FGs lasted between 41-57 minutes, and individual key informant interviews lasted between 11-38 minutes. We ended recruitment after reaching theme saturation. Our goal was to achieve saturation across the sample as a whole and not within distinct participant groups. We noted if certain themes were more salient for 1 particular group. We audio-recorded all interviews and FGs. Recordings were transcribed, de-identified, and transferred to ATLAS.ti for data analysis.
Analysis
We conducted a thematic analysis using an inductive approach at the semantic level.19 Using an iterative process, we generated a preliminary coding schema after reviewing an initial selection of transcripts. Coders then independently coded transcripts and met in dyads to both discuss and reconcile codes, and resolve any discrepancies through discussion until reaching a consensus. One coder (DC) coded all transcripts; 3 coders (EP, SPP, MR) divided the transcripts evenly. All authors met periodically to discuss codebook revisions and emergent themes. We identified themes that represented patterns, had meaning to study participants, and captured important findings related to our research questions.19
As expected, the style of IIs differed from that of FGs and informants were able to provide information specific to their roles. Overall, the information provided by IIs was complementary to that of FGs and helped triangulate findings. Thus, we combined them in the results.18
RESULTS
We organized our findings into 3 main groupings, including (1) care before IMPACT, (2) care with IMPACT, and (3) perceived limitations of IMPACT. We included a table (Table 2) with additional quotations, beyond those in the body of the results, to support emergent themes described below.
Care before IMPACT
Providers felt hospitalization did not address addiction for many reasons, including ethical and legal concerns, medical knowledge gaps, and lack of treatment options.
Before IMPACT, many participants noted that hospitalization ignored or avoided addressing addiction, leading to a chaotic care environment that adversely affected patient care and provider experience. As one social worker stated, “prior to IMPACT we provided assessments, and we provided resources. But we didn’t address addiction.”
Providers cited multiple explanations for this, including the common misperception that using methadone to treat withdrawal violated federal regulations, and concerns about the ethicality of using opioids in patients with SUD. Across disciplines, providers described a “huge knowledge gap” and little confidence in addressing withdrawal, complex chronic pain, medications for addiction, and challenging patient behaviors. Providers also described limited expertise and scarce treatment options as a deterrent. As one attending reflected, “I would ask those questions [about SUD] before, but then … I had the information, but I couldn’t do anything with it.”
Providers felt the failure to address SUD adversely affected patient care, leading to untreated withdrawal, disruptive behaviors, and patients leaving against medical advice (AMA).
Participants across disciplines described wide variability in the medical management of SUD, particularly around the management of opioid withdrawal and pain, with some providers who “simply wouldn’t prescribe methadone or any opiates” and others who prescribed high doses without anticipating risks. As one attending recalled:
“You would see this pattern, especially in the intravenous drug-using population: left AMA, left AMA, left AMA … nine times out of ten, nobody was dealing with the fact that they were gonna go into withdrawal.”
Respondents recalled that disruptive behaviors from patients’ active use or withdrawal frequently threatened safety; imposed a tremendous burden on staff time and morale; and were a consistent source of providers’ distress. As one patient advocate explained:
“[Providers] get called to the unit because the person is yelling and throwing things or comes back after being gone for a long period and appears impaired … it often blows up, and they get discharged or they leave against medical advice or they go out and don’t come back. We don’t really know what happened to them, and they’re vulnerable. And the staff are vulnerable. And other patients are distressed by the disruption and commotion.”
Absent standards and systems to address SUD, providers felt they were “left to their own,” resulting in a reactive and chaotic care environment.
Providers noted inconsistent rules and policies regarding smoke breaks, room searches, and visitors. As a result, care felt “reckless and risky” and led to a “nonalliance” across disciplines. Providers frequently described inconsistent and loose expectations until an event -- often active use – triggered an ad hoc ratcheting up of the rules, damaging patient-provider relationships and limiting providers’ ability to provide medical care. Facing these conflicts, “staff gets escalated, and everybody gets kind of spun up.” As one attending reflected:
“I could not get any sort of engagement even in just her medical issues … I was trying to talk to her and educate her about heart failure and salt intake and food intake, but every time I walked in the room … I’d have to come in and be like, ‘your UDS [urine drug screen] was positive again, so here’s the changes to your behavioral plan, and OK, let’s talk about your heart failure …’ At that point, the relationship had completely disintegrated until it was very nonproductive.”
Providers described widespread “moral distress,” burnout, and feelings of futility before IMPACT.
Consequently, providers felt that caring for people with SUD was “very emotionally draining and very time consuming.” As one patient advocate described:
“We’ve been watching staff try to manage these patients for years without the experts and the resources and the skills that they need … As a result, there was a crescendo effect of moral distress, and [staff] bring in all of their past experiences which influence the interaction … Some staff are very skilled, but you also saw some really punitive responses.”
Many felt that providing intensive medical care without addressing people’s underlying SUD was a waste of time and resources. As one cardiac surgeon reflected:
“[Patients] ended up either dead or reinfected. Nobody wanted to do stuff because we felt it was futile. Well, of course, it’s futile …. you’re basically trying to fix the symptoms. It’s like having a leaky roof and just running around with a bunch of buckets, which is like surgery. You gotta fix the roof…otherwise they will continue to inject bacteria into their bodies.”
Care with IMPACT:
Providers felt integrating hospital-based systems to address SUD legitimized addiction as a treatable disease.
Participants described IMPACT as a “sea change” that “completely reframes” addiction as “a medical condition that actually has a treatment.” As one social worker observed, “when it’s somebody in a white coat with expertise who’s talking to another doctor it really can shift mindsets in an amazing way.” Others echoed this, stating that an addiction team “legitimized the fact that this is an actual disease that we need to treat - and a failure to treat it is a failure to be a good doctor.”
Providers felt that by addressing addiction directly, “IMPACT elevated the consciousness of providers and nurses … that substance use disorders are brain disorders and not bad behavior.” They described that this legitimization, combined with seeing firsthand the stabilizing effects of medications for addiction, allowed providers to understand SUD as a chronic disease, and not a moral failing.
Providers felt IMPACT improved patient engagement and humanized care by treating withdrawal, directly communicating about SUD, and modeling compassionate care.
Providers noted that treating withdrawal had a dramatic effect on patient engagement and care. One surgeon explained, “by managing their opioid dependence and other substance abuse issues … it’s easier for the staff to take care of them, it’s safer, and the patients feel better taken care of because the staff will engage with them.” Many noted that conflict-ridden “conversations were able to go to the side, and we were able to talk about other things to build rapport.” Others noted that this shift felt like “more productive time.”
In addition, providers repeatedly emphasized that having clear hospital standards and a process to engage patients “really helps … establish rapport with patients: ‘This is how we work this. These are your boundaries. And this is what will happen if you push those boundaries.’ There it is.” Providers attributed improved patient-provider communication to “frank conversation,” “the right amount of empathy,” and a less judgmental environment. As one attending described, “I don’t know if it gives them a voice or allows us to hear them better … but something’s happening with communication.”
Many participants highlighted that IMPACT modeled compassionate bedside interactions, exposed the role of trauma in many patients’ lives, and helped providers see SUD as a disease spectrum. One attending noted that to “actually appreciate the subtleties – just the severity of the disorder – has been powerful.” One resident said:
“There’s definitely a lot of stigma around patients with use disorders that probably shows itself in subtle ways throughout their hospitalization. I think IMPACT does a good job … keeping the patient in the center and keeping their use disorder contextualized in the greater person … [IMPACT] role models bedside interactions and how to treat people like humans.”
Providers valued post-hospital SUD treatment pathways.
Providers valued previously nonexistent post-hospital SUD treatment pathways, stating “this relationship with [community treatment] … it’s like an answer to prayers,” and “this isn’t just like we’re being nicer.” One attending described:
“Starting them on [methadone or buprenorphine-naloxone] and then making the next step in the outpatient world happen has been huge. That transition is so critical … that’s been probably the biggest impact.”
Providers felt relief after IMPACT implementation.
Providers felt that by addressing SUD treatment gaps and providing addiction expertise, IMPACT helped alleviate the previously widespread feelings of “moral distress.” One resident explained “having [IMPACT] as a lifeline, it just feels so good.” As an infectious disease consultant noted, “it makes people more open to treating people if they don’t feel isolated and out of their depth.” Others noted that IMPACT supported better multidisciplinary collaboration, which “reduced a lot of tension between the teams.” One nurse summarized:
“I think you feel more empowered when you’ve got the right medication, … the knowledge, and you feel like you have the resources. You actually feel like you’re making a difference.”
Respondents acknowledged that even with IMPACT, some patients leave AMA or relapse. However, by understanding addiction as a relapsing and remitting disease, providers reconceptualized “success,” further reducing feelings of emotional burnout and stress: “there will be ups and downs, it’s not gonna be a straight linear success.” One case manager reflected,
“Maybe that’s part of the nature of the illness, you progress, and then you kind of hold your breath and then it slips again … at least with IMPACT at the table I can say we’ve done the best we can for this person.”
Perceived limitations of IMPACT:
Providers noted several key limitations of IMPACT, including that hospital-based interventions do not address poverty and have limited ability to address socioeconomic determinants such as “social support, … housing, or nutrition.” Providers also felt that IMPACT had limited ability to alleviate patients’ feelings of boredom and isolation associated with prolonged hospitalization, and that IMPACT had limited effectiveness for highly ambivalent patients (Table 2).
Finally, while many described increased confidence managing SUD after working with IMPACT, others cautioned against deferring too much to specialists. As one resident doctor said:
“We shouldn’t forget that all providers should know how to handle some form of people with addiction … I just don’t want it to be like, ‘oh, well, no, I don’t need to think about this … because we have an addiction specialist.’”
Participants across disciplines repeatedly suggested formal, ongoing initiatives to educate and train providers to manage SUD independently.
DISCUSSION
This study explores provider perspectives on care for hospitalized adults with SUD. Before IMPACT, providers felt care was chaotic, unsafe, and frustrating. Providers perceived variable care quality, resulting in untreated withdrawal, inconsistent care plans, and poor patient outcomes, leading to widespread “moral distress” and feelings of futility among providers. Yet this experience was not inevitable. Providers described that a hospital-based intervention to treat SUD reframed addiction as a treatable chronic disease, transformed culture, and improved patient care and provider experience.
Our findings are consistent with and build on previous research in several ways. First, widespread anxiety and difficulty managing patients with SUD was not unique to our hospital. In a systematic review, van Boekel and colleagues describe that healthcare providers perceived violence, manipulation, and poor motivation as factors impeding care for patients with SUD.9 Our study demonstrates the resulting feelings of powerlessness and frustration may be alleviated through an intervention that provides SUD care.
Second, our study is consistent with a recent survey-based study by Wakeman and colleagues that found that a hospital-based SUD intervention improved providers’ feelings of preparedness and satisfaction.20 Our study provides a rich qualitative description and elucidates mechanisms by which such interventions may work.
The finding that a hospital-based SUD intervention can shift providers’ views of addiction is important. Earlier studies have shown that providers who perceive addiction as a choice are more likely to have negative attitudes toward people with SUD.11 While our intervention did not provide formal education aimed at changing attitudes, participants reported that seeing firsthand effects of treatment on patient behaviors was a powerful tool that radically shifted providers’ understanding and reduced stigma.
Stigma can occur at both individual and organizational levels. Structural stigma refers to practices, policies, and norms of institutions that exclude needs of a particular group.21 The absence of systems to address SUD sends a message to both patients and providers that addiction is a not a treatable or worthy disease. IMPACT was in and of itself a systems-level intervention; by creating a consultation service, hospital-wide policies, and pathways to care after hospitalization, IMPACT ‘legitimized’ SUD and reduced institutional stigma.
Several studies have shown the feasibility and effectiveness of starting medications for addiction (MAT) in the hospital.13-15 Our study builds on this work by highlighting systems-level elements valued by providers. These elements may be important to support and scale widespread adoption of MAT in hospitals. Specifically, providers felt that IMPACT’s attention to hospital policies, use of addiction medicine specialists, and direct linkages to outpatient SUD treatment proved instrumental in shifting care systems.
Our study has several limitations. As a single-site study, our goal was not generalizability, but transferability. As such, we aimed to obtain rich, in-depth information that can inform implementation of similar efforts. Because our study was conducted after the implementation of IMPACT, providers’ perspectives on care before IMPACT may have been influenced by the intervention. However, this also strengthens our findings by allowing participants the opportunity for insights under a different system. It likely leads to distinct findings compared to what we might have uncovered in a pre-post study. While respondents noted perceived limitations of IMPACT, there were few instances of negative remarks in the data we collected. It is possible that providers with more negative interpretations chose not to participate in interviews; however, we elicited wide viewpoints and encouraged participants to share both strengths and weaknesses. Finally, IMPACT implementation depends on regional as well as local factors such as Medicaid expansion, community treatment resources, and the existence of addiction medicine expertise that will differ across settings.
Despite these limitations, our study has several important implications. For clinical practice, our findings highlight the importance of treating withdrawal to address challenging patient behaviors and the value of integrating MAT into the hospital setting. Our findings also underscore the role of expert consultation for addiction. Importantly, our results emphasize that reframing SUD as a brain disease can have significant implications for clinical care and providers’ well-being. Provider distress is not inevitable and can change with the right support and systems.
At the hospital and health systems level, our findings suggest that hospitals can and should address SUD. This may include forming interprofessional teams with SUD expertise, providing standardized guidelines for addiction care such as patient safety plans and methadone policies, and creating rapid-access pathways to outpatient SUD care. By addressing SUD, hospitals may simultaneously improve care and reduce provider burnout. Providers’ important concerns about shifting SUD treatment to a specialty team and their discomfort managing SUD pre-IMPACT suggest the need to integrate SUD education across all levels of interprofessional education. Furthermore, provider concerns that IMPACT has limited ability to engage ambivalent patients underscores the need for hospital-based approaches that emphasize harm reduction strategies.
As the SUD epidemic worsens, SUD-related hospitalizations are skyrocketing, and people are dying at unprecedented rates.2,3 Many efforts to address SUD have been in primary care or community settings. While important, many people with SUD are unable or unlikely to seek primary care. 22 Hospitals need a workforce and systems that can address both the physical and behavioral health needs of this population. By implementing SUD improvements, hospitals can support staff and reduce burnout, better engage patients, improve care, and reduce stigma from this devastating disease
Disclosures
The authors have no conflicts of interest to disclose.
1. Rossen L, Bastian B, Warner M, Khan D, Chong Y. Drug poisoning mortality: United States, 1999-2015. 2017; https://www.cdc.gov/nchs/data-visualization/drug-poisoning-mortality/. Accessed 7-11, 2017.
2. Tedesco D, Asch SM, Curtin C, et al. Opioid abuse and poisoning: trends in inpatient and emergency department discharges. Health Aff (Millwood). 2017;36(10):1748-1753. http:// doi.org/10.1377/hlthaff.2017.0260. PubMed
3. Weiss AJ, Elixhauser A, Barrett ML, Steiner CA, Bailey MK, O’Malley L. Statistical Brief #219: Opioid-Related Inpatient Stays and Emergency Department Visits by State, 2009-2014. 2017; https://hcup-us.ahrq.gov/reports/statbriefs/sb219-Opioid-Hospital-Stays-ED-Visits-by-State.jsp?utm_source=AHRQ&utm_medium=EN-2&utm_term=&utm_content=2&utm_campaign=AHRQ_EN12_20_2016. Accessed July 11, 2017. PubMed
4. Ronan MV, Herzig SJ. Hospitalizations related to opioid abuse/dependence and associated serious infections increased sharply, 2002-12. Health Aff (Millwood). 2016;35(5):832-837. http:// doi.org/10.1377/hlthaff.2015.1424. PubMed
5. Infectious Diseases Society of America Emerging Infections Network. Report for Query: ‘Injection Drug Use (IDU) and Infectious Disease Practice’. 2017; https://www.int-med.uiowa.edu/Research/EIN/FinalReport_IDUandID.pdf. Accessed July 11, 2017.
6. Rosenthal ES, Karchmer AW, Theisen-Toupal J, Castillo RA, Rowley CF. Suboptimal addiction interventions for patients hospitalized with injection drug use-associated infective endocarditis. Am J Med. 2016;129(5):481-485. http:// doi.org/10.1016/j.amjmed.2015.09.024. PubMed
7. Velez CM, Nicolaidis C, Korthuis PT, Englander H. “It’s been an Experience, a Life Learning Experience”: A qualitative study of hospitalized patients with substance use disorders. J Gen Intern Med. 2017;32(3):296-303. http:// doi.org/10.1007/s11606-016-3919-4. PubMed
8. Wakeman SE, Pham-Kanter G, Donelan K. Attitudes, practices, and preparedness to care for patients with substance use disorder: Results from a survey of general internists. Subst Abus. 2016;37(4):635-641. http:// doi.org/10.1080/08897077.2016.1187240. PubMed
9. van Boekel LC, Brouwers EP, van Weeghel J, Garretsen HF. Stigma among health professionals towards patients with substance use disorders and its consequences for healthcare delivery: systematic review. Drug Alcohol Depend. 2013;131(1-2):23-35. http:// doi.org/10.1016/j.drugalcdep.2013.02.018 PubMed
10. Merrill JO, Rhodes LA, Deyo RA, Marlatt GA, Bradley KA. Mutual mistrust in the medical care of drug users: the keys to the “narc” cabinet. J Gen Intern Med. 2002;17(5):327-333. http:// doi.org/10.1046/j.1525-1497.2002.10625.x. PubMed
11. Brener L, Von Hippel W, Kippax S, Preacher KJ. The role of physician and nurse attitudes in the health care of injecting drug users. Subst Use Misuse. 2010;45(7-8):1007-1018. http:// doi.org/10.3109/10826081003659543. PubMed
12. Wakeman SE, Metlay JP, Chang Y, Herman GE, Rigotti NA. Inpatient addiction consultation for hospitalized patients increases post-discharge abstinence and reduces addiction severity. J Gen Intern Med. 2017;32(8):909-916. http:// doi.org/10.1007/s11606-017-4077-z. PubMed
13. Wei J, Defries T, Lozada M, Young N, Huen W, Tulsky J. An inpatient treatment and discharge planning protocol for alcohol dependence: efficacy in reducing 30-day readmissions and emergency department visits. J Gen Intern Med. 2015;30(3):365-370. http:// doi.org/10.1007/s11606-014-2968-9. PubMed
14. Liebschutz JM, Crooks D, Herman D, et al. Buprenorphine treatment for hospitalized, opioid-dependent patients: a randomized clinical trial. JAMA Intern Med. 2014;174(8):1369-1376. http:// doi.org/10.1001/jamainternmed.2014.2556. PubMed
15. Shanahan CW, Beers D, Alford DP, Brigandi E, Samet JH. A transitional opioid program to engage hospitalized drug users. J Gen Intern Med. 2010;25(8):803-808. http:// doi.org/10.1007/s11606-010-1311-3. PubMed
16. Parmelli E, Flodgren G, Beyer F, Baillie N, Schaafsma ME, Eccles MP. The effectiveness of strategies to change organisational culture to improve healthcare performance: a systematic review. Implement Sci. 2011;6(1):33. http:// doi.org/10.1186/1748-5908-6-33. PubMed
17. Englander H, Weimer M, Solotaroff R, et al. Planning and designing the improving addiction care team (IMPACT) for hospitalized adults with substance use disorder. J Hosp Med. 2017;12(5):339-342. http:// doi.org/10.12788/jhm.2736. PubMed
18. Lambert SD, Loiselle CG. Combining individual interviews and focus groups to enhance data richness. J Adv Nurs. 2008;62(2):228-237. http:// doi.org/10.1111/j.1365-2648.2007.04559.x. PubMed
19. Braun VC, Victoria. Using thematic analysis in psychology. Qual Res Psychol. 2006;3:25. http://dx.doi.org/10.1191/1478088706qp063oa.
20. Wakeman SE, Kanter GP, Donelan K. Institutional substance use disorder intervention improves general internist preparedness, attitudes, and clinical practice. J Addict Med. 2017;11(4):308-314. http:// doi.org/10.1097/ADM.0000000000000314. PubMed
21. Paterson B, Hirsch G, Andres K. Structural factors that promote stigmatization of drug users with hepatitis C in hospital emergency departments. Int J Drug Policy. 2013;24(5):471-478. http:// doi.org/10.1016/j.drugpo.2013.01.008 PubMed
22. Ross LE, Vigod S, Wishart J, et al. Barriers and facilitators to primary care for people with mental health and/or substance use issues: a qualitative study. BMC Fam Pract. 2015;16:135. http:// doi.org/10.1186/s12875-015-0353-3. PubMed
© 2018 Society of Hospital Medicine
Obstructive sleep apnea: A better Dx model for primary care
ABSTRACT
Purpose To derive a predictive model for obstructive sleep apnea (OSA) in primary care practice, using home-based overnight oximetry results to refine posttest probability (PTP) of disease after initial risk stratification with the Sleep Apnea Clinical Score (SACS).
Methods We performed secondary analyses on data from a SACS validation cohort, to compare the diagnostic accuracy of 3 overnight oximetry measurements (oxygen desaturation index [ODI], mean saturation, and minimum saturation) in predicting OSA. Receiver operator characteristics (ROC) were computed for each measurement independently and sequentially after risk stratifying with SACS. We examined the implications of oximetry results for OSA PTP for participants categorized as intermediate risk (SACS 6-14; 66/191 participants [35%]; OSA probability 41%). We calculated positive likelihood ratios (LR) for multiple ODI results and determined which ones allowed recalibration to high- or low-risk PTP.
Results Among the 3 oximetry findings, ODI best predicted OSA (area under the curve [AUC], 0.88; 95% confidence interval [CI], 0.83-0.93). An ODI ≥8.4 (likelihood ratio [LR], 4.19; 95% CI, 2.87-6.10) created a PTP of 77%, while an ODI of 0 to <8.4 (LR, 0.19, 95% CI, 0.12-0.33) created a 14% PTP. Sequential application of SACS and ODI results yielded an AUC result of 0.90 (95% CI, 0.85-0.95).
Conclusions SACS risk stratification provides an advantage over clinical gestalt. In those at intermediate risk, ODI results provide a simple and clinically useful way to further refine diagnostic prediction. Sequential use of SACS and selectively employed overnight oximetry may limit unnecessary polysomnography. Oximetry testing should be avoided in patients deemed low or high risk by SACS, as positive results do not substantially recalibrate risk.
Obstructive sleep apnea (OSA) is a prevalent and underdiagnosed condition. The National Sleep Foundation estimates that 18 million Americans have OSA.1 Primary care practice may be the best setting in which to identify OSA, as many of our patients have conditions frequently associated with apnea (eg, hypertension, obesity, diabetes, arrhythmia, and neurologic illness). Up to a third of patients in primary care practice may be at increased risk.2,3
Clinical guidelines of the American Academy of Sleep Medicine (AASM) recommend obtaining a sleep history to evaluate for possible OSA in 3 instances: as part of a routine health maintenance examination, during evaluation of specific complaints associated with OSA (eg, snoring, apnea, daytime sleepiness), and during comprehensive evaluations for individuals with high-risk conditions (ie, obesity, congestive heart failure, refractory hypertension, diabetes, stroke history).4
The American College of Physicians (ACP) Clinical Practice Guideline suggests assessing individuals who have unexplained daytime sleepiness.5 The ACP considers this assessment “High-Value Care,” as “evidence shows that before diagnosis, patients with OSA have higher rates of health care use, more frequent and longer hospital stays, and higher health care costs than after diagnosis.”5
Continue to: We recently validated the diagnostic accuracy...
We recently validated the diagnostic accuracy of the Sleep Apnea Clinical Score (SACS) for use in a primary care patient population suspected of having OSA.6 SACS uses historical and clinical data to derive a score that identifies a patient’s risk level.7 However, as an alternative to the 2 levels described in Flemons’ SACS,7 we propose creating 3 risk strata (FIGURE 17,8). We believe that patients at high risk (SACS ≥15) should be encouraged to undergo sleep evaluations as their posttest probability (PTP) of OSA is 75% to 80%. Individuals at low risk (SACS ≤5; PTP <20%) could receive lifestyle advice and simple clinical interventions that decrease symptoms (eg, weight loss, increased physical activity, sleeping on one’s side). For low-risk patients, clinical observation and reevaluation could take place over time with their primary care provider, without additional testing or referral to specialists.

What about patients at intermediate risk? Many patients suspected of having OSA will be assigned to intermediate risk (SACS 6-14), and their PTP of OSA remains at 40% to 45%, the pre-test level most commonly encountered in suspected OSA. As polysomnography is a limited and expensive clinical resource, intermediate-risk patients would benefit from recalibration of their SACS-based risk assessment using an additional surrogate test such as home-based overnight oximetry. Our internal OSA practice guidelines recommend referral for sleep medicine consultation when oximetry results are abnormal—specifically, an oxygen desaturation index (ODI) of ≥5, a mean saturation less than 89%, and a minimum saturation of 75% or less.
Our objectives in this study were to compare the diagnostic implications of these 3 measurements from home-based overnight oximetry reports and use the most relevant result to derive a predictive model further refining PTP of OSA in a primary care patient population first stratified to intermediate risk by SACS.
METHODS
Subjects
We performed secondary analyses on data obtained from our SACS validation cohort.6 In brief, these were patients suspected of having OSA based on the presence of signs, symptoms, or associated risk factors. One hundred ninety-one patients completed all assessments. Sixty-six of 191 patients (35%) were categorized as intermediate risk (SACS 6-14; OSA probability 41% [27/66]).
Data collection and analyses
Participants completed home-based overnight oximetry using Nonin Model 2500 oximeters (Nonin Medical Inc., Plymouth, Minn). We transferred oximetry results from the sleep lab database to a statistical program for analyses of ODI, mean saturation, and minimal saturation. ODI was defined as the number of 4% drops in saturation from baseline divided by the number of hours of recording time. Although the AASM states that a diagnosis of OSA is confirmed if the number of obstructive events is more than 15 per hour or more than 5 per hour in a patient who reports related symptoms,4 we defined OSA as an apnea-hypopnea index (AHI) of >10 based on polysomnography (as this was the threshold used in the derivation cohort for SACS).7 We demonstrated the predictive ability of SACS at various AHI definitions of OSA in our validation cohort.6 The use of SACS in our validation cohort showed a statistically similar ability to predict OSA at both an AHI of 10 and 20, compared with the derivation cohort.
Continue to: We entered additional information...
We entered additional information reported directly by patients and obtained from their sleep studies into a REDCap database and transferred that to our statistical program. We used descriptive statistics to determine ranges and central tendencies of oximetry results. Receiver operator characteristic (ROC) analyses described the predictive abilities for each oximetry result individually and in serial application with prior SACS determinations. For comparison, we used the area under the ROC curve (AUC) from logistic regression to model the probability of OSA.
We calculated positive likelihood ratios (LR) and 95% confidence intervals (CI) to determine the degree of oximetry abnormality that would recalibrate risk either to a high PTP of OSA (>75%) or a low PTP (<25%). We sorted intermediate-risk SACS scores into quintiles based on ODI results to compare the resulting PTPs of OSA. We applied the PTP of OSA from our previous work (using the SACS score to compute the LR) as the new PTP, estimated the LR based on ODI, and computed an updated PTP of OSA. We also used ROC analysis to determine the optimal cutoff value of the ODI.
Finally, in accordance with our internal clinical practice recommendations, we examined the predictive ability of a “positive” ODI result of ≥5 to recalibrate risk prediction for OSA for patients in the low-risk group. We performed analyses using SAS 9.4 (SAS Institute, Cary, NC).
RESULTS

One hundred ninety-one subjects completed assessments. The median and quartile results for ODI, mean saturation, and minimum saturation are found in TABLE 1. TABLE 2 shows the distribution of patients with positive oximetry results. An ODI of 5 or greater was the most frequent abnormal result (135/191; 70.7%).

We used the AUC to measure the comparative abilities of SACS and the 3 overnight oximetry results in predicting OSA (TABLE 3). ODI results demonstrated the best ability to predict OSA, compared with polysomnography as the relative gold standard (AUC, 0.88; 95% confidence interval [CI], 0.83-0.93). Serial application of SACS and ODI yielded even better diagnostic results (AUC, 0.90; 95% CI, 0.85-0.95).

Continue to: As ODI was found to be the strongest predictor of OSA...
As ODI was found to be the strongest predictor of OSA, we grouped these results in quintiles and calculated positive LRs. TABLE 4 shows their effect on PTP of disease among patients with intermediate risk. An ODI result >10 effected an upward recalibration of disease probability (LR, 2.33; 95% CI, 1.27-4.26). The optimal cutoff of ODI to discriminate between those with and without OSA was determined by ROC analysis. An ODI greater than 8.4 created a PTP of disease of approximately 73% to 77%.

Our internal clinical guidelines recommend referring patients with an ODI of 5 or greater for sleep medicine consultation. We examined the ability of this ODI result to recalibrate disease suspicion for a patient at low risk (SACS ≤5). The LR for ODI of 5 or greater is 2.1, but this only results in a recalibration of risk from 24% pretest probability in our validation cohort to 41% PTP (95% CI, 33-49). This low cutoff for a positive test creates false-positive results more than 40% of the time due to low specificity (0.58). This is insufficient to change the suspicion of disease, resulting only in a shift to intermediate OSA risk.
DISCUSSION
Among 3 different oximetry measurements, an ODI ≥10 best predicts OSA, both independently and when used sequentially after the SACS. ODI was by far the most frequent abnormality on oximetry in our cohort, thereby increasing its utility in clinical decision making. For those subjects at intermediate risk, a cutoff of 10 for the ODI result may be a simple and clinically effective way to recalibrate risk and aid in making referral decisions. (This may also be simpler and more easily remembered by clinicians than the 8.4 ODI results from the ROC analyses.)
Assessment is inadequate without a clinical prediction rule. Unfortunately, providers cannot simply rely on clinical gestalt in diagnosing OSA. In their derivation cohort, Flemens et al examined the LRs created by SACS and by clinician prediction based on history and physical exam.7 The SACS LRs ranged from 5.17 to 0.25, a 20-fold range. This reflected superior diagnostic information compared with subjective physician impression, where LRs ranged from 3.7 to 0.52, a seven-fold range. Myers et al prepared a meta-analysis of 4 different trials that examined physicians’ ability to predict OSA.9 Despite the researchers’ use of experienced sleep medicine doctors, the overall diagnostic accuracy of clinical impression was modest (summary positive LR, 1.7; 95% CI, 1.5-2; I2 = 0%; summary negative LR, 0.67; 95% CI, 0.60-0.74; I2 = 10%; sensitivity, 58%; specificity, 67%). This is similar to reliance on a single clinical sign or symptom to predict OSA.
Wise use of oximetry augments SACS calculation. To limit unnecessary oximetry testing in low- and high-risk groups and to avoid polysomnography in cases of a low PTP of disease, we advocate limiting oximetry testing to individuals in the SACS intermediate-risk group (FIGURE 2) wherein ODI results can potentially recalibrate risk assessment up or down. (Those in the high- risk group should be referred to a sleep medicine specialist.) Our institutional recommendation of using an ODI result of ≥5 as a threshold to increase suspicion of disease requires a caveat for the low-risk group. “Positive” results at that low diagnostic threshold are frequently false.

Continue to: Multiple benefits of SACS
Multiple benefits of SACS. We believe using the SACS calculation during clinical encounters with patients potentially at risk for OSA would increase diagnostic accuracy. Performing risk stratification with SACS should not be an undue burden on providers, and the increased time spent with patients has its own benefits, including helping them better understand their risk. Using this standardized process—augmented, as needed, with overnight ODI assessment—might also encourage more patients to follow through on subsequent recommendations, as their risk is further quantified objectively. Lastly, unnecessary testing with polysomnography could be avoided.
Limitations of our study. This study’s findings were derived from a patient population in a single institution. Replication of the findings from other settings would be helpful.
Looking forward. It is yet unclear if clinicians will embrace these strategies in real-world primary care practice. We have designed an implementation-and-dissemination trial to assess whether family physicians will use the SACS clinical predication rule in everyday practice and whether our evidence-based recommendations about overnight oximetry will be followed. Underlying our suggested clinical evaluation pathway (FIGURE 2) is the belief that there is value gained from sharing the decision-making process with patients. Although we provide new evidence that informs these conversations, the patient’s values and preferences are important when determining the best direction to proceed in the evaluation for suspected OSA. These recommendations are intended to aid, not replace, good clinical judgment.
Home-based sleep testing has become more widely available, is convenient for patients, and is less expensive than lab-based polysomnography. Our study did not directly address the appropriate circumstances for home studies in clinical evaluation. We rely on the expertise of our sleep medicine colleagues to determine which patients are appropriate candidates for home-based studies.
The AASM states that “portable monitors (PM) for the diagnosis of OSA should be [used] only in conjunction with a comprehensive sleep evaluation. Clinical sleep evaluations using PM must be supervised by a practitioner with board certification in sleep medicine or an individual who fulfills the eligibility criteria for the sleep medicine certification examination.”4 Additionally, the group recommends that PM “may be used in the unattended setting as an alternative to polysomnography for the diagnosis of OSA in patients with a high pretest probability of moderate to severe OSA and no comorbid sleep disorder or major comorbid medical disorders.”4
Continue to: GRANT SUPPORT
GRANT SUPPORT
The use of the REDCap database is supported by grant UL1 TR000135. This work was supported by a Mayo Foundation CR-20 grant awarded to Dr. Mookadam as Principal investigator and Dr. Grover as Coinvestigator.
Statistical analyses were supported, in part, by the Department of Family Medicine, Mayo Clinic, Scottsdale, Ariz.
CORRESPONDENCE
Michael Grover, DO, Mayo Clinic Thunderbird Primary Care Center-Family Medicine, 13737 N 92nd Street, Scottsdale, AZ 85260; [email protected]
1. National Sleep Foundation. Sleep apnea. https://sleepfoundation.org/sleep-disorders-problems/sleep-apnea. Accessed September 14, 2018.
2. Grover M, Mookadam M, Armas D, et al. Identifying patients at risk for obstructive sleep apnea in a primary care practice. J Am Board Fam Med. 2011;24:152-160.
3. Mold JW, Quattlebaum C, Schinnerer E, et al. Identification by primary care clinicians of patients with obstructive sleep apnea: a practice-based research network (PBRN) study. J Am Board Fam Med. 2011;24:138-145.
4. Epstein LJ, Kristo D, Strollo PJ, Jr., et al; Adult Obstructive Sleep Apnea Task Force of the American Academy of Sleep Medicine. Clinical guideline for the evaluation, management and long-term care of obstructive sleep apnea in adults. J Clin Sleep Med. 2009;5:263-276.
5. Qaseem A, Dallas P, Owens DK, et al. Diagnosis of obstructive sleep apnea in adults: a clinical practice guideline from the American College of Physicians. Ann Intern Med. 2014;161:210-220.
6. Grover M, Mookadam M, Chang Y-H, et al. Validating the Sleep Apnea Clinical Score for use in primary care populations. Mayo Clin Proc. 2016;91:469-476.
7. Flemons WW, Whitelaw WA, Brant R, et al. Likelihood ratios for a sleep apnea clinical prediction rule. Am J Respir Crit Care Med. 1994;150:1279-1285.
8. Gali B, Whalen FX, Gay PC, et al. Management plan to reduce risks in perioperative care of patients with presumed obstructive sleep apnea syndrome. J Clin Sleep Med. 2007;3:582-588.
9. Myers KA, Mrkobrada M, Simel DL. Does this patient have obstructive sleep apnea?: The rational clinical examination systematic review. JAMA. 2013;310(7):731-741.
ABSTRACT
Purpose To derive a predictive model for obstructive sleep apnea (OSA) in primary care practice, using home-based overnight oximetry results to refine posttest probability (PTP) of disease after initial risk stratification with the Sleep Apnea Clinical Score (SACS).
Methods We performed secondary analyses on data from a SACS validation cohort, to compare the diagnostic accuracy of 3 overnight oximetry measurements (oxygen desaturation index [ODI], mean saturation, and minimum saturation) in predicting OSA. Receiver operator characteristics (ROC) were computed for each measurement independently and sequentially after risk stratifying with SACS. We examined the implications of oximetry results for OSA PTP for participants categorized as intermediate risk (SACS 6-14; 66/191 participants [35%]; OSA probability 41%). We calculated positive likelihood ratios (LR) for multiple ODI results and determined which ones allowed recalibration to high- or low-risk PTP.
Results Among the 3 oximetry findings, ODI best predicted OSA (area under the curve [AUC], 0.88; 95% confidence interval [CI], 0.83-0.93). An ODI ≥8.4 (likelihood ratio [LR], 4.19; 95% CI, 2.87-6.10) created a PTP of 77%, while an ODI of 0 to <8.4 (LR, 0.19, 95% CI, 0.12-0.33) created a 14% PTP. Sequential application of SACS and ODI results yielded an AUC result of 0.90 (95% CI, 0.85-0.95).
Conclusions SACS risk stratification provides an advantage over clinical gestalt. In those at intermediate risk, ODI results provide a simple and clinically useful way to further refine diagnostic prediction. Sequential use of SACS and selectively employed overnight oximetry may limit unnecessary polysomnography. Oximetry testing should be avoided in patients deemed low or high risk by SACS, as positive results do not substantially recalibrate risk.
Obstructive sleep apnea (OSA) is a prevalent and underdiagnosed condition. The National Sleep Foundation estimates that 18 million Americans have OSA.1 Primary care practice may be the best setting in which to identify OSA, as many of our patients have conditions frequently associated with apnea (eg, hypertension, obesity, diabetes, arrhythmia, and neurologic illness). Up to a third of patients in primary care practice may be at increased risk.2,3
Clinical guidelines of the American Academy of Sleep Medicine (AASM) recommend obtaining a sleep history to evaluate for possible OSA in 3 instances: as part of a routine health maintenance examination, during evaluation of specific complaints associated with OSA (eg, snoring, apnea, daytime sleepiness), and during comprehensive evaluations for individuals with high-risk conditions (ie, obesity, congestive heart failure, refractory hypertension, diabetes, stroke history).4
The American College of Physicians (ACP) Clinical Practice Guideline suggests assessing individuals who have unexplained daytime sleepiness.5 The ACP considers this assessment “High-Value Care,” as “evidence shows that before diagnosis, patients with OSA have higher rates of health care use, more frequent and longer hospital stays, and higher health care costs than after diagnosis.”5
Continue to: We recently validated the diagnostic accuracy...
We recently validated the diagnostic accuracy of the Sleep Apnea Clinical Score (SACS) for use in a primary care patient population suspected of having OSA.6 SACS uses historical and clinical data to derive a score that identifies a patient’s risk level.7 However, as an alternative to the 2 levels described in Flemons’ SACS,7 we propose creating 3 risk strata (FIGURE 17,8). We believe that patients at high risk (SACS ≥15) should be encouraged to undergo sleep evaluations as their posttest probability (PTP) of OSA is 75% to 80%. Individuals at low risk (SACS ≤5; PTP <20%) could receive lifestyle advice and simple clinical interventions that decrease symptoms (eg, weight loss, increased physical activity, sleeping on one’s side). For low-risk patients, clinical observation and reevaluation could take place over time with their primary care provider, without additional testing or referral to specialists.
What about patients at intermediate risk? Many patients suspected of having OSA will be assigned to intermediate risk (SACS 6-14), and their PTP of OSA remains at 40% to 45%, the pre-test level most commonly encountered in suspected OSA. As polysomnography is a limited and expensive clinical resource, intermediate-risk patients would benefit from recalibration of their SACS-based risk assessment using an additional surrogate test such as home-based overnight oximetry. Our internal OSA practice guidelines recommend referral for sleep medicine consultation when oximetry results are abnormal—specifically, an oxygen desaturation index (ODI) of ≥5, a mean saturation less than 89%, and a minimum saturation of 75% or less.
Our objectives in this study were to compare the diagnostic implications of these 3 measurements from home-based overnight oximetry reports and use the most relevant result to derive a predictive model further refining PTP of OSA in a primary care patient population first stratified to intermediate risk by SACS.
METHODS
Subjects
We performed secondary analyses on data obtained from our SACS validation cohort.6 In brief, these were patients suspected of having OSA based on the presence of signs, symptoms, or associated risk factors. One hundred ninety-one patients completed all assessments. Sixty-six of 191 patients (35%) were categorized as intermediate risk (SACS 6-14; OSA probability 41% [27/66]).
Data collection and analyses
Participants completed home-based overnight oximetry using Nonin Model 2500 oximeters (Nonin Medical Inc., Plymouth, Minn). We transferred oximetry results from the sleep lab database to a statistical program for analyses of ODI, mean saturation, and minimal saturation. ODI was defined as the number of 4% drops in saturation from baseline divided by the number of hours of recording time. Although the AASM states that a diagnosis of OSA is confirmed if the number of obstructive events is more than 15 per hour or more than 5 per hour in a patient who reports related symptoms,4 we defined OSA as an apnea-hypopnea index (AHI) of >10 based on polysomnography (as this was the threshold used in the derivation cohort for SACS).7 We demonstrated the predictive ability of SACS at various AHI definitions of OSA in our validation cohort.6 The use of SACS in our validation cohort showed a statistically similar ability to predict OSA at both an AHI of 10 and 20, compared with the derivation cohort.
Continue to: We entered additional information...
We entered additional information reported directly by patients and obtained from their sleep studies into a REDCap database and transferred that to our statistical program. We used descriptive statistics to determine ranges and central tendencies of oximetry results. Receiver operator characteristic (ROC) analyses described the predictive abilities for each oximetry result individually and in serial application with prior SACS determinations. For comparison, we used the area under the ROC curve (AUC) from logistic regression to model the probability of OSA.
We calculated positive likelihood ratios (LR) and 95% confidence intervals (CI) to determine the degree of oximetry abnormality that would recalibrate risk either to a high PTP of OSA (>75%) or a low PTP (<25%). We sorted intermediate-risk SACS scores into quintiles based on ODI results to compare the resulting PTPs of OSA. We applied the PTP of OSA from our previous work (using the SACS score to compute the LR) as the new PTP, estimated the LR based on ODI, and computed an updated PTP of OSA. We also used ROC analysis to determine the optimal cutoff value of the ODI.
Finally, in accordance with our internal clinical practice recommendations, we examined the predictive ability of a “positive” ODI result of ≥5 to recalibrate risk prediction for OSA for patients in the low-risk group. We performed analyses using SAS 9.4 (SAS Institute, Cary, NC).
RESULTS
One hundred ninety-one subjects completed assessments. The median and quartile results for ODI, mean saturation, and minimum saturation are found in TABLE 1. TABLE 2 shows the distribution of patients with positive oximetry results. An ODI of 5 or greater was the most frequent abnormal result (135/191; 70.7%).
We used the AUC to measure the comparative abilities of SACS and the 3 overnight oximetry results in predicting OSA (TABLE 3). ODI results demonstrated the best ability to predict OSA, compared with polysomnography as the relative gold standard (AUC, 0.88; 95% confidence interval [CI], 0.83-0.93). Serial application of SACS and ODI yielded even better diagnostic results (AUC, 0.90; 95% CI, 0.85-0.95).
Continue to: As ODI was found to be the strongest predictor of OSA...
As ODI was found to be the strongest predictor of OSA, we grouped these results in quintiles and calculated positive LRs. TABLE 4 shows their effect on PTP of disease among patients with intermediate risk. An ODI result >10 effected an upward recalibration of disease probability (LR, 2.33; 95% CI, 1.27-4.26). The optimal cutoff of ODI to discriminate between those with and without OSA was determined by ROC analysis. An ODI greater than 8.4 created a PTP of disease of approximately 73% to 77%.
Our internal clinical guidelines recommend referring patients with an ODI of 5 or greater for sleep medicine consultation. We examined the ability of this ODI result to recalibrate disease suspicion for a patient at low risk (SACS ≤5). The LR for ODI of 5 or greater is 2.1, but this only results in a recalibration of risk from 24% pretest probability in our validation cohort to 41% PTP (95% CI, 33-49). This low cutoff for a positive test creates false-positive results more than 40% of the time due to low specificity (0.58). This is insufficient to change the suspicion of disease, resulting only in a shift to intermediate OSA risk.
DISCUSSION
Among 3 different oximetry measurements, an ODI ≥10 best predicts OSA, both independently and when used sequentially after the SACS. ODI was by far the most frequent abnormality on oximetry in our cohort, thereby increasing its utility in clinical decision making. For those subjects at intermediate risk, a cutoff of 10 for the ODI result may be a simple and clinically effective way to recalibrate risk and aid in making referral decisions. (This may also be simpler and more easily remembered by clinicians than the 8.4 ODI results from the ROC analyses.)
Assessment is inadequate without a clinical prediction rule. Unfortunately, providers cannot simply rely on clinical gestalt in diagnosing OSA. In their derivation cohort, Flemens et al examined the LRs created by SACS and by clinician prediction based on history and physical exam.7 The SACS LRs ranged from 5.17 to 0.25, a 20-fold range. This reflected superior diagnostic information compared with subjective physician impression, where LRs ranged from 3.7 to 0.52, a seven-fold range. Myers et al prepared a meta-analysis of 4 different trials that examined physicians’ ability to predict OSA.9 Despite the researchers’ use of experienced sleep medicine doctors, the overall diagnostic accuracy of clinical impression was modest (summary positive LR, 1.7; 95% CI, 1.5-2; I2 = 0%; summary negative LR, 0.67; 95% CI, 0.60-0.74; I2 = 10%; sensitivity, 58%; specificity, 67%). This is similar to reliance on a single clinical sign or symptom to predict OSA.
Wise use of oximetry augments SACS calculation. To limit unnecessary oximetry testing in low- and high-risk groups and to avoid polysomnography in cases of a low PTP of disease, we advocate limiting oximetry testing to individuals in the SACS intermediate-risk group (FIGURE 2) wherein ODI results can potentially recalibrate risk assessment up or down. (Those in the high- risk group should be referred to a sleep medicine specialist.) Our institutional recommendation of using an ODI result of ≥5 as a threshold to increase suspicion of disease requires a caveat for the low-risk group. “Positive” results at that low diagnostic threshold are frequently false.
Continue to: Multiple benefits of SACS
Multiple benefits of SACS. We believe using the SACS calculation during clinical encounters with patients potentially at risk for OSA would increase diagnostic accuracy. Performing risk stratification with SACS should not be an undue burden on providers, and the increased time spent with patients has its own benefits, including helping them better understand their risk. Using this standardized process—augmented, as needed, with overnight ODI assessment—might also encourage more patients to follow through on subsequent recommendations, as their risk is further quantified objectively. Lastly, unnecessary testing with polysomnography could be avoided.
Limitations of our study. This study’s findings were derived from a patient population in a single institution. Replication of the findings from other settings would be helpful.
Looking forward. It is yet unclear if clinicians will embrace these strategies in real-world primary care practice. We have designed an implementation-and-dissemination trial to assess whether family physicians will use the SACS clinical predication rule in everyday practice and whether our evidence-based recommendations about overnight oximetry will be followed. Underlying our suggested clinical evaluation pathway (FIGURE 2) is the belief that there is value gained from sharing the decision-making process with patients. Although we provide new evidence that informs these conversations, the patient’s values and preferences are important when determining the best direction to proceed in the evaluation for suspected OSA. These recommendations are intended to aid, not replace, good clinical judgment.
Home-based sleep testing has become more widely available, is convenient for patients, and is less expensive than lab-based polysomnography. Our study did not directly address the appropriate circumstances for home studies in clinical evaluation. We rely on the expertise of our sleep medicine colleagues to determine which patients are appropriate candidates for home-based studies.
The AASM states that “portable monitors (PM) for the diagnosis of OSA should be [used] only in conjunction with a comprehensive sleep evaluation. Clinical sleep evaluations using PM must be supervised by a practitioner with board certification in sleep medicine or an individual who fulfills the eligibility criteria for the sleep medicine certification examination.”4 Additionally, the group recommends that PM “may be used in the unattended setting as an alternative to polysomnography for the diagnosis of OSA in patients with a high pretest probability of moderate to severe OSA and no comorbid sleep disorder or major comorbid medical disorders.”4
Continue to: GRANT SUPPORT
GRANT SUPPORT
The use of the REDCap database is supported by grant UL1 TR000135. This work was supported by a Mayo Foundation CR-20 grant awarded to Dr. Mookadam as Principal investigator and Dr. Grover as Coinvestigator.
Statistical analyses were supported, in part, by the Department of Family Medicine, Mayo Clinic, Scottsdale, Ariz.
CORRESPONDENCE
Michael Grover, DO, Mayo Clinic Thunderbird Primary Care Center-Family Medicine, 13737 N 92nd Street, Scottsdale, AZ 85260; [email protected]
1. National Sleep Foundation. Sleep apnea. https://sleepfoundation.org/sleep-disorders-problems/sleep-apnea. Accessed September 14, 2018.
2. Grover M, Mookadam M, Armas D, et al. Identifying patients at risk for obstructive sleep apnea in a primary care practice. J Am Board Fam Med. 2011;24:152-160.
3. Mold JW, Quattlebaum C, Schinnerer E, et al. Identification by primary care clinicians of patients with obstructive sleep apnea: a practice-based research network (PBRN) study. J Am Board Fam Med. 2011;24:138-145.
4. Epstein LJ, Kristo D, Strollo PJ, Jr., et al; Adult Obstructive Sleep Apnea Task Force of the American Academy of Sleep Medicine. Clinical guideline for the evaluation, management and long-term care of obstructive sleep apnea in adults. J Clin Sleep Med. 2009;5:263-276.
5. Qaseem A, Dallas P, Owens DK, et al. Diagnosis of obstructive sleep apnea in adults: a clinical practice guideline from the American College of Physicians. Ann Intern Med. 2014;161:210-220.
6. Grover M, Mookadam M, Chang Y-H, et al. Validating the Sleep Apnea Clinical Score for use in primary care populations. Mayo Clin Proc. 2016;91:469-476.
7. Flemons WW, Whitelaw WA, Brant R, et al. Likelihood ratios for a sleep apnea clinical prediction rule. Am J Respir Crit Care Med. 1994;150:1279-1285.
8. Gali B, Whalen FX, Gay PC, et al. Management plan to reduce risks in perioperative care of patients with presumed obstructive sleep apnea syndrome. J Clin Sleep Med. 2007;3:582-588.
9. Myers KA, Mrkobrada M, Simel DL. Does this patient have obstructive sleep apnea?: The rational clinical examination systematic review. JAMA. 2013;310(7):731-741.

Geniculate Artery Injury During Primary Total Knee Arthroplasty
ABSTRACT
Major arterial injury associated with total knee arthroplasty (TKA) is a rare and potentially devastating complication. However, the rate of injury to smaller periarticular vessels and the clinical significance of such an injury have not been well investigated. The purpose of this study is to describe the rate and outcomes of geniculate artery (GA) injury, the time at which injury occurs, and any associations with tourniquet use.
From November 2015 to February 2016, 3 surgeons at a single institution performed 100 consecutive primary TKAs and documented the presence or absence and the timing of GA injury. The data were then retrospectively reviewed. All TKAs had no prior surgery on the operative extremity. Other variables collected included tourniquet use, tranexamic acid (TXA) administration, intraoperative blood loss, postoperative drain output, and blood transfusion.
The overall rate of GA injury was 38%, with lateral inferior and middle GA injury in 31% and 15% of TKAs, respectively. Most of the injuries were visualized during bone cuts or meniscectomy. The rate of overall or isolated GA injury was not significantly different (P > .05) with either use of intravenous (84 patients) or topical (14 patients) TXA administration. Comparing selective tourniquet use (only during cementation) vs routine use showed no differences in GA injury rate (P = .37), blood loss (P = .07), or drain output (P = .46).
There is a relatively high rate of GA injury, with injury to the lateral GA occurring more often than the middle GA. Routine or selective tourniquet use does not affect the rate of injury.
Continue to: Major arterial injury...
Major arterial injury associated with total knee arthroplasty (TKA) is a rare and potentially devastating complication. The majority of literature in this context consists of case reports, small case series, and large retrospective studies that have examined the type, location, and mechanism of injury present in these cases.1-13 Reported arterial injuries include occlusion, laceration, aneurysm, pseudoaneurysm, and arteriovenous fistula formation in the femoral (believed to be due to the tourniquet around the proximal thigh) and popliteal arteries causing combinations of ischemia and hemorrhage necessitating treatment ranging from endovascular arterial intervention to amputation.4,5,9-11,13-17 In addition, several studies have asserted that the risk of major arterial injury may be increased with tourniquet use, suggesting that tourniquet use should be minimized for routine primary TKAs.3,6
There are very few cases in the literature specifically addressing injury to the more commonly encountered geniculate arteries (GAs). The medial GAs are typically visualized and coagulated during the standard medial parapatellar approach. In addition, if performed, a lateral release can damage the lateral superior and inferior GAs and the middle GA can be cut with posterior cruciate ligament resection. However, the middle and lateral inferior GAs are anecdotally the most difficult to detect and treat intraoperatively, especially after implantation of TKA and deflation of the tourniquet. The potential lack of recognition of such GA injury can result in harmful sequelae, including ischemia of the patella, hemorrhage, and painful pseudoaneurysms.2,18-29 Currently, there are only 2 case reports of lateral inferior GA injury, 2 cases of medial inferior GA injury, and no reports of middle GA injury.2,23,24,29
The rate, the timing within surgery, the risk factors, including tourniquet use, and the clinical effects of GA injury are largely unknown. If these factors were better understood, prophylactic measures and/or awareness could be better applied to prevent adverse outcomes, especially in cases of the middle and lateral inferior GAs. The aims of this study are to elucidate the rate and timing of middle and lateral inferior GA injury during primary TKA; determine the factors related to injury, including intraoperative blood loss, postoperative drain output, and tranexamic (TXA) acid use; and investigate any differences in the rate of injury with and without the use of a tourniquet.
MATERIALS AND METHODS
PATIENT DEMOGRAPHICS AND SURGICAL TECHNIQUE
From November 2015 to February 2016, 3 surgeons (MJT, TMM, and RTT) at a single institution performed 100 consecutive unilateral primary TKAs and documented the presence or absence and the timing of GA injury. After obtaining approval from our Institutional Review Board, a retrospective study was performed to investigate the prospectively recorded rate of middle and lateral inferior GA injuries occurring during primary TKAs. Patients with a diagnosis of isolated osteoarthritis were included, and those with any previous surgery on the operative knee were excluded. The average age of patients at the time of surgery was 67 years (range, 25-91 years), the average body mass index was 33 kg/m2 (range, 18-54 kg/m2), and there were 63 (63%) female patients.
All TKAs were performed through a medial parapatellar approach with a posterior-stabilized, cemented design, and each patient received a postoperative surgical drain. One of the 3 lead surgeons (TMM) in this study used a tourniquet from the time of incision until the completion of cementation, and the other 2 (MJT and RTT) predominantly used the tourniquet only during cementation. To elucidate any differences in GA injury between these 2 methods of tourniquet use, the patients were categorized into 2 groups base d on tourniquet use. Group 1 included patients in whom a tourniquet was used to maintain a bloodless surgical field from the time of incision until the completion of cementation, and Group 2 included patients in whom tourniquet use was more selective (ie, applied only during cementation). Group 1 comprised 31% (31/100) of patients, while Group 2 comprised 67% (67/100) of patients; no tourniquet was used in 2% (2/100) of cases. In addition, TXA was used in 98% (98/100) of patients: 84 patients received intravenous (IV) and 14 received topical TXA administration.
Continue to: ANALYSIS OF GENICULATE ARTERY INJURY
ANALYSIS OF GENICULATE ARTERY INJURY
The senior authors critically evaluated the GA during the primary TKAs and documented the presence or absence of injury in the operative reports. GA injury was reported if there was intraoperative visualization of pulsatile bleeding or visualization of arterial lumen in the anatomic areas of the middle and lateral inferior GAs. At 3 separate occasions during the operation, the surgeon looked specifically for pulsatile bleeding or arterial lumen in the areas of the middle and lateral inferior GAs, including after all the femoral and tibial bone cuts were completed, immediately before preparing to cement (before the tourniquet was inflated if there was not one inflated from the start of the procedure), and immediately after the tourniquet was deflated (Figure 1). All bleeding GAs that were visualized were effectively coagulated by cautery. Details regarding the use of TXA (topical or IV), intraoperative blood loss, postsurgical drain output for 24 hours after surgery, and blood transfusion were collected from the patients’ medical records (Table 1).

| Table 1. Operative Variables | |
Variable | Value |
Total number | 100 (100%) |
Intraoperative blood loss (mL) | 160 (25-500) |
Drain output 1st 24 hours (mL) | 488 (75-1980) |
Total output (mL) | 618 (75-2130) |
Use of TXA | 98 (98%) |
Topical TXA | 84 (84%) |
IV TXA | 14 (14%) |
Tourniquet entire procedure | 31 (31%) |
Operative variables other than geniculate artery injury. Data presented as mean (range) or n (%). TXA = tranexamic acid.
STATISTICAL METHODS
Statistical analysis was performed using the JMP software version 10.0.0 (SAS Institute, Inc). The overall rate of GA injury was determined, including the rates of GA injury based on location, time point, and method of diagnosis (pulsatile bleeding or arterial lumen visualization). If >1 GA injury occurred in the same knee, only 1 GA injury was calculated for the overall rate; however, each injury was specified separately when calculating the injury rate for the specific GA. Intraoperative blood loss, postoperative drain output, and the use of TXA were compared between cases in which a GA injury was detected and those in which it was not detected. Before conducting the retrospective review, a power analysis determined that we would require 100 patients to detect a difference in GA injury between Groups 1 and 2 (33 in Group 1 and 67 in Group 2), assuming a 30% rate in Group 1 and a 5% rate of GA injury in Group 2 using Fisher’s exact test. The Fisher’s exact test was used to compare categorical variables, and the Wilcoxon rank sum test was used to compare continuous variables. An alpha value of .05 was considered as statistically significant.
RESULTS
RATE OF GENICULATE ARTERY INJURY
The overall rate of any GA injury was 38% (38/100). Lateral inferior GA injury was more frequently detected than middle GA injury (31% vs 15% of TKAs, respectively; Table 2). Among the 31 lateral inferior GA injuries, 14 were identified as pulsatile bleeding, 7 as lumen visualizations, and 6 as both pulsatile bleeding and lumen visualization; 4 were detected by methods not recorded in the operative report. Of the lateral inferior GA injuries, 11 were identified after the bone cuts, 7 during meniscus removal, 3 during exposure, 1 after tourniquet deflation, and 9 at a time not recorded in the operative report. Of the 15 middle GA injuries, 9 were identified as pulsatile bleeding, 2 as lumen visualizations, and 4 as both pulsatile bleeding and lumen visualization. In addition, 7 of these GA injuries were identified after the bone cuts, 3 during cruciate removal, 1 after meniscus removal, 1 during exposure, and 3 at a time not recorded in the operative report (Table 3).
| Table 2. Rates of Geniculate Artery Injury Based on Location and Method | ||||
Location | Pulsatile Bleeding | Arterial Lumen | Both | Overall Rate |
Lateral inferior GA | 14 (14%) | 7 (7%) | 6 (6%) | 31 (31%) |
Middle GA | 9 (9%) | 2 (2%) | 4 (4%) | 15 (15%) |
Rates of geniculate artery injury based on location and method of diagnosis. Data presented as n (%). There were 4 additional lateral inferior and 9 middle GA injuries identified by a method not specified in the operative report. GA = geniculate artery.
Table 3. Rates of Geniculate Artery Injury Based on Time Point | ||
Time | Lateral Inferior GA | Middle GA |
After bone cuts | 11 (11%) | 7 (7%) |
During meniscus removal | 7 (7%) | 1 (1%) |
During exposure | 3 (3%) | 1 (1%) |
After tourniquet deflation | 1 (1%) | 0 (0%) |
During cruciate removal | 0 (0%) | 3 (3%) |
Not reported | 9 (9%) | 3 (3%) |
Rates of geniculate artery injury based on time point and method of diagnosis. GA = geniculate artery. Data presented as n (%).
FACTORS ASSOCIATED WITH GENICULATE ARTERY INJURY
Mean intraoperative estimated blood loss was 186 mL (standard deviation [SD], 111; range 50–500 mL) in those with a GA injury versus 147 mL (range, 82.25–400 mL) in those without injury (P = .14). Postoperative drain output in the 24 hours after surgery was 467 mL (SD 253, range 100–1105 mL) versus 502 mL (SD 378, range 75–1980 mL) in TKAs with and without GA injury, respectively (P = .82). Total estimated blood loss (combined intraoperative blood loss and 24-hour postoperative drain output) was 613 mL (SD 252, range 150–1105 mL) in TKAs with GA injury versus 620 mL (SD 393, range 75–2130 mL) without injury (P = .44) (Table 4). Overall, there was no statistical difference in blood loss, drain output, or combined output when analyzed according to lateral inferior or middle GA injury (P = .24–.82) (Table 5 and Table 6). No patients required blood transfusion postoperatively after TKA.
| Table 4. Factors Associated with GA Injury | |||
Outcome | GA Injury | No GA Injury | P Value |
Blood loss (mL) | 186 (50-500) | 147 (25-400) | .1366 |
24-Hour drain output (mL) | 467 (100-1105) | 502 (75-1980) | .8240 |
Total output (mL) | 613 (150-1105) | 620 (75-2130) | .4368 |
Differences in outcomes based on presence or absence of GA injury. Note that there were no significant differences. Values are reported as average (range). GA = geniculate artery.
| Table 5. Factors Associated with LIGA Injury | |||
Outcome | LIGA Injury | No LIGA Injury | P Value |
Blood loss (mL) | 178 (50-400) | 153 (25-500) | .2401 |
24-Hour drain output (mL) | 461 (100-890) | 501 (75-1980) | .8187 |
Total output (mL) | 610 (150-1080) | 621 (75-2130) | .4165 |
Differences in outcomes based on presence or absence of LIGA injury. Note that there were no significant differences. Values are reported as average (range). LIGA = lateral inferior geniculate artery.
| Table 6. Factors Associated with MGA Injury | |||
Outcome | MGA Injury | No MGA Injury | P Value |
Blood loss (mL) | 190 (75-500) | 156 (25-400) | .6225 |
24-Hour drain output (mL) | 455 (125-1105) | 494 (75-1980) | .6428 |
Total output (mL) | 582 (200-1105) | 624 (75-2130) | .6535 |
Differences in outcomes based on presence or absence of MGA injury. Note that there were no significant differences. Values are reported as average (range). MGA = middle geniculate artery.
IV administration of TXA was associated with a 37% (31/84) rate of GA injury, whereas topical TXA administration was associated with a 43% (6/14) rate of GA injury (P = .77). The rate of overall or isolated GA injury was not significantly different (P = .35–1.0) between IV and topical TXA administration (Table 7). In addition, total combined output was not significantly different (P = .1032) when comparing GA injury and noninjury in the subgroup analysis based on TXA use (IV or topical); however, topical administration was associated with lower intraoperative blood loss than IV administration (P = .0489), whereas IV administration was associated with lower 24-hour postoperative drain output than topical administration (P = .0169). There was no difference in blood loss, 24-hour drain output, or total output between those who did and did not sustain a GA injury in the group of patients who received IV TXA administration (Table 8, P = .2118–.7091). The same was true for those receiving topical TXA administration (Table 9, P = .0912–.9485).
Table 7. Factors Associated with TXA Injury | |||
Outcome | IV TXA (n = 84) | Topical TXA (n = 14) | P Value |
Any GA injury | 31 (37%) | 6 (43%) | .7683 |
LIGA injury | 24 (29%) | 6 (43%) | .3498 |
MGA injury | 13 (15%) | 2 (14%) | 1.0 |
Blood loss (mL) | 170 (25-500) | 113 (40-240) | .0489* |
24-Hour drain output (mL) | 454 (75-1980) | 662 (75-1800) | .0169* |
Total output (mL) | 592 (75-2130) | 751 (75-2130) | .1032 |
Differences in outcomes based on presence or absence of MGA injury. Note that there were no significant differences. Values are reported as n (%) or average (range). TXA = tranexamic acid, GA = geniculate artery, LIGA = lateral inferior geniculate artery, MGA = middle geniculate artery. *denotes statistical significance (P < .05).
| Table 8. Factors Associated with GA Injury Given IV TXA Use | ||||
Outcome | GA Injury | No GA Injury | Difference | P Value |
Blood loss (mL) | 195 (50-500) | 157 (25-400) | 38 | .2118 |
24-Hour drain output (mL) | 436 (100-1105) | 464 (75-1980) | 28 | .7091 |
Total output (mL) | 594 (150-1105) | 592 (75-2130) | 2 | .6982 |
Differences in outcomes of those patients who received IV TXA based on presence or absence of GA injury. Note that there were no significant differences. Values are reported as average (range). GA = geniculate artery, TXA = tranexamic acid.
| Table 9. Factors Associated with GA Injury Given Topical TXA Use | ||||
Outcome | GA Injury | No GA Injury | Difference | P Value |
Blood loss (mL) | 163 (100-250) | 84 (40-150) | 79 | .0912 |
24-Hour drain output (mL) | 610 (205-890) | 701 (415-1800) | 91 | .9485 |
Total output (mL) | 719 (405-960) | 775 (455-1900) | 56 | .6982 |
Differences in outcomes based on presence or absence of GA injury. Note that there were no significant differences. Values are reported as average (range). GA = geniculate artery.
Continue to: TOURNIQUET USE
TOURNIQUET USE
Comparison between Groups 1 (tourniquet use) and 2 (selective tourniquet use) revealed similar rates of overall and specific GA injury, intraoperative blood loss, and 24-hour postoperative drain output (Table 10). Group 1 demonstrated a 29% (9/31) rate of any GA injury versus 40% (27/67) in Group 2 (P = .37). For the specific lateral inferior GA injury, there was an equivalent rate of injury at 29% (9/31 in Group 1, 20/67 in Group 2; P = 1.0). Similarly, Group 1 patients had a 10% (3/31) rate of middle GA injury compared to 16% (11/67) in Group 2 patients (P = .53). Intraoperative estimated blood loss was lower in Group 1 (140 mL; range 25–400 mL) than in Group 2 (171 mL; range 40–500 mL) (P = .07), whereas the average 24-hour postoperative drain output was similar for Groups 1 (484 mL; range 75–1800 mL) and 2 (488 mL; range 100–1980 mL) (P = .46). Total estimated output was slightly less for Group 1 (593 mL; range 75–1900 mL) than for Group 2 (626 mL; range 125–2130 mL) (P = .38). A post hoc power analysis showed that with these rates of GA injury in Groups 1 and 2 and given a 2:1 ratio of the number of patients in Group 2 versus Group 1, a total of 185 patients in Group 1 and 370 patients in Group 2 would be needed to detect a statistically significant difference (P < .05) with a power of 80%.
| Table 10. Factors Associated with Tourniquet Use | ||||
Injury | Group 1 (n = 31) | Group 2 (n = 67) | Difference | P Value |
Overall GA injury | 9 (29%) | 27 (40%) | 11% | .3687 |
Lateral inferior GA | 9 (29%) | 20 (29%) | 0% | 1.0 |
Middle GA | 3 (10%) | 11 (16%) | 6% | .5382 |
Blood loss (mL) | 140 (25-400) | 171 (40-500) | 31 | .0661 |
24-Hour drain output (mL) | 484 (75-1800) | 488 (100-1980) | 4 | .4580 |
Total output (mL) | 593 (75-1900) | 626 (125-2130) | 33 | .3776 |
Differences in outcomes separated based on use of a tourniquet for the entire case (Group 1) vs use of a tourniquet only during cementation (Group 2). Note that there were no significant differences. Values are reported as n (%) or average (range). GA = geniculate artery.
DISCUSSION
Major arterial injury associated with TKA is a well-known, rare, and potentially devastating complication.1-13 However, the rate of injury to smaller periarticular vessels and the clinical significance of such injury have not been studied. The present study found a high rate of GA injury but no clinically significant difference in intraoperative blood loss or postoperative drain output between patients with GA injury (which was identified and managed with cautery) and those without GA injury. In addition, tourniquet use did not affect the rate of injury or the associated blood loss. To our knowledge, this is the first study that has critically evaluated the rate of GA injury occurring during TKA.
The overall rate of GA injury occurring during primary TKA was 38% with a higher predominance of lateral inferior than middle GA injury (31% vs 15%). Anatomically, it would follow that the lateral GA could be injured at a higher rate as it courses on top of the lateral meniscus, thus being susceptible to injury during cutting of the tibial plateau and meniscectomy. In addition, because the meniscectomy is performed longitudinally along the course of the artery, it may also be potentially lacerated in multiple locations and lengthwise. In theory, there should be a 100% rate of middle GA injury during posterior-stabilized TKA as this artery runs through the cruciate ligaments, which are resected during these cases. However, vessel injury was defined in this study as the visualization of pulsatile bleeding or vessel lumen. It is probable that in the cases in which injury to the middle GA was not visualized, it was cut but simultaneously cauterized. Thus, a lower rate (15%) of injury was detected. Nonetheless, these results still suggest that these periarticular arteries are injured at a higher rate; therefore, it is important for surgeons to specifically identify these injuries intraoperatively and adequately cauterize these vessels. As long as these arteries are cauterized, additional blood loss and potential vascular pseudoaneurysms should be prevented.
The effect of GA injury on intraoperative blood loss, 24-hour postoperative drain output, and total estimated blood loss showed no significant clinical findings in the present study cohort. In addition, examining the injury rate and blood loss based on TXA use also revealed no detrimental clinical associations. Although GA injury could inherently be associated with higher levels of blood loss and drain output, it is important to note that all GA injuries were also effectively coagulated, thus explaining the indifferent results. Accordingly, it should be recommended to surgeons performing primary TKAs to carefully evaluate for GA injury to prevent excessive blood loss or painful pseudoaneurysms. However, there is also a potential for beta error in this study in which a true difference did exist but no statistical difference was found due to the study being underpowered.
Full or selective tourniquet use during TKA did not appear to have any effect on the rate of GA injury, intraoperative blood loss, or 24-hour postoperative drain output. The similarity between GA injury rates perhaps further indicates an equivalent ability to detect these injuries between these two methods because of operative inspection for such injuries. With regard to intraoperative blood loss and drain output, the present findings are similar to previous studies demonstrating equivocal results despite variable tourniquet utilization in TKA.15,30 However, these results differ from those of Harvey and colleagues31, who demonstrated that blood loss inversely correlated with intraoperative tourniquet time. There are risks and benefits related to the use of both full and selective tourniquet methods, but either method does not appear to be advantageous in decreasing the rate of GA injury.
Continue to: Although this is the first study...
Although this is the first study to investigate the rates of GA injury and the potential clinical effects, there are limitations to this research. First, the study was retrospective in nature despite the fact that the data were collected prospectively. Only acute perioperative follow-up was performed, and thus, we were unable to evaluate longer term effects of GA injury on TKA outcomes. Furthermore, this study is potentially prone to beta error. As discussed above, 185 patients in Group 1 and 370 patients in Group 2 would be needed to detect a statistical difference in the rate of GA injury based on the rates found in this study. This study could also have been underpowered to identify differences in other aspects, such as differences in blood loss and drain. Furthermore, the data collected regarding intraoperative blood loss are estimated data and can be variable. Finally, visualization of vessel lumen and pulsatile bleeding is not a validated method to diagnose GA injuries, and potential injuries may have been missed. Despite such disadvantages, the strengths of this study include the concise results in consecutive patients, the generalizability of the data as multiple surgeons participated, and its first report of nonmajor periarticular artery injury.
CONCLUSIONS
There is a relatively high rate of GA injury, with injury to the lateral GA being visualized more often than injury to the middle GA. The majority of GA injuries occur around the time of bone cuts and meniscectomy, and tourniquet use does not affect the rate of injury. To reduce intraoperative blood loss and postoperative drain output, surgeons should identify and coagulate GA injuries routinely during primary TKA.
1. Calligaro KD, Dougherty MJ, Ryan S, Booth RE. Acute arterial complications associated with total hip and knee arthroplasty. J Vasc Surg. 2003;38(6):1170-1177. doi: 10.1016/S0741-5214(03)00918-2.
2. Dennis DA, Neumann RD, Toma P, Rosenberg G, Mallory TH. Arteriovenous fistula with false aneurysm of the inferior medial geniculate artery. A complication of total knee arthroplasty. Clin Orthop Relat Res. 1987(222):255-260.
3. Hagan PF, Kaufman EE. Vascular complication of knee arthroplasty under tourniquet. A case report. Clin Orthop Relat Res. 1990(257):159-161.
4. Holmberg A, Milbrink J, Bergqvist D. Arterial complications after knee arthroplasty: 4 cases and a review of the literature. Acta Orthop Scand. 1996;67(1):75-78. doi: 10.3109/17453679608995616.
5. Hozack WJ, Cole PA, Gardner R, Corces A. Popliteal aneurysm after total knee arthroplasty. Case reports and review of the literature. J Arthroplasty. 1990;5(4):301-305. doi: 10.1016/S0883-5403(08)80087-3.
6. Jeyaseelan S, Stevenson TM, Pfitzner J. Tourniquet failure and arterial calcification. Case report and theoretical dangers. Anaesthesia. 1981;36(1):48-50. doi: 10.1111/j.1365-2044.1981.tb08599.x
7. Mureebe L, Gahtan V, Kahn MB, Kerstein MD, Roberts AB. Popliteal artery injury after total knee arthroplasty. Am Surg. 1996;62(5):366-368.
8. O'Connor JV, Stocks G, Crabtree JD, Jr., Galasso P, Wallsh E. Popliteal pseudoaneurysm following total knee arthroplasty. J Arthroplasty. 1998;13(7):830-832. doi: 10.1016/S0883-5403(98)90039-0.
9. Ohira T, Fujimoto T, Taniwaki K. Acute popliteal artery occlusion after total knee arthroplasty. Arch Orthop Trauma Surg. 1997;116(6-7):429-430. doi: 10.1007/BF00434007.
10. Parfenchuck TA, Young TR. Intraoperative arterial occlusion in total joint arthroplasty. J Arthroplasty. 1994;9(2):217-220. doi: 10.1016/0883-5403(94)90071-X.
11. Rush JH, Vidovich JD, Johnson MA. Arterial complications of total knee replacement. The Australian experience. J Bone Joint Surg Br. 1987;69(3):400-402. doi: 10.1302/0301-620X.69B3.3584193.
12. Smith DE, McGraw RW, Taylor DC, Masri BA. Arterial complications and total knee arthroplasty. J Am Acad Orthop Surg. 2001;9(4):253-257.
13. Zahrani HA, Cuschieri RJ. Vascular complications after total knee replacement. J Cardiovasc Surg (Torino). 1989;30(6):951-952.
14. Isiklar ZU, Landon GC, Tullos HS. Amputation after failed total knee arthroplasty. Clin Orthop Relat Res. 1994(299):173-178.
15. Wakankar HM, Nicholl JE, Koka R, D'Arcy JC. The tourniquet in total knee arthroplasty. A prospective, randomised study. J Bone Joint Surg Br. 1999;81(1):30-33. doi: 10.1302/0301-620X.81B1.0810030.
16. Kumar SN, Chapman JA, Rawlins I. Vascular injuries in total knee arthroplasty. A review of the problem with special reference to the possible effects of the tourniquet. J Arthroplasty. 1998;13(2):211-216. doi: 10.1016/S0883-5403(98)90102-4.
17. DeLaurentis DA, Levitsky KA, Booth RE, et al. Arterial and ischemic aspects of total knee arthroplasty. Am J Surg. 1992;164(3):237-240. doi: 10.1016/S0002-9610(05)81078-5.
18. Langkamer VG. Local vascular complications after knee replacement: a review with illustrative case reports. Knee. 2001;8(4):259-264. doi: 10.1016/S0968-0160(01)00103-X.
19. Moran M, Hodgkinson J, Tait W. False aneurysm of the superior lateral geniculate artery following Total Knee Replacement. Knee. 2002;9(4):349-351. doi: 10.1016/S0968-0160(02)00061-3.
20. Pritsch T, Parnes N, Menachem A. A bleeding pseudoaneurysm of the lateral genicular artery after total knee arthroplasty--a case report. Acta Orthop. 2005;76(1):138-140. doi: 10.1080/00016470510030463.
21. Gaheer RS, Chirputkar K, Sarungi M. Spontaneous resolution of superior medial geniculate artery pseudoaneurysm following total knee arthroplasty. Knee. 2014;21(2):586-588. doi: 10.1016/j.knee.2012.10.021.
22. Law KY, Cheung KW, Chiu KH, Antonio GE. Pseudoaneurysm of the geniculate artery following total knee arthroplasty: a report of two cases. J Orthop Surg (Hong Kong). 2007;15(3):386-389. /doi: 10.1177/230949900701500331.
23. Noorpuri BS, Maxwell-Armstrong CA, Lamerton AJ. Pseudo-aneurysm of a geniculate collateral artery complicating total knee replacement. Eur J Vasc Endovasc Surg. 1999;18(6):534-535.
24. Pai VS. Traumatic aneurysm of the inferior lateral geniculate artery after total knee replacement. J Arthroplasty. 1999;14(5):633-634. doi: 10.1016/S0883-5403(99)90089-X.
25. Julien TP, Gravereaux E, Martin S. Superior medial geniculate artery pseudoaneurysm after primary total knee arthroplasty. J Arthroplasty. 2012;27(2):323 e313-326. doi: 10.1016/j.arth.2011.02.009.
26. Kalsi PS, Carrington RJ, Skinner JS. Therapeutic embolization for the treatment of recurrent hemarthrosis after total knee arthroplasty due to an arteriovenous fistula. J Arthroplasty. 2007;22(8):1223-1225. /doi: 10.1016/j.arth.2006.11.012.
27. Ritter MA, Herbst SA, Keating EM, Faris PM, Meding JB. Patellofemoral complications following total knee arthroplasty. Effect of a lateral release and sacrifice of the superior lateral geniculate artery. J Arthroplasty. 1996;11(4):368-372. doi: 10.1016/S0883-5403(96)80024-6.
28. Aldrich D, Anschuetz R, LoPresti C, Fumich M, Pitluk H, O'Brien W. Pseudoaneurysm complicating knee arthroscopy. Arthroscopy. 1995;11(2):229-230. doi: 10.1016/0749-8063(95)90073-X.
29. Sharma H, Singh GK, Cavanagh SP, Kay D. Pseudoaneurysm of the inferior medial geniculate artery following primary total knee arthroplasty: delayed presentation with recurrent haemorrhagic episodes. Knee Surg Sports Traumatol Arthrosc. 2006;14(2):153-155. doi: 10.1007/s00167-005-0639-4.
30. Abdel-Salam A, Eyres KS. Effects of tourniquet during total knee arthroplasty. A prospective randomised study. J Bone Joint Surg Br. 1995;77(2):250-253. doi: 10.1302/0301-620X.77B2.7706340.
31. Harvey EJ, Leclerc J, Brooks CE, Burke DL. Effect of tourniquet use on blood loss and incidence of deep vein thrombosis in total knee arthroplasty. J Arthroplasty. 1997;12(3):291-296. doi: 10.1016/S0883-5403(97)90025-5.
ABSTRACT
Major arterial injury associated with total knee arthroplasty (TKA) is a rare and potentially devastating complication. However, the rate of injury to smaller periarticular vessels and the clinical significance of such an injury have not been well investigated. The purpose of this study is to describe the rate and outcomes of geniculate artery (GA) injury, the time at which injury occurs, and any associations with tourniquet use.
From November 2015 to February 2016, 3 surgeons at a single institution performed 100 consecutive primary TKAs and documented the presence or absence and the timing of GA injury. The data were then retrospectively reviewed. All TKAs had no prior surgery on the operative extremity. Other variables collected included tourniquet use, tranexamic acid (TXA) administration, intraoperative blood loss, postoperative drain output, and blood transfusion.
The overall rate of GA injury was 38%, with lateral inferior and middle GA injury in 31% and 15% of TKAs, respectively. Most of the injuries were visualized during bone cuts or meniscectomy. The rate of overall or isolated GA injury was not significantly different (P > .05) with either use of intravenous (84 patients) or topical (14 patients) TXA administration. Comparing selective tourniquet use (only during cementation) vs routine use showed no differences in GA injury rate (P = .37), blood loss (P = .07), or drain output (P = .46).
There is a relatively high rate of GA injury, with injury to the lateral GA occurring more often than the middle GA. Routine or selective tourniquet use does not affect the rate of injury.
Continue to: Major arterial injury...
Major arterial injury associated with total knee arthroplasty (TKA) is a rare and potentially devastating complication. The majority of literature in this context consists of case reports, small case series, and large retrospective studies that have examined the type, location, and mechanism of injury present in these cases.1-13 Reported arterial injuries include occlusion, laceration, aneurysm, pseudoaneurysm, and arteriovenous fistula formation in the femoral (believed to be due to the tourniquet around the proximal thigh) and popliteal arteries causing combinations of ischemia and hemorrhage necessitating treatment ranging from endovascular arterial intervention to amputation.4,5,9-11,13-17 In addition, several studies have asserted that the risk of major arterial injury may be increased with tourniquet use, suggesting that tourniquet use should be minimized for routine primary TKAs.3,6
There are very few cases in the literature specifically addressing injury to the more commonly encountered geniculate arteries (GAs). The medial GAs are typically visualized and coagulated during the standard medial parapatellar approach. In addition, if performed, a lateral release can damage the lateral superior and inferior GAs and the middle GA can be cut with posterior cruciate ligament resection. However, the middle and lateral inferior GAs are anecdotally the most difficult to detect and treat intraoperatively, especially after implantation of TKA and deflation of the tourniquet. The potential lack of recognition of such GA injury can result in harmful sequelae, including ischemia of the patella, hemorrhage, and painful pseudoaneurysms.2,18-29 Currently, there are only 2 case reports of lateral inferior GA injury, 2 cases of medial inferior GA injury, and no reports of middle GA injury.2,23,24,29
The rate, the timing within surgery, the risk factors, including tourniquet use, and the clinical effects of GA injury are largely unknown. If these factors were better understood, prophylactic measures and/or awareness could be better applied to prevent adverse outcomes, especially in cases of the middle and lateral inferior GAs. The aims of this study are to elucidate the rate and timing of middle and lateral inferior GA injury during primary TKA; determine the factors related to injury, including intraoperative blood loss, postoperative drain output, and tranexamic (TXA) acid use; and investigate any differences in the rate of injury with and without the use of a tourniquet.
MATERIALS AND METHODS
PATIENT DEMOGRAPHICS AND SURGICAL TECHNIQUE
From November 2015 to February 2016, 3 surgeons (MJT, TMM, and RTT) at a single institution performed 100 consecutive unilateral primary TKAs and documented the presence or absence and the timing of GA injury. After obtaining approval from our Institutional Review Board, a retrospective study was performed to investigate the prospectively recorded rate of middle and lateral inferior GA injuries occurring during primary TKAs. Patients with a diagnosis of isolated osteoarthritis were included, and those with any previous surgery on the operative knee were excluded. The average age of patients at the time of surgery was 67 years (range, 25-91 years), the average body mass index was 33 kg/m2 (range, 18-54 kg/m2), and there were 63 (63%) female patients.
All TKAs were performed through a medial parapatellar approach with a posterior-stabilized, cemented design, and each patient received a postoperative surgical drain. One of the 3 lead surgeons (TMM) in this study used a tourniquet from the time of incision until the completion of cementation, and the other 2 (MJT and RTT) predominantly used the tourniquet only during cementation. To elucidate any differences in GA injury between these 2 methods of tourniquet use, the patients were categorized into 2 groups base d on tourniquet use. Group 1 included patients in whom a tourniquet was used to maintain a bloodless surgical field from the time of incision until the completion of cementation, and Group 2 included patients in whom tourniquet use was more selective (ie, applied only during cementation). Group 1 comprised 31% (31/100) of patients, while Group 2 comprised 67% (67/100) of patients; no tourniquet was used in 2% (2/100) of cases. In addition, TXA was used in 98% (98/100) of patients: 84 patients received intravenous (IV) and 14 received topical TXA administration.
Continue to: ANALYSIS OF GENICULATE ARTERY INJURY
ANALYSIS OF GENICULATE ARTERY INJURY
The senior authors critically evaluated the GA during the primary TKAs and documented the presence or absence of injury in the operative reports. GA injury was reported if there was intraoperative visualization of pulsatile bleeding or visualization of arterial lumen in the anatomic areas of the middle and lateral inferior GAs. At 3 separate occasions during the operation, the surgeon looked specifically for pulsatile bleeding or arterial lumen in the areas of the middle and lateral inferior GAs, including after all the femoral and tibial bone cuts were completed, immediately before preparing to cement (before the tourniquet was inflated if there was not one inflated from the start of the procedure), and immediately after the tourniquet was deflated (Figure 1). All bleeding GAs that were visualized were effectively coagulated by cautery. Details regarding the use of TXA (topical or IV), intraoperative blood loss, postsurgical drain output for 24 hours after surgery, and blood transfusion were collected from the patients’ medical records (Table 1).
| Table 1. Operative Variables | |
Variable | Value |
Total number | 100 (100%) |
Intraoperative blood loss (mL) | 160 (25-500) |
Drain output 1st 24 hours (mL) | 488 (75-1980) |
Total output (mL) | 618 (75-2130) |
Use of TXA | 98 (98%) |
Topical TXA | 84 (84%) |
IV TXA | 14 (14%) |
Tourniquet entire procedure | 31 (31%) |
Operative variables other than geniculate artery injury. Data presented as mean (range) or n (%). TXA = tranexamic acid.
STATISTICAL METHODS
Statistical analysis was performed using the JMP software version 10.0.0 (SAS Institute, Inc). The overall rate of GA injury was determined, including the rates of GA injury based on location, time point, and method of diagnosis (pulsatile bleeding or arterial lumen visualization). If >1 GA injury occurred in the same knee, only 1 GA injury was calculated for the overall rate; however, each injury was specified separately when calculating the injury rate for the specific GA. Intraoperative blood loss, postoperative drain output, and the use of TXA were compared between cases in which a GA injury was detected and those in which it was not detected. Before conducting the retrospective review, a power analysis determined that we would require 100 patients to detect a difference in GA injury between Groups 1 and 2 (33 in Group 1 and 67 in Group 2), assuming a 30% rate in Group 1 and a 5% rate of GA injury in Group 2 using Fisher’s exact test. The Fisher’s exact test was used to compare categorical variables, and the Wilcoxon rank sum test was used to compare continuous variables. An alpha value of .05 was considered as statistically significant.
RESULTS
RATE OF GENICULATE ARTERY INJURY
The overall rate of any GA injury was 38% (38/100). Lateral inferior GA injury was more frequently detected than middle GA injury (31% vs 15% of TKAs, respectively; Table 2). Among the 31 lateral inferior GA injuries, 14 were identified as pulsatile bleeding, 7 as lumen visualizations, and 6 as both pulsatile bleeding and lumen visualization; 4 were detected by methods not recorded in the operative report. Of the lateral inferior GA injuries, 11 were identified after the bone cuts, 7 during meniscus removal, 3 during exposure, 1 after tourniquet deflation, and 9 at a time not recorded in the operative report. Of the 15 middle GA injuries, 9 were identified as pulsatile bleeding, 2 as lumen visualizations, and 4 as both pulsatile bleeding and lumen visualization. In addition, 7 of these GA injuries were identified after the bone cuts, 3 during cruciate removal, 1 after meniscus removal, 1 during exposure, and 3 at a time not recorded in the operative report (Table 3).
| Table 2. Rates of Geniculate Artery Injury Based on Location and Method | ||||
Location | Pulsatile Bleeding | Arterial Lumen | Both | Overall Rate |
Lateral inferior GA | 14 (14%) | 7 (7%) | 6 (6%) | 31 (31%) |
Middle GA | 9 (9%) | 2 (2%) | 4 (4%) | 15 (15%) |
Rates of geniculate artery injury based on location and method of diagnosis. Data presented as n (%). There were 4 additional lateral inferior and 9 middle GA injuries identified by a method not specified in the operative report. GA = geniculate artery.
Table 3. Rates of Geniculate Artery Injury Based on Time Point | ||
Time | Lateral Inferior GA | Middle GA |
After bone cuts | 11 (11%) | 7 (7%) |
During meniscus removal | 7 (7%) | 1 (1%) |
During exposure | 3 (3%) | 1 (1%) |
After tourniquet deflation | 1 (1%) | 0 (0%) |
During cruciate removal | 0 (0%) | 3 (3%) |
Not reported | 9 (9%) | 3 (3%) |
Rates of geniculate artery injury based on time point and method of diagnosis. GA = geniculate artery. Data presented as n (%).
FACTORS ASSOCIATED WITH GENICULATE ARTERY INJURY
Mean intraoperative estimated blood loss was 186 mL (standard deviation [SD], 111; range 50–500 mL) in those with a GA injury versus 147 mL (range, 82.25–400 mL) in those without injury (P = .14). Postoperative drain output in the 24 hours after surgery was 467 mL (SD 253, range 100–1105 mL) versus 502 mL (SD 378, range 75–1980 mL) in TKAs with and without GA injury, respectively (P = .82). Total estimated blood loss (combined intraoperative blood loss and 24-hour postoperative drain output) was 613 mL (SD 252, range 150–1105 mL) in TKAs with GA injury versus 620 mL (SD 393, range 75–2130 mL) without injury (P = .44) (Table 4). Overall, there was no statistical difference in blood loss, drain output, or combined output when analyzed according to lateral inferior or middle GA injury (P = .24–.82) (Table 5 and Table 6). No patients required blood transfusion postoperatively after TKA.
| Table 4. Factors Associated with GA Injury | |||
Outcome | GA Injury | No GA Injury | P Value |
Blood loss (mL) | 186 (50-500) | 147 (25-400) | .1366 |
24-Hour drain output (mL) | 467 (100-1105) | 502 (75-1980) | .8240 |
Total output (mL) | 613 (150-1105) | 620 (75-2130) | .4368 |
Differences in outcomes based on presence or absence of GA injury. Note that there were no significant differences. Values are reported as average (range). GA = geniculate artery.
| Table 5. Factors Associated with LIGA Injury | |||
Outcome | LIGA Injury | No LIGA Injury | P Value |
Blood loss (mL) | 178 (50-400) | 153 (25-500) | .2401 |
24-Hour drain output (mL) | 461 (100-890) | 501 (75-1980) | .8187 |
Total output (mL) | 610 (150-1080) | 621 (75-2130) | .4165 |
Differences in outcomes based on presence or absence of LIGA injury. Note that there were no significant differences. Values are reported as average (range). LIGA = lateral inferior geniculate artery.
| Table 6. Factors Associated with MGA Injury | |||
Outcome | MGA Injury | No MGA Injury | P Value |
Blood loss (mL) | 190 (75-500) | 156 (25-400) | .6225 |
24-Hour drain output (mL) | 455 (125-1105) | 494 (75-1980) | .6428 |
Total output (mL) | 582 (200-1105) | 624 (75-2130) | .6535 |
Differences in outcomes based on presence or absence of MGA injury. Note that there were no significant differences. Values are reported as average (range). MGA = middle geniculate artery.
IV administration of TXA was associated with a 37% (31/84) rate of GA injury, whereas topical TXA administration was associated with a 43% (6/14) rate of GA injury (P = .77). The rate of overall or isolated GA injury was not significantly different (P = .35–1.0) between IV and topical TXA administration (Table 7). In addition, total combined output was not significantly different (P = .1032) when comparing GA injury and noninjury in the subgroup analysis based on TXA use (IV or topical); however, topical administration was associated with lower intraoperative blood loss than IV administration (P = .0489), whereas IV administration was associated with lower 24-hour postoperative drain output than topical administration (P = .0169). There was no difference in blood loss, 24-hour drain output, or total output between those who did and did not sustain a GA injury in the group of patients who received IV TXA administration (Table 8, P = .2118–.7091). The same was true for those receiving topical TXA administration (Table 9, P = .0912–.9485).
Table 7. Factors Associated with TXA Injury | |||
Outcome | IV TXA (n = 84) | Topical TXA (n = 14) | P Value |
Any GA injury | 31 (37%) | 6 (43%) | .7683 |
LIGA injury | 24 (29%) | 6 (43%) | .3498 |
MGA injury | 13 (15%) | 2 (14%) | 1.0 |
Blood loss (mL) | 170 (25-500) | 113 (40-240) | .0489* |
24-Hour drain output (mL) | 454 (75-1980) | 662 (75-1800) | .0169* |
Total output (mL) | 592 (75-2130) | 751 (75-2130) | .1032 |
Differences in outcomes based on presence or absence of MGA injury. Note that there were no significant differences. Values are reported as n (%) or average (range). TXA = tranexamic acid, GA = geniculate artery, LIGA = lateral inferior geniculate artery, MGA = middle geniculate artery. *denotes statistical significance (P < .05).
| Table 8. Factors Associated with GA Injury Given IV TXA Use | ||||
Outcome | GA Injury | No GA Injury | Difference | P Value |
Blood loss (mL) | 195 (50-500) | 157 (25-400) | 38 | .2118 |
24-Hour drain output (mL) | 436 (100-1105) | 464 (75-1980) | 28 | .7091 |
Total output (mL) | 594 (150-1105) | 592 (75-2130) | 2 | .6982 |
Differences in outcomes of those patients who received IV TXA based on presence or absence of GA injury. Note that there were no significant differences. Values are reported as average (range). GA = geniculate artery, TXA = tranexamic acid.
| Table 9. Factors Associated with GA Injury Given Topical TXA Use | ||||
Outcome | GA Injury | No GA Injury | Difference | P Value |
Blood loss (mL) | 163 (100-250) | 84 (40-150) | 79 | .0912 |
24-Hour drain output (mL) | 610 (205-890) | 701 (415-1800) | 91 | .9485 |
Total output (mL) | 719 (405-960) | 775 (455-1900) | 56 | .6982 |
Differences in outcomes based on presence or absence of GA injury. Note that there were no significant differences. Values are reported as average (range). GA = geniculate artery.
Continue to: TOURNIQUET USE
TOURNIQUET USE
Comparison between Groups 1 (tourniquet use) and 2 (selective tourniquet use) revealed similar rates of overall and specific GA injury, intraoperative blood loss, and 24-hour postoperative drain output (Table 10). Group 1 demonstrated a 29% (9/31) rate of any GA injury versus 40% (27/67) in Group 2 (P = .37). For the specific lateral inferior GA injury, there was an equivalent rate of injury at 29% (9/31 in Group 1, 20/67 in Group 2; P = 1.0). Similarly, Group 1 patients had a 10% (3/31) rate of middle GA injury compared to 16% (11/67) in Group 2 patients (P = .53). Intraoperative estimated blood loss was lower in Group 1 (140 mL; range 25–400 mL) than in Group 2 (171 mL; range 40–500 mL) (P = .07), whereas the average 24-hour postoperative drain output was similar for Groups 1 (484 mL; range 75–1800 mL) and 2 (488 mL; range 100–1980 mL) (P = .46). Total estimated output was slightly less for Group 1 (593 mL; range 75–1900 mL) than for Group 2 (626 mL; range 125–2130 mL) (P = .38). A post hoc power analysis showed that with these rates of GA injury in Groups 1 and 2 and given a 2:1 ratio of the number of patients in Group 2 versus Group 1, a total of 185 patients in Group 1 and 370 patients in Group 2 would be needed to detect a statistically significant difference (P < .05) with a power of 80%.
| Table 10. Factors Associated with Tourniquet Use | ||||
Injury | Group 1 (n = 31) | Group 2 (n = 67) | Difference | P Value |
Overall GA injury | 9 (29%) | 27 (40%) | 11% | .3687 |
Lateral inferior GA | 9 (29%) | 20 (29%) | 0% | 1.0 |
Middle GA | 3 (10%) | 11 (16%) | 6% | .5382 |
Blood loss (mL) | 140 (25-400) | 171 (40-500) | 31 | .0661 |
24-Hour drain output (mL) | 484 (75-1800) | 488 (100-1980) | 4 | .4580 |
Total output (mL) | 593 (75-1900) | 626 (125-2130) | 33 | .3776 |
Differences in outcomes separated based on use of a tourniquet for the entire case (Group 1) vs use of a tourniquet only during cementation (Group 2). Note that there were no significant differences. Values are reported as n (%) or average (range). GA = geniculate artery.
DISCUSSION
Major arterial injury associated with TKA is a well-known, rare, and potentially devastating complication.1-13 However, the rate of injury to smaller periarticular vessels and the clinical significance of such injury have not been studied. The present study found a high rate of GA injury but no clinically significant difference in intraoperative blood loss or postoperative drain output between patients with GA injury (which was identified and managed with cautery) and those without GA injury. In addition, tourniquet use did not affect the rate of injury or the associated blood loss. To our knowledge, this is the first study that has critically evaluated the rate of GA injury occurring during TKA.
The overall rate of GA injury occurring during primary TKA was 38% with a higher predominance of lateral inferior than middle GA injury (31% vs 15%). Anatomically, it would follow that the lateral GA could be injured at a higher rate as it courses on top of the lateral meniscus, thus being susceptible to injury during cutting of the tibial plateau and meniscectomy. In addition, because the meniscectomy is performed longitudinally along the course of the artery, it may also be potentially lacerated in multiple locations and lengthwise. In theory, there should be a 100% rate of middle GA injury during posterior-stabilized TKA as this artery runs through the cruciate ligaments, which are resected during these cases. However, vessel injury was defined in this study as the visualization of pulsatile bleeding or vessel lumen. It is probable that in the cases in which injury to the middle GA was not visualized, it was cut but simultaneously cauterized. Thus, a lower rate (15%) of injury was detected. Nonetheless, these results still suggest that these periarticular arteries are injured at a higher rate; therefore, it is important for surgeons to specifically identify these injuries intraoperatively and adequately cauterize these vessels. As long as these arteries are cauterized, additional blood loss and potential vascular pseudoaneurysms should be prevented.
The effect of GA injury on intraoperative blood loss, 24-hour postoperative drain output, and total estimated blood loss showed no significant clinical findings in the present study cohort. In addition, examining the injury rate and blood loss based on TXA use also revealed no detrimental clinical associations. Although GA injury could inherently be associated with higher levels of blood loss and drain output, it is important to note that all GA injuries were also effectively coagulated, thus explaining the indifferent results. Accordingly, it should be recommended to surgeons performing primary TKAs to carefully evaluate for GA injury to prevent excessive blood loss or painful pseudoaneurysms. However, there is also a potential for beta error in this study in which a true difference did exist but no statistical difference was found due to the study being underpowered.
Full or selective tourniquet use during TKA did not appear to have any effect on the rate of GA injury, intraoperative blood loss, or 24-hour postoperative drain output. The similarity between GA injury rates perhaps further indicates an equivalent ability to detect these injuries between these two methods because of operative inspection for such injuries. With regard to intraoperative blood loss and drain output, the present findings are similar to previous studies demonstrating equivocal results despite variable tourniquet utilization in TKA.15,30 However, these results differ from those of Harvey and colleagues31, who demonstrated that blood loss inversely correlated with intraoperative tourniquet time. There are risks and benefits related to the use of both full and selective tourniquet methods, but either method does not appear to be advantageous in decreasing the rate of GA injury.
Continue to: Although this is the first study...
Although this is the first study to investigate the rates of GA injury and the potential clinical effects, there are limitations to this research. First, the study was retrospective in nature despite the fact that the data were collected prospectively. Only acute perioperative follow-up was performed, and thus, we were unable to evaluate longer term effects of GA injury on TKA outcomes. Furthermore, this study is potentially prone to beta error. As discussed above, 185 patients in Group 1 and 370 patients in Group 2 would be needed to detect a statistical difference in the rate of GA injury based on the rates found in this study. This study could also have been underpowered to identify differences in other aspects, such as differences in blood loss and drain. Furthermore, the data collected regarding intraoperative blood loss are estimated data and can be variable. Finally, visualization of vessel lumen and pulsatile bleeding is not a validated method to diagnose GA injuries, and potential injuries may have been missed. Despite such disadvantages, the strengths of this study include the concise results in consecutive patients, the generalizability of the data as multiple surgeons participated, and its first report of nonmajor periarticular artery injury.
CONCLUSIONS
There is a relatively high rate of GA injury, with injury to the lateral GA being visualized more often than injury to the middle GA. The majority of GA injuries occur around the time of bone cuts and meniscectomy, and tourniquet use does not affect the rate of injury. To reduce intraoperative blood loss and postoperative drain output, surgeons should identify and coagulate GA injuries routinely during primary TKA.
1. Calligaro KD, Dougherty MJ, Ryan S, Booth RE. Acute arterial complications associated with total hip and knee arthroplasty. J Vasc Surg. 2003;38(6):1170-1177. doi: 10.1016/S0741-5214(03)00918-2.
2. Dennis DA, Neumann RD, Toma P, Rosenberg G, Mallory TH. Arteriovenous fistula with false aneurysm of the inferior medial geniculate artery. A complication of total knee arthroplasty. Clin Orthop Relat Res. 1987(222):255-260.
3. Hagan PF, Kaufman EE. Vascular complication of knee arthroplasty under tourniquet. A case report. Clin Orthop Relat Res. 1990(257):159-161.
4. Holmberg A, Milbrink J, Bergqvist D. Arterial complications after knee arthroplasty: 4 cases and a review of the literature. Acta Orthop Scand. 1996;67(1):75-78. doi: 10.3109/17453679608995616.
5. Hozack WJ, Cole PA, Gardner R, Corces A. Popliteal aneurysm after total knee arthroplasty. Case reports and review of the literature. J Arthroplasty. 1990;5(4):301-305. doi: 10.1016/S0883-5403(08)80087-3.
6. Jeyaseelan S, Stevenson TM, Pfitzner J. Tourniquet failure and arterial calcification. Case report and theoretical dangers. Anaesthesia. 1981;36(1):48-50. doi: 10.1111/j.1365-2044.1981.tb08599.x
7. Mureebe L, Gahtan V, Kahn MB, Kerstein MD, Roberts AB. Popliteal artery injury after total knee arthroplasty. Am Surg. 1996;62(5):366-368.
8. O'Connor JV, Stocks G, Crabtree JD, Jr., Galasso P, Wallsh E. Popliteal pseudoaneurysm following total knee arthroplasty. J Arthroplasty. 1998;13(7):830-832. doi: 10.1016/S0883-5403(98)90039-0.
9. Ohira T, Fujimoto T, Taniwaki K. Acute popliteal artery occlusion after total knee arthroplasty. Arch Orthop Trauma Surg. 1997;116(6-7):429-430. doi: 10.1007/BF00434007.
10. Parfenchuck TA, Young TR. Intraoperative arterial occlusion in total joint arthroplasty. J Arthroplasty. 1994;9(2):217-220. doi: 10.1016/0883-5403(94)90071-X.
11. Rush JH, Vidovich JD, Johnson MA. Arterial complications of total knee replacement. The Australian experience. J Bone Joint Surg Br. 1987;69(3):400-402. doi: 10.1302/0301-620X.69B3.3584193.
12. Smith DE, McGraw RW, Taylor DC, Masri BA. Arterial complications and total knee arthroplasty. J Am Acad Orthop Surg. 2001;9(4):253-257.
13. Zahrani HA, Cuschieri RJ. Vascular complications after total knee replacement. J Cardiovasc Surg (Torino). 1989;30(6):951-952.
14. Isiklar ZU, Landon GC, Tullos HS. Amputation after failed total knee arthroplasty. Clin Orthop Relat Res. 1994(299):173-178.
15. Wakankar HM, Nicholl JE, Koka R, D'Arcy JC. The tourniquet in total knee arthroplasty. A prospective, randomised study. J Bone Joint Surg Br. 1999;81(1):30-33. doi: 10.1302/0301-620X.81B1.0810030.
16. Kumar SN, Chapman JA, Rawlins I. Vascular injuries in total knee arthroplasty. A review of the problem with special reference to the possible effects of the tourniquet. J Arthroplasty. 1998;13(2):211-216. doi: 10.1016/S0883-5403(98)90102-4.
17. DeLaurentis DA, Levitsky KA, Booth RE, et al. Arterial and ischemic aspects of total knee arthroplasty. Am J Surg. 1992;164(3):237-240. doi: 10.1016/S0002-9610(05)81078-5.
18. Langkamer VG. Local vascular complications after knee replacement: a review with illustrative case reports. Knee. 2001;8(4):259-264. doi: 10.1016/S0968-0160(01)00103-X.
19. Moran M, Hodgkinson J, Tait W. False aneurysm of the superior lateral geniculate artery following Total Knee Replacement. Knee. 2002;9(4):349-351. doi: 10.1016/S0968-0160(02)00061-3.
20. Pritsch T, Parnes N, Menachem A. A bleeding pseudoaneurysm of the lateral genicular artery after total knee arthroplasty--a case report. Acta Orthop. 2005;76(1):138-140. doi: 10.1080/00016470510030463.
21. Gaheer RS, Chirputkar K, Sarungi M. Spontaneous resolution of superior medial geniculate artery pseudoaneurysm following total knee arthroplasty. Knee. 2014;21(2):586-588. doi: 10.1016/j.knee.2012.10.021.
22. Law KY, Cheung KW, Chiu KH, Antonio GE. Pseudoaneurysm of the geniculate artery following total knee arthroplasty: a report of two cases. J Orthop Surg (Hong Kong). 2007;15(3):386-389. /doi: 10.1177/230949900701500331.
23. Noorpuri BS, Maxwell-Armstrong CA, Lamerton AJ. Pseudo-aneurysm of a geniculate collateral artery complicating total knee replacement. Eur J Vasc Endovasc Surg. 1999;18(6):534-535.
24. Pai VS. Traumatic aneurysm of the inferior lateral geniculate artery after total knee replacement. J Arthroplasty. 1999;14(5):633-634. doi: 10.1016/S0883-5403(99)90089-X.
25. Julien TP, Gravereaux E, Martin S. Superior medial geniculate artery pseudoaneurysm after primary total knee arthroplasty. J Arthroplasty. 2012;27(2):323 e313-326. doi: 10.1016/j.arth.2011.02.009.
26. Kalsi PS, Carrington RJ, Skinner JS. Therapeutic embolization for the treatment of recurrent hemarthrosis after total knee arthroplasty due to an arteriovenous fistula. J Arthroplasty. 2007;22(8):1223-1225. /doi: 10.1016/j.arth.2006.11.012.
27. Ritter MA, Herbst SA, Keating EM, Faris PM, Meding JB. Patellofemoral complications following total knee arthroplasty. Effect of a lateral release and sacrifice of the superior lateral geniculate artery. J Arthroplasty. 1996;11(4):368-372. doi: 10.1016/S0883-5403(96)80024-6.
28. Aldrich D, Anschuetz R, LoPresti C, Fumich M, Pitluk H, O'Brien W. Pseudoaneurysm complicating knee arthroscopy. Arthroscopy. 1995;11(2):229-230. doi: 10.1016/0749-8063(95)90073-X.
29. Sharma H, Singh GK, Cavanagh SP, Kay D. Pseudoaneurysm of the inferior medial geniculate artery following primary total knee arthroplasty: delayed presentation with recurrent haemorrhagic episodes. Knee Surg Sports Traumatol Arthrosc. 2006;14(2):153-155. doi: 10.1007/s00167-005-0639-4.
30. Abdel-Salam A, Eyres KS. Effects of tourniquet during total knee arthroplasty. A prospective randomised study. J Bone Joint Surg Br. 1995;77(2):250-253. doi: 10.1302/0301-620X.77B2.7706340.
31. Harvey EJ, Leclerc J, Brooks CE, Burke DL. Effect of tourniquet use on blood loss and incidence of deep vein thrombosis in total knee arthroplasty. J Arthroplasty. 1997;12(3):291-296. doi: 10.1016/S0883-5403(97)90025-5.
TAKE-HOME POINTS
- During total knee arthroscopy (TKA), 38% of patients will have an injury of a geniculate artery.
- The lateral inferior geniculate artery is most commonly injured, with a rate of injury of 31%.
- The middle geniculate artery is injured 15% of the time.
- The most common time of geniculate artery injury is during bone cutting or removal of the meniscus.
- There is no difference in rate of geniculate artery injury identification with or without the use of a tourniquet.
An Overview of Pharmacotherapy Options for Alcohol Use Disorder
Alcohol use disorder (AUD) is a relatively common condition characterized by a pattern of problematic alcohol consumption. According to the 2016 National Survey on Drug Use and Health (NSDUH) approximately 14.6 million Americans aged > 18 years had a diagnosis of AUD.1 This same survey also found that 26.2% of individuals over the age of 18 years reported engaging in binge drinking, which is ≥ 5 drinks in males or ≥ 4 drinks in females on the same occasion in the past month. Of those surveyed, 6.6% reported engaging in heavy drinking (binge drinking on 5 or more days in the past month).1
Military and veteran populations have a higher prevalence of alcohol misuse compared with that of the general population.2 Two out of 5 US veterans screen positive for lifetime AUD, which is higher than the prevalence of AUD in the general population.3 A number of studies have found that excessive alcohol use is common among military personnel.2,4,5 One study suggested that the average active-duty military member engages in approximately 30 binge drinking episodes per person per year.4 Military veterans may continue with a similar drinking pattern when transitioning to civilian life, explaining the high prevalence of AUD in the veteran population.6 Furthermore, since alcohol use provides temporary relief of posttraumatic stress disorder(PTSD) symptoms, a diagnosis of PTSD may also contribute to hazardous drinking in this population.7
Excessive alcohol consumption is associated with a number of negative outcomes, including increased motor-vehicle accidents, decreased medication adherence, and therefore, decreased efficacy, increased health care costs, and increased morbidity and mortality.8-13 Additionally, alcohol use is associated with a number of medical and psychiatric comorbidities.14,15 Compared with veterans without AUD, those with a diagnosis of AUD were 2.6 times more likely to have current depression and 2.8 times more likely to have generalized anxiety.3 Veterans with AUD also are 2.1 times more likely to have current suicidal ideation and 4.1 times more likely to have had a suicide attempt compared with veterans without AUD.3
Given the high prevalence and the associated risks, alcohol misuse should be properly addressed and treated. Pharmacotherapy for AUD has demonstrated efficacy in decreasing heavy drinking and prolonging periods of abstinence.16 Despite the proven benefits of available pharmacotherapy, these medications still are drastically underutilized in both the nonveteran and veteran populations. In fiscal year 2012, there were 444,000 veterans with a documented diagnosis of AUD; however, only 5.8% received evidence-based pharmacotherapy.17 The potential barriers for the utilization of AUD pharmacotherapy includes perceived low patient demand, lack of skill or knowledge about addiction, and lack of health care provider (HCP) confidence in efficacy.18 This article will provide a thorough overview of the pharmacotherapy options for the treatment of AUD and the evidence that supports the use of pharmacotherapy. We will then conclude with the recommended treatment approach for specialized patient populations.
FDA-Approved Pharmacotherapies
Naltrexone
Naltrexone was the second FDA-approved medication for the treatment of AUD and is considered a first-line agent by the Department of Veterans Affairs (VA).19,20 Unlike its predecessor, disulfiram, naltrexone significantly reduces cravings.21 During alcohol consumption endogenous opioid activity is greatly enhanced, leading to the rewarding effects of alcohol. By antagonizing the µ-opioid receptor, naltrexone mediates endorphin release during alcohol consumption, explaining the efficacy of naltrexone in AUD.21-28 Since cravings are reduced, patients are able to abstain from drinking for longer periods of time, and since pleasure is reduced, heavy drinking is also reduced.21,25
When compared with other pharmacotherapy options for AUD, naltrexone is less effective for abstinence and more effective for decreasing the time and frequency of heavy drinking days and average number of drinks consumed.29 A meta-analysis of 19 clinical trials found that naltrexone significantly reduced relapse rates in patients with AUD compared with those of placebo.30 This analysis also found that naltrexone reduced both the number of alcoholic beverages consumed and the risk of relapse to heavy drinking while increasing the total number of days of abstinence.30 The COMBINE study also found that patients receiving oral naltrexone in combination with medical treatment had a 28% reduced risk of having a heavy-drinking day.31
Dosing and Formulations
Naltrexone is available as a tablet or a long-acting injectable. The tablet is often dosed as 50 mg daily; although some studies suggest that daily doses up to 150 mg are safe and efficacious.21,25,32 The initial and maintenance dose for most patients is 50 mg daily. 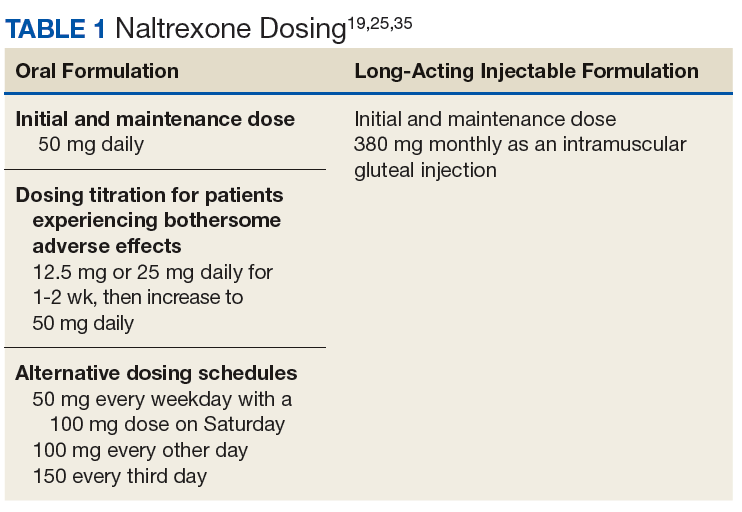
Nonadherence to the oral formulation of naltrexone is a significant barrier to the treatment of AUD. The long-acting injectable formulation is an option for patients who may have difficulty with adhering to oral naltrexone. As with the oral formulation, the long-acting naltrexone injection significantly reduces drinking days and increases abstinence.33 It was also found to be superior to oral naltrexone, acamprosate, and disulfiram in preventing discontinuation of AUD treatment.34 The long-acting injectable should be administered as an intramuscular gluteal injection at a dose of 380 mg monthly.35
Ideally, naltrexone should be initiated following the cessation of alcohol withdrawal symptoms. However, naltrexone can be safely administered in patients who are actively withdrawing from alcohol or in patients who continue to consume alcohol.25
Warnings, Precautions, and AEs
Naltrexone carries a US Food and Drug Administration (FDA) boxed warning for reversible hepatotoxicity. The risk of hepatotoxicity is increased in patients who receive higher doses (100-300 mg daily).21 A safety study demonstrated that the administration of 50 mg daily or less is not associated with significant hepatotoxicity.21,31 It is contraindicated in patients with acute hepatitis or liver failure and should be avoided in patients with liver function tests > 5 times the upper limit of normal.
Since naltrexone is a µ-opioid receptor antagonist, it is contraindicated in patients who are actively taking opioids or patients who have used opioids within the past 7 days. Co-administration with an opioid can lead to precipitated opioid withdrawal.21 Therefore, opioids should not be administered within 7 to 10 days of initiating naltrexone and 2 to 3 days after discontinuation of oral naltrexone.21 For patients receiving the long-acting injectable form of naltrexone, opioids should be avoided at least 1 month after the injection.25
To ensure that a patient is opioid free, HCPs can perform a toxicology screening prior to the initiation of naltrexone. Some HCPs may also perform a naloxone challenge to test whether a patient is at risk for precipitated opioid withdrawal prior to prescribing naltrexone. 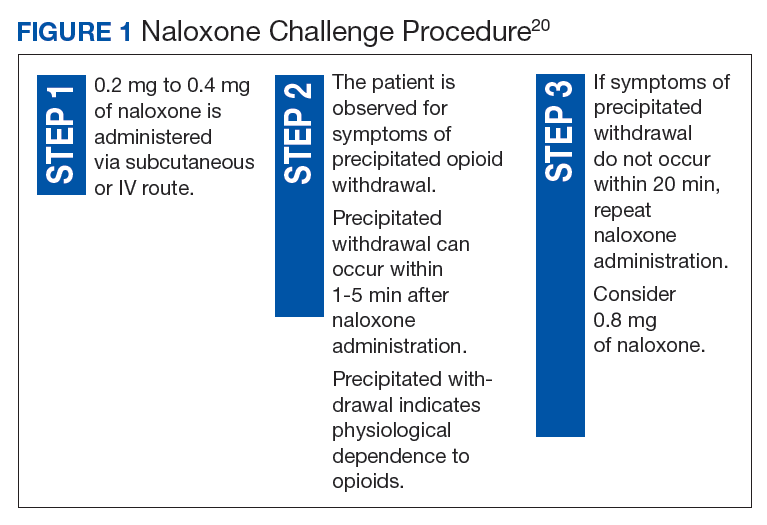
The adverse effects (AEs) of naltrexone are transient and include nausea, vomiting, anorexia, dizziness, and fatigue.19,35 Injection site reactions can be experienced with the long-acting naltrexone injection. Liver transaminases, such as the alanine aminotransferase and aspartate transaminase, should be monitored at baseline, 6 months after initiation, and annually during the course of treatment (Table 2). 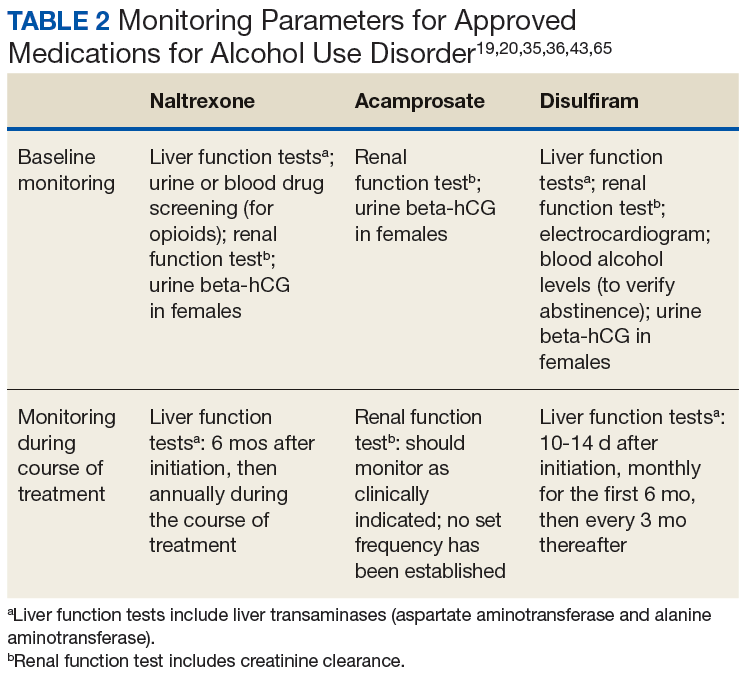
Acamprosate
The FDA approved acamprosate for the treatment of AUD in 2004, and it is also considered a first-line agent for AUD by the VA.20 It is approved for the maintenance of abstinence from alcohol use and is most efficacious when initiated in patients who are abstinent prior to treatment.29,36 Patients with AUD typically have a disruption in the balance between the inhibitory neurotransmitter, gamma-aminobutyric acid (GABA), and the excitatory neurotransmitter, glutamate. While its mechanism of action remains unknown, acamprosate is thought to increase the activity of GABA and to decrease the activity of glutamate at the N-methyl-D-aspartate (NMDA) receptors in the central nervous system. In essence, it is thought to restores the balance between GABA and glutamate in patients with AUD.36
Acamprosate has been found to effectively prevent relapse. Three randomized, double-blind, placebo-controlled European clinical trials evaluated the efficacy of acamprosate in combination with psychotherapy. The results demonstrated that patients taking acamprosate had longer durations of abstinence compared with that of placebo, improved rates of complete abstinence, and a prolonged time to first drink.37-39 A meta-analysis evaluated the use of acamprosate in AUD showed that acamprosate was more effective at maintaining abstinence in patients who had been abstinent prior to the initiation of therapy.29 These patients also had better abstinence rates if they had been abstinent for a longer duration prior to treatment initiation.30 Studies also showed that acamprosate significantly assisted with maintaining abstinence, improved rates of abstinence, and led to more days of abstinence.40,41 Of note, there also have been studies that have shown no significant benefit with acamprosate compared with placebo in the treatment of AUD.42
Dosing and Formulations
Acamprosate is available as a 333 mg delayed-release tablet. The recommended dose is 666 mg 3 times daily.36 The dose can be decreased to 333 mg 3 times a day in patients with moderate renal impairment (CrCl-30-50 mL/min).
Since acamprosate has been proven more effective in patients who are abstinent prior to initiation, acamprosate is typically initiated 5 days following alcohol cessation.25 However, it may be safely administered with alcohol and can continue to be administered in the event of a relapse.36
Warnings, Precautions, and AEs
Acamprosate is safe to use in patients with hepatic and mild-to-moderate renal impairment; however, it is contraindicated in patients with severe renal impairment (creatinine clearance [CrCl] ≤ 30 mL/min).36 Serum creatinine levels should be monitored at baseline and during treatment.
Acamprosate has a number of related AEs. The most common is diarrhea. Less common AEs include insomnia, anxiety, and depression. Due to its possible potential to increase suicidality, HCPs should monitor for the emergence of mood changes.36
Disulfiram
Disulfiram is an aldehyde dehydrogenase inhibitor that is FDA approved for the management of AUD.43 When ingested, ethanol is typically metabolized to acetaldehyde, which is further metabolized to acetic acid by aldehyde dehydrogenase.44 Disulfiram inhibits aldehyde dehydrogenase, leading to a rapid accumulation of acetaldehyde within the plasma (outlined in Figure 2). 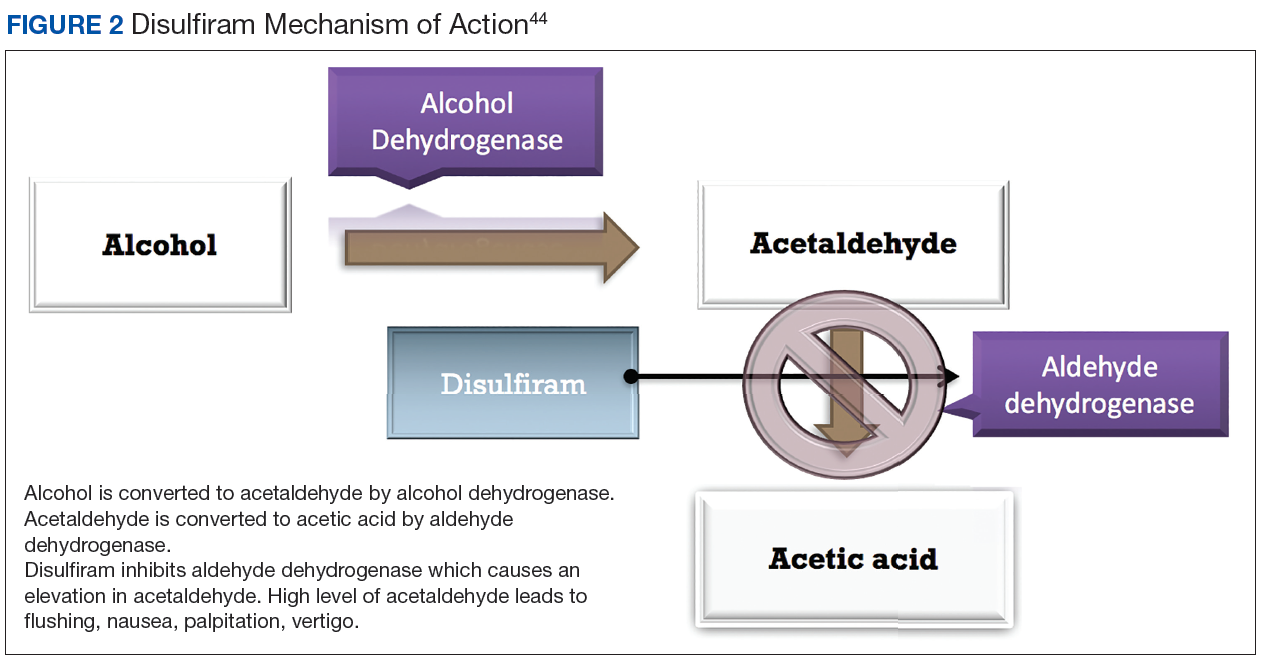
There are limited studies that prove the efficacy of disulfiram. In a randomized trial comparing disulfiram, acamprosate, and naltrexone, patients treated with disulfiram had fewer heavy drinking days, lower rates of weekly alcohol consumption, and a longer period of abstinence compared to other medications.45 Additionally, a 2014 meta-analysis showed that in open-label studies, disulfiram was more beneficial in preventing alcohol consumption when compared with acamprosate, naltrexone, and placebo. This result was not seen in blinded studies.46 Disulfiram does not reduce alcohol cravings, and adherence is a significant issue. It is most effective between 2 and 12 months, when taken under supervised administration.47
Dosing and Formulations
Disulfiram is only available as a tablet. The recommended starting dose is up to 500 mg for the first 2 weeks. However, the maintenance dose can range from 125 to 500 mg daily.43 Patients must be abstinent from alcohol at least 12 to 24 hours prior to the initiation of disulfiram.25 A blood alcohol level can be obtained in order to confirm abstinence.25
Warnings, Precautions, and AEs
Disulfiram is contraindicated in patients with severe myocardial disease or coronary occlusion and severe hepatic impairment.43 Other contraindications are outlined in Table 3. 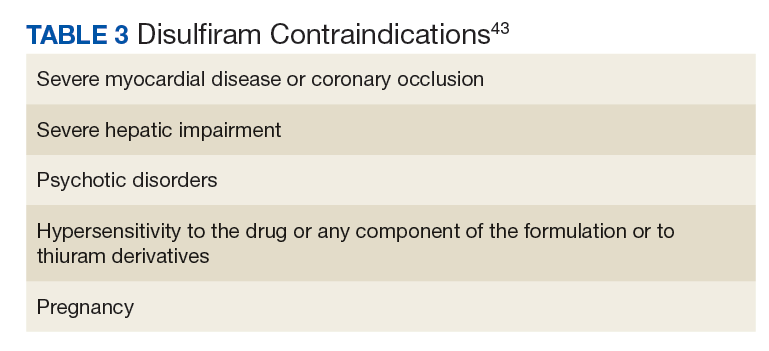
Common AEs include somnolence, a metallic after-taste, and peripheral neuropathy.43 Patients should be informed that they could experience a disulfiram reaction with even small amounts of alcohol; all foods, drinks, and medications containing alcohol should be avoided. Due to the potential of disulfiram potential to cause hepatotoxicity, liver transaminases should be monitored at baseline, 2 weeks after initiation, and monthly for the first 6 months of therapy, and every 3 months thereafter (Table 2).25
Off-Label Pharmacotherapies
Topiramate
Although not approved for AUD, topiramate has been used off-label for this indication as it has proven efficacy in clinical trials.48-56 While its mechanism of action for AUD is unclear, it has been theorized that topiramate antagonizes glutamate receptors, thereby reducing dopamine release in the nucleus accumbens upon alcohol consumption, and potentiates the inhibitory neurotransmitter GABA.50,51,57-60
In clinical trials, topiramate has demonstrated significant efficacy in reducing cravings, the risk of relapse, and the number of drinks consumed daily, while increasing abstinence.51,53,60 Batki and colleagues report that the administration of topiramate in veterans with co-occurring AUD and PTSD reduced alcohol consumption, cravings, and the severity of their PTSD symptoms.61
Dosing and Formulations
Topiramate is available in a number of formulations; however, only the immediate-release formulation is recommended for the treatment of AUD. The extended-release formulation is contraindicated in the setting of alcohol consumption and is therefore not used for the treatment of AUD.62 Doses should be initiated at 25 mg daily and can be titrated in 25 to 50 mg weekly increments. To minimize AEs and to reduce the risk of patients discontinuing therapy, the dose may be slowly titrated over 8 weeks.53,59 An effective dose can range from 75 to 300 mg in divided doses; however, AEs often limit the tolerability of increased doses.48,50,63,64 The VA/DoD Practice Guideline for the Management of Substance Use Disorders recommends titrating topiramate to a target dose of 100 mg twice daily.65
Warnings, Precautions, and AEs
Common AEs include memory impairment, anorexia, fatigue, paresthesias, and somnolence.62 There is an increased risk of nephrolithiasis with topiramate administration; therefore, adequate hydration is crucial.49,59 Titration of topiramate to the target dose is suggested to limit AEs.35
Prior to initiating topiramate, the patient’s renal function should be assessed. In those with a CrCl < 70 mL/min the dose should be decreased by 50% and titrated more slowly.62
Gabapentin
Gabapentin is prescribed for the treatment of partial seizures and postherpetic neuralgia. In recent years, it has shown efficacy for treating other conditions, such as AUD. While its mechanism for this indication remains unclear, the inhibition of excitatory alpha-2-delta calcium channels and stimulation of inhibitory GABAA receptors by gabapentin is believed to decrease alcohol cravings, reduce anxiety, and increase abstinence.66
A 12-week, double-blind, randomized controlled trial demonstrated that oral gabapentin was more efficacious than was placebo for improving rates of abstinence, decreasing heavy drinking, and reducing alcohol cravings.67 Gabapentin may also serve as a good adjunctive option to naltrexone therapy either when naltrexone monotherapy fails or if a patient is complaining of sleep and mood disturbances with abstinence.67,68
Dosing and Formulations
Gabapentin should be titrated slowly to minimize AEs. It can be initiated at 300 mgon day 1 and increase by 300-mg increments. Doses of 900 to 1,800 mg per day have proven to be efficacious for the treatment of AUD.66,67 These proposed doses can be safely administered to most patients, but caution should be observed in elderly and patients with renal impairment.69,70
Warnings, Precautions, and AEs
The most common AEs for gabapentin include drowsiness, dizziness, and fatigue.69 Since it is renally cleared, renal function should be monitored at baseline and periodically during treatment. Gabapentin is not metabolized by liver enzymes and does not significantly interact with drugs that require hepatic metabolism.
Baclofen
Baclofen has generated attention as an unconventional treatment option for alcohol dependence. Its unique mechanism of action, which involves the activation of GABAB receptors and the subsequent inhibition of dopaminergic neurons, makes it useful for the treatment of AUD.71
A 12-week study evaluating the effectiveness and safety of baclofen for the maintenance of alcohol abstinence demonstrated that baclofen was more efficacious than placebo for increasing abstinence in patients with liver cirrhosis. In addition, there were more cumulative days of abstinence with baclofen use (62.8 days) vs placebo (30.8 days) in cirrhotic patients.72
Dosing and Formulations
There has been a range of doses studied for baclofen in the treatment of AUD. Studies indicate that initiating baclofen at 30 mg daily and increasing doses based on the patient’s clinical response is most effective.72 As a result, doses as high as 275 mg per day have been used for some patients.73 Baclofen is renally cleared; therefore, the dose should be adjusted in patients with renal impairment.74
Warnings, Precautions, and AEs
Some of the common AEs of baclofen include drowsiness, confusion, headache, and nausea. Due to its CNS depressant effects, baclofen should be used with caution in the elderly. Also, due to its potential to cause withdrawal symptoms, baclofen should not be discontinued abruptly.74,75 Baclofen is a safe option for patients with severe liver disease, due to its minimal hepatic metabolism.76
Ondansetron
Ondansetron is approved for both prophylactic and therapeutic use as an antiemetic agent for chemotherapy and anesthesia-induced nausea and vomiting.77As a highly selective and competitive 5-HT3 receptor antagonist, ondansetron has demonstrated efficacy in reducing serotonin-mediated dopaminergic effects in AUD.78,79 The lowering of these dopaminergic effects is associated with a reduction in alcohol-induced gratification and consumption.
In a 12-week, randomized controlled trial, 271 patients diagnosed with AUD received ondansetron twice daily or placebo, combined with weekly cognitive behavioral therapy (CBT). There was a statistically significant decrease in alcohol consumption in patients treated with ondansetron compared with those who received placebo. Additionally, ondansetron was superior to placebo for increasing the percentage and total amount of days abstinent.80 These results were primarily observed in participants diagnosed with early-onset AUD (defined as onset at 25 years or younger), which may suggest the presence of genetically predisposed serotonin dysfunctions.80,81 In contrast, there were no significant differences observed in participants with late-onset AUD (onset after age 25 years) in either study group.80
Dosing and Formulations
Given its modest efficacy for the treatment of AUD, ondansetron has demonstrated clinical benefits at doses of 0.001 to 0.016 mg/kg twice daily. Additionally, 1 study reported that low-dose ondansetron (0.25 mg twice daily) was effective in reducing alcohol consumption when compared with placebo or high-dose ondansetron, which was considered 2 mg twice daily.82
Warnings, Precautions, and AEs
The most commonly reported AEs with ondansetron include fatigue, headache, anxiety, and serotonin syndrome when used concomitantly with other serotonergic agents.77 Also, serious cardiovascular complications, such as QTc prolongation, angina pectoris, atrial fibrillation, and arrhythmias have been observed with IV administration.77,81,83 Consequently, patients with electrolyte imbalances (eg, hypokalemia, hypomagnesemia), a history of congestive heart failure, or concomitant medications associated with QTc prolongation, should be monitored with an electrocardiogram (ECG) or switched to another agent.77
Treatment Approach with AUD Pharmacotherapy
There is insufficient evidence to support the use of 1 medication for AUD over the others.16,46,84 Instead, the choice of therapy largely depends on the patient’s comorbidities, renal and hepatic function, and on the patient’s established goals, whether abstinence or reduction in alcohol consumption (Table 4). 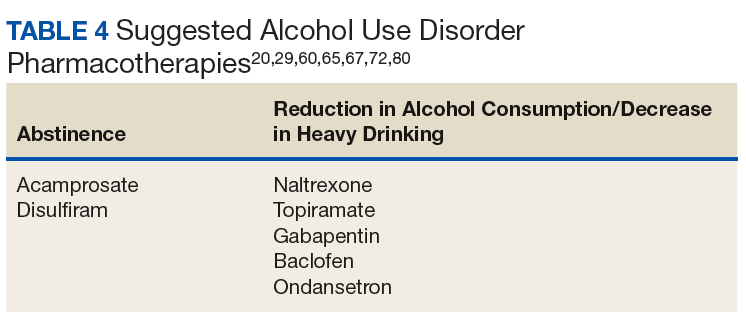
There is much debate over the appropriate duration of treatment for AUD pharmacotherapy. It is recommended that patients remain on these medications for at least 3 months. Pharmacotherapy can be continued for 6 to 12 months as the risk for relapse is highest during this time frame.85,86 The National Institute for Health and Care Excellence guidelines recommend discontinuing AUD pharmacotherapy if alcohol consumption persists 4 to 6 weeks after initiation.86
Comorbid Liver Disease
Due to the negative effects of heavy alcohol consumption on the liver, patients with AUD may develop liver disease. Health care providers should be aware of the appropriate pharmacotherapy options for patients with comorbid liver disease. Acamprosate is mostly excreted unchanged by the kidneys, therefore is an option for patients with liver disease whose goal is complete abstinence. Topiramate is another option for use in patients with liver impairment. Unlike acamprosate, topiramate would be a better option in patients who may not completely abstain from alcohol consumption but would like to decrease the amount of heavy drinking days.87
Gabapentin, baclofen, and ondansetron are also options for those with liver disease. Baclofen in particular has been studied in those with advanced liver disease, and it was found to be safe and effective.88,89
Comorbid Renal Disease
Naltrexone is an option for patients with mild renal impairment. Naltrexone and its major metabolite, 6-ß-naltrexol, are renally excreted; however, urinary excretion of unchanged naltrexone accounts for < 2% of the oral dose.19 Even with its low potential for accumulation, HCPs should carefully monitor for AEs in patients with moderate-to-severe renal impairment. Disulfiram is another pharmacotherapy option, since it is mostly metabolized by the liver.
Gabapentin, baclofen, and ondansetron are also possible options; however, their doses should be renally adjusted. Overall, there are limited studies on the use of these medications treating AUD in patients with renal impairment.
Pregnancy
Alcohol consumption during pregnancy can result in a wide range of birth defects to the unborn fetus. Due to the negative effects of alcohol consumption on the fetus, pregnant females should be referred to a professional alcohol treatment program. Although AUD pharmacotherapy may be considered in pregnant females, there have been no human studies that have examined the efficacy and safety in this patient population. All evidence comes from animal studies, case reports, and case series.90
Naltrexone is the most widely used medication for AUD in pregnancy. It is considered pregnancy category C and 1 study in particular did not detect any gross abnormalities in fetal development in pregnancy.19, 90 Disulfiram, acamprosate, and topiramate have all been shown to cause harm to either animal or human fetuses and are generally not recommended.36,44,63 Similar to naltrexone, gabapentin and baclofen are also pregnancy category C.69,77 Ondansetron is pregnancy category B, but it should still be used with caution since its use in pregnancy for the treatment of AUD has not been studied.77,90
Psychosocial Interventions
It is recommended that AUD pharmacotherapy be used in conjunction with a psychosocial intervention, such as CBT or medical management. Many of the studies evaluating the efficacy of AUD pharmacotherapy combined psychosocial interventions with medications. The literature suggests that when combined with CBT or medical management therapy, pharmacotherapy used for AUD results in better alcohol consumption outcomes.31,91 It has also been suggested that psychosocial interventions may improve patient adherence to AUD pharmacotherapy.25
Barriers
Inadequate HCP training on the use of AUD pharmacotherapy has been found to be a major barrier to the utilization of AUD pharmacotherapy, along with a lack of confidence in the effectiveness of these medications.18 Increasing HCP education on the use and benefits of these agents may increase the overall confidence of HCPs in prescribing pharmacotherapy for the treatment of AUD, especially in the primary care setting. One aspect that has been found to improve education and the prescribing of pharmacotherapy for AUD within the Veterans Health Administration has been the use of academic detailing programs.92 Academic detailing is a multifaceted educational outreach program that is used to assist with HCP education. Additionally, clinical pharmacists can be consulted to help develop a safe and effective AUD pharmacotherapy treatment regimen.
Conclusion
There is a major disparity in the prevalence of AUD between the general population and the military and veteran populations. Many clinical trials have found a number of pharmacotherapy options to be effective for the treatment of AUD. Despite the need and the proven benefits, the utilization of AUD pharmacotherapy still remains low in both the general and veteran populations. Increasing provider education and addressing other potential barriers for the use of pharmacotherapy for AUD can have a positive impact on prescribing patterns, which can ultimately improve alcohol consumption outcomes in patients with a diagnosis of AUD.
1. Substance Abuse and Mental Health Services Administration, Center for Behavioral Health Statistics and Quality. Results from the 2016 National Survey on Drug Use and Health: detailed tables. Substance Abuse and Mental Health Services Administration. https://www.samhsa.gov/data/sites/default/files/NSDUH-DetTabs-2016/NSDUH-DetTabs-2016.pdf. Published September 7, 2017. Accessed September 13, 2018.
2. Jones E, Fear NT. Alcohol use and misuse within the military: a review. Int Rev Psychiatry. 2011;23(2):166-172.
3. Fuehrlein BS, Mota N, Arias AJ, et al. The burden of alcohol use disorders in US military veterans: results from the National Health and Resilience in Veterans Study. Addiction. 2016;111(10):1786-1794.
4. Stahre MA, Brewer RD, Fonseca VP, Naimi TS. Binge drinking among US active-duty military personnel. Am J Prev Med. 2009;36(3):208-217.
5. Institute of Medicine. Substance use disorders in the U.S. armed forces. https://www.nap.edu/resource/13441/SUD_rb.pdf. Published September 2012. Accessed September 12, 2018.
6. McDevitt-Murphy ME, Murphy JG, Williams JL, Monahan CJ, Bracken-Minor KL. Brief intervention to reduce hazardous drinking and enhance coping among OEF/OIF/OND veterans. Prof Psychol Res Pr. 2015;46(2):83-89.
7. Jacobson IG, Ryan MA, Hooper TI, et al. Alcohol use and alcohol-related problems before and after military combat deployment. JAMA. 2008;300(6):663-675.
8. Chou SP, Dawson DA, Stinson FS, et al. The prevalence of drinking and driving in the United States, 2001-2002: results from the National Epidemiologic Survey on Alcohol and Related Conditions. Drug Alcohol Depend. 2006;83(2):137-146.
9. Bazargan-Hejazi S, Bazargan M, Hardin E, Bing EG. Alcohol use and adherence to prescribed therapy among under-served Latino and African-American patients using emergency department services. Ethn Dis. 2005;15(2):267-275.
10. Kamali M, Kelly BD, Clarke M, et al. A prospective evaluation of adherence to medication in first episode of schizophrenia. Eur Psychiatry. 2006;21(1):29-33.
11. Tucker JS, Burnam MA, Sherbourne CD, Kung FY, Gifford AL. Substance abuse and mental health correlates of nonadherence to antiretroviral medications in a sample of patients with human immunodeficiency virus infection. Am J Med. 2003;114(7):573-580.
12. Rehm J, Room R, Graham K, Monteiro M, Gmel G, Sempos CT. The relationship of average volume of alcohol consumption and patterns of drinking to burden of disease: an overview. Addiction. 2003;98(9):1209-1228.
13. Kendler KS, Ohlsson H, Sundquist J, Sundquist K. Alcohol use disorder and mortality across the lifespan: a longitudinal cohort and co-relative analysis. JAMA Psychiatry. 2016;73(6):575-581.
14. Hasin DS, Stinson FS, Ogburn E, Grant BF. Prevalence, correlates, disability, and comorbidity of DSM-IV alcohol abuse and dependence in the United States. Arch Gen Psychiatry. 2007;64(7):830-842.
15. Grant BF, Stinson FS, Dawson DA, et al. Prevalence and co-occurrence of substance use disorders and independent mood and anxiety disorders: results from the National Epidemiologic Survey on Alcohol and Related Conditions. Arch Gen Psychiatry. 2004;61(8):807-816.
16. Jonas DE, Amick HR, Feltner C, et al. Pharmacotherapy for adults with alcohol use disorders in outpatient settings: a systematic review and meta-analysis. JAMA. 2014;311(18):1889-1900.
17. Del Re AC, Gordon AJ, Lembke A, Harris AH. Prescription of topiramate to treat alcohol use disorders in the Veterans Health Administration. Addict Sci Clin Pract. 2013;8:12.
18. Harris AH, Ellerbe L, Reeder RN, et al. Pharmacotherapy for alcohol dependence: perceived treatment barriers and action strategies among Veterans Health Administration service providers. Psychol Serv. 2013;10(4):410-419.
19. ReVia [package insert]. Pomona, NY: Duramed Pharmaceuticals; 2013.
20. US Department of Veterans Affairs, Pharmacy Benefits Management Services, Medical Advisory Panel, and VISN Pharmacist Executives. Alcohol use disorder pharmacotherapy: naltrexone, acamprosate, and disulfiram recommendations for use. https://www.pbm.va.gov/PBM/clinicalguidance/clinicalrecommendations/Alcohol_Use_Disorder_Pharmacotherapy_Acamprosate_Naltrexone_Disulfiram_Recommendations_for_Use.docx. Published December 2013. Accessed September 17, 2018.
21. Anton RF. Naltrexone for the management of alcohol dependence. N Engl J Med. 2008;359(7):715-721.
22. O’Malley SS, Rounsaville BJ, Farren C, et al. Initial and maintenance naltrexone treatment for alcohol dependence using primary care vs specialty care: a nested sequence of 3 randomized trials. Arch Intern Med. 2003;163(14):1695-1704.
23. O’Brien CP. A range of research-based pharmacotherapies for addiction. Science. 1997;278(5335):66-70.
24. Swift RM. Effect of naltrexone on human alcohol consumption. J Clin Psychiatry. 1995;56 (suppl 7):24-29.
25. Center for Substance Abuse Treatment. Incorporating Alcohol Pharmacotherapies into Medical Practice. Treatment Improvement Protocol (TIP) Series 49. Rockville, MD: Substance Abuse and Mental Health Services Administration; 2009.
26. Spanagel R, Zieglgänsberger W. Anti-craving compounds for ethanol: new pharmacological tools to study addictive processes. Trends Pharmacol Sci. 1997;18(2):54-59.
27. Herz A. Endogenous opioid systems and alcohol addiction. Psychopharmacology (Berl). 1997;129(2):99-111.
28. Miller NS. The integration of pharmacological and nonpharmacological treatments in drug/alcohol addiction. J Addict Dis. 1997;16(4):1-5.
 29. Maisel NC, Blodgett JC, Wilbourne PL, Humphreys K, Finney JW. Meta-analysis of naltrexone and acamprosate for treating alcohol use disorders: when are these medications most helpful? Addiction. 2013;108(2):275-293.
30. Bouza C, Angeles M, Muñoz A, Amate JM. Efficacy and safety of naltrexone and acamprosate in the treatment of alcohol dependence: a systematic review. Addiction. 2004;99(7):811-828.
31. Anton RF, O’Malley SS, Ciraulo DA, et al; COMBINE Study Research Group. Combined pharmacotherapies and behavioral interventions for alcohol dependence: the COMBINE study: a randomized controlled trial. JAMA. 2006;295(17):2003-2017.
32. Oslin DW, Pettinati HM, Volpicelli JR, Wolf AL, Kampman KM, O’Brien CP. The effects of naltrexone on alcohol and cocaine use in dually addicted patients. J Subst Abuse Treat. 1999;16(2):163-167.
33. Kranzler HR, Wesson DR, Billot L; DrugAbuse Sciences Naltrexone Depot Study Group. Naltrexone depot for treatment of alcohol dependence: a multicenter, randomized, placebo-controlled clinical trial. Alcohol Clin Exp Res. 2004;28(7):1051-1059.
34. Bryson WC, McConnell J, Korthuis PT, McCarty D. Extended-release naltrexone for alcohol dependence: persistence and healthcare costs and utilization. Am J Manag Care. 2011;17 (suppl 8):S222-S234.
35. Vivitrol [package insert]. Waltham, MA: Alkermes, Inc.; 2010.
36. Campral [package insert]. St. Louis, MO: Forest Laboratories Inc; 2012.
37. Paille F, Guelfi J, Perkins AC, Royer RJ, Steru L, Parot P. Double-blind randomized multicentre trial of acamprosate in maintaining abstinence from alcohol. Alcohol. 1995;30(2):239-247.
38. Pelc I, Verbanck P, Le Bon O, Gavrilovic M, Lion K, Lehert P. Efficacy and safety of acamprosate in the treatment of detoxified alcohol-dependent patients. A 90-day placebo-controlled dose-finding study. Br J Psychiatry. 1997;171:73-77.
39. Sass H, Soyka M, Mann K, Zieglgänsberger W. Relapse prevention by acamprosate. Results from a placebo-controlled study on alcohol dependence. Arch Gen Psychiatry. 1996;53(8):673-680.
40. Mann K, Lehert P, Morgan MY. The efficacy of acamprosate in the maintenance of abstinence in alcohol-dependent individuals: results of a meta-analysis. Alcohol Clin Exp Res. 2004;28(1):51-63.
41. Mason BJ, Lehert P. Acamprosate for alcohol dependence: a sex-specific meta-analysis based on individual patient data. Alcohol Clin Exp Res. 2012;36(3):497-508.
42. Richardson K, Baillie A, Reid S, et al. Do acamprosate or naltrexone have an effect on daily drinking by reducing craving for alcohol? Addiction. 2008;103(6):953-959.
43. Antabuse [package insert]. North Wales, PA: Teva Pharmaceuticals; 2015.
44. Ait-Daoud N, Johnson BA. Medications for the treatment of alcoholism. In: Johnson BA, Ruiz P, Galanter M, eds. Handbook of Clinical Alcoholism Treatment. Lippincott Williams & Wilkins, Baltimore; 2003
45. Laaksonen E, Koski-Jännes A, Salaspuro M, Ahtinen H, Alho H. A randomized, multicentre, open-label, comparative trial of disulfiram, naltrexone and acamprosate in the treatment of alcohol dependence. Alcohol Alcohol. 2008;43(1):53-61.
46. Skinner MD, Lahmek P, Pham H, Aubin HJ. Disulfiram efficacy in the treatment of alcohol dependence: a meta-analysis. PLoS One. 2014;9(2):e87366.
47. Jørgensen CH, Pedersen B, Tønnesen H. The efficacy of disulfiram for the treatment of alcohol use disorder. Alcohol Clin Exp Res. 2011;35(10):1749-1758.
48. Arbaizar B, Diersen-Sotos T, Gómez-Acebo I, Llorca J. Topiramate in the treatment of alcohol dependence: a meta-analysis. [Article in English, Spanish] Actas Esp Psiquiatr. 2010;38(1):8-12.
49. Johnson BA, Ait-Daoud N. Topiramate in the new generation of drugs: efficacy in the treatment of alcoholic patients. Curr Pharm Des. 2010;16(19):2103-2112.
50. Paparrigopoulos T, Tzavellas E, Karaiskos D, Kourlaba G, Liappas I. Treatment of alcohol dependence with low-dose topiramate: an open-label controlled study. BMC Psychiatry. 2011;11:41.
51. Johnson BA, Ait-Daoud N, Bowden CL, et al. Oral topiramate for treatment of alcohol dependence: a randomised controlled trial. Lancet. 2003;361(9370):1677-1685.
52. Johnson BA, Ait-Daoud N, Akhtar FZ, Ma JZ. Oral topiramate reduces the consequences of drinking and improves the quality of life of alcohol-dependent individuals: a randomized controlled trial. Arch Gen Psychiatry. 2004;61(9):905-912.
53. Johnson BA, Rosenthal N, Capece JA, et al; Topiramate for Alcoholism Advisory Board; Topiramate for Alcoholism Study Group. Topiramate for treating alcohol dependence: a randomized controlled trial. JAMA. 2007;298(14):1641-1651.
54. Flórez G, García-Portilla P, Alvarez S, Saiz PA, Nogueiras L, Bobes J. Using topiramate or naltrexone for the treatment of alcohol-dependent patients. Alcohol Clin Exp Res. 2008;32(7):1251-1259.
55. Flórez G, Saiz PA, Garcia-Portilla P, Alvarez S, Nogueiras L, Bobes J. Topiramate for the treatment of alcohol dependence: comparison with naltrexone. Eur Addict Res. 2011;17(1):29-36.
56. Baltieri DA, Daró FR, Ribeiro PL, de Andrade AG. Comparing topiramate with naltrexone in the treatment of alcohol dependence. Addiction. 2008;103(12):2035-2044.
57. White HS, Brown SD, Woodhead JH, Skeen GA, Wolf HH. Topiramate modulates GABA-evoked currents in murine cortical neurons by a nonbenzodiazepine mechanism. Epilepsia. 2000;41(suppl 1):S17-S20.
58. White HS, Brown SD, Woodhead JH, Skeen GA, Wolf HH. Topiramate enhances GABA-mediated chloride flux and GABA-evoked chloride currents in murine brain neurons and increases seizure threshold. Epilepsy Res. 1997;28(3):167-179.
59. Guglielmo R, Martinotti G, Quatrale M, et al. Topiramate in alcohol use disorders: review and update. CNS Drugs. 2015;29(5):383-395.
60. Kranzler HR, Covault J, Feinn R, et al. Topiramate treatment for heavy drinkers: moderation by a GRIK1 polymorphism. Am J Psychiatry. 2014;171(4):445-452.
61. Batki SL, Pennington DL, Lasher B, et al. Topiramate treatment of alcohol use disorder in veterans with posttraumatic stress disorder: a randomized controlled pilot trial. Alcohol Clin Exp Res. 2014;38(8):2169-2177.
62. Topamax [package insert]. Titusville, NJ: Janssen Pharmaceuticals Inc; 2017.
63. Meador KJ. Cognitive effects of levetiracetam versus topiramate. Epilepsy Curr. 2008;8(3):64-65.
64. Luykx JJ, Carpay JA. Nervous system adverse responses to topiramate in the treatment of neuropsychiatric disorders. Expert Opin Drug Saf. 2010;9(4):623-631.
65. The Management of Substance Use Disorder Work Group; US Department of Veteran Affairs, US Department of Defense. VA/DoD clinical practice guideline for the management of substance use disorders. https://www.healthquality.va.gov/guidelines/MH/sud/VADODSUDCPGRevised22216.pdf. Published December 2015. Accessed September 12, 2018.
66. Sills GJ. The mechanism of action of gabapentin and pregabalin. Curr Opin Pharmacol. 2006;6(1):108-113.
67. Mason BJ, Quello S, Goodell V, Shandan F, Kyle M, Begovic A. Gabapentin treatment for alcohol dependence: a randomized clinical trial. JAMA Intern Med. 2014;174(1):70-77.
68. Anton RF, Myrick H, Wright TM, et al. Gabapentin combined with naltrexone for the treatment of alcohol dependence. Am J Psychiatry. 2011;168(7):709-717.
69. Neurontin [package insert]. New York, NY: Pfizer; 2017.
70. American Geriatrics Society 2015 Beers Criteria Update Expert Panel. American Geriatrics Society 2015 updated Beers criteria for potentially inappropriate medication use in older adults. J Am Geriatr Soc. 2015;63(11):2227-2246.
71. Addolorato G, Leggio L. Safety and efficacy of baclofen in the treatment of alcohol-dependent patients. Curr Pharm Des. 2010;16(19):2113-2117.
72. Addolorato G, Leggio L, Ferrulli A, et al. Effectiveness and safety of baclofen for maintenance of alcohol abstinence in alcohol-dependent patients with liver cirrhosis: a randomized, double-blind, controlled study. Lancet. 2007;370(9603):1915-1922.
73. Dore GM, Lo K, Juckes L, Bezyan S, Latt N. Clinical experience with baclofen in the management of alcohol-dependent patients with psychiatric comorbidity: a selected cases series. Alcohol Alcohol. 2011;46(6):714-720.
74. Baclofen tablet [package insert]. Pulaski, TN: AvKare Inc; 2018.
75. Hansel DE, Hansel CR, Shindle MK, et al. Oral baclofen in cerebral palsy: possible seizure potentiation? Pediatr Neurol. 2003;29(3):203-206.
76. Leggio L, Ferrulli A, Zambon A, et al. Baclofen promotes alcohol abstinence in alcohol dependent cirrhotic patients with hepatitis C virus (HCV) infection. Addict Behav. 2012;37(4):561-564.
77. Zofran [package insert]. East Hanover, NJ: Norvartis Pharmaceuticals; 2017.
78. Barnes NM, Sharp T. A review of central 5-HT receptors and their function. Neuropharmacology. 1999;38(8):1083-1152.
79. Johnson BA, Campling GM, Griffiths P, Cowen PJ. Attenuation of some alcohol-induced mood changes and the desire to drink by 5-HT3 receptor blockade: a preliminary study in health male volunteers. Psychopharmacology (Berl). 1993;112(1):142-144.
80. Johnson B, Roache J, Javors M, et al. Ondansetron for reduction of drinking among biologically predisposed alcoholic patients: a randomized controlled trial. JAMA. 2000;284(8):963-971.
81. Kasinath NS, Malak O, Tetzlaff J. Atrial fibrillation after ondansetron for the prevention and treatment of postoperative nausea and vomiting: a case report. Can J Anaesth. 2003;50(3):229-231.
82. Sellers EM, Toneatto T, Romach MK, Somer GR, Sobell LC, Sobell MB. Clinical efficacy of the 5-HT3 antagonist ondansetron in alcohol abuse and dependence. Alcohol Clin Exp Res. 1994;18(4):879-885.
83. Havrilla PL, Kane-Gill SL, Verrico MM, Seybert AL, Reis SE. Coronary vasospasm and atrial fibrillation associated with ondansetron therapy. Ann Pharmacother. 2009;43(3):532-536.
84. Donoghue K, Elzerbi C, Saunders R, Whittington C, Pilling S, Drummond C. The efficacy of acamprosate and naltrexone in the treatment alcohol dependence, Europe versus the rest of the world: a meta-analysis. Addiction. 2015;110(6):920-930.
85. National Institute for Health and Care Excellence. Alcohol-use disorder: diagnosis, assessment and management of harmful drinking and alcohol dependence. Clinical guideline [CG115]. https://www.nice.org.uk/guidance/cg115. Published February 2011. Accessed September 12, 2018.
86. U.S. Department of Health and Human Services, National Institutes of Health, National Institute on Alcohol Abuse and Alcoholism. Helping patients who drink too much a clinician’s guide. https://www.niaaa.nih.gov/guide. Accessed September 12, 2018.
87. Blodgett JC, Del Re AC, Maisel NC, Finney JW. A meta-analysis of topiramate’s effects for individuals with alcohol use disorders. Alcohol Clin Exp Res. 2014;38(6):1481-1488.
88. Müller CA, Geisel O, Pelz P, et al. High-dose baclofen for the treatment of alcohol dependence (BACLAD study): a randomized, placebo-controlled trial. Eur Neuropsychopharmacol. 2015;25(8):1167-1177.
89. Beraha EM, Salemink E, Goudriaan AE, et al. Efficacy and safety of high-dose baclofen for the treatment of alcohol dependence: a multicentre, randomized, double-blind controlled trial. Eur Neuropsychopharmacol. 2016;26(12):1950-1959.
90. DeVido J, Bogunovic O, Weiss RD. Alcohol use disorders in pregnancy. Harv Rev Psychiatry. 2015;23(2)112-121.
91. Anton RF, Moak DH, Latham P, et al. Naltrexone combined with either cognitive behavioral or motivational enhancement therapy for alcohol dependence. J Clin Psychopharmacol. 2005;25(4):349-357.
92. Harris AHS, Bowe T, Hagedorn H, et al. Multifaceted academic detailing program to increase pharmacotherapy for alcohol use disorder: interrupted time series evaluation of effectiveness. Addict Sci Clin Pract. 2016;11(1):15.
Alcohol use disorder (AUD) is a relatively common condition characterized by a pattern of problematic alcohol consumption. According to the 2016 National Survey on Drug Use and Health (NSDUH) approximately 14.6 million Americans aged > 18 years had a diagnosis of AUD.1 This same survey also found that 26.2% of individuals over the age of 18 years reported engaging in binge drinking, which is ≥ 5 drinks in males or ≥ 4 drinks in females on the same occasion in the past month. Of those surveyed, 6.6% reported engaging in heavy drinking (binge drinking on 5 or more days in the past month).1
Military and veteran populations have a higher prevalence of alcohol misuse compared with that of the general population.2 Two out of 5 US veterans screen positive for lifetime AUD, which is higher than the prevalence of AUD in the general population.3 A number of studies have found that excessive alcohol use is common among military personnel.2,4,5 One study suggested that the average active-duty military member engages in approximately 30 binge drinking episodes per person per year.4 Military veterans may continue with a similar drinking pattern when transitioning to civilian life, explaining the high prevalence of AUD in the veteran population.6 Furthermore, since alcohol use provides temporary relief of posttraumatic stress disorder(PTSD) symptoms, a diagnosis of PTSD may also contribute to hazardous drinking in this population.7
Excessive alcohol consumption is associated with a number of negative outcomes, including increased motor-vehicle accidents, decreased medication adherence, and therefore, decreased efficacy, increased health care costs, and increased morbidity and mortality.8-13 Additionally, alcohol use is associated with a number of medical and psychiatric comorbidities.14,15 Compared with veterans without AUD, those with a diagnosis of AUD were 2.6 times more likely to have current depression and 2.8 times more likely to have generalized anxiety.3 Veterans with AUD also are 2.1 times more likely to have current suicidal ideation and 4.1 times more likely to have had a suicide attempt compared with veterans without AUD.3
Given the high prevalence and the associated risks, alcohol misuse should be properly addressed and treated. Pharmacotherapy for AUD has demonstrated efficacy in decreasing heavy drinking and prolonging periods of abstinence.16 Despite the proven benefits of available pharmacotherapy, these medications still are drastically underutilized in both the nonveteran and veteran populations. In fiscal year 2012, there were 444,000 veterans with a documented diagnosis of AUD; however, only 5.8% received evidence-based pharmacotherapy.17 The potential barriers for the utilization of AUD pharmacotherapy includes perceived low patient demand, lack of skill or knowledge about addiction, and lack of health care provider (HCP) confidence in efficacy.18 This article will provide a thorough overview of the pharmacotherapy options for the treatment of AUD and the evidence that supports the use of pharmacotherapy. We will then conclude with the recommended treatment approach for specialized patient populations.
FDA-Approved Pharmacotherapies
Naltrexone
Naltrexone was the second FDA-approved medication for the treatment of AUD and is considered a first-line agent by the Department of Veterans Affairs (VA).19,20 Unlike its predecessor, disulfiram, naltrexone significantly reduces cravings.21 During alcohol consumption endogenous opioid activity is greatly enhanced, leading to the rewarding effects of alcohol. By antagonizing the µ-opioid receptor, naltrexone mediates endorphin release during alcohol consumption, explaining the efficacy of naltrexone in AUD.21-28 Since cravings are reduced, patients are able to abstain from drinking for longer periods of time, and since pleasure is reduced, heavy drinking is also reduced.21,25
When compared with other pharmacotherapy options for AUD, naltrexone is less effective for abstinence and more effective for decreasing the time and frequency of heavy drinking days and average number of drinks consumed.29 A meta-analysis of 19 clinical trials found that naltrexone significantly reduced relapse rates in patients with AUD compared with those of placebo.30 This analysis also found that naltrexone reduced both the number of alcoholic beverages consumed and the risk of relapse to heavy drinking while increasing the total number of days of abstinence.30 The COMBINE study also found that patients receiving oral naltrexone in combination with medical treatment had a 28% reduced risk of having a heavy-drinking day.31
Dosing and Formulations
Naltrexone is available as a tablet or a long-acting injectable. The tablet is often dosed as 50 mg daily; although some studies suggest that daily doses up to 150 mg are safe and efficacious.21,25,32 The initial and maintenance dose for most patients is 50 mg daily.
Nonadherence to the oral formulation of naltrexone is a significant barrier to the treatment of AUD. The long-acting injectable formulation is an option for patients who may have difficulty with adhering to oral naltrexone. As with the oral formulation, the long-acting naltrexone injection significantly reduces drinking days and increases abstinence.33 It was also found to be superior to oral naltrexone, acamprosate, and disulfiram in preventing discontinuation of AUD treatment.34 The long-acting injectable should be administered as an intramuscular gluteal injection at a dose of 380 mg monthly.35
Ideally, naltrexone should be initiated following the cessation of alcohol withdrawal symptoms. However, naltrexone can be safely administered in patients who are actively withdrawing from alcohol or in patients who continue to consume alcohol.25
Warnings, Precautions, and AEs
Naltrexone carries a US Food and Drug Administration (FDA) boxed warning for reversible hepatotoxicity. The risk of hepatotoxicity is increased in patients who receive higher doses (100-300 mg daily).21 A safety study demonstrated that the administration of 50 mg daily or less is not associated with significant hepatotoxicity.21,31 It is contraindicated in patients with acute hepatitis or liver failure and should be avoided in patients with liver function tests > 5 times the upper limit of normal.
Since naltrexone is a µ-opioid receptor antagonist, it is contraindicated in patients who are actively taking opioids or patients who have used opioids within the past 7 days. Co-administration with an opioid can lead to precipitated opioid withdrawal.21 Therefore, opioids should not be administered within 7 to 10 days of initiating naltrexone and 2 to 3 days after discontinuation of oral naltrexone.21 For patients receiving the long-acting injectable form of naltrexone, opioids should be avoided at least 1 month after the injection.25
To ensure that a patient is opioid free, HCPs can perform a toxicology screening prior to the initiation of naltrexone. Some HCPs may also perform a naloxone challenge to test whether a patient is at risk for precipitated opioid withdrawal prior to prescribing naltrexone.
The adverse effects (AEs) of naltrexone are transient and include nausea, vomiting, anorexia, dizziness, and fatigue.19,35 Injection site reactions can be experienced with the long-acting naltrexone injection. Liver transaminases, such as the alanine aminotransferase and aspartate transaminase, should be monitored at baseline, 6 months after initiation, and annually during the course of treatment (Table 2).
Acamprosate
The FDA approved acamprosate for the treatment of AUD in 2004, and it is also considered a first-line agent for AUD by the VA.20 It is approved for the maintenance of abstinence from alcohol use and is most efficacious when initiated in patients who are abstinent prior to treatment.29,36 Patients with AUD typically have a disruption in the balance between the inhibitory neurotransmitter, gamma-aminobutyric acid (GABA), and the excitatory neurotransmitter, glutamate. While its mechanism of action remains unknown, acamprosate is thought to increase the activity of GABA and to decrease the activity of glutamate at the N-methyl-D-aspartate (NMDA) receptors in the central nervous system. In essence, it is thought to restores the balance between GABA and glutamate in patients with AUD.36
Acamprosate has been found to effectively prevent relapse. Three randomized, double-blind, placebo-controlled European clinical trials evaluated the efficacy of acamprosate in combination with psychotherapy. The results demonstrated that patients taking acamprosate had longer durations of abstinence compared with that of placebo, improved rates of complete abstinence, and a prolonged time to first drink.37-39 A meta-analysis evaluated the use of acamprosate in AUD showed that acamprosate was more effective at maintaining abstinence in patients who had been abstinent prior to the initiation of therapy.29 These patients also had better abstinence rates if they had been abstinent for a longer duration prior to treatment initiation.30 Studies also showed that acamprosate significantly assisted with maintaining abstinence, improved rates of abstinence, and led to more days of abstinence.40,41 Of note, there also have been studies that have shown no significant benefit with acamprosate compared with placebo in the treatment of AUD.42
Dosing and Formulations
Acamprosate is available as a 333 mg delayed-release tablet. The recommended dose is 666 mg 3 times daily.36 The dose can be decreased to 333 mg 3 times a day in patients with moderate renal impairment (CrCl-30-50 mL/min).
Since acamprosate has been proven more effective in patients who are abstinent prior to initiation, acamprosate is typically initiated 5 days following alcohol cessation.25 However, it may be safely administered with alcohol and can continue to be administered in the event of a relapse.36
Warnings, Precautions, and AEs
Acamprosate is safe to use in patients with hepatic and mild-to-moderate renal impairment; however, it is contraindicated in patients with severe renal impairment (creatinine clearance [CrCl] ≤ 30 mL/min).36 Serum creatinine levels should be monitored at baseline and during treatment.
Acamprosate has a number of related AEs. The most common is diarrhea. Less common AEs include insomnia, anxiety, and depression. Due to its possible potential to increase suicidality, HCPs should monitor for the emergence of mood changes.36
Disulfiram
Disulfiram is an aldehyde dehydrogenase inhibitor that is FDA approved for the management of AUD.43 When ingested, ethanol is typically metabolized to acetaldehyde, which is further metabolized to acetic acid by aldehyde dehydrogenase.44 Disulfiram inhibits aldehyde dehydrogenase, leading to a rapid accumulation of acetaldehyde within the plasma (outlined in Figure 2).
There are limited studies that prove the efficacy of disulfiram. In a randomized trial comparing disulfiram, acamprosate, and naltrexone, patients treated with disulfiram had fewer heavy drinking days, lower rates of weekly alcohol consumption, and a longer period of abstinence compared to other medications.45 Additionally, a 2014 meta-analysis showed that in open-label studies, disulfiram was more beneficial in preventing alcohol consumption when compared with acamprosate, naltrexone, and placebo. This result was not seen in blinded studies.46 Disulfiram does not reduce alcohol cravings, and adherence is a significant issue. It is most effective between 2 and 12 months, when taken under supervised administration.47
Dosing and Formulations
Disulfiram is only available as a tablet. The recommended starting dose is up to 500 mg for the first 2 weeks. However, the maintenance dose can range from 125 to 500 mg daily.43 Patients must be abstinent from alcohol at least 12 to 24 hours prior to the initiation of disulfiram.25 A blood alcohol level can be obtained in order to confirm abstinence.25
Warnings, Precautions, and AEs
Disulfiram is contraindicated in patients with severe myocardial disease or coronary occlusion and severe hepatic impairment.43 Other contraindications are outlined in Table 3.
Common AEs include somnolence, a metallic after-taste, and peripheral neuropathy.43 Patients should be informed that they could experience a disulfiram reaction with even small amounts of alcohol; all foods, drinks, and medications containing alcohol should be avoided. Due to the potential of disulfiram potential to cause hepatotoxicity, liver transaminases should be monitored at baseline, 2 weeks after initiation, and monthly for the first 6 months of therapy, and every 3 months thereafter (Table 2).25
Off-Label Pharmacotherapies
Topiramate
Although not approved for AUD, topiramate has been used off-label for this indication as it has proven efficacy in clinical trials.48-56 While its mechanism of action for AUD is unclear, it has been theorized that topiramate antagonizes glutamate receptors, thereby reducing dopamine release in the nucleus accumbens upon alcohol consumption, and potentiates the inhibitory neurotransmitter GABA.50,51,57-60
In clinical trials, topiramate has demonstrated significant efficacy in reducing cravings, the risk of relapse, and the number of drinks consumed daily, while increasing abstinence.51,53,60 Batki and colleagues report that the administration of topiramate in veterans with co-occurring AUD and PTSD reduced alcohol consumption, cravings, and the severity of their PTSD symptoms.61
Dosing and Formulations
Topiramate is available in a number of formulations; however, only the immediate-release formulation is recommended for the treatment of AUD. The extended-release formulation is contraindicated in the setting of alcohol consumption and is therefore not used for the treatment of AUD.62 Doses should be initiated at 25 mg daily and can be titrated in 25 to 50 mg weekly increments. To minimize AEs and to reduce the risk of patients discontinuing therapy, the dose may be slowly titrated over 8 weeks.53,59 An effective dose can range from 75 to 300 mg in divided doses; however, AEs often limit the tolerability of increased doses.48,50,63,64 The VA/DoD Practice Guideline for the Management of Substance Use Disorders recommends titrating topiramate to a target dose of 100 mg twice daily.65
Warnings, Precautions, and AEs
Common AEs include memory impairment, anorexia, fatigue, paresthesias, and somnolence.62 There is an increased risk of nephrolithiasis with topiramate administration; therefore, adequate hydration is crucial.49,59 Titration of topiramate to the target dose is suggested to limit AEs.35
Prior to initiating topiramate, the patient’s renal function should be assessed. In those with a CrCl < 70 mL/min the dose should be decreased by 50% and titrated more slowly.62
Gabapentin
Gabapentin is prescribed for the treatment of partial seizures and postherpetic neuralgia. In recent years, it has shown efficacy for treating other conditions, such as AUD. While its mechanism for this indication remains unclear, the inhibition of excitatory alpha-2-delta calcium channels and stimulation of inhibitory GABAA receptors by gabapentin is believed to decrease alcohol cravings, reduce anxiety, and increase abstinence.66
A 12-week, double-blind, randomized controlled trial demonstrated that oral gabapentin was more efficacious than was placebo for improving rates of abstinence, decreasing heavy drinking, and reducing alcohol cravings.67 Gabapentin may also serve as a good adjunctive option to naltrexone therapy either when naltrexone monotherapy fails or if a patient is complaining of sleep and mood disturbances with abstinence.67,68
Dosing and Formulations
Gabapentin should be titrated slowly to minimize AEs. It can be initiated at 300 mgon day 1 and increase by 300-mg increments. Doses of 900 to 1,800 mg per day have proven to be efficacious for the treatment of AUD.66,67 These proposed doses can be safely administered to most patients, but caution should be observed in elderly and patients with renal impairment.69,70
Warnings, Precautions, and AEs
The most common AEs for gabapentin include drowsiness, dizziness, and fatigue.69 Since it is renally cleared, renal function should be monitored at baseline and periodically during treatment. Gabapentin is not metabolized by liver enzymes and does not significantly interact with drugs that require hepatic metabolism.
Baclofen
Baclofen has generated attention as an unconventional treatment option for alcohol dependence. Its unique mechanism of action, which involves the activation of GABAB receptors and the subsequent inhibition of dopaminergic neurons, makes it useful for the treatment of AUD.71
A 12-week study evaluating the effectiveness and safety of baclofen for the maintenance of alcohol abstinence demonstrated that baclofen was more efficacious than placebo for increasing abstinence in patients with liver cirrhosis. In addition, there were more cumulative days of abstinence with baclofen use (62.8 days) vs placebo (30.8 days) in cirrhotic patients.72
Dosing and Formulations
There has been a range of doses studied for baclofen in the treatment of AUD. Studies indicate that initiating baclofen at 30 mg daily and increasing doses based on the patient’s clinical response is most effective.72 As a result, doses as high as 275 mg per day have been used for some patients.73 Baclofen is renally cleared; therefore, the dose should be adjusted in patients with renal impairment.74
Warnings, Precautions, and AEs
Some of the common AEs of baclofen include drowsiness, confusion, headache, and nausea. Due to its CNS depressant effects, baclofen should be used with caution in the elderly. Also, due to its potential to cause withdrawal symptoms, baclofen should not be discontinued abruptly.74,75 Baclofen is a safe option for patients with severe liver disease, due to its minimal hepatic metabolism.76
Ondansetron
Ondansetron is approved for both prophylactic and therapeutic use as an antiemetic agent for chemotherapy and anesthesia-induced nausea and vomiting.77As a highly selective and competitive 5-HT3 receptor antagonist, ondansetron has demonstrated efficacy in reducing serotonin-mediated dopaminergic effects in AUD.78,79 The lowering of these dopaminergic effects is associated with a reduction in alcohol-induced gratification and consumption.
In a 12-week, randomized controlled trial, 271 patients diagnosed with AUD received ondansetron twice daily or placebo, combined with weekly cognitive behavioral therapy (CBT). There was a statistically significant decrease in alcohol consumption in patients treated with ondansetron compared with those who received placebo. Additionally, ondansetron was superior to placebo for increasing the percentage and total amount of days abstinent.80 These results were primarily observed in participants diagnosed with early-onset AUD (defined as onset at 25 years or younger), which may suggest the presence of genetically predisposed serotonin dysfunctions.80,81 In contrast, there were no significant differences observed in participants with late-onset AUD (onset after age 25 years) in either study group.80
Dosing and Formulations
Given its modest efficacy for the treatment of AUD, ondansetron has demonstrated clinical benefits at doses of 0.001 to 0.016 mg/kg twice daily. Additionally, 1 study reported that low-dose ondansetron (0.25 mg twice daily) was effective in reducing alcohol consumption when compared with placebo or high-dose ondansetron, which was considered 2 mg twice daily.82
Warnings, Precautions, and AEs
The most commonly reported AEs with ondansetron include fatigue, headache, anxiety, and serotonin syndrome when used concomitantly with other serotonergic agents.77 Also, serious cardiovascular complications, such as QTc prolongation, angina pectoris, atrial fibrillation, and arrhythmias have been observed with IV administration.77,81,83 Consequently, patients with electrolyte imbalances (eg, hypokalemia, hypomagnesemia), a history of congestive heart failure, or concomitant medications associated with QTc prolongation, should be monitored with an electrocardiogram (ECG) or switched to another agent.77
Treatment Approach with AUD Pharmacotherapy
There is insufficient evidence to support the use of 1 medication for AUD over the others.16,46,84 Instead, the choice of therapy largely depends on the patient’s comorbidities, renal and hepatic function, and on the patient’s established goals, whether abstinence or reduction in alcohol consumption (Table 4).
There is much debate over the appropriate duration of treatment for AUD pharmacotherapy. It is recommended that patients remain on these medications for at least 3 months. Pharmacotherapy can be continued for 6 to 12 months as the risk for relapse is highest during this time frame.85,86 The National Institute for Health and Care Excellence guidelines recommend discontinuing AUD pharmacotherapy if alcohol consumption persists 4 to 6 weeks after initiation.86
Comorbid Liver Disease
Due to the negative effects of heavy alcohol consumption on the liver, patients with AUD may develop liver disease. Health care providers should be aware of the appropriate pharmacotherapy options for patients with comorbid liver disease. Acamprosate is mostly excreted unchanged by the kidneys, therefore is an option for patients with liver disease whose goal is complete abstinence. Topiramate is another option for use in patients with liver impairment. Unlike acamprosate, topiramate would be a better option in patients who may not completely abstain from alcohol consumption but would like to decrease the amount of heavy drinking days.87
Gabapentin, baclofen, and ondansetron are also options for those with liver disease. Baclofen in particular has been studied in those with advanced liver disease, and it was found to be safe and effective.88,89
Comorbid Renal Disease
Naltrexone is an option for patients with mild renal impairment. Naltrexone and its major metabolite, 6-ß-naltrexol, are renally excreted; however, urinary excretion of unchanged naltrexone accounts for < 2% of the oral dose.19 Even with its low potential for accumulation, HCPs should carefully monitor for AEs in patients with moderate-to-severe renal impairment. Disulfiram is another pharmacotherapy option, since it is mostly metabolized by the liver.
Gabapentin, baclofen, and ondansetron are also possible options; however, their doses should be renally adjusted. Overall, there are limited studies on the use of these medications treating AUD in patients with renal impairment.
Pregnancy
Alcohol consumption during pregnancy can result in a wide range of birth defects to the unborn fetus. Due to the negative effects of alcohol consumption on the fetus, pregnant females should be referred to a professional alcohol treatment program. Although AUD pharmacotherapy may be considered in pregnant females, there have been no human studies that have examined the efficacy and safety in this patient population. All evidence comes from animal studies, case reports, and case series.90
Naltrexone is the most widely used medication for AUD in pregnancy. It is considered pregnancy category C and 1 study in particular did not detect any gross abnormalities in fetal development in pregnancy.19, 90 Disulfiram, acamprosate, and topiramate have all been shown to cause harm to either animal or human fetuses and are generally not recommended.36,44,63 Similar to naltrexone, gabapentin and baclofen are also pregnancy category C.69,77 Ondansetron is pregnancy category B, but it should still be used with caution since its use in pregnancy for the treatment of AUD has not been studied.77,90
Psychosocial Interventions
It is recommended that AUD pharmacotherapy be used in conjunction with a psychosocial intervention, such as CBT or medical management. Many of the studies evaluating the efficacy of AUD pharmacotherapy combined psychosocial interventions with medications. The literature suggests that when combined with CBT or medical management therapy, pharmacotherapy used for AUD results in better alcohol consumption outcomes.31,91 It has also been suggested that psychosocial interventions may improve patient adherence to AUD pharmacotherapy.25
Barriers
Inadequate HCP training on the use of AUD pharmacotherapy has been found to be a major barrier to the utilization of AUD pharmacotherapy, along with a lack of confidence in the effectiveness of these medications.18 Increasing HCP education on the use and benefits of these agents may increase the overall confidence of HCPs in prescribing pharmacotherapy for the treatment of AUD, especially in the primary care setting. One aspect that has been found to improve education and the prescribing of pharmacotherapy for AUD within the Veterans Health Administration has been the use of academic detailing programs.92 Academic detailing is a multifaceted educational outreach program that is used to assist with HCP education. Additionally, clinical pharmacists can be consulted to help develop a safe and effective AUD pharmacotherapy treatment regimen.
Conclusion
There is a major disparity in the prevalence of AUD between the general population and the military and veteran populations. Many clinical trials have found a number of pharmacotherapy options to be effective for the treatment of AUD. Despite the need and the proven benefits, the utilization of AUD pharmacotherapy still remains low in both the general and veteran populations. Increasing provider education and addressing other potential barriers for the use of pharmacotherapy for AUD can have a positive impact on prescribing patterns, which can ultimately improve alcohol consumption outcomes in patients with a diagnosis of AUD.
1. Substance Abuse and Mental Health Services Administration, Center for Behavioral Health Statistics and Quality. Results from the 2016 National Survey on Drug Use and Health: detailed tables. Substance Abuse and Mental Health Services Administration. https://www.samhsa.gov/data/sites/default/files/NSDUH-DetTabs-2016/NSDUH-DetTabs-2016.pdf. Published September 7, 2017. Accessed September 13, 2018.
2. Jones E, Fear NT. Alcohol use and misuse within the military: a review. Int Rev Psychiatry. 2011;23(2):166-172.
3. Fuehrlein BS, Mota N, Arias AJ, et al. The burden of alcohol use disorders in US military veterans: results from the National Health and Resilience in Veterans Study. Addiction. 2016;111(10):1786-1794.
4. Stahre MA, Brewer RD, Fonseca VP, Naimi TS. Binge drinking among US active-duty military personnel. Am J Prev Med. 2009;36(3):208-217.
5. Institute of Medicine. Substance use disorders in the U.S. armed forces. https://www.nap.edu/resource/13441/SUD_rb.pdf. Published September 2012. Accessed September 12, 2018.
6. McDevitt-Murphy ME, Murphy JG, Williams JL, Monahan CJ, Bracken-Minor KL. Brief intervention to reduce hazardous drinking and enhance coping among OEF/OIF/OND veterans. Prof Psychol Res Pr. 2015;46(2):83-89.
7. Jacobson IG, Ryan MA, Hooper TI, et al. Alcohol use and alcohol-related problems before and after military combat deployment. JAMA. 2008;300(6):663-675.
8. Chou SP, Dawson DA, Stinson FS, et al. The prevalence of drinking and driving in the United States, 2001-2002: results from the National Epidemiologic Survey on Alcohol and Related Conditions. Drug Alcohol Depend. 2006;83(2):137-146.
9. Bazargan-Hejazi S, Bazargan M, Hardin E, Bing EG. Alcohol use and adherence to prescribed therapy among under-served Latino and African-American patients using emergency department services. Ethn Dis. 2005;15(2):267-275.
10. Kamali M, Kelly BD, Clarke M, et al. A prospective evaluation of adherence to medication in first episode of schizophrenia. Eur Psychiatry. 2006;21(1):29-33.
11. Tucker JS, Burnam MA, Sherbourne CD, Kung FY, Gifford AL. Substance abuse and mental health correlates of nonadherence to antiretroviral medications in a sample of patients with human immunodeficiency virus infection. Am J Med. 2003;114(7):573-580.
12. Rehm J, Room R, Graham K, Monteiro M, Gmel G, Sempos CT. The relationship of average volume of alcohol consumption and patterns of drinking to burden of disease: an overview. Addiction. 2003;98(9):1209-1228.
13. Kendler KS, Ohlsson H, Sundquist J, Sundquist K. Alcohol use disorder and mortality across the lifespan: a longitudinal cohort and co-relative analysis. JAMA Psychiatry. 2016;73(6):575-581.
14. Hasin DS, Stinson FS, Ogburn E, Grant BF. Prevalence, correlates, disability, and comorbidity of DSM-IV alcohol abuse and dependence in the United States. Arch Gen Psychiatry. 2007;64(7):830-842.
15. Grant BF, Stinson FS, Dawson DA, et al. Prevalence and co-occurrence of substance use disorders and independent mood and anxiety disorders: results from the National Epidemiologic Survey on Alcohol and Related Conditions. Arch Gen Psychiatry. 2004;61(8):807-816.
16. Jonas DE, Amick HR, Feltner C, et al. Pharmacotherapy for adults with alcohol use disorders in outpatient settings: a systematic review and meta-analysis. JAMA. 2014;311(18):1889-1900.
17. Del Re AC, Gordon AJ, Lembke A, Harris AH. Prescription of topiramate to treat alcohol use disorders in the Veterans Health Administration. Addict Sci Clin Pract. 2013;8:12.
18. Harris AH, Ellerbe L, Reeder RN, et al. Pharmacotherapy for alcohol dependence: perceived treatment barriers and action strategies among Veterans Health Administration service providers. Psychol Serv. 2013;10(4):410-419.
19. ReVia [package insert]. Pomona, NY: Duramed Pharmaceuticals; 2013.
20. US Department of Veterans Affairs, Pharmacy Benefits Management Services, Medical Advisory Panel, and VISN Pharmacist Executives. Alcohol use disorder pharmacotherapy: naltrexone, acamprosate, and disulfiram recommendations for use. https://www.pbm.va.gov/PBM/clinicalguidance/clinicalrecommendations/Alcohol_Use_Disorder_Pharmacotherapy_Acamprosate_Naltrexone_Disulfiram_Recommendations_for_Use.docx. Published December 2013. Accessed September 17, 2018.
21. Anton RF. Naltrexone for the management of alcohol dependence. N Engl J Med. 2008;359(7):715-721.
22. O’Malley SS, Rounsaville BJ, Farren C, et al. Initial and maintenance naltrexone treatment for alcohol dependence using primary care vs specialty care: a nested sequence of 3 randomized trials. Arch Intern Med. 2003;163(14):1695-1704.
23. O’Brien CP. A range of research-based pharmacotherapies for addiction. Science. 1997;278(5335):66-70.
24. Swift RM. Effect of naltrexone on human alcohol consumption. J Clin Psychiatry. 1995;56 (suppl 7):24-29.
25. Center for Substance Abuse Treatment. Incorporating Alcohol Pharmacotherapies into Medical Practice. Treatment Improvement Protocol (TIP) Series 49. Rockville, MD: Substance Abuse and Mental Health Services Administration; 2009.
26. Spanagel R, Zieglgänsberger W. Anti-craving compounds for ethanol: new pharmacological tools to study addictive processes. Trends Pharmacol Sci. 1997;18(2):54-59.
27. Herz A. Endogenous opioid systems and alcohol addiction. Psychopharmacology (Berl). 1997;129(2):99-111.
28. Miller NS. The integration of pharmacological and nonpharmacological treatments in drug/alcohol addiction. J Addict Dis. 1997;16(4):1-5.
29. Maisel NC, Blodgett JC, Wilbourne PL, Humphreys K, Finney JW. Meta-analysis of naltrexone and acamprosate for treating alcohol use disorders: when are these medications most helpful? Addiction. 2013;108(2):275-293.
30. Bouza C, Angeles M, Muñoz A, Amate JM. Efficacy and safety of naltrexone and acamprosate in the treatment of alcohol dependence: a systematic review. Addiction. 2004;99(7):811-828.
31. Anton RF, O’Malley SS, Ciraulo DA, et al; COMBINE Study Research Group. Combined pharmacotherapies and behavioral interventions for alcohol dependence: the COMBINE study: a randomized controlled trial. JAMA. 2006;295(17):2003-2017.
32. Oslin DW, Pettinati HM, Volpicelli JR, Wolf AL, Kampman KM, O’Brien CP. The effects of naltrexone on alcohol and cocaine use in dually addicted patients. J Subst Abuse Treat. 1999;16(2):163-167.
33. Kranzler HR, Wesson DR, Billot L; DrugAbuse Sciences Naltrexone Depot Study Group. Naltrexone depot for treatment of alcohol dependence: a multicenter, randomized, placebo-controlled clinical trial. Alcohol Clin Exp Res. 2004;28(7):1051-1059.
34. Bryson WC, McConnell J, Korthuis PT, McCarty D. Extended-release naltrexone for alcohol dependence: persistence and healthcare costs and utilization. Am J Manag Care. 2011;17 (suppl 8):S222-S234.
35. Vivitrol [package insert]. Waltham, MA: Alkermes, Inc.; 2010.
36. Campral [package insert]. St. Louis, MO: Forest Laboratories Inc; 2012.
37. Paille F, Guelfi J, Perkins AC, Royer RJ, Steru L, Parot P. Double-blind randomized multicentre trial of acamprosate in maintaining abstinence from alcohol. Alcohol. 1995;30(2):239-247.
38. Pelc I, Verbanck P, Le Bon O, Gavrilovic M, Lion K, Lehert P. Efficacy and safety of acamprosate in the treatment of detoxified alcohol-dependent patients. A 90-day placebo-controlled dose-finding study. Br J Psychiatry. 1997;171:73-77.
39. Sass H, Soyka M, Mann K, Zieglgänsberger W. Relapse prevention by acamprosate. Results from a placebo-controlled study on alcohol dependence. Arch Gen Psychiatry. 1996;53(8):673-680.
40. Mann K, Lehert P, Morgan MY. The efficacy of acamprosate in the maintenance of abstinence in alcohol-dependent individuals: results of a meta-analysis. Alcohol Clin Exp Res. 2004;28(1):51-63.
41. Mason BJ, Lehert P. Acamprosate for alcohol dependence: a sex-specific meta-analysis based on individual patient data. Alcohol Clin Exp Res. 2012;36(3):497-508.
42. Richardson K, Baillie A, Reid S, et al. Do acamprosate or naltrexone have an effect on daily drinking by reducing craving for alcohol? Addiction. 2008;103(6):953-959.
43. Antabuse [package insert]. North Wales, PA: Teva Pharmaceuticals; 2015.
44. Ait-Daoud N, Johnson BA. Medications for the treatment of alcoholism. In: Johnson BA, Ruiz P, Galanter M, eds. Handbook of Clinical Alcoholism Treatment. Lippincott Williams & Wilkins, Baltimore; 2003
45. Laaksonen E, Koski-Jännes A, Salaspuro M, Ahtinen H, Alho H. A randomized, multicentre, open-label, comparative trial of disulfiram, naltrexone and acamprosate in the treatment of alcohol dependence. Alcohol Alcohol. 2008;43(1):53-61.
46. Skinner MD, Lahmek P, Pham H, Aubin HJ. Disulfiram efficacy in the treatment of alcohol dependence: a meta-analysis. PLoS One. 2014;9(2):e87366.
47. Jørgensen CH, Pedersen B, Tønnesen H. The efficacy of disulfiram for the treatment of alcohol use disorder. Alcohol Clin Exp Res. 2011;35(10):1749-1758.
48. Arbaizar B, Diersen-Sotos T, Gómez-Acebo I, Llorca J. Topiramate in the treatment of alcohol dependence: a meta-analysis. [Article in English, Spanish] Actas Esp Psiquiatr. 2010;38(1):8-12.
49. Johnson BA, Ait-Daoud N. Topiramate in the new generation of drugs: efficacy in the treatment of alcoholic patients. Curr Pharm Des. 2010;16(19):2103-2112.
50. Paparrigopoulos T, Tzavellas E, Karaiskos D, Kourlaba G, Liappas I. Treatment of alcohol dependence with low-dose topiramate: an open-label controlled study. BMC Psychiatry. 2011;11:41.
51. Johnson BA, Ait-Daoud N, Bowden CL, et al. Oral topiramate for treatment of alcohol dependence: a randomised controlled trial. Lancet. 2003;361(9370):1677-1685.
52. Johnson BA, Ait-Daoud N, Akhtar FZ, Ma JZ. Oral topiramate reduces the consequences of drinking and improves the quality of life of alcohol-dependent individuals: a randomized controlled trial. Arch Gen Psychiatry. 2004;61(9):905-912.
53. Johnson BA, Rosenthal N, Capece JA, et al; Topiramate for Alcoholism Advisory Board; Topiramate for Alcoholism Study Group. Topiramate for treating alcohol dependence: a randomized controlled trial. JAMA. 2007;298(14):1641-1651.
54. Flórez G, García-Portilla P, Alvarez S, Saiz PA, Nogueiras L, Bobes J. Using topiramate or naltrexone for the treatment of alcohol-dependent patients. Alcohol Clin Exp Res. 2008;32(7):1251-1259.
55. Flórez G, Saiz PA, Garcia-Portilla P, Alvarez S, Nogueiras L, Bobes J. Topiramate for the treatment of alcohol dependence: comparison with naltrexone. Eur Addict Res. 2011;17(1):29-36.
56. Baltieri DA, Daró FR, Ribeiro PL, de Andrade AG. Comparing topiramate with naltrexone in the treatment of alcohol dependence. Addiction. 2008;103(12):2035-2044.
57. White HS, Brown SD, Woodhead JH, Skeen GA, Wolf HH. Topiramate modulates GABA-evoked currents in murine cortical neurons by a nonbenzodiazepine mechanism. Epilepsia. 2000;41(suppl 1):S17-S20.
58. White HS, Brown SD, Woodhead JH, Skeen GA, Wolf HH. Topiramate enhances GABA-mediated chloride flux and GABA-evoked chloride currents in murine brain neurons and increases seizure threshold. Epilepsy Res. 1997;28(3):167-179.
59. Guglielmo R, Martinotti G, Quatrale M, et al. Topiramate in alcohol use disorders: review and update. CNS Drugs. 2015;29(5):383-395.
60. Kranzler HR, Covault J, Feinn R, et al. Topiramate treatment for heavy drinkers: moderation by a GRIK1 polymorphism. Am J Psychiatry. 2014;171(4):445-452.
61. Batki SL, Pennington DL, Lasher B, et al. Topiramate treatment of alcohol use disorder in veterans with posttraumatic stress disorder: a randomized controlled pilot trial. Alcohol Clin Exp Res. 2014;38(8):2169-2177.
62. Topamax [package insert]. Titusville, NJ: Janssen Pharmaceuticals Inc; 2017.
63. Meador KJ. Cognitive effects of levetiracetam versus topiramate. Epilepsy Curr. 2008;8(3):64-65.
64. Luykx JJ, Carpay JA. Nervous system adverse responses to topiramate in the treatment of neuropsychiatric disorders. Expert Opin Drug Saf. 2010;9(4):623-631.
65. The Management of Substance Use Disorder Work Group; US Department of Veteran Affairs, US Department of Defense. VA/DoD clinical practice guideline for the management of substance use disorders. https://www.healthquality.va.gov/guidelines/MH/sud/VADODSUDCPGRevised22216.pdf. Published December 2015. Accessed September 12, 2018.
66. Sills GJ. The mechanism of action of gabapentin and pregabalin. Curr Opin Pharmacol. 2006;6(1):108-113.
67. Mason BJ, Quello S, Goodell V, Shandan F, Kyle M, Begovic A. Gabapentin treatment for alcohol dependence: a randomized clinical trial. JAMA Intern Med. 2014;174(1):70-77.
68. Anton RF, Myrick H, Wright TM, et al. Gabapentin combined with naltrexone for the treatment of alcohol dependence. Am J Psychiatry. 2011;168(7):709-717.
69. Neurontin [package insert]. New York, NY: Pfizer; 2017.
70. American Geriatrics Society 2015 Beers Criteria Update Expert Panel. American Geriatrics Society 2015 updated Beers criteria for potentially inappropriate medication use in older adults. J Am Geriatr Soc. 2015;63(11):2227-2246.
71. Addolorato G, Leggio L. Safety and efficacy of baclofen in the treatment of alcohol-dependent patients. Curr Pharm Des. 2010;16(19):2113-2117.
72. Addolorato G, Leggio L, Ferrulli A, et al. Effectiveness and safety of baclofen for maintenance of alcohol abstinence in alcohol-dependent patients with liver cirrhosis: a randomized, double-blind, controlled study. Lancet. 2007;370(9603):1915-1922.
73. Dore GM, Lo K, Juckes L, Bezyan S, Latt N. Clinical experience with baclofen in the management of alcohol-dependent patients with psychiatric comorbidity: a selected cases series. Alcohol Alcohol. 2011;46(6):714-720.
74. Baclofen tablet [package insert]. Pulaski, TN: AvKare Inc; 2018.
75. Hansel DE, Hansel CR, Shindle MK, et al. Oral baclofen in cerebral palsy: possible seizure potentiation? Pediatr Neurol. 2003;29(3):203-206.
76. Leggio L, Ferrulli A, Zambon A, et al. Baclofen promotes alcohol abstinence in alcohol dependent cirrhotic patients with hepatitis C virus (HCV) infection. Addict Behav. 2012;37(4):561-564.
77. Zofran [package insert]. East Hanover, NJ: Norvartis Pharmaceuticals; 2017.
78. Barnes NM, Sharp T. A review of central 5-HT receptors and their function. Neuropharmacology. 1999;38(8):1083-1152.
79. Johnson BA, Campling GM, Griffiths P, Cowen PJ. Attenuation of some alcohol-induced mood changes and the desire to drink by 5-HT3 receptor blockade: a preliminary study in health male volunteers. Psychopharmacology (Berl). 1993;112(1):142-144.
80. Johnson B, Roache J, Javors M, et al. Ondansetron for reduction of drinking among biologically predisposed alcoholic patients: a randomized controlled trial. JAMA. 2000;284(8):963-971.
81. Kasinath NS, Malak O, Tetzlaff J. Atrial fibrillation after ondansetron for the prevention and treatment of postoperative nausea and vomiting: a case report. Can J Anaesth. 2003;50(3):229-231.
82. Sellers EM, Toneatto T, Romach MK, Somer GR, Sobell LC, Sobell MB. Clinical efficacy of the 5-HT3 antagonist ondansetron in alcohol abuse and dependence. Alcohol Clin Exp Res. 1994;18(4):879-885.
83. Havrilla PL, Kane-Gill SL, Verrico MM, Seybert AL, Reis SE. Coronary vasospasm and atrial fibrillation associated with ondansetron therapy. Ann Pharmacother. 2009;43(3):532-536.
84. Donoghue K, Elzerbi C, Saunders R, Whittington C, Pilling S, Drummond C. The efficacy of acamprosate and naltrexone in the treatment alcohol dependence, Europe versus the rest of the world: a meta-analysis. Addiction. 2015;110(6):920-930.
85. National Institute for Health and Care Excellence. Alcohol-use disorder: diagnosis, assessment and management of harmful drinking and alcohol dependence. Clinical guideline [CG115]. https://www.nice.org.uk/guidance/cg115. Published February 2011. Accessed September 12, 2018.
86. U.S. Department of Health and Human Services, National Institutes of Health, National Institute on Alcohol Abuse and Alcoholism. Helping patients who drink too much a clinician’s guide. https://www.niaaa.nih.gov/guide. Accessed September 12, 2018.
87. Blodgett JC, Del Re AC, Maisel NC, Finney JW. A meta-analysis of topiramate’s effects for individuals with alcohol use disorders. Alcohol Clin Exp Res. 2014;38(6):1481-1488.
88. Müller CA, Geisel O, Pelz P, et al. High-dose baclofen for the treatment of alcohol dependence (BACLAD study): a randomized, placebo-controlled trial. Eur Neuropsychopharmacol. 2015;25(8):1167-1177.
89. Beraha EM, Salemink E, Goudriaan AE, et al. Efficacy and safety of high-dose baclofen for the treatment of alcohol dependence: a multicentre, randomized, double-blind controlled trial. Eur Neuropsychopharmacol. 2016;26(12):1950-1959.
90. DeVido J, Bogunovic O, Weiss RD. Alcohol use disorders in pregnancy. Harv Rev Psychiatry. 2015;23(2)112-121.
91. Anton RF, Moak DH, Latham P, et al. Naltrexone combined with either cognitive behavioral or motivational enhancement therapy for alcohol dependence. J Clin Psychopharmacol. 2005;25(4):349-357.
92. Harris AHS, Bowe T, Hagedorn H, et al. Multifaceted academic detailing program to increase pharmacotherapy for alcohol use disorder: interrupted time series evaluation of effectiveness. Addict Sci Clin Pract. 2016;11(1):15.
The PASTA Bridge – A Repair Technique for Partial Articular-Sided Rotator Cuff Tears: A Biomechanical Evaluation of Construct Strength
ABSTRACT
Partial articular-sided supraspinatus tendon avulsion (PASTA) tears are a common clinical problem that can require surgical intervention to reduce patient symptoms. Currently, no consensus has been reached regarding the optimal repair technique. The PASTA Bridge technique was developed by the senior author to address these types of lesions. A controlled laboratory study was performed comparing the PASTA Bridge with a standard transtendon rotator cuff repair to confirm its biomechanical efficacy. A 50% articular-sided partial tear of the supraspinatus tendon was created on 6 matched pairs of fresh-frozen cadaveric shoulders. For each matched pair, 1 humerus received a PASTA Bridge repair, whereas the contralateral side received a repair using a single suture anchor with a horizontal mattress suture. The ultimate load, yield load, and stiffness were determined from the load-displacement results for each sample. Video tracking software was used to determine the cyclic displacement of each sample at the articular margin and the repair site. Strain at the margin and repair site was then calculated using this collected data. There were no significant differences between the 2 repairs in ultimate load (P = .577), strain at the repair site (P = .355), or strain at the margin (P = .801). No instance of failure was due to the PASTA Bridge construct itself. The results of this study have established that the PASTA Bridge is biomechanically equivalent to the transtendon repair technique. The PASTA Bridge is technically easy, percutaneous, reproducible, and is associated with fewer risks.
Continue to: Rotator cuff tests...
Rotator cuff tears can be classified as full-thickness or partial-thickness; the latter being further divided into the bursal surface, articular-sided, or intratendinous tears. A study analyzing the anatomical distribution of partial tears found that approximately 50% of those at the rotator cuff footprint were articular-sided and predominantly involved the supraspinatus tendon.1 These partial-thickness articular-sided supraspinatus tendon avulsion tears have been coined “PASTA lesions.” Current treatment recommendations suggest that a debridement, a transtendon technique, or a “takedown” method of completing a partial tear and performing a full-thickness repair be utilized for partial-thickness rotator cuff repairs.
The primary goal of a partial cuff repair is to reestablish the tendon footprint at the humeral head. It has been argued that the “takedown” method alters the normal footprint and presents tension complications that can result in poor outcomes.2-5 Also, if the full-thickness repair fails, the patient is left with a full-thickness tear that could be more disabling. The trans-tendon technique has proven to be superior in this sense, demonstrating an improvement in both footprint contact and healing potential.3-5 This article aims to evaluate the biomechanical effectiveness of a new PASTA lesion repair technique, the PASTA Bridge,6 when compared with a traditional transtendon suture anchor repair.
MATERIALS AND METHODS
BIOMECHANICAL OPERATIVE TECHNIQUE: PASTA BRIDGE REPAIR
A 17-gauge spinal needle was used to create a puncture in the supraspinatus tendon approximately 7.5 mm anterior to the centerline of the footprint and just medial to the simulated tear line. A 1.1-mm blunt Nitinol wire (Arthrex) was placed over the top of the spinal needle, and the spinal needle was removed. A 2.4-mm portal dilation instrument (Arthrex) was placed over the top of the 1.1 blunt wire (Arthrex) followed by the drill spear for the 2.4-mm BioComposite SutureTak (Arthrex). A pilot hole was created just medial to the simulated tear using the spear and a 1.8-mm drill followed by insertion of a 2.4-mm BioComposite SutureTak (Arthrex). This process was repeated approximately 5 mm posterior to the centerline of the footprint. A strand of suture from each anchor was tied in a manner similar to the “double pulley” method described by Lo and Burkhart.3 The opposing 2 limbs were tensioned to pull the knot taut over the repair site and fixed laterally with a 4.75-mm BioComposite SwiveLock (Arthrex) placed approximately 1 cm lateral to the greater tuberosity.
BIOMECHANICAL OPERATIVE TECHNIQUE: CONTROL (4.5-MM CORKSCREW FT GROUP)
A No. 11 scalpel was used to create a puncture in the tendon for a transtendon approach. A 4.5-mm titanium Corkscrew FT (Arthrex) was placed just medial to the beginning of the simulated tear. The No. 2 FiberWire (Arthrex) was passed anterior and posterior to the hole made for the transtendon approach. A horizontal mattress stitch was tied using a standard 2-handed knot technique.
BIOMECHANICAL ANALYSIS
The proximal humeri with intact supraspinatus tendons were removed from 6 matched pairs of fresh-frozen cadaver shoulders (3 males, 3 females; average age, 49 ± 12 years). The shaft of the humerus was potted in fiberglass resin. For each sample, a partial tear of the supraspinatus tendon was replicated by using a sharp blade to transect 50% of the medial side of the supraspinatus from the tuberosity.2,5 From each matched pair, 1 humerus was selected to receive a PASTA Bridge repair,6 and the contralateral repair was performed using one 4.5-mm titanium Corkscrew FT. Half of the samples of each repair were performed on the right humerus to avoid a mechanical bias. Each repair was performed by the same orthopedic surgeon.
Continue to: Biomechanical testing was...
Biomechanical testing was conducted using an INSTRON 8871 Axial Table Top Servo-hydraulic Testing System (INSTRON), with a 5 kN load cell attached to the crosshead. The system was calibrated using FastTrack software (AEC Software), and both the load and position controls were run through WaveMaker software (WaveMaker). Each sample was positioned on a fixed angle fixture and secured to the testing surface so that the direction of pull would be performed 45° to the humeral shaft. A custom fixture with inter-digitated brass clamps was attached to the crosshead, and dry ice was used to freeze the tendon to the clamp. The test setup can be seen in Figures 1A, 1B.

Each sample was pre-loaded to 10 N to remove slack from the system. Pre-loading was followed by cyclic loading between 10 N and 100 N,7-11 at 1 Hz, for 100 cycles. One-hundred cycles were chosen based on literature stating that the majority of the cyclic displacement occurs in the first 100 cycles.7-10 Post cycling, the samples were loaded to failure at a rate of 33 mm/sec.7-12 Load and position data were recorded at 500 Hz, and the mode of failure was noted for each sample.

Before loading, a soft-tissue marker was used to create individual marks on the supraspinatus in-line with the articular margin and lateral edge of the tuberosity (Figures 1A, 1B). The individual marks, a digital camera, and MaxTraq video tracking software (Innovision Systems) were used to calculate displacement and strain.

For each sample, the ultimate load, yield load, and stiffness were determined from the load-displacement results. Video tracking software was used to determine the cyclic displacement of each sample at both the articular margin (medial dots) and at the repair site. The strain at these 2 locations was calculated by dividing the cyclic displacement of the respective site by the distance between the site of interest and the lateral edge of the tuberosity (lateral marks) (ΔL/L). Paired t tests (α = 0.05) were used to determine if differences in ultimate load or strain between the 2 repairs were significant.

RESULTS
BIOMECHANICAL ANALYSIS
The results of the biomechanical testing are provided in the Table. There were no significant differences between the 2 repairs in ultimate load (P = .577), strain at the repair site (P = .355), or strain at the margin (P = .801). A post-hoc power analysis revealed that a sample size of at least 20 matched pairs would be needed to establish a significant difference for strain at the repair site. The modes of failure were mid-substance tendon tearing, the humeral head breaking, tearing at the musculotendinous junction, or the tendon tearing at the repair site. All 4 modes of failure occurred in at least 1 sample from both repair groups (Figures 2-4). Visual inspection of the samples post-testing revealed no damage to the anchors or sutures. A representative picture of the tendon tearing at the repair site can be seen in Figures 2A, 2B.

Continue to: The purpose of...
DISCUSSION
The purpose of this study was to evaluate the biomechanical strength of a new technique for PASTA repairs—the PASTA Bridge.6 After creation of a partial-thickness tear on a cadaveric model, we compared the PASTA Bridge technique6 with a standard transtendon suture anchor repair. We hypothesized that the PASTA Bridge would yield equivalent or better biomechanical properties including the ultimate load to failure and the degree of strain at different locations in the repair. Our results supported this hypothesis. The PASTA Bridge was biomechanically equivalent to transtendon repair.
For repairs of partial-thickness rotator cuff tears, 2 traditional techniques are transtendon repairs and the “takedown” method of completing a partial tear into a full tear with a subsequent repair.13 While clinical outcomes of the 2 methods suggest no superiority over the other,13 studies have demonstrated a biomechanical advantage with transtendon repairs. Repairs of PASTA lesions exhibit both lower strain and displacement of the repaired tendon compared with a full-thickness repair.2-5 Failure of the “takedown” method results in a full-thickness rotator cuff tear as opposed to a partial tear. This outcome can prove to be more debilitating for the patient. Furthermore, Mazzocca and colleagues5 illustrated that for partial tears >25% thickness, the cuff strain returned to the intact state once repaired.
Our data suggest that biomechanically the transtendon and the PASTA Bridge6 techniques were equivalent. While the ultimate load and strain at repair sites are comparable, the PASTA Bridge is percutaneous and presents significantly less risk of complications. The PASTA Bridge6 uses a medial row horizontal mattress with a lateral row fixation to recreate the rotator cuff footprint. It has been postulated that reestablishing a higher percentage of the footprint can aide in tendon-bone healing, having valuable implications for both biological and clinical outcomes of the patient.3,4,14 Greater contact at the tendon-bone interface may allow more fibers to participate in the healing process.14 In their analysis of rotator cuff repair, Apreleva and colleagues14 asserted that more laterally placed suture anchors may increase the repair-site area. The lateral anchors of the PASTA Bridge help not only to increase the footprint and thereby the healing potential of the repair but also assist in taking pressure off the medial row anchors.
In their report on double-row rotator cuff repair, Lo and Burkhart3 suggest that double-row fixation is superior to single-row repairs for a variety of reasons. Primarily, double-row techniques increase the number of points of fixation, which will secondarily reduce both the stress and load at each suture point.3 This effect improves the overall strength of the repair construct. Use of the lateral anchor of the PASTA Bridge6 allows the medial anchors to act as pivot points. Placing the stress laterally, the configuration allows for movement and strain distribution without sacrificing the integrity of the repair. In our analysis, failure occurred by the tendon tearing mid-substance, humeral head breaking, tendon tearing at the repair site, and tearing at the musculotendinous junction (Figures 2-4). There was no instance of failure due to the construct itself indicating that the 2.4-mm medial anchors are more than adequate for the PASTA Bridge.6 When visually inspecting the samples after failure, there was no damage to the anchors or sutures. This observation indicates that the PASTA Bridge construct is remarkably strong and capable of withstanding excessive forces.
There were some potential limitations of this study. The small sample size modified the potential for identifying significant differences between the groups. A post-hoc power analysis revealed that a sample size of at least 20 matched pairs would be required to determine a significant difference between the 2 repair groups in strain at the repair site. We did not test this many pairs because the data was so similar after 6 matched pairs that it did not warrant continuing further. Additional research should be done with larger sample populations to evaluate the biomechanical efficacy of this technique further.
CONCLUSION
The PASTA Bridge6 creates a strong construct for repair of articular-sided partial-thickness tears of the supraspinatus. The data suggest the PASTA Bridge6 is biomechanically equivalent to the gold standard transtendon suture anchor repair. The PASTA Bridge6 is technically sound, percutaneous, and presents less risk of complications. It does not require arthroscopic knot tying and carries only minimal risk of damage to residual tissues. In our analysis, there were no failures of the actual construct, asserting that the PASTA Bridge6 is a strong, durable repair. The PASTA Bridge6 should be strongly considered by surgeons treating PASTA lesions.
1. Schaeffeler C, Mueller D, Kirchhoff C, Wolf P, Rummeny EJ, Woertler K. Tears at the rotator cuff footprint: prevalence and imaging characteristics in 305 MR arthrograms of the shoulder. Eur Radiol. 2011;21:1477-1484. doi:10.1007/s00330-011-2066-x.
2. Gonzalez-Lomas G, Kippe MA, Brown GD, et al. In situ transtendon repair outperforms tear completion and repair for partial articular-sided supraspinatus tendon tears. J Shoulder Elbow Surg. 2008;17(5):722-728.
3. Lo IKY, Burkhart SS. Transtendon arthroscopic repair of partial-thickness, articular surface tears of the rotator cuff. Arthroscopy. 2004; 20(2):214-220. doi:10.1016/j.arthro.2003.11.042.
4. Mazzocca AD, Millett PJ, Guanche CA, Santangelo SA, Arciero RA. Arthroscopic single-row versus double-row suture anchor rotator cuff repair. Am J Sports Med. 2005;33(12):1861-1868.
5. Mazzocca AD, Rincon LM, O’Connor RW, et al. Intra-articular partial-thickness rotator cuff tears: analysis of injured and repaired strain behavior. Am J Sports Med. 2008;36(1):110-116. doi:10.1177/0363546507307502.
6. Hirahara AM, Andersen WJ. The PASTA bridge: a technique for the arthroscopic repair of PASTA lesions. Arthrosc Tech. In Press. Epub 2017 Sept 18.
7. Barber FA, Coons DA, Ruiz-Suarez M. Cyclic load testing and ultimate failure strength of biodegradable glenoid anchors. Arthroscopy. 2008; 24(2):224-228. doi:10.1016/j.arthro.2007.08.011.
8. Barber FA, Coons DA, Ruiz-Suarez M. Cyclic load testing of biodegradable suture anchors containing 2 high-strength sutures. Arthroscopy. 2007; 23(4):355-360. doi:10.1016/j.arthro.2006.12.009.
9. Barber FA, Feder SM, Burkhart SS, Ahrens J. The relationship of suture anchor failure and bone density to proximal humerus location: a cadaveric study. Arthroscopy. 1997;13(3):340-345. doi:10.1016/j.jbiomech.2009.12.007.
10. Barber FA, Herbert MA, Richards DP. Sutures and suture anchors: update 2003. Arthroscopy. 2003;19(9):985-990.
11. Burkhart SS, Johnson TC, Wirth MA, Athanasiou KA. Cyclic loading of transosseous rotator cuff repairs: tension overload as a possible cause of failure. Arthroscopy. 1997;13(2):172-176. doi:10.1016/S0749-8063(97)90151-1.
12. Hecker AT, Shea M, Hayhurst JO, Myers ER, Meeks LW, Hayes WC. Pull-out strength of suture anchors for rotator cuff and bankart lesion repairs. Am J Sports Med. 1993; 21(6):874-879.
13. Strauss EJ, Salata MJ, Kercher J, et al. The arthroscopic management of partial-thickness rotator cuff tears: a systematic review of the literature. Arthroscopy. 2011;27(4):568-580. doi:10.1016/j.arthro.2010.09.019.
14. Apreleva M, Özbaydar M, Fitzgibbons PG, Warner JJP. Rotator cuff tears: the effect of the reconstruction method on three-dimensional repair-site area. Arthroscopy. 2002;18(5):519-526. doi:10.1053/jars.2002.32930.
ABSTRACT
Partial articular-sided supraspinatus tendon avulsion (PASTA) tears are a common clinical problem that can require surgical intervention to reduce patient symptoms. Currently, no consensus has been reached regarding the optimal repair technique. The PASTA Bridge technique was developed by the senior author to address these types of lesions. A controlled laboratory study was performed comparing the PASTA Bridge with a standard transtendon rotator cuff repair to confirm its biomechanical efficacy. A 50% articular-sided partial tear of the supraspinatus tendon was created on 6 matched pairs of fresh-frozen cadaveric shoulders. For each matched pair, 1 humerus received a PASTA Bridge repair, whereas the contralateral side received a repair using a single suture anchor with a horizontal mattress suture. The ultimate load, yield load, and stiffness were determined from the load-displacement results for each sample. Video tracking software was used to determine the cyclic displacement of each sample at the articular margin and the repair site. Strain at the margin and repair site was then calculated using this collected data. There were no significant differences between the 2 repairs in ultimate load (P = .577), strain at the repair site (P = .355), or strain at the margin (P = .801). No instance of failure was due to the PASTA Bridge construct itself. The results of this study have established that the PASTA Bridge is biomechanically equivalent to the transtendon repair technique. The PASTA Bridge is technically easy, percutaneous, reproducible, and is associated with fewer risks.
Continue to: Rotator cuff tests...
Rotator cuff tears can be classified as full-thickness or partial-thickness; the latter being further divided into the bursal surface, articular-sided, or intratendinous tears. A study analyzing the anatomical distribution of partial tears found that approximately 50% of those at the rotator cuff footprint were articular-sided and predominantly involved the supraspinatus tendon.1 These partial-thickness articular-sided supraspinatus tendon avulsion tears have been coined “PASTA lesions.” Current treatment recommendations suggest that a debridement, a transtendon technique, or a “takedown” method of completing a partial tear and performing a full-thickness repair be utilized for partial-thickness rotator cuff repairs.
The primary goal of a partial cuff repair is to reestablish the tendon footprint at the humeral head. It has been argued that the “takedown” method alters the normal footprint and presents tension complications that can result in poor outcomes.2-5 Also, if the full-thickness repair fails, the patient is left with a full-thickness tear that could be more disabling. The trans-tendon technique has proven to be superior in this sense, demonstrating an improvement in both footprint contact and healing potential.3-5 This article aims to evaluate the biomechanical effectiveness of a new PASTA lesion repair technique, the PASTA Bridge,6 when compared with a traditional transtendon suture anchor repair.
MATERIALS AND METHODS
BIOMECHANICAL OPERATIVE TECHNIQUE: PASTA BRIDGE REPAIR
A 17-gauge spinal needle was used to create a puncture in the supraspinatus tendon approximately 7.5 mm anterior to the centerline of the footprint and just medial to the simulated tear line. A 1.1-mm blunt Nitinol wire (Arthrex) was placed over the top of the spinal needle, and the spinal needle was removed. A 2.4-mm portal dilation instrument (Arthrex) was placed over the top of the 1.1 blunt wire (Arthrex) followed by the drill spear for the 2.4-mm BioComposite SutureTak (Arthrex). A pilot hole was created just medial to the simulated tear using the spear and a 1.8-mm drill followed by insertion of a 2.4-mm BioComposite SutureTak (Arthrex). This process was repeated approximately 5 mm posterior to the centerline of the footprint. A strand of suture from each anchor was tied in a manner similar to the “double pulley” method described by Lo and Burkhart.3 The opposing 2 limbs were tensioned to pull the knot taut over the repair site and fixed laterally with a 4.75-mm BioComposite SwiveLock (Arthrex) placed approximately 1 cm lateral to the greater tuberosity.
BIOMECHANICAL OPERATIVE TECHNIQUE: CONTROL (4.5-MM CORKSCREW FT GROUP)
A No. 11 scalpel was used to create a puncture in the tendon for a transtendon approach. A 4.5-mm titanium Corkscrew FT (Arthrex) was placed just medial to the beginning of the simulated tear. The No. 2 FiberWire (Arthrex) was passed anterior and posterior to the hole made for the transtendon approach. A horizontal mattress stitch was tied using a standard 2-handed knot technique.
BIOMECHANICAL ANALYSIS
The proximal humeri with intact supraspinatus tendons were removed from 6 matched pairs of fresh-frozen cadaver shoulders (3 males, 3 females; average age, 49 ± 12 years). The shaft of the humerus was potted in fiberglass resin. For each sample, a partial tear of the supraspinatus tendon was replicated by using a sharp blade to transect 50% of the medial side of the supraspinatus from the tuberosity.2,5 From each matched pair, 1 humerus was selected to receive a PASTA Bridge repair,6 and the contralateral repair was performed using one 4.5-mm titanium Corkscrew FT. Half of the samples of each repair were performed on the right humerus to avoid a mechanical bias. Each repair was performed by the same orthopedic surgeon.
Continue to: Biomechanical testing was...
Biomechanical testing was conducted using an INSTRON 8871 Axial Table Top Servo-hydraulic Testing System (INSTRON), with a 5 kN load cell attached to the crosshead. The system was calibrated using FastTrack software (AEC Software), and both the load and position controls were run through WaveMaker software (WaveMaker). Each sample was positioned on a fixed angle fixture and secured to the testing surface so that the direction of pull would be performed 45° to the humeral shaft. A custom fixture with inter-digitated brass clamps was attached to the crosshead, and dry ice was used to freeze the tendon to the clamp. The test setup can be seen in Figures 1A, 1B.
Each sample was pre-loaded to 10 N to remove slack from the system. Pre-loading was followed by cyclic loading between 10 N and 100 N,7-11 at 1 Hz, for 100 cycles. One-hundred cycles were chosen based on literature stating that the majority of the cyclic displacement occurs in the first 100 cycles.7-10 Post cycling, the samples were loaded to failure at a rate of 33 mm/sec.7-12 Load and position data were recorded at 500 Hz, and the mode of failure was noted for each sample.
Before loading, a soft-tissue marker was used to create individual marks on the supraspinatus in-line with the articular margin and lateral edge of the tuberosity (Figures 1A, 1B). The individual marks, a digital camera, and MaxTraq video tracking software (Innovision Systems) were used to calculate displacement and strain.
For each sample, the ultimate load, yield load, and stiffness were determined from the load-displacement results. Video tracking software was used to determine the cyclic displacement of each sample at both the articular margin (medial dots) and at the repair site. The strain at these 2 locations was calculated by dividing the cyclic displacement of the respective site by the distance between the site of interest and the lateral edge of the tuberosity (lateral marks) (ΔL/L). Paired t tests (α = 0.05) were used to determine if differences in ultimate load or strain between the 2 repairs were significant.
RESULTS
BIOMECHANICAL ANALYSIS
The results of the biomechanical testing are provided in the Table. There were no significant differences between the 2 repairs in ultimate load (P = .577), strain at the repair site (P = .355), or strain at the margin (P = .801). A post-hoc power analysis revealed that a sample size of at least 20 matched pairs would be needed to establish a significant difference for strain at the repair site. The modes of failure were mid-substance tendon tearing, the humeral head breaking, tearing at the musculotendinous junction, or the tendon tearing at the repair site. All 4 modes of failure occurred in at least 1 sample from both repair groups (Figures 2-4). Visual inspection of the samples post-testing revealed no damage to the anchors or sutures. A representative picture of the tendon tearing at the repair site can be seen in Figures 2A, 2B.
Continue to: The purpose of...
DISCUSSION
The purpose of this study was to evaluate the biomechanical strength of a new technique for PASTA repairs—the PASTA Bridge.6 After creation of a partial-thickness tear on a cadaveric model, we compared the PASTA Bridge technique6 with a standard transtendon suture anchor repair. We hypothesized that the PASTA Bridge would yield equivalent or better biomechanical properties including the ultimate load to failure and the degree of strain at different locations in the repair. Our results supported this hypothesis. The PASTA Bridge was biomechanically equivalent to transtendon repair.
For repairs of partial-thickness rotator cuff tears, 2 traditional techniques are transtendon repairs and the “takedown” method of completing a partial tear into a full tear with a subsequent repair.13 While clinical outcomes of the 2 methods suggest no superiority over the other,13 studies have demonstrated a biomechanical advantage with transtendon repairs. Repairs of PASTA lesions exhibit both lower strain and displacement of the repaired tendon compared with a full-thickness repair.2-5 Failure of the “takedown” method results in a full-thickness rotator cuff tear as opposed to a partial tear. This outcome can prove to be more debilitating for the patient. Furthermore, Mazzocca and colleagues5 illustrated that for partial tears >25% thickness, the cuff strain returned to the intact state once repaired.
Our data suggest that biomechanically the transtendon and the PASTA Bridge6 techniques were equivalent. While the ultimate load and strain at repair sites are comparable, the PASTA Bridge is percutaneous and presents significantly less risk of complications. The PASTA Bridge6 uses a medial row horizontal mattress with a lateral row fixation to recreate the rotator cuff footprint. It has been postulated that reestablishing a higher percentage of the footprint can aide in tendon-bone healing, having valuable implications for both biological and clinical outcomes of the patient.3,4,14 Greater contact at the tendon-bone interface may allow more fibers to participate in the healing process.14 In their analysis of rotator cuff repair, Apreleva and colleagues14 asserted that more laterally placed suture anchors may increase the repair-site area. The lateral anchors of the PASTA Bridge help not only to increase the footprint and thereby the healing potential of the repair but also assist in taking pressure off the medial row anchors.
In their report on double-row rotator cuff repair, Lo and Burkhart3 suggest that double-row fixation is superior to single-row repairs for a variety of reasons. Primarily, double-row techniques increase the number of points of fixation, which will secondarily reduce both the stress and load at each suture point.3 This effect improves the overall strength of the repair construct. Use of the lateral anchor of the PASTA Bridge6 allows the medial anchors to act as pivot points. Placing the stress laterally, the configuration allows for movement and strain distribution without sacrificing the integrity of the repair. In our analysis, failure occurred by the tendon tearing mid-substance, humeral head breaking, tendon tearing at the repair site, and tearing at the musculotendinous junction (Figures 2-4). There was no instance of failure due to the construct itself indicating that the 2.4-mm medial anchors are more than adequate for the PASTA Bridge.6 When visually inspecting the samples after failure, there was no damage to the anchors or sutures. This observation indicates that the PASTA Bridge construct is remarkably strong and capable of withstanding excessive forces.
There were some potential limitations of this study. The small sample size modified the potential for identifying significant differences between the groups. A post-hoc power analysis revealed that a sample size of at least 20 matched pairs would be required to determine a significant difference between the 2 repair groups in strain at the repair site. We did not test this many pairs because the data was so similar after 6 matched pairs that it did not warrant continuing further. Additional research should be done with larger sample populations to evaluate the biomechanical efficacy of this technique further.
CONCLUSION
The PASTA Bridge6 creates a strong construct for repair of articular-sided partial-thickness tears of the supraspinatus. The data suggest the PASTA Bridge6 is biomechanically equivalent to the gold standard transtendon suture anchor repair. The PASTA Bridge6 is technically sound, percutaneous, and presents less risk of complications. It does not require arthroscopic knot tying and carries only minimal risk of damage to residual tissues. In our analysis, there were no failures of the actual construct, asserting that the PASTA Bridge6 is a strong, durable repair. The PASTA Bridge6 should be strongly considered by surgeons treating PASTA lesions.
1. Schaeffeler C, Mueller D, Kirchhoff C, Wolf P, Rummeny EJ, Woertler K. Tears at the rotator cuff footprint: prevalence and imaging characteristics in 305 MR arthrograms of the shoulder. Eur Radiol. 2011;21:1477-1484. doi:10.1007/s00330-011-2066-x.
2. Gonzalez-Lomas G, Kippe MA, Brown GD, et al. In situ transtendon repair outperforms tear completion and repair for partial articular-sided supraspinatus tendon tears. J Shoulder Elbow Surg. 2008;17(5):722-728.
3. Lo IKY, Burkhart SS. Transtendon arthroscopic repair of partial-thickness, articular surface tears of the rotator cuff. Arthroscopy. 2004; 20(2):214-220. doi:10.1016/j.arthro.2003.11.042.
4. Mazzocca AD, Millett PJ, Guanche CA, Santangelo SA, Arciero RA. Arthroscopic single-row versus double-row suture anchor rotator cuff repair. Am J Sports Med. 2005;33(12):1861-1868.
5. Mazzocca AD, Rincon LM, O’Connor RW, et al. Intra-articular partial-thickness rotator cuff tears: analysis of injured and repaired strain behavior. Am J Sports Med. 2008;36(1):110-116. doi:10.1177/0363546507307502.
6. Hirahara AM, Andersen WJ. The PASTA bridge: a technique for the arthroscopic repair of PASTA lesions. Arthrosc Tech. In Press. Epub 2017 Sept 18.
7. Barber FA, Coons DA, Ruiz-Suarez M. Cyclic load testing and ultimate failure strength of biodegradable glenoid anchors. Arthroscopy. 2008; 24(2):224-228. doi:10.1016/j.arthro.2007.08.011.
8. Barber FA, Coons DA, Ruiz-Suarez M. Cyclic load testing of biodegradable suture anchors containing 2 high-strength sutures. Arthroscopy. 2007; 23(4):355-360. doi:10.1016/j.arthro.2006.12.009.
9. Barber FA, Feder SM, Burkhart SS, Ahrens J. The relationship of suture anchor failure and bone density to proximal humerus location: a cadaveric study. Arthroscopy. 1997;13(3):340-345. doi:10.1016/j.jbiomech.2009.12.007.
10. Barber FA, Herbert MA, Richards DP. Sutures and suture anchors: update 2003. Arthroscopy. 2003;19(9):985-990.
11. Burkhart SS, Johnson TC, Wirth MA, Athanasiou KA. Cyclic loading of transosseous rotator cuff repairs: tension overload as a possible cause of failure. Arthroscopy. 1997;13(2):172-176. doi:10.1016/S0749-8063(97)90151-1.
12. Hecker AT, Shea M, Hayhurst JO, Myers ER, Meeks LW, Hayes WC. Pull-out strength of suture anchors for rotator cuff and bankart lesion repairs. Am J Sports Med. 1993; 21(6):874-879.
13. Strauss EJ, Salata MJ, Kercher J, et al. The arthroscopic management of partial-thickness rotator cuff tears: a systematic review of the literature. Arthroscopy. 2011;27(4):568-580. doi:10.1016/j.arthro.2010.09.019.
14. Apreleva M, Özbaydar M, Fitzgibbons PG, Warner JJP. Rotator cuff tears: the effect of the reconstruction method on three-dimensional repair-site area. Arthroscopy. 2002;18(5):519-526. doi:10.1053/jars.2002.32930.
TAKE-HOME POINTS
- The PASTA Bridge is biomechanically equivalent to the gold-standard transtendon repair technique.
- The configuration is a double-row repair, increasing the number of fixation points.
- The lateral anchor of the PASTA Bridge assumes the stress of the repair, allowing the medial anchors to act as pivot points.
- The PASTA Bridge is strong and capable of withstanding excessive forces.
- The PASTA Bridge poses less risk of complication.
Patient Preferences in Office-Based Orthopedic Care: A Prospective Evaluation
ABSTRACT
Patient satisfaction has become a topic of interest within orthopedics as the landscape of provider reimbursement continues to evolve to reward value of care. Online internet physician rating sites are becoming increasingly popular ways for patients to subjectively express their provider experience. Understanding what patients value during their episode of care is important in the modern healthcare environment. The purpose of this study is to determine what preferences, if any, patients have when selecting their physician and how they experience care in an outpatient orthopedic setting. A prospective survey was electronically administered to 212 patients in an adult reconstruction clinic. One hundred ninety-six patients (92.5%) completed the survey. Demographic questions regarding age, sex, ethnicity, and prior adult reconstruction surgical history were obtained. When patients were asked how much time they would like the doctor to spend with them on a routine visit, the most common answer was 10 to 15 minutes (41.3%), with only 10.2% patients desiring >20 minutes. The majority of patients (83.1%) believe ≥30 minutes is too long to wait to see their surgeon. Less than half of patients (41.8%) stated that they would feel as though they were receiving below average care if seen only by a nurse practitioner or physician’s assistant at a postoperative visit. Patients reported no significant age, gender, or ethnicity preferences for their physician. Recommendations from friends or other physicians was the most common (66.4%) way for patients to find their physicians, while 12.2% utilized online rating sites during their search. Optimizing patient experiences in the office may include keeping wait times to <30 minutes and educating patients on the roles of physician extenders. More work needs to be done to further elucidate variables influencing the subjective patient experience with their orthopedic care.
Continue to: Patient satisfaction...
Patient satisfaction has become an important focus in the rapidly changing healthcare environment due to the significant impact it has on healthcare delivery, healthcare economics, assessment of the quality of care, development of patient-care models, and quality improvement initiatives.1-4 Historically, the quality of care was measured by objective metrics such as complication rates, range-of-motion, and the provider’s expert opinion on the outcome. While those metrics are still impactful variables when defining a successful outcome, the medical community is now increasingly recognizing the importance of patients’ perspectives when defining successful treatments. Patient satisfaction is now highly regarded by clinicians and the government when considering outcomes and is even being incorporated into determining the value of care. Under the Affordable Care Act, patients assumed a more active role in clinical decision-making as well as in creating quality and efficiency initiatives.5,6 By 2017, 2% of the United States government’s Medicare payments will be redistributed among hospitals and physicians based on their quality and efficiency metrics, which are largely determined by patients’ evaluations of care.7 As a result, there has been significant interest in identifying variables influencing patient satisfaction and subjective outcomes.8,9
Patient satisfaction is related to both the outcomes of care and the process of care. As first described by Donabedian,10patients may be satisfied with the successful outcome of their care, but dissatisfied with how they received their care. The process of care is complex and considers many aspects of healthcare delivery, including time, cost, healthcare provider interactions, and burdens faced. While patient satisfaction with outcomes and process of care are heavily related, they should be regarded separately. It is essential that providers understand what variables are important to patients with regards to how they experience healthcare and choose their provider, especially surrounding elective procedures such as hip and knee arthroplasty.11,12
Within orthopedic surgery, patient satisfaction scores are beginning to be incorporated as part of the standard-of-care quality metrics obtained along with patient-reported outcome measures (PROMs) at defined time points postoperatively. Furthermore, PROMs and patient satisfaction data are becoming an increasingly important component of medical decision-making.13-16 Several authors have reported that increased patient satisfaction is correlated with increased compliance, improved treatment outcomes across numerous medical settings, including orthopedics, decreased risk of litigation, and higher patient ratings of the quality of care.17,18 Various factors, including meeting of expectations, staff politeness, the communication skills of the surgeon, and waiting times, have been suggested to influence eventual patient satisfaction within the surgical literature.19-21 However, within orthopedic surgery there is a paucity of investigations evaluating how patients determine preferences and satisfaction with the process of care.
The purpose of this study is to determine what preferences, if any, patients have when selecting their physician and how they experience care in an outpatient orthopedic setting. The authors hypothesize that the majority of patients find their physicians through online rating sites or recommendations from family and friends. The authors believe that patients expect to be seen in <30 minutes and will be unsatisfied overall with the amount of time that they spend with their physician.
Continue to: METHODS...
METHODS
The senior author (BRL) and a research team created a 15-question survey to evaluate patient preferences regarding the demographic characteristics (eg, age, gender, ethnicity) of their physician, wait times in a waiting room, time spent with the physician, care received from physician extenders (eg, nurse practitioners, physician assistants), and how they learned of their physician (Appendix). An a priori power analysis was conducted to determine that approximately 200 patients were needed for inclusion.11,22 Following Institutional Review Board approval (ORA 15051104), the survey was administered to 212 patients in a single-surgeon, adult reconstruction clinic. The survey was digitally administered on a touch-screen tablet using an electronic independent third party survey center (SurveyMonkey Inc) devoid of any identifying data. The survey was offered to all patients >21 years of age who were English-speaking and in the common area as patients waiting to be seen, from June 2015 to March 2016. A research assistant approached patients in the waiting room and asked if they would like to participate in a short survey regarding what factors influence the patient-physician relationship from the patient’s perspective.
Appendix 1
- Do you wish to partake in this 3-minute survey?
- Have you had a prior knee or hip replacement?
- What is your age?
- 30-40 years
- 40-50 years
- 50-60 years
- 60-70 years
- 70-80 years
- 80+ years
- What is your gender?
- Which of the following best represents your racial or ethnic heritage?
- African American
- How much time would you like the doctor to spend talking to you on a routine visit?
- 0-5 minutes
- 5-10 minutes
- 10-15 minutes
- 15-20 minutes
- 20-30 minutes
- >30 minutes
- How long is too long to wait to see the doctor?
- 10 minutes
- 20 minutes
- 30 minutes
- 40 minutes
- 50 minutes
- An hour or more
- If you were to only see a physician’s assistant or nurse practitioner at your follow-up visit and not the doctor, would you feel like you were getting below average care?
- Overall I am satisfied with the time the doctor spends with me.
- If you were to need a major surgery, would you want the physician to tell you what he or she would do if they were in your shoes?
- Would you prefer your doctor to be the same race/ethnicity as you?
- No
- No Preference
- Would you feel more comfortable with a male as opposed to a female orthopedic surgeon?
- Would you feel more comfortable with a female as opposed to a male orthopedic surgeon?
- What age would you like your physician to be?
- 25-35 years old
- 35-45 years old
- 45-55 years old
- 55-65 years old
- 65 years and older
- No preference
- How do you usually find your physician?
- Friends’ recommendations
- Healthcare provider’s recommendations
- Insurance plans
- Online research/ratings
- Other
Descriptive statistics were used to analyze subject demographics and survey responses. Chi-square analyses and multinomial logistic regressions were utilized to compare responses. All statistical analyses were conducted using SPSS version 24.0 software (SPSS Inc). Statistical significance was set at P < 0.05.
RESULTS
Of the 212 patients who were invited to participate, 196 patients (92.4%) agreed and completed the survey. Demographic and surgical history information can be found in Table 1. The majority of patients were female (62%) and above the age of 50 years (92.4%). Almost half (48.5%) of patients had a prior hip or knee replacement.
Table 1. Survey Respondent Demographics
| Number | Percent |
Age Range | ||
30-40 years | 4 | 2.0% |
40-50 years | 11 | 5.6% |
50-60 years | 47 | 24.0% |
60-70 years | 84 | 42.9% |
70-80 years | 41 | 20.9% |
>80 years | 9 | 4.6% |
Gender | ||
Male | 74 | 37.8% |
Female | 122 | 62.2% |
Ethnicity | ||
African American | 39 | 19.9% |
Asian | 3 | 1.5% |
Caucasian | 140 | 71.4% |
Hispanic | 10 | 5.1% |
Other | 4 | 2.0% |
Prior knee or hip replacement | ||
Yes | 95 | 48.5% |
No | 55 | 28.1% |
No Response | 46 | 23.5% |
When asked how long is too long to wait to see the doctor, 30 minutes (39.8%) was most commonly selected, followed by 40 minutes (24.5%) (Figure 1). When asked how much time patients would like the doctor to spend with them during an office visit, the majority (68.9%) selected either 10 to 15 minutes (41.3%) or 15 to 20 minutes (27.6%) (Figure 2). The majority of patients (92.3%) were satisfied with the amount of time the doctor spent with them. In addition, 94.9% of respondents would want their doctor to tell them what they would do if they were in the patient’s shoes when making decisions regarding their medical care (Table 2). Less than half of respondents (41.8%) believe that seeing a physician extender (eg, nurse practitioner or physician assistant) at a postoperative visit would result in a lower quality of care (Table 2).
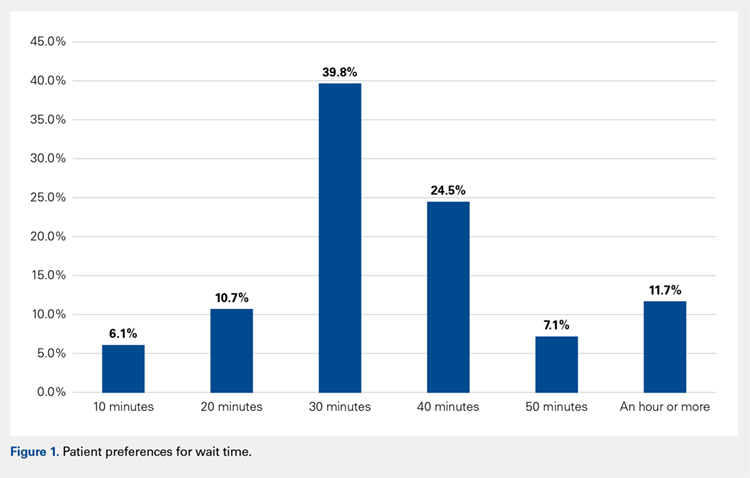
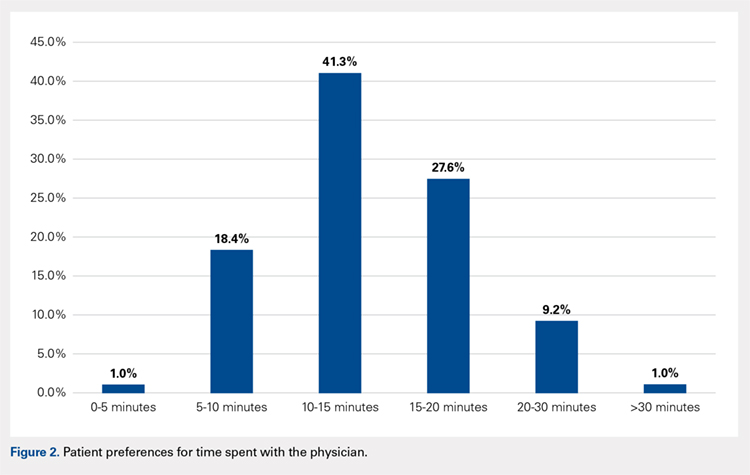
Table 2. Responses to Survey Questions
If you were to only see a physician's assistant or nurse practitioner at your follow-up visit and not the doctor, would you feel like you were getting below average care? | ||
Answer choices | Number | Percent |
No | 114 | 58.2% |
Yes | 82 | 41.8% |
If you were to need a major surgery would you want the physician to tell you what he or she would do if they were in your shoes? | ||
Answer choices | Number | Percent |
No | 10 | 5.1% |
Yes | 186 | 94.9% |
Would you prefer your doctor to be the same race/ethnicity as you? | ||
Answer choices | Number | Percent |
No | 29 | 14.8% |
Yes | 3 | 1.5% |
No Preference | 164 | 83.7% |
When asked if patients preferred a doctor of the same race/ethnicity, the vast majority (83.7%) had no preference (Table 2). There was no significant difference found between male and female respondents when asked if they would feel more comfortable with a male as opposed to a female orthopedic surgeon (P = .118) and vice versa (P = .604) (Table 3). Most patients preferred a physician between the ages of 45 and 55 years (39.3%), followed by 35 and 45 years (23.0%); however, this preference was not statistically significant (Table 4). Older patients were more likely to prefer younger physicians (odds ratio, 4.612 for 25-35 years of age; odds ratio, 1.328 for 35-45 years of age). Only 12.2% of patients reported online research/rating sites as the main resource utilized when selecting their physician (Figure 3). The majority (68.4%) reported that recommendations from either friends (35.2%) or healthcare providers (33.2%) were the main avenues through which they found their physicians.
Table 3. Overall Responses to Questions Regarding Male and Female Orthopedic Surgeonsa
Would you feel more comfortable with a male as opposed to a female orthopedic surgeon? | |||||
Answer choices | Number | Percent | Female responses | Male responses | P value |
No | 164 | 83.7% | 106 (86.9%) | 58 (78.4%) | 0.118 |
Yes | 32 | 16.3% | 16 (13.1%) | 16 (21.6%) |
|
Would you feel more comfortable with a female as opposed to a male orthopedic surgeon? | |||||
Answer choices | Number | Percent | Female responses | Male responses | P value |
No | 186 | 94.9% | 115 (94.3%) | 71 (95.9%) | 0.604 |
Yes | 10 | 5.1% | 7 (5.7%) | 3 (4.1%) |
|
aResponses were broken down by gender and compared utilizing a 2 x 2 chi-square analysis to test for significant differences in respondents’ gender preferences for their orthopedic surgeon.
Table 4. Patient Preferences Regarding Physician Age
What age would you like your physician to be? |
| 95% Confidence Interval | ||||
Answer Choices | Number or Responses | Percent | P value | Exp(β) | Lower Bound | Upper Bound |
25-35 years | 1 | 0.5% | 0.217 | 4.612 | 0.407 | 52.283 |
35-45 years | 45 | 23.0% | 0.161 | 1.328 | 0.893 | 1.975 |
45-55 years | 77 | 39.3% | 0.159 | 1.276 | 0.909 | 1.791 |
55-65 years | 9 | 4.6% | 0.483 | 1.302 | 0.624 | 2.717 |
≥65 years | 2 | 1.0% | 0.272 | 0.491 | 0.138 | 1.748 |
No preferencea | 62 | 31.6% | Reference | |||
aNo preference was used as the reference category for the answer choices, while the age bracket “>80 years” was used as the reference for the age of respondent variable.
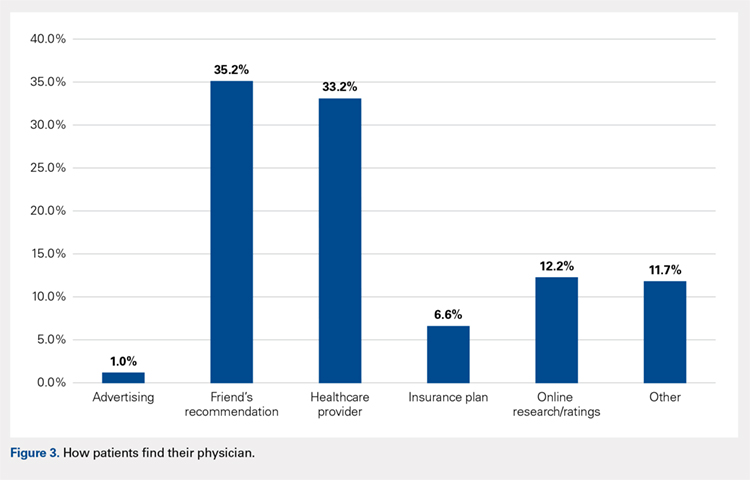
Continue to: DISCUSSION...
DISCUSSION
The results of this study demonstrate that patients have several expectations and preferences with regards to the care they receive from physicians in the office. Patients prefer to wait <30 minutes before seeing their provider and desire only 10 to 20 minutes with their doctor. Patients do not have specific preferences with regards to the gender or ethnicity of their physician but would prefer a physician in the middle of their career, aged 45 to 55 years. Ultimately, patients do believe that seeing a physician at a postoperative visit is important, as just under half of patients thought that seeing a physician extender alone at a postoperative visit resulted in a lower quality of care.
While these results were obtained in a population specifically seeking the care of an orthopedic adult reconstruction surgeon, the results demonstrate that patients do not necessarily desire an unreasonable amount of time with their doctor. Patients simply want to be seen in a timely fashion and receive the full undivided attention of their doctor for approximately 20 minutes. Similarly, Patterson and colleagues22 found, in their series of 182 patients who presented to an orthopedic surgeon, that there was a significant correlation between time spent with the surgeon and overall patient satisfaction. Interestingly, the authors reported that patient satisfaction was not correlated with education level, sex, marital status, whether the patients were evaluated by a resident physician before seeing the attending surgeon, self-reported mental status, tobacco usage, the type of clinic visit, or the waiting time to see the surgeon (average, about 40 minutes for this cohort).22 Similarly, Teunis and colleagues23 reported an average 32-minute wait time in 81 patients presenting for care at an orthopedic hand clinic and demonstrated that a longer wait time was associated with decreased patient satisfaction. These results corroborate the findings of this study that a short wait time is important to patients when evaluating the process of care. Additionally, patients do not have unreasonable expectations with regards to the amount of time they would like to spend with the physician. A physician who has a clinic for 9 hours a day would thus be able to see 54 patients and still spend at least 10 minutes with each patient. The quality of the physician-patient interaction is likely more important than the actual amount of time spent; however, based on this study, patients do have certain expectations about how much time physicians should spend with them.
There were no significant sex, age, or ethnicity preferences in our specific patient cohort. However, a sizable percentage of respondents, 41.8%, believed that they were receiving inferior care if they only saw a physician extender at a routine follow-up visit. Many orthopedic surgeons rely on the care provided by physician extenders to enable them to see additional patients. Physician extenders are well trained to provide high-quality care, including at routine postoperative visits. The results of this study, that many patients believe physician extenders provide lower-quality care, may be a result of inadequate patient education regarding the extensive training and education physician extenders undergo. Physician extenders are qualified, licensed healthcare professionals who are playing increasingly important roles within orthopedics and medicine as a whole. As the demand for orthopedic surgeons to see more patients increases, so does the role of physician extenders. Future research is warranted into educating the public regarding the importance of these healthcare providers and the adequacy of their training.
While many practices now routinely obtain patient satisfaction scores, another modality through which patients can express their satisfaction and experiences with healthcare providers is through online internet physician rating sites (IPRS). These sites have exploded in number and popularity in recent years and, according to some studies, have a very real effect on provider selection.24 Interestingly, a low percentage of patients in this study utilized IPRS reviews to find their doctors. In a recent prospective survey study of 1000 consecutive patients presenting for care at the Mayo Clinic, Burkle and Keegan24 reported that 27% of patients would choose not to see a physician based on a negative IPRS review. Interestingly, only 1.0% of patients reported finding their doctor through advertising. Numerous authors have recently addressed advertising in orthopedic surgery, specifically direct-to-consumer marking, including the influence of physician self-promotion on patients.25,26 Specifically, Halawi and Barsoum26 discussed how direct-to-consumer marketing is commonly disseminated to the public through television and print advertisements, which are modalities more commonly utilized by older generations. However, many advertising agencies are moving toward internet-based advertising, especially through orthopedic group and individual surgeon websites for self-promoting advertisement, as approximately 75% of Americans use the internet for health-related information.25,27 The fact that many patients in this study did not utilize IPRS reviews or advertising (much of which is electronic) may be a result of the older, less internet-centric demographic that is often seen in an adult reconstruction clinic. Future research is warranted to determine what demographic of patients value IPRS reviews and how those reviews influence physician selection and the patient experience.
There are several limitations to this study. First, the majority of the surveyed population was Caucasian, and our results may not be equally reflective of diverse ethnic backgrounds. Second, the cohort size, while based on previous studies conducted in a similar fashion, may be underpowered to detect significant differences for 1 or more of these questions. In addition, having a question regarding the patient’s medical background or experiences may have provided further insight as to why patients selected the answers that they did. Furthermore, questions regarding the patient’s education level, religious background, and income brackets may have provided further context in which to evaluate their responses. These questions were omitted in an effort to keep the questionnaire at a length that would maximize enrollment and prevent survey fatigue. Future research is warranted to determine what patient-specific, injury/symptom-specific, and treatment-specific variables influence the subjective patient experience.
CONCLUSION
The vast majority of patients desire only 10 to 20 minutes with their doctor and are highly satisfied with the amount of time their surgeon spends with them. Patients reported no significant gender- or ethnicity-based preferences for their doctor. The majority of patients believe that a wait time exceeding 30 minutes is too long. A greater effort needs to be made to educate patients and the public about the significant and effective roles nurse practitioners and physician assistants can play within the healthcare system. While this cohort did not report notable utilization of IPRS reviews, it remains essential to understand what factors influence patients’ subjective experiences with their providers to ensure that patients achieve their desired outcomes, and report as such on these websites as they continue to gain popularity. Diminishing clinic wait times and understanding patient preferences may lead to a greater percentage of “satisfied” patients. While the majority of focus has been and will likely continue to be on improving patients’ satisfaction with their outcomes, more work needs to be done focusing specifically on the process through which outcomes are achieved.
1. Kocher MS, Steadman JR, Briggs K, Zurakowski D, Sterett WI, Hawkins RJ. Determinants of patient satisfaction with outcome after anterior cruciate ligament reconstruction. J Bone Joint Surg Am. 2002;84–A(9):1560-1572.
2. Carr-Hill RA. The measurement of patient satisfaction. J Public Health Med. 1992;14(3):236-249.
3. Ross CK, Steward CA, Sinacore JM. A comparative study of seven measures of patient satisfaction. Med Care. 1995;33(4):392-406. doi:10.1097/00005650-199504000-00006.
4. Strasser S, Aharony L, Greenberger D. The patient satisfaction process: moving toward a comprehensive model. Med Care Rev. 1993;50(2):219-248. doi:10.1177/107755879305000205.
5. Bozic KJ. Orthopaedic healthcare worldwide: shared medical decision making in orthopaedics. Clin Orthop Relat Res. 2013;471(5):1412-1414. doi:10.1007/s11999-013-2838-5.
6. Youm J, Chenok KE, Belkora J, Chiu V, Bozic KJ. The emerging case for shared decision making in orthopaedics. Instr Course Lect. 2013;62:587-594. doi:10.2106/00004623-201210170-00011.
7. Blumenthal D, Abrams M, Nuzum R. The affordable CARE Act at 5 years. N Engl J Med. 2015;373(16):1580. doi:10.1056/NEJMc1510015.
8. Shirley ED, Sanders JO. Patient satisfaction: implications and predictors of success. J Bone Joint Surg Am. 2013;95(10):e69. doi:10.2106/JBJS.L.01048.
9. Morris BJ, Jahangir AA, Sethi MK. Patient satisfaction: an emerging health policy issue. AAOS Now Web site. http://www.aaos.org/AAOSNow/2013/Jun/advocacy/advocacy5/?ssopc=1. Published June 2013. Accessed November 19, 2016.
10. Donabedian A. The quality of care. How can it be assessed? JAMA. 1988;260(12):1743-1748. doi:10.1001/jama.260.12.1743.
11. Bozic KJ, Kaufman D, Chan VC, Caminiti S, Lewis C. Factors that influence provider selection for elective total joint arthroplasty. Clin Orthop Relat Res. 2013;471(6):1865-1872. doi:10.1007/s11999-012-2640-9.
12. Davies AR, Ware JE Jr. Involving consumers in quality of care assessment. Health Aff (Millwood). 1988;7(1):33-48.
13. Black N, Burke L, Forrest CB, et al. Patient-reported outcomes: pathways to better health, better services, and better societies. Qual Life Res. 2016;25(5):1103-1112. doi:10.1007/s11136-015-1168-3.
14. Gilbert A, Sebag-Montefiore D, Davidson S, Velikova G. Use of patient-reported outcomes to measure symptoms and health related quality of life in the clinic. Gynecol Oncol. 2015;136(3):429-439. doi:10.1016/j.ygyno.2014.11.071.
15. Van Der Wees PJ, Nijhuis-Van Der Sanden MW, Ayanian JZ, Black N, Westert GP, Schneider EC. Integrating the use of patient-reported outcomes for both clinical practice and performance measurement: views of experts from 3 countries. Milbank Q. 2014;92(4):754-775. doi:10.1111/1468-0009.12091.
16. Franklin PD, Lewallen D, Bozic K, Hallstrom B, Jiranek W, Ayers DC. Implementation of patient-reported outcome measures in U.S. Total joint replacement registries: rationale, status, and plans. J Bone Joint Surg Am. 2014;96(Suppl 1):104-109. doi:10.2106/JBJS.N.00328.
17. Williams B. Patient satisfaction: a valid concept? Soc Sci Med. 1994;38(4):509-516. doi:10.1016/0277-9536(94)90247-X.
18. Hickson GB, Clayton EW, Entman SS, et al. Obstetricians' prior malpractice experience and patients' satisfaction with care. JAMA. 1994;272(20):1583-1587. doi:10.1001/jama.1994.03520200039032.
19. Larsson BW, Larsson G, Chantereau MW, von Holstein KS. International comparisons of patients' views on quality of care. Int J Health Care Qual Assur Inc Leadersh Health Serv. 2005;18(1):62-73. doi:10.1108/09526860510576974.
20. McLafferty RB, Williams RG, Lambert AD, Dunnington GL. Surgeon communication behaviors that lead patients to not recommend the surgeon to family members or friends: analysis and impact. Surgery. 2006;140(4):616-624. doi:https://doi.org/10.1016/j.surg.2006.06.021.
21. Mira JJ, Tomás O, Virtudes-Pérez M, Nebot C, Rodríguez-Marín J. Predictors of patient satisfaction in surgery. Surgery. 2009;145(5):536-541. doi:10.1016/j.surg.2009.01.012.
22. Patterson BM, Eskildsen SM, Clement RC, et al. Patient satisfaction is associated with time with provider but not clinic wait time among orthopedic patients. Orthopedics. 2017;40(1):43-48. doi:10.3928/01477447-20161013-05.
23. Teunis T, Thornton ER, Jayakumar P, Ring D. Time seeing a hand surgeon is not associated With patient satisfaction. Clin Orthop Relat Res. 2015;473(7):2362-2368. doi:10.1007/s11999-014-4090-z.
24. Burkle CM, Keegan MT. Popularity of internet physician rating sites and their apparent influence on patients' choices of physicians. BMC Health Serv Res. 2015;15:416. doi:10.1186/s12913-015-1099-2.
25. Mohney S, Lee DJ, Elfar JC. The effect of orthopedic advertising and self-promotion on a naive population. Am J Orthop. 2016;45(4):E227-E232.
26. Halawi MJ, Barsoum WK. Direct-to-consumer marketing: implications for patient care and orthopedic education. Am J Orthop. 2016;45(6):E335-E336.
27. Mostaghimi A, Crotty BH, Landon BE. The availability and nature of physician information on the internet. J Gen Intern Med. 2010;25(11):1152-1156. doi:10.1007/s11606-010-1425-7.
ABSTRACT
Patient satisfaction has become a topic of interest within orthopedics as the landscape of provider reimbursement continues to evolve to reward value of care. Online internet physician rating sites are becoming increasingly popular ways for patients to subjectively express their provider experience. Understanding what patients value during their episode of care is important in the modern healthcare environment. The purpose of this study is to determine what preferences, if any, patients have when selecting their physician and how they experience care in an outpatient orthopedic setting. A prospective survey was electronically administered to 212 patients in an adult reconstruction clinic. One hundred ninety-six patients (92.5%) completed the survey. Demographic questions regarding age, sex, ethnicity, and prior adult reconstruction surgical history were obtained. When patients were asked how much time they would like the doctor to spend with them on a routine visit, the most common answer was 10 to 15 minutes (41.3%), with only 10.2% patients desiring >20 minutes. The majority of patients (83.1%) believe ≥30 minutes is too long to wait to see their surgeon. Less than half of patients (41.8%) stated that they would feel as though they were receiving below average care if seen only by a nurse practitioner or physician’s assistant at a postoperative visit. Patients reported no significant age, gender, or ethnicity preferences for their physician. Recommendations from friends or other physicians was the most common (66.4%) way for patients to find their physicians, while 12.2% utilized online rating sites during their search. Optimizing patient experiences in the office may include keeping wait times to <30 minutes and educating patients on the roles of physician extenders. More work needs to be done to further elucidate variables influencing the subjective patient experience with their orthopedic care.
Continue to: Patient satisfaction...
Patient satisfaction has become an important focus in the rapidly changing healthcare environment due to the significant impact it has on healthcare delivery, healthcare economics, assessment of the quality of care, development of patient-care models, and quality improvement initiatives.1-4 Historically, the quality of care was measured by objective metrics such as complication rates, range-of-motion, and the provider’s expert opinion on the outcome. While those metrics are still impactful variables when defining a successful outcome, the medical community is now increasingly recognizing the importance of patients’ perspectives when defining successful treatments. Patient satisfaction is now highly regarded by clinicians and the government when considering outcomes and is even being incorporated into determining the value of care. Under the Affordable Care Act, patients assumed a more active role in clinical decision-making as well as in creating quality and efficiency initiatives.5,6 By 2017, 2% of the United States government’s Medicare payments will be redistributed among hospitals and physicians based on their quality and efficiency metrics, which are largely determined by patients’ evaluations of care.7 As a result, there has been significant interest in identifying variables influencing patient satisfaction and subjective outcomes.8,9
Patient satisfaction is related to both the outcomes of care and the process of care. As first described by Donabedian,10patients may be satisfied with the successful outcome of their care, but dissatisfied with how they received their care. The process of care is complex and considers many aspects of healthcare delivery, including time, cost, healthcare provider interactions, and burdens faced. While patient satisfaction with outcomes and process of care are heavily related, they should be regarded separately. It is essential that providers understand what variables are important to patients with regards to how they experience healthcare and choose their provider, especially surrounding elective procedures such as hip and knee arthroplasty.11,12
Within orthopedic surgery, patient satisfaction scores are beginning to be incorporated as part of the standard-of-care quality metrics obtained along with patient-reported outcome measures (PROMs) at defined time points postoperatively. Furthermore, PROMs and patient satisfaction data are becoming an increasingly important component of medical decision-making.13-16 Several authors have reported that increased patient satisfaction is correlated with increased compliance, improved treatment outcomes across numerous medical settings, including orthopedics, decreased risk of litigation, and higher patient ratings of the quality of care.17,18 Various factors, including meeting of expectations, staff politeness, the communication skills of the surgeon, and waiting times, have been suggested to influence eventual patient satisfaction within the surgical literature.19-21 However, within orthopedic surgery there is a paucity of investigations evaluating how patients determine preferences and satisfaction with the process of care.
The purpose of this study is to determine what preferences, if any, patients have when selecting their physician and how they experience care in an outpatient orthopedic setting. The authors hypothesize that the majority of patients find their physicians through online rating sites or recommendations from family and friends. The authors believe that patients expect to be seen in <30 minutes and will be unsatisfied overall with the amount of time that they spend with their physician.
Continue to: METHODS...
METHODS
The senior author (BRL) and a research team created a 15-question survey to evaluate patient preferences regarding the demographic characteristics (eg, age, gender, ethnicity) of their physician, wait times in a waiting room, time spent with the physician, care received from physician extenders (eg, nurse practitioners, physician assistants), and how they learned of their physician (Appendix). An a priori power analysis was conducted to determine that approximately 200 patients were needed for inclusion.11,22 Following Institutional Review Board approval (ORA 15051104), the survey was administered to 212 patients in a single-surgeon, adult reconstruction clinic. The survey was digitally administered on a touch-screen tablet using an electronic independent third party survey center (SurveyMonkey Inc) devoid of any identifying data. The survey was offered to all patients >21 years of age who were English-speaking and in the common area as patients waiting to be seen, from June 2015 to March 2016. A research assistant approached patients in the waiting room and asked if they would like to participate in a short survey regarding what factors influence the patient-physician relationship from the patient’s perspective.
Appendix 1
- Do you wish to partake in this 3-minute survey?
- Have you had a prior knee or hip replacement?
- What is your age?
- 30-40 years
- 40-50 years
- 50-60 years
- 60-70 years
- 70-80 years
- 80+ years
- What is your gender?
- Which of the following best represents your racial or ethnic heritage?
- African American
- How much time would you like the doctor to spend talking to you on a routine visit?
- 0-5 minutes
- 5-10 minutes
- 10-15 minutes
- 15-20 minutes
- 20-30 minutes
- >30 minutes
- How long is too long to wait to see the doctor?
- 10 minutes
- 20 minutes
- 30 minutes
- 40 minutes
- 50 minutes
- An hour or more
- If you were to only see a physician’s assistant or nurse practitioner at your follow-up visit and not the doctor, would you feel like you were getting below average care?
- Overall I am satisfied with the time the doctor spends with me.
- If you were to need a major surgery, would you want the physician to tell you what he or she would do if they were in your shoes?
- Would you prefer your doctor to be the same race/ethnicity as you?
- No
- No Preference
- Would you feel more comfortable with a male as opposed to a female orthopedic surgeon?
- Would you feel more comfortable with a female as opposed to a male orthopedic surgeon?
- What age would you like your physician to be?
- 25-35 years old
- 35-45 years old
- 45-55 years old
- 55-65 years old
- 65 years and older
- No preference
- How do you usually find your physician?
- Friends’ recommendations
- Healthcare provider’s recommendations
- Insurance plans
- Online research/ratings
- Other
Descriptive statistics were used to analyze subject demographics and survey responses. Chi-square analyses and multinomial logistic regressions were utilized to compare responses. All statistical analyses were conducted using SPSS version 24.0 software (SPSS Inc). Statistical significance was set at P < 0.05.
RESULTS
Of the 212 patients who were invited to participate, 196 patients (92.4%) agreed and completed the survey. Demographic and surgical history information can be found in Table 1. The majority of patients were female (62%) and above the age of 50 years (92.4%). Almost half (48.5%) of patients had a prior hip or knee replacement.
Table 1. Survey Respondent Demographics
| Number | Percent |
Age Range | ||
30-40 years | 4 | 2.0% |
40-50 years | 11 | 5.6% |
50-60 years | 47 | 24.0% |
60-70 years | 84 | 42.9% |
70-80 years | 41 | 20.9% |
>80 years | 9 | 4.6% |
Gender | ||
Male | 74 | 37.8% |
Female | 122 | 62.2% |
Ethnicity | ||
African American | 39 | 19.9% |
Asian | 3 | 1.5% |
Caucasian | 140 | 71.4% |
Hispanic | 10 | 5.1% |
Other | 4 | 2.0% |
Prior knee or hip replacement | ||
Yes | 95 | 48.5% |
No | 55 | 28.1% |
No Response | 46 | 23.5% |
When asked how long is too long to wait to see the doctor, 30 minutes (39.8%) was most commonly selected, followed by 40 minutes (24.5%) (Figure 1). When asked how much time patients would like the doctor to spend with them during an office visit, the majority (68.9%) selected either 10 to 15 minutes (41.3%) or 15 to 20 minutes (27.6%) (Figure 2). The majority of patients (92.3%) were satisfied with the amount of time the doctor spent with them. In addition, 94.9% of respondents would want their doctor to tell them what they would do if they were in the patient’s shoes when making decisions regarding their medical care (Table 2). Less than half of respondents (41.8%) believe that seeing a physician extender (eg, nurse practitioner or physician assistant) at a postoperative visit would result in a lower quality of care (Table 2).
Table 2. Responses to Survey Questions
If you were to only see a physician's assistant or nurse practitioner at your follow-up visit and not the doctor, would you feel like you were getting below average care? | ||
Answer choices | Number | Percent |
No | 114 | 58.2% |
Yes | 82 | 41.8% |
If you were to need a major surgery would you want the physician to tell you what he or she would do if they were in your shoes? | ||
Answer choices | Number | Percent |
No | 10 | 5.1% |
Yes | 186 | 94.9% |
Would you prefer your doctor to be the same race/ethnicity as you? | ||
Answer choices | Number | Percent |
No | 29 | 14.8% |
Yes | 3 | 1.5% |
No Preference | 164 | 83.7% |
When asked if patients preferred a doctor of the same race/ethnicity, the vast majority (83.7%) had no preference (Table 2). There was no significant difference found between male and female respondents when asked if they would feel more comfortable with a male as opposed to a female orthopedic surgeon (P = .118) and vice versa (P = .604) (Table 3). Most patients preferred a physician between the ages of 45 and 55 years (39.3%), followed by 35 and 45 years (23.0%); however, this preference was not statistically significant (Table 4). Older patients were more likely to prefer younger physicians (odds ratio, 4.612 for 25-35 years of age; odds ratio, 1.328 for 35-45 years of age). Only 12.2% of patients reported online research/rating sites as the main resource utilized when selecting their physician (Figure 3). The majority (68.4%) reported that recommendations from either friends (35.2%) or healthcare providers (33.2%) were the main avenues through which they found their physicians.
Table 3. Overall Responses to Questions Regarding Male and Female Orthopedic Surgeonsa
Would you feel more comfortable with a male as opposed to a female orthopedic surgeon? | |||||
Answer choices | Number | Percent | Female responses | Male responses | P value |
No | 164 | 83.7% | 106 (86.9%) | 58 (78.4%) | 0.118 |
Yes | 32 | 16.3% | 16 (13.1%) | 16 (21.6%) |
|
Would you feel more comfortable with a female as opposed to a male orthopedic surgeon? | |||||
Answer choices | Number | Percent | Female responses | Male responses | P value |
No | 186 | 94.9% | 115 (94.3%) | 71 (95.9%) | 0.604 |
Yes | 10 | 5.1% | 7 (5.7%) | 3 (4.1%) |
|
aResponses were broken down by gender and compared utilizing a 2 x 2 chi-square analysis to test for significant differences in respondents’ gender preferences for their orthopedic surgeon.
Table 4. Patient Preferences Regarding Physician Age
What age would you like your physician to be? |
| 95% Confidence Interval | ||||
Answer Choices | Number or Responses | Percent | P value | Exp(β) | Lower Bound | Upper Bound |
25-35 years | 1 | 0.5% | 0.217 | 4.612 | 0.407 | 52.283 |
35-45 years | 45 | 23.0% | 0.161 | 1.328 | 0.893 | 1.975 |
45-55 years | 77 | 39.3% | 0.159 | 1.276 | 0.909 | 1.791 |
55-65 years | 9 | 4.6% | 0.483 | 1.302 | 0.624 | 2.717 |
≥65 years | 2 | 1.0% | 0.272 | 0.491 | 0.138 | 1.748 |
No preferencea | 62 | 31.6% | Reference | |||
aNo preference was used as the reference category for the answer choices, while the age bracket “>80 years” was used as the reference for the age of respondent variable.
Continue to: DISCUSSION...
DISCUSSION
The results of this study demonstrate that patients have several expectations and preferences with regards to the care they receive from physicians in the office. Patients prefer to wait <30 minutes before seeing their provider and desire only 10 to 20 minutes with their doctor. Patients do not have specific preferences with regards to the gender or ethnicity of their physician but would prefer a physician in the middle of their career, aged 45 to 55 years. Ultimately, patients do believe that seeing a physician at a postoperative visit is important, as just under half of patients thought that seeing a physician extender alone at a postoperative visit resulted in a lower quality of care.
While these results were obtained in a population specifically seeking the care of an orthopedic adult reconstruction surgeon, the results demonstrate that patients do not necessarily desire an unreasonable amount of time with their doctor. Patients simply want to be seen in a timely fashion and receive the full undivided attention of their doctor for approximately 20 minutes. Similarly, Patterson and colleagues22 found, in their series of 182 patients who presented to an orthopedic surgeon, that there was a significant correlation between time spent with the surgeon and overall patient satisfaction. Interestingly, the authors reported that patient satisfaction was not correlated with education level, sex, marital status, whether the patients were evaluated by a resident physician before seeing the attending surgeon, self-reported mental status, tobacco usage, the type of clinic visit, or the waiting time to see the surgeon (average, about 40 minutes for this cohort).22 Similarly, Teunis and colleagues23 reported an average 32-minute wait time in 81 patients presenting for care at an orthopedic hand clinic and demonstrated that a longer wait time was associated with decreased patient satisfaction. These results corroborate the findings of this study that a short wait time is important to patients when evaluating the process of care. Additionally, patients do not have unreasonable expectations with regards to the amount of time they would like to spend with the physician. A physician who has a clinic for 9 hours a day would thus be able to see 54 patients and still spend at least 10 minutes with each patient. The quality of the physician-patient interaction is likely more important than the actual amount of time spent; however, based on this study, patients do have certain expectations about how much time physicians should spend with them.
There were no significant sex, age, or ethnicity preferences in our specific patient cohort. However, a sizable percentage of respondents, 41.8%, believed that they were receiving inferior care if they only saw a physician extender at a routine follow-up visit. Many orthopedic surgeons rely on the care provided by physician extenders to enable them to see additional patients. Physician extenders are well trained to provide high-quality care, including at routine postoperative visits. The results of this study, that many patients believe physician extenders provide lower-quality care, may be a result of inadequate patient education regarding the extensive training and education physician extenders undergo. Physician extenders are qualified, licensed healthcare professionals who are playing increasingly important roles within orthopedics and medicine as a whole. As the demand for orthopedic surgeons to see more patients increases, so does the role of physician extenders. Future research is warranted into educating the public regarding the importance of these healthcare providers and the adequacy of their training.
While many practices now routinely obtain patient satisfaction scores, another modality through which patients can express their satisfaction and experiences with healthcare providers is through online internet physician rating sites (IPRS). These sites have exploded in number and popularity in recent years and, according to some studies, have a very real effect on provider selection.24 Interestingly, a low percentage of patients in this study utilized IPRS reviews to find their doctors. In a recent prospective survey study of 1000 consecutive patients presenting for care at the Mayo Clinic, Burkle and Keegan24 reported that 27% of patients would choose not to see a physician based on a negative IPRS review. Interestingly, only 1.0% of patients reported finding their doctor through advertising. Numerous authors have recently addressed advertising in orthopedic surgery, specifically direct-to-consumer marking, including the influence of physician self-promotion on patients.25,26 Specifically, Halawi and Barsoum26 discussed how direct-to-consumer marketing is commonly disseminated to the public through television and print advertisements, which are modalities more commonly utilized by older generations. However, many advertising agencies are moving toward internet-based advertising, especially through orthopedic group and individual surgeon websites for self-promoting advertisement, as approximately 75% of Americans use the internet for health-related information.25,27 The fact that many patients in this study did not utilize IPRS reviews or advertising (much of which is electronic) may be a result of the older, less internet-centric demographic that is often seen in an adult reconstruction clinic. Future research is warranted to determine what demographic of patients value IPRS reviews and how those reviews influence physician selection and the patient experience.
There are several limitations to this study. First, the majority of the surveyed population was Caucasian, and our results may not be equally reflective of diverse ethnic backgrounds. Second, the cohort size, while based on previous studies conducted in a similar fashion, may be underpowered to detect significant differences for 1 or more of these questions. In addition, having a question regarding the patient’s medical background or experiences may have provided further insight as to why patients selected the answers that they did. Furthermore, questions regarding the patient’s education level, religious background, and income brackets may have provided further context in which to evaluate their responses. These questions were omitted in an effort to keep the questionnaire at a length that would maximize enrollment and prevent survey fatigue. Future research is warranted to determine what patient-specific, injury/symptom-specific, and treatment-specific variables influence the subjective patient experience.
CONCLUSION
The vast majority of patients desire only 10 to 20 minutes with their doctor and are highly satisfied with the amount of time their surgeon spends with them. Patients reported no significant gender- or ethnicity-based preferences for their doctor. The majority of patients believe that a wait time exceeding 30 minutes is too long. A greater effort needs to be made to educate patients and the public about the significant and effective roles nurse practitioners and physician assistants can play within the healthcare system. While this cohort did not report notable utilization of IPRS reviews, it remains essential to understand what factors influence patients’ subjective experiences with their providers to ensure that patients achieve their desired outcomes, and report as such on these websites as they continue to gain popularity. Diminishing clinic wait times and understanding patient preferences may lead to a greater percentage of “satisfied” patients. While the majority of focus has been and will likely continue to be on improving patients’ satisfaction with their outcomes, more work needs to be done focusing specifically on the process through which outcomes are achieved.
1. Kocher MS, Steadman JR, Briggs K, Zurakowski D, Sterett WI, Hawkins RJ. Determinants of patient satisfaction with outcome after anterior cruciate ligament reconstruction. J Bone Joint Surg Am. 2002;84–A(9):1560-1572.
2. Carr-Hill RA. The measurement of patient satisfaction. J Public Health Med. 1992;14(3):236-249.
3. Ross CK, Steward CA, Sinacore JM. A comparative study of seven measures of patient satisfaction. Med Care. 1995;33(4):392-406. doi:10.1097/00005650-199504000-00006.
4. Strasser S, Aharony L, Greenberger D. The patient satisfaction process: moving toward a comprehensive model. Med Care Rev. 1993;50(2):219-248. doi:10.1177/107755879305000205.
5. Bozic KJ. Orthopaedic healthcare worldwide: shared medical decision making in orthopaedics. Clin Orthop Relat Res. 2013;471(5):1412-1414. doi:10.1007/s11999-013-2838-5.
6. Youm J, Chenok KE, Belkora J, Chiu V, Bozic KJ. The emerging case for shared decision making in orthopaedics. Instr Course Lect. 2013;62:587-594. doi:10.2106/00004623-201210170-00011.
7. Blumenthal D, Abrams M, Nuzum R. The affordable CARE Act at 5 years. N Engl J Med. 2015;373(16):1580. doi:10.1056/NEJMc1510015.
8. Shirley ED, Sanders JO. Patient satisfaction: implications and predictors of success. J Bone Joint Surg Am. 2013;95(10):e69. doi:10.2106/JBJS.L.01048.
9. Morris BJ, Jahangir AA, Sethi MK. Patient satisfaction: an emerging health policy issue. AAOS Now Web site. http://www.aaos.org/AAOSNow/2013/Jun/advocacy/advocacy5/?ssopc=1. Published June 2013. Accessed November 19, 2016.
10. Donabedian A. The quality of care. How can it be assessed? JAMA. 1988;260(12):1743-1748. doi:10.1001/jama.260.12.1743.
11. Bozic KJ, Kaufman D, Chan VC, Caminiti S, Lewis C. Factors that influence provider selection for elective total joint arthroplasty. Clin Orthop Relat Res. 2013;471(6):1865-1872. doi:10.1007/s11999-012-2640-9.
12. Davies AR, Ware JE Jr. Involving consumers in quality of care assessment. Health Aff (Millwood). 1988;7(1):33-48.
13. Black N, Burke L, Forrest CB, et al. Patient-reported outcomes: pathways to better health, better services, and better societies. Qual Life Res. 2016;25(5):1103-1112. doi:10.1007/s11136-015-1168-3.
14. Gilbert A, Sebag-Montefiore D, Davidson S, Velikova G. Use of patient-reported outcomes to measure symptoms and health related quality of life in the clinic. Gynecol Oncol. 2015;136(3):429-439. doi:10.1016/j.ygyno.2014.11.071.
15. Van Der Wees PJ, Nijhuis-Van Der Sanden MW, Ayanian JZ, Black N, Westert GP, Schneider EC. Integrating the use of patient-reported outcomes for both clinical practice and performance measurement: views of experts from 3 countries. Milbank Q. 2014;92(4):754-775. doi:10.1111/1468-0009.12091.
16. Franklin PD, Lewallen D, Bozic K, Hallstrom B, Jiranek W, Ayers DC. Implementation of patient-reported outcome measures in U.S. Total joint replacement registries: rationale, status, and plans. J Bone Joint Surg Am. 2014;96(Suppl 1):104-109. doi:10.2106/JBJS.N.00328.
17. Williams B. Patient satisfaction: a valid concept? Soc Sci Med. 1994;38(4):509-516. doi:10.1016/0277-9536(94)90247-X.
18. Hickson GB, Clayton EW, Entman SS, et al. Obstetricians' prior malpractice experience and patients' satisfaction with care. JAMA. 1994;272(20):1583-1587. doi:10.1001/jama.1994.03520200039032.
19. Larsson BW, Larsson G, Chantereau MW, von Holstein KS. International comparisons of patients' views on quality of care. Int J Health Care Qual Assur Inc Leadersh Health Serv. 2005;18(1):62-73. doi:10.1108/09526860510576974.
20. McLafferty RB, Williams RG, Lambert AD, Dunnington GL. Surgeon communication behaviors that lead patients to not recommend the surgeon to family members or friends: analysis and impact. Surgery. 2006;140(4):616-624. doi:https://doi.org/10.1016/j.surg.2006.06.021.
21. Mira JJ, Tomás O, Virtudes-Pérez M, Nebot C, Rodríguez-Marín J. Predictors of patient satisfaction in surgery. Surgery. 2009;145(5):536-541. doi:10.1016/j.surg.2009.01.012.
22. Patterson BM, Eskildsen SM, Clement RC, et al. Patient satisfaction is associated with time with provider but not clinic wait time among orthopedic patients. Orthopedics. 2017;40(1):43-48. doi:10.3928/01477447-20161013-05.
23. Teunis T, Thornton ER, Jayakumar P, Ring D. Time seeing a hand surgeon is not associated With patient satisfaction. Clin Orthop Relat Res. 2015;473(7):2362-2368. doi:10.1007/s11999-014-4090-z.
24. Burkle CM, Keegan MT. Popularity of internet physician rating sites and their apparent influence on patients' choices of physicians. BMC Health Serv Res. 2015;15:416. doi:10.1186/s12913-015-1099-2.
25. Mohney S, Lee DJ, Elfar JC. The effect of orthopedic advertising and self-promotion on a naive population. Am J Orthop. 2016;45(4):E227-E232.
26. Halawi MJ, Barsoum WK. Direct-to-consumer marketing: implications for patient care and orthopedic education. Am J Orthop. 2016;45(6):E335-E336.
27. Mostaghimi A, Crotty BH, Landon BE. The availability and nature of physician information on the internet. J Gen Intern Med. 2010;25(11):1152-1156. doi:10.1007/s11606-010-1425-7.
TAKE-HOME POINTS
- The vast majority of patients desire only 10 to 20 minutes with their doctor and are highly satisfied with the amount of time their surgeon spends with them.
- Patients reported no significant gender- or ethnicity-based preferences for their doctor.
- The majority of patients believe that a wait time exceeding 30 minutes is too long.
- Nearly 42% of respondents felt they would be receiving below average medical care if seen only by a nurse practitioner or physician’s assistant at a postoperative appointment.
- Recommendations from friends is the most common way patients find their physicians.
Medical Complications and Outcomes After Total Shoulder Arthroplasty: A Nationwide Analysis
ABSTRACT
There is a paucity of evidence describing the types and rates of postoperative complications following total shoulder arthroplasty (TSA). We sought to analyze the complications following TSA and determine their effects on described outcome measures.
Using discharge data from the weighted Nationwide Inpatient Sample from 2006 to 2010, patients who underwent primary TSA were identified. The prevalence of specific complications was identified using the International Classification of Diseases, 9th Revision, Clinical Modification (ICD-9-CM) codes. The data from this database represent events occurring during admission, prior to discharge. The associations between patient characteristics, complications, and outcomes of TSA were evaluated. The specific outcomes analyzed in this study were mortality and length of stay (LOS).
A total of 125,766 patients were identified. The rate of complication after TSA was 6.7% (8457 patients). The most frequent complications were respiratory, renal, and cardiac, occurring in 2.9%, 0.8%, and 0.8% of cases, respectively. Increasing age and total number of preoperative comorbidities significantly increased the likelihood of having a complication. The prevalence of postoperative shock and central nervous system, cardiac, vascular, and respiratory complications was significantly higher in patients who suffered postoperative mortality (88 patients; 0.07% mortality rate) than in those who survived surgery (P < 0.0001). In terms of LOS, shock and infectious and vascular complications most significantly increased the length of hospitalization.
Postoperative complications following TSA are not uncommon and occur in >6% of patients. Older patients and certain comorbidities are associated with complications after surgery. These complications are associated with postoperative mortality and increased LOS.
Continue to: Total shoulder arthroplasty...
Total shoulder arthroplasty (TSA) provides a predictably high level of satisfaction with survival as high as 92% at 15 years.1 As implant instrumentation and surgical technique and understanding have improved, the frequency of TSAs being performed has also increased.2 Although there are enough data on long-term surgical complications following TSA,1,3-6 there is a paucity of evidence delineating the incidence and types of postoperative complications during hospitalization. Several current issues motivate the improved understanding of TSA, including the increasing number of TSAs being performed, the desire to improve quality of care, and the desire to create financially efficient healthcare.
The purpose of this study is to detail the postoperative complications that occur following TSA using a large national database. Specifically, our goals are to determine the incidence and types of complications after shoulder arthroplasty, determine the patient factors that are associated with these complications, and evaluate the effects of these complications on postoperative in-hospital mortality and length of stay (LOS). Our hypothesis is that there would be a correlation between specific patient factors and complications and that these complications would adversely correlate to patient postoperative outcomes.
METHODS
DESIGN
We conducted a retrospective analysis of TSAs captured by the Nationwide Inpatient Sample (NIS) database between 2006 and 2010. The NIS is the largest all-payer inpatient database that is currently available to the public in the United States.7
The NIS is a part of the Healthcare Cost and Utilization Project funded by the Agency for Healthcare Research and Quality (AHRQ) and the US Department of Health and Human Services. The NIS database is designed to approximate a 20% sample of US hospitals and the patients they serve, including community, academic, general, and specialty-specific hospitals such as orthopedic hospitals.7 The 2010 update of the NIS database contains discharge data from 1051 hospitals across 45 states, with a representative sample of >39 million inpatient hospital stays.7 The NIS database and its data sources have been independently validated and assessed for quality each year since 1988.8Furthermore, comparative analysis of multiple database elements and distributions has been validated against standard norms, including the National Hospital Discharge Survey.9 The NIS database has been used in numerous published studies.2,10,11
PATIENT SELECTION
The yearly NIS databases from 2006 to 2010 were compiled. Patients aged ≥40 years who underwent a TSA were identified using the International Classification of Diseases, 9th Revision (ICD-9), procedural code 81.80. Exclusion criteria were patients with a primary or a secondary diagnosis of humeral or scapular fracture, chronic osteomyelitis, rheumatologic diseases, or evidence of concurrent malignancy (Figure 1).
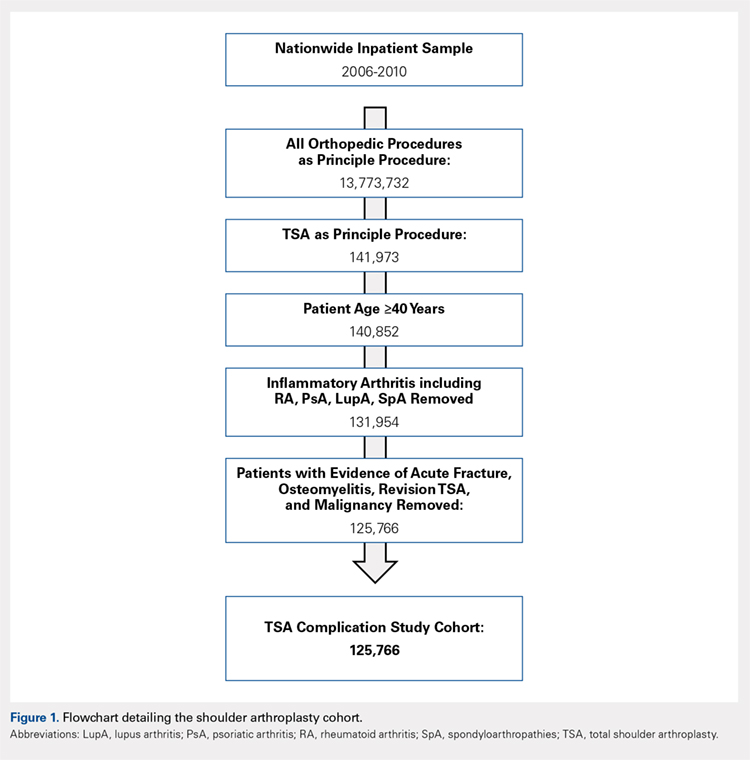
Native to NIS are patient demographics, including age, sex, and race. Patient comorbidities as described by Elixhauser and colleagues12 are also included in the database.
Continue to: OUTCOMES...
OUTCOMES
The primary outcome of this study was a description of the type and frequency of postoperative complications of TSA. To conduct this analysis, we queried the TSA cohort for specific ICD-9 codes representing acute cardiac, central nervous system, infectious, gastrointestinal, genitourinary, postoperative shock, renal, respiratory, surgical, vascular, and wound complications. The ICD-9 codes used to identify complications were modeled according to previous literature on various surgical applications and were further parsed to reflect only acute postoperative diagnoses13-15(see the Appendix for the comprehensive list of ICD-9 codes).
Two additional outcomes were analyzed, including postoperative mortality and LOS. Postoperative mortality was defined as death occurring prior to discharge. We calculated the average LOS among the complication and the noncomplication cohort.
STATISTICAL ANALYSIS
Patient demographics and target outcomes of the study were analyzed by frequency distribution. Where applicable, the chi-square and the Student’s t tests were used to confirm the statistical difference for dichotomous and continuous variables, respectively. Multivariate regressions were performed after controlling for possible clustering of the data using a generalized estimating equation following a previous analytical methodology.16-20 The results are reported with odds ratios and 95% confidence intervals where applicable, all statistical tests with P ≤ 0.05 were considered to be significant, and all statistical tests were two-sided. We conducted all analyses using SAS, version 9.2 (SAS Institute).
RESULTS
From 2006 to 2010, a weighted sample of 141,973 patients was found to undergo a TSA. After applying our inclusion and exclusion criteria, our study cohort consisted of 125,766 patients (Figure 1).
Continue to: OVERALL TSA COHORT DEMOGRAPHICS...
OVERALL TSA COHORT DEMOGRAPHICS
The average age of the TSA cohort was 69.4 years (standard deviation [SD], 21.20), and 54.1% were females. The cohort had significant comorbidities, with 83.3% of them having at least 1 comorbidity at the time of surgery. Specifically, 31.3% of the patients had 1 comorbidity, 26.5% had 2 comorbidities, and 25.4% had ≥3 comorbidities. Hypertension was the most common comorbidity present in 66.2% of patients, and diabetes was the second most common comorbidity with a prevalence of 16.8%.
COMPLICATION COHORT DEMOGRAPHICS
An overall postoperative complication rate of 6.7% (weighted sample of 8457 patients) was noted in the overall TSA cohort. The TSA cohort was dichotomized into patients who suffered at least 1 complication (weighted, n = 8457) and patients undergoing routine TSAs (weighted, n = 117,308). The average age was significantly higher in the complication vs routine cohort (71.38 vs 69.27 years, P < 0.0001). Similarly, there were significantly more comorbidities (2.51 vs 1.71, P < 0.0001) in the complication cohort.
COMPLICATIONS
We noted a complication rate of 6.7% (weighted sample of 8457 patients). A single complication was noted in 5% of these patients, whereas 1.3% and 0.4% of the patients had 2 and ≥3 complications, respectively. Respiratory abnormalities (2.9%), acute renal failure (0.8%), and cardiac complications (0.8%) were the most prevalent complications after TSA. The list of complications is detailed in Figure 2. Logistic regression analysis of patient characteristics predicting complications showed that advanced age (odds ratio [OR], 2.1 in those aged ≥85 years) and increasing number of comorbidities (≥3; OR, 3.5) were most significant in predicting complications (all P < 0.0001) (Figure 3). Despite the ubiquity of hypertension in this patient population, it was not a significant predictor of complication (OR, 0.9); in contrast, pulmonary disorders (OR, 5.1) and fluid and electrolyte disorders (4.0) were most strongly associated with the development of a postoperative complication after surgery (Figure 4).
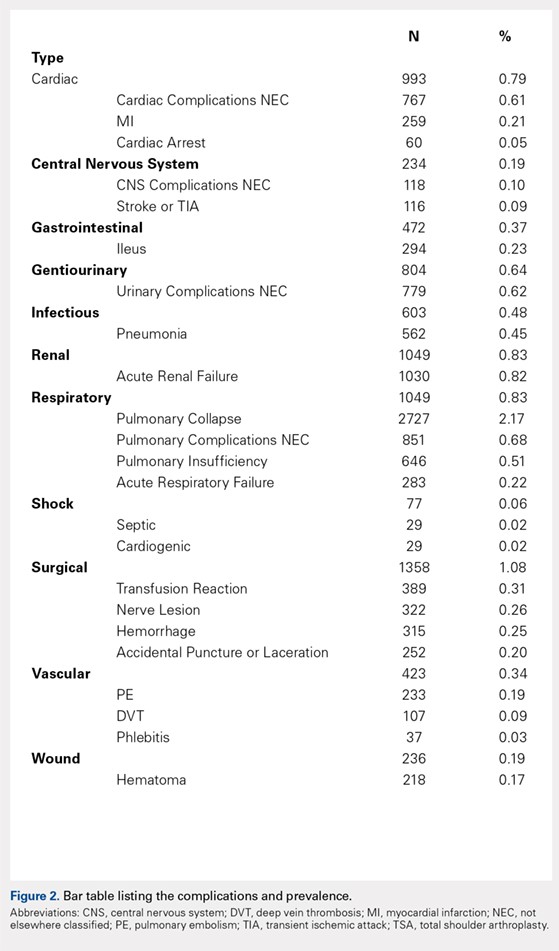
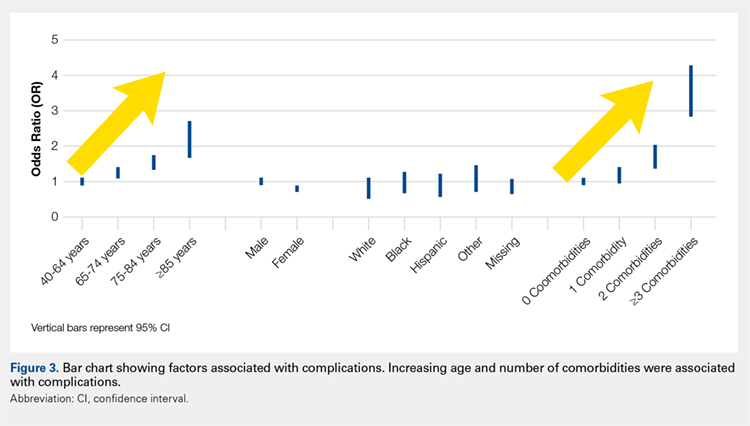
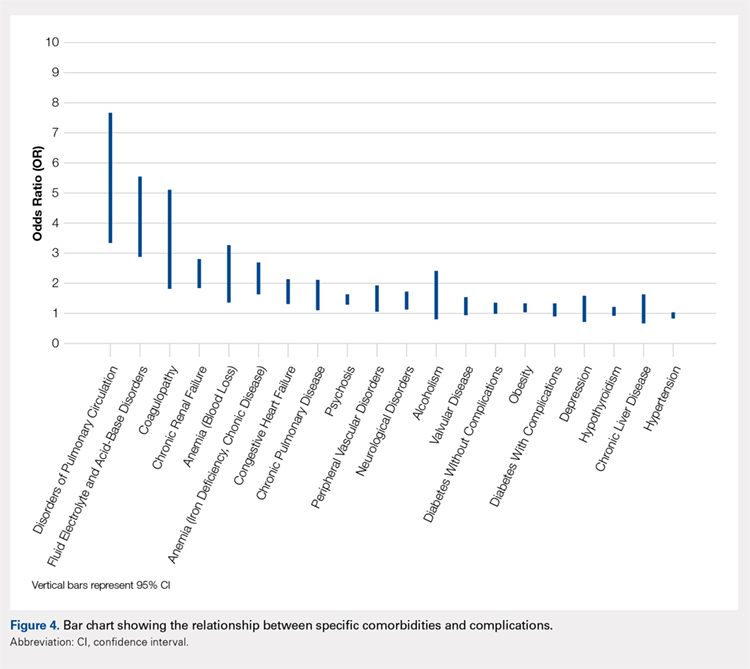
EFFECT OF COMPLICATIONS ON LOS
The average length of hospitalization was 2.3 days (95% confidence interval, 2.22-2.25) among the entire cohort. The average LOS was longer in the complication cohort (3.9 days) than in patients who did not have a complication (2.1 days, P < 0.0001). Of the specific complications noted, hemodynamic shock (11.8 days); infectious, most commonly pneumonia (7.6 days); and vascular complications (6.9 days) were associated with the longest hospitalizations. This result is summarized in Figure 5.
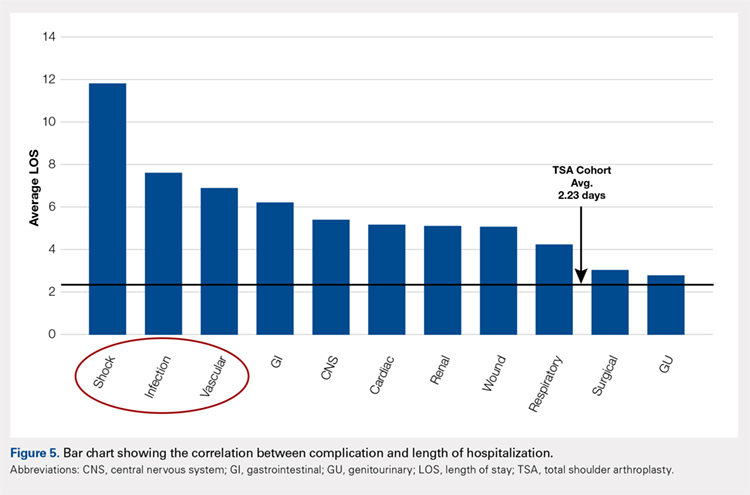
MORTALITY
An overall postoperative (in-house) mortality rate of 0.07% was noted (weighted, n = 88). Comparison between the patient cohort that died vs those who survived TSA resulted in significant differences in the rates of complications. Complications that were most significantly different between the cohorts included cardiac (60.47% vs 0.75%, P < 0.0001), postoperative shock (26.61% vs 0.04%, P < 0.0001), and respiratory complications (43.1% vs 2.8%, P < 0.0001). It is important to note that the overall rate of postoperative shock was exceedingly low in the TSA cohort, but it was highly prevalent in the mortality cohort, occurring in 26.61% of patients. A summary of the mortality statistics is presented in Figure 6.
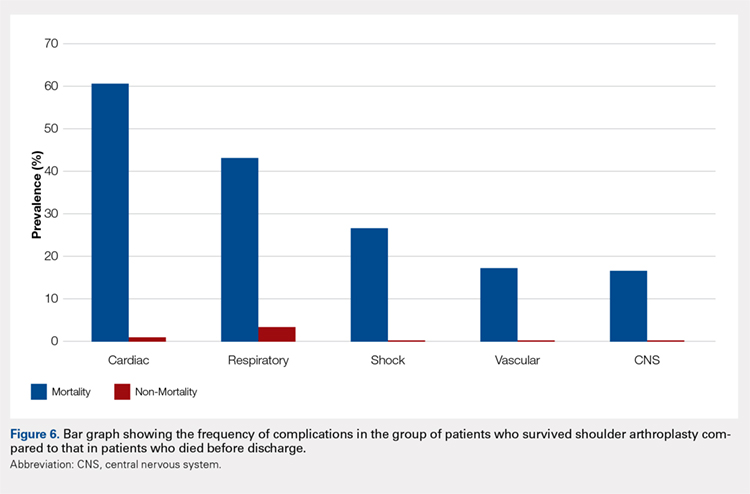
Continue to: DISCUSSION...
DISCUSSION
TSA continues to be associated with high levels of satisfaction;1 as a result, its incidence is increasing.2 As our understanding and efficiency improves nationally, it is imperative that we determine the short-term and longer-term outcomes and complications. In addition, the factors that may affect prognosis must be elucidated to provide a more individualized and effective standard of care. To date, most of the outcome studies of TSA have evaluated long-term outcomes and specific implant-related complications.1,5,6,21,22 Our intent was to evaluate the complications that occur in the postoperative period and their effect on unique “patient care” outcomes. With knowledge of these complications and the predisposing factors, we can better assess patients, risk-stratify, and provide appropriate guidelines.
We noted that complications occurring after TSA are not uncommon, with >6% of patients suffering a postoperative complication. In this study, the number of complications noted was associated with worse patient outcomes. In addition, we noted that patients undergoing a TSA have a significant burden of comorbidities; however, hematologic and fluid disorders (eg, iron deficiency anemia, pulmonary circulatory disorders, and fluid imbalances) were most important in predicting postoperative complications.
Increased LOS in the hospital after TSA was associated with the occurrence of complications. Of all noted complications, shock and infectious and vascular complications led to the longest hospitalizations. Hospital-acquired pneumonia was the most common infectious etiology, while pulmonary embolism and deep vein thrombosis were the most consistent vascular complications. Although seldom studied in the TSA population, a similar finding has been noted in patients after THA. O’Malley and colleagues,23 using the American College of Surgeon’s National Surgical Quality Improvement Program database, identified independent factors that were associated with complications and average prolonged LOS. They noted that the occurrence of major complications was associated with a prolonged LOS. Some, but not all the major complications, included organ space infection, cardiac events, pneumonia, and venous thromboembolic events.23 Therefore, attempts to limit the amount of time spent in hospitals and control the associated costs must focus on managing the incidence of complications.
Postoperative mortality after TSA was uncommon, occurring in 0.07% of the patients in this study. The low incidence of mortality noted in this study is probably related to the fact that our data represent mortality, whereas in the hospital and, unlike most mortality studies, it does not account for patient demise that may occur in the months after surgery. Other reports have noted that mortality occurs in <1.5% of these patients.24-28 Singh and colleagues25 observed in their evaluation of perioperative mortality after TSA a mortality rate of 0.8% with 90 days after 4380 shoulder replacements performed at their institution. Using multivariate analysis, they were able to identify associations between mortality and increasing American Society of Anesthesiology (ASA) class and Charlson Comorbidity Index. These results in relation to ours would indicate that the majority of patients who die after shoulder arthroplasty do so after initial discharge. Although we could not determine a causal relationship between mortality and patient comorbidities, we noted that certain complications strongly correlated with mortality. In patients who died, there was a relatively high incidence of cardiac (60.5%) and respiratory (43.1%) complications. Similarly, although postoperative shock was almost nonexistent in the patients who survived surgery (0.04%), it was much more common in the patients who suffered mortality (26.6%).
This study is not without limitations. Data were extracted from a national database, therefore precluding the inclusion of specific details of surgery and functional assessment. Inherent to ICD-9 coding, we were unable to assess the exact detail and severity of complications. For instance, we cannot be certain what criteria were used to define “acute renal failure” for each patient. This study is retrospective in nature and therefore adequate randomization and standardization of patients is not possible. Similarly, the nature of the database may not allow for exacting our inclusion and exclusion criteria. However, the large sample size of the patient population lessens the chance of potential biases and type 2 errors. Prior to October 2010, reverse shoulder arthroplasty was coded under the ICD-9procedural code 81.80 as TSA. Therefore, there is some overlap between TSA and reverse shoulder arthroplasty in our data. Reverse shoulder arthroplasty is now coded under ICD-9 procedural code 81.88. It is possible that results may differ if reverse shoulder arthroplasty were excluded from our patient cohort. This can be an area of future research.
CONCLUSION
Although much is known about the long-term hardware and functional complications after TSA, in this study, we have attempted to broaden the understanding of perioperative complications and the associated sequelae. Complications are common after TSA surgery and are related to adverse outcomes. In the setting of healthcare changes, the surgeon and the patient must understand the cause, types, incidence, and outcomes of medical and surgical complications after surgery. This allows for more accurate “standard of care” metrics. Further large-volume multicenter studies are needed to gain further insight into the short- and long-term outcomes of TSA.
1. Fox TJ, Cil A, Sperling JW, Sanchez-Sotelo J, Schleck CD, Cofield RH. Survival of the glenoid component in shoulder arthroplasty. J Shoulder Elbow Surg. 2009;18(6):859-863. doi:10.1016/j.jse.2008.11.020.
2. Kim SH, Wise BL, Zhang Y, Szabo RM. Increasing incidence of shoulder arthroplasty in the United States. J Bone Joint Surg Am. 2011;93(24):2249-2254. doi:10.2106/JBJS.J.01994.
3. Ahmadi S, Lawrence TM, Sahota S, et al. The incidence and risk factors for blood transfusion in revision shoulder arthroplasty: our institution's experience and review of the literature. J Shoulder Elbow Surg. 2014;23(1):43–48. doi:10.1016/j.jse.2013.03.010.
4. Boyd AD Jr, Aliabadi P, Thornhill TS. Postoperative proximal migration in total shoulder arthroplasty. Incidence and significance. J Arthroplasty. 1991;6(1):31-37. doi:10.1016/S0883-5403(06)80154-3.
5. Choi T, Horodyski M, Struk AM, Sahajpal DT, Wright TW. Incidence of early radiolucent lines after glenoid component insertion for total shoulder arthroplasty: a radiographic study comparing pressurized and unpressurized cementing techniques. J Shoulder Elbow Surg. 2013;22(3):403-408. doi:10.1016/j.jse.2012.05.041.
6. Favard L, Katz D, Colmar M, Benkalfate T, Thomazeau H, Emily S. Total shoulder arthroplasty - arthroplasty for glenohumeral arthropathies: results and complications after a minimum follow-up of 8 years according to the type of arthroplasty and etiology. Orthop Traumatol Surg Res. 2012;98(4 Suppl):S41-S47. doi:10.1016/j.otsr.2012.04.003.
7. Agency for Healthcare Research and Quality. Introduction to the HCUP national inpatient sample (NIS) 2012. https://hcup-us.ahrq.gov/db/nation/nis/NISIntroduction2012.pdf 2012. Accessed June 9, 2013.
8. Agency for Healthcare Research and Quality. HCUP quality control procedures. https://hcup-us.ahrq.gov/db/quality.pdf. Accessed June 15, 2013.
9. Agency for Healthcare Research and Quality. Comparative analysis of HCUP and NHDS inpatient discharge data: technical supplement 13. https://archive.ahrq.gov/research/data/hcup/nhds/niscomp.html. Accessed June 15, 2013.
10. Rajaee SS, Trofa D, Matzkin E, Smith E. National trends in primary total hip arthroplasty in extremely young patients: a focus on bearing surface usage. J Arthroplasty. 2012;27(10):1870-1878. doi:10.1016/j.arth.2012.04.006.
11. Bozic KJ, Kurtz S, Lau E, et al. The epidemiology of bearing surface usage in total hip arthroplasty in the United States. J Bone Joint Surg Am. 2009;91(7):1614-1620. doi:10.2106/JBJS.H.01220.
12. Elixhauser A, Steiner C, Harris DR, Coffey RM. Comorbidity measures for use with administrative data. Med Care. 1998;36(1):8-27. doi:10.1097/00005650-199801000-00004.
13. Cahill KS, Chi JH, Day A, Claus EB. Prevalence, complications, and hospital charges associated with use of bone-morphogenetic proteins in spinal fusion procedures. JAMA. 2009;302(1):58-66. doi:10.1001/jama.2009.956.
14. Lin CA, Kuo AC, Takemoto S. Comorbidities and perioperative complications in HIV-positive patients undergoing primary total hip and knee arthroplasty. J Bone Joint Surg Am. 2013;95(11):1028-1036. doi:10.2106/JBJS.L.00269.
15. Rasouli MR, Maltenfort MG, Ross D, Hozack WJ, Memtsoudis SG, Parvizi J. Perioperative morbidity and mortality following bilateral total hip arthroplasty. J Arthroplasty. 2014;29(1):142-148. doi:10.1016/j.arth.2013.04.001.
16. Begg CB, Riedel ER, Bach PB, et al. Variations in morbidity after radical prostatectomy. N Engl J Med. 2002;346(15):1138-1144. doi:10.1056/NEJMsa011788.
17. Hu JC, Gold KF, Pashos CL, Mehta SS, Litwin MS. Temporal trends in radical prostatectomy complications from 1991 to 1998. J Urol. 2003;169(4):1443-1448. doi:10.1097/01.ju.0000056046.16588.e4.
18. Abdollah F, Sun M, Schmitges J, et al. Surgical caseload is an important determinant of continent urinary diversion rate at radical cystectomy: a population-based study. Ann Surg Oncol. 2011;18(9):2680-2687. doi:10.1245/s10434-011-1618-2.
19. Panageas KS, Schrag D, Riedel E, Bach PB, Begg CB. The effect of clustering of outcomes on the association of procedure volume and surgical outcomes. Ann Intern Med. 2003;139(8):658-665. doi:10.7326/0003-4819-139-8-200310210-00009.
20. Joice GA, Deibert CM, Kates M, Spencer BA, McKiernan JM. "Never events”: centers for Medicare and Medicaid Services complications after radical cystectomy. Urology. 2013;81(3):527-532. doi:10.1016/j.urology.2012.09.050.
21. Taunton MJ, McIntosh AL, Sperling JW, Cofield RH. Total shoulder arthroplasty with a metal-backed, bone-ingrowth glenoid component. Medium to long-term results. J Bone Joint Surg Am. 2008;90(10):2180-2188. doi:10.2106/JBJS.G.00966.
22. Raiss P, Schmitt M, Bruckner T, et al. Results of cemented total shoulder replacement with a minimum follow-up of ten years. J Bone Joint Surg Am. 2012;94(23):e1711-e1710. doi:10.2106/JBJS.K.00580.
23. O'Malley NT, Fleming FJ, Gunzler DD, Messing SP, Kates SL. Factors independently associated with complications and length of stay after hip arthroplasty: analysis of the National Surgical Quality Improvement Program. J Arthroplasty. 2012;27(10):1832-1837. doi:10.1016/j.arth.2012.04.025.
24. White CB, Sperling JW, Cofield RH, Rowland CM. Ninety-day mortality after shoulder arthroplasty. J Arthroplasty. 2003;18(7):886-888. doi:10.1016/S0883-5403(03)00269-9.
25. Singh JA, Sperling JW, Cofield RH. Ninety day mortality and its predictors after primary shoulder arthroplasty: an analysis of 4,019 patients from 1976-2008. BMC Musculoskelet Disord. 2011;12:231. doi:10.1186/1471-2474-12-231.
26. Fehringer EV, Mikuls TR, Michaud KD, Henderson WG, O'Dell JR. Shoulder arthroplasties have fewer complications than hip or knee arthroplasties in US veterans. Clin Orthop Relat Res. 2010;468(3):717-722. doi:10.1007/s11999-009-0996-2.
27. Farmer KW, Hammond JW, Queale WS, Keyurapan E, McFarland EG. Shoulder arthroplasty versus hip and knee arthroplasties: a comparison of outcomes. Clin Orthop Relat Res. 2007;455:183-189. doi:10.1097/01.blo.0000238839.26423.8d.
28. Farng E, Zingmond D, Krenek L, Soohoo NF. Factors predicting complication rates after primary shoulder arthroplasty. J Shoulder Elbow Surg. 2011;20(4):557-563. doi:10.1016/j.jse.2010.11.005.
ABSTRACT
There is a paucity of evidence describing the types and rates of postoperative complications following total shoulder arthroplasty (TSA). We sought to analyze the complications following TSA and determine their effects on described outcome measures.
Using discharge data from the weighted Nationwide Inpatient Sample from 2006 to 2010, patients who underwent primary TSA were identified. The prevalence of specific complications was identified using the International Classification of Diseases, 9th Revision, Clinical Modification (ICD-9-CM) codes. The data from this database represent events occurring during admission, prior to discharge. The associations between patient characteristics, complications, and outcomes of TSA were evaluated. The specific outcomes analyzed in this study were mortality and length of stay (LOS).
A total of 125,766 patients were identified. The rate of complication after TSA was 6.7% (8457 patients). The most frequent complications were respiratory, renal, and cardiac, occurring in 2.9%, 0.8%, and 0.8% of cases, respectively. Increasing age and total number of preoperative comorbidities significantly increased the likelihood of having a complication. The prevalence of postoperative shock and central nervous system, cardiac, vascular, and respiratory complications was significantly higher in patients who suffered postoperative mortality (88 patients; 0.07% mortality rate) than in those who survived surgery (P < 0.0001). In terms of LOS, shock and infectious and vascular complications most significantly increased the length of hospitalization.
Postoperative complications following TSA are not uncommon and occur in >6% of patients. Older patients and certain comorbidities are associated with complications after surgery. These complications are associated with postoperative mortality and increased LOS.
Continue to: Total shoulder arthroplasty...
Total shoulder arthroplasty (TSA) provides a predictably high level of satisfaction with survival as high as 92% at 15 years.1 As implant instrumentation and surgical technique and understanding have improved, the frequency of TSAs being performed has also increased.2 Although there are enough data on long-term surgical complications following TSA,1,3-6 there is a paucity of evidence delineating the incidence and types of postoperative complications during hospitalization. Several current issues motivate the improved understanding of TSA, including the increasing number of TSAs being performed, the desire to improve quality of care, and the desire to create financially efficient healthcare.
The purpose of this study is to detail the postoperative complications that occur following TSA using a large national database. Specifically, our goals are to determine the incidence and types of complications after shoulder arthroplasty, determine the patient factors that are associated with these complications, and evaluate the effects of these complications on postoperative in-hospital mortality and length of stay (LOS). Our hypothesis is that there would be a correlation between specific patient factors and complications and that these complications would adversely correlate to patient postoperative outcomes.
METHODS
DESIGN
We conducted a retrospective analysis of TSAs captured by the Nationwide Inpatient Sample (NIS) database between 2006 and 2010. The NIS is the largest all-payer inpatient database that is currently available to the public in the United States.7
The NIS is a part of the Healthcare Cost and Utilization Project funded by the Agency for Healthcare Research and Quality (AHRQ) and the US Department of Health and Human Services. The NIS database is designed to approximate a 20% sample of US hospitals and the patients they serve, including community, academic, general, and specialty-specific hospitals such as orthopedic hospitals.7 The 2010 update of the NIS database contains discharge data from 1051 hospitals across 45 states, with a representative sample of >39 million inpatient hospital stays.7 The NIS database and its data sources have been independently validated and assessed for quality each year since 1988.8Furthermore, comparative analysis of multiple database elements and distributions has been validated against standard norms, including the National Hospital Discharge Survey.9 The NIS database has been used in numerous published studies.2,10,11
PATIENT SELECTION
The yearly NIS databases from 2006 to 2010 were compiled. Patients aged ≥40 years who underwent a TSA were identified using the International Classification of Diseases, 9th Revision (ICD-9), procedural code 81.80. Exclusion criteria were patients with a primary or a secondary diagnosis of humeral or scapular fracture, chronic osteomyelitis, rheumatologic diseases, or evidence of concurrent malignancy (Figure 1).
Native to NIS are patient demographics, including age, sex, and race. Patient comorbidities as described by Elixhauser and colleagues12 are also included in the database.
Continue to: OUTCOMES...
OUTCOMES
The primary outcome of this study was a description of the type and frequency of postoperative complications of TSA. To conduct this analysis, we queried the TSA cohort for specific ICD-9 codes representing acute cardiac, central nervous system, infectious, gastrointestinal, genitourinary, postoperative shock, renal, respiratory, surgical, vascular, and wound complications. The ICD-9 codes used to identify complications were modeled according to previous literature on various surgical applications and were further parsed to reflect only acute postoperative diagnoses13-15(see the Appendix for the comprehensive list of ICD-9 codes).
Two additional outcomes were analyzed, including postoperative mortality and LOS. Postoperative mortality was defined as death occurring prior to discharge. We calculated the average LOS among the complication and the noncomplication cohort.
STATISTICAL ANALYSIS
Patient demographics and target outcomes of the study were analyzed by frequency distribution. Where applicable, the chi-square and the Student’s t tests were used to confirm the statistical difference for dichotomous and continuous variables, respectively. Multivariate regressions were performed after controlling for possible clustering of the data using a generalized estimating equation following a previous analytical methodology.16-20 The results are reported with odds ratios and 95% confidence intervals where applicable, all statistical tests with P ≤ 0.05 were considered to be significant, and all statistical tests were two-sided. We conducted all analyses using SAS, version 9.2 (SAS Institute).
RESULTS
From 2006 to 2010, a weighted sample of 141,973 patients was found to undergo a TSA. After applying our inclusion and exclusion criteria, our study cohort consisted of 125,766 patients (Figure 1).
Continue to: OVERALL TSA COHORT DEMOGRAPHICS...
OVERALL TSA COHORT DEMOGRAPHICS
The average age of the TSA cohort was 69.4 years (standard deviation [SD], 21.20), and 54.1% were females. The cohort had significant comorbidities, with 83.3% of them having at least 1 comorbidity at the time of surgery. Specifically, 31.3% of the patients had 1 comorbidity, 26.5% had 2 comorbidities, and 25.4% had ≥3 comorbidities. Hypertension was the most common comorbidity present in 66.2% of patients, and diabetes was the second most common comorbidity with a prevalence of 16.8%.
COMPLICATION COHORT DEMOGRAPHICS
An overall postoperative complication rate of 6.7% (weighted sample of 8457 patients) was noted in the overall TSA cohort. The TSA cohort was dichotomized into patients who suffered at least 1 complication (weighted, n = 8457) and patients undergoing routine TSAs (weighted, n = 117,308). The average age was significantly higher in the complication vs routine cohort (71.38 vs 69.27 years, P < 0.0001). Similarly, there were significantly more comorbidities (2.51 vs 1.71, P < 0.0001) in the complication cohort.
COMPLICATIONS
We noted a complication rate of 6.7% (weighted sample of 8457 patients). A single complication was noted in 5% of these patients, whereas 1.3% and 0.4% of the patients had 2 and ≥3 complications, respectively. Respiratory abnormalities (2.9%), acute renal failure (0.8%), and cardiac complications (0.8%) were the most prevalent complications after TSA. The list of complications is detailed in Figure 2. Logistic regression analysis of patient characteristics predicting complications showed that advanced age (odds ratio [OR], 2.1 in those aged ≥85 years) and increasing number of comorbidities (≥3; OR, 3.5) were most significant in predicting complications (all P < 0.0001) (Figure 3). Despite the ubiquity of hypertension in this patient population, it was not a significant predictor of complication (OR, 0.9); in contrast, pulmonary disorders (OR, 5.1) and fluid and electrolyte disorders (4.0) were most strongly associated with the development of a postoperative complication after surgery (Figure 4).
EFFECT OF COMPLICATIONS ON LOS
The average length of hospitalization was 2.3 days (95% confidence interval, 2.22-2.25) among the entire cohort. The average LOS was longer in the complication cohort (3.9 days) than in patients who did not have a complication (2.1 days, P < 0.0001). Of the specific complications noted, hemodynamic shock (11.8 days); infectious, most commonly pneumonia (7.6 days); and vascular complications (6.9 days) were associated with the longest hospitalizations. This result is summarized in Figure 5.
MORTALITY
An overall postoperative (in-house) mortality rate of 0.07% was noted (weighted, n = 88). Comparison between the patient cohort that died vs those who survived TSA resulted in significant differences in the rates of complications. Complications that were most significantly different between the cohorts included cardiac (60.47% vs 0.75%, P < 0.0001), postoperative shock (26.61% vs 0.04%, P < 0.0001), and respiratory complications (43.1% vs 2.8%, P < 0.0001). It is important to note that the overall rate of postoperative shock was exceedingly low in the TSA cohort, but it was highly prevalent in the mortality cohort, occurring in 26.61% of patients. A summary of the mortality statistics is presented in Figure 6.
Continue to: DISCUSSION...
DISCUSSION
TSA continues to be associated with high levels of satisfaction;1 as a result, its incidence is increasing.2 As our understanding and efficiency improves nationally, it is imperative that we determine the short-term and longer-term outcomes and complications. In addition, the factors that may affect prognosis must be elucidated to provide a more individualized and effective standard of care. To date, most of the outcome studies of TSA have evaluated long-term outcomes and specific implant-related complications.1,5,6,21,22 Our intent was to evaluate the complications that occur in the postoperative period and their effect on unique “patient care” outcomes. With knowledge of these complications and the predisposing factors, we can better assess patients, risk-stratify, and provide appropriate guidelines.
We noted that complications occurring after TSA are not uncommon, with >6% of patients suffering a postoperative complication. In this study, the number of complications noted was associated with worse patient outcomes. In addition, we noted that patients undergoing a TSA have a significant burden of comorbidities; however, hematologic and fluid disorders (eg, iron deficiency anemia, pulmonary circulatory disorders, and fluid imbalances) were most important in predicting postoperative complications.
Increased LOS in the hospital after TSA was associated with the occurrence of complications. Of all noted complications, shock and infectious and vascular complications led to the longest hospitalizations. Hospital-acquired pneumonia was the most common infectious etiology, while pulmonary embolism and deep vein thrombosis were the most consistent vascular complications. Although seldom studied in the TSA population, a similar finding has been noted in patients after THA. O’Malley and colleagues,23 using the American College of Surgeon’s National Surgical Quality Improvement Program database, identified independent factors that were associated with complications and average prolonged LOS. They noted that the occurrence of major complications was associated with a prolonged LOS. Some, but not all the major complications, included organ space infection, cardiac events, pneumonia, and venous thromboembolic events.23 Therefore, attempts to limit the amount of time spent in hospitals and control the associated costs must focus on managing the incidence of complications.
Postoperative mortality after TSA was uncommon, occurring in 0.07% of the patients in this study. The low incidence of mortality noted in this study is probably related to the fact that our data represent mortality, whereas in the hospital and, unlike most mortality studies, it does not account for patient demise that may occur in the months after surgery. Other reports have noted that mortality occurs in <1.5% of these patients.24-28 Singh and colleagues25 observed in their evaluation of perioperative mortality after TSA a mortality rate of 0.8% with 90 days after 4380 shoulder replacements performed at their institution. Using multivariate analysis, they were able to identify associations between mortality and increasing American Society of Anesthesiology (ASA) class and Charlson Comorbidity Index. These results in relation to ours would indicate that the majority of patients who die after shoulder arthroplasty do so after initial discharge. Although we could not determine a causal relationship between mortality and patient comorbidities, we noted that certain complications strongly correlated with mortality. In patients who died, there was a relatively high incidence of cardiac (60.5%) and respiratory (43.1%) complications. Similarly, although postoperative shock was almost nonexistent in the patients who survived surgery (0.04%), it was much more common in the patients who suffered mortality (26.6%).
This study is not without limitations. Data were extracted from a national database, therefore precluding the inclusion of specific details of surgery and functional assessment. Inherent to ICD-9 coding, we were unable to assess the exact detail and severity of complications. For instance, we cannot be certain what criteria were used to define “acute renal failure” for each patient. This study is retrospective in nature and therefore adequate randomization and standardization of patients is not possible. Similarly, the nature of the database may not allow for exacting our inclusion and exclusion criteria. However, the large sample size of the patient population lessens the chance of potential biases and type 2 errors. Prior to October 2010, reverse shoulder arthroplasty was coded under the ICD-9procedural code 81.80 as TSA. Therefore, there is some overlap between TSA and reverse shoulder arthroplasty in our data. Reverse shoulder arthroplasty is now coded under ICD-9 procedural code 81.88. It is possible that results may differ if reverse shoulder arthroplasty were excluded from our patient cohort. This can be an area of future research.
CONCLUSION
Although much is known about the long-term hardware and functional complications after TSA, in this study, we have attempted to broaden the understanding of perioperative complications and the associated sequelae. Complications are common after TSA surgery and are related to adverse outcomes. In the setting of healthcare changes, the surgeon and the patient must understand the cause, types, incidence, and outcomes of medical and surgical complications after surgery. This allows for more accurate “standard of care” metrics. Further large-volume multicenter studies are needed to gain further insight into the short- and long-term outcomes of TSA.
1. Fox TJ, Cil A, Sperling JW, Sanchez-Sotelo J, Schleck CD, Cofield RH. Survival of the glenoid component in shoulder arthroplasty. J Shoulder Elbow Surg. 2009;18(6):859-863. doi:10.1016/j.jse.2008.11.020.
2. Kim SH, Wise BL, Zhang Y, Szabo RM. Increasing incidence of shoulder arthroplasty in the United States. J Bone Joint Surg Am. 2011;93(24):2249-2254. doi:10.2106/JBJS.J.01994.
3. Ahmadi S, Lawrence TM, Sahota S, et al. The incidence and risk factors for blood transfusion in revision shoulder arthroplasty: our institution's experience and review of the literature. J Shoulder Elbow Surg. 2014;23(1):43–48. doi:10.1016/j.jse.2013.03.010.
4. Boyd AD Jr, Aliabadi P, Thornhill TS. Postoperative proximal migration in total shoulder arthroplasty. Incidence and significance. J Arthroplasty. 1991;6(1):31-37. doi:10.1016/S0883-5403(06)80154-3.
5. Choi T, Horodyski M, Struk AM, Sahajpal DT, Wright TW. Incidence of early radiolucent lines after glenoid component insertion for total shoulder arthroplasty: a radiographic study comparing pressurized and unpressurized cementing techniques. J Shoulder Elbow Surg. 2013;22(3):403-408. doi:10.1016/j.jse.2012.05.041.
6. Favard L, Katz D, Colmar M, Benkalfate T, Thomazeau H, Emily S. Total shoulder arthroplasty - arthroplasty for glenohumeral arthropathies: results and complications after a minimum follow-up of 8 years according to the type of arthroplasty and etiology. Orthop Traumatol Surg Res. 2012;98(4 Suppl):S41-S47. doi:10.1016/j.otsr.2012.04.003.
7. Agency for Healthcare Research and Quality. Introduction to the HCUP national inpatient sample (NIS) 2012. https://hcup-us.ahrq.gov/db/nation/nis/NISIntroduction2012.pdf 2012. Accessed June 9, 2013.
8. Agency for Healthcare Research and Quality. HCUP quality control procedures. https://hcup-us.ahrq.gov/db/quality.pdf. Accessed June 15, 2013.
9. Agency for Healthcare Research and Quality. Comparative analysis of HCUP and NHDS inpatient discharge data: technical supplement 13. https://archive.ahrq.gov/research/data/hcup/nhds/niscomp.html. Accessed June 15, 2013.
10. Rajaee SS, Trofa D, Matzkin E, Smith E. National trends in primary total hip arthroplasty in extremely young patients: a focus on bearing surface usage. J Arthroplasty. 2012;27(10):1870-1878. doi:10.1016/j.arth.2012.04.006.
11. Bozic KJ, Kurtz S, Lau E, et al. The epidemiology of bearing surface usage in total hip arthroplasty in the United States. J Bone Joint Surg Am. 2009;91(7):1614-1620. doi:10.2106/JBJS.H.01220.
12. Elixhauser A, Steiner C, Harris DR, Coffey RM. Comorbidity measures for use with administrative data. Med Care. 1998;36(1):8-27. doi:10.1097/00005650-199801000-00004.
13. Cahill KS, Chi JH, Day A, Claus EB. Prevalence, complications, and hospital charges associated with use of bone-morphogenetic proteins in spinal fusion procedures. JAMA. 2009;302(1):58-66. doi:10.1001/jama.2009.956.
14. Lin CA, Kuo AC, Takemoto S. Comorbidities and perioperative complications in HIV-positive patients undergoing primary total hip and knee arthroplasty. J Bone Joint Surg Am. 2013;95(11):1028-1036. doi:10.2106/JBJS.L.00269.
15. Rasouli MR, Maltenfort MG, Ross D, Hozack WJ, Memtsoudis SG, Parvizi J. Perioperative morbidity and mortality following bilateral total hip arthroplasty. J Arthroplasty. 2014;29(1):142-148. doi:10.1016/j.arth.2013.04.001.
16. Begg CB, Riedel ER, Bach PB, et al. Variations in morbidity after radical prostatectomy. N Engl J Med. 2002;346(15):1138-1144. doi:10.1056/NEJMsa011788.
17. Hu JC, Gold KF, Pashos CL, Mehta SS, Litwin MS. Temporal trends in radical prostatectomy complications from 1991 to 1998. J Urol. 2003;169(4):1443-1448. doi:10.1097/01.ju.0000056046.16588.e4.
18. Abdollah F, Sun M, Schmitges J, et al. Surgical caseload is an important determinant of continent urinary diversion rate at radical cystectomy: a population-based study. Ann Surg Oncol. 2011;18(9):2680-2687. doi:10.1245/s10434-011-1618-2.
19. Panageas KS, Schrag D, Riedel E, Bach PB, Begg CB. The effect of clustering of outcomes on the association of procedure volume and surgical outcomes. Ann Intern Med. 2003;139(8):658-665. doi:10.7326/0003-4819-139-8-200310210-00009.
20. Joice GA, Deibert CM, Kates M, Spencer BA, McKiernan JM. "Never events”: centers for Medicare and Medicaid Services complications after radical cystectomy. Urology. 2013;81(3):527-532. doi:10.1016/j.urology.2012.09.050.
21. Taunton MJ, McIntosh AL, Sperling JW, Cofield RH. Total shoulder arthroplasty with a metal-backed, bone-ingrowth glenoid component. Medium to long-term results. J Bone Joint Surg Am. 2008;90(10):2180-2188. doi:10.2106/JBJS.G.00966.
22. Raiss P, Schmitt M, Bruckner T, et al. Results of cemented total shoulder replacement with a minimum follow-up of ten years. J Bone Joint Surg Am. 2012;94(23):e1711-e1710. doi:10.2106/JBJS.K.00580.
23. O'Malley NT, Fleming FJ, Gunzler DD, Messing SP, Kates SL. Factors independently associated with complications and length of stay after hip arthroplasty: analysis of the National Surgical Quality Improvement Program. J Arthroplasty. 2012;27(10):1832-1837. doi:10.1016/j.arth.2012.04.025.
24. White CB, Sperling JW, Cofield RH, Rowland CM. Ninety-day mortality after shoulder arthroplasty. J Arthroplasty. 2003;18(7):886-888. doi:10.1016/S0883-5403(03)00269-9.
25. Singh JA, Sperling JW, Cofield RH. Ninety day mortality and its predictors after primary shoulder arthroplasty: an analysis of 4,019 patients from 1976-2008. BMC Musculoskelet Disord. 2011;12:231. doi:10.1186/1471-2474-12-231.
26. Fehringer EV, Mikuls TR, Michaud KD, Henderson WG, O'Dell JR. Shoulder arthroplasties have fewer complications than hip or knee arthroplasties in US veterans. Clin Orthop Relat Res. 2010;468(3):717-722. doi:10.1007/s11999-009-0996-2.
27. Farmer KW, Hammond JW, Queale WS, Keyurapan E, McFarland EG. Shoulder arthroplasty versus hip and knee arthroplasties: a comparison of outcomes. Clin Orthop Relat Res. 2007;455:183-189. doi:10.1097/01.blo.0000238839.26423.8d.
28. Farng E, Zingmond D, Krenek L, Soohoo NF. Factors predicting complication rates after primary shoulder arthroplasty. J Shoulder Elbow Surg. 2011;20(4):557-563. doi:10.1016/j.jse.2010.11.005.
TAKE HOME POINTS
- Medical complications are common (6.7%) after total shoulder arthroplasty.
- Age and preoperative medical comorbidities increased the risk of a postoperative complication.
- The most frequent medical complications are respiratory, renal, and cardiac.
- Length of stay was effected most by shock, infections, and vascular complications.
- Mortality was associated with major complications such as, shock, central nervous system, cardiac, vascular, and respiratory complications.
Comparison of Cardiovascular Outcomes Between Statin Monotherapy and Fish Oil and Statin Combination Therapy in a Veteran Population
The Centers for Disease Control and Prevention lists cardiovascular-related diseases as a leading cause of mortality.1 The medication class of 3-hydroxy-3-methylglutaryl coenzyme A reductase inhibitors, more commonly known as statins, is first-line therapy to prevent negative cardiovascular outcomes and reduce premature death.2 Additional hyperlipidemia medications, such as fish oil, can be added for potential cardiovascular benefit.
Yokoyama and colleagues demonstrated that fish oil is a promising treatment for the prevention of major coronary events in patients with hypercholesterolemia.3 Furthermore, Macchia and colleagues found reductions in cardiovascular outcomes and all-cause mortality in postmyocardial infarction patients treated with fish oil and statin combination therapy.4 In contrast, the Outcomes Reduction with an Initial Glargine Intervention (ORIGIN) trial found glucose intolerant and patients with diabetes mellitus did not have improved cardiovascular outcomes with fish oil therapy.5 Likewise The Risk and Prevention Study Collaborative Group found fish oil supplementation provided no benefit for primary prevention in patients with multiple cardiovascular risk factors.6 These studies demonstrate fish oil therapy can cause diverse cardiovascular outcomes in different patient populations.
Currently, there are no studies examining the impact of fish oil and statin combination therapy on the US veteran population. The research of Yokoyama, Macchia, and The Risk and Prevention Study Collaborative Group took place in Japanese and Italian populations, which impacts their external validity.
This study aims to help the US Department of Veterans Affairs (VA) primary care providers and clinical pharmacists address the role of fish oil and statin combination therapy in the prevention of cardiovascular disease and all-cause mortality in the veteran population. The addition of fish oil to statin therapy was compared with an established standard of care, statin monotherapy, in veterans at the Fargo Veterans Affairs Health Care System (FVAHCS).
Methods
A retrospective chart review was conducted using the FVAHCS Computerized Patient Record System (CPRS). The institution’s review board and VA medical center approved the study. Eligible veterans with prescriptions for fish oil or statin therapy between January 1, 2000 and September 30, 2015 were randomly selected, reviewed, and sorted based on inclusion and exclusion criteria. 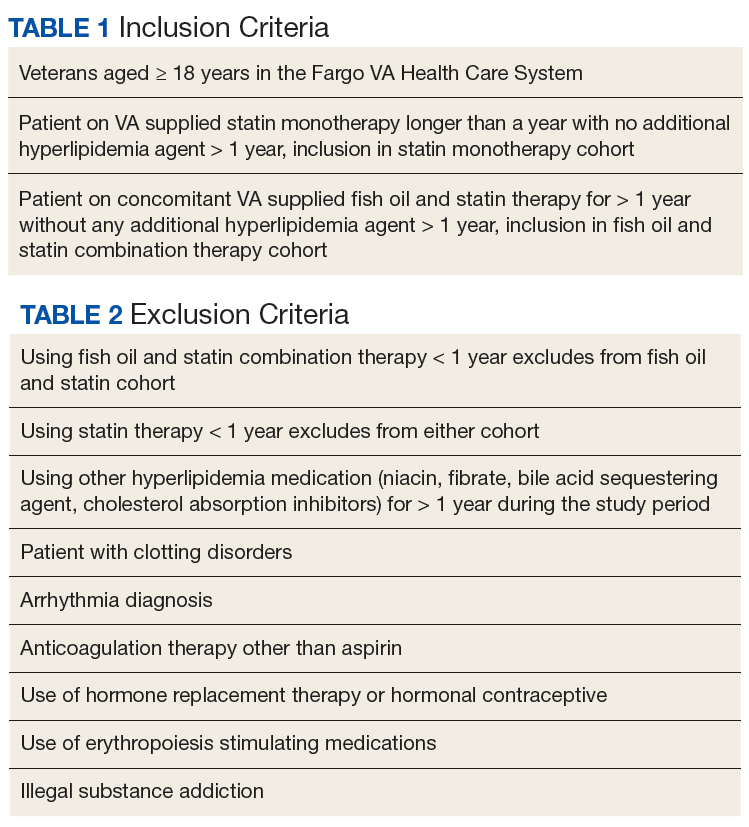
The primary outcome was time to aggregate cardiovascular events, specifically myocardial infarction (MI), stroke, transient ischemic attack, coronary artery bypass graft, and percutaneous intervention. Adverse cardiovascular event data were obtained from the veterans’ International Classification of Disease (ICD) 9 codes. Furthermore, the secondary outcome—time to all-cause mortality—was gathered by death records in CPRS. Time to these events was compared in veterans on fish oil and statin combination therapy or statin monotherapy. The date of the cardiovascular event or death was recorded for each outcome and was obtained by reviewing provider notes that documented the incidence. If a specific day or month of incidence was not documented, July 1 was selected as the default date for the adverse cardiovascular event.
Demographics, medication adherence, diagnoses, lab values within 90 days of initiation of therapy, and primary and secondary outcomes were collected. Demographics that included age, race, and sex all were obtained via chart review. Diagnoses were gathered using ICD 9 codes. Refill history was retrieved to assess adherence. Adherence was calculated by the total days of medication therapy divided by the total days within the study. Total days in the study was calculated by the duration of therapy days between therapy initiation date and a terminating factor. Terminating factors included an adverse cardiovascular event, death, or the study termination date.
Statistics
Demographic and other cohort characterization variables were compared either by a t test, rank sum test, or Fisher exact test given the character of the variable. Kaplan Meier analysis was used to evaluate time to aggregate cardiovascular events and all-cause mortality. VA Informatics and Computing Infrastructure (VINCI) R 3.4.3 was used for data analysis. One of the few combination studies by Macchia and colleagues gave an estimate of unadjusted incident rates for patients treated with statin monotherapy vs fish oil and statin combination therapy in patients having a recent MI.4 Based on this information, a power analysis determined that a 2% difference in incidence rate of adverse cardiovascular events could be detected between the 2 cohorts with 1,000 veterans in the statin cohort, and 500 veterans in the fish oil and statin cohort assuming a time to event interval of about 7.5 years. An α level of 0.05 was set to determine statistical significance.
Results
A total of 3,940 veterans with prescriptions for fish oil or statin therapy were randomly reviewed and sorted based on inclusion and exclusion criteria. This inclusion criteria resulted in 2,575 fish oil and statin combination patients and 1,365 statin monotherapy patients. Exclusion criteria produced a final total of 437 fish oil and statin combination patients and 559 statin monotherapy patients. Patient demographics are presented in Table 3. 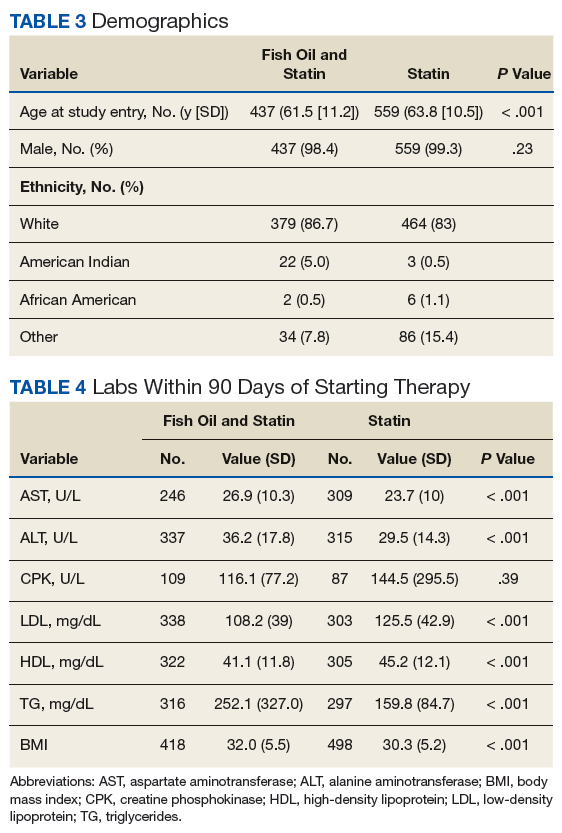
All baseline laboratory data were collected within 90 days of therapy initiation (Table 4). Statin monotherapy patients had lower triglyceride levels compared with those of the fish oil and statin combination patients. However, both high-density lipoprotein (HDL) and low-density lipoprotein (LDL) levels were higher in the statin monotherapy patients. As seen in Table 5, diagnosis of heart failure, hypertension, hypothyroidism, and dyslipidemia were higher in the statin monotherapy cohort, while tobacco use and pancreatitis were more prevalent in the fish oil and statin combination cohort. 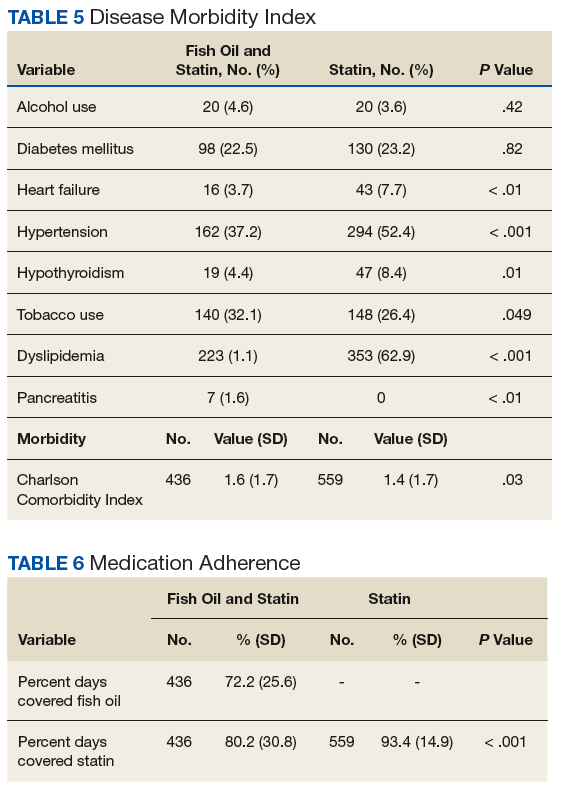
Kaplan Meier curves of the primary outcome, time to aggregate adverse cardiovascular event, and the secondary outcome, time to all-cause mortality are shown in Figure 1 and Figure 2, respectively. This shows adverse cardiovascular events and all-cause mortality for approximately 4,500 days for the fish oil and statin cohort and approximately 6,000 days for the statin monotherapy cohort.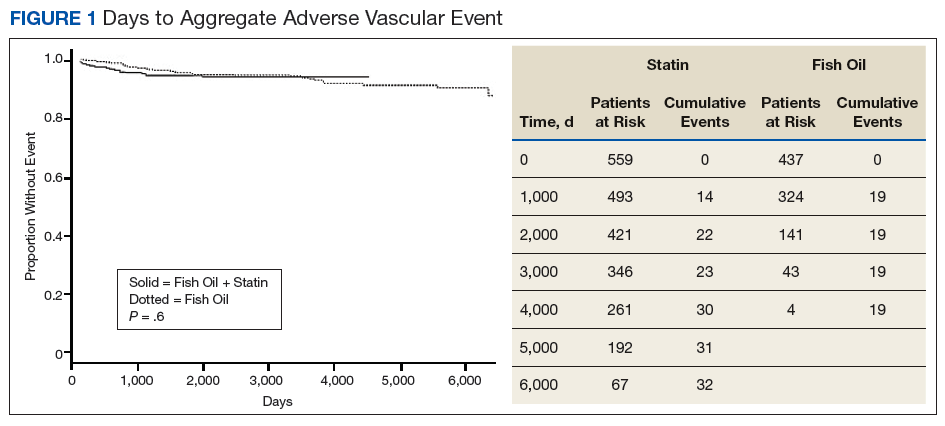
Discussion
Analysis of this study failed to detect a statistically significant difference for time to aggregate adverse cardiovascular events or all-cause mortality. This may be due to fewer adverse cardiovascular events and mortality in the 2 cohorts than was anticipated.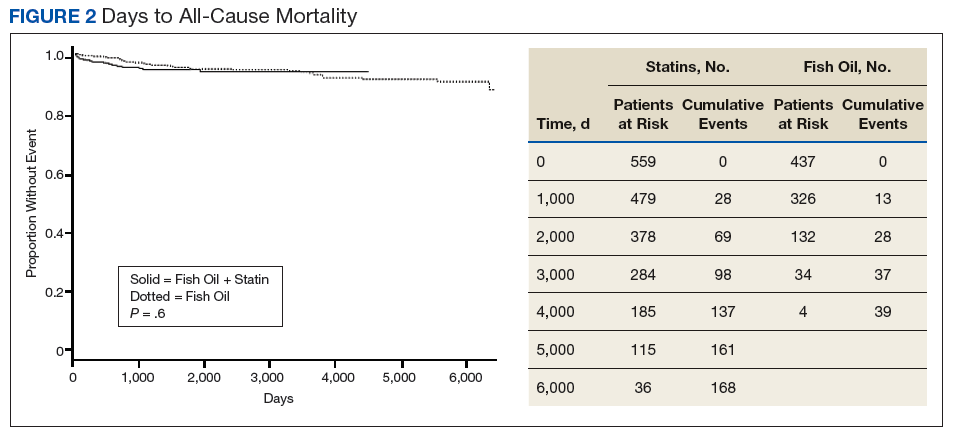
There are no studies examining fish oil and statin therapy in the veteran population and only limited studies comparing statin and fish oil combination therapy vs statin monotherapy for adverse cardiovascular outcomes and all-cause mortality. One of the few comparison studies was by Macchia and colleagues and consisted of 7,924 post MI patients in Italy. Over a 4-year period, researchers found a slight improvement in the adjusted paired-matched population for all-cause mortality in the fish oil and statin therapy cohort vs statin monotherapy (8.6% vs 13.6% P < .001).3 A benefit also was seen in the fish oil and statin cohort vs statin monotherapy in the adjusted paired-matched population for death or stroke (16.7% vs 11.5% P < .001).3
In contrast, this study did not address postmyocardial infarction patients exclusively. Rather, patients in this study had lower morbidity, which resulted in fewer adverse cardiovascular outcomes and a greater difficulty to detect a difference in this healthier population. These healthier patients may derive less benefit from primary or secondary prevention with statin and fish oil combination therapy.
In this study, there were extensive inclusion and exclusion criteria to assess the relationship between the cohorts for
Comparison of demographic data showed both cohorts were of similar age, sex, and race. Of note the Fargo veteran population was primarily white (> 80% in both cohorts). This is slightly higher than the percentage of whites for all US veterans. The slight difference most likely had a minimal clinical impact. Laboratory values recorded within 90 days of initiation of therapy were largely clinically similar except for triglycerides being significantly higher in the fish oil and statin combination cohort (Table 4). This may reflect selection bias, where providers may be more likely to add fish oil therapy for the potential to further control triglycerides.
Diagnoses of hypertension, heart failure, and dyslipidemia were higher in the statin monotherapy cohort. However, body mass index, tobacco use, and pancreatitis were statistically higher in fish oil and statin combination cohort. Even though there was a statistically significant difference in disease diagnoses, this likely created a minor clinical difference between the groups. This is further illustrated by the similarity of the Charlson Comorbidity Index of 1.6 for fish oil and statin cohort and 1.4 in statin monotherapy cohort.
Strengths
A strength of this study was its adherence rates. Adherence rates were high in both cohorts (Table 6). Fish oil and statin cohort did have slightly lower adherence compared with that of statin monotherapy. This may demonstrate extra pill burden influencing adherence. Overall demographics, laboratory values, disease, and adherence rates were clinically similar in both cohorts, thus reducing the potential for confounders.
Limitations
Limitations of this study include its retrospective chart review design. This design is susceptible to incorrect recording of events. The primary outcome, aggregate adverse cardiovascular events, may have been incorrectly recorded in the medical record as other diseases, such as coronary artery disease or heart disease, and therefore not captured by ICD 9 code retrieval. Also, important information, such as laboratory data, disease, and medication adherence, may not have been documented for all patients. Of note 1 patient in the fish oil and statin combination cohort did not have any recorded laboratory data, disease, or adherence data.
Another limitation is lack of access to medical notes from non-VA providers, which can result in missed data collection. To reduce this limitation, the study excluded veterans that received non-VA fish oil, statins, or other hyperlipidemia medications for > 1 year. Veterans were included only if they used VA-provided fish oil or statins. This inclusion and exclusion criteria reduced the chance of missing data from other facilities because it favored inclusion of only subjects that received care exclusively through the VA.
Last, on study initiation it was not realized that fish oil was not provided by the health care system until about the year 2004. This resulted in less risk days for the fish oil and statin cohort. However, Kaplan Meier analysis lessens this issue from being a confounder. Time to event rates for both the primary and secondary outcomes were similar and most likely would have continued to trend together with the same therapy duration.
Conclusion
Fish oil and statin combination therapy when compared with statin monotherapy failed to show that a statistically significant difference exists in the rates of MI, stroke, transient ischemic attack, coronary artery bypass graft, and percutaneous intervention. The clinical difference of fish oil and statin combination therapy vs statin monotherapy is most likely small or nonexistent. From our literature search, this is the only study concerning the use of fish oil and statin combination therapy in the veteran population. It is most likely that fish oil and statin combination therapy and statin monotherapy are similar for the reduction of time to aggregate adverse cardiovascular events and all-cause mortality in the veteran population.
Acknowledgments
This material is the result of work supported with resources and the use of facilities at the Fargo VA Healthcare System.
1. Kochanek KD, Murphy SL, Xu J, Tejada-Vera B. Deaths: final data for 2014. https://www.cdc.gov/nchs/data/nvsr/nvsr65/nvsr65_04.pdf. Published June 30, 2016. Accessed July 26, 2018.
2. Stone NJ, Robinson JG, Lichtenstein AH, et al; American College of Cardiology/American Heart Association Task Force on Practice Guidelines. 2013 ACC/AHA guideline on the treatment of blood cholesterol to reduce atherosclerotic cardiovascular risk in adults: a report of the American College of Cardiology/American Heart Association Task Force on Practice Guidelines. J Am Coll Cardiol. 2014;63(25 pt B):2889-2934.
3. Yokoyama M, Origasa H, Matsuzaki M, et al; Japan EPA lipid intervention study (JELIS) Investigators. Effects of eicosapentaenoic acid on major coronary events in hypercholesterolaemic patients (JELIS): a randomised open-label, blinded endpoint analysis. Lancet. 2007;369(9567):1090-1098.
4. Macchia A, Romero M, D’Ettorre A, Tognoni G, Mariani J. Exploratory analysis on the use of statins with or without n-3 PUFA and major events in patients discharged for acute myocardial infarction: an observational retrospective study. PLoS One. 2013;8(5):e62772.
5. ORIGIN Trial Investigators, Bosch J, Gerstein HC, et al. n-3 fatty acids and cardiovascular outcomes in patients with dysglycemia. N Engl J Med. 2012;367(4):309-318.
6. The Risk and Prevention Study Collaborative Group, Roncaglioni MC, Tombesi M, et al. n-3 fatty acids in patients with multiple cardiovascular risk factors. N Engl J Med. 2013;368(19):1800-1808.
7. Rizos EC, Ntzani EE, Bika E, Kostapanos MS, Elisaf MS. Association between omega-3 fatty acid supplementation and risk of major cardiovascular disease events: a systematic review and meta-analysis. JAMA. 2012;308(10):1024-1033.
The Centers for Disease Control and Prevention lists cardiovascular-related diseases as a leading cause of mortality.1 The medication class of 3-hydroxy-3-methylglutaryl coenzyme A reductase inhibitors, more commonly known as statins, is first-line therapy to prevent negative cardiovascular outcomes and reduce premature death.2 Additional hyperlipidemia medications, such as fish oil, can be added for potential cardiovascular benefit.
Yokoyama and colleagues demonstrated that fish oil is a promising treatment for the prevention of major coronary events in patients with hypercholesterolemia.3 Furthermore, Macchia and colleagues found reductions in cardiovascular outcomes and all-cause mortality in postmyocardial infarction patients treated with fish oil and statin combination therapy.4 In contrast, the Outcomes Reduction with an Initial Glargine Intervention (ORIGIN) trial found glucose intolerant and patients with diabetes mellitus did not have improved cardiovascular outcomes with fish oil therapy.5 Likewise The Risk and Prevention Study Collaborative Group found fish oil supplementation provided no benefit for primary prevention in patients with multiple cardiovascular risk factors.6 These studies demonstrate fish oil therapy can cause diverse cardiovascular outcomes in different patient populations.
Currently, there are no studies examining the impact of fish oil and statin combination therapy on the US veteran population. The research of Yokoyama, Macchia, and The Risk and Prevention Study Collaborative Group took place in Japanese and Italian populations, which impacts their external validity.
This study aims to help the US Department of Veterans Affairs (VA) primary care providers and clinical pharmacists address the role of fish oil and statin combination therapy in the prevention of cardiovascular disease and all-cause mortality in the veteran population. The addition of fish oil to statin therapy was compared with an established standard of care, statin monotherapy, in veterans at the Fargo Veterans Affairs Health Care System (FVAHCS).
Methods
A retrospective chart review was conducted using the FVAHCS Computerized Patient Record System (CPRS). The institution’s review board and VA medical center approved the study. Eligible veterans with prescriptions for fish oil or statin therapy between January 1, 2000 and September 30, 2015 were randomly selected, reviewed, and sorted based on inclusion and exclusion criteria.
The primary outcome was time to aggregate cardiovascular events, specifically myocardial infarction (MI), stroke, transient ischemic attack, coronary artery bypass graft, and percutaneous intervention. Adverse cardiovascular event data were obtained from the veterans’ International Classification of Disease (ICD) 9 codes. Furthermore, the secondary outcome—time to all-cause mortality—was gathered by death records in CPRS. Time to these events was compared in veterans on fish oil and statin combination therapy or statin monotherapy. The date of the cardiovascular event or death was recorded for each outcome and was obtained by reviewing provider notes that documented the incidence. If a specific day or month of incidence was not documented, July 1 was selected as the default date for the adverse cardiovascular event.
Demographics, medication adherence, diagnoses, lab values within 90 days of initiation of therapy, and primary and secondary outcomes were collected. Demographics that included age, race, and sex all were obtained via chart review. Diagnoses were gathered using ICD 9 codes. Refill history was retrieved to assess adherence. Adherence was calculated by the total days of medication therapy divided by the total days within the study. Total days in the study was calculated by the duration of therapy days between therapy initiation date and a terminating factor. Terminating factors included an adverse cardiovascular event, death, or the study termination date.
Statistics
Demographic and other cohort characterization variables were compared either by a t test, rank sum test, or Fisher exact test given the character of the variable. Kaplan Meier analysis was used to evaluate time to aggregate cardiovascular events and all-cause mortality. VA Informatics and Computing Infrastructure (VINCI) R 3.4.3 was used for data analysis. One of the few combination studies by Macchia and colleagues gave an estimate of unadjusted incident rates for patients treated with statin monotherapy vs fish oil and statin combination therapy in patients having a recent MI.4 Based on this information, a power analysis determined that a 2% difference in incidence rate of adverse cardiovascular events could be detected between the 2 cohorts with 1,000 veterans in the statin cohort, and 500 veterans in the fish oil and statin cohort assuming a time to event interval of about 7.5 years. An α level of 0.05 was set to determine statistical significance.
Results
A total of 3,940 veterans with prescriptions for fish oil or statin therapy were randomly reviewed and sorted based on inclusion and exclusion criteria. This inclusion criteria resulted in 2,575 fish oil and statin combination patients and 1,365 statin monotherapy patients. Exclusion criteria produced a final total of 437 fish oil and statin combination patients and 559 statin monotherapy patients. Patient demographics are presented in Table 3.
All baseline laboratory data were collected within 90 days of therapy initiation (Table 4). Statin monotherapy patients had lower triglyceride levels compared with those of the fish oil and statin combination patients. However, both high-density lipoprotein (HDL) and low-density lipoprotein (LDL) levels were higher in the statin monotherapy patients. As seen in Table 5, diagnosis of heart failure, hypertension, hypothyroidism, and dyslipidemia were higher in the statin monotherapy cohort, while tobacco use and pancreatitis were more prevalent in the fish oil and statin combination cohort.
Kaplan Meier curves of the primary outcome, time to aggregate adverse cardiovascular event, and the secondary outcome, time to all-cause mortality are shown in Figure 1 and Figure 2, respectively. This shows adverse cardiovascular events and all-cause mortality for approximately 4,500 days for the fish oil and statin cohort and approximately 6,000 days for the statin monotherapy cohort.
Discussion
Analysis of this study failed to detect a statistically significant difference for time to aggregate adverse cardiovascular events or all-cause mortality. This may be due to fewer adverse cardiovascular events and mortality in the 2 cohorts than was anticipated.
There are no studies examining fish oil and statin therapy in the veteran population and only limited studies comparing statin and fish oil combination therapy vs statin monotherapy for adverse cardiovascular outcomes and all-cause mortality. One of the few comparison studies was by Macchia and colleagues and consisted of 7,924 post MI patients in Italy. Over a 4-year period, researchers found a slight improvement in the adjusted paired-matched population for all-cause mortality in the fish oil and statin therapy cohort vs statin monotherapy (8.6% vs 13.6% P < .001).3 A benefit also was seen in the fish oil and statin cohort vs statin monotherapy in the adjusted paired-matched population for death or stroke (16.7% vs 11.5% P < .001).3
In contrast, this study did not address postmyocardial infarction patients exclusively. Rather, patients in this study had lower morbidity, which resulted in fewer adverse cardiovascular outcomes and a greater difficulty to detect a difference in this healthier population. These healthier patients may derive less benefit from primary or secondary prevention with statin and fish oil combination therapy.
In this study, there were extensive inclusion and exclusion criteria to assess the relationship between the cohorts for
Comparison of demographic data showed both cohorts were of similar age, sex, and race. Of note the Fargo veteran population was primarily white (> 80% in both cohorts). This is slightly higher than the percentage of whites for all US veterans. The slight difference most likely had a minimal clinical impact. Laboratory values recorded within 90 days of initiation of therapy were largely clinically similar except for triglycerides being significantly higher in the fish oil and statin combination cohort (Table 4). This may reflect selection bias, where providers may be more likely to add fish oil therapy for the potential to further control triglycerides.
Diagnoses of hypertension, heart failure, and dyslipidemia were higher in the statin monotherapy cohort. However, body mass index, tobacco use, and pancreatitis were statistically higher in fish oil and statin combination cohort. Even though there was a statistically significant difference in disease diagnoses, this likely created a minor clinical difference between the groups. This is further illustrated by the similarity of the Charlson Comorbidity Index of 1.6 for fish oil and statin cohort and 1.4 in statin monotherapy cohort.
Strengths
A strength of this study was its adherence rates. Adherence rates were high in both cohorts (Table 6). Fish oil and statin cohort did have slightly lower adherence compared with that of statin monotherapy. This may demonstrate extra pill burden influencing adherence. Overall demographics, laboratory values, disease, and adherence rates were clinically similar in both cohorts, thus reducing the potential for confounders.
Limitations
Limitations of this study include its retrospective chart review design. This design is susceptible to incorrect recording of events. The primary outcome, aggregate adverse cardiovascular events, may have been incorrectly recorded in the medical record as other diseases, such as coronary artery disease or heart disease, and therefore not captured by ICD 9 code retrieval. Also, important information, such as laboratory data, disease, and medication adherence, may not have been documented for all patients. Of note 1 patient in the fish oil and statin combination cohort did not have any recorded laboratory data, disease, or adherence data.
Another limitation is lack of access to medical notes from non-VA providers, which can result in missed data collection. To reduce this limitation, the study excluded veterans that received non-VA fish oil, statins, or other hyperlipidemia medications for > 1 year. Veterans were included only if they used VA-provided fish oil or statins. This inclusion and exclusion criteria reduced the chance of missing data from other facilities because it favored inclusion of only subjects that received care exclusively through the VA.
Last, on study initiation it was not realized that fish oil was not provided by the health care system until about the year 2004. This resulted in less risk days for the fish oil and statin cohort. However, Kaplan Meier analysis lessens this issue from being a confounder. Time to event rates for both the primary and secondary outcomes were similar and most likely would have continued to trend together with the same therapy duration.
Conclusion
Fish oil and statin combination therapy when compared with statin monotherapy failed to show that a statistically significant difference exists in the rates of MI, stroke, transient ischemic attack, coronary artery bypass graft, and percutaneous intervention. The clinical difference of fish oil and statin combination therapy vs statin monotherapy is most likely small or nonexistent. From our literature search, this is the only study concerning the use of fish oil and statin combination therapy in the veteran population. It is most likely that fish oil and statin combination therapy and statin monotherapy are similar for the reduction of time to aggregate adverse cardiovascular events and all-cause mortality in the veteran population.
Acknowledgments
This material is the result of work supported with resources and the use of facilities at the Fargo VA Healthcare System.
1. Kochanek KD, Murphy SL, Xu J, Tejada-Vera B. Deaths: final data for 2014. https://www.cdc.gov/nchs/data/nvsr/nvsr65/nvsr65_04.pdf. Published June 30, 2016. Accessed July 26, 2018.
2. Stone NJ, Robinson JG, Lichtenstein AH, et al; American College of Cardiology/American Heart Association Task Force on Practice Guidelines. 2013 ACC/AHA guideline on the treatment of blood cholesterol to reduce atherosclerotic cardiovascular risk in adults: a report of the American College of Cardiology/American Heart Association Task Force on Practice Guidelines. J Am Coll Cardiol. 2014;63(25 pt B):2889-2934.
3. Yokoyama M, Origasa H, Matsuzaki M, et al; Japan EPA lipid intervention study (JELIS) Investigators. Effects of eicosapentaenoic acid on major coronary events in hypercholesterolaemic patients (JELIS): a randomised open-label, blinded endpoint analysis. Lancet. 2007;369(9567):1090-1098.
4. Macchia A, Romero M, D’Ettorre A, Tognoni G, Mariani J. Exploratory analysis on the use of statins with or without n-3 PUFA and major events in patients discharged for acute myocardial infarction: an observational retrospective study. PLoS One. 2013;8(5):e62772.
5. ORIGIN Trial Investigators, Bosch J, Gerstein HC, et al. n-3 fatty acids and cardiovascular outcomes in patients with dysglycemia. N Engl J Med. 2012;367(4):309-318.
6. The Risk and Prevention Study Collaborative Group, Roncaglioni MC, Tombesi M, et al. n-3 fatty acids in patients with multiple cardiovascular risk factors. N Engl J Med. 2013;368(19):1800-1808.
7. Rizos EC, Ntzani EE, Bika E, Kostapanos MS, Elisaf MS. Association between omega-3 fatty acid supplementation and risk of major cardiovascular disease events: a systematic review and meta-analysis. JAMA. 2012;308(10):1024-1033.