User login
Women in GI: Career-spanning strategies to overcome gender bias
The gender gap in gastroenterology persists – currently, women constitute 39% of fellows, but only 22% of senior AGA members and less than 18% of all practicing gastroenterologists – and it has gained even greater significance within the “current historical moment” of the COVID pandemic and growing cognizance of systemic sexism and racism, according to experts.
During the pandemic, women have been more likely to stay home to care for ill family members and children affected by school closures, which increases their already disproportionate share of unpaid work, wrote Jessica Bernica, MD, of Baylor College of Medicine in Houston with her associates in Techniques and Innovations in Gastrointestinal Endoscopy. They noted that, according to one study, this “holds true for female physicians, who despite their more privileged positions, also experience higher demands at home, impacting their ability to contribute to teaching, service, and research.”
At the same time, the pandemic has brought into focus which jobs are “truly essential” – and that they are “overwhelmingly [held] by women and people of color, who are often underpaid and undervalued,” the experts wrote. The growing focus on systemic racism has also increased awareness of the chronic gender discrimination faced by female minorities, as well as by women in general, they added. In the field of gastroenterology, inherent gender bias – both systemic and self-directed – can bar women from advancing beginning as early as medical school.
To help address these issues, the experts outlined key opportunities for change as women navigate professional “forks in the road” throughout their careers.
Throughout their careers
During medical school and residency, women can specifically request gastroenterology rotations (“ideally with both inpatient and outpatient exposure”), attend society conferences, participate in research themselves, and join a research track or serve as chief medical resident. When applying for gastroenterology fellowships, they can prioritize programs with female faculty, which were recently found to be more likely to hire female fellows.
During fellowship, women can avail themselves of female mentors, who can help them strategize about ways to address gender bias, connect with GI groups and societies, and learn endoscopy techniques, including “unique approaches ... [that] overcome the challenges of standard scope sizes and accessibility.” At the institutional level, opportunities to affect positive changes for women trainees include “formal education on the benefits of hands-on learning and encouraging explicit and open communication between parties regarding invitation to, comfort with, and type of physical contact prior to a case.”
After fellowship, early-career gastroenterologists should scrutinize contracts for details on pay and research support, and they should ideally join a practice that either already has many women physicians on staff, or that ensures salary transparency and has “parental leave policies that are compatible with [applicants’] personal and professional goals.” But the experts advocated caution about part-time positions, which may purport to offer more flexibility but turn into full-time work for part-time pay and can preclude participation in practice management.
The experts recommended midcareer female gastroenterologists call out their own achievements rather than waiting for recognition, “actively seek promotion and tenure,” negotiate their salaries (as men tend to do routinely), and think twice before accepting professional roles that are uncompensated or do not clearly promote career advancement.
Senior gastroenterologists have unique opportunities to spearhead changes in institutional policies and practices, according to the experts. Specific examples include “explicitly stating [in job listings] that salary is negotiable, creating transparent written compensation plans, and conducting audits of job offers” to help mitigate any inequities in pay or hiring practices. In addition, senior women gastroenterologists can mentor individual women in the field, implement formal trainings on implicit bias, ensure that their practice or department tracks the gender of gastroenterologists who join, leave, or are promoted.
The experts did not report receiving funding for the work. They reported having no conflicts of interest.
Gastroenterology is a male-dominated field; women represent only 18% of current practicing gastroenterologists. Fortunately more women are entering medicine, including our field of gastroenterology, with current statistics showing that 39% of fellows are women. There have been historical barriers to women’s entry into the gastroenterology field, but thanks to the efforts of great female leaders in gastroenterology and men who are allies of women in our field, we have seen some of these barriers start to weaken. However, there is much work yet to be done. In fact, many would argue our work is just beginning.

Hopefully we will all learn something from Bernica and colleagues’ important piece and continue to sponsor and encourage women to practice this great field so that someday our workforce will look more like the patients we are caring for.
Laura E. Raffals, MD, is with the department of gastroenterology and hepatology at Mayo Clinic, Rochester, Minn. She has no conflicts of interest.
Gastroenterology is a male-dominated field; women represent only 18% of current practicing gastroenterologists. Fortunately more women are entering medicine, including our field of gastroenterology, with current statistics showing that 39% of fellows are women. There have been historical barriers to women’s entry into the gastroenterology field, but thanks to the efforts of great female leaders in gastroenterology and men who are allies of women in our field, we have seen some of these barriers start to weaken. However, there is much work yet to be done. In fact, many would argue our work is just beginning.
Hopefully we will all learn something from Bernica and colleagues’ important piece and continue to sponsor and encourage women to practice this great field so that someday our workforce will look more like the patients we are caring for.
Laura E. Raffals, MD, is with the department of gastroenterology and hepatology at Mayo Clinic, Rochester, Minn. She has no conflicts of interest.
The gender gap in gastroenterology persists – currently, women constitute 39% of fellows, but only 22% of senior AGA members and less than 18% of all practicing gastroenterologists – and it has gained even greater significance within the “current historical moment” of the COVID pandemic and growing cognizance of systemic sexism and racism, according to experts.
During the pandemic, women have been more likely to stay home to care for ill family members and children affected by school closures, which increases their already disproportionate share of unpaid work, wrote Jessica Bernica, MD, of Baylor College of Medicine in Houston with her associates in Techniques and Innovations in Gastrointestinal Endoscopy. They noted that, according to one study, this “holds true for female physicians, who despite their more privileged positions, also experience higher demands at home, impacting their ability to contribute to teaching, service, and research.”
At the same time, the pandemic has brought into focus which jobs are “truly essential” – and that they are “overwhelmingly [held] by women and people of color, who are often underpaid and undervalued,” the experts wrote. The growing focus on systemic racism has also increased awareness of the chronic gender discrimination faced by female minorities, as well as by women in general, they added. In the field of gastroenterology, inherent gender bias – both systemic and self-directed – can bar women from advancing beginning as early as medical school.
To help address these issues, the experts outlined key opportunities for change as women navigate professional “forks in the road” throughout their careers.
Throughout their careers
During medical school and residency, women can specifically request gastroenterology rotations (“ideally with both inpatient and outpatient exposure”), attend society conferences, participate in research themselves, and join a research track or serve as chief medical resident. When applying for gastroenterology fellowships, they can prioritize programs with female faculty, which were recently found to be more likely to hire female fellows.
During fellowship, women can avail themselves of female mentors, who can help them strategize about ways to address gender bias, connect with GI groups and societies, and learn endoscopy techniques, including “unique approaches ... [that] overcome the challenges of standard scope sizes and accessibility.” At the institutional level, opportunities to affect positive changes for women trainees include “formal education on the benefits of hands-on learning and encouraging explicit and open communication between parties regarding invitation to, comfort with, and type of physical contact prior to a case.”
After fellowship, early-career gastroenterologists should scrutinize contracts for details on pay and research support, and they should ideally join a practice that either already has many women physicians on staff, or that ensures salary transparency and has “parental leave policies that are compatible with [applicants’] personal and professional goals.” But the experts advocated caution about part-time positions, which may purport to offer more flexibility but turn into full-time work for part-time pay and can preclude participation in practice management.
The experts recommended midcareer female gastroenterologists call out their own achievements rather than waiting for recognition, “actively seek promotion and tenure,” negotiate their salaries (as men tend to do routinely), and think twice before accepting professional roles that are uncompensated or do not clearly promote career advancement.
Senior gastroenterologists have unique opportunities to spearhead changes in institutional policies and practices, according to the experts. Specific examples include “explicitly stating [in job listings] that salary is negotiable, creating transparent written compensation plans, and conducting audits of job offers” to help mitigate any inequities in pay or hiring practices. In addition, senior women gastroenterologists can mentor individual women in the field, implement formal trainings on implicit bias, ensure that their practice or department tracks the gender of gastroenterologists who join, leave, or are promoted.
The experts did not report receiving funding for the work. They reported having no conflicts of interest.
FROM TECHNIQUES AND INNOVATIONS IN GASTROINTESTINAL ENDOSCOPY
In the previous year, 70% of oncologists reported sexual harassment
A new survey of sexual harassment among U.S. oncologists has found that 70% reported incidents from peers and/or supervisors in the previous 12 months.
The incidence was higher among women than men (80% vs. 56%), a difference that was statistically significant (P < .0001).
However, after experiencing sexual harassment from coworkers, men and women were alike in terms of reporting similarly negative outcomes in mental health, sense of safety, and turnover intentions (e.g., leaving or quitting).
“Our findings demonstrate that the impact of sexual harassment on both men and women is tangible and is not different,” said lead author Ishwaria Subbiah, MD, a medical oncologist at the University of Texas MD Anderson Cancer Center, Houston, during her presentation of the study on June 5 at the American Society of Clinical Oncology (ASCO) 2021. The meeting was held virtually because of the pandemic.
“The survey’s recall period [about harassment] was in the previous 12 months. The respondents weren’t reflecting on a lifetime of events,” Dr. Subbiah said in an interview. “That’s part of what makes the findings that much more sobering.”
The release of the survey results roughly coincided with a furor within oncology circles over details that have now come to light about Axel Grothey, MD, a high-profile medical oncologist who was forced out of the Mayo Clinic in Rochester, Minn., after having unethical sexual relations with mentees – only to move on to another major center with more mentees.
The new survey, which included 153 women and 118 men, was conducted in 2020.
Overall, 69% of respondents reported gender-based harassment, 17% reported unwanted sexual attention, and 3% reported sexual coercion from peers/supervisors. For the three types of sexual harassment, women reported higher rates of incidence; the greatest proportional disparity was in unwanted sexual attention (22% of women vs. 9% of men).
The types of sexual harassment are defined in a landmark 2018 report from the National Academies of Sciences, Engineering, and Medicine. Gender harassment is nonverbal or verbal behaviors that are hostile, objectifying, and excluding of or conveying second-class status about a gender. Unwanted sexual attention is advances, including touching, and seeking a sexual relationship despite discouragement. Sexual coercion involves seeking compliance with sexual demands by making job-related threats or promising job-related benefits.
The commonality in the three harassments is their being “unwanted,” Dr. Subbiah explained.
Another commonality is that “sexual harassment is a tool of power that one person yields over another,” commented Marina Stasenko, MD, a gynecologic oncologist at NYU Langone’s Perlmutter Cancer Center.
Dr. Stasenko led a 2018 study that found that 64% of U.S. gynecologic oncologists reported sexual harassment during training or practice, a much longer recall period than the 1 year in Dr. Subbiah’s study.
However, things may be changing regarding sexual harassment – at least in terms of victims speaking out, said Dr. Stasenko. Perhaps discussing personal experience “is becoming less taboo,” she told this news organization. “The media spotlight on sexual harassment within medicine has been bright [recently].”
That was borne out last week – a number of oncologists who had been harassed told their stories on Twitter in reaction to the report about Dr. Grothey at one of America’s top medical centers. Also, in another sign of the moment, an academic oncologist publicly said that rumors about Dr. Grothey were long-standing. “Heard from many colleagues that this behavior was known in the field and went on for years. Years,” tweeted Charu Aggarwal, MD, MPH, from the University of Pennsylvania, Philadelphia.
Other outcomes seem to make Dr. Grothey’s behavior at Mayo, which multiple oncologists said has occurred at every center, a watershed moment. Namely, he has been muted or dismissed by an array of organizations since the story broke.
ASCO disallowed Dr. Grothey from making presentations at the annual meeting (he was an author on 12 studies), the National Cancer Institute removed him from his position as co-chair of an influential steering committee that helps determine grant funding for research, and the OneOncology community care network dropped him as medical director of their research arm, as reported by The Cancer Letter. He was also removed from the OncoAlert Network, a global network of oncology professionals, and from the medical advisory board of Fight CRC, an advocacy group for patients with colorectal cancer, as reported by this news organization. His current employer, West Cancer Center, in Germantown, Tennessee, has also started an investigation.
In her presentation, Dr. Subbiah acknowledged a changing landscape, with “increasing attention in recent years” to sexual harassment thanks to the “broader cultural movements” of #metoo and #TIMESUP social media–based campaigns.
Another oncologist nodded to the recent news about Dr. Grothey at the Mayo Clinic and suggested Dr. Subbiah’s study was part of a historic struggle for equity for women. “Sadly, both timely and timeless,” tweeted medical oncologist Tatiana Prowell, MD, of Johns Hopkins University, Baltimore, about the new study.
Academia has a problem
To conduct their survey, Dr. Subbiah and her coinvestigators reached out to 1,000 randomly selected U.S. members of ASCO via the organization’s research survey pool, as well as through Twitter and Facebook. The invitation to participate described the survey as being about the “workplace experience of oncologists” and that it aimed to mitigate response bias.
Of the 271 survey respondents, 250 were oncologists in practice and 21 were residents/fellows. Nearly all were heterosexual (94%) and U.S. citizens (87%). A majority (53%) were White, 35% were Asian/Pacific Islander, and 11% were Black or Hispanic. Most (68%) were more than 5 years out from training.
Most of the respondents (62%) were from academia.
“There is a big problem of sexual harassment in academic medicine,” said Pamela Kunz, MD, of Yale Cancer Center, New Haven, Conn., who was asked for comment. Dr. Kunz left Stanford University in 2020 after 19 years, citing repeated harassment.
“The institutions tend to protect the brand rather than the victim. Perpetrators are often not disciplined and may leave an institution under cover of a resignation only to go on and receive a better leadership role at another institution,” she said in an interview.
A “revolution” is needed to address the problem, Dr. Kunz said, citing needs to routinely discuss the topic, systems to measure and track it, methods to hold perpetrators accountable, and meaningful educational opportunities.
Harassment from patients/families also tallied
The new survey also queried participants with regard to sexual harassment from patients and/or families, which was reported by 67% of women and 35% of men (P < .0001).
As with harassment from peers/supervisors, gender harassment was the most common form and was reported by significantly higher percentages of women.
And as with coworkers, sexual harassment from patients/families was also significantly associated with detriments to mental health, workplace safety, and turnover intentions.
Sexual harassment from “insiders” (P = .001) but not patients (P = .55) was significantly associated with a decrease in a fourth metric in the study – job satisfaction.
“The goal of medicine and oncology is ‘ultimately to ease suffering,’” Dr. Subbiah said. That holds true for workplace wellness, including addressing harassment. “There should be no hesitation to go there and look at what is truly impacting the workplace,” she said.
“This is a difficult topic,” Dr. Subbiah acknowledged, adding that “the findings are sobering and merit open, global conversation among all oncology stakeholders.”
The study authors, Dr. Ganz, and Dr. Stasenko have disclosed no relevant financial relationships.
A version of this article first appeared on Medscape.com.
Under new administration, best time to lobby for health care may be now
The ambitious infrastructure bill now being debated in the US Congress might be one of the best immediate opportunities to lobby for legislative or policy changes in delivery of health care during the current Biden administration, according to an analysis delivered at the annual health policy and advocacy conference sponsored by the American College of Chest Physicians.
The infrastructure bill is likely to be pushed forward in the filibuster-proof reconciliation process, which means “that some things might get passed that otherwise would not,” explained Keith S. Studdard, Vice President, Jeffrey J. Kimbell & Associates, Washington, DC.
With few exceptions, the key players in the health care team of President Joe Biden’s new administration are in place, according to Mr. Studdard, who is a lobbyist and health care expert. By moving quickly to fill key positions, the new administration “got off to a good start” for a health care agenda that Mr. Studdard believes will be a focus of the Biden presidency. There is some degree of urgency.
“The amount of time [the Biden administration has] to get their agenda through is fairly limited,” Mr. Studdard reported. The problems include a slim majority of fellow Democrats in the House of Representatives (222 vs 213), no majority of Democrats over Republicans in the Senate (50 vs 50), and mid-term elections that are already looming.
“Midterms historically favor the opposition party,” Mr. Studdard said. He expects party lines to harden as the midterms approach, dissipating the already limited appetite for bipartisan cooperation.
The midterms provide the basis for trying to affect change in advance of legislative gridlock, but the recently announced $2 trillion infrastructure bill is an even more compelling impetus. Infrastructure in this case is not limited to the construction of bridges and roads. Rather, this bill “is a massive package that will almost certainly touch on health care policy,” according to Mr. Studdard.
As the infrastructure bill winds its way through the legislative process, Mr. Studdard expects there will be efforts to include language that favors expansion of services and funding for health care. This includes those related to the Affordable Care Act (ACA) and the temporary modifications permitted under the CARES Act, which was passed during the early months of the COVID-19 pandemic.
For those who think that waivers and exceptions introduced in the CARES Act, such as the expansion of telehealth, should be made permanent, “this will be your main shot on goal,” Mr. Studdard said.
The debates around the ambitious infrastructure bill are “all that we will be hearing about from the legislative standpoint for the next few months,” Mr. Studdard said. He expects major lobbying efforts in regard to this legislation from a vast array of interest groups, not just those with a stake in health care.
If the bill passes, it will likely to be greatly helped by a vote under the reconciliation process. Created in 1974 to allow expedited consideration of spending legislation, the reconciliation process allows bills to be enacted with a simple majority, which is 51 votes in the Senate and 218 votes in the House. Filibustering is not permitted.
This means that the infrastructure bill, like the CARES Act, which was also passed through the reconciliation process, can be made into law even if all 50 Republican senators vote against it. As she has already done three times since taking office—most recently for COVID19 relief bill in early March—Vice President Kamala Harris can break a 50-50 tie with her vote for the administration’s agenda.
Legislation is one of two paths for altering funding and rules regarding health care in the United States. Policy is the other. For reaching decision makers with influence on policy, Mr. Studdard provided a long list of agencies, political appointees, and elected representatives that could be targeted. Many, such as the director of the Centers for Medicare & Medicaid Services (CMS), are well known, but others might be overlooked without a detailed list of the players.
As one example, he pointed to the Center for Medicare and Medicaid Innovation (CMMI), which is a relatively new organization within CMS. Led by Liz Fowler, a former Senate aide involved in writing the ACA, the CMMI has broad authority over several aspects of health policy, such as value-based care.
“The CCMI is something you should put on your radar. It moves with more flexibility than the HHS [Department of Health and Human Services],” Mr. Studdard said.
Mr. Studdard’s detailed overview of the intricacies of how to affect change in health policy and the likely trajectory under the Biden Administration included frequent comments about the traits, background, and goals of the specific decision makers he identified. The implication is that personal relations matter. Mr. Studdard indicated that knowing who to contact is just the first step.
For the Health Policy and Advocacy Committee, this information is critical. In his outline of the numerous paths for influencing health care policy, Mr. Studdard’s comments lead directly to strategies to lobbying goals for CHEST.
“CHEST and its Health Policy and Advocacy Committee are keeping a focus on health care policy to improve access and to improve care for our patients and reduce the burden on our providers,” according to the Chair of the Committee, Neil Freedman, MD, FCCP. Dr, Freedman is the Division Head Pulmonary, Critical Care, Allergy, and Immunology, Northshore University HeatlhSystem, Evanston, Illinois.
“We would hope that, in addition to the proposed infrastructure bill subsidizing some additional costs for the ACA and COBRA [Consolidated Omnibus Budget Reconciliation Act] and enhancing Medicaid eligibility, the bill would also provide some additional funding for the provider relief fund,” he said.
Mr. Studdard or his lobbying firm represent 62 clients with interests in health care policy.
REPORTING FROM THE CHEST HEALTH POLICY AND ADVOCACY CONFERENCE
E/M Coding in 2021: The Times (and More) Are A-Changin’
Effective on January 1, 2021, the outpatient evaluation and management (E/M) codes underwent substantial changes, which were the culmination of multiple years of revision and surveying via the American Medical Association (AMA) Relative Value Scale Update Committee and Current Procedural Terminology (RUC-CPT) process to streamline definitions and promote consistency as well as to decrease the administrative burden for all specialties within the house of medicine.1 These updates represent a notable change from the previous documentation requirements for this oft used family of codes. Herein, we break down some of the highlights of the changes and how they may be applied for some commonly used dermatologic diagnoses.
Time Is Time Is Time
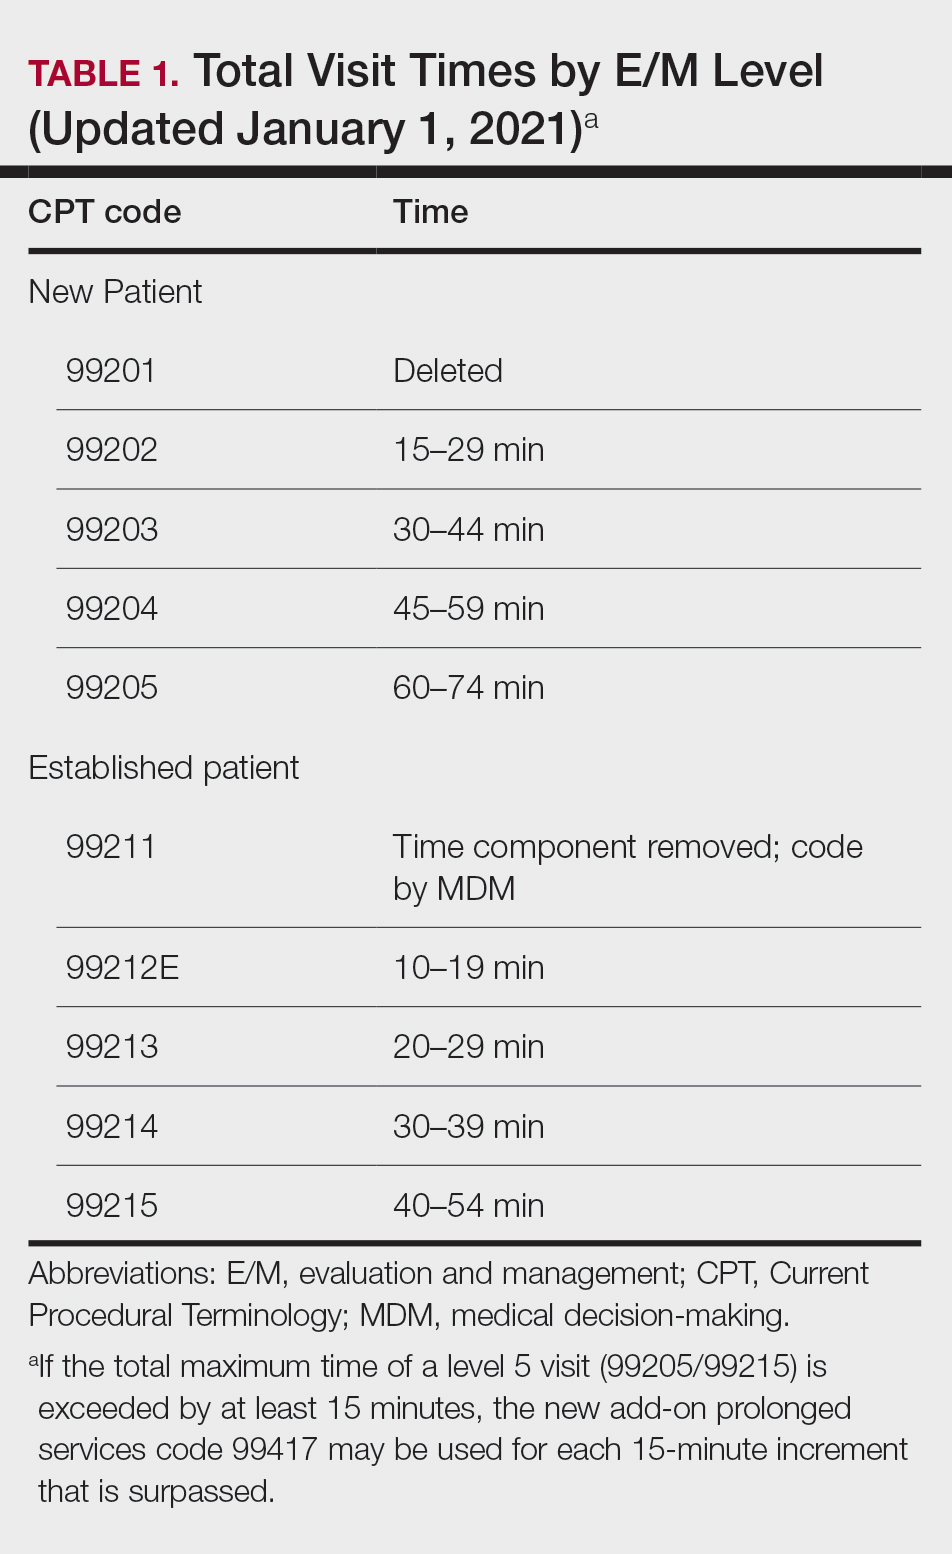
Prior to the 2021 revisions, a physician generally could only code for an E/M level by time for a face-to-face encounter dominated by counseling and/or care coordination. With the new updates, any encounter can be coded by total time spent by the physician with the patient1; however, clinical staff time is not included. There also are now clear guidelines of the time ranges corresponding to the level of E/M,1 as noted in Table 1.
Importantly, time now includes not just face-to-face time with the patient but also any time on the date of the encounter that the physician is involved in the care of the patient when not reported with a separate code. This can include reviewing notes or data before or after the examination, care coordination, ordering laboratory tests, and providing any documentation related to the encounter. Importantly, this applies only when these activities are done on the date of the encounter.
If you work with a nurse practitioner or physician assistant (PA) who assists you and you are the one reporting the service, you cannot double-dip. For example, if your PA spends 10 minutes alone with a patient, you are in the room together for 5 minutes, the PA spends another 10 minutes alone with the patient afterward, and you do chart work for 10 minutes at the end of the day, the total time spent is 35 minutes, not 40 minutes, as you cannot count the time you and the PA spent together twice.
Decisions, Decisions
Evaluation and management coding also can be determined via the level of medical decision-making (MDM). Per the 2021 guidelines, MDM is comprised of 3 categories: (1) number and complexity of problems addressed at the encounter, (2) amount and/or complexity of data to be reviewed or analyzed, and (3) risk of complications and/or morbidity or mortality of patient management.1 To reach a certain overall E/M level, 2 of 3 categories must be met or exceeded. Let’s dive into each of these in a little more detail.
Number and Complexity of Problems Addressed at the Encounter
First, it is important to understand the definition of a problem addressed. Per AMA guidelines, this includes a disease, condition, illness, injury, symptom, sign, finding, complaint, or other matter addressed at the encounter that is evaluated or treated at the encounter by the physician. If the problem is referred to another provider without evaluation or consideration of treatment, it is not considered to be a problem addressed and cannot count toward this first category. An example could be a patient with a lump on the abdomen that you refer to plastic or general surgery for evaluation and treatment.
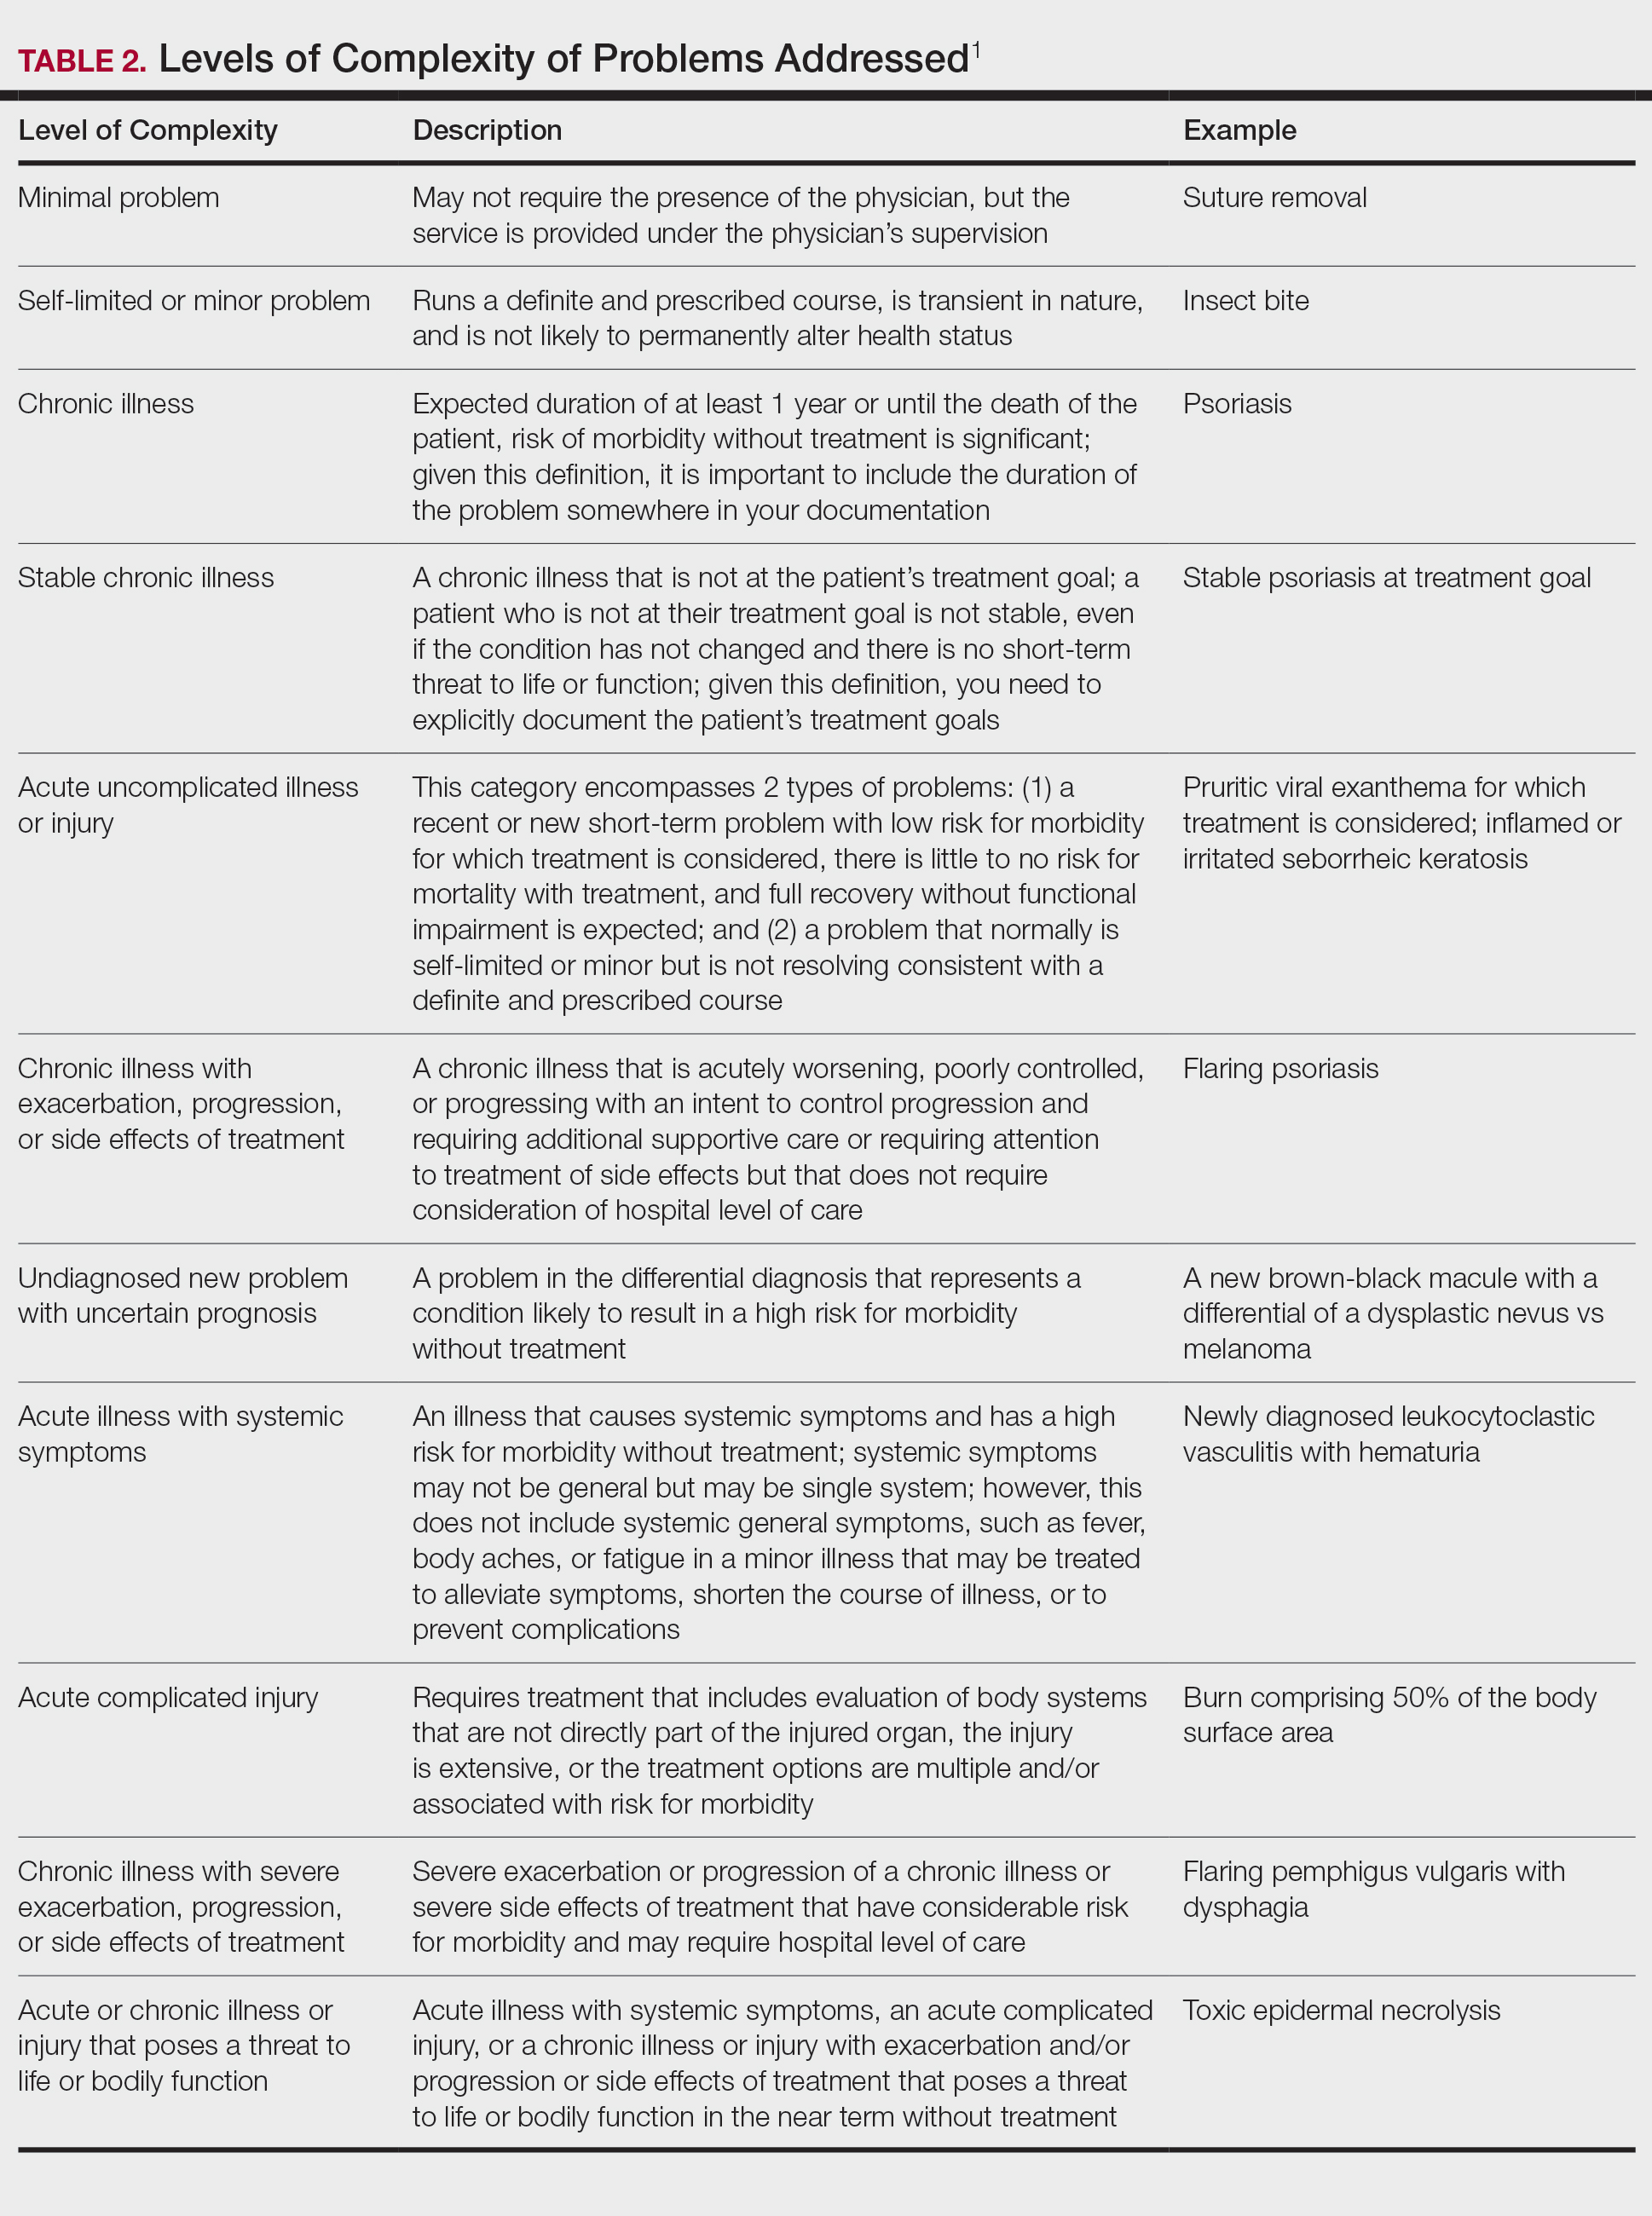
Once you have determined that you are addressing a problem, you will need to determine the level of complexity of the problem, as outlined in Table 2. Keep in mind that some entities and disease states in dermatology may fit the requirements of more than 1 level of complexity depending on the clinical situation, while there are many entities in dermatology that may not be perfectly captured by any of the levels described. In these situations, clinical judgement is required to determine where the problem would best fit. Importantly, whatever you decide, your documentation should support that decision.
Amount and/or Complexity of Data to Be Reviewed and Analyzed
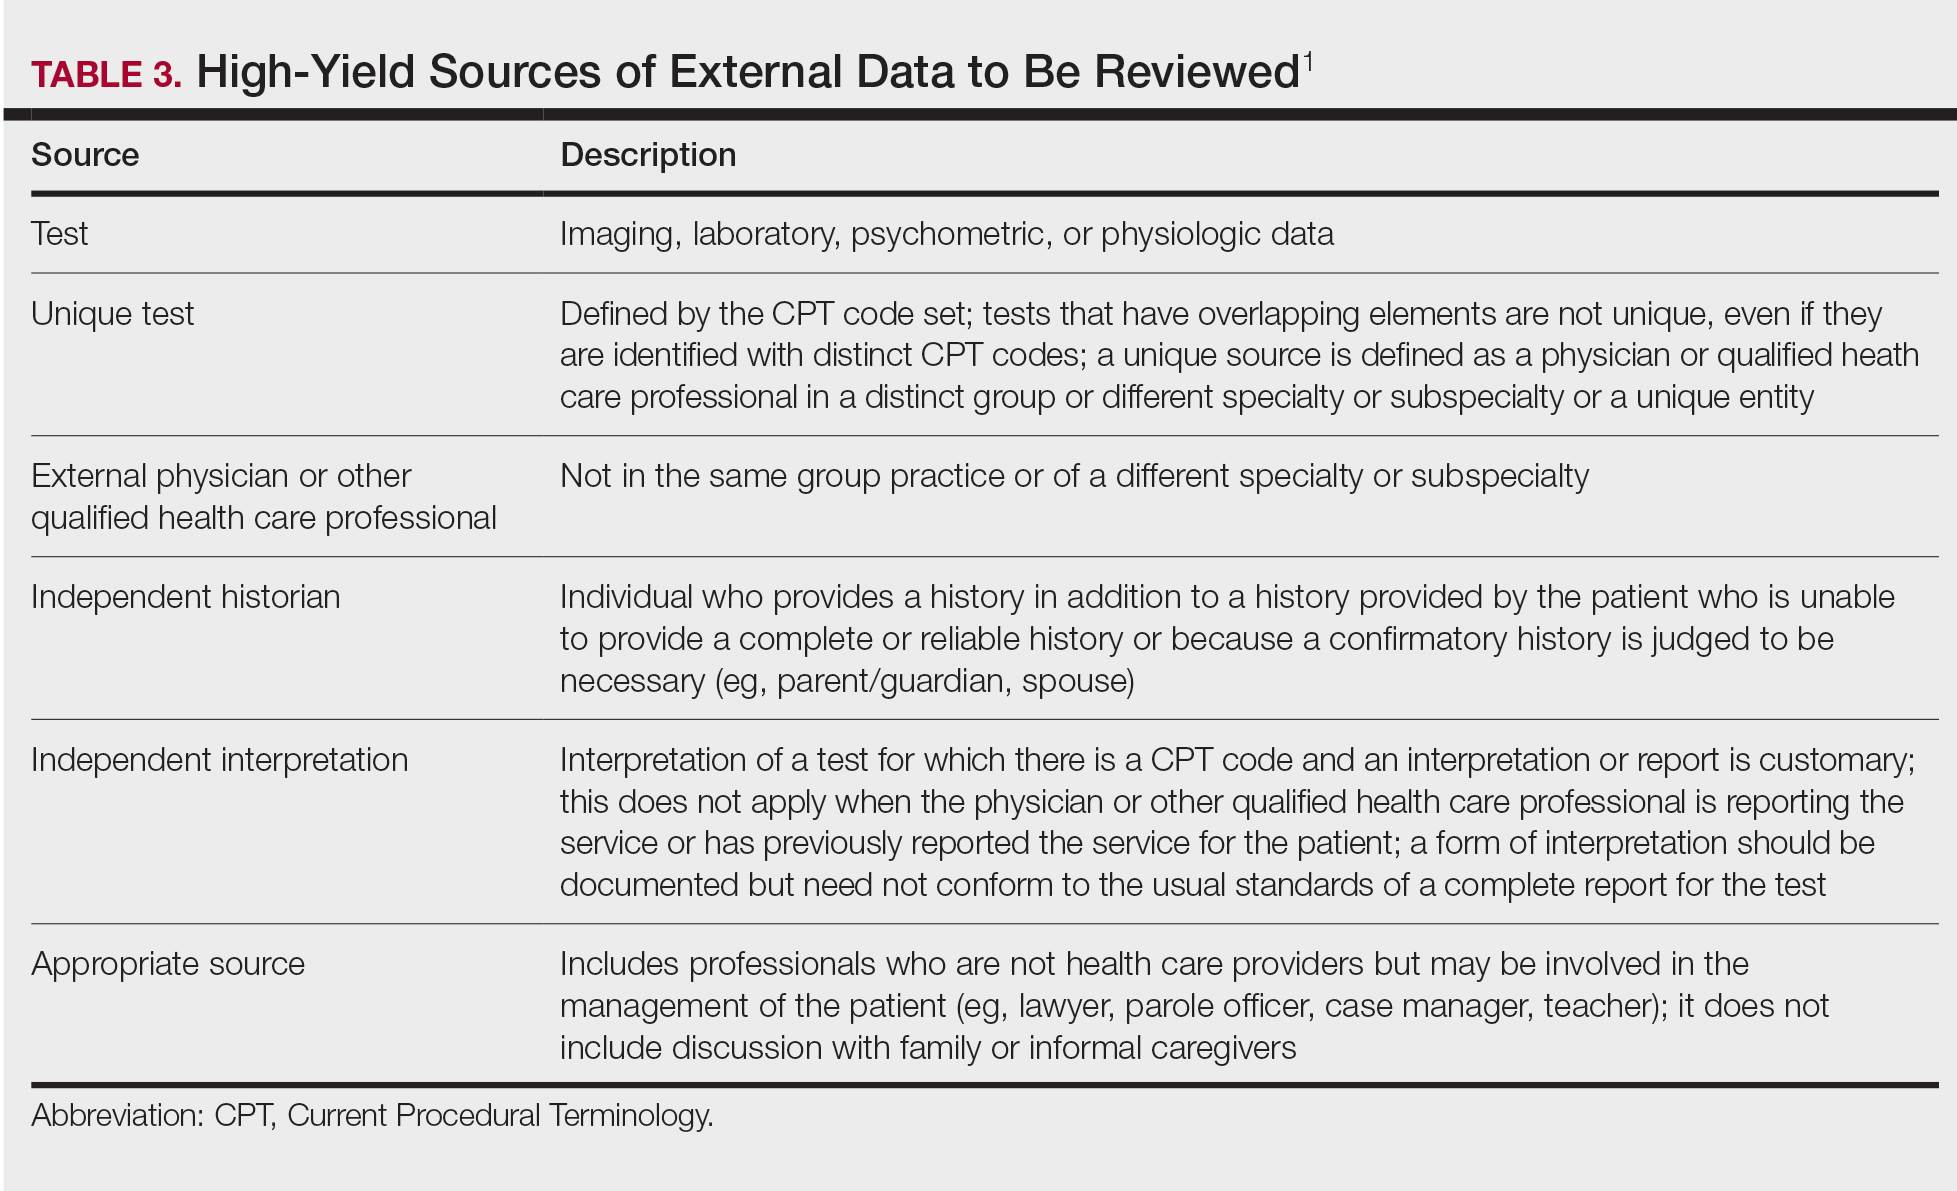
This category encompasses any external notes reviewed, unique laboratory tests or imaging ordered or reviewed, the need for an independent historian or discussion with external health care providers or appropriate sources, or independent interpretation of tests. Some high-yield definitions in this category are outlined in Table 3.
Risk of Complications and/or Morbidity or Mortality of Patient Management
In this category, risk relates to both the patient’s diagnosis and treatment(s). Importantly, for treatment and diagnostic options, these include both the options selected and those considered but not selected. Risk is defined as the probability and/or consequences of an event and is based on the usual behavior and thought processes of a physician in the same specialty. In other words, think of the risk as compared to risk in the setting of other dermatologists diagnosing and/or treating the same condition.
Social determinants of health also play a part in this category and are defined as economic and social conditions that influence the health of individuals and communities. Social determinants of health can be indicated by the specific corresponding International Statistical Classification of Diseases, Tenth Revision code and may need to be included in your billing according to specific institutional or carrier guidelines if they are a factor in your level of MDM.
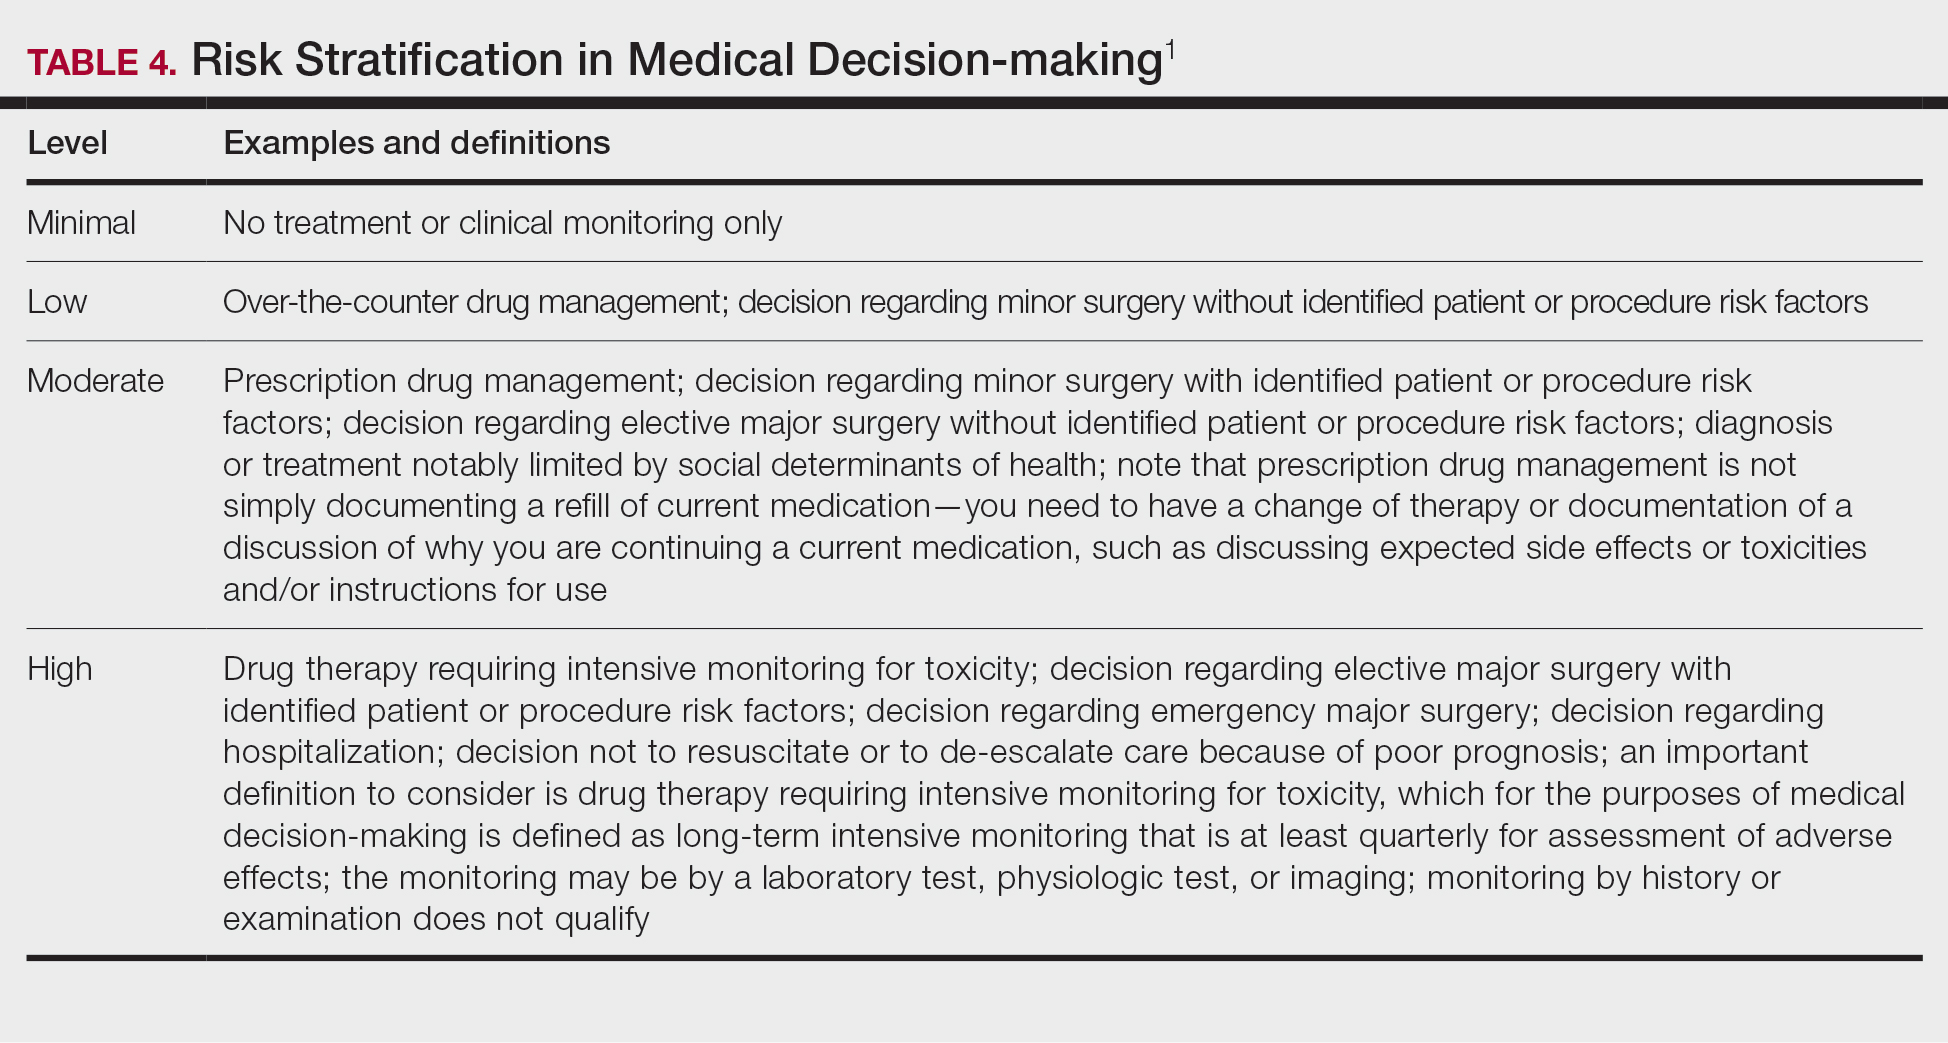
For the purposes of MDM, risk is stratified into minimal, low, moderate, and high. Some examples for each level are outlined in Table 4.
Putting It All Together
Once you have determined each of the above 3 categories, you can put them together into the MDM chart to ascertain the overall level of MDM. (The official AMA medical decision-making grid is available online [https://www.ama-assn.org/system/files/2019-06/cpt-revised-mdm-grid.pdf]). Keep in mind that 2 of 3 columns in the table must be obtained in that level to reach an overall E/M level; for example, a visit that addresses 2 self-limited or minor problems (level 3) in which no data is reviewed (level 2) and involves prescribing a new medication (level 4), would be an overall level 3 visit.
Final Thoughts
The outpatient E/M guidelines have undergone substantial revisions; therefore, it is crucial to understand the updated definitions to ensure proper billing and documentation. History and physical examination documentation must be medically appropriate but are no longer used to determine overall E/M level; time and MDM are the sole options that can be used. Importantly, try to code as accurately as possible, documenting which problems were both noted and addressed. If you are unsure of a definition within the updated changes and MDM table, referencing the appropriate sources for guidance is recommended.
Although representing a considerable shift, the revaluation of this family of codes and the intended decrease in documentation burden has the ability to be a positive gain for dermatologists. Expect other code families to mirror these changes in the next few years.
- American Medical Association. CPT® Evaluation and management (E/M) office or other outpatient (99202-99215) and prolonged services (99354, 99355, 99356, 99417) code and guideline changes. Accessed May 14, 2021. https://www.ama-assn.org/system/files/2019-06/cpt-office-prolonged-svs-code-changes.pdf
Effective on January 1, 2021, the outpatient evaluation and management (E/M) codes underwent substantial changes, which were the culmination of multiple years of revision and surveying via the American Medical Association (AMA) Relative Value Scale Update Committee and Current Procedural Terminology (RUC-CPT) process to streamline definitions and promote consistency as well as to decrease the administrative burden for all specialties within the house of medicine.1 These updates represent a notable change from the previous documentation requirements for this oft used family of codes. Herein, we break down some of the highlights of the changes and how they may be applied for some commonly used dermatologic diagnoses.
Time Is Time Is Time
Prior to the 2021 revisions, a physician generally could only code for an E/M level by time for a face-to-face encounter dominated by counseling and/or care coordination. With the new updates, any encounter can be coded by total time spent by the physician with the patient1; however, clinical staff time is not included. There also are now clear guidelines of the time ranges corresponding to the level of E/M,1 as noted in Table 1.
Importantly, time now includes not just face-to-face time with the patient but also any time on the date of the encounter that the physician is involved in the care of the patient when not reported with a separate code. This can include reviewing notes or data before or after the examination, care coordination, ordering laboratory tests, and providing any documentation related to the encounter. Importantly, this applies only when these activities are done on the date of the encounter.
If you work with a nurse practitioner or physician assistant (PA) who assists you and you are the one reporting the service, you cannot double-dip. For example, if your PA spends 10 minutes alone with a patient, you are in the room together for 5 minutes, the PA spends another 10 minutes alone with the patient afterward, and you do chart work for 10 minutes at the end of the day, the total time spent is 35 minutes, not 40 minutes, as you cannot count the time you and the PA spent together twice.
Decisions, Decisions
Evaluation and management coding also can be determined via the level of medical decision-making (MDM). Per the 2021 guidelines, MDM is comprised of 3 categories: (1) number and complexity of problems addressed at the encounter, (2) amount and/or complexity of data to be reviewed or analyzed, and (3) risk of complications and/or morbidity or mortality of patient management.1 To reach a certain overall E/M level, 2 of 3 categories must be met or exceeded. Let’s dive into each of these in a little more detail.
Number and Complexity of Problems Addressed at the Encounter
First, it is important to understand the definition of a problem addressed. Per AMA guidelines, this includes a disease, condition, illness, injury, symptom, sign, finding, complaint, or other matter addressed at the encounter that is evaluated or treated at the encounter by the physician. If the problem is referred to another provider without evaluation or consideration of treatment, it is not considered to be a problem addressed and cannot count toward this first category. An example could be a patient with a lump on the abdomen that you refer to plastic or general surgery for evaluation and treatment.
Once you have determined that you are addressing a problem, you will need to determine the level of complexity of the problem, as outlined in Table 2. Keep in mind that some entities and disease states in dermatology may fit the requirements of more than 1 level of complexity depending on the clinical situation, while there are many entities in dermatology that may not be perfectly captured by any of the levels described. In these situations, clinical judgement is required to determine where the problem would best fit. Importantly, whatever you decide, your documentation should support that decision.
Amount and/or Complexity of Data to Be Reviewed and Analyzed
This category encompasses any external notes reviewed, unique laboratory tests or imaging ordered or reviewed, the need for an independent historian or discussion with external health care providers or appropriate sources, or independent interpretation of tests. Some high-yield definitions in this category are outlined in Table 3.
Risk of Complications and/or Morbidity or Mortality of Patient Management
In this category, risk relates to both the patient’s diagnosis and treatment(s). Importantly, for treatment and diagnostic options, these include both the options selected and those considered but not selected. Risk is defined as the probability and/or consequences of an event and is based on the usual behavior and thought processes of a physician in the same specialty. In other words, think of the risk as compared to risk in the setting of other dermatologists diagnosing and/or treating the same condition.
Social determinants of health also play a part in this category and are defined as economic and social conditions that influence the health of individuals and communities. Social determinants of health can be indicated by the specific corresponding International Statistical Classification of Diseases, Tenth Revision code and may need to be included in your billing according to specific institutional or carrier guidelines if they are a factor in your level of MDM.
For the purposes of MDM, risk is stratified into minimal, low, moderate, and high. Some examples for each level are outlined in Table 4.
Putting It All Together
Once you have determined each of the above 3 categories, you can put them together into the MDM chart to ascertain the overall level of MDM. (The official AMA medical decision-making grid is available online [https://www.ama-assn.org/system/files/2019-06/cpt-revised-mdm-grid.pdf]). Keep in mind that 2 of 3 columns in the table must be obtained in that level to reach an overall E/M level; for example, a visit that addresses 2 self-limited or minor problems (level 3) in which no data is reviewed (level 2) and involves prescribing a new medication (level 4), would be an overall level 3 visit.
Final Thoughts
The outpatient E/M guidelines have undergone substantial revisions; therefore, it is crucial to understand the updated definitions to ensure proper billing and documentation. History and physical examination documentation must be medically appropriate but are no longer used to determine overall E/M level; time and MDM are the sole options that can be used. Importantly, try to code as accurately as possible, documenting which problems were both noted and addressed. If you are unsure of a definition within the updated changes and MDM table, referencing the appropriate sources for guidance is recommended.
Although representing a considerable shift, the revaluation of this family of codes and the intended decrease in documentation burden has the ability to be a positive gain for dermatologists. Expect other code families to mirror these changes in the next few years.
- American Medical Association. CPT® Evaluation and management (E/M) office or other outpatient (99202-99215) and prolonged services (99354, 99355, 99356, 99417) code and guideline changes. Accessed May 14, 2021. https://www.ama-assn.org/system/files/2019-06/cpt-office-prolonged-svs-code-changes.pdf
- American Medical Association. CPT® Evaluation and management (E/M) office or other outpatient (99202-99215) and prolonged services (99354, 99355, 99356, 99417) code and guideline changes. Accessed May 14, 2021. https://www.ama-assn.org/system/files/2019-06/cpt-office-prolonged-svs-code-changes.pdf
Practice Points
- The outpatient evaluation and management (E/M) codes have undergone substantial changes that took effect January 1, 2021.
- Outpatient E/M visits are now coded based on time or level of medical decision-making (MDM).
- Time now includes all preservice, intraservice, and postservice time the physician spends with the patient on the date of the encounter.
- Many of the key definitions used in order to determine level of MDM have been streamlined and updated.
The doctor house: What to know in 2021
The concept of home ownership has changed for this generation, not only in the logistics of the best way to do it, but also in the desire and demand for owning versus renting. According to the Penn Institute for Urban Research, the U.S. homeownership rate is now at 63.7%, the lowest in 48 years. “Homeownership rates have declined for all demographic age groups. Since 2006, the number of households who own their home in the United States has decreased by 674,000 while the number of renters has increased by over 8 million.”1
But isn’t owning your own home the American dream? Isn’t it a great investment? If we’re looking strictly at the monthly payment numbers, traditionally paying a mortgage is cheaper than paying rent for the same-size home. That became even more true as home prices dropped in 2007-2008 and as interest rates also dropped over the last several years. Then there’s the age-old concept of “building equity” or “throwing away money on rent.” As a financial planner, I get asked all the time about a home as an investment. It certainly can be, like any investment, if you buy and sell at the right time. But something is only an investment if it grows, and you can’t predict if you’re going to buy and sell your house at the right time. The median price of an existing home sold in March 2021 was $329,100. That’s a 17.2% increase from March 2020. Times are certainly crazy right now in the real estate market.
What many people don’t think about are the other costs, and not just financial costs. Today’s generation is more aware of the added stress and burden of maintaining a home and the money you can sink into it for maintenance, let alone remodeling. Then of course there’s the mortgage interest, property taxes, and insurance that you won’t have with a rental. Lastly, the biggest reason today’s generation is choosing to rent more and more is the flexibility. They want to be more mobile, able to get up and move without having to worry about listing, selling, and possibly owing more than the house is worth, and being stuck. We saw this with many residents that bought a home during residency and then tried to sell when they landed their first job, only to find out they owed more than it was worth because of the real estate market collapse of 2008. Approximately 50% of physicians will leave their first job within 1-3 years, so it’s a gamble that you’ll be able to sell your house when you want to for the price you need.
But what are the benefits of buying? First, there is the age-old argument of building equity. If you stay in your house long enough, and plan to sell it when you retire and downsize, it can definitely be an investment. If you keep a mortgage long enough, eventually you’ll pay it off, and have no payment. Mortgage interest is also tax-deductible. Lastly, there are the intangibles – like being able to put down roots, build a community, and have the ability to remodel and customize your home, a feature not usually available when renting.
Now that I’ve effectively talked you out and back in again, what’s the best way to go about buying a house in today’s crazy market? We’ve seen houses list and sell within a day and get multiple offers well over asking price. It’s a very difficult time to buy, but there are ways to make it easier. First, be clear on what you want in a house, especially location. There’s nothing worse than buyer’s remorse in your primary residence, and that happens more these days when people have to quickly make a decision. Find a good, fee-based financial planner to help you decide how much house fits in your budget and your long-term goals. You’d be surprised how easily we can talk ourselves into paying much more than we had originally decided. Use your financial planner to help avoid emotions getting involved and creeping up your price (especially when multiple offers are involved). A good rule of thumb is for a housing payment to be no more than 33% of your take-home income. This includes principal, interest, and taxes. Or, many planners will use the “2x income” rule of thumb. So if you make $300,000, don’t go over $600,000. Although with today’s low interest rates, there is some more wiggle room on that. Next, get a good referral from someone you trust in looking for a realtor. Real estate is a commission-based job and can have some potential conflicts of interest, so getting a recommendation can help. Or, there are realtors who will work for a flat fee, regardless of how much you pay for a house. That can help reduce the conflict.
You made the offer, you beat out the other bids, and you’re getting a house! How are you paying for it? Hopefully, you already got preapproved. This means finding a good, reputable mortgage professional. Get referrals, shop around, and take your time. Get multiple quotes before you start the underwriting process. They shouldn’t have to pull your credit to give you a fairly accurate estimate of what interest rate you’ll qualify for. Usually, they will give you fixed and variable interest quotes. I normally recommend fixed interest. Because interest rates are so low right now, they’re only going to go up in the future, and if you have a variable rate loan, your payment will go up as interest rates rise.
Is a physician loan a good idea? Depending on your circumstance, it can often be a good deal. Most new attendings don’t have cash saved up for a down payment, and these often don’t require one. And the other big benefit is that they won’t consider your student loan payments when calculating your debt-to-income ratio. Mortgage lenders will look at how much other debt you have when determining an approval. And a conventional mortgage will take your student loan payments into consideration, which means you’ll qualify for a much lower payment and purchase price. In my experience, you want a credit score of around 700 or higher to qualify for these types of loans. The only downside of a physician mortgage is the rates are slightly higher. I encourage you to start the application process early; they’re taking upward of 90 days lately.
As the mortgage is being processed, you’ll have an inspection and appraisal, and as long as those are all favorable, you’re in! Now, should you take any surplus income each month and pay extra on your mortgage to pay it down sooner, or invest it? Everyone’s situation is different, but a good rule of thumb is to look at interest rates on the debt you want to pay off versus expected rate of return on the potential investment. For example, if you have extra money, should you invest it in an SP500 index fund that historically gets 8%-12% per year, or put it on the principal of your mortgage that has an interest rate of 3%? Assuming no other factors or goals, and you just want the best bang for your buck, my money would go toward the investment getting 8%-12% over saving 3% on my mortgage.
Take your time, do your research, and find good professionals. There’s no right answer for everyone, but there are certainly some good practices when walking through the first home decision. Here at FinancialMD, we only work with physicians, and we’re happy to chat if you want some guidance on this. Send me an email and subscribe to our weekly Didactic Minute videos on YouTube for more financial tips for young physicians. Good luck!
Mr. Solitro is a financial planner and CEO of FinancialMD. He has no other conflicts of interest.
Investment advisory services offered through FinancialMD, a registered investment adviser. Registration as an investment adviser does not imply a certain level of skill or training. This article is provided for informational purposes only and nothing contained herein should be construed as a solicitation to buy or sell any products. Advisory services are offered only to clients and prospective clients in places where FinancialMD and its investment adviser representatives are registered or exempt from registration. Investing involves the risk of loss of principal. Past performance is no guarantee of future performance and no investment strategy can guarantee a profit or protect against loss.
This article was updated June 8, 2021.
Reference
1. Wachter S and Acolin A. Owning or Renting in the US: Shifting Dynamics of the Housing Market. Penn Institute for Urban Research. 2016 May.
Relationship-Centered Care in the Physician-Patient Interaction: Improving Your Understanding of Metacognitive Interventions
Communication and relationships cannot be taken for granted, particularly in the physician-patient relationship, where life-altering diagnoses may be given. With one diagnosis, someone’s life may be changed, and both physicians and patients need to be cognizant of the importance of a strong relationship and clear communication.
In the current US health care system, both physicians and patients often are not getting their needs met, and studies that include factors of race, ethnicity, and socioeconomic status suggest that physician-patient relationship barriers contribute to racial disparities in health care.1,2 Although patient-centered care is a widely recognized and upheld model, relationship-centered care between physician and patient involves focusing on the patient and the physician-patient relationship through recognizing personhood, affect (being empathic), and reciprocal influence.3,4 Although it is not necessarily intuitive because it can appear to be yet another task for busy physicians, relationship-centered care improves health care delivery for both physicians and patients through decreased physician burnout, reduced medical errors, and better patient outcomes and satisfaction.5,6
Every physician, patient, and physician-patient relationship is different; unlike the standard questions directed at a routine patient history focused on gathering data, there is no one-size-fits-all relationship-centered conversation.7-10 As with any successful interaction between 2 people, there is a certain amount of necessary self-awareness (Table 1)11 that allows for improvisation and appropriate responsiveness to what is seen, heard, and felt. Rather than attending solely to disease states, the focus of relationship-centered care is on patients, interpersonal interaction, and promoting health and well-being.15
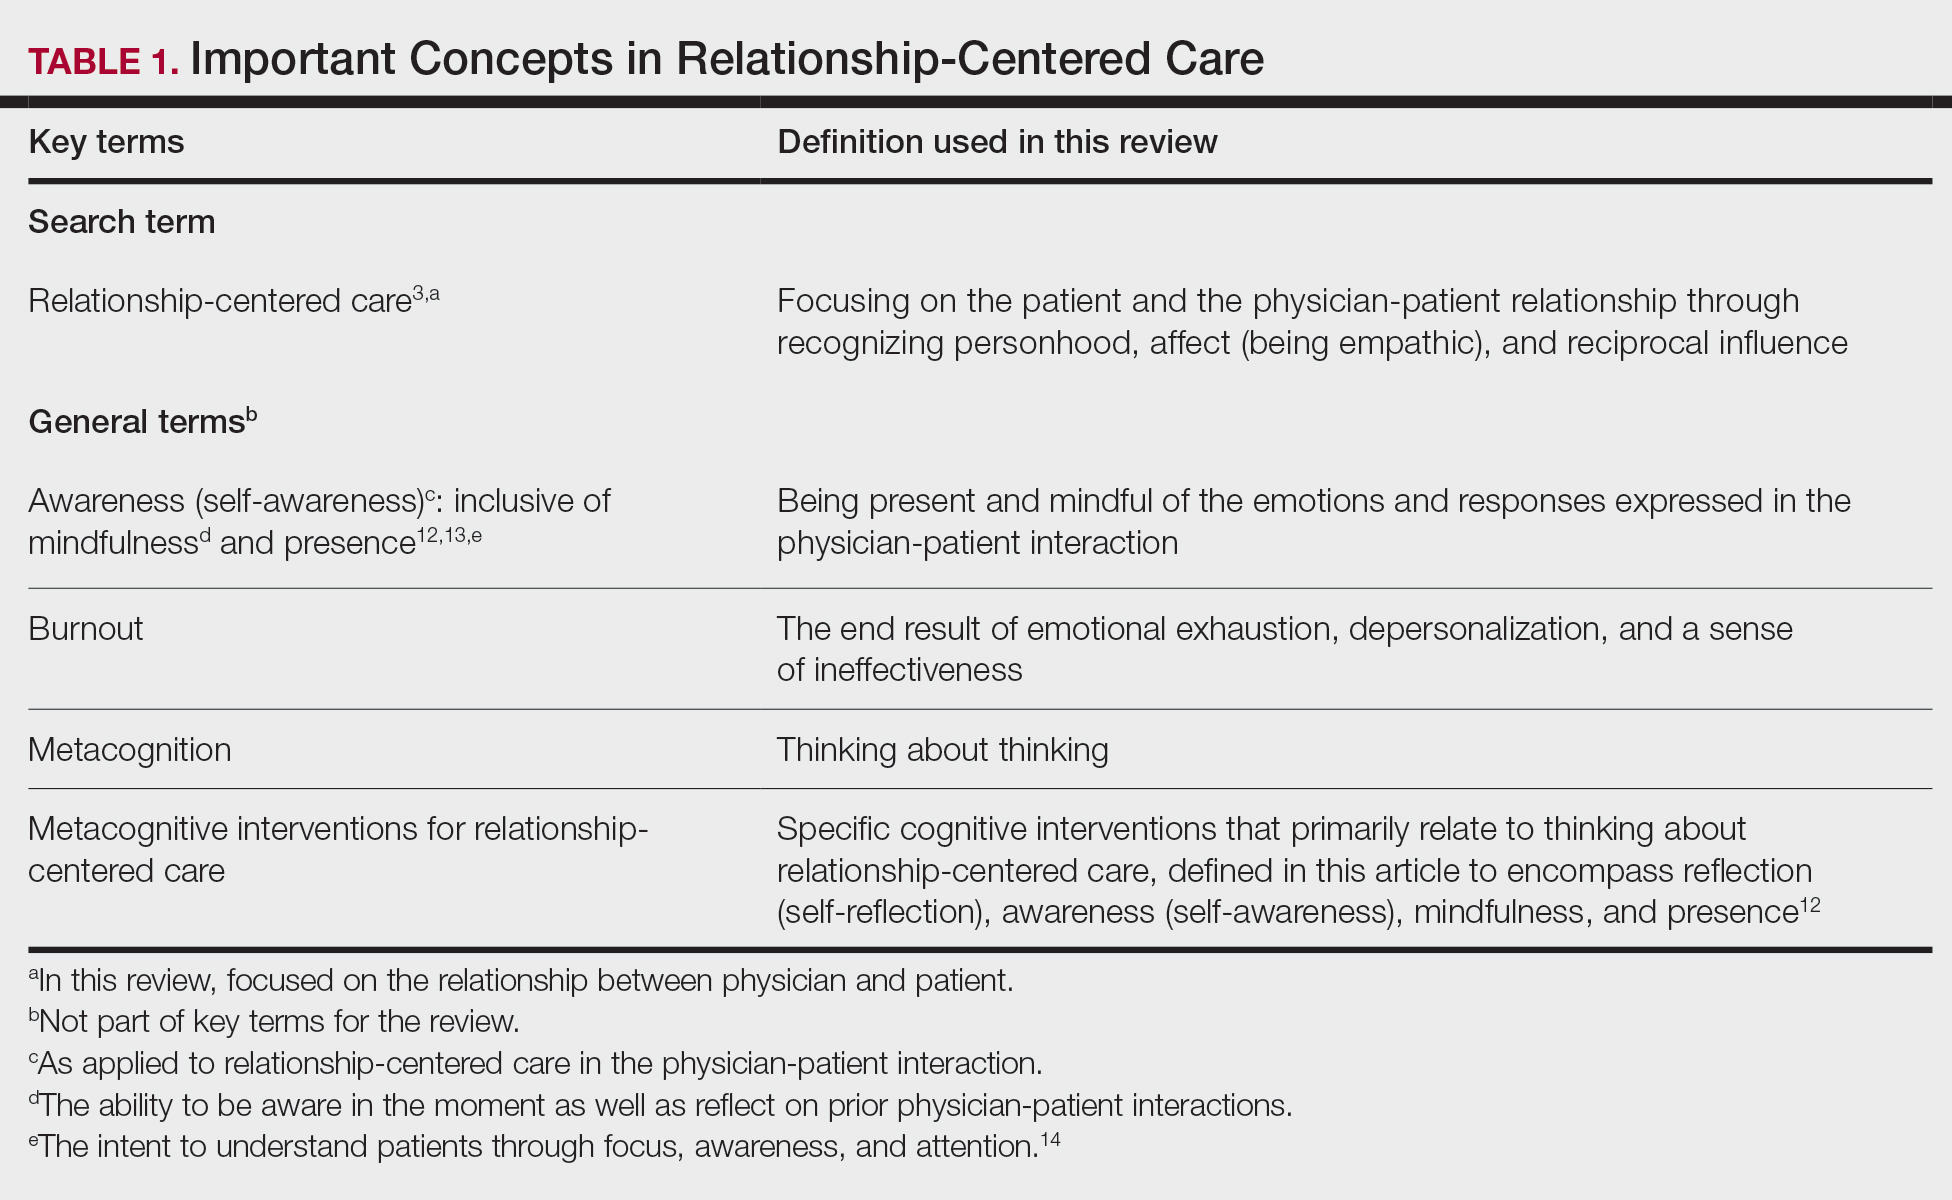
This review summarizes the existing literature on relationship-centered care, introduces the use of metacognition (Table 1), and suggests creating simple habits to promote such care. The following databases were searched from inception through November 23, 2020, using the term relationship-centered care: MEDLINE (Ovid), EMBASE (Ovid), APA PsycInfo (Ovid), Scopus, Web of Science Core Collection, CINAHL Complete (EBSCO), Academic Search Premier (EBSCOhost), and ERIC (ProQuest). A total of 1772 records were retrieved through searches, and after deduplication of 1116 studies, 350 records were screened through a 2-part process. Articles were first screened by title and abstract for relevance to the relationship between physician and patient, with 185 studies deemed irrelevant (eg, pertaining to the relationship of veterinarian to animal). The remaining 165 studies were assessed for eligibility, with 69 further studies excluded for various reasons. The screening process resulted in 96 articles considered in this review.
Definitions/key terms, as used in this article, are listed in Table 1.
Background of Relationship-Centered Care
Given time constraints, the diagnosis and treatment of medical problems often are the focus of physicians. Although proper medical diagnosis and treatment are important, and their delivery is made possible by the physician having the appropriate knowledge, a physician-patient relationship that focuses solely on disease without acknowledging the patient creates a system that ultimately neglects both patients and physicians.15 This prevailing physician-patient relationship paradigm is suboptimal, and a proposed remedy is relationship-centered care, which focuses on relationships among the human beings in health care interactions.3 Relationship-centered care has 4 principles: (1) the personhood of each party must be recognized, (2) emotion is part of relationships, (3) relationships are reciprocal and not just one way, and (4) creating these types of relationships is morally valuable3 and beneficial to patient care.16
Assessment of the Need for Relationship-Centered Care
Relationship-centered care has been studied in physician-patient interactions in various health care settings.17-23 For at least 2 decades, relationship-centered care has been set forth as a model,4,24,25 but there are challenges. Physicians tend to overrate or underrate their communication skills in patient interactions.26,27 A given physician’s preferences often still seem to supersede those of the patient.3,28,29 The impetus to develop relationship-centered care skills generally needs to be internally driven,4,30 as, ultimately, physicians and patients have varying needs.4,31 However, providing physicians with a potential structure is helpful.32
A Solution: Metacognition in the Physician-Patient Interaction
Metacognition is important to integrating basic science knowledge into medical learning and practice,33,34 and it is no less important in translating interpersonal knowledge to the physician-patient interaction. Decreased metacognitive effort35 may underpin the decline in empathy seen with increasing medical training.36,37 Understanding how metacognitive practices foster relationship-centered care is important for teaching, developing, and maintaining that care.
Metacognition is already embedded in the fabric of the physician-patient interaction.33,34 The complex interplay of the physician-patient interview, patient examination, and integration of physical as well as ancillary data requires higher-order thinking and the ability to parse out that thinking successfully. As a concrete example, coming to a diagnosis requires thinking about what has been presented during the physician-patient interaction and considering what supports and suggests the disease while a list of potential differential diagnosis alternatives is being generated. Physicians are trained to apply this clinical reasoning approach to their patient care.
Conversely, although communication skills are a key component of doctoring,38 both between physician and patient as well as among other colleagues and staff, many physicians have never received formal training in communication skills,26,32,39 though it is now an integral part of medical school curricula.40 When such training is mandatory, less than 1% of physicians continue to believe that there was no benefit, even from a single 8-hour communications skills training session.41 Communication cannot be taught comprehensively in 8 hours; thus, the benefit of such training may be the end result of metacognition and increased self-awareness (Table 1).42,43
Building Relationship-Centered Care Through Metacognitive Attention
Metacognition as manifested by such self-awareness can build relationship-centered care.4 Self-awareness can be taught through mentorship or role models.44 Journaling,40 meditation, and appreciation of beauty and the arts45 can contribute, as well as more formal training programs,32,38,42 as offered by the Academy of Communication in Healthcare. Creating opportunities for patient empowerment also supports relationship-centered care, as does applying knowledge of implicit bias.46
Even without formal training, relationship-centered care can be built through attention to cues9—visual (eg, sitting down, other body language),47,48 auditory (eg, knocking, language, tone, conversational flow),48,49 and emotional (eg, clinical empathy, emotional intelligence)(Table 2). Such attention is familiar to everyone, not just physicians or patients, through interactions outside of health care; inattention may be due to the hidden curriculum or culture of medicine40 as well as real-time changes, such as the introduction of the electronic health record.51 Inattention to these cues also may be a result of context-specific knowledge, in which a physician’s real-life communication skills are not applied to the unique context of patient care.
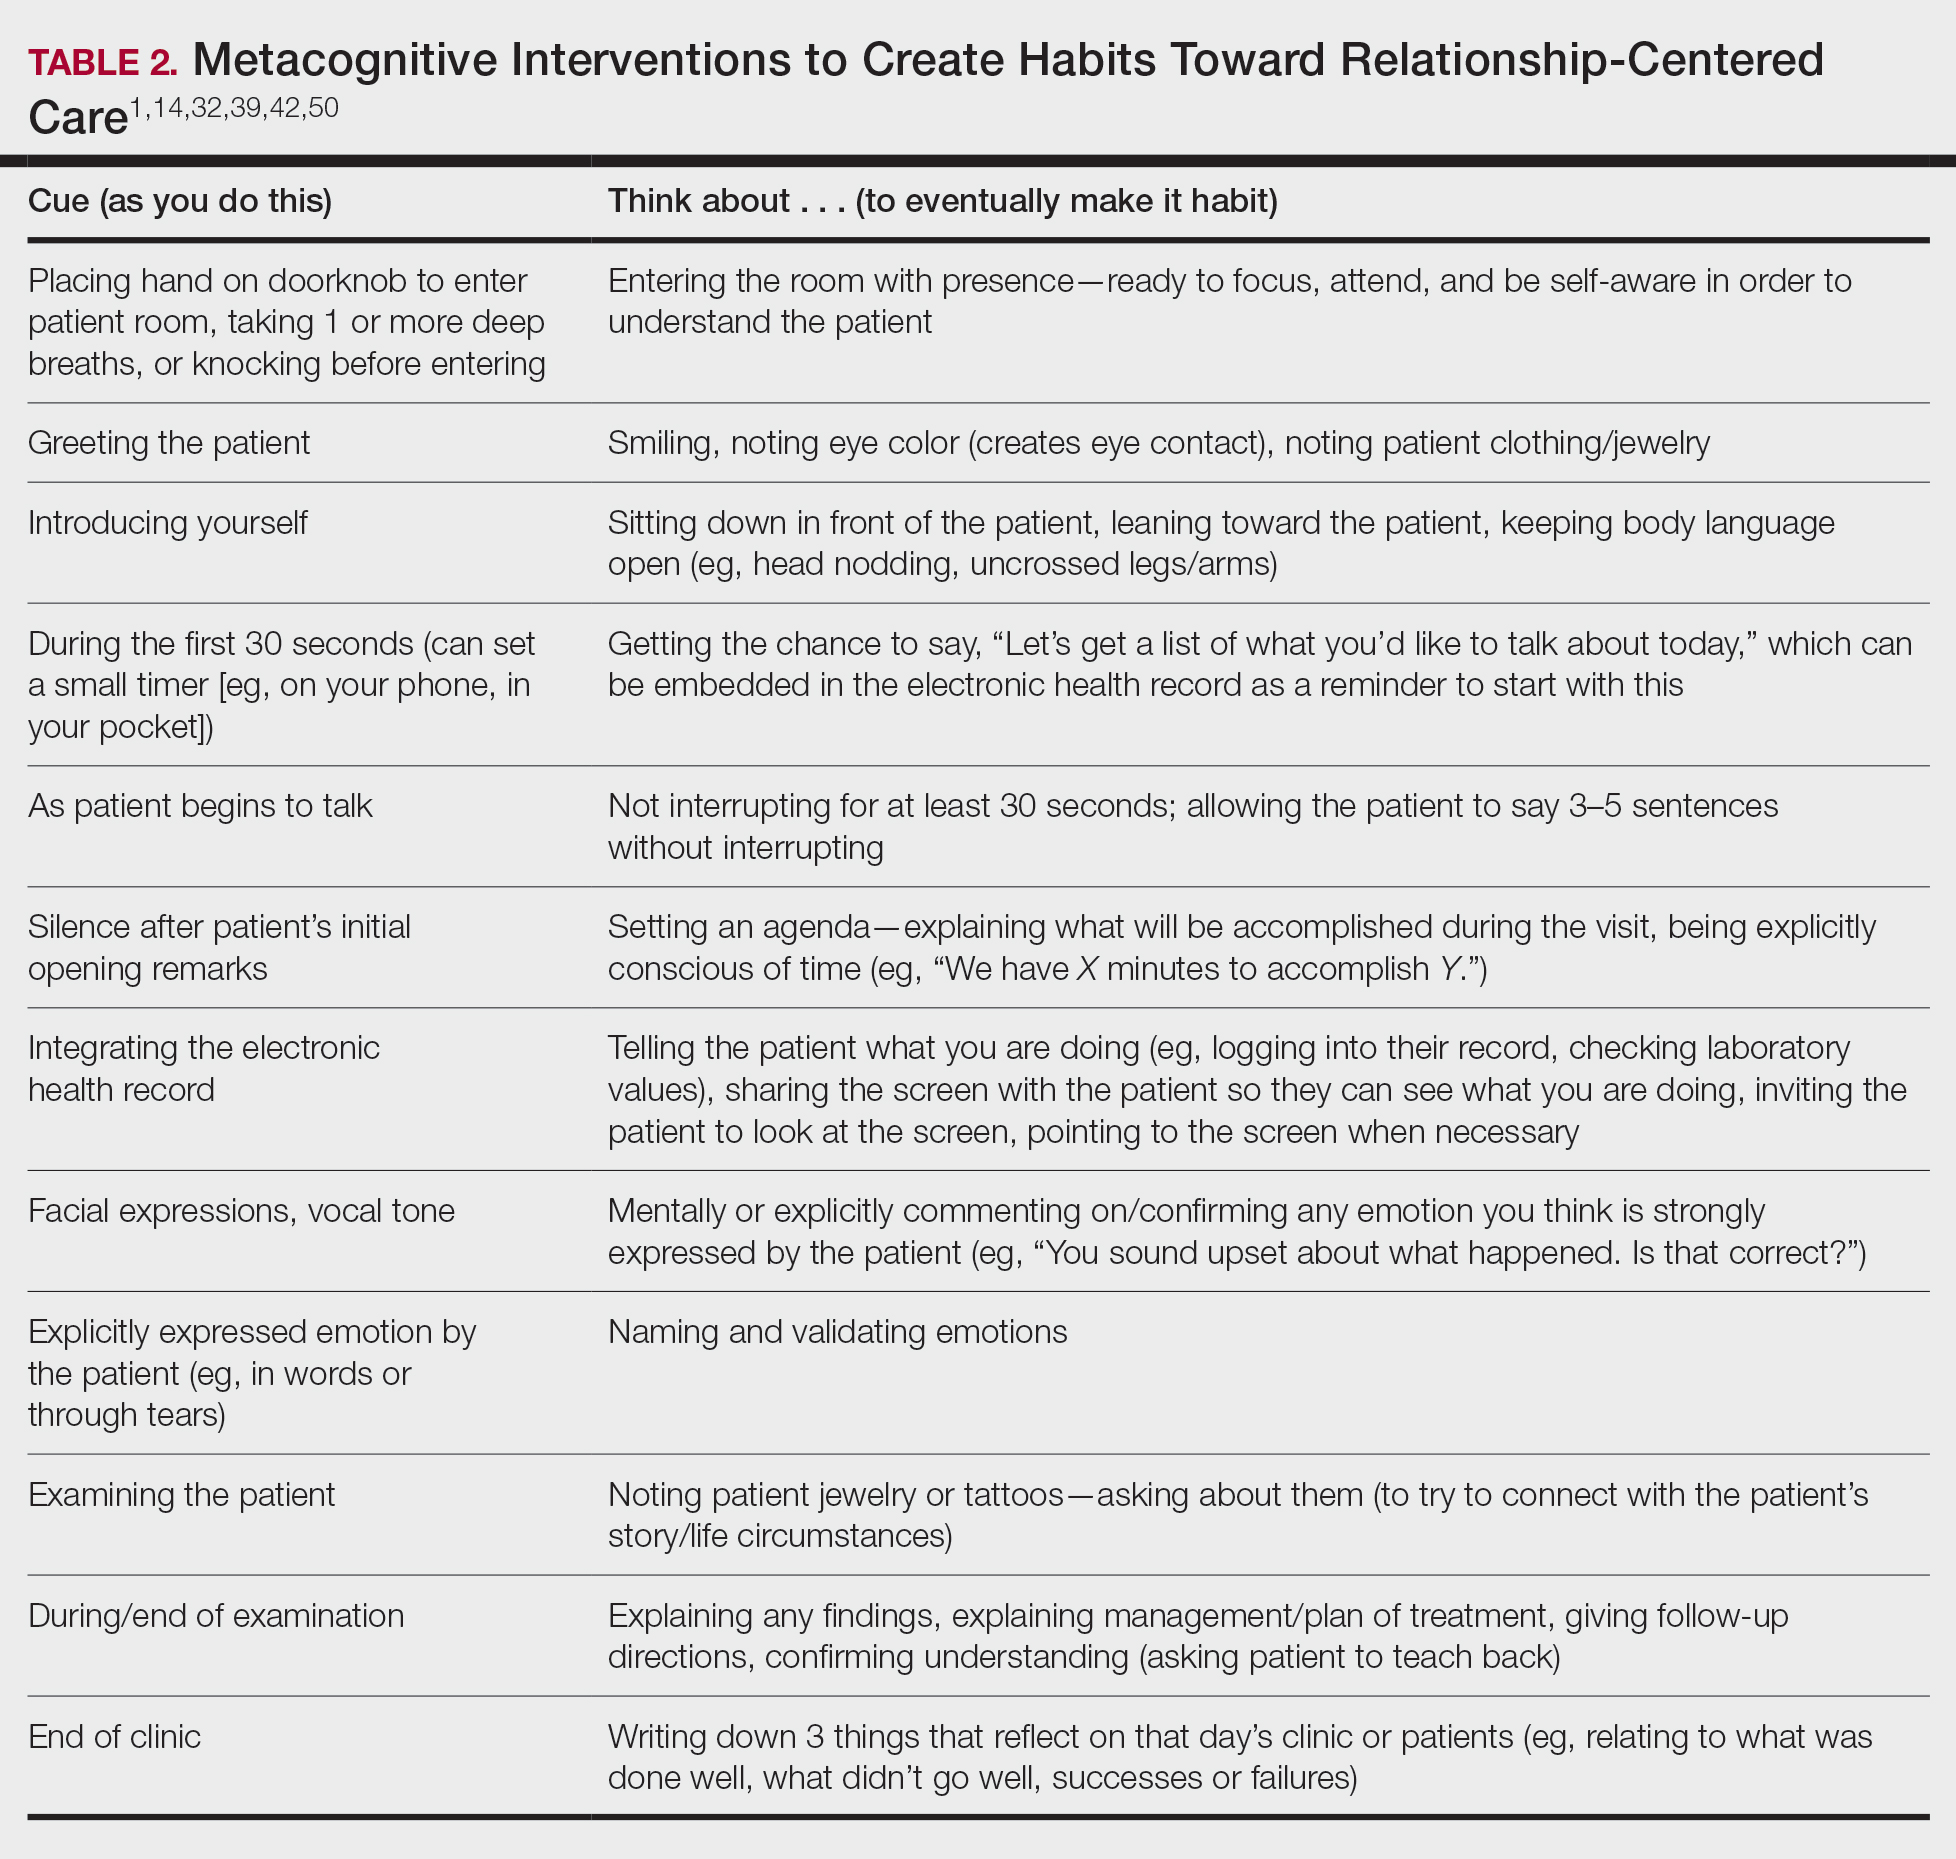
Although the theoretical foundation of relationship-centered care is relatively complex,9 a simple formula that has improved patient experience is “The Big 3,” which entails (1) simply knocking before entering the examination room, (2) sitting, and (3) asking, “What is your main concern?”30 Another relatively simple technique would be to involve the patient with the electronic health record by sharing the screen with them.52 Learning about narrative medicine and developing skills to appreciate each patient’s story is another method to increase relationship-centered care,40,53 as is emotional intelligence.54 These interventions are simple to implement, and good relationship-centered care will save time, help manage patient visits more effectively, and aid in avoiding the urgent new concern that the patient adds at the end of the visit.55 The positive effect of these different interventions highlights that small changes (Table 2) can shift the prevailing culture of medicine to become more relationship centered.56
Metacognitive Attention Can Generate Habit
Taking metacognition a step further, these small interventions can become habit11,14,39 through self-awareness, deliberate practice, and feedback.43 Habit is generated by linking a given intervention to another defined cue. For example, placing a hand on a doorknob to enter an examination room can be the cue to generate a habit of entering with presence.14 Alternatively, before entering an examination room, taking 3 deep breaths can be the cue to trigger presence.14 Habits can be created in just 3 weeks,57 and other proposed cues to generate habits toward relationship-centered care are listed in Table 2. By creating habit through metacognitive attention, relationship-centered care will become something that happens subconsciously without further burdening physicians with another task. Asking patients for permission to record video of an interaction also can create opportunities for self-awareness and self-evaluation through rewatching the video.58
Final Thoughts
Physicians already have the tools to create relationship-centered care in physician-patient interactions. A critical mental shift is to develop habits and apply thinking patterns toward understanding and responding appropriately to patients of all ethnicities and their emotions in the physician-patient interaction. This shift is aided by metacognitive awareness (Table 1) and the development of useful habits (Table 2).
- Sanders L, Fortin AH VI, Schiff GD. Connecting with patients—the missing links. JAMA. 2020;323:33-34.
- Peck BM, Denney M. Disparities in the conduct of the medical encounter: the effects of physician and patient race and gender. SAGE Open. 2012;2:1-14.
- Beach MC, Inui T. Relationship-centered care. a constructive reframing. J Gen Intern Med. 2006;21(suppl 1):S3-S8.
- Tresolini CP, Pew-Fetzer Task Force. Health Professions Education and Relationship-Centered Care. Pew Health Professions Commission; 1994.
- Hojat M. Empathy in Health Professions Education and Patient Care. Springer; 2016.
- Wilkinson H, Whittington R, Perry L, et al. Examining the relationship between burnout and empathy in healthcare professionals: a systematic review. Burn Res. 2017;6:18-29.
- Frankel RM, Quill T. Integrating biopsychosocial and relationship-centered care into mainstream medical practice: a challenge that continues to produce positive results. Fam Syst Health. 2005;23:413-421.
- Frankel RM. Relationship-centered care and the patient-physician relationship. J Gen Intern Med. 2004;19:1163-1165.
- Ventres WB, Frankel RM. Shared presence in physician-patient communication: a graphic representation. Fam Syst Health. 2015;33:270-279.
- Cooper LA, Beach MC, Johnson RL, et al. Delving below the surface: understanding how race and ethnicity influence relationships in health care. J Gen Intern Med. 2006;21(suppl 1):S21-S27.
- Epstein RM. Mindful practice. JAMA. 1999;282:833-839.
- Dobie S. Viewpoint: reflections on a well-traveled path: self-awareness, mindful practice, and relationship-centered care as foundations for medical education. Acad Med. 2007;82:422-427.
- Rabow MW. Meaning and relationship-centered care: recommendations for clinicians attending to the spiritual distress of patients at the end of life. Ethics Med Public Health. 2019;9:57-62.
- Zulman DM, Haverfield MC, Shaw JG, et al. Practices to foster physician presence and connection with patients in the clinical encounter. JAMA. 2020;323:70-81.
- Rakel DP, Guerrera MP, Bayles BP, et al. CAM education: promoting a salutogenic focus in health care. J Altern Complement Med. 2008;14:87-93.
- Olaisen RH, Schluchter MD, Flocke SA, et al. Assessing the longitudinal impact of physician-patient relationship on functional health. Ann Fam Med. 2020;18:422-429.
- Berg GM, Ekengren F, Lee FA, et al. Patient satisfaction with surgeons in a trauma population: testing a structural equation model using perceptions of interpersonal and technical care. J Trauma Acute Care Surg. 2012;72:1316-1322.
- Nassar A, Weimer-Elder B, Kline M, et al. Developing an inpatient relationship-centered communication curriculum for surgical teams: pilot study. J Am Coll Surg. 2019;229(4 suppl 2):E48.
- Caldicott CV, Dunn KA, Frankel RM. Can patients tell when they are unwanted? “turfing” in residency training. Patient Educ Couns. 2005;56:104-111.
- Tucker Edmonds B, Mogul M, Shea JA. Understanding low-income African American women’s expectations, preferences, and priorities in prenatal care. Fam Community Health. 2015;38:149-157.
- Sundstrom B, Szabo C, Dempsey A. “My body. my choice:” a qualitative study of the influence of trust and locus of control on postpartum contraceptive choice. J Health Commun. 2018;23:162-169.
- Block S, Billings JA. Nurturing humanism through teaching palliative care. Acad Med. 1998;73:763-765.
- Hebert RS, Schulz R, Copeland VC, et al. Preparing family caregivers for death and bereavement. insights from caregivers of terminally ill patients. J Pain Symptom Manage. 2009;37:3-12.
- Nundy S, Oswald J. Relationship-centered care: a new paradigm for population health management. Healthc (Amst). 2014;2:216-219.
- Sprague S. Relationship centered care. J S C Med Assoc. 2009;105:135-136.
- Roter DL, Frankel RM, Hall JA, et al. The expression of emotion through nonverbal behavior in medical visits. mechanisms and outcomes. J Gen Intern Med. 2006;21(suppl 1):S28-S34.
- Kenny DA, Veldhuijzen W, van der Weijden T, et al. Interpersonal perception in the context of doctor-patient relationships: a dyadic analysis of doctor-patient communication. Soc Sci Med. 2010;70:763-768.
- Tarzian AJ, Neal MT, O’Neil JA. Attitudes, experiences, and beliefs affecting end-of-life decision-making among homeless individuals. J Palliat Med. 2005;8:36-48.
- Roter D. The enduring and evolving nature of the patient-physician relationship. Patient Educ Couns. 2000;39:5-15.
- Sharieff GQ. MD to MD coaching: improving physician-patient experience scores: what works, what doesn’t. J Patient Exp. 2017;4:210-212.
- Duggan AP, Bradshaw YS, Swergold N, et al. When rapport building extends beyond affiliation: communication overaccommodation toward patients with disabilities. Perm J. 2011;15:23-30.
- Hirschmann K, Rosler G, Fortin AH VI. “For me, this has been transforming”: a qualitative analysis of interprofessional relationship-centered communication skills training. J Patient Exp. 2020;7:1007-1014.
- Hennrikus EF, Skolka MP, Hennrikus N. Applying metacognition through patient encounters and illness scripts to create a conceptual framework for basic science integration, storage, and retrieval. J Med Educ Curric Dev. 2018;5:2382120518777770.
- Eichbaum QG. Thinking about thinking and emotion: the metacognitive approach to the medical humanities that integrates the humanities with the basic and clinical sciences. Perm J. 2014;18:64-75.
- Stansfield RB, Schwartz A, O’Brien CL, et al. Development of a metacognitive effort construct of empathy during clinical training: a longitudinal study of the factor structure of the Jefferson Scale of Empathy. Adv Health Sci Educ Theory Pract. 2016;21:5-17.
- Hojat M, Vergare MJ, Maxwell K, et al. The devil is in the third year: a longitudinal study of erosion of empathy in medical school. Acad Med. 2009;84:1182-1191.
- Neumann M, Edelhäuser F, Tauschel D, et al. Empathy decline and its reasons: a systematic review of studies with medical students and residents. Acad Med. 2011;86:996-1009.
- Chou CL, Hirschmann K, Fortin AHT, et al. The impact of a faculty learning community on professional and personal development: the facilitator training program of the American Academy on Communication in Healthcare. Acad Med. 2014;89:1051-1056.
- Rider EA. Advanced communication strategies for relationship-centered care. Pediatr Ann. 2011;40:447-453.
- Reichman JAH. Narrative competence, mindfulness,and relationship-centered care in medical education: an innovative approach to teaching medical interviewing. Dissertation Abstracts International Section A: Humanities and Social Sciences. 2015;75(8-A(E)).
- Boissy A, Windover AK, Bokar D, et al. Communication skills training for physicians improves patient satisfaction. J Gen Intern Med. 2016;31:755-761.
- Hatem DS, Barrett SV, Hewson M, et al. Teaching the medical interview: methods and key learning issues in a faculty development course. J Gen Intern Med. 2007;22:1718-1724.
- Gilligan TD, Baile WF. ASCO patient-clinician communication guideline: fostering relationship-centered care. ASCO Connection. November 20, 2017. Accessed March 5, 2021. https://connection.asco.org/blogs/asco-patient-clinician-communication-guideline-fostering-relationship-centered-care
- Haidet P, Stein HF. The role of the student-teacher relationship in the formation of physicians. The hidden curriculum as process. J Gen Intern Med. 2006;(suppl 1):S16-S20.
- Puchalski CM, Guenther M. Restoration and re-creation: spirituality in the lives of healthcare professionals. Curr Opin Support Palliat Care. 2012;6:254-258.
- Williams SW, Hanson LC, Boyd C, et al. Communication, decision making, and cancer: what African Americans want physicians to know. J Palliative Med. 2008;11:1221-1226.
- Lindsley I, Woodhead S, Micallef C, et al. The concept of body language in the medical consultation. Psychiatr Danub. 2015;27(suppl 1):S41-S47.
- Hall JA, Harrigan JA, Rosenthal R. Nonverbal behavior in clinician-patient interaction. Appl Prev Psychol. 1995;4:21-37.
- Ness DE, Kiesling SF. Language and connectedness in the medical and psychiatric interview. Patient Educ Couns. 2007;68:139-144.
- Miller WL. The clinical hand: a curricular map for relationship-centered care. Fam Med. 2004;36:330-335.
- Wald HS, George P, Reis SP, et al. Electronic health record training in undergraduate medical education: bridging theory to practice with curricula for empowering patient- and relationship-centered care in the computerized setting. Acad Med. 2014;89:380-386.
- Silverman H, Ho YX, Kaib S, et al. A novel approach to supporting relationship-centered care through electronic health record ergonomic training in preclerkship medical education. Acad Med. 2014;89:1230-1234.
- Weiss T, Swede MJ. Transforming preprofessional health education through relationship-centered care and narrative medicine. Teach Learn Med. 2019;31:222-233.
- Blanch-Hartigan D. An effective training to increase accurate recognition of patient emotion cues. Patient Educ Couns. 2012;89:274-280.
- White J, Levinson W, Roter D. “Oh, by the way ...”: the closing moments of the medical visit. J Gen Intern Med. 1994;9:24-28.
- Suchman AL, Williamson PR, Litzelman DK, et al. Toward an informal curriculum that teaches professionalism. Transforming the social environment of a medical school. J Gen Intern Med. 2004;19:501-504.
- Lally P, van Jaarsveld CHM, Potts HWW, et al. How are habits formed: modelling habit formation in the real world. Eur J Soc Psychol. 2010;40:998-1009.
- Little P, White P, Kelly J, et al. Randomised controlled trial of a brief intervention targeting predominantly non-verbal communication in general practice consultations. Br J Gen Pract. 2015;65:E351-E356.
Communication and relationships cannot be taken for granted, particularly in the physician-patient relationship, where life-altering diagnoses may be given. With one diagnosis, someone’s life may be changed, and both physicians and patients need to be cognizant of the importance of a strong relationship and clear communication.
In the current US health care system, both physicians and patients often are not getting their needs met, and studies that include factors of race, ethnicity, and socioeconomic status suggest that physician-patient relationship barriers contribute to racial disparities in health care.1,2 Although patient-centered care is a widely recognized and upheld model, relationship-centered care between physician and patient involves focusing on the patient and the physician-patient relationship through recognizing personhood, affect (being empathic), and reciprocal influence.3,4 Although it is not necessarily intuitive because it can appear to be yet another task for busy physicians, relationship-centered care improves health care delivery for both physicians and patients through decreased physician burnout, reduced medical errors, and better patient outcomes and satisfaction.5,6
Every physician, patient, and physician-patient relationship is different; unlike the standard questions directed at a routine patient history focused on gathering data, there is no one-size-fits-all relationship-centered conversation.7-10 As with any successful interaction between 2 people, there is a certain amount of necessary self-awareness (Table 1)11 that allows for improvisation and appropriate responsiveness to what is seen, heard, and felt. Rather than attending solely to disease states, the focus of relationship-centered care is on patients, interpersonal interaction, and promoting health and well-being.15
This review summarizes the existing literature on relationship-centered care, introduces the use of metacognition (Table 1), and suggests creating simple habits to promote such care. The following databases were searched from inception through November 23, 2020, using the term relationship-centered care: MEDLINE (Ovid), EMBASE (Ovid), APA PsycInfo (Ovid), Scopus, Web of Science Core Collection, CINAHL Complete (EBSCO), Academic Search Premier (EBSCOhost), and ERIC (ProQuest). A total of 1772 records were retrieved through searches, and after deduplication of 1116 studies, 350 records were screened through a 2-part process. Articles were first screened by title and abstract for relevance to the relationship between physician and patient, with 185 studies deemed irrelevant (eg, pertaining to the relationship of veterinarian to animal). The remaining 165 studies were assessed for eligibility, with 69 further studies excluded for various reasons. The screening process resulted in 96 articles considered in this review.
Definitions/key terms, as used in this article, are listed in Table 1.
Background of Relationship-Centered Care
Given time constraints, the diagnosis and treatment of medical problems often are the focus of physicians. Although proper medical diagnosis and treatment are important, and their delivery is made possible by the physician having the appropriate knowledge, a physician-patient relationship that focuses solely on disease without acknowledging the patient creates a system that ultimately neglects both patients and physicians.15 This prevailing physician-patient relationship paradigm is suboptimal, and a proposed remedy is relationship-centered care, which focuses on relationships among the human beings in health care interactions.3 Relationship-centered care has 4 principles: (1) the personhood of each party must be recognized, (2) emotion is part of relationships, (3) relationships are reciprocal and not just one way, and (4) creating these types of relationships is morally valuable3 and beneficial to patient care.16
Assessment of the Need for Relationship-Centered Care
Relationship-centered care has been studied in physician-patient interactions in various health care settings.17-23 For at least 2 decades, relationship-centered care has been set forth as a model,4,24,25 but there are challenges. Physicians tend to overrate or underrate their communication skills in patient interactions.26,27 A given physician’s preferences often still seem to supersede those of the patient.3,28,29 The impetus to develop relationship-centered care skills generally needs to be internally driven,4,30 as, ultimately, physicians and patients have varying needs.4,31 However, providing physicians with a potential structure is helpful.32
A Solution: Metacognition in the Physician-Patient Interaction
Metacognition is important to integrating basic science knowledge into medical learning and practice,33,34 and it is no less important in translating interpersonal knowledge to the physician-patient interaction. Decreased metacognitive effort35 may underpin the decline in empathy seen with increasing medical training.36,37 Understanding how metacognitive practices foster relationship-centered care is important for teaching, developing, and maintaining that care.
Metacognition is already embedded in the fabric of the physician-patient interaction.33,34 The complex interplay of the physician-patient interview, patient examination, and integration of physical as well as ancillary data requires higher-order thinking and the ability to parse out that thinking successfully. As a concrete example, coming to a diagnosis requires thinking about what has been presented during the physician-patient interaction and considering what supports and suggests the disease while a list of potential differential diagnosis alternatives is being generated. Physicians are trained to apply this clinical reasoning approach to their patient care.
Conversely, although communication skills are a key component of doctoring,38 both between physician and patient as well as among other colleagues and staff, many physicians have never received formal training in communication skills,26,32,39 though it is now an integral part of medical school curricula.40 When such training is mandatory, less than 1% of physicians continue to believe that there was no benefit, even from a single 8-hour communications skills training session.41 Communication cannot be taught comprehensively in 8 hours; thus, the benefit of such training may be the end result of metacognition and increased self-awareness (Table 1).42,43
Building Relationship-Centered Care Through Metacognitive Attention
Metacognition as manifested by such self-awareness can build relationship-centered care.4 Self-awareness can be taught through mentorship or role models.44 Journaling,40 meditation, and appreciation of beauty and the arts45 can contribute, as well as more formal training programs,32,38,42 as offered by the Academy of Communication in Healthcare. Creating opportunities for patient empowerment also supports relationship-centered care, as does applying knowledge of implicit bias.46
Even without formal training, relationship-centered care can be built through attention to cues9—visual (eg, sitting down, other body language),47,48 auditory (eg, knocking, language, tone, conversational flow),48,49 and emotional (eg, clinical empathy, emotional intelligence)(Table 2). Such attention is familiar to everyone, not just physicians or patients, through interactions outside of health care; inattention may be due to the hidden curriculum or culture of medicine40 as well as real-time changes, such as the introduction of the electronic health record.51 Inattention to these cues also may be a result of context-specific knowledge, in which a physician’s real-life communication skills are not applied to the unique context of patient care.
Although the theoretical foundation of relationship-centered care is relatively complex,9 a simple formula that has improved patient experience is “The Big 3,” which entails (1) simply knocking before entering the examination room, (2) sitting, and (3) asking, “What is your main concern?”30 Another relatively simple technique would be to involve the patient with the electronic health record by sharing the screen with them.52 Learning about narrative medicine and developing skills to appreciate each patient’s story is another method to increase relationship-centered care,40,53 as is emotional intelligence.54 These interventions are simple to implement, and good relationship-centered care will save time, help manage patient visits more effectively, and aid in avoiding the urgent new concern that the patient adds at the end of the visit.55 The positive effect of these different interventions highlights that small changes (Table 2) can shift the prevailing culture of medicine to become more relationship centered.56
Metacognitive Attention Can Generate Habit
Taking metacognition a step further, these small interventions can become habit11,14,39 through self-awareness, deliberate practice, and feedback.43 Habit is generated by linking a given intervention to another defined cue. For example, placing a hand on a doorknob to enter an examination room can be the cue to generate a habit of entering with presence.14 Alternatively, before entering an examination room, taking 3 deep breaths can be the cue to trigger presence.14 Habits can be created in just 3 weeks,57 and other proposed cues to generate habits toward relationship-centered care are listed in Table 2. By creating habit through metacognitive attention, relationship-centered care will become something that happens subconsciously without further burdening physicians with another task. Asking patients for permission to record video of an interaction also can create opportunities for self-awareness and self-evaluation through rewatching the video.58
Final Thoughts
Physicians already have the tools to create relationship-centered care in physician-patient interactions. A critical mental shift is to develop habits and apply thinking patterns toward understanding and responding appropriately to patients of all ethnicities and their emotions in the physician-patient interaction. This shift is aided by metacognitive awareness (Table 1) and the development of useful habits (Table 2).
- Sanders L, Fortin AH VI, Schiff GD. Connecting with patients—the missing links. JAMA. 2020;323:33-34.
- Peck BM, Denney M. Disparities in the conduct of the medical encounter: the effects of physician and patient race and gender. SAGE Open. 2012;2:1-14.
- Beach MC, Inui T. Relationship-centered care. a constructive reframing. J Gen Intern Med. 2006;21(suppl 1):S3-S8.
- Tresolini CP, Pew-Fetzer Task Force. Health Professions Education and Relationship-Centered Care. Pew Health Professions Commission; 1994.
- Hojat M. Empathy in Health Professions Education and Patient Care. Springer; 2016.
- Wilkinson H, Whittington R, Perry L, et al. Examining the relationship between burnout and empathy in healthcare professionals: a systematic review. Burn Res. 2017;6:18-29.
- Frankel RM, Quill T. Integrating biopsychosocial and relationship-centered care into mainstream medical practice: a challenge that continues to produce positive results. Fam Syst Health. 2005;23:413-421.
- Frankel RM. Relationship-centered care and the patient-physician relationship. J Gen Intern Med. 2004;19:1163-1165.
- Ventres WB, Frankel RM. Shared presence in physician-patient communication: a graphic representation. Fam Syst Health. 2015;33:270-279.
- Cooper LA, Beach MC, Johnson RL, et al. Delving below the surface: understanding how race and ethnicity influence relationships in health care. J Gen Intern Med. 2006;21(suppl 1):S21-S27.
- Epstein RM. Mindful practice. JAMA. 1999;282:833-839.
- Dobie S. Viewpoint: reflections on a well-traveled path: self-awareness, mindful practice, and relationship-centered care as foundations for medical education. Acad Med. 2007;82:422-427.
- Rabow MW. Meaning and relationship-centered care: recommendations for clinicians attending to the spiritual distress of patients at the end of life. Ethics Med Public Health. 2019;9:57-62.
- Zulman DM, Haverfield MC, Shaw JG, et al. Practices to foster physician presence and connection with patients in the clinical encounter. JAMA. 2020;323:70-81.
- Rakel DP, Guerrera MP, Bayles BP, et al. CAM education: promoting a salutogenic focus in health care. J Altern Complement Med. 2008;14:87-93.
- Olaisen RH, Schluchter MD, Flocke SA, et al. Assessing the longitudinal impact of physician-patient relationship on functional health. Ann Fam Med. 2020;18:422-429.
- Berg GM, Ekengren F, Lee FA, et al. Patient satisfaction with surgeons in a trauma population: testing a structural equation model using perceptions of interpersonal and technical care. J Trauma Acute Care Surg. 2012;72:1316-1322.
- Nassar A, Weimer-Elder B, Kline M, et al. Developing an inpatient relationship-centered communication curriculum for surgical teams: pilot study. J Am Coll Surg. 2019;229(4 suppl 2):E48.
- Caldicott CV, Dunn KA, Frankel RM. Can patients tell when they are unwanted? “turfing” in residency training. Patient Educ Couns. 2005;56:104-111.
- Tucker Edmonds B, Mogul M, Shea JA. Understanding low-income African American women’s expectations, preferences, and priorities in prenatal care. Fam Community Health. 2015;38:149-157.
- Sundstrom B, Szabo C, Dempsey A. “My body. my choice:” a qualitative study of the influence of trust and locus of control on postpartum contraceptive choice. J Health Commun. 2018;23:162-169.
- Block S, Billings JA. Nurturing humanism through teaching palliative care. Acad Med. 1998;73:763-765.
- Hebert RS, Schulz R, Copeland VC, et al. Preparing family caregivers for death and bereavement. insights from caregivers of terminally ill patients. J Pain Symptom Manage. 2009;37:3-12.
- Nundy S, Oswald J. Relationship-centered care: a new paradigm for population health management. Healthc (Amst). 2014;2:216-219.
- Sprague S. Relationship centered care. J S C Med Assoc. 2009;105:135-136.
- Roter DL, Frankel RM, Hall JA, et al. The expression of emotion through nonverbal behavior in medical visits. mechanisms and outcomes. J Gen Intern Med. 2006;21(suppl 1):S28-S34.
- Kenny DA, Veldhuijzen W, van der Weijden T, et al. Interpersonal perception in the context of doctor-patient relationships: a dyadic analysis of doctor-patient communication. Soc Sci Med. 2010;70:763-768.
- Tarzian AJ, Neal MT, O’Neil JA. Attitudes, experiences, and beliefs affecting end-of-life decision-making among homeless individuals. J Palliat Med. 2005;8:36-48.
- Roter D. The enduring and evolving nature of the patient-physician relationship. Patient Educ Couns. 2000;39:5-15.
- Sharieff GQ. MD to MD coaching: improving physician-patient experience scores: what works, what doesn’t. J Patient Exp. 2017;4:210-212.
- Duggan AP, Bradshaw YS, Swergold N, et al. When rapport building extends beyond affiliation: communication overaccommodation toward patients with disabilities. Perm J. 2011;15:23-30.
- Hirschmann K, Rosler G, Fortin AH VI. “For me, this has been transforming”: a qualitative analysis of interprofessional relationship-centered communication skills training. J Patient Exp. 2020;7:1007-1014.
- Hennrikus EF, Skolka MP, Hennrikus N. Applying metacognition through patient encounters and illness scripts to create a conceptual framework for basic science integration, storage, and retrieval. J Med Educ Curric Dev. 2018;5:2382120518777770.
- Eichbaum QG. Thinking about thinking and emotion: the metacognitive approach to the medical humanities that integrates the humanities with the basic and clinical sciences. Perm J. 2014;18:64-75.
- Stansfield RB, Schwartz A, O’Brien CL, et al. Development of a metacognitive effort construct of empathy during clinical training: a longitudinal study of the factor structure of the Jefferson Scale of Empathy. Adv Health Sci Educ Theory Pract. 2016;21:5-17.
- Hojat M, Vergare MJ, Maxwell K, et al. The devil is in the third year: a longitudinal study of erosion of empathy in medical school. Acad Med. 2009;84:1182-1191.
- Neumann M, Edelhäuser F, Tauschel D, et al. Empathy decline and its reasons: a systematic review of studies with medical students and residents. Acad Med. 2011;86:996-1009.
- Chou CL, Hirschmann K, Fortin AHT, et al. The impact of a faculty learning community on professional and personal development: the facilitator training program of the American Academy on Communication in Healthcare. Acad Med. 2014;89:1051-1056.
- Rider EA. Advanced communication strategies for relationship-centered care. Pediatr Ann. 2011;40:447-453.
- Reichman JAH. Narrative competence, mindfulness,and relationship-centered care in medical education: an innovative approach to teaching medical interviewing. Dissertation Abstracts International Section A: Humanities and Social Sciences. 2015;75(8-A(E)).
- Boissy A, Windover AK, Bokar D, et al. Communication skills training for physicians improves patient satisfaction. J Gen Intern Med. 2016;31:755-761.
- Hatem DS, Barrett SV, Hewson M, et al. Teaching the medical interview: methods and key learning issues in a faculty development course. J Gen Intern Med. 2007;22:1718-1724.
- Gilligan TD, Baile WF. ASCO patient-clinician communication guideline: fostering relationship-centered care. ASCO Connection. November 20, 2017. Accessed March 5, 2021. https://connection.asco.org/blogs/asco-patient-clinician-communication-guideline-fostering-relationship-centered-care
- Haidet P, Stein HF. The role of the student-teacher relationship in the formation of physicians. The hidden curriculum as process. J Gen Intern Med. 2006;(suppl 1):S16-S20.
- Puchalski CM, Guenther M. Restoration and re-creation: spirituality in the lives of healthcare professionals. Curr Opin Support Palliat Care. 2012;6:254-258.
- Williams SW, Hanson LC, Boyd C, et al. Communication, decision making, and cancer: what African Americans want physicians to know. J Palliative Med. 2008;11:1221-1226.
- Lindsley I, Woodhead S, Micallef C, et al. The concept of body language in the medical consultation. Psychiatr Danub. 2015;27(suppl 1):S41-S47.
- Hall JA, Harrigan JA, Rosenthal R. Nonverbal behavior in clinician-patient interaction. Appl Prev Psychol. 1995;4:21-37.
- Ness DE, Kiesling SF. Language and connectedness in the medical and psychiatric interview. Patient Educ Couns. 2007;68:139-144.
- Miller WL. The clinical hand: a curricular map for relationship-centered care. Fam Med. 2004;36:330-335.
- Wald HS, George P, Reis SP, et al. Electronic health record training in undergraduate medical education: bridging theory to practice with curricula for empowering patient- and relationship-centered care in the computerized setting. Acad Med. 2014;89:380-386.
- Silverman H, Ho YX, Kaib S, et al. A novel approach to supporting relationship-centered care through electronic health record ergonomic training in preclerkship medical education. Acad Med. 2014;89:1230-1234.
- Weiss T, Swede MJ. Transforming preprofessional health education through relationship-centered care and narrative medicine. Teach Learn Med. 2019;31:222-233.
- Blanch-Hartigan D. An effective training to increase accurate recognition of patient emotion cues. Patient Educ Couns. 2012;89:274-280.
- White J, Levinson W, Roter D. “Oh, by the way ...”: the closing moments of the medical visit. J Gen Intern Med. 1994;9:24-28.
- Suchman AL, Williamson PR, Litzelman DK, et al. Toward an informal curriculum that teaches professionalism. Transforming the social environment of a medical school. J Gen Intern Med. 2004;19:501-504.
- Lally P, van Jaarsveld CHM, Potts HWW, et al. How are habits formed: modelling habit formation in the real world. Eur J Soc Psychol. 2010;40:998-1009.
- Little P, White P, Kelly J, et al. Randomised controlled trial of a brief intervention targeting predominantly non-verbal communication in general practice consultations. Br J Gen Pract. 2015;65:E351-E356.
Practice Points
- Relationship-centered care emphasizes that all relationships in health care are important, including not only relationships between physicians and patients but also among physicians and colleagues, staff, students, community, and self.
- The physician-patient relationship can be complex, and metacognition can lead to habitual practice of simple techniques to optimize the interaction

Medical licensing questions continue to violate ADA
With the COVID-19 pandemic, already high rates of suicide, depression, and burnout among physicians became even more acute. Yet, 3 years after the Federation of State Medical Boards issued recommendations on what questions about mental health status license applications should – or mostly should not – include, only North Carolina fully complies with all four recommendations, and most states comply with two or fewer, a study of state medical board applications has found (JAMA. 2021 May 18;325[19];2017-8).

Questions about mental health history or “its hypothetical effect on competency,” violate the Americans with Disabilities Act, the study authors stated. In a research letter to JAMA, the authors also reported that five state boards do not comply with any of the FSMB recommendations. Twenty-four states comply with three of the four recommendations.
Overall, the mean consistency score was 2.1, which means state medical licensing applications typically run afoul of the Americans With Disabilities Act when it comes to mental health history of applicants.
“No one should ever wonder, ‘Will I lose my job, or should I get help?’ ” said co–senior author Jessica A. Gold, MD, MS, a psychiatrist at Washington University in St. Louis. “This should absolutely never be a question on someone’s mind. And the fact that it is, in medicine, is a problem that needs to be solved. I hope that people are beginning to see that, and we can make a change to get people the help they need before it is too late.”
High rates of depression, suicide
She noted that before COVID-19, physicians already had higher rates of depression, burnout, and suicide than the general population. “Over COVID-19, it has become clear that the mental health of physicians has become additionally compounded,” Dr. Gold said.
One study found that physicians had a 44% higher rate of suicide (PLoS One. 2019 Dec;14[12]:e0226361), but they’re notoriously reluctant to seek out mental health care. A 2017 study reported that 40% of physicians would be reluctant to seek mental health care because of concerns about their licensure (Mayo Clin Proc. 2017;92[10]:1486-93).
As the pandemic went on, Dr. Gold and her colleagues decided to study whether state boards had improved their compliance with the FSMB recommendations issued in 2018. Those recommendations include these four limitations regarding questions about mental health conditions on license applications:
- Include only when they result in impairment.
- Include only when the mental health conditions are current – that is, when they’ve occurred within the past 2 years.
- Provide safe haven nonreporting – that is, allow physicians to not report previously diagnosed and treated mental health conditions if they’re being monitored and are in good standing with a physician health program.
- Include supportive or nonjudgmental language about seeking mental health care.
The study considered board applications that had questions about mental health status as consistent with the first three recommendations. Seventeen states complied.
Thirty-nine state boards complied with the first recommendation regarding impairment; 41 with the second recommendation about near-term history; 25 with safe-haven nonreporting. Only eight states were consistent with the recommendation on supportive language.
The ADA limits inquiries about an applicant’s impairment to only current conditions. In a 2017 study, only 21 state boards had limited questions to current impairment. “This is a significant improvement, but this still means the rest of the states are violating an actual law,” Dr. Gold said. “Another plus is that 17 states asked no questions at all that could require mental health disclosure. This, too is significant because it highlights change in thinking.”
But still, the fact that five states didn’t comply with any recommendation and only one followed all of them is “utterly unacceptable,” Dr. Gold said. “Instead, we should have universal adoption of FSMB recommendations.”
Time to remove stigma
Michael F. Myers, MD, a clinical psychiatrist at the State University of New York, Brooklyn, said removing the stigma of seeking help for mental health conditions is especially important for physicians. He’s written several books about physician mental health, including his latest, “Becoming a Doctor’s Doctor: A Memoir.”
“I would say at least 15% of the families that I interviewed who lost a physician loved one to suicide have said the doctor was petrified of going for professional help because of fears of what this could do to their medical license,” he said. “It is extremely important that those licensing questions will be either brought up to speed, or – the ones that are clearly violating the ADA – that they be removed.”
Applications for hospital privileges can also run afoul of the same ADA standard, Dr. Myers added. “Physicians have told me that when they go to get medical privileges at a medical center, they get asked all kinds of questions that are outdated, that are intrusive, that violate the ADA,” he said.
Credentialing is another area that Dr. Gold and her colleagues are interested in studying, she said. “Sometimes the licensing applications can be fine, but then the hospital someone is applying to work at can ask the same illegal questions anyway,” she said. “So it doesn’t matter that the state fixed the problem because the hospital asked them anyway. You feel your job is at risk in the same way, so you still don’t get help.”
Dr. Gold and Dr. Myers have no relevant financial relationships to disclose.
With the COVID-19 pandemic, already high rates of suicide, depression, and burnout among physicians became even more acute. Yet, 3 years after the Federation of State Medical Boards issued recommendations on what questions about mental health status license applications should – or mostly should not – include, only North Carolina fully complies with all four recommendations, and most states comply with two or fewer, a study of state medical board applications has found (JAMA. 2021 May 18;325[19];2017-8).
Questions about mental health history or “its hypothetical effect on competency,” violate the Americans with Disabilities Act, the study authors stated. In a research letter to JAMA, the authors also reported that five state boards do not comply with any of the FSMB recommendations. Twenty-four states comply with three of the four recommendations.
Overall, the mean consistency score was 2.1, which means state medical licensing applications typically run afoul of the Americans With Disabilities Act when it comes to mental health history of applicants.
“No one should ever wonder, ‘Will I lose my job, or should I get help?’ ” said co–senior author Jessica A. Gold, MD, MS, a psychiatrist at Washington University in St. Louis. “This should absolutely never be a question on someone’s mind. And the fact that it is, in medicine, is a problem that needs to be solved. I hope that people are beginning to see that, and we can make a change to get people the help they need before it is too late.”
High rates of depression, suicide
She noted that before COVID-19, physicians already had higher rates of depression, burnout, and suicide than the general population. “Over COVID-19, it has become clear that the mental health of physicians has become additionally compounded,” Dr. Gold said.
One study found that physicians had a 44% higher rate of suicide (PLoS One. 2019 Dec;14[12]:e0226361), but they’re notoriously reluctant to seek out mental health care. A 2017 study reported that 40% of physicians would be reluctant to seek mental health care because of concerns about their licensure (Mayo Clin Proc. 2017;92[10]:1486-93).
As the pandemic went on, Dr. Gold and her colleagues decided to study whether state boards had improved their compliance with the FSMB recommendations issued in 2018. Those recommendations include these four limitations regarding questions about mental health conditions on license applications:
- Include only when they result in impairment.
- Include only when the mental health conditions are current – that is, when they’ve occurred within the past 2 years.
- Provide safe haven nonreporting – that is, allow physicians to not report previously diagnosed and treated mental health conditions if they’re being monitored and are in good standing with a physician health program.
- Include supportive or nonjudgmental language about seeking mental health care.
The study considered board applications that had questions about mental health status as consistent with the first three recommendations. Seventeen states complied.
Thirty-nine state boards complied with the first recommendation regarding impairment; 41 with the second recommendation about near-term history; 25 with safe-haven nonreporting. Only eight states were consistent with the recommendation on supportive language.
The ADA limits inquiries about an applicant’s impairment to only current conditions. In a 2017 study, only 21 state boards had limited questions to current impairment. “This is a significant improvement, but this still means the rest of the states are violating an actual law,” Dr. Gold said. “Another plus is that 17 states asked no questions at all that could require mental health disclosure. This, too is significant because it highlights change in thinking.”
But still, the fact that five states didn’t comply with any recommendation and only one followed all of them is “utterly unacceptable,” Dr. Gold said. “Instead, we should have universal adoption of FSMB recommendations.”
Time to remove stigma
Michael F. Myers, MD, a clinical psychiatrist at the State University of New York, Brooklyn, said removing the stigma of seeking help for mental health conditions is especially important for physicians. He’s written several books about physician mental health, including his latest, “Becoming a Doctor’s Doctor: A Memoir.”
“I would say at least 15% of the families that I interviewed who lost a physician loved one to suicide have said the doctor was petrified of going for professional help because of fears of what this could do to their medical license,” he said. “It is extremely important that those licensing questions will be either brought up to speed, or – the ones that are clearly violating the ADA – that they be removed.”
Applications for hospital privileges can also run afoul of the same ADA standard, Dr. Myers added. “Physicians have told me that when they go to get medical privileges at a medical center, they get asked all kinds of questions that are outdated, that are intrusive, that violate the ADA,” he said.
Credentialing is another area that Dr. Gold and her colleagues are interested in studying, she said. “Sometimes the licensing applications can be fine, but then the hospital someone is applying to work at can ask the same illegal questions anyway,” she said. “So it doesn’t matter that the state fixed the problem because the hospital asked them anyway. You feel your job is at risk in the same way, so you still don’t get help.”
Dr. Gold and Dr. Myers have no relevant financial relationships to disclose.
FROM JAMA
Storing patients’ credit card information: Keep it safe
Credit cards have made it easier for psychiatrists who work in outpatient settings to collect payment for their services. Accepting credit cards saves time in sessions for clinical matters, leads to higher rates of collecting payments for patients who do not show up for appointments, and avoids having to manage bounced checks and collection agencies.1 No federal or state laws prohibit businesses from storing consumers’ credit card information. However, psychiatric practices are legally obligated to have safeguards in place to protect sensitive information and limit liability exposures.2 There are several steps to take when storing your patients’ credit card information.
Establish a payment policy. Create a policy that outlines your practice’s credit card procedures, including when credit cards will be charged and under what circumstances, how patients will be notified, and how credit card information will be stored.2 Give your patients a copy of this policy and review it with them at their first appointment and any time you change this policy.2 Get consent from your patients before using and storing their credit card information.2
Use secure methods to store this information. Most medical practices photocopy/write down their patients’ credit card information and store it in the patient’s electronic/paper medical record, or they use an online service to store it electronically.2 Online services usually provide a higher level of protection than the patient’s medical record.2 Ensure that electronic data that includes credit card numbers is robustly encrypted, or that paper records are locked in a secure place, such as in a safe or file drawer that requires a key/combination lock.3 Payment Card Industry (PCI) regulations prohibit storing a credit card’s security code (a three- or four-digit number on the front or back of the card).3 This code is used to allow merchants to verify whether a customer authorizing a transaction over the phone or via the internet physically possesses the card.3 PCI regulations also prohibit storing data contained in the card’s magnetic strip.3 This data contains information about the account that is not displayed on the card, assists with authorizing transactions, and ensures that credit cards cannot be easily counterfeited.3
Understand all federal and state laws and regulations. If your practice collects patient billing information, you are considered a “merchant” and are subject to federal and state laws and regulations that protect consumer credit card information.2 These laws and regulations include (but are not limited to)2:
- Health Insurance Portability and Accountability Act (HIPAA) and similar state privacy laws
- Federal Trade Commission Act (FTCA) and similar state business laws
- Payment Card Industry Data Security Standard (PCI DSS), which was not devised by federal or state government.
HIPAA and state privacy laws require psychiatrists to implement “reasonable” security measures to protect payment information, regardless of how that information is stored.2,4 Because HIPAA does not define “reasonable,” psychiatrists have latitude in determining which security measures to implement.2,4 Locking the information in a file cabinet and locking the room where the file cabinet is kept (for paper storage) or using HIPAA-compliant encrypted storage programs (for electronic storage) are examples of “reasonable” security measures.2
FTCA requires businesses to use “appropriate” and “reasonable” security measures to protect credit card information.2,5 Because FTCA does not specify these terms,2,5 psychiatrists have leeway in determining which security measures to implement. Federal law requires all businesses to delete a card’s expiration date and shorten the account information to include no more than the last 5 digits of the card number that is printed on all sales receipts.6 FTCA also requires businesses to get prior authorization from individuals before charging their credit card.2 For example, if a patient previously used a credit card to pay for a session, the psychiatrist cannot later use the credit card to charge for a missed appointment without notifying the patient and getting their authorization.2
PCI DSS applies to entities that store, process, and/or transmit cardholder data.7 Any business that accepts credit card payments must comply with PCI DSS, which includes 12 requirements.7 Examples of these requirements include using firewalls to protect cardholder data and restricting access to cardholder data to a “need-to-know” basis. Businesses that do not comply with PCI DSS can be subjected to fines and/or have their contracts terminated by the credit card companies.2 Fines can range from $5,000 to $100,000 per month for data breaches where you are found negligible.1
1. Braslow K. Benefits and costs of accepting credit cards in your practice. Current Psychiatry. 2017;16(5):17,29.
2. Wertheimer M. Keeping patient credit card and payment information on file. Psychiatric News. 2019;54(11):8.
3. Hephner L. 5 tips for proper handling of credit card information. Accessed April 22, 2020. https://paysimple.com/blog/5-tips-for-proper-handling-of-customer-credit-card-account-information/
4. Health Insurance Portability and Accountability Act of 1996. Public Law No. 104–191, 110 Stat. 1936 (1996).
5. Federal Trade Commission Act of 1914. 15 U.S.C. §§ 41-58, as amended (1914).
6. Federal Trade Commission. Slip showing? Federal law requires all businesses to truncate credit card information on receipts. Accessed April 22, 2020. https://www.ftc.gov/tips-advice/business-center/guidance/slip-showing-federal-law-requires-all-businesses-truncate
7. PCI Security Standards Council. Accessed April 22, 2020. https://www.pcisecuritystandards.org/
Credit cards have made it easier for psychiatrists who work in outpatient settings to collect payment for their services. Accepting credit cards saves time in sessions for clinical matters, leads to higher rates of collecting payments for patients who do not show up for appointments, and avoids having to manage bounced checks and collection agencies.1 No federal or state laws prohibit businesses from storing consumers’ credit card information. However, psychiatric practices are legally obligated to have safeguards in place to protect sensitive information and limit liability exposures.2 There are several steps to take when storing your patients’ credit card information.
Establish a payment policy. Create a policy that outlines your practice’s credit card procedures, including when credit cards will be charged and under what circumstances, how patients will be notified, and how credit card information will be stored.2 Give your patients a copy of this policy and review it with them at their first appointment and any time you change this policy.2 Get consent from your patients before using and storing their credit card information.2
Use secure methods to store this information. Most medical practices photocopy/write down their patients’ credit card information and store it in the patient’s electronic/paper medical record, or they use an online service to store it electronically.2 Online services usually provide a higher level of protection than the patient’s medical record.2 Ensure that electronic data that includes credit card numbers is robustly encrypted, or that paper records are locked in a secure place, such as in a safe or file drawer that requires a key/combination lock.3 Payment Card Industry (PCI) regulations prohibit storing a credit card’s security code (a three- or four-digit number on the front or back of the card).3 This code is used to allow merchants to verify whether a customer authorizing a transaction over the phone or via the internet physically possesses the card.3 PCI regulations also prohibit storing data contained in the card’s magnetic strip.3 This data contains information about the account that is not displayed on the card, assists with authorizing transactions, and ensures that credit cards cannot be easily counterfeited.3
Understand all federal and state laws and regulations. If your practice collects patient billing information, you are considered a “merchant” and are subject to federal and state laws and regulations that protect consumer credit card information.2 These laws and regulations include (but are not limited to)2:
- Health Insurance Portability and Accountability Act (HIPAA) and similar state privacy laws
- Federal Trade Commission Act (FTCA) and similar state business laws
- Payment Card Industry Data Security Standard (PCI DSS), which was not devised by federal or state government.
HIPAA and state privacy laws require psychiatrists to implement “reasonable” security measures to protect payment information, regardless of how that information is stored.2,4 Because HIPAA does not define “reasonable,” psychiatrists have latitude in determining which security measures to implement.2,4 Locking the information in a file cabinet and locking the room where the file cabinet is kept (for paper storage) or using HIPAA-compliant encrypted storage programs (for electronic storage) are examples of “reasonable” security measures.2
FTCA requires businesses to use “appropriate” and “reasonable” security measures to protect credit card information.2,5 Because FTCA does not specify these terms,2,5 psychiatrists have leeway in determining which security measures to implement. Federal law requires all businesses to delete a card’s expiration date and shorten the account information to include no more than the last 5 digits of the card number that is printed on all sales receipts.6 FTCA also requires businesses to get prior authorization from individuals before charging their credit card.2 For example, if a patient previously used a credit card to pay for a session, the psychiatrist cannot later use the credit card to charge for a missed appointment without notifying the patient and getting their authorization.2
PCI DSS applies to entities that store, process, and/or transmit cardholder data.7 Any business that accepts credit card payments must comply with PCI DSS, which includes 12 requirements.7 Examples of these requirements include using firewalls to protect cardholder data and restricting access to cardholder data to a “need-to-know” basis. Businesses that do not comply with PCI DSS can be subjected to fines and/or have their contracts terminated by the credit card companies.2 Fines can range from $5,000 to $100,000 per month for data breaches where you are found negligible.1
1. Braslow K. Benefits and costs of accepting credit cards in your practice. Current Psychiatry. 2017;16(5):17,29.
2. Wertheimer M. Keeping patient credit card and payment information on file. Psychiatric News. 2019;54(11):8.
3. Hephner L. 5 tips for proper handling of credit card information. Accessed April 22, 2020. https://paysimple.com/blog/5-tips-for-proper-handling-of-customer-credit-card-account-information/
4. Health Insurance Portability and Accountability Act of 1996. Public Law No. 104–191, 110 Stat. 1936 (1996).
5. Federal Trade Commission Act of 1914. 15 U.S.C. §§ 41-58, as amended (1914).
6. Federal Trade Commission. Slip showing? Federal law requires all businesses to truncate credit card information on receipts. Accessed April 22, 2020. https://www.ftc.gov/tips-advice/business-center/guidance/slip-showing-federal-law-requires-all-businesses-truncate
7. PCI Security Standards Council. Accessed April 22, 2020. https://www.pcisecuritystandards.org/

Private practice: The basics for psychiatry trainees
Many psychiatry trainees consider private practice as a career option or form of supplemental income. In my experience, however, residency training may provide limited introduction to the general steps involved in starting a practice. In this article, I briefly summarize what I learned while exploring the private practice option as a psychiatry resident.
A good specialty for private practice
Trainees in the earlier stages of their education should be aware that the first step toward private practice may actually occur during medical school, when they are considering which specialty to pursue. If a student is particularly interested in solo private practice, they may want to select a specialty with the potential for less overhead in an independent setting. Psychiatry typically has lower overhead costs than some other specialties. This gap widens even further with the increased popularity and acceptance of telepsychiatry.
Budgeting and finance
Once you decide to pursue private practice, you will want to consider whether you prefer solo practice or group practice, and part-time or full-time. If working for yourself, you will need to understand business planning and budgeting, including how to project revenue and expenses. When first starting in solo practice—especially if you are not taking over a previously established practice—it is useful to have secondary sources of income. This can be a part-time clinical position, working with on-demand health care companies, contracting, consulting, etc. Many new physicians begin with a full-time position and decide to initiate their private practice on a part-time basis. This approach provides a level of financial security that you otherwise would not have. However, a full-time position requires full-time energy, hours, and attention, and it can be challenging to balance full-time and part-time work. Whichever approach you decide to take, it can be most helpful to simply keep an open mind and always consider looking further into any new opportunity that interests you.
Insurance and licensing
You don’t have to wait to establish your own practice to purchase malpractice insurance. Shop around for the best rates and the coverage that most comprehensively fits your needs. If your training program allows “moonlighting,” you might need your own insurance to work at sites other than your training hospital. Many residents begin to apply for independent state licensure at the same time they begin pursuing moonlighting opportunities. It may be helpful not to wait until the last minute to do this, because the process has quite a few steps and can take a while. If your state requires letters of reference, think about which of your supervisors you can ask for one. If you plan to work in a state other than that of your training location, it may be helpful to simultaneously apply for your medical license in that state, because you will already be going through the process. Certain states offer reciprocity regarding medical licenses. The Interstate Medical Licensure Compact offers an expedited pathway to licensure for qualified physicians who want to practice in multiple states.1
Marketing your practice
Potential sources for building a panel of patients include referral networks, insurance panels, professional organizations, social media, networking, directories, and word of mouth. If you plan to accept health insurance, the directories provided by insurance panels will allow potential patients to find you when searching for practitioners who accept their plan. Professional organizations offer similar directories, and some private companies also provide directories, either for free or for a fee.
Use technology to your advantage
The exciting thing about starting a private practice today is that the technology available to support a small practice has drastically improved. Many software applications can help with scheduling and billing, which minimizes the need for office staff and enables you to be more productive. These programs typically are available via an online subscription that gives you access to an electronic medical record and other features for a monthly fee. Many of these programs provide add-ons such as a website for your practice and integrated telehealth services. While these programs typically perform many of the same functions, each has a different setup and varying workflows. An online search can facilitate a side-by-side comparison of the software programs that most closely meet your needs.
Seek out mentors and consultants
Finally, try to find a private practice mentor, and reach out to as many people as possible who have worked in any type of private practice setting. A mentor can alert you to factors you might not otherwise have considered. It also may be helpful to establish some form of supervision; such opportunities can be found through professional societies and other groups for private practice clinicians. In these groups, you also can ask other clinicians to recommend private practice and practice management consultants.
Stepping into the unknown can be an intimidating experience; however, you will not know what you are capable of until you try. Fortunately, psychiatry offers the flexibility to create a hybrid career that allows you to follow your passion and maintain your level of comfort. The American Psychiatric Association offers members additional information in the practice management resources section of its website.2
1. Interstate Medical Licensure Compact. Information for physicians. 2020. Accessed March 8, 2021. https://www.imlcc.org/information-for-physicians
2. American Psychiatric Association. Online practice handbook. 2021. Accessed March 21, 2021. https://www.psychiatry.org/psychiatrists/practice/practice-management/starting-a-practice/online-practice-handbook
Many psychiatry trainees consider private practice as a career option or form of supplemental income. In my experience, however, residency training may provide limited introduction to the general steps involved in starting a practice. In this article, I briefly summarize what I learned while exploring the private practice option as a psychiatry resident.
A good specialty for private practice
Trainees in the earlier stages of their education should be aware that the first step toward private practice may actually occur during medical school, when they are considering which specialty to pursue. If a student is particularly interested in solo private practice, they may want to select a specialty with the potential for less overhead in an independent setting. Psychiatry typically has lower overhead costs than some other specialties. This gap widens even further with the increased popularity and acceptance of telepsychiatry.
Budgeting and finance
Once you decide to pursue private practice, you will want to consider whether you prefer solo practice or group practice, and part-time or full-time. If working for yourself, you will need to understand business planning and budgeting, including how to project revenue and expenses. When first starting in solo practice—especially if you are not taking over a previously established practice—it is useful to have secondary sources of income. This can be a part-time clinical position, working with on-demand health care companies, contracting, consulting, etc. Many new physicians begin with a full-time position and decide to initiate their private practice on a part-time basis. This approach provides a level of financial security that you otherwise would not have. However, a full-time position requires full-time energy, hours, and attention, and it can be challenging to balance full-time and part-time work. Whichever approach you decide to take, it can be most helpful to simply keep an open mind and always consider looking further into any new opportunity that interests you.
Insurance and licensing
You don’t have to wait to establish your own practice to purchase malpractice insurance. Shop around for the best rates and the coverage that most comprehensively fits your needs. If your training program allows “moonlighting,” you might need your own insurance to work at sites other than your training hospital. Many residents begin to apply for independent state licensure at the same time they begin pursuing moonlighting opportunities. It may be helpful not to wait until the last minute to do this, because the process has quite a few steps and can take a while. If your state requires letters of reference, think about which of your supervisors you can ask for one. If you plan to work in a state other than that of your training location, it may be helpful to simultaneously apply for your medical license in that state, because you will already be going through the process. Certain states offer reciprocity regarding medical licenses. The Interstate Medical Licensure Compact offers an expedited pathway to licensure for qualified physicians who want to practice in multiple states.1
Marketing your practice
Potential sources for building a panel of patients include referral networks, insurance panels, professional organizations, social media, networking, directories, and word of mouth. If you plan to accept health insurance, the directories provided by insurance panels will allow potential patients to find you when searching for practitioners who accept their plan. Professional organizations offer similar directories, and some private companies also provide directories, either for free or for a fee.
Use technology to your advantage
The exciting thing about starting a private practice today is that the technology available to support a small practice has drastically improved. Many software applications can help with scheduling and billing, which minimizes the need for office staff and enables you to be more productive. These programs typically are available via an online subscription that gives you access to an electronic medical record and other features for a monthly fee. Many of these programs provide add-ons such as a website for your practice and integrated telehealth services. While these programs typically perform many of the same functions, each has a different setup and varying workflows. An online search can facilitate a side-by-side comparison of the software programs that most closely meet your needs.
Seek out mentors and consultants
Finally, try to find a private practice mentor, and reach out to as many people as possible who have worked in any type of private practice setting. A mentor can alert you to factors you might not otherwise have considered. It also may be helpful to establish some form of supervision; such opportunities can be found through professional societies and other groups for private practice clinicians. In these groups, you also can ask other clinicians to recommend private practice and practice management consultants.
Stepping into the unknown can be an intimidating experience; however, you will not know what you are capable of until you try. Fortunately, psychiatry offers the flexibility to create a hybrid career that allows you to follow your passion and maintain your level of comfort. The American Psychiatric Association offers members additional information in the practice management resources section of its website.2
1. Interstate Medical Licensure Compact. Information for physicians. 2020. Accessed March 8, 2021. https://www.imlcc.org/information-for-physicians
2. American Psychiatric Association. Online practice handbook. 2021. Accessed March 21, 2021. https://www.psychiatry.org/psychiatrists/practice/practice-management/starting-a-practice/online-practice-handbook

New Editor in Chief: Ebrahim Barkoudah, MD, MPH
With another long winter officially in the rearview mirror and spring sunshine displaying new signs of life outdoors, I am excited to share some of the changes happening inside the offices of the Journal of Clinical Outcomes Management (JCOM). It is my pleasure to introduce Ebrahim Barkoudah, MD, MPH, as the journal’s new physician Editor in Chief. Dr. Barkoudah’s extensive experience in education and his work to improve patient outcomes will be assets to JCOM.
Specializing in both internal medicine and hospital medicine, Dr. Barkoudah is the Associate Director of the Hospital Medicine Unit and a Medical Director in the Department of Medicine at Brigham and Women’s Hospital in Boston. He is also Assistant Professor of Medicine at Harvard Medical School, where he led the school’s international education efforts.
Dr. Barkoudah serves patients with a range of complex clinical disorders, managing their care and seeking innovative treatment options. His research interest is in health care outcomes as well as clinical trials of therapeutic interventions. Dr. Barkoudah also serves on numerous clinical innovation committees at Brigham Health and national task forces.
Dr. Barkoudah is an active member of several professional societies including the American College of Physicians, Society of Hospital Medicine, American Heart Association, Massachusetts Medical Society, among others. He was the Institutional Administration Fellow of the Safety and Quality Fellowship Program at the Institution for Healthcare Improvement.
On behalf of the JCOM Editorial Review Board, I want to extend a special thank you to outgoing editor Lori Tishler, MD, MPH. Dr. Tishler’s impact on the journal cannot be overstated, and we are indebted to the time and expertise she shared with the journal during her tenure.
—Eric Seger