User login
Traumatic brain injury tied to long-term sleep problems
Veterans who have suffered a traumatic brain injury (TBI) are significantly more likely to develop insomnia and other sleep problems years later compared to their counterparts who have not suffered a brain injury, a new study shows.
Results of a large longitudinal study show that those with TBI were about 40% more likely to develop insomnia, sleep apnea, excessive daytime sleepiness, or another sleep disorder in later years, after adjusting for demographics and medical and psychiatric conditions.
Interestingly, the association with sleep disorders was strongest among those with mild TBI versus a more severe brain injury.
The study showed that the risk for sleep disorders increased up to 14 years after a brain injury, an indicator that “clinicians should really pay attention to sleep disorders in TBI patients both in the short term and the long term,” study investigator Yue Leng, MD, PhD, assistant professor, department of psychiatry and behavioral sciences, University of California, San Francisco, told this news organization.
The study was published online March 3 in Neurology.
First long-term look
TBI is common among veterans, who may have sleep complaints or psychiatric symptoms, but previous studies into the consequences of TBI have examined the short- vs. long-term impact, said Dr. Leng.
To examine the longitudinal association between TBI and sleep disorders, the investigators examined data on 98,709 Veterans Health Administration patients diagnosed with TBI and an age-matched group of the same number of veterans who had not received such a diagnosis. The mean age of the participants was 49 years at baseline, and 11.7% were women. Of the TBI cases, 49.6% were mild.
Researchers used an exposure survey and diagnostic codes to establish TBI and its severity.
Patients with TBI were more likely to be male and were much more likely to have a psychiatric condition, such as a mood disorder (22.4% vs. 9.3%), anxiety (10.5% vs. 4.4%), posttraumatic stress disorder (19.5% vs. 4.4%), or substance abuse (11.4% vs. 5.2%). They were also more likely to smoke or use tobacco (13.5% vs. 8.7%).
Researchers assessed a number of sleep disorders, including insomnia, hypersomnia disorders, narcolepsy, sleep-related breathing disorders, and sleep-related movement disorders.
During a follow-up period that averaged 5 years but ranged up to 14 years, 23.4% of veterans with TBI and 15.8% of those without TBI developed a sleep disorder.
After adjusting for age, sex, race, education, and income, those who had suffered a TBI were 50% more likely to develop any sleep disorder, compared with those who had not had a TBI (hazard ratio, 1.50; 95% confidence interval, 1.47-1.53.)
After controlling for medical conditions that included diabetes, hypertension, myocardial infarction, and cerebrovascular disease, as well as psychiatric disorders such as mood disorders, anxiety, PTSD, substance use disorder, and tobacco use, the HR for developing a sleep disorder was 1.41 (95% CI, 1.37-1.44).
The association with TBI was stronger for some sleep disorders. Adjusted HRs were 1.50 (95% CI, 1.45-1.55) for insomnia, 1.50 (95% CI, 1.39-1.61) for hypersomnia, 1.33 (95% CI, 1.16-1.52) for sleep-related movement disorders, and 1.28 (95% CI, 1.24-1.32) for sleep apnea.
It’s unclear what causes postinjury sleep problems, but it could be that TBI induces structural brain damage, or it could affect melatonin secretion or wake-promoting neurons.
Damage to arousal-promoting neurons could help explain the reason the link between TBI and sleep disorders was strongest for insomnia and hypersomnia, although the exact mechanism is unclear, said Dr. Leng.
Greater risk with mild TBI
Overall, the association was stronger for mild TBI than for moderate to severe TBI. This, said Dr. Leng, might be because of differences in the brain injury mechanism.
Mild TBI often involves repetitive concussive or subconcussive injuries, such as sports injuries or blast injury among active-duty military personnel. This type of injury is more likely to cause diffuse axonal injury and inflammation, whereas moderate or severe TBI is often attributable to a direct blow with more focal but severe damage, explained Dr. Leng.
She noted that veterans with mild TBI were more likely to have a psychiatric condition, but because the study controlled for such conditions, this doesn’t fully explain the stronger association between mild TBI and sleep disorders.
Further studies are needed to sort out the exact mechanisms, she said.
The association between TBI and risk for sleep disorders was reduced somewhat but was still moderate in an analysis that excluded patients who developed a sleep disorder within 2 years of a brain injury.
This analysis, said Dr. Leng, helped ensure that the sleep disorder developed after the brain injury.
The researchers could not examine the trajectory of sleep problems, so it’s not clear whether sleep problems worsen or get better over time, said Dr. Leng.
Because PTSD also leads to sleep problems, the researchers thought that having both PTSD and TBI might increase the risk for sleep problems. “But actually we found the association was pretty similar in those with, and without, PTSD, so that was kind of contrary to our hypothesis,” she said.
The new results underline the need for more screening for sleep disorders among patients with TBI, both in the short term and the long term, said Dr. Leng. “Clinicians should ask TBI patients about their sleep, and they should follow that up,” she said.
She added that long-term sleep disorders can affect a patient’s health and can lead to psychiatric problems and neurodegenerative diseases.
Depending on the type of sleep disorder, there are a number of possible treatments. For example, for patients with sleep apnea, continuous positive airway pressure treatment may be considered.
‘Outstanding’ research
Commenting for this news organization, Frank Conidi, MD, director, Florida Center for Headache and Sports Neurology; CEO, Brainsport, Team Neurologist, the Florida Panthers of the National Hockey League; and past president, Florida Society of Neurology, said the study is “by far” the largest to investigate the correlation between sleep disorders and head trauma.
The design and outcome measures “were well thought out,” and the researchers “did an outstanding job in sorting through and analyzing the data,” said Dr. Conidi.
He added that he was particularly impressed with how the researchers addressed PTSD, which is highly prevalent among veterans with head trauma and is known to affect sleep.
The new results “solidify what those of us who see individuals with TBI have observed over the years: that there is a higher incidence of all types of sleep disorders” in individuals with a TBI, said Dr. Conidi.
However, he questioned the study’s use of guidelines to classify the various types of head trauma. These guidelines, he said, “are based on loss of consciousness, which we have started to move away from when classifying TBI.”
In addition, Dr. Conidi said he “would have loved to have seen” some correlation with neuroimaging studies, such as those used to assess subdural hematoma, epidural hematoma, subarachnoid hemorrhage, and diffuse axonal injury, but that this “could be an impetus for future studies.”
In “a perfect world,” all patients with a TBI would undergo a polysomnography study in a sleep laboratory, but insurance companies now rarely cover such studies and have attempted to have clinicians shift to home sleep studies, said Dr. Conidi. “These are marginal at best for screening for sleep disorders,” he noted.
At his centers, every TBI patient is screened for sleep disorders and, whenever possible, undergoes formal evaluation in the sleep lab, he added.
The study was supported by the U.S. Army Medical Research and Material Command and the U.S. Department of Veterans Affairs. Dr. Leng and Dr. Conidi have disclosed no relevant financial relationships.
A version of this article first appeared on Medscape.com.
Vaginal pH may predict CIN 2 progression in HIV-positive women
Elevated vaginal pH at the time of cervical intraepithelial neoplasia 2 diagnosis may be a useful marker of CIN 2 persistence/progression, as well as the rate of persistence/progression in HIV-positive women, new research suggests.
“We analyzed data from the Women’s Interagency HIV Study [WIHS], an observational, longitudinal cohort of women with and without HIV to determine factors that may influence CIN 2 natural history,” said Kate Michel, PhD, MPH, of Georgetown University, Washington. She presented the results at the Conference on Retroviruses and Opportunistic Infections.
As previous data have shown a high incidence of CIN 2 progression among women with HIV, the researchers evaluated the role of human papillomavirus (HPV) type, local immune response, and markers of the cervicovaginal microbiome on the risk of CIN 2 persistence/progression.
Within the cohort, follow-up visits occur every 6 months, and clinical data is collected via questionnaires, physical and gynecologic exams, and biological samples. As no specific treatment is offered in the WIHS, treatment for cervical abnormalities is abstracted from medical records.
In the present study, Dr. Michel and colleagues selected up to four banked cervicovaginal lavage (CVL) samples per woman, with the first sample selected 6-12 months prior to CIN 2 diagnosis, the second at CIN 2 diagnosis, the third between CIN 2 diagnosis and outcome, and the fourth at the outcome visit.
The investigators performed HPV typing and muiltiplex immune mediator testing on each CVL sample. Lab results from WIHS core testing were also extracted, including plasma CD4+ T-cell count and HIV viral load, as well as vaginal pH and Nugent’s score.
Study outcomes included persistence/progression and regression, defined as a subsequent CIN 2 or CIN 3 diagnosis and subsequent CIN 1 or normal diagnosis, respectively. Logistic regression models were used to determine CIN 2 regression versus persistence/progression.
Results
A total of 337 samples were obtained and 94 women were included in the analysis. Key demographic and behavioral factor were similar at CIN 2 diagnosis.
The majority of participants were African American (53.2%) and on antiretroviral therapy (66.0%). The most prevalent high-risk types were HPV-58 (18.4%) and HPV-16 (17.5%).
After a median 12.5 years of follow-up, 33 participants (35.1%) with incident CIN 2 had a subsequent CIN 2/CIN 3 diagnosis and those who regressed had a higher CD4 T-cell count at CIN 2 diagnosis (P = .02).
Each subsequent high-risk HPV type identified at the pre–CIN 2 visit was associated with higher odds of CIN2 persistence/progression (odds ratio, 2.27; 95% confidence interval, 1.15-4.50).
Bacterial vaginosis (adjusted OR, 5.08; 95% CI, 1.30-19.94) and vaginal pH (aOR, 2.27; 95% CI, 1.15-4.50) at the CIN 2 diagnosis visit were each associated with increased odds of CIN 2 persistence/progression.
Vaginal pH greater than 4.5 at CIN 2 diagnosis was also associated with unadjusted time to CIN 2 persistence/progression (log rank P = .002) and an increased rate of CIN 2 persistence/progression (adjusted hazard ratio, 3.37; 95% CI, 1.26-8.99).
Furthermore, among participants who did not receive CIN 2 treatment, vaginal pH remained associated with greater odds of CIN 2 persistence/progression (OR, 2.46; 95% CI, 1.19-5.13). Cervicovaginal immune mediator levels were not associated with CIN 2 persistence/progression.
“The most striking finding from this work was that vaginal pH was associated with higher odds of, quicker time to, and increased hazard of CIN 2 persistence/progression,” Dr. Michel said. “We postulate this effect is mediated by the cervical microbiome, but more work is needed to establish the exact mechanism.”
“It would be interesting to test whether this association might be explained by different vaginal cleaning techniques, such as douching,” said moderator Ronald T. Mitsuyasu, MD, of the University of California, Los Angeles.
“We’re currently working on an analysis of cervicovaginal bacterial species to explore the microbiome in more detail,” Dr. Michel concluded.
Dr. Michel disclosed no conflicts of interest. The study was supported by multiple sources, including the National Institute of Allergy and Infectious Diseases, the National Cancer Institute, and the Georgetown-Howard Universities Center for Clinical and Translational Science.
FROM CROI 2021
mCODE: Improving data sharing to enhance cancer care
An initiative designed to improve sharing of patient data may provide “tremendous benefits” in cancer care and research, according to authors of a review article.

The goals of the initiative, called Minimal Common Oncology Data Elements (mCODE), were to identify the data elements in electronic health records that are “essential” for making treatment decisions and create “a standardized computable data format” that would improve the exchange of data across EHRs, according to the mCODE website.
Travis J. Osterman, DO, of Vanderbilt University Medical Center in Nashville, Tenn., and colleagues described the mCODE initiative in a review published in JCO Clinical Cancer Informatics.
At present, commercially available EHRs are poorly designed to support modern oncology workflow, requiring laborious data entry and lacking a common library of oncology-specific discrete data elements. As an example, most EHRs poorly support the needs of precision oncology and clinical genetics, since next-generation sequencing and genetic test results are almost universally reported in PDF files.
In addition, basic, operational oncology data (e.g., cancer staging, adverse event documentation, response to treatment, etc.) are captured in EHRs primarily as an unstructured narrative.
Computable, analytical data are found for only the small percentage of patients in clinical trials. Even then, some degree of manual data abstraction is regularly required.
Interoperability of EHRs between practices and health care institutions is often so poor that the transfer of basic cancer-related information as analyzable data is difficult or even impossible.
Making progress: The 21st Century Cures Act
The American Society of Clinical Oncology has a more than 15-year history of developing oncology data standards. Unfortunately, progress in implementing these standards has been glacially slow. Impediments have included:
- A lack of conformance with clinical workflows.
- Failure to test standards on specific-use cases during pilot testing.
- A focus on data exchange, rather than the practical impediments to data entry.
- Poor engagement with EHR vendors in distributing clinical information modules with an oncology-specific focus
- Instability of data interoperability technologies.
The 21st Century Cures Act, which became law in December 2016, mandated improvement in the interoperability of health information through the development of data standards and application programming interfaces.
In early 2020, final rules for implementation required technology vendors to employ application programming interfaces using a single interoperability resource. In addition, payers were required to use the United States Core Data for Interoperability Standard for data exchange. These requirements were intended to provide patients with access to their own health care data “without special effort.”
As a fortunate byproduct, since EHR vendors are required to implement application program interfaces using the Health Level Seven International (HL7) Fast Healthcare Interoperability Resource (FHIR) Specification, the final rules could enable systems like mCODE to be more easily integrated with existing EHRs.
Lessons from CancerLinQ
ASCO created the health technology platform CancerLinQ in 2014, envisioning that it could become an oncology-focused learning health system – a system in which internal data and experience are systematically integrated with external evidence, allowing knowledge to be put into practice.
CancerLinQ extracts data from EHRs and other sources via direct software connections. CancerLinQ then aggregates, harmonizes, and normalizes the data in a cloud-based environment.
The data are available to participating practices for quality improvement in patient care and secondary research. In 2020, records of cancer patients in the CancerLinQ database surpassed 2 million.
CancerLinQ has been successful. However, because of the nature of the EHR ecosystem and the scope and variability of data capture by clinicians, supporting a true learning health system has proven to be a formidable task. Postprocessing manual review using trained human curators is laborious and unsustainable.
The CancerLinQ experience illustrated that basic cancer-pertinent data should be standardized in the EHR and collected prospectively.
The mCODE model
The mCODE initiative seeks to facilitate progress in care quality, clinical research, and health care policy by developing and maintaining a standard, computable, interoperable data format.
Guiding principles that were adopted early in mCODE’s development included:
- A collaborative, noncommercial, use case–driven developmental model.
- Iterative processes.
- User-driven development, refinement, and maintenance.
- Low ongoing maintenance requirements.
A foundational moment in mCODE’s development involved achieving consensus among stakeholders that the project would fail if EHR vendors required additional data entry by users.
After pilot work, a real-world endpoints project, working-group deliberation, public comment, and refinement, the final data standard included six primary domains: patient, disease, laboratory data/vital signs, genomics, treatment, and outcome.
Each domain is further divided into several concepts with specific associated data elements. The data elements are modeled into value sets that specify the possible values for the data element.
To test mCODE, eight organizations representing oncology EHR vendors, standards developers, and research organizations participated in a cancer interoperability track. The comments helped refine mCODE version 1.0, which was released in March 2020 and is accessible via the mCODE website.
Additions will likely be reviewed by a technical review group after external piloting of new use cases.
Innovation, not regulation
Every interaction between a patient and care provider yields information that could lead to improved safety and better outcomes. To be successful, the information must be collected in a computable format so it can be aggregated with data from other patients, analyzed without manual curation, and shared through interoperable systems. Those data should also be secure enough to protect the privacy of individual patients.
mCODE is a consensus data standard for oncology that provides an infrastructure to share patient data between oncology practices and health care systems while promising little to no additional data entry on the part of clinicians. Adoption by sites will be critical, however.
Publishing the standard through the HL7 FHIR technology demonstrated to EHR vendors and regulatory agencies the stability of HL7, an essential requirement for its incorporation into software.
EHR vendors and others are engaged in the CodeX HL7 FHIR Accelerator to design projects to expand and/or modify mCODE. Their creativity and innovativeness via the external advisory mCODE council and/or CodeX will be encouraged to help mCODE reach its full potential.
As part of CodeX, the Community of Practice, an open forum for end users, was established to provide regular updates about mCODE-related initiatives and use cases to solicit in-progress input, according to Robert S. Miller, MD, medical director of CancerLinQ and an author of the mCODE review.
For mCODE to be embraced by all stakeholders, there should be no additional regulations. By engaging stakeholders in an enterprise that supports innovation and collaboration – without additional regulation – mCODE could maximize the potential of EHRs that, until now, have assisted us only marginally in accomplishing those goals.
mCODE is a joint venture of ASCO/CancerLinQ, the Alliance for Clinical Trials in Oncology Foundation, the MITRE Corporation, the American Society for Radiation Oncology, and the Society of Surgical Oncology.
Dr. Osterman disclosed a grant from the National Cancer Institute and relationships with Infostratix, eHealth, AstraZeneca, Outcomes Insights, Biodesix, MD Outlook, GenomOncology, Cota Healthcare, GE Healthcare, and Microsoft. Dr. Miller and the third review author disclosed no conflicts of interest.
Dr. Lyss was a community-based medical oncologist and clinical researcher for more than 35 years before his recent retirement. His clinical and research interests were focused on breast and lung cancers, as well as expanding clinical trial access to medically underserved populations. He is based in St. Louis. He has no conflicts of interest.
An initiative designed to improve sharing of patient data may provide “tremendous benefits” in cancer care and research, according to authors of a review article.
The goals of the initiative, called Minimal Common Oncology Data Elements (mCODE), were to identify the data elements in electronic health records that are “essential” for making treatment decisions and create “a standardized computable data format” that would improve the exchange of data across EHRs, according to the mCODE website.
Travis J. Osterman, DO, of Vanderbilt University Medical Center in Nashville, Tenn., and colleagues described the mCODE initiative in a review published in JCO Clinical Cancer Informatics.
At present, commercially available EHRs are poorly designed to support modern oncology workflow, requiring laborious data entry and lacking a common library of oncology-specific discrete data elements. As an example, most EHRs poorly support the needs of precision oncology and clinical genetics, since next-generation sequencing and genetic test results are almost universally reported in PDF files.
In addition, basic, operational oncology data (e.g., cancer staging, adverse event documentation, response to treatment, etc.) are captured in EHRs primarily as an unstructured narrative.
Computable, analytical data are found for only the small percentage of patients in clinical trials. Even then, some degree of manual data abstraction is regularly required.
Interoperability of EHRs between practices and health care institutions is often so poor that the transfer of basic cancer-related information as analyzable data is difficult or even impossible.
Making progress: The 21st Century Cures Act
The American Society of Clinical Oncology has a more than 15-year history of developing oncology data standards. Unfortunately, progress in implementing these standards has been glacially slow. Impediments have included:
- A lack of conformance with clinical workflows.
- Failure to test standards on specific-use cases during pilot testing.
- A focus on data exchange, rather than the practical impediments to data entry.
- Poor engagement with EHR vendors in distributing clinical information modules with an oncology-specific focus
- Instability of data interoperability technologies.
The 21st Century Cures Act, which became law in December 2016, mandated improvement in the interoperability of health information through the development of data standards and application programming interfaces.
In early 2020, final rules for implementation required technology vendors to employ application programming interfaces using a single interoperability resource. In addition, payers were required to use the United States Core Data for Interoperability Standard for data exchange. These requirements were intended to provide patients with access to their own health care data “without special effort.”
As a fortunate byproduct, since EHR vendors are required to implement application program interfaces using the Health Level Seven International (HL7) Fast Healthcare Interoperability Resource (FHIR) Specification, the final rules could enable systems like mCODE to be more easily integrated with existing EHRs.
Lessons from CancerLinQ
ASCO created the health technology platform CancerLinQ in 2014, envisioning that it could become an oncology-focused learning health system – a system in which internal data and experience are systematically integrated with external evidence, allowing knowledge to be put into practice.
CancerLinQ extracts data from EHRs and other sources via direct software connections. CancerLinQ then aggregates, harmonizes, and normalizes the data in a cloud-based environment.
The data are available to participating practices for quality improvement in patient care and secondary research. In 2020, records of cancer patients in the CancerLinQ database surpassed 2 million.
CancerLinQ has been successful. However, because of the nature of the EHR ecosystem and the scope and variability of data capture by clinicians, supporting a true learning health system has proven to be a formidable task. Postprocessing manual review using trained human curators is laborious and unsustainable.
The CancerLinQ experience illustrated that basic cancer-pertinent data should be standardized in the EHR and collected prospectively.
The mCODE model
The mCODE initiative seeks to facilitate progress in care quality, clinical research, and health care policy by developing and maintaining a standard, computable, interoperable data format.
Guiding principles that were adopted early in mCODE’s development included:
- A collaborative, noncommercial, use case–driven developmental model.
- Iterative processes.
- User-driven development, refinement, and maintenance.
- Low ongoing maintenance requirements.
A foundational moment in mCODE’s development involved achieving consensus among stakeholders that the project would fail if EHR vendors required additional data entry by users.
After pilot work, a real-world endpoints project, working-group deliberation, public comment, and refinement, the final data standard included six primary domains: patient, disease, laboratory data/vital signs, genomics, treatment, and outcome.
Each domain is further divided into several concepts with specific associated data elements. The data elements are modeled into value sets that specify the possible values for the data element.
To test mCODE, eight organizations representing oncology EHR vendors, standards developers, and research organizations participated in a cancer interoperability track. The comments helped refine mCODE version 1.0, which was released in March 2020 and is accessible via the mCODE website.
Additions will likely be reviewed by a technical review group after external piloting of new use cases.
Innovation, not regulation
Every interaction between a patient and care provider yields information that could lead to improved safety and better outcomes. To be successful, the information must be collected in a computable format so it can be aggregated with data from other patients, analyzed without manual curation, and shared through interoperable systems. Those data should also be secure enough to protect the privacy of individual patients.
mCODE is a consensus data standard for oncology that provides an infrastructure to share patient data between oncology practices and health care systems while promising little to no additional data entry on the part of clinicians. Adoption by sites will be critical, however.
Publishing the standard through the HL7 FHIR technology demonstrated to EHR vendors and regulatory agencies the stability of HL7, an essential requirement for its incorporation into software.
EHR vendors and others are engaged in the CodeX HL7 FHIR Accelerator to design projects to expand and/or modify mCODE. Their creativity and innovativeness via the external advisory mCODE council and/or CodeX will be encouraged to help mCODE reach its full potential.
As part of CodeX, the Community of Practice, an open forum for end users, was established to provide regular updates about mCODE-related initiatives and use cases to solicit in-progress input, according to Robert S. Miller, MD, medical director of CancerLinQ and an author of the mCODE review.
For mCODE to be embraced by all stakeholders, there should be no additional regulations. By engaging stakeholders in an enterprise that supports innovation and collaboration – without additional regulation – mCODE could maximize the potential of EHRs that, until now, have assisted us only marginally in accomplishing those goals.
mCODE is a joint venture of ASCO/CancerLinQ, the Alliance for Clinical Trials in Oncology Foundation, the MITRE Corporation, the American Society for Radiation Oncology, and the Society of Surgical Oncology.
Dr. Osterman disclosed a grant from the National Cancer Institute and relationships with Infostratix, eHealth, AstraZeneca, Outcomes Insights, Biodesix, MD Outlook, GenomOncology, Cota Healthcare, GE Healthcare, and Microsoft. Dr. Miller and the third review author disclosed no conflicts of interest.
Dr. Lyss was a community-based medical oncologist and clinical researcher for more than 35 years before his recent retirement. His clinical and research interests were focused on breast and lung cancers, as well as expanding clinical trial access to medically underserved populations. He is based in St. Louis. He has no conflicts of interest.
FROM JCO CLINICAL CANCER INFORMATICS
Thick Hyperkeratotic Plaques on the Palms and Soles
The Diagnosis: Keratoderma Climactericum
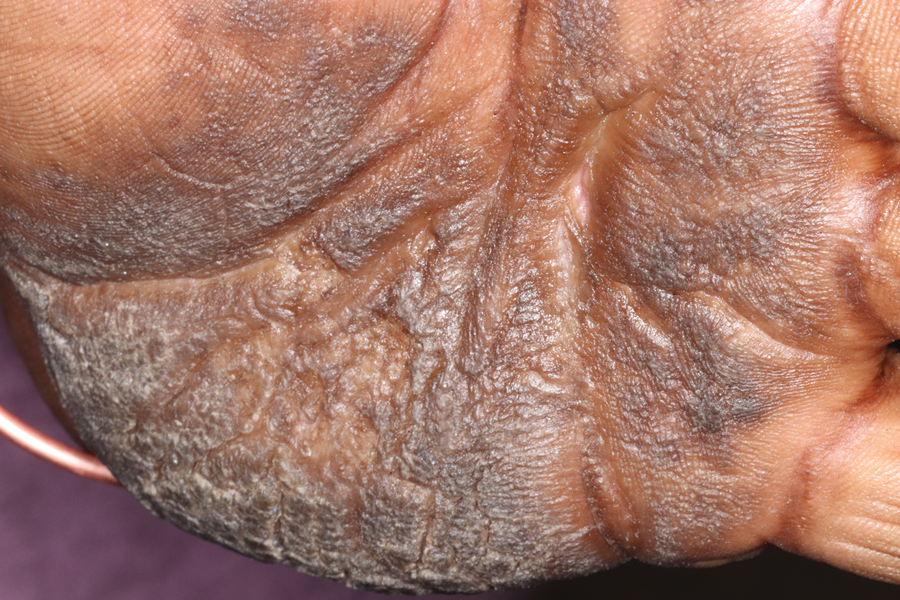
Keratoderma climactericum was first reported in 1934 by Haxthausen1 as nonpruritic circumscribed hyperkeratosis located mainly on the palms and soles. The initial eruption was described as discrete lesions with an oval or round shape that progressed to less-defined, confluent, hyperkeratotic patches with fissures.1 Keratoderma climactericum also may be referred to as Haxthausen disease and is considered an acquired palmoplantar keratoderma.2
Keratoderma climactericum is a rare dermatologic disorder that presents in women of menopausal age who have no family or personal history of skin disease. Keratoderma climactericum is associated with hypertension and obesity.2 Keratotic lesions usually first occur on the plantar surfaces with eventual development of fissuring and hyperkeratosis that causes painful walking. The keratotic lesions on the plantar surfaces often are nonpruritic and gradually become confluent over time. As the disease progresses, keratotic lesions appear on the central palms, which can lead to confluent hyperkeratosis on the palmar surfaces (Figure 1).2 The exact mechanism of keratoderma climactericum has not been described but is believed to be due to hormonal dysregulation.2
In 1986, Deschamps et al3 presented 10 cases of keratoderma climactericum occurring in menopausal women with an average age of 57 years. The lesions began on the soles at areas of greatest pressure. Histopathology for each patient showed orthokeratotic hyperkeratosis, irregular hyperplasia, interpapillary ridges, and exocytosis of lymphocytes in the epidermis. Seven patients were treated with etretinate, which first led to the removal of palmar lesions, followed by improvement in plantar lesions and pain when walking. There was no association of keratoderma climactericum and sex hormones, as hormone levels were negative or normal for each patient.3
Three cases of keratoderma climactericum following bilateral oophorectomy in young women were reported by Wachtel4 in 1981. Unlike in women of menopausal age, there was no association of keratoderma climactericum with hypertension or obesity. Additionally, the lesions on the palms and soles were more diffusely distributed than in women of menopausal age. Estrogen administration completely reversed each patient's hyperkeratotic palms and soles.4 A definitive pathogenic role of estrogens in the development of keratoderma climactericum has yet to be determined.2
Histopathology is not specific for keratoderma climactericum, making the disease a clinical diagnosis. However, a biopsy may be useful to rule out palmoplantar psoriasis.2 Clinical information such as the age and sex of the patient, distribution of disease, presence of fissuring, and progression of disease from soles to palms should be considered when making a diagnosis of keratoderma climactericum. The differential diagnosis of keratoderma climactericum should include fungal infections, contact dermatitis, irritant dermatitis, psoriasis, atopic dermatitis, underlying malignancy, and pityriasis rubra pilaris.
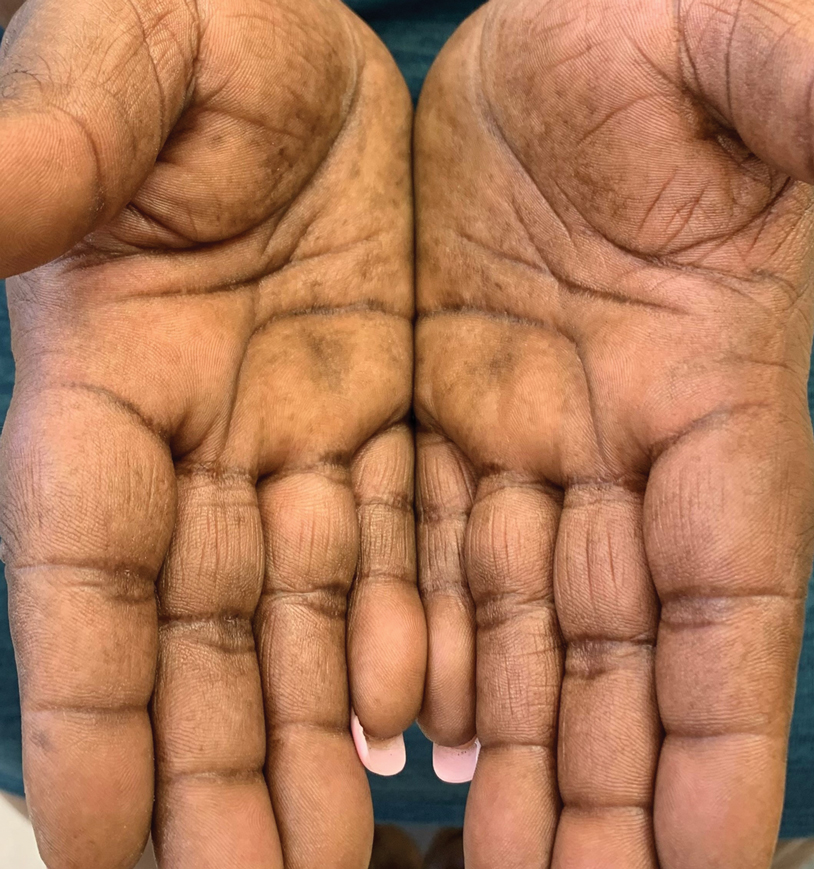
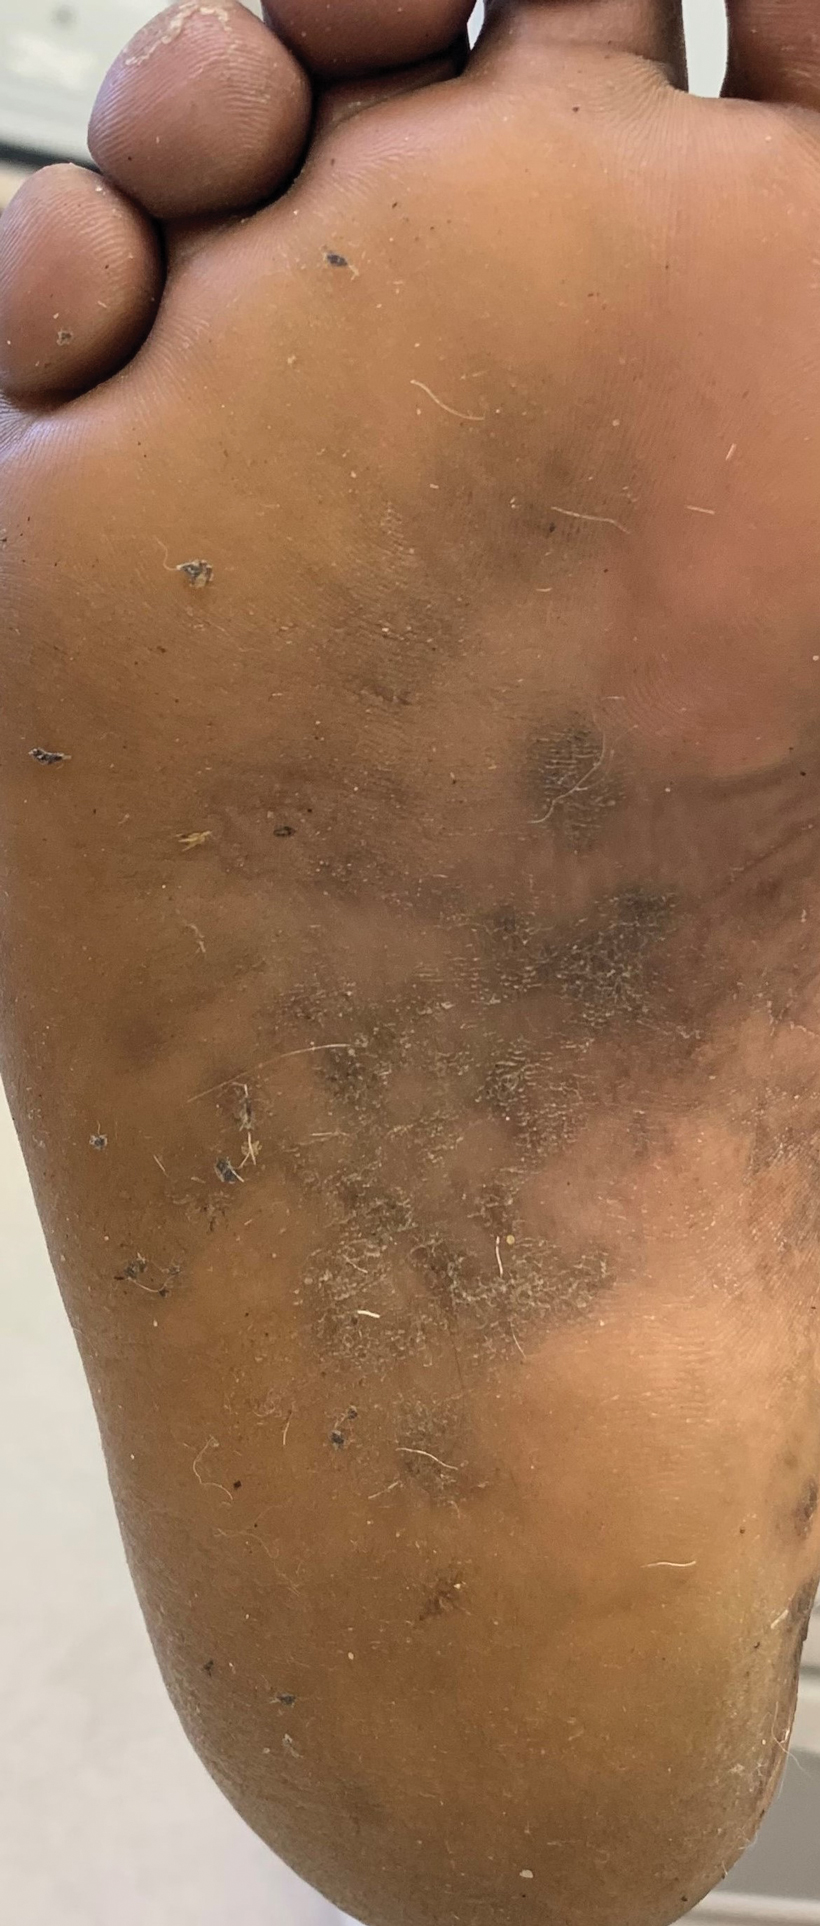
Treatment options for keratoderma climactericum include salicylic acid, emollients, oral retinoids, urea ointments, estriol cream, and topical steroids.5,6 Our patient was prescribed acitretin 25 mg daily and ammonium lactate to apply topically as needed for dry skin. Five months after the initial presentation, fissures and dry skin on the bilateral soles were still present. Ammonium lactate was discontinued, and the patient was prescribed urea cream 40%. Fifteen months after the initial presentation, the patient reported substantial improvement on the hands and feet and noted that she no longer needed the urea cream. Physical examination revealed no presence of hyperkeratosis or fissuring on the palms (Figure 2), and mild hyperkeratosis was present on the plantar surfaces of the feet (Figure 3). The patient continued to use acitretin to prevent disease relapse.
Keratoderma climactericum is an unusual and debilitating condition that occurs in women of menopausal age. It is diagnosed by its specific clinical presentation. More common diagnoses such as tinea and dermatitis should be ruled out before considering keratoderma climactericum.
- Haxthausen H. Keratoderma climactericum. Br J Dermatol. 1934;46:161-167.
- Patel S, Zirwas M, English JC. Acquired palmoplantar keratoderma. Am J Clin Dermatol. 2007;8:1-11.
- Deschamps P, Leroy D, Pedailles S, et al. Keratoderma climactericum (Haxthausen's disease): clinical signs, laboratory findings and etretinate treatment in 10 patients. Dermatologica. 1986;172:258-262.
- Wachtel TJ. Plantar and palmar hyperkeratosis in young castrated women. Int J Dermatol. 1981;20:270-271.
- Bristow I. The management of heel fissures using a steroid impregnated tape (Haelan) in a patient with Keratoderma climactericum. Podiatry Now. 2008;11:22-23.
- Mendes-Bastos P. Plantar keratoderma climactericum: successful improvement with a topical estriol cream. J Cosmet Dermatol. 2018;17:811-813.
The Diagnosis: Keratoderma Climactericum
Keratoderma climactericum was first reported in 1934 by Haxthausen1 as nonpruritic circumscribed hyperkeratosis located mainly on the palms and soles. The initial eruption was described as discrete lesions with an oval or round shape that progressed to less-defined, confluent, hyperkeratotic patches with fissures.1 Keratoderma climactericum also may be referred to as Haxthausen disease and is considered an acquired palmoplantar keratoderma.2
Keratoderma climactericum is a rare dermatologic disorder that presents in women of menopausal age who have no family or personal history of skin disease. Keratoderma climactericum is associated with hypertension and obesity.2 Keratotic lesions usually first occur on the plantar surfaces with eventual development of fissuring and hyperkeratosis that causes painful walking. The keratotic lesions on the plantar surfaces often are nonpruritic and gradually become confluent over time. As the disease progresses, keratotic lesions appear on the central palms, which can lead to confluent hyperkeratosis on the palmar surfaces (Figure 1).2 The exact mechanism of keratoderma climactericum has not been described but is believed to be due to hormonal dysregulation.2
In 1986, Deschamps et al3 presented 10 cases of keratoderma climactericum occurring in menopausal women with an average age of 57 years. The lesions began on the soles at areas of greatest pressure. Histopathology for each patient showed orthokeratotic hyperkeratosis, irregular hyperplasia, interpapillary ridges, and exocytosis of lymphocytes in the epidermis. Seven patients were treated with etretinate, which first led to the removal of palmar lesions, followed by improvement in plantar lesions and pain when walking. There was no association of keratoderma climactericum and sex hormones, as hormone levels were negative or normal for each patient.3
Three cases of keratoderma climactericum following bilateral oophorectomy in young women were reported by Wachtel4 in 1981. Unlike in women of menopausal age, there was no association of keratoderma climactericum with hypertension or obesity. Additionally, the lesions on the palms and soles were more diffusely distributed than in women of menopausal age. Estrogen administration completely reversed each patient's hyperkeratotic palms and soles.4 A definitive pathogenic role of estrogens in the development of keratoderma climactericum has yet to be determined.2
Histopathology is not specific for keratoderma climactericum, making the disease a clinical diagnosis. However, a biopsy may be useful to rule out palmoplantar psoriasis.2 Clinical information such as the age and sex of the patient, distribution of disease, presence of fissuring, and progression of disease from soles to palms should be considered when making a diagnosis of keratoderma climactericum. The differential diagnosis of keratoderma climactericum should include fungal infections, contact dermatitis, irritant dermatitis, psoriasis, atopic dermatitis, underlying malignancy, and pityriasis rubra pilaris.
Treatment options for keratoderma climactericum include salicylic acid, emollients, oral retinoids, urea ointments, estriol cream, and topical steroids.5,6 Our patient was prescribed acitretin 25 mg daily and ammonium lactate to apply topically as needed for dry skin. Five months after the initial presentation, fissures and dry skin on the bilateral soles were still present. Ammonium lactate was discontinued, and the patient was prescribed urea cream 40%. Fifteen months after the initial presentation, the patient reported substantial improvement on the hands and feet and noted that she no longer needed the urea cream. Physical examination revealed no presence of hyperkeratosis or fissuring on the palms (Figure 2), and mild hyperkeratosis was present on the plantar surfaces of the feet (Figure 3). The patient continued to use acitretin to prevent disease relapse.
Keratoderma climactericum is an unusual and debilitating condition that occurs in women of menopausal age. It is diagnosed by its specific clinical presentation. More common diagnoses such as tinea and dermatitis should be ruled out before considering keratoderma climactericum.
- Haxthausen H. Keratoderma climactericum. Br J Dermatol. 1934;46:161-167.
- Patel S, Zirwas M, English JC. Acquired palmoplantar keratoderma. Am J Clin Dermatol. 2007;8:1-11.
- Deschamps P, Leroy D, Pedailles S, et al. Keratoderma climactericum (Haxthausen's disease): clinical signs, laboratory findings and etretinate treatment in 10 patients. Dermatologica. 1986;172:258-262.
- Wachtel TJ. Plantar and palmar hyperkeratosis in young castrated women. Int J Dermatol. 1981;20:270-271.
- Bristow I. The management of heel fissures using a steroid impregnated tape (Haelan) in a patient with Keratoderma climactericum. Podiatry Now. 2008;11:22-23.
- Mendes-Bastos P. Plantar keratoderma climactericum: successful improvement with a topical estriol cream. J Cosmet Dermatol. 2018;17:811-813.
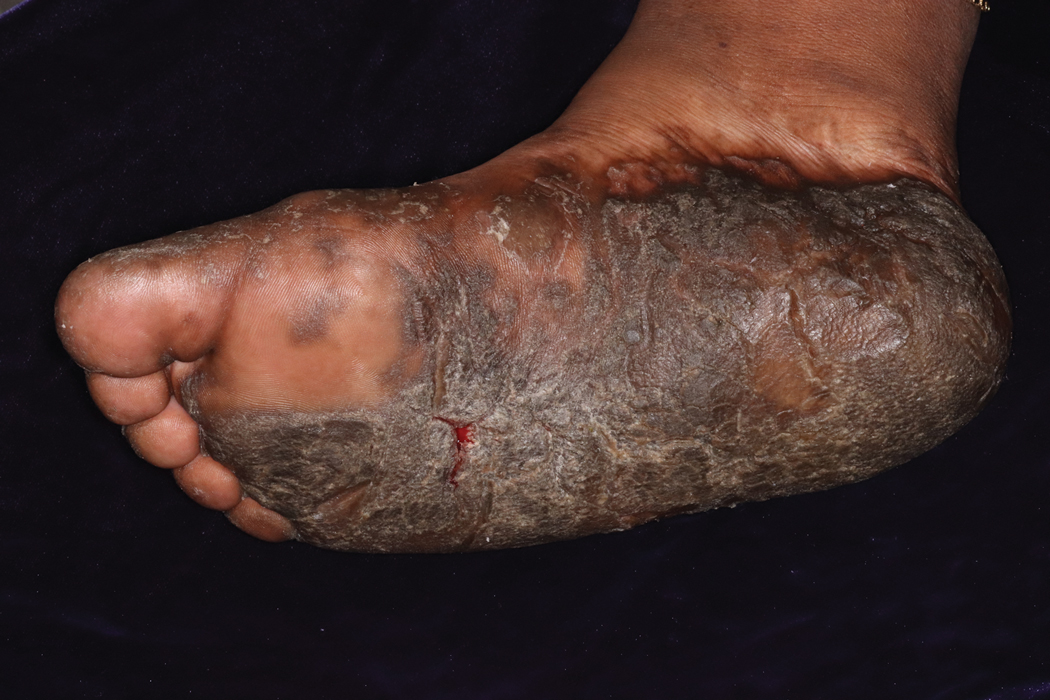
A 52-year-old woman with a history of rheumatoid arthritis presented with a rash on the palms and soles of 7 years' duration that started around the onset of menopause. Physical examination revealed thick hyperkeratotic plaques with multiple deep fissures on the palms and soles. The patient's current medications included methotrexate for rheumatoid arthritis. She previously had been prescribed adalimumab by an outside physician for the rash, which provided no relief, and currently was using urea ointment, which caused a burning sensation on the palms and soles. The patient denied a personal or family history of psoriasis.
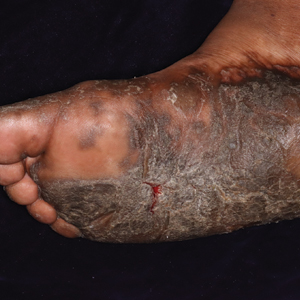
Self-management techniques help relieve lower urinary tract symptoms

The researchers reviewed the literature and analyzed eight randomized controlled trials enrolling a total of 1,006 men, who were experiencing lower urinary tract symptoms, according to the paper published in the Annals of Family Medicine. The self-management techniques practiced by patients as part of the trials included adjusting the timing of when patients drank fluids, reducing or eliminating caffeine and alcohol, adjusting the schedules of or replacing medications for other conditions, adjusting patients’ habits for urinating, and performing pelvic floor exercises for better performance of muscles controlling urination.
“Self-management interventions for lower urinary tract symptoms should be considered as a cheap and safe alternative to drug interventions with unfavorable safety profiles,” said study author Loai Albarqouni, MD, MSc, PhD, a post-doctoral fellow at Bond University in Australia.
Self-management yielded better results than usual care
Some of the symptoms experienced by participants in the trials included increased frequency of urination, urgency of urination, urination hesitancy, and dribbling. The researchers excluded research involving men with LUTS attributed to infections, those with prostate cancer, men who had undergone prostate surgery, and men with neurologic conditions.
Self-management techniques, which frequently included watchful waiting, significantly reduced symptom severity, compared with usual care in two of the trials, which included a total of 350 participants. Symptom severity was measured using the International Prostate Symptom Score (IPSS), with a mean difference of 7.44 points in favor of self-management (95% confidence interval, –8.82 to –6.06). A drop of 3 points on the IPSS scale is considered clinically meaningful.
The researchers found no difference in symptom severity at 6-12 weeks between self-management and drug therapy in their analysis of four trials that compared these approaches. Self-management resulted in better results in terms of waking at night because of the need to urinate, but there was no difference in the number of times urinating per day.
In two of the studies, investigators examined a combined self-management and drug therapy approach, compared with drug therapy by itself. In one of these studies, which included 133 participants, using the combination of treatments resulted in significantly lower symptom severity, compared with using drug therapy alone at 6 weeks, on the IPSS, with a mean difference of 2.30 (95% CI, –4.11 to –0.49).
One study involving men with involuntary loss of urine immediately after urination compared utilizing counseling, pelvic floor exercises, and urethral milking to work urine through the urethra. Pelvic floor exercise was the most effective at reducing urine loss.
Study author Dr. Albarqouni said better tools for physician education could help with implementing these strategies more effectively.
Analysis draws more attention to self-management approaches for men
Outside experts said that, while self-management approaches for these symptoms have long been recognized for women, this analysis draws more attention to the growing use of self-management approaches for men. They noted that hurdles, such as time constraints and physician education on proper technique, remain.

“Evidence suggests that the regular use of nondrug interventions is suboptimal for various reasons, including the inadequate reporting of the details of the interventions in the literature,” Dr. Albarqouni said.
Camille Vaughan, MD, MS, assistant professor of medicine at Emory University, where she has researched lower urinary tract symptoms, said advising patients on self-care is common in her practice, but should be more widely adopted in primary care.
Many patients don’t want to add to drugs that are often already a long list of medications, for fear of side effects and interactions, she said.
“If there are behavioral-based approaches that are appropriate, they’re often really interested in those strategies,” she said.
Barriers include the time it takes to teach patients these strategies and the confidence of the physicians themselves to instruct patients correctly, Dr. Vaughan said. Some physicians might be interested in the self-management approach for their patients, but “may not feel like they have all of the information at hand to share with patients,” she added.
“I think there are several decades of work showing the benefit of these types of strategies in women,” she said. “It’s relatively recent for men.” The analysis is a useful summary, she said.
“I think this should be really encouraging for providers and patients alike, because it’s highlighting the benefits of behavior and lifestyle-based strategies. A lot of these issues are going to impact men as they age,” she added.
High-quality data on self-management techniques have been limited
Scott Bauer, MD, MS, assistant professor of medicine at the University of California, San Francisco, and general internist at the San Francisco VA Medical Center, said he often prescribes self-management but has often had to review primary data from smaller trials and adapt that information to his own practice.

“I have felt like, for a long time, there’s been a lack of high-quality data and good synthesis of that data to really guide what I should specifically be recommending,” he said. “I’m very happy to see efforts to try to synthesize the data in a more comprehensive way and maybe work toward guidelines that can be applied more easily in clinical care.” It shows, he said, that “there is a decent amount of signal that should really be taken seriously both in a clinical context and for future research studies.”
Dr. Bauer noted that there is still a need to identify which patients are best suited for which approaches.
“We are very poor at diagnosing the specific etiology of LUTS – we don’t have great diagnostic tests or even phenotyping, and so that leaves clinicians with a very heterogeneous group of patients who all have the same syndrome of symptoms,” he explained. “But we don’t have much to guide us in terms of identifying who would benefit most from self-management overall, who would benefit from specific self-management techniques, and who would benefit from medication to target very specific mechanisms.”
Dr. Vaughan reported receiving funding from the Department of Veterans Affairs and National institutes of Health for research related to urinary symptom management, and that her spouse is an employee of Kimberly-Clark, which makes adult care products. Dr. Albarqouni and Dr. Bauer reported no relevant financial disclosures.
The researchers reviewed the literature and analyzed eight randomized controlled trials enrolling a total of 1,006 men, who were experiencing lower urinary tract symptoms, according to the paper published in the Annals of Family Medicine. The self-management techniques practiced by patients as part of the trials included adjusting the timing of when patients drank fluids, reducing or eliminating caffeine and alcohol, adjusting the schedules of or replacing medications for other conditions, adjusting patients’ habits for urinating, and performing pelvic floor exercises for better performance of muscles controlling urination.
“Self-management interventions for lower urinary tract symptoms should be considered as a cheap and safe alternative to drug interventions with unfavorable safety profiles,” said study author Loai Albarqouni, MD, MSc, PhD, a post-doctoral fellow at Bond University in Australia.
Self-management yielded better results than usual care
Some of the symptoms experienced by participants in the trials included increased frequency of urination, urgency of urination, urination hesitancy, and dribbling. The researchers excluded research involving men with LUTS attributed to infections, those with prostate cancer, men who had undergone prostate surgery, and men with neurologic conditions.
Self-management techniques, which frequently included watchful waiting, significantly reduced symptom severity, compared with usual care in two of the trials, which included a total of 350 participants. Symptom severity was measured using the International Prostate Symptom Score (IPSS), with a mean difference of 7.44 points in favor of self-management (95% confidence interval, –8.82 to –6.06). A drop of 3 points on the IPSS scale is considered clinically meaningful.
The researchers found no difference in symptom severity at 6-12 weeks between self-management and drug therapy in their analysis of four trials that compared these approaches. Self-management resulted in better results in terms of waking at night because of the need to urinate, but there was no difference in the number of times urinating per day.
In two of the studies, investigators examined a combined self-management and drug therapy approach, compared with drug therapy by itself. In one of these studies, which included 133 participants, using the combination of treatments resulted in significantly lower symptom severity, compared with using drug therapy alone at 6 weeks, on the IPSS, with a mean difference of 2.30 (95% CI, –4.11 to –0.49).
One study involving men with involuntary loss of urine immediately after urination compared utilizing counseling, pelvic floor exercises, and urethral milking to work urine through the urethra. Pelvic floor exercise was the most effective at reducing urine loss.
Study author Dr. Albarqouni said better tools for physician education could help with implementing these strategies more effectively.
Analysis draws more attention to self-management approaches for men
Outside experts said that, while self-management approaches for these symptoms have long been recognized for women, this analysis draws more attention to the growing use of self-management approaches for men. They noted that hurdles, such as time constraints and physician education on proper technique, remain.
“Evidence suggests that the regular use of nondrug interventions is suboptimal for various reasons, including the inadequate reporting of the details of the interventions in the literature,” Dr. Albarqouni said.
Camille Vaughan, MD, MS, assistant professor of medicine at Emory University, where she has researched lower urinary tract symptoms, said advising patients on self-care is common in her practice, but should be more widely adopted in primary care.
Many patients don’t want to add to drugs that are often already a long list of medications, for fear of side effects and interactions, she said.
“If there are behavioral-based approaches that are appropriate, they’re often really interested in those strategies,” she said.
Barriers include the time it takes to teach patients these strategies and the confidence of the physicians themselves to instruct patients correctly, Dr. Vaughan said. Some physicians might be interested in the self-management approach for their patients, but “may not feel like they have all of the information at hand to share with patients,” she added.
“I think there are several decades of work showing the benefit of these types of strategies in women,” she said. “It’s relatively recent for men.” The analysis is a useful summary, she said.
“I think this should be really encouraging for providers and patients alike, because it’s highlighting the benefits of behavior and lifestyle-based strategies. A lot of these issues are going to impact men as they age,” she added.
High-quality data on self-management techniques have been limited
Scott Bauer, MD, MS, assistant professor of medicine at the University of California, San Francisco, and general internist at the San Francisco VA Medical Center, said he often prescribes self-management but has often had to review primary data from smaller trials and adapt that information to his own practice.
“I have felt like, for a long time, there’s been a lack of high-quality data and good synthesis of that data to really guide what I should specifically be recommending,” he said. “I’m very happy to see efforts to try to synthesize the data in a more comprehensive way and maybe work toward guidelines that can be applied more easily in clinical care.” It shows, he said, that “there is a decent amount of signal that should really be taken seriously both in a clinical context and for future research studies.”
Dr. Bauer noted that there is still a need to identify which patients are best suited for which approaches.
“We are very poor at diagnosing the specific etiology of LUTS – we don’t have great diagnostic tests or even phenotyping, and so that leaves clinicians with a very heterogeneous group of patients who all have the same syndrome of symptoms,” he explained. “But we don’t have much to guide us in terms of identifying who would benefit most from self-management overall, who would benefit from specific self-management techniques, and who would benefit from medication to target very specific mechanisms.”
Dr. Vaughan reported receiving funding from the Department of Veterans Affairs and National institutes of Health for research related to urinary symptom management, and that her spouse is an employee of Kimberly-Clark, which makes adult care products. Dr. Albarqouni and Dr. Bauer reported no relevant financial disclosures.
Some minorities underrepresented on liver transplant waiting lists
Non-Hispanic Black and Hispanic patients are underrepresented on many liver transplant waiting lists, whereas non-Hispanic White patients are often overrepresented, according to data from 109 centers.

While racial disparities “greatly diminished” after placement on a waiting list, which suggests recent progress in the field, pre–wait-listing disparities may be more challenging to overcome, reported lead author Curtis Warren, MPH, CPH, of the University of Florida, Gainesville, and colleagues.
“In 2020, the Organ Procurement and Transplantation Network implemented a new allocation system for liver transplantation based on concentric circles of geographic proximity rather than somewhat arbitrarily delineated Donor Service Areas (DSAs),” the investigators wrote in Journal of the American College of Surgeons. “Although this was a step toward improving and equalizing access to lifesaving organs for those on the liver transplant wait list, the listing process determining which patients will be considered for transplantation has continued to be a significant hurdle.”
The process is “rife with impediments to equal access to listing,” according to Dr. Warren and colleagues; getting on a waiting list can be affected by factors such as inequitable access to primary care, lack of private health insurance, and subjective selection by transplant centers.
To better characterize these impediments, the investigators gathered center-specific data from the Scientific Registry of Transplant Recipients and the U.S. Census Bureau. The final dataset included 30,353 patients from treated at 109 transplant centers, each of which performed more than 250 transplants between January 2013 and December 2018. The investigators compared waiting list data for each center with demographics from its DSA. Primary variables included race/ethnicity, education level, poverty, and insurance coverage.
Multiple logistic regression analysis was used to compare expected waiting list demographics with observed waiting list demographics with the aid of observed/expected ratios for each race/ethnicity. Univariate and multivariate analyses were used to identify significant predictors, including covariates such as age at listing, distance traveled to transplant center, and center type.
On an adjusted basis, the observed/expected ratios showed that non-Hispanic Black patients were underrepresented on waiting lists at 88 out of 109 centers (81%) and Hispanic patients were underrepresented at 68 centers (62%). In contrast, non-Hispanic White patients were overrepresented on waiting lists at 65 centers (58%). Non-Hispanic White patients were underrepresented on waiting lists at 49 centers, or 45%. Minority underrepresentation was further supported by mean MELD (Model for End-Stage Liver Disease) scores, which were significantly higher among non-Hispanic Black patients (20.2) and Hispanic patients (19.4), compared with non-Hispanic White patients (18.7) (P < .0001 for all) at the time of wait-listing.
Based on the multivariate model, underrepresentation among Black patients was most common in areas with a higher proportion of Black individuals in the population, longer travel distances to transplant centers, and a higher rate of private insurance among transplant recipients. For Hispanic patients, rates of private insurance alone predicted underrepresentation.
Once patients were listed, however, these disparities faded. Non-Hispanic Black patients accounted for 9.8% of all transplants across all hospitals, compared with 7.9% of wait-listed individuals (P < .0001). At approximately two out of three hospitals (65%), the transplanted percentage of Black patients exceeded the wait-listed percentage (P = .002).
“Data from this study show that the wait lists at many transplant centers in the United States underrepresent minority populations, compared with what would be expected based on their service areas,” the investigators concluded. “Future work will need to be devoted to increasing awareness of these trends to promote equitable access to listing for liver transplantation.”
Looking at social determinants of health
According to Lauren D. Nephew, MD, MSc, MAE, of Indiana University, Indianapolis, “The question of access to care is particularly important at this juncture as we examine the inequities that COVID-19 exposed in access to care for racial minorities, and as we prepare for potential changes to health insurance coverage with the new administration.”

Dr. Nephew noted that the reported racial disparities stem from social determinants of health, such as proximity to transplant centers and type of insurance coverage.
“Another striking finding was that the disparity in wait-listing non-Hispanic Black patients increased with the percentage of non-Hispanic Black patients living in the area, further highlighting barriers in access to care in majority Black neighborhoods,” she said. “Inequities such as these are unacceptable, given our mandate to distribute organs in a fair and equitable fashion, and they require prospective studies for further examination.”
Identifying discrimination
Lanla Conteh, MD, MPH, of the Ohio State University Wexner Medical Center, Columbus, described how these inequities are magnified through bias in patient selection.

“Often times two very similar patients may present with the same medical profile and social circumstances; however, one is turned down,” she said. “Often the patient turned down is the non-Hispanic Black patient while the non-Hispanic White patient is given a pass.”
Dr. Conteh suggested that the first step in fixing this bias is recognizing that it is a problem and calling it by its proper name.
“As transplant centers, in order to address and change these significant disparities, we must first be willing to acknowledge that they do exist,” she said. “Only then can we move to the next step of developing awareness and methods to actively combat what we should label as systemic discrimination in medicine. Transplantation is a lifesaving treatment for many patients with decompensated liver disease or liver cancer. Ensuring equitable access for all patients and populations is of paramount importance.”
The study was supported by a Health Resources and Services Administration contract, as well as grants from the National Institutes of Health/National Institute of Diabetes and Digestive and Kidney Diseases. The investigators and interviewees reported no conflicts of interest.
AGA applauds researchers who are working to raise our awareness of health disparities in digestive diseases. AGA is committed to addressing this important societal issue head on. Learn more about AGA’s commitment through the AGA Equity Project.
This article was updated Mar. 12, 2021.
Non-Hispanic Black and Hispanic patients are underrepresented on many liver transplant waiting lists, whereas non-Hispanic White patients are often overrepresented, according to data from 109 centers.
While racial disparities “greatly diminished” after placement on a waiting list, which suggests recent progress in the field, pre–wait-listing disparities may be more challenging to overcome, reported lead author Curtis Warren, MPH, CPH, of the University of Florida, Gainesville, and colleagues.
“In 2020, the Organ Procurement and Transplantation Network implemented a new allocation system for liver transplantation based on concentric circles of geographic proximity rather than somewhat arbitrarily delineated Donor Service Areas (DSAs),” the investigators wrote in Journal of the American College of Surgeons. “Although this was a step toward improving and equalizing access to lifesaving organs for those on the liver transplant wait list, the listing process determining which patients will be considered for transplantation has continued to be a significant hurdle.”
The process is “rife with impediments to equal access to listing,” according to Dr. Warren and colleagues; getting on a waiting list can be affected by factors such as inequitable access to primary care, lack of private health insurance, and subjective selection by transplant centers.
To better characterize these impediments, the investigators gathered center-specific data from the Scientific Registry of Transplant Recipients and the U.S. Census Bureau. The final dataset included 30,353 patients from treated at 109 transplant centers, each of which performed more than 250 transplants between January 2013 and December 2018. The investigators compared waiting list data for each center with demographics from its DSA. Primary variables included race/ethnicity, education level, poverty, and insurance coverage.
Multiple logistic regression analysis was used to compare expected waiting list demographics with observed waiting list demographics with the aid of observed/expected ratios for each race/ethnicity. Univariate and multivariate analyses were used to identify significant predictors, including covariates such as age at listing, distance traveled to transplant center, and center type.
On an adjusted basis, the observed/expected ratios showed that non-Hispanic Black patients were underrepresented on waiting lists at 88 out of 109 centers (81%) and Hispanic patients were underrepresented at 68 centers (62%). In contrast, non-Hispanic White patients were overrepresented on waiting lists at 65 centers (58%). Non-Hispanic White patients were underrepresented on waiting lists at 49 centers, or 45%. Minority underrepresentation was further supported by mean MELD (Model for End-Stage Liver Disease) scores, which were significantly higher among non-Hispanic Black patients (20.2) and Hispanic patients (19.4), compared with non-Hispanic White patients (18.7) (P < .0001 for all) at the time of wait-listing.
Based on the multivariate model, underrepresentation among Black patients was most common in areas with a higher proportion of Black individuals in the population, longer travel distances to transplant centers, and a higher rate of private insurance among transplant recipients. For Hispanic patients, rates of private insurance alone predicted underrepresentation.
Once patients were listed, however, these disparities faded. Non-Hispanic Black patients accounted for 9.8% of all transplants across all hospitals, compared with 7.9% of wait-listed individuals (P < .0001). At approximately two out of three hospitals (65%), the transplanted percentage of Black patients exceeded the wait-listed percentage (P = .002).
“Data from this study show that the wait lists at many transplant centers in the United States underrepresent minority populations, compared with what would be expected based on their service areas,” the investigators concluded. “Future work will need to be devoted to increasing awareness of these trends to promote equitable access to listing for liver transplantation.”
Looking at social determinants of health
According to Lauren D. Nephew, MD, MSc, MAE, of Indiana University, Indianapolis, “The question of access to care is particularly important at this juncture as we examine the inequities that COVID-19 exposed in access to care for racial minorities, and as we prepare for potential changes to health insurance coverage with the new administration.”
Dr. Nephew noted that the reported racial disparities stem from social determinants of health, such as proximity to transplant centers and type of insurance coverage.
“Another striking finding was that the disparity in wait-listing non-Hispanic Black patients increased with the percentage of non-Hispanic Black patients living in the area, further highlighting barriers in access to care in majority Black neighborhoods,” she said. “Inequities such as these are unacceptable, given our mandate to distribute organs in a fair and equitable fashion, and they require prospective studies for further examination.”
Identifying discrimination
Lanla Conteh, MD, MPH, of the Ohio State University Wexner Medical Center, Columbus, described how these inequities are magnified through bias in patient selection.
“Often times two very similar patients may present with the same medical profile and social circumstances; however, one is turned down,” she said. “Often the patient turned down is the non-Hispanic Black patient while the non-Hispanic White patient is given a pass.”
Dr. Conteh suggested that the first step in fixing this bias is recognizing that it is a problem and calling it by its proper name.
“As transplant centers, in order to address and change these significant disparities, we must first be willing to acknowledge that they do exist,” she said. “Only then can we move to the next step of developing awareness and methods to actively combat what we should label as systemic discrimination in medicine. Transplantation is a lifesaving treatment for many patients with decompensated liver disease or liver cancer. Ensuring equitable access for all patients and populations is of paramount importance.”
The study was supported by a Health Resources and Services Administration contract, as well as grants from the National Institutes of Health/National Institute of Diabetes and Digestive and Kidney Diseases. The investigators and interviewees reported no conflicts of interest.
AGA applauds researchers who are working to raise our awareness of health disparities in digestive diseases. AGA is committed to addressing this important societal issue head on. Learn more about AGA’s commitment through the AGA Equity Project.
This article was updated Mar. 12, 2021.
FROM THE JOURNAL OF THE AMERICAN COLLEGE OF SURGEONS
JAMA editor resigns over controversial podcast
JAMA editor in chief Howard Bauchner, MD, apologized to JAMA staff and stakeholders and asked for and received Dr. Livingston’s resignation, according to a statement from AMA CEO James Madara.
More than 2,000 people have signed a petition on Change.org calling for an investigation at JAMA over the podcast, called “Structural Racism for Doctors: What Is It?”
It appears they are now getting their wish. Dr. Bauchner announced that the journal’s oversight committee is investigating how the podcast and a tweet promoting the episode were developed, reviewed, and ultimately posted.
“This investigation and report of its findings will be thorough and completed rapidly,” Dr. Bauchner said.
Dr. Livingston, the host of the podcast, has been heavily criticized across social media. During the podcast, Dr. Livingston, who is White, said: “Structural racism is an unfortunate term. Personally, I think taking racism out of the conversation will help. Many of us are offended by the concept that we are racist.”
The audio of the podcast has been deleted from JAMA’s website. In its place is audio of a statement from Dr. Bauchner. In his statement, which he released last week, he said the comments in the podcast, which also featured Mitch Katz, MD, were “inaccurate, offensive, hurtful, and inconsistent with the standards of JAMA.”
Dr. Katz is an editor at JAMA Internal Medicine and CEO of NYC Health + Hospitals in New York.
Also deleted was a JAMA tweet promoting the podcast episode. The tweet said: “No physician is racist, so how can there be structural racism in health care? An explanation of the idea by doctors for doctors in this user-friendly podcast.”
The incident was met with anger and confusion in the medical community.
Herbert C. Smitherman, MD, vice dean of diversity and community affairs at Wayne State University, Detroit, noted after hearing the podcast that it was a symptom of a much larger problem.
“At its core, this podcast had racist tendencies. Those attitudes are why you don’t have as many articles by Black and Brown people in JAMA,” he said. “People’s attitudes, whether conscious or unconscious, are what drive the policies and practices which create the structural racism.”
Dr. Katz responded to the backlash last week with the following statement: “Systemic racism exists in our country. The disparate effects of the pandemic have made this painfully clear in New York City and across the country.
“As clinicians, we must understand how these structures and policies have a direct impact on the health outcomes of the patients and communities we serve. It is woefully naive to say that no physician is a racist just because the Civil Rights Act of 1964 forbade it, or that we should avoid the term ‘systematic racism’ because it makes people uncomfortable. We must and can do better.”
JAMA, an independent arm of the AMA, is taking other steps to address concerns. Its executive publisher, Thomas Easley, held an employee town hall this week, and said JAMA acknowledges that “structural racism is real, pernicious, and pervasive in health care.” The journal is also starting an “end-to-end review” of all editorial processes across all JAMA publications. Finally, the journal will also create a new associate editor’s position who will provide “insight and counsel” on racism and structural racism in health care.
A version of this article first appeared on WebMD.com .
BASILICA technique prevents TAVR-related coronary obstruction in registry study
For patients undergoing transcatheter aortic valve replacement (TAVR), the intentional laceration technique of diseased valve leaflets called BASILICA is effective and reasonably safe for preventing coronary artery obstruction, according to a late-breaking study presented at CRT 2021 sponsored by MedStar Heart & Vascular Institute.
In a series of 214 patients entered into a registry over a recent 30-month period, leaflets posing risk were effectively traversed with the technique in 95% of cases, and complication rates were reasonably low with 30-day stroke and death rate of 3.4%, reported Jaffar M. Khan, BMBCH, PhD, cardiovascular branch of the National Heart, Lung, and Blood Institute.
The rate of complications is acceptable given the large potential risk, according to Dr. Khan. If coronary obstruction occurs, reported mortality rates have been as high as 50%. The 1-year survival rate in the registry following BASILICA was 84%.
Results should ‘push people toward BASILICA’
The acronym BASILICA stands for bioprosthetic or native aortic scallop intentional laceration to prevent iatrogenic coronary artery obstruction. In the procedure, performed immediately before TAVR, guidewires are introduced to first traverse and then lacerate aortic leaflets threatening obstruction of a coronary artery.
In cases where diseased valve leaflets pose a risk of coronary obstruction, most interventionalists “are comfortable with surgery when patients are at low or intermediate risk, but the choices for high-risk patients are a snorkel stent or BASILICA. Given the limits of snorkel stenting, these data should be reassuring and push people toward BASILICA,” Dr. Khan said.
The 214 patients were entered into the registry from June 2015 to December 2020. The mean age was 74.9 years. Of valves treated, 73% were failed bioprosthetic devices. The remaining were native aortic valves. Solo BASILICA was performed in most patients, but 21.5% underwent a doppio procedure, meaning the laceration of two leaflets.
Despite BASILICA, 10 patients (4.7%) had some degree of coronary obstruction, including 5 with partial obstruction of the main coronary artery and 1 with partial obstruction of the right coronary artery. All of these partial obstructions were successfully treated with orthotopic stents.
An obstruction of the right coronary artery was successfully treated with balloon angioplasty. Another patient with significant left main coronary artery obstruction required cardiopulmonary bypass but was successfully treated with snorkel stenting. Of two patients with complete obstruction of the left main coronary artery caused by the skirt of the TAVR device, one died in hospital despite several maneuvers to restore perfusion.
Procedural complications included a mitral chord laceration, which subsequently led to valve replacement, and three guidewire transversals into surrounding tissue that did not result in serious sequelae. Hypotension requiring pressors occurred in 8.5%.
There was a “slight trend” for worse outcomes in those undergoing doppio rather than solo BASILICA, but the difference did not reach statistical significance. Cerebral embolic protection was offered to a minority of patients in this series. The trend for a lower risk of stroke in this group did not reach significance, Dr. Khan reported.
Best for high-volume centers, for now
Although these data support the conclusion that BASILICA “is feasible in a real-world setting,” Dr. Khan acknowledged that BASILICA might not be appropriate at low-volume centers. Dr. Khan cited data that indicates obstruction of a coronary artery by a diseased leaflet occurs in less than 1% of TAVR cases.
“Not every site doing a handful of TAVRs is going to want to tackle these cases, but those working in a high-volume center will from time to time encounter patients with coronary obstruction or who are at increased risk,” Dr. Khan said.
In North America, there has been a proctoring program to disseminate the skills required to perform BASILICA, according to Dr. Khan, who explained that proctors typically participate in two or three cases before these are performed without supervision.
So far, the uptake of BASILICA has been limited.
“BASILICA has not been catching on in EUROPE,” said Didier F. Loulmet, MD, chief of cardiac surgery at Tisch Hospital, New York University Langone Health. There might be several reasons, but Dr. Loulmet said that lack of a comparable proctoring program is one factor.”
“This is a relatively complex procedure performed in a small number of patients, so building up expertise is quite a challenge, particularly in small centers,” he added. He encouraged proctoring as “the way that it has to be propagated.”
The results presented by Dr. Khan on March 6 at CRT 2021 were simultaneously published in JACC: Cardiovascular Interventions.
Dr. Khan has patents on several devices, including catheters to lacerate valve leaflet. Dr. Loulmet reported no potential conflicts of interest.
FROM CRT 2021
Don’t discontinue osteoporosis meds for COVID-19 vaccines, expert guidance says
COVID-19 vaccines are safe and effective for patients taking osteoporosis medications, according to joint guidance from six endocrine and osteoporosis societies and foundations.

They noted, though, that some timing modifications with certain medications should be considered to help distinguish between adverse events from the medication versus the vaccine.
The American Society for Bone and Mineral Research “is an international organization, so we brought together our sister societies that have a vested interested in bone health. Vaccination is happening worldwide, and we wanted to present a united front and united recommendations about how to handle osteoporosis medications appropriately during vaccination,” said Suzanne Jan De Beur, MD, who is president of ASBMR and an associate professor of medicine at Johns Hopkins University, Baltimore.
There has been quite a lot of concern from the community about vaccine and medications, from both physicians and patients wondering whether treatments and vaccines should occur in a certain order, and whether there should be a time gap between the two, said Dr. Jan De Beur. “There was a dearth of information about the best practices for osteoporosis treatment management during vaccination, and we didn’t want people missing their opportunity for a vaccine, and we also didn’t want them unnecessarily delaying their osteoporosis treatment.”
There is no evidence that osteoporosis therapies affect the risk or severity of COVID-19 disease, nor do they appear to change the disease course. Osteoporosis itself does not appear associated with increased risk of infection or severe outcomes, so patients with osteoporosis do not need to be prioritized for vaccination based on that condition alone.
There is no evidence that osteoporosis therapies affect the safety or efficacy of vaccination, but given that vaccine availability is currently inconsistent, patients may need to make temporary changes to their osteoporosis regimens to ensure they can receive vaccine when it is available, such as ensuring a delay between medication and vaccination injections.
A key reason for a delay between injectable or infusion medications and a vaccine is to distinguish between adverse events that could occur, so that an adverse reaction to vaccine isn’t mistaken for an adverse reaction to a drug. Nevertheless, the real world is messy. Dr. Jan De Beur noted a recent patient who arrived at her clinic for an injectable treatment who had just received a COVID-19 vaccination that morning. “We decided to put the injection in the other arm, rather than reschedule the person and put them through the risk of coming back. We could distinguish between injection-site reactions, at least,” she said.
No changes should be made to general bone health therapies, such as calcium and vitamin D supplementation, weight-bearing exercises, and maintenance of a balanced diet.
The guidance includes some recommendations for specific osteoporosis medications.
- Oral bisphosphonates: Alendronate, risedronate, and ibandronate should be continued.
- Intravenous bisphosphonates: a 7-day interval (4-day minimum) is recommended between intravenous bisphosphonate (zoledronic acid and ibandronate) infusion and COVID-19 vaccination in order to distinguish potential autoimmune or inflammatory reactions that could be attributable to either intravenous bisphosphonate or the vaccine.
- Denosumab: There should be a 4- to 7-day delay between denosumab infusion and COVID-19 vaccination to account for injection-site reactions. Another option is to have denosumab injected into the contralateral arm or another site like the abdomen or upper thigh, if spacing the injections is not possible. In any case, denosumab injections should be performed within 7 months of the previous dose.
- Teriparatide and abaloparatide should be continued.
- Romosozumab: There should be a 4- to 7-day delay between a romosozumab injection and COVID-19 vaccine, or romosozumab can be injected in the abdomen (with the exception of a 2-inch area around the naval) or thigh if spacing is not possible.
- Raloxifene should be continued in patients receiving COVID-19 vaccination.
Guidance signatories include ASBMR, the American Association of Clinical Endocrinology, the Endocrine Society, the European Calcified Tissue Society, the National Osteoporosis Foundation, and the International Osteoporosis Foundation.
Dr. Jan De Beur has no relevant financial disclosures.
COVID-19 vaccines are safe and effective for patients taking osteoporosis medications, according to joint guidance from six endocrine and osteoporosis societies and foundations.
They noted, though, that some timing modifications with certain medications should be considered to help distinguish between adverse events from the medication versus the vaccine.
The American Society for Bone and Mineral Research “is an international organization, so we brought together our sister societies that have a vested interested in bone health. Vaccination is happening worldwide, and we wanted to present a united front and united recommendations about how to handle osteoporosis medications appropriately during vaccination,” said Suzanne Jan De Beur, MD, who is president of ASBMR and an associate professor of medicine at Johns Hopkins University, Baltimore.
There has been quite a lot of concern from the community about vaccine and medications, from both physicians and patients wondering whether treatments and vaccines should occur in a certain order, and whether there should be a time gap between the two, said Dr. Jan De Beur. “There was a dearth of information about the best practices for osteoporosis treatment management during vaccination, and we didn’t want people missing their opportunity for a vaccine, and we also didn’t want them unnecessarily delaying their osteoporosis treatment.”
There is no evidence that osteoporosis therapies affect the risk or severity of COVID-19 disease, nor do they appear to change the disease course. Osteoporosis itself does not appear associated with increased risk of infection or severe outcomes, so patients with osteoporosis do not need to be prioritized for vaccination based on that condition alone.
There is no evidence that osteoporosis therapies affect the safety or efficacy of vaccination, but given that vaccine availability is currently inconsistent, patients may need to make temporary changes to their osteoporosis regimens to ensure they can receive vaccine when it is available, such as ensuring a delay between medication and vaccination injections.
A key reason for a delay between injectable or infusion medications and a vaccine is to distinguish between adverse events that could occur, so that an adverse reaction to vaccine isn’t mistaken for an adverse reaction to a drug. Nevertheless, the real world is messy. Dr. Jan De Beur noted a recent patient who arrived at her clinic for an injectable treatment who had just received a COVID-19 vaccination that morning. “We decided to put the injection in the other arm, rather than reschedule the person and put them through the risk of coming back. We could distinguish between injection-site reactions, at least,” she said.
No changes should be made to general bone health therapies, such as calcium and vitamin D supplementation, weight-bearing exercises, and maintenance of a balanced diet.
The guidance includes some recommendations for specific osteoporosis medications.
- Oral bisphosphonates: Alendronate, risedronate, and ibandronate should be continued.
- Intravenous bisphosphonates: a 7-day interval (4-day minimum) is recommended between intravenous bisphosphonate (zoledronic acid and ibandronate) infusion and COVID-19 vaccination in order to distinguish potential autoimmune or inflammatory reactions that could be attributable to either intravenous bisphosphonate or the vaccine.
- Denosumab: There should be a 4- to 7-day delay between denosumab infusion and COVID-19 vaccination to account for injection-site reactions. Another option is to have denosumab injected into the contralateral arm or another site like the abdomen or upper thigh, if spacing the injections is not possible. In any case, denosumab injections should be performed within 7 months of the previous dose.
- Teriparatide and abaloparatide should be continued.
- Romosozumab: There should be a 4- to 7-day delay between a romosozumab injection and COVID-19 vaccine, or romosozumab can be injected in the abdomen (with the exception of a 2-inch area around the naval) or thigh if spacing is not possible.
- Raloxifene should be continued in patients receiving COVID-19 vaccination.
Guidance signatories include ASBMR, the American Association of Clinical Endocrinology, the Endocrine Society, the European Calcified Tissue Society, the National Osteoporosis Foundation, and the International Osteoporosis Foundation.
Dr. Jan De Beur has no relevant financial disclosures.
The vanguard of HIV care: Don’t forget this screening
In response, clinical care is continually adapting to the dramatically altered natural history of disease.
Today, the cutting edge of clinical care overlaps with primary care. The clinical vanguard addresses the medical vulnerabilities of patients with HIV, seeking to eliminate preventable morbidity and premature death. Among this clinical vanguard is the screening for and prevention of anal cancer. With the increased longevity of people living with HIV and the nearly universal exposure to human papillomavirus (HPV), there is now potential for progression to mucosal cellular dysplasia and eventual malignancy.
We know that prevention is possible because of the example of cervical cancer, the etiology of which is exposure to oncogenic serotypes of HPV (16 and 18 are most common). Screenings for cervical cancer (regular clinical examinations and Pap smears) and treatments to eliminate high-grade dysplasia have decreased the incidence rate by over 50% since the 1970s. Vaccination against HPV has been available since 2006 and offers the prospect of preventing HPV-associated malignancies, including head and neck cancer, in future decades.
However, rates of anal cancer are increasing. The CDC estimates that about 4,700 new cases of HPV-associated anal cancers are diagnosed in women and about 2,300 are diagnosed in men each year in the United States. Anal cancer rates in individuals with HIV have increased in the era of effective antiretrovirals and greater longevity. The highest rates, at 95 per 100,000, are in HIV-positive men who have sex with men. Very similar rates were noted in a more recent study that found increased risk with advancing age and in those with an AIDS diagnosis.
All patients with HIV should be screened
The New York State AIDS Institute Clinical Guidelines Program recommends screening for anal dysplasia in all patients with HIV. A proactive approach similar to cervical cancer screening is appropriate and includes measures easily implemented by all clinicians.
- History: Assess for rectal symptoms, anal pain, discharge, and lumps.
- Physical exam: Assess for presence of perianal lesions; perform a thorough digital rectal exam.
- Anal Pap test for anal cytology: Insert a Dacron swab moistened with tap water about 3 inches into the anal canal, applying pressure to lateral anal walls and rotating the swab. Then remove and place the swab into liquid cytology solution, shake vigorously for a full 30 seconds, and assess for any dysplasia (high-grade squamous intraepithelial lesion, low-grade intraepithelial lesion, atypical squamous cells of undetermined significance), which would warrant further evaluation by high-resolution anoscopy (HRA).
High-resolution anoscopy
HRA for anal dysplasia corresponds to colposcopy for cervical dysplasia. The ability to treat and eliminate high-risk precursor lesions interrupts the progression to malignancy. The efficacy of this strategy is being evaluated in a National Institutes of Health prospective trial called the Anchor Study. The epidemiology of HPV; the clinical horror of witnessing the painful, preventable deaths of young patients with well-controlled HIV caused by anal cancer; and the example of controlling cervical cancer have motivated my practice to assure comprehensive care for our patients.
Unfortunately, establishing HRA in one’s practice is challenging. Barriers to practice include the expense of required equipment and the absence of consensus on specific products. In addition, hands-on precepting to ease newcomers to competence is not generally available. Considerable skill is required for complete visualization of the anal transformative zone in the folds of the anal canal, and recognizing high-risk lesions requires study and accumulated experience. The International Anal Neoplasia Society is a useful resource that also offers a training course. We are invited to train ourselves, and to rely on the eventual feedback of biopsy results and the forbearance of our early patients.
The expanding scope of our medical practices must shift to meet the evolving needs of the growing population of virologically suppressed patients who are living longer. HIV care involves curing life-threatening opportunistic infections, encouraging antiretroviral adherence, and providing comprehensive care – which now includes preventing anal cancer.
A version of this article first appeared on Medscape.com.