User login
What is an “early and accurate” diagnosis?
For the last few weeks, the eye-grabber at the top of the American Academy of Pediatrics shopAAP email has been “Early and Accurate Diagnosis.” The unstated claim is that a practitioner who subscribes to one of their continuing education products will improve his or her chances of making an early and accurate diagnosis that “Also Cures Missed School, Soccer Practice, and Music Lessons.” The tagline, Early and Accurate Diagnosis, got me ruminating.

What exactly is an accurate diagnosis? And how does one define an early diagnosis? These are not merely questions of semantics. An honest attempt to answer them scratches through the surface of some serious issues facing a primary care physician.
Who are the judges deciding whether a physician’s diagnosis is accurate? Should it be a panel of academic physicians, most of who are specialists and subspecialists, and who are most comfortable seeing patients with array of signs and symptoms that your patient has presented? Or, should it be a collection of your primary care peers working with limited resources miles away from a tertiary care center?
Is there such a thing as a diagnosis that is close enough? How often is it important that your diagnosis is spot on? Is it like a high school algebra problem in which you could get partial credit for showing how you arrived at the not-quite-right-answer? It really makes a difference only when you start acting (or, in some cases, not acting) on your diagnosis.
Let’s be honest. How often have you made the wrong diagnosis and the patient got better with your management plan? Your therapy may have worked for Diagnosis A even though you were targeting Diagnosis B. Or, more likely, the patient was going to get better without any intervention.
Don’t get me wrong. I think a correct diagnosis can be, and often is, extremely important, but it is really the patient who is the judge of whether you got it right. He doesn’t care what you called it. He is happy knowing that he got better and you didn’t hurt him.
Now, what about that “early” piece? Again, the patient might have something to say about this. You may have made the correct diagnosis but because your productivity is limited by a clunky EMR or your appointment desk does a poor job of triage, the patient was forced to wait an unconscionable amount of time to be seen.
A timely diagnosis certainly is important in many situations. But particularly, early in your career, you may not have the experience to make those quick one look and you’ve got it right diagnoses. These are times to come clean and tell the patient that you aren’t sure what they have. Of course, you might want to choose a better phrase than, “I don’t have clue.”
If I had been asked to write the AAP’s tag line, I would have chosen “efficient” instead of early. If you made the correct diagnosis and it was reasonably timely but you ordered a barrage of unnecessary and expensive tests that inconvenienced the patient, you should have done a better job.
Finally, if you make the correct and early diagnosis but deliver it to the patient poorly, your therapy may not work. Again, it boils down to being an artful and caring physician.
Dr. Wilkoff practiced primary care pediatrics in Brunswick, Maine for nearly 40 years. He has authored several books on behavioral pediatrics, including “How to Say No to Your Toddler.” Email him at [email protected].
For the last few weeks, the eye-grabber at the top of the American Academy of Pediatrics shopAAP email has been “Early and Accurate Diagnosis.” The unstated claim is that a practitioner who subscribes to one of their continuing education products will improve his or her chances of making an early and accurate diagnosis that “Also Cures Missed School, Soccer Practice, and Music Lessons.” The tagline, Early and Accurate Diagnosis, got me ruminating.
What exactly is an accurate diagnosis? And how does one define an early diagnosis? These are not merely questions of semantics. An honest attempt to answer them scratches through the surface of some serious issues facing a primary care physician.
Who are the judges deciding whether a physician’s diagnosis is accurate? Should it be a panel of academic physicians, most of who are specialists and subspecialists, and who are most comfortable seeing patients with array of signs and symptoms that your patient has presented? Or, should it be a collection of your primary care peers working with limited resources miles away from a tertiary care center?
Is there such a thing as a diagnosis that is close enough? How often is it important that your diagnosis is spot on? Is it like a high school algebra problem in which you could get partial credit for showing how you arrived at the not-quite-right-answer? It really makes a difference only when you start acting (or, in some cases, not acting) on your diagnosis.
Let’s be honest. How often have you made the wrong diagnosis and the patient got better with your management plan? Your therapy may have worked for Diagnosis A even though you were targeting Diagnosis B. Or, more likely, the patient was going to get better without any intervention.
Don’t get me wrong. I think a correct diagnosis can be, and often is, extremely important, but it is really the patient who is the judge of whether you got it right. He doesn’t care what you called it. He is happy knowing that he got better and you didn’t hurt him.
Now, what about that “early” piece? Again, the patient might have something to say about this. You may have made the correct diagnosis but because your productivity is limited by a clunky EMR or your appointment desk does a poor job of triage, the patient was forced to wait an unconscionable amount of time to be seen.
A timely diagnosis certainly is important in many situations. But particularly, early in your career, you may not have the experience to make those quick one look and you’ve got it right diagnoses. These are times to come clean and tell the patient that you aren’t sure what they have. Of course, you might want to choose a better phrase than, “I don’t have clue.”
If I had been asked to write the AAP’s tag line, I would have chosen “efficient” instead of early. If you made the correct diagnosis and it was reasonably timely but you ordered a barrage of unnecessary and expensive tests that inconvenienced the patient, you should have done a better job.
Finally, if you make the correct and early diagnosis but deliver it to the patient poorly, your therapy may not work. Again, it boils down to being an artful and caring physician.
Dr. Wilkoff practiced primary care pediatrics in Brunswick, Maine for nearly 40 years. He has authored several books on behavioral pediatrics, including “How to Say No to Your Toddler.” Email him at [email protected].
December 2018 Highlights

Nail Care: Survey of the Cutis Editorial Board
To improve patient care and outcomes, leading dermatologists from the Cutis Editorial Board answered 5 questions on nail care. Here’s what we found.
Do you routinely perform diagnostic testing before treating for onychomycosis?
Ninety-five percent of dermatologists perform diagnostic testing before treating onychomycosis. Of them, nearly two-thirds only test before treating with systemic antifungals, while one-third test before starting systemic or topical antifungals.

Expert Commentary
Provided by Shari R. Lipner, MD, PhD (New York, New York)
A laboratory diagnosis of onychomycosis is an absolute necessity before treating for onychomycosis, and the vast majority of our board members are testing routinely. Diagnosis should ideally be performed before initiating both oral and topical therapy. Failure to do so may lead to incorrect treatment with progression of disease and missed diagnoses of malignancy (Lipner and Scher, 2016; Lipner and Scher, 2016).
Next page: Nail fungus
What diagnostic tests do you use to confirm the presence of a nail fungus?
More than 70% of respondents use histopathology or fungal culture to confirm the presence of a nail fungus. Direct microscopy is used by 38% and only 5% use polymerase chain reaction.

Expert Commentary
Provided by Shari R. Lipner, MD, PhD (New York, New York)
Options for diagnosis are potassium hydroxide preparation with microscopy, fungal culture, or nail plate clipping with histopathology. Polymerase chain reaction is another option that is available and covered by many insurance plans. Many of our board members use histopathology and fungal culture more often than other methods. Histopathology is advantageous for its high sensitivity and capacity to detect other nail diseases, such as nail psoriasis. A disadvantage is that the identity and viability of the infecting organism cannot be determined. While fungal culture can detect both identity and viability, the organism may take several weeks to grow and there is a high false-negative rate (Lipner and Scher, 2018 [Part 1]).
Next page: Laboratory monitoring with terbinafine
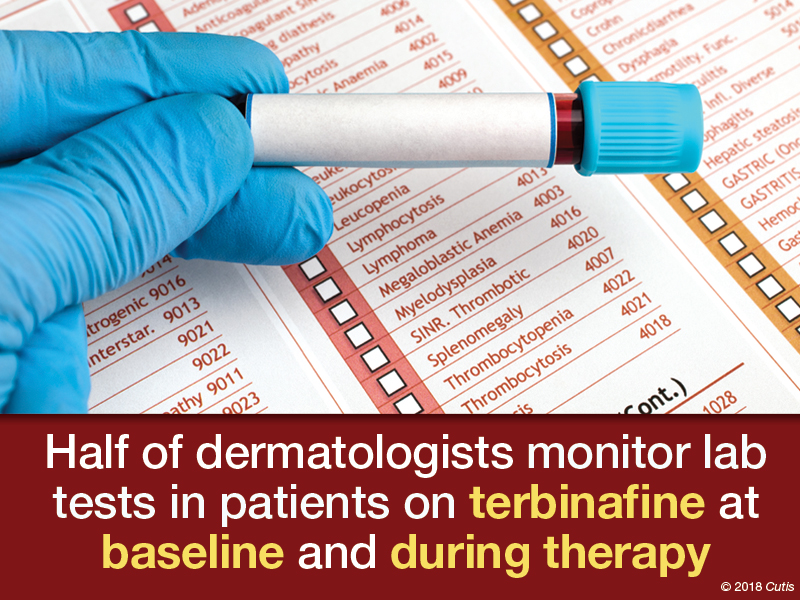
Do you routinely do laboratory monitoring when prescribing terbinafine for your patients with onychomycosis?
Almost half (48%) of dermatologists monitor laboratory test results in onychomycosis patients taking terbinafine at both baseline and during therapy. Twenty-three percent monitor at baseline only; 14% at baseline and after therapy; 5% at baseline, during therapy, and after therapy; and 10% don’t monitor at all.
Expert Commentary
Provided by Shari R. Lipner, MD, PhD (New York, New York)
Almost half of board members perform laboratory monitoring for patients taking terbinafine, which was reasonable prior to any published data on blood count and liver function tests in patients taking this drug. However, a new study on this topic should make us reconsider our practices. This study analyzed the rate of laboratory test abnormalities in 4985 patients taking terbinafine or griseofulvin for dermatophyte infections. Elevated alanine aminotransferase, aspartate aminotransferase, anemia, lymphopenia, and neutropenia were uncommon and similar to the baseline rates. Therefore, routine interval laboratory monitoring may be unnecessary in healthy patients taking oral terbinafine for onychomycosis (Stolmeier et al).
Next page: Biotin recommendations
Do you routinely recommend biotin to your patients?
Approximately half (52%) of dermatologists do not recommend biotin to their patients. However, 29% do recommend it for hair and nail disorders.

Expert Commentary
Provided by Shari R. Lipner, MD, PhD (New York, New York)
Biotin is an essential cofactor for mammalian carboxylase enzymes that are involved in important metabolic pathways in humans. Biotin supplementation is likely unnecessary for most individuals, as biotin intake is likely sufficient in a Western diet. There are limited data on biotin supplementation to treat dermatologic conditions, especially in patients with normal biotin levels. In addition, a recent warning issued by the US Food and Drug Administration reported that consumption of biotin may interfere with laboratory tests. Therefore, biotin should not be routinely recommended to patients without sufficient evidence that it would benefit their condition (Lipner, 2018).
Next page: Medication for onychomycosis
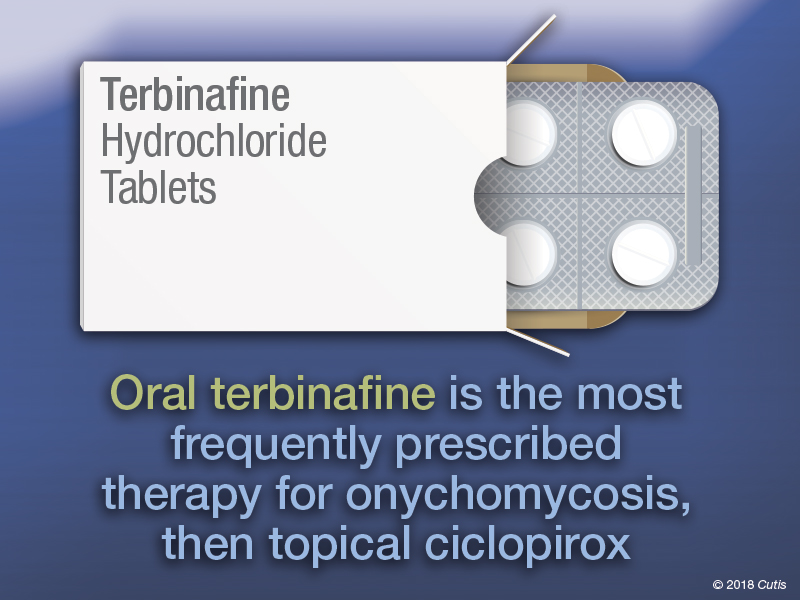
Which medication(s) do you prescribe most often for onychomycosis?
The top medications prescribed by dermatologists for onychomycosis were oral terbinafine (62%) and topical ciclopirox (52%), followed by oral fluconazole (29%), topical efinaconazole (24%), oral itraconazole (14%), and topical tavaborole (5%).
Expert Commentary
Provided by Shari R. Lipner, MD, PhD (New York, New York)
Oral terbinafine is most frequently prescribed by our board, likely because it has the best efficacy, dosing regimen, and minimal potential for systemic side effects or drug-drug interactions. Efficacy with ciclopirox lacquer is quite low and the medication is difficult to apply. For toenail onychomycosis, application is daily with weekly clipping and removal and monthly debridement. Patients who are not candidates for terbinafine would likely benefit more from oral itraconazole, oral fluconazole (off label), efinaconazole, or tavaborole (Lipner and Scher, 2018 [Part II]).
Next page: More tips from derms
More Tips From Dermatologists
The dermatologists we polled had the following advice for their peers:
As with care in general in dermatology, the care and treatment of healthy nails and especially diseased nails is multifaceted and is optimized by using combination therapy. The combination of an oral antifungal and a topical that treats the local area and also provides protection and a healthy environment for nail growth and repair is ideal.—Fran E. Cook-Bolden, MD (New York, New York)
It’s important to culture for fungus before starting treatment. It seems many cultures turn out to be nondermatophytes, and terbinafine is not the best treatment.—Lawrence J. Green, MD (Washington, DC)
Nails do care. Diagnoses should be confirmed.—Richard K. Scher, MD (New York, New York)
About This Survey
The survey was fielded electronically to Cutis Editorial Board Members within the United States from October 22, 2018, to November 14, 2018. A total of 21 usable responses were received.
- Lipner SR. Rethinking biotin therapy for hair, nail, and skin disorders. J Am Acad Dermatol. 2018;78:1236-1238.
- Lipner SR, Scher RK. Confirmatory testing for onychomycosis. JAMA Dermatol. 2016 Jul 1;152:847.
- Lipner SR, Scher RK. Onychomycosis–a small step for quality of care. Curr Med Res Opin. 2016;32:865-867.
- Lipner SR, Scher RK. Part I: onychomycosis: clinical overview and diagnosis [published online June 27, 2018]. J Am Acad Dermatol. pii:S0190-9622(18)32188-1.
- Lipner SR, Scher RK. Part II: onychomycosis: treatment and prevention of recurrence [published online June 27, 2018]. J Am Acad Dermatol. pii: S0190-9622(18)32187-X.)
- Stolmeier DA, Stratman HB, McIntee TJ, et al. Utility of laboratory test result monitoring in patients taking oral terbinafine or griseofulvin for dermatophyte infections [published online October 17, 2018]. JAMA Dermatol. doi:10.1001/jamadermatol.2018.3578.
To improve patient care and outcomes, leading dermatologists from the Cutis Editorial Board answered 5 questions on nail care. Here’s what we found.
Do you routinely perform diagnostic testing before treating for onychomycosis?
Ninety-five percent of dermatologists perform diagnostic testing before treating onychomycosis. Of them, nearly two-thirds only test before treating with systemic antifungals, while one-third test before starting systemic or topical antifungals.
Expert Commentary
Provided by Shari R. Lipner, MD, PhD (New York, New York)
A laboratory diagnosis of onychomycosis is an absolute necessity before treating for onychomycosis, and the vast majority of our board members are testing routinely. Diagnosis should ideally be performed before initiating both oral and topical therapy. Failure to do so may lead to incorrect treatment with progression of disease and missed diagnoses of malignancy (Lipner and Scher, 2016; Lipner and Scher, 2016).
Next page: Nail fungus
What diagnostic tests do you use to confirm the presence of a nail fungus?
More than 70% of respondents use histopathology or fungal culture to confirm the presence of a nail fungus. Direct microscopy is used by 38% and only 5% use polymerase chain reaction.
Expert Commentary
Provided by Shari R. Lipner, MD, PhD (New York, New York)
Options for diagnosis are potassium hydroxide preparation with microscopy, fungal culture, or nail plate clipping with histopathology. Polymerase chain reaction is another option that is available and covered by many insurance plans. Many of our board members use histopathology and fungal culture more often than other methods. Histopathology is advantageous for its high sensitivity and capacity to detect other nail diseases, such as nail psoriasis. A disadvantage is that the identity and viability of the infecting organism cannot be determined. While fungal culture can detect both identity and viability, the organism may take several weeks to grow and there is a high false-negative rate (Lipner and Scher, 2018 [Part 1]).
Next page: Laboratory monitoring with terbinafine
Do you routinely do laboratory monitoring when prescribing terbinafine for your patients with onychomycosis?
Almost half (48%) of dermatologists monitor laboratory test results in onychomycosis patients taking terbinafine at both baseline and during therapy. Twenty-three percent monitor at baseline only; 14% at baseline and after therapy; 5% at baseline, during therapy, and after therapy; and 10% don’t monitor at all.
Expert Commentary
Provided by Shari R. Lipner, MD, PhD (New York, New York)
Almost half of board members perform laboratory monitoring for patients taking terbinafine, which was reasonable prior to any published data on blood count and liver function tests in patients taking this drug. However, a new study on this topic should make us reconsider our practices. This study analyzed the rate of laboratory test abnormalities in 4985 patients taking terbinafine or griseofulvin for dermatophyte infections. Elevated alanine aminotransferase, aspartate aminotransferase, anemia, lymphopenia, and neutropenia were uncommon and similar to the baseline rates. Therefore, routine interval laboratory monitoring may be unnecessary in healthy patients taking oral terbinafine for onychomycosis (Stolmeier et al).
Next page: Biotin recommendations
Do you routinely recommend biotin to your patients?
Approximately half (52%) of dermatologists do not recommend biotin to their patients. However, 29% do recommend it for hair and nail disorders.
Expert Commentary
Provided by Shari R. Lipner, MD, PhD (New York, New York)
Biotin is an essential cofactor for mammalian carboxylase enzymes that are involved in important metabolic pathways in humans. Biotin supplementation is likely unnecessary for most individuals, as biotin intake is likely sufficient in a Western diet. There are limited data on biotin supplementation to treat dermatologic conditions, especially in patients with normal biotin levels. In addition, a recent warning issued by the US Food and Drug Administration reported that consumption of biotin may interfere with laboratory tests. Therefore, biotin should not be routinely recommended to patients without sufficient evidence that it would benefit their condition (Lipner, 2018).
Next page: Medication for onychomycosis
Which medication(s) do you prescribe most often for onychomycosis?
The top medications prescribed by dermatologists for onychomycosis were oral terbinafine (62%) and topical ciclopirox (52%), followed by oral fluconazole (29%), topical efinaconazole (24%), oral itraconazole (14%), and topical tavaborole (5%).
Expert Commentary
Provided by Shari R. Lipner, MD, PhD (New York, New York)
Oral terbinafine is most frequently prescribed by our board, likely because it has the best efficacy, dosing regimen, and minimal potential for systemic side effects or drug-drug interactions. Efficacy with ciclopirox lacquer is quite low and the medication is difficult to apply. For toenail onychomycosis, application is daily with weekly clipping and removal and monthly debridement. Patients who are not candidates for terbinafine would likely benefit more from oral itraconazole, oral fluconazole (off label), efinaconazole, or tavaborole (Lipner and Scher, 2018 [Part II]).
Next page: More tips from derms
More Tips From Dermatologists
The dermatologists we polled had the following advice for their peers:
As with care in general in dermatology, the care and treatment of healthy nails and especially diseased nails is multifaceted and is optimized by using combination therapy. The combination of an oral antifungal and a topical that treats the local area and also provides protection and a healthy environment for nail growth and repair is ideal.—Fran E. Cook-Bolden, MD (New York, New York)
It’s important to culture for fungus before starting treatment. It seems many cultures turn out to be nondermatophytes, and terbinafine is not the best treatment.—Lawrence J. Green, MD (Washington, DC)
Nails do care. Diagnoses should be confirmed.—Richard K. Scher, MD (New York, New York)
About This Survey
The survey was fielded electronically to Cutis Editorial Board Members within the United States from October 22, 2018, to November 14, 2018. A total of 21 usable responses were received.
- Lipner SR. Rethinking biotin therapy for hair, nail, and skin disorders. J Am Acad Dermatol. 2018;78:1236-1238.
- Lipner SR, Scher RK. Confirmatory testing for onychomycosis. JAMA Dermatol. 2016 Jul 1;152:847.
- Lipner SR, Scher RK. Onychomycosis–a small step for quality of care. Curr Med Res Opin. 2016;32:865-867.
- Lipner SR, Scher RK. Part I: onychomycosis: clinical overview and diagnosis [published online June 27, 2018]. J Am Acad Dermatol. pii:S0190-9622(18)32188-1.
- Lipner SR, Scher RK. Part II: onychomycosis: treatment and prevention of recurrence [published online June 27, 2018]. J Am Acad Dermatol. pii: S0190-9622(18)32187-X.)
- Stolmeier DA, Stratman HB, McIntee TJ, et al. Utility of laboratory test result monitoring in patients taking oral terbinafine or griseofulvin for dermatophyte infections [published online October 17, 2018]. JAMA Dermatol. doi:10.1001/jamadermatol.2018.3578.
Robotic vs. conventional laparoscopic surgery for rectal cancer: No winner yet
Robot-assisted rectal surgery is gaining acceptance but, with some exceptions, outcomes are not significantly improved over the conventional laparoscopic approach, a meta-analysis has found.
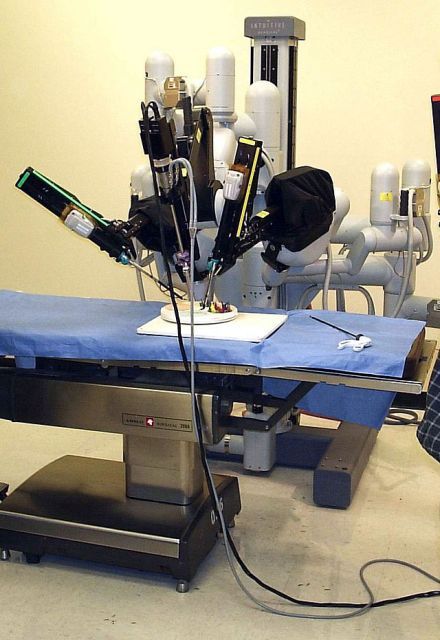
Conducted by Katie Jones, MD, and her colleagues at Brighton and Sussex (England) University Hospital NHS Trust, the meta-analysis was designed as a follow-up to ROLARR (isrctn.org ID: ISRCTN80500123), a randomized clinical trial in which robot-assisted and. conventional laparoscopic surgery for rectal cancer were studied for risk of conversion to open surgery. That trial findings showed that robot-assisted laparoscopic surgery did not significantly reduce the risk of conversion. For other outcomes (pathology, complications, bladder, and sexual function), the differences between the two approaches were insignificant. But the two surgical approaches did differ on cost: The robot-assisted operation was significantly more expensive than the conventional laparoscopic procedure.
Dr. Jones and her colleagues analyzed data from ROLARR in the context of 27 other qualifying studies and confirmed many of the ROLARR findings. The 27 case control studies comprised 5,547 patients and had comparable outcomes data.
The outcomes of interest were duration of operation, conversion risk, blood loss, length of stay, oncological outcomes, time to first flatus, reoperation rate, postoperative morbidity, and postoperative mortality.
The investigators found that duration of the operation was longer for the robot-assisted procedure, compared with the conventional laparoscopic approach, though this difference was not statistically significant (z = 1.28, P = .20), and blood loss, morbidity, and mortality were similar between the two groups. Oncological outcomes (risk of positive circumferential resection margins, lymph node yield, and length of distal resection margins) were similar for these two surgical approaches.
In contrast to the ROLARR findings, this meta-analysis found that the risk of conversion favored the robot-assisted procedure (z = 5.51, P = .00001). Hospital stay (z = 2.46, P = 01) and time to first flatus outcomes (z = 3.09, P = .002) favored the robot-assisted procedure. Postop morbidity and mortality and reoperation rate were similar in the two groups.
“Based upon the findings of this largest-ever series on the role of robotic surgery in rectal cancer resection, the [robot-assisted procedure] is certainly a feasible technique and oncologically safe surgical intervention but failed to demonstrate any superiority over [the conventional laparoscopic approach] for many surgical outcomes,” the investigators wrote. “Mere advantage of robotic surgery was noted in only three postoperative outcomes, that is early passage of flatus, lower risk of conversion, and shorter hospitalization.”
Dr. Jones and her colleagues declared they had no conflicts of interest.
SOURCE: Jones K et al. World J Gastroentrol. 2018 Nov 15. doi: 10.4251/wjgo.v10.i11.449.
Robot-assisted rectal surgery is gaining acceptance but, with some exceptions, outcomes are not significantly improved over the conventional laparoscopic approach, a meta-analysis has found.
Conducted by Katie Jones, MD, and her colleagues at Brighton and Sussex (England) University Hospital NHS Trust, the meta-analysis was designed as a follow-up to ROLARR (isrctn.org ID: ISRCTN80500123), a randomized clinical trial in which robot-assisted and. conventional laparoscopic surgery for rectal cancer were studied for risk of conversion to open surgery. That trial findings showed that robot-assisted laparoscopic surgery did not significantly reduce the risk of conversion. For other outcomes (pathology, complications, bladder, and sexual function), the differences between the two approaches were insignificant. But the two surgical approaches did differ on cost: The robot-assisted operation was significantly more expensive than the conventional laparoscopic procedure.
Dr. Jones and her colleagues analyzed data from ROLARR in the context of 27 other qualifying studies and confirmed many of the ROLARR findings. The 27 case control studies comprised 5,547 patients and had comparable outcomes data.
The outcomes of interest were duration of operation, conversion risk, blood loss, length of stay, oncological outcomes, time to first flatus, reoperation rate, postoperative morbidity, and postoperative mortality.
The investigators found that duration of the operation was longer for the robot-assisted procedure, compared with the conventional laparoscopic approach, though this difference was not statistically significant (z = 1.28, P = .20), and blood loss, morbidity, and mortality were similar between the two groups. Oncological outcomes (risk of positive circumferential resection margins, lymph node yield, and length of distal resection margins) were similar for these two surgical approaches.
In contrast to the ROLARR findings, this meta-analysis found that the risk of conversion favored the robot-assisted procedure (z = 5.51, P = .00001). Hospital stay (z = 2.46, P = 01) and time to first flatus outcomes (z = 3.09, P = .002) favored the robot-assisted procedure. Postop morbidity and mortality and reoperation rate were similar in the two groups.
“Based upon the findings of this largest-ever series on the role of robotic surgery in rectal cancer resection, the [robot-assisted procedure] is certainly a feasible technique and oncologically safe surgical intervention but failed to demonstrate any superiority over [the conventional laparoscopic approach] for many surgical outcomes,” the investigators wrote. “Mere advantage of robotic surgery was noted in only three postoperative outcomes, that is early passage of flatus, lower risk of conversion, and shorter hospitalization.”
Dr. Jones and her colleagues declared they had no conflicts of interest.
SOURCE: Jones K et al. World J Gastroentrol. 2018 Nov 15. doi: 10.4251/wjgo.v10.i11.449.
FROM WORLD JOURNAL OF GASTROINTESTINAL ONCOLOGY
Key clinical point:
Major finding: Duration of the operation was longer for the robot-assisted procedure, compared with the conventional laparoscopic approach (z = 1.28, P = .20), but blood loss, morbidity, and mortality were similar between the two groups.
Study details: Meta-analysis of 27 studies and one RCT of patients who had robot-assisted laparoscopic surgery or conventional laparoscopic surgery for rectal cancer.
Disclosures: The investigators had no disclosures.
Source: Jones K. World J Gastrointest Oncol. 2018 Nov 15. doi: 10.4251/wjgo.v10.i11.449.
Innovations in Dermatology: Laboratory Monitoring With Isotretinoin


Giving hospitalists a larger clinical footprint
Something you did not know about warm handoffs
I am going to teach you something you do not know. I am almost sure of it.

Warm handoffs – a term you often hear within the confines of hospital walls when transferring a patient service to service or ward to ward. You do it in-house, but it’s unlikely you make the same connection when you discharge the same patient or transfer them to an outside entity.
But you have to be asleep under a rock not to have heard or read the changes afoot in the skilled nursing facility (SNF) realm, including the rise of the “SNFist”. Too much variation in use and spending; plus, we are learning patients do not need 25 days cooped up in a rehabilitation facility when 15 might do with a segue into home health for another 10 or 14. Patients like being home, and it costs a lot less.
Unfortunately, we do not do SNF handoffs in the same manner as ICUs. Our bad, and inpatient providers better adapt.
As hospitals decant and quality measures get an intimate look in the rehab space, SNFs will notice sicker patients, and the staff there will be more mindful of the sign outs and the data they receive. Know a Centers for Medicare & Medicaid Services value-based program started on October 1 (just like hospitals – penalties and all) and SNFists, whoever they might be – NP/PA/DO/MD – will also require of hospitals a step-up in information transfer, both in quality and timeliness.
Read the full post at hospitalleader.org.
Also on The Hospital Leader
- “Immigration & the Future of Healthcare: Looking to a Greater Good,” by Jordan Messler, MD, SFHM
- “We Must Become Comfortable Talking about Physician Suicide,” by Tracy Cardin, ACNP-BC, SFHM
- “A New Light in the Darkness: Using Hospital-Based Medication-Assisted Treatment to Tackle the Opioid Crisis,” by Richard Bottner, PA-C
Something you did not know about warm handoffs
Something you did not know about warm handoffs
I am going to teach you something you do not know. I am almost sure of it.
Warm handoffs – a term you often hear within the confines of hospital walls when transferring a patient service to service or ward to ward. You do it in-house, but it’s unlikely you make the same connection when you discharge the same patient or transfer them to an outside entity.
But you have to be asleep under a rock not to have heard or read the changes afoot in the skilled nursing facility (SNF) realm, including the rise of the “SNFist”. Too much variation in use and spending; plus, we are learning patients do not need 25 days cooped up in a rehabilitation facility when 15 might do with a segue into home health for another 10 or 14. Patients like being home, and it costs a lot less.
Unfortunately, we do not do SNF handoffs in the same manner as ICUs. Our bad, and inpatient providers better adapt.
As hospitals decant and quality measures get an intimate look in the rehab space, SNFs will notice sicker patients, and the staff there will be more mindful of the sign outs and the data they receive. Know a Centers for Medicare & Medicaid Services value-based program started on October 1 (just like hospitals – penalties and all) and SNFists, whoever they might be – NP/PA/DO/MD – will also require of hospitals a step-up in information transfer, both in quality and timeliness.
Read the full post at hospitalleader.org.
Also on The Hospital Leader
- “Immigration & the Future of Healthcare: Looking to a Greater Good,” by Jordan Messler, MD, SFHM
- “We Must Become Comfortable Talking about Physician Suicide,” by Tracy Cardin, ACNP-BC, SFHM
- “A New Light in the Darkness: Using Hospital-Based Medication-Assisted Treatment to Tackle the Opioid Crisis,” by Richard Bottner, PA-C
Latest intranasal insulin results for Alzheimer’s muddied by malfunctioning inhaler
BARCELONA –
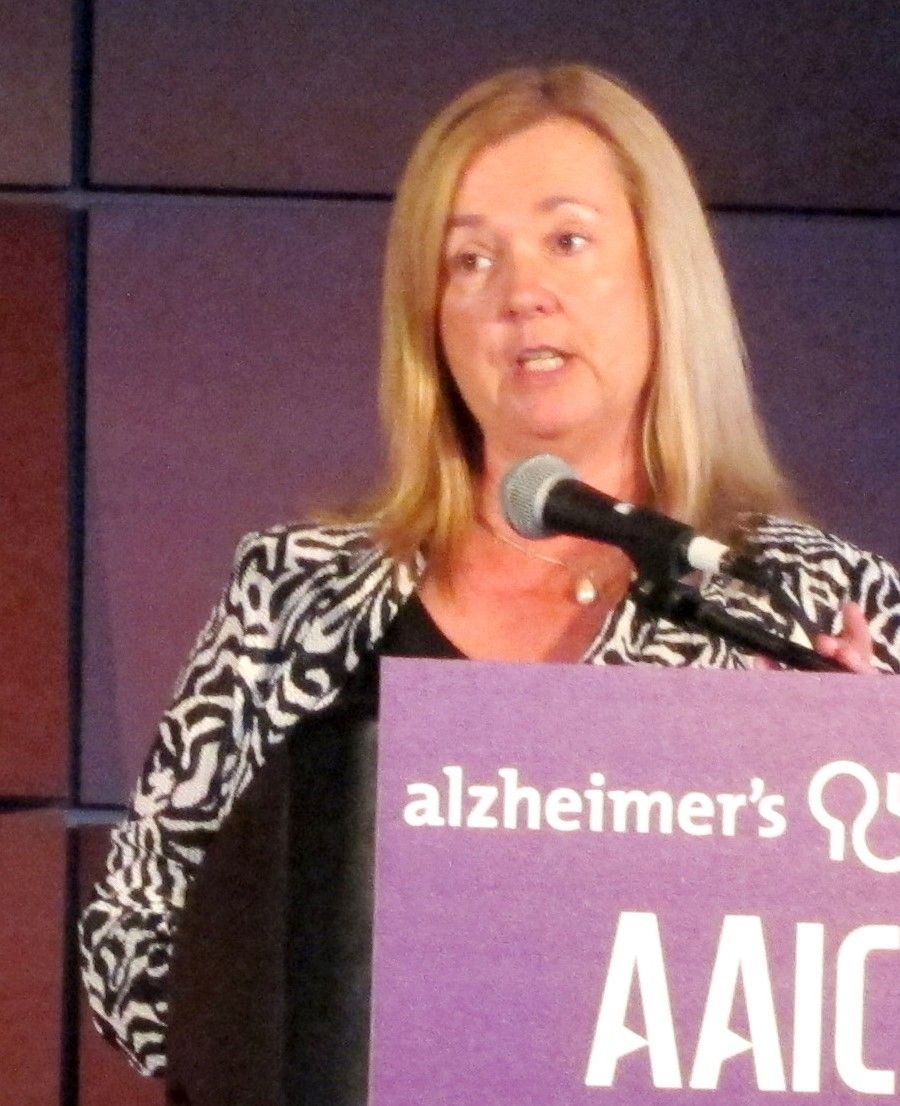
Instead of doing poorly, patients using the faulty device actually experienced better outcomes than did those who entered the study later and used a more reliable inhaler, Suzanne Craft, PhD, said at the Clinical Trials on Alzheimer’s Disease conference.
A secondary analysis of the ViaNase device subgroup “replicated findings in our original studies,” which used the same atomizer, said Dr. Craft, a professor of gerontology and geriatric medicine at Wake Forest University, Winston-Salem, N.C. “We remain optimistic, but clearly we are at the beginning of understanding optimal insulin doses and delivery techniques for this population.”
The 289-patient, placebo-controlled study was predicated by a prior successful study by Dr. Craft and her colleagues, published in 2012 in JAMA Neurology. That trial randomized 104 patients with amnestic mild cognitive impairment (MCI) or mild-moderate Alzheimer’s to placebo or intranasal insulin 20 or 40 IU. After 4 months, subjects in both insulin groups showed preserved cognition and functional abilities, as well as increased cerebral glucose metabolism.
The ViaNase device was manufactured by Kurve Technology. But the company redesigned it for the new trial, adding an electronic timing component, which Dr. Craft said, was supposed to increase ease of use.
“Unfortunately, there were frequent malfunctions of this mechanism for the first 49 patients – so much so that we had to discontinue using the device and switch to a newer one,” for the other 240 patients in the study. This intranasal drug-delivery system, called the Precisions Olfactory Delivery (POD) device, is made by Impel NeuroPharma. Dr. Craft’s trial is its first investigation in patients with Alzheimer’s disease.
The new study randomized 289 patients with MCI or mild Alzheimer’s to twice-daily sprays with a placebo device, or to intranasal insulin 40 IU for 12 months, followed by a 6-month, open-label period. The primary outcome was the Alzheimer’s Disease Assessment Scale-Cognition measure (ADAS-Cog 12). Secondary outcomes were the Clinical Dementia Rating Scale sum of boxes (CDR-sb) a memory composite measure, activities of daily living, cerebrospinal fluid biomarkers, and MRI of the hippocampus and entorhinal cortex.
Because of the device problems, Dr. Craft conducted separate analyses for the user groups. The primary was an intent-to-treat (ITT), mixed-model, repeat-measures analysis of the 240 using the POD device. The model controlled for age, sex, genetic risk status, and investigation site. An exploratory ITT analysis looked only at the ADAS-Cog 12 in the 49 who used the ViaNase device. Patients were a mean of 71 years old, with a mean Mini Mental State Exam score of 25. About 42% were positive for the high-risk apolipoprotein E epsilon-4 allele.
At 12 months, there was no between-group difference on the ADAS-Cog 12 measure; both groups increased by about 4 points, indicating worsening. Nor were there any changes in any of the Alzheimer’s-related biomarkers: amyloid-beta 40 and 42, total tau, or phosphorylated tau. There was a small but statistically significant difference in the sizes of the hippocampus and entorhinal cortex.
The ViaNase group fared somewhat better in the secondary analysis of the ADAS-Cog12. The measure increased by about 5 points in the placebo group, and about 2.5 points in the insulin group. The significant separation was evident at 3 months and continued to widen over the course of the study.
Compliance was very good in the larger group – around 85%. It was lower in the ViaNase group, probably because of the device’s unreliability. Retention was good in both groups. There were no significant differences in adverse events and no obvious safety issues.
The 6-month, open-label period will close out before the end of the year. In the meantime, Dr. Craft is conducting additional subgroup analyses on the 12-month data.
Dr. Craft has served as a consultant for GlaxoSmithKline and Accera.
SOURCE: Craft S et al. J Prev Alz Dis 2018;5(S1):S9, Abstract OC2.
BARCELONA –
Instead of doing poorly, patients using the faulty device actually experienced better outcomes than did those who entered the study later and used a more reliable inhaler, Suzanne Craft, PhD, said at the Clinical Trials on Alzheimer’s Disease conference.
A secondary analysis of the ViaNase device subgroup “replicated findings in our original studies,” which used the same atomizer, said Dr. Craft, a professor of gerontology and geriatric medicine at Wake Forest University, Winston-Salem, N.C. “We remain optimistic, but clearly we are at the beginning of understanding optimal insulin doses and delivery techniques for this population.”
The 289-patient, placebo-controlled study was predicated by a prior successful study by Dr. Craft and her colleagues, published in 2012 in JAMA Neurology. That trial randomized 104 patients with amnestic mild cognitive impairment (MCI) or mild-moderate Alzheimer’s to placebo or intranasal insulin 20 or 40 IU. After 4 months, subjects in both insulin groups showed preserved cognition and functional abilities, as well as increased cerebral glucose metabolism.
The ViaNase device was manufactured by Kurve Technology. But the company redesigned it for the new trial, adding an electronic timing component, which Dr. Craft said, was supposed to increase ease of use.
“Unfortunately, there were frequent malfunctions of this mechanism for the first 49 patients – so much so that we had to discontinue using the device and switch to a newer one,” for the other 240 patients in the study. This intranasal drug-delivery system, called the Precisions Olfactory Delivery (POD) device, is made by Impel NeuroPharma. Dr. Craft’s trial is its first investigation in patients with Alzheimer’s disease.
The new study randomized 289 patients with MCI or mild Alzheimer’s to twice-daily sprays with a placebo device, or to intranasal insulin 40 IU for 12 months, followed by a 6-month, open-label period. The primary outcome was the Alzheimer’s Disease Assessment Scale-Cognition measure (ADAS-Cog 12). Secondary outcomes were the Clinical Dementia Rating Scale sum of boxes (CDR-sb) a memory composite measure, activities of daily living, cerebrospinal fluid biomarkers, and MRI of the hippocampus and entorhinal cortex.
Because of the device problems, Dr. Craft conducted separate analyses for the user groups. The primary was an intent-to-treat (ITT), mixed-model, repeat-measures analysis of the 240 using the POD device. The model controlled for age, sex, genetic risk status, and investigation site. An exploratory ITT analysis looked only at the ADAS-Cog 12 in the 49 who used the ViaNase device. Patients were a mean of 71 years old, with a mean Mini Mental State Exam score of 25. About 42% were positive for the high-risk apolipoprotein E epsilon-4 allele.
At 12 months, there was no between-group difference on the ADAS-Cog 12 measure; both groups increased by about 4 points, indicating worsening. Nor were there any changes in any of the Alzheimer’s-related biomarkers: amyloid-beta 40 and 42, total tau, or phosphorylated tau. There was a small but statistically significant difference in the sizes of the hippocampus and entorhinal cortex.
The ViaNase group fared somewhat better in the secondary analysis of the ADAS-Cog12. The measure increased by about 5 points in the placebo group, and about 2.5 points in the insulin group. The significant separation was evident at 3 months and continued to widen over the course of the study.
Compliance was very good in the larger group – around 85%. It was lower in the ViaNase group, probably because of the device’s unreliability. Retention was good in both groups. There were no significant differences in adverse events and no obvious safety issues.
The 6-month, open-label period will close out before the end of the year. In the meantime, Dr. Craft is conducting additional subgroup analyses on the 12-month data.
Dr. Craft has served as a consultant for GlaxoSmithKline and Accera.
SOURCE: Craft S et al. J Prev Alz Dis 2018;5(S1):S9, Abstract OC2.
REPORTING FROM CTAD
Resection, neurostimulation combo found successful in eloquent cortical regions
NEW ORLEANS – Concurrent surgical resection and implanted strip electrodes eliminated refractory focal seizures in two patients with focal cortical dysplasia and reduced them by 62% in a third patient, according a report presented at the annual meeting of the American Epilepsy Society.
None of the patients had been considered surgical candidates because their seizure foci were in eloquent cortical regions; if fully resected, patients would have experienced marked neurologic deficits. But the combination procedure of flanking the incomplete resected foci with implanted electrodes allowed neurosurgeons to remove less tissue, preserving function while effectively treating previously untreatable seizures, Emily Mirro said at the meeting.
The two-in-one technique makes good surgical sense for these patients, she said in an interview. “If we simply performed the resection and closed without implanting the electrodes, just waiting to see if seizures develop or not, then going back to implant the electrodes, the surgery is riskier and more difficult,” said Ms. Mirro, director of field clinical engineering for NeuroPace, which makes the stimulator system.
At the meeting, she presented three case studies on behalf of primary authors Lawrence Shuer, MD, and Babak Razavi, MD, PhD, both of Stanford (Calif.) University.
The first patient was a 26-year-old with a focal cortical dysplasia in the right parietal region, causing about six seizures each month. At the time of surgery, surgeons flanked the resected region with four cortical strip leads over sensory cortex. The RNS System detected the first postsurgical seizure 1 month afterward. Five months later, the system was enabled at 0.5 milliamps. For the next year, the patient received about 100 stimulations per day, amounting to a total daily stimulation time of about 20 seconds. Electrographic seizures did return, at which point the system increased neurostimulation to about 2,000 per day (a total stimulation time of about 7 minutes per day). At 1.3 years, the patient remains seizure free.
Patient two was a 20-year-old with a left frontal transmantle cortical dysplasia that involved the inferior frontal sulcus. The baseline seizure frequency was about two per day. Surgeons removed the dysplastic area with a 2.0 cm x 0.5 cm resection; the deficit was flanked with two left-front cortical strip leads. In the following 9 days, the patient experienced eight seizures. At 14 days out, the system was enabled at 1 milliamp. This patient became seizure free and remains so at 1.3 years, with about 100 stimulations per day to suppress electrographic abnormalities.
The third patient, also 20 years old, had a left-parietal resection to the margin of the motor cortex. The baseline seizure frequency was up to 150 nocturnal events per month and several seizures during each day as well. The resection was flanked by one strip lead over the motor cortex; one depth lead implanted into it. Immediately after surgery, the patient experienced both electrographic and clinical seizures. The stimulator was enabled a week after surgery at 0.5 milliamps; this was titrated to 3 milliamps over 1.4 years. At last follow-up, the patient had about a 62% reduction in seizure frequency; all are now nocturnal.
None of the patients experienced any peri- or postoperative surgical complications.
Ms. Mirro is an employee of NeuroPace.
SOURCE: Razavi B et al. AES 2018, Abstract 2.315
REPORTING FROM AES 2018
Key clinical point:
Major finding: Two patients became seizure free and one had a 62% reduction in seizures.
Study details: A three-patient case series.
Disclosures: NeuroPace makes the neurostimulator used in the study. The presenter is an employee of NeuroPace.
Source: Razavi B et al. AES 2018, Abstract 2.315.
True postbariatric hyperinsulinemic hypoglycemia is rare
based on a decade’s worth of experience from the Mayo Clinic, Rochester, Minn.
Of 2,386 patients who had bariatric surgery at Mayo, 60 (2.6%) had a postsurgical diagnosis code associated with hypoglycemia in their medical record. However, just five of them (0.25%) had documentation meeting the criteria for Whipple’s Triad, which consists of low blood glucose levels, symptoms associated with the low glucose levels, and symptom resolution when glucose levels are corrected, Tiffany Cortes, MD, reported in an oral presentation at Obesity Week, which is presented by the Obesity Society and the American Society for Metabolic and Bariatric Surgery .
“Postbariatric hypoglycemia is an infrequent occurrence among patients who present with suspicious symptoms,” said Dr. Cortes, an endocrinology fellow at the clinic.
Post–bariatric surgery hypoglycemia is characterized by neuroglycopenia with a documented plasma glucose of less than 54 mg/dL with symptom resolution after a rise in glucose levels; neuroglycopenia that occurs 1-3 hours after a meal; and symptom onset more than 6 months after bariatric surgery, said Dr. Cortes.
Previous work had found that the overall prevalence of post–bariatric surgery hyperinsulinemic hypoglycemia ranged from 17%-34%, with severe symptoms seen in fewer than 1% of surgery recipients.
Bariatric surgery, especially Roux-en-Y gastric bypass (RYGB), may result in wide postprandial blood glucose excursions, with a spike occurring about 30 minutes after eating. For symptomatic individuals, this postprandial glucose peak will prompt an insulin surge followed by a rapid and steep decline in serum glucose.
Looking at Mayo Clinic medical records from mid-2008 to the end of 2017, Dr. Cortes and her colleagues wanted to determine the prevalence of hyperinsulinemic hypoglycemia in the bariatric surgery population.
Additionally, the researchers wanted to see how patients who presented with symptoms suspicious for the syndrome were evaluated and to understand the efficacy of treatments.
Patients who had a diagnosis of type 1 diabetes mellitus and those who were on insulin or sulfonylureas were excluded from the retrospective chart review.
Of the 60 patients evaluated in the endocrinology clinic for symptoms suspicious for hyperinsulinemic hypoglycemia, 51 (85%) were female, and 14 had a diagnosis of diabetes before surgery. Mean patient age at surgery was 43 years.
These symptomatic patients had a mean presurgical body mass index (BMI) of 42.8 kg/m2 (range, 38.6-49.3 kg/m2). Their mean time to maximal weight loss was 1.3 years after surgery, with symptoms beginning at 1.4 years after surgery. Patients lost a mean 37.4% of their body mass to reach a mean nadir BMI of 26.2.
Overall, about two-thirds of the surgeries performed were RYGB. Of patients with hypoglycemic symptoms, 73.3% had an RYGB. Revision of gastric bypass was the next most common surgery, at 21.8% overall; these patients constituted 15% of the hypoglycemic symptom group.
Of the patients with symptoms, 80% noted symptoms only after eating, with half of patients describing symptoms coming on 1-3 hours after eating. A little over a third of the patients didn’t describe the exact timing of symptoms.
Just 20 patients had a complete hypoglycemia work up bundle documented in their medical record, said Dr. Cortes. This consisted of measures of serum glucose, insulin, and C-peptide levels. Of the 20 patients, 5 met Whipple’s Triad criteria, and 4 of these patients received a diagnosis of hyperinsulinemic hypoglycemia.
Two patients had a 72-hour fast, and neither of them met diagnostic criteria. Seventeen patients had a mixed meal tolerance test, with one individual meeting diagnostic criteria for and receiving a diagnosis of hypoinsulinemic hyperglycemia.
Of the five patients meeting diagnostic criteria (0.20% of surgical population), all had received RYGB, and two had previous weight loss procedures, said Dr. Cortes. For four of the patients, the surgical indication was weight loss; the other patient had an indication of gastroesophageal reflux disease (GERD).
“Dietary interventions are the most effective treatment” for post–bariatric surgery hyperinsulinemic hypoglycemia in the Mayo Clinic experience, said Dr. Cortes.
Turning to the investigators’ examination of treatment recommendations for the 60 patients who reported hypoglycemic symptoms, most (95%) received an initial recommendation to manage symptoms by diet changes.
Most patients (77%) had at least one follow-up visit, with over half of these patients (61%) reporting improvement in symptoms, and seven patients (16%) reporting resolution. Twelve patients (27%) either remained the same or had not had a recurrence of symptoms.
Medication was prescribed for 12 patients; of them, 8 received the alpha glucosidase inhibitor acarbose and 7 responded, according to the record review. No one reported worsening of symptoms on acarbose.
Other individual patients were prescribed octreotide alone, or octreotide, pasireotide, or diazoxide in combination with acarbose, with variable results.
Dr. Cortes reported no conflicts of interest and no external sources of funding.
SOURCE: Cortes T et al. Obesity Week 2018, Abstract T-OR-2015.
REPORTING FROM OBESITY WEEK 2018
Key clinical point: Less than 1% of bariatric surgery patients had hyperinsulinemic hypoglycemia.
Major finding: When strict diagnostic criteria were used, 0.20% received the diagnosis.
Study details: Single-center retrospective chart review of 2,386 patients receiving bariatric surgery.
Disclosures: Dr. Cortes reported no outside sources of funding and no conflicts of interest.
Source: Cortes T et al. Obesity Week 2018, Abstract T-OR-2015.
FLT3 inhibitor moves forward in newly diagnosed AML
SAN DIEGO – In an ongoing phase 1 study, the oral FMS-like tyrosine kinase 3
The dose escalation/expansion study coupled the oral agent with induction and consolidation chemotherapy and was aimed at establishing the dosing and safety of gilteritinib.
The findings – reported at the annual meeting of the American Society of Hematology – mean that the FLT3 inhibitor will next be compared with the current standard of care, which has a 60%-65% remission rate, according to Keith W. Pratz, MD, of Johns Hopkins University in Baltimore.
“The later-phase clinical studies that we will be doing with gilteritinib will look to compare midostaurin-based chemotherapy with gilteritinib and looking for outcomes, with hopes of improving upon this 60%-65% remission rate,” Dr. Pratz said in a video interview.
Gilteritinib was recently approved by the Food and Drug Administration for relapsed/refractory AML patients with FLT3 mutations.
Dr. Pratz said the approval will provide a needed new treatment option in that patient population, which has had a low response rate to conventional therapy, in the range of 10%-15%.
“There really wasn’t a standard approved therapy prior to this and this will be what is given to most patients who have a FLT3 mutation and relapse,” he said.
Dr. Pratz reported consultancy and research funding from Astellas, which markets gilteritinib, as well as other companies.
REPORTING FROM ASH 2018