User login
CMS holds ACA risk adjustment payments following legal ruling
The risk adjustment payment uses statewide average premiums to draw money from health insurance plans within a state that have low levels of high-need patients and funnels that money to plans in that state with high amounts of high-need patients, as a way to minimize adverse selection and to spread risk.
The government was set to make a budget neutral payment of $10.4 billion for the 2017 plan year. But in a rare Saturday announcement, the agency said July 7 that the reason for putting the risk adjustment payments on hold was differing legal opinions on the validity of the payments.
The CMS filed a motion to reconsider following the New Mexico verdict, a hearing of which was held June 21.
“We are disappointed by the court’s recent ruling,” CMS Administrator Seema Verma said in a statement. “As a result of this litigation, billions of dollars in risk adjustment payments are now on hold. CMS has asked the court to reconsider its ruling, and hopes for a prompt resolution that allows CMS to prevent more adverse impacts on Americans who receive their insurance in the individual and small group markets.”
“We are very discouraged by the new market disruption brought about by the decision to freeze risk adjustment payments,” insurance trade group America’s Health Insurance Plans said in a statement. “The decision comes at a critical time when insurance providers are developing premiums for 2019 and states are reviewing rates. ... It will create more market uncertainty and increase premiums for many health plans.”
Likewise, the Blue Cross Blue Shield Association predicted higher premiums if the agency does not make payments.
““Without a quick resolution to this matter, this action will significantly increase 2019 premiums for millions of individuals and small business owners and could result in far fewer health plan choices,” BCBSA said in a statement. “It will undermine Americans’ access to affordable coverage, particularly for those who need medical care the most.”
The action comes as the Department of Justice is choosing not to defend the ACA in court against a lawsuit looking to declare the individual mandate unconstitutional in a case that would also eliminate the guaranteed issue provisions of the Affordable Care Act.
Oral arsenic/ATRA is noninferior to IV form in APML
For patients with non–high-risk acute promyelocytic leukemia (APML), the combination of an oral arsenic formulation and all-trans retinoic acid (ATRA) was noninferior to standard therapy with intravenous arsenic trioxide and ATRA, results of a randomized phase 3 trial show.
Among 109 patients with APML from one of 14 centers in China, the 2-year event-free survival rate after a median follow-up of 32 months was 97% for patients randomized to receive oral arsenic realgar-Indigo naturalis formula (RIF) plus ATRA, and 94% for patients randomized to IV arsenic trioxide plus ATRA, reported Hong-Hu Zhu, MD, of Peking University People’s Hospital in Beijing, China, and his colleagues.
“Our results suggest that non–high-risk acute promyelocytic leukemia can be cured using complete oral arsenic plus ATRA without conventional chemotherapy,” the investigators wrote. The report was published in The Lancet Oncology. “Although longer-term follow-up is needed to draw firm conclusions, our results support previously reported clinical and experimental evidence indicating that ATRA and arsenic act synergistically to eradicate acute promyelocytic leukemia.”
The combination of IV arsenic trioxide and ATRA has revolutionized the care of patients with APML, producing complete and durable remissions in more than 95% of patients with non–high-risk disease, defined as white blood cell counts of 10 x 109/L or less. The trial was designed to see whether an easier-to-administer all-oral regimen could be similarly efficacious and safe, the investigators said.
A total of 109 patients with newly diagnosed APML were randomly assigned on 2:1 basis to receive either RIF-ATRA (72 patients) or arsenic trioxide ATRA (37). Three patients in the oral arm and one in the arsenic trioxide arm did not receive the assigned therapy, but instead received ATRA and chemotherapy.
For induction, RIF was delivered 60 mg/kg daily in an oral divided dose; arsenic trioxide was delivered 0.15 mg/kg daily in an IV. ATRA was delivered 25 mg/m2 daily in an oral divided dose. Treatments were used until complete remissions were achieved.
Consolidation was home based and consisted of the same daily doses of RIF or arsenic trioxide in a 4-week-on/4-week-off regimen for four cycles, plus ATRA in the same daily dose in a 2-week-on/2-week-off regimen for seven cycles.
In a modified intention-to-treat analysis with 105 patients, 2-year EFS rates (the primary endpoint) were 97% with oral arsenic and 94% with arsenic trioxide. The percentage difference in EFS was 2.7% and RIF met the prespecified requirement for noninferiority because the lower limit of the 95% confidence interval (-5.8%) was greater than the noninferiority margin of –10%. The noninferiority of the oral formulation was confirmed in a per-protocol analysis, the investigators noted.
Grade 3 or 4 hepatotoxicities during induction were seen in 9% of patients treated with RIF-ATRA versus 14% of patients in the arsenic trioxide–ATRA group. Grade 3 or 4 infections occurred in 23% and 42% of patients, respectively.
Two patients in the arsenic trioxide–ATRA group died during induction therapy, one from hemorrhage and one from thrombocytopenia. There were no deaths during induction in the RIF-ATRA arm and no additional deaths in either arm during the consolidation phase.
All of the 103 surviving patients achieved complete remissions after consolidation.
The investigators acknowledged that the study was limited by a median follow-up time that was too short to allow definitive conclusions about overall survival. They plan to compare the costs of the two regimens in a future study.
SOURCE: Zhu HH et al. Lancet Oncol 2018;19:871-9.
The study by Dr. Zhu and colleagues advances the field of acute promyelocytic leukaemia treatment, but it also exposes important challenges in safely monitoring patients. Experienced hematologic oncologists are aware of the significant potential toxicity from arsenic treatment, including differentiation syndrome and thrombohemorrhagic events. Due to these potential complications, patients should always be managed in hospital during the first 2-3 weeks of induction, at least, so that they have the benefit of clinical and laboratory monitoring, transfusion support, and rapid supportive and therapeutic measures.
Francesco Lo-Coco, MD, and Laura Cicconi, MD, are with University Tor Vergata in Rome. Dr. Lo-Coco reported consultancy and speaker honoraria from Teva and Orsenix. Dr. Cicconi reported speaker honoraria from Teva. Their remarks are adapted and condensed from an accompanying editorial (Lancet Oncol. 2018;19:846-7).
For patients with non–high-risk acute promyelocytic leukemia (APML), the combination of an oral arsenic formulation and all-trans retinoic acid (ATRA) was noninferior to standard therapy with intravenous arsenic trioxide and ATRA, results of a randomized phase 3 trial show.
Among 109 patients with APML from one of 14 centers in China, the 2-year event-free survival rate after a median follow-up of 32 months was 97% for patients randomized to receive oral arsenic realgar-Indigo naturalis formula (RIF) plus ATRA, and 94% for patients randomized to IV arsenic trioxide plus ATRA, reported Hong-Hu Zhu, MD, of Peking University People’s Hospital in Beijing, China, and his colleagues.
“Our results suggest that non–high-risk acute promyelocytic leukemia can be cured using complete oral arsenic plus ATRA without conventional chemotherapy,” the investigators wrote. The report was published in The Lancet Oncology. “Although longer-term follow-up is needed to draw firm conclusions, our results support previously reported clinical and experimental evidence indicating that ATRA and arsenic act synergistically to eradicate acute promyelocytic leukemia.”
The combination of IV arsenic trioxide and ATRA has revolutionized the care of patients with APML, producing complete and durable remissions in more than 95% of patients with non–high-risk disease, defined as white blood cell counts of 10 x 109/L or less. The trial was designed to see whether an easier-to-administer all-oral regimen could be similarly efficacious and safe, the investigators said.
A total of 109 patients with newly diagnosed APML were randomly assigned on 2:1 basis to receive either RIF-ATRA (72 patients) or arsenic trioxide ATRA (37). Three patients in the oral arm and one in the arsenic trioxide arm did not receive the assigned therapy, but instead received ATRA and chemotherapy.
For induction, RIF was delivered 60 mg/kg daily in an oral divided dose; arsenic trioxide was delivered 0.15 mg/kg daily in an IV. ATRA was delivered 25 mg/m2 daily in an oral divided dose. Treatments were used until complete remissions were achieved.
Consolidation was home based and consisted of the same daily doses of RIF or arsenic trioxide in a 4-week-on/4-week-off regimen for four cycles, plus ATRA in the same daily dose in a 2-week-on/2-week-off regimen for seven cycles.
In a modified intention-to-treat analysis with 105 patients, 2-year EFS rates (the primary endpoint) were 97% with oral arsenic and 94% with arsenic trioxide. The percentage difference in EFS was 2.7% and RIF met the prespecified requirement for noninferiority because the lower limit of the 95% confidence interval (-5.8%) was greater than the noninferiority margin of –10%. The noninferiority of the oral formulation was confirmed in a per-protocol analysis, the investigators noted.
Grade 3 or 4 hepatotoxicities during induction were seen in 9% of patients treated with RIF-ATRA versus 14% of patients in the arsenic trioxide–ATRA group. Grade 3 or 4 infections occurred in 23% and 42% of patients, respectively.
Two patients in the arsenic trioxide–ATRA group died during induction therapy, one from hemorrhage and one from thrombocytopenia. There were no deaths during induction in the RIF-ATRA arm and no additional deaths in either arm during the consolidation phase.
All of the 103 surviving patients achieved complete remissions after consolidation.
The investigators acknowledged that the study was limited by a median follow-up time that was too short to allow definitive conclusions about overall survival. They plan to compare the costs of the two regimens in a future study.
SOURCE: Zhu HH et al. Lancet Oncol 2018;19:871-9.
FROM THE LANCET ONCOLOGY
Key clinical point:
Major finding: The 2-year event-free survival was 97% with oral arsenic/ATRA versus 94% with IV arsenic trioxide/ATRA.
Study details: Randomized open-label phase 3 trial of 109 patients with APML.
Disclosures: The National Natural Science Foundation of China, the Beijing Municipal Science and Technology Commission, and the National Key R&D Program of China supported the study. The investigators reported having no financial disclosures.
Source: Zhu HH et al. Lancet Oncol. 2018;19:871-9.
Intensive nonaspirin NSAID use linked to reduced ovarian cancer mortality
Intensive use of nonaspirin nonsteroidal anti-inflammatory drugs (NSAIDs) was associated with improved survival of patients with serous ovarian cancer in a recent population-based study.
By contrast, any use of nonaspirin NSAIDs was not associated with survival benefit, according to the authors of the study, which was based on records for more than 4,000 patients in the Danish Cancer Registry.
“More intensive use of nonaspirin NSAIDs appears necessary to obtain a prognostic benefit,” wrote Freija Verdoodt, PhD, postdoctoral researcher with the Danish Cancer Society Research Center, Copenhagen and her coauthors. The report was published in Gynecologic Oncology.
In addition, there was a suggestion that use of these drugs was associated with increased mortality in patients that with nonserous ovarian cancer, Dr. Verdoodt and her colleagues noted.
The study population comprised 4,117 women who were alive 1 year after a diagnosis of epithelial ovarian cancer. Ovarian cancer–specific mortality, the primary outcome of the analysis, was evaluated in relation to postdiagnosis use of nonaspirin NSAIDs.
The investigators found that any postdiagnosis use of nonaspirin NSAIDs was not associated with a difference in mortality, with a hazard ratio of 0.97 (95% confidence interval, 0.87-1.08) after adjusting for factors such as age, clinical stage, and year of diagnosis.
“Nonaspirin NSAIDs are typically used sporadically, and thus limited use among a substantial proportion of the postdiagnosis users may have attenuated the mortality risk estimates of our main analysis,” Dr. Verdoodt and her coauthors wrote.
However, increasing cumulative dose was associated with decreases in mortality, with hazard ratios of 1.03, 0.96, and 0.75 for low, medium, and high cumulative doses, respectively.
Likewise, the intensity of use, defined as cumulative dose divided by the number of days between the first and most recent postdiagnosis NSAID prescription, was associated with decreased mortality, with hazard ratios of 1.04, 0.98, and 0.86 for low, medium, and high use intensity, the reported data show.
When stratified by tumor histology, the data showed an association between reduced ovarian cancer–specific mortality and serous ovarian tumors (hazard ratio, 0.87; 95% CI, 0.77-0.99), and post hoc analyses confirmed further reductions in mortality based on high cumulative doses, with a hazard ratio of 0.62, and high intensity of use, with a hazard ratio of 0.79.
Conversely, other histologies were associated with increases in ovarian cancer mortality, though the numbers of patients in these subgroups were small, limiting interpretation of the results, investigators said.
Prior to this study, there were few epidemiologic investigations of the impact of nonaspirin NSAIDs on ovarian cancer prognosis, and of those, most did not include separate estimates based on histological subtypes, according to the investigators.
Although this study suggests intensive nonaspirin NSAID use comes with a potential prognostic benefit, these drugs also have potential adverse effects, including serious cardiovascular adverse events, the investigators said.
“A consideration of such risks in the light of a survival benefit among poor-prognosis serous ovarian cancer patients should guide further research,” they wrote.
The study was supported by the Sapere Aude program of the Independent Research Fund Denmark and the Mermaid project. The authors declared no conflicts of interest.
SOURCE: Verdoodt F et al. Gynecol Oncol. 2018 Jun 27. doi: 10.1016/j.ygyno.2018.06.018.
FROM GYNECOLOGIC ONCOLOGY
Key clinical point: Intensive use of nonaspirin nonsteroidal anti-inflammatory drugs (NSAIDs) was associated with improved survival of patients with serous ovarian cancer
Major finding: Serous ovarian tumors were associated with reduced ovarian cancer-specific mortality (HR, 0.87; 95% CI, 0.77-0.99), while post hoc analyses confirmed further reductions in mortality based on high cumulative doses (HR, 0.62), and high use intensity (HR, 0.79).
Study details: A population-based study of the Danish Cancer Registry including 4,117 women alive at least 1 year after an ovarian cancer diagnosis.
Disclosures: The study was supported by the Sapere Aude program of the Independent Research Fund Denmark and the Mermaid project. The authors declared no conflicts of interest.
Source: Verdoodt F et al. Gynecol Oncol. 2018 Jun 27. doi: 10.1016/j.ygyno.2018.06.018.
Mutations may be detectable years before AML diagnosis
Individuals who develop acute myeloid leukemia (AML) may have somatic mutations detectable years before diagnosis, a newly published analysis shows.
Mutations in IDH1, IDH2, TP53, DNMT3A, TET2, and spliceosome genes at baseline assessment increased the odds of developing AML with a median follow-up of 9.6 years in the study, which was based on blood samples from participants in the Women’s Health Initiative (WHI).
The findings suggest a “premalignant landscape of mutations” that may precede overt AML by many years, according to Pinkal Desai, MD, assistant professor of medicine at Cornell University and oncologist at New York–Presbyterian/Weill Cornell Medical Center, New York, and her coauthors.
“The ability to detect and identify high-risk mutations suggests that monitoring strategies for patients, as well as clinical trials of potentially preventative or disease-intercepting interventions should be considered,” wrote Dr. Desai and her colleagues. The report was published in Nature Medicine.
Their analysis comprised 212 women who participated in the WHI who were healthy at the baseline evaluation but went on to develop AML during follow-up. They performed deep sequencing on peripheral blood DNA for these cases and for 212 age-matched controls.
Women who developed AML were more likely than were controls to have mutations in baseline assessment (odds ratio, 4.86; 95% confidence interval, 3.07-7.77), and had demonstrated greater clonal complexity versus controls (comutations in 46.8% and 5.5%, respectively; odds ratio, 9.01; 95% CI, 4.1-21.4), investigators found.
All 21 patients with TP53 mutations went on to develop AML, as did all 15 with IDH1 or IDH2 mutations and all 3 with RUNX1 mutations. Multivariate analysis showed that TP53, IDH1 and IDH2, TET2, DNMT3A and several spliceosome genes were associated with significantly increased odds of AML versus controls.
Based on these results, Dr. Desai and colleagues proposed that patients at increased AML risk should be followed in long-term monitoring studies that incorporate next-generation sequencing.
“Data from these studies will provide a robust rationale for clinical trials of preventative intervention strategies in populations at high risk of developing AML,” they wrote.
In clinical practice, monitoring individuals for AML-associated mutations will become more feasible as costs decrease and new therapies with favorable toxicity profiles are introduced, they added.
“Molecularly targeted therapy is already available for IDH2 mutations and is under development for mutations in other candidate genes found in this study including IDH1, TP53 and spliceosome genes,” they wrote.
The authors reported having no relevant financial disclosures. The WHI program is funded by the National Institutes of Health.
SOURCE: Desai P et al. Nat Med. 2018;24:1015-23.
FROM NATURE MEDICINE
Key clinical point:
Major finding: Compared with controls, those who eventually developed AML were more likely to have mutations (odds ratio, 4.86; 95% CI, 3.07-7.77) in baseline assessment at a median of 9.6 years before diagnosis.
Study details: Analysis of blood samples from 212 women who developed AML and 212 age-matched controls in the Women’s Health Initiative.
Disclosures: The researchers reported having no relevant financial disclosures. The WHI program is funded by the National Institutes of Health.
Source: Desai P et al. Nat Med. 2018;24:1015-23.
Diagnosis and Management of Aggressive B-Cell Non-Hodgkin Lymphoma
Abstract
- Objective: To review the diagnosis and management of aggressive B-cell non-Hodgkin lymphoma (NHL).
- Methods: Review of the literature.
- Results: NHL comprises a wide variety of malignant hematologic disorders with varying clinical and biological features. Aggressive NHLs are characterized by rapid clinical progression without therapy. However, a significant proportion of patients are cured with appropriate combination chemotherapy or combined modality regimens. In contrast, the indolent lymphomas have a relatively good prognosis (median survival of 10 years or longer) but usually are not curable in advanced clinical stages. Overall 5-year survival for aggressive NHLs with current treatment is approximately 50% to 60%, with relapses typically occurring within the first 5 years.
- Conclusion: Treatment strategies for relapsed patients offer some potential for cure; however, clinical trial participation should be encouraged whenever possible to investigate new approaches for improving outcomes in this patient population.
Non-Hodgkin lymphoma (NHL) comprises a wide variety of malignant hematologic disorders with varying clinical and biological features. The more than 60 separate NHL subtypes can be classified according to cell of origin (B cell versus T cell), anatomical location (eg, orbital, testicular, bone, central nervous system), clinical behavior (indolent versus aggressive), histological features, or cytogenetic abnormalities. Although various NHL classification schemes have been used over the years, the World Health Organization (WHO) classification is now widely accepted as the definitive pathologic classification system for lymphoproliferative disorders, incorporating morphologic, immunohistochemical, flow cytometric, cytogenetic, and molecular features [1]. While the pathologic and molecular subclassification of NHL has become increasingly refined in recent years, from a management standpoint, classification based on clinical behavior remains very useful. This approach separates NHL subtypes into indolent versus aggressive categories. Whereas indolent NHLs may remain clinically insignificant for months to years, aggressive B-cell NHLs generally become life-threatening within weeks to months without treatment.
Epidemiology
Data from cancer registries show a steady, unexplainable increase in the incidence of NHL during the second half of the 20th century; the incidence has subsequently plateaued. There was a significant increase in NHL incidence between 1970 and 1995, which has been attributed in part to the HIV epidemic. More than 72,000 new cases of NHL were diagnosed in the United States in 2017, compared to just over 8000 cases of Hodgkin lymphoma, making NHL the sixth most common cancer in adult men and the fifth most common in adult women [2]. NHL appears to occur more frequently in Western countries than in Asian populations.
Various factors associated with increased risk for B-cell NHL have been identified over the years, including occupational and environmental exposure to certain pesticides and herbicides [3], immunosuppression associated with HIV infection [4], autoimmune disorders [5], iatrogenically induced immune suppression in the post-transplant and other settings [6], family history of NHL [7], and a personal history of a prior cancer, including Hodgkin lymphoma and prior NHL [8]. In terms of infectious agents associated with aggressive B-cell NHLs, Epstein-Barr virus (EBV) has a clear pathogenic role in Burkitt lymphoma, in many cases of post-transplant lymphoproliferative disorders, and in some cases of HIV-related aggressive B-cell lymphoma [9]. Human herpesvirus-8 viral genomes have been found in virtually all cases of primary effusion lymphomas [10]. Epidemiological studies also have linked hepatitis B and C to increased incidences of certain NHL subtypes [11–13], including primary hepatic diffuse large B-cell lymphoma (DLBCL). Similarly, Helicobacter pylori has been associated with gastric DLBCL.
Staging and Workup
A tissue biopsy is essential in the diagnosis and management of NHL. The most significant disadvantage of fine-needle aspiration cytology is the lack of histologic architecture. The optimal specimen is an excisional biopsy; when this cannot be performed, a core needle biopsy, ideally using a 16-gauge or larger caliber needle, is the next best choice.
The baseline tests appropriate for most cases of newly diagnosed aggressive B-cell NHL are listed in Table 1. 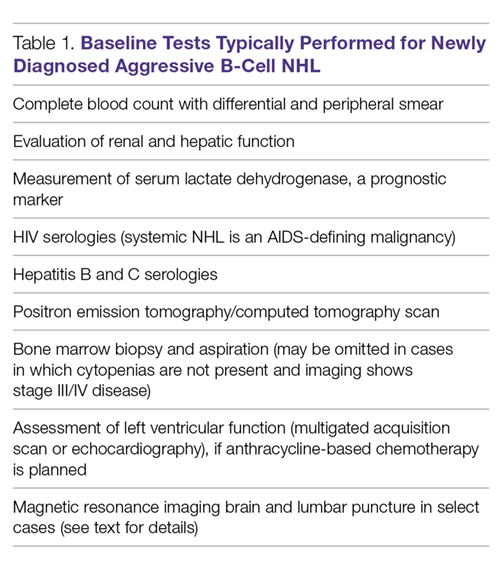
Prior to the initiation of treatment, patients should always undergo a thorough cardiac and pulmonary evaluation, especially if the patient will be treated with an anthracycline or mediastinal irradiation. Central nervous system (CNS) evaluation with magnetic resonance imaging (MRI) and lumbar puncture is essential if there are neurological signs or symptoms. In addition, certain anatomical sites including the testicles, paranasal sinuses, kidney, adrenal glands, and epidural space have been associated with increased involvement of the CNS and may warrant MRI evaluation and lumbar puncture. Certain NHL subtypes like Burkitt lymphoma, high-grade NHL with translocations of MYC and BCL-2 or BCL-6 (double-hit lymphoma), blastoid mantle cell lymphoma, and lymphoblastic lymphoma have a high risk of CNS involvement, and patients with these subtypes need CNS evaluation.
The Lugano classification is used to stage patients with NHL [14]. This classification is based on the Ann Arbor staging system and uses the distribution and number of tumor sites to stage disease. In general, this staging system in isolation is of limited value in predicting survival after treatment. However, the Ann Arbor stage does have prognostic impact when incorporated into risk scoring systems such as the International Prognostic Index (IPI). In clinical practice, the Ann Arbor stage is useful primarily to determine eligibility for localized therapy approaches. The absence or presence of systemic symptoms such as fevers, drenching night sweats, or weight loss (> 10% of baseline over 6 months or less) is designated by A or B, respectively.
Diffuse Large B-Cell Lymphoma
DLBCL is the most common lymphoid neoplasm in adults, accounting for about 25% of all NHL cases [2]. It is increasingly clear that the diagnostic category of DLBCL is quite heterogeneous in terms of morphology, genetics, and biologic behavior. A number of clinicopathologic subtypes of DLBCL exist, such as T cell/histiocyte–rich large B-cell lymphoma, primary mediastinal large B-cell lymphoma, intravascular large B-cell lymphoma, DLBCL associated with chronic inflammation, lymphomatoid granulomatosis, and EBV-positive large B-cell lymphoma, among others. Gene expression profiling (GEP) can distinguish 2 cell of origin DLBCL subtypes: the germinal center B-cell (GCB) and activated B-cell (ABC) subtypes [15].
DLBCL may be primary (de novo) or may arise through the transformation of many different types of low-grade B-cell lymphomas. This latter scenario is referred to as histologic transformation or transformed lymphoma. In some cases, patients may have a previously diagnosed low-grade B-cell NHL; in other cases, both low-grade and aggressive B-cell NHL may be diagnosed concurrently. The presence of elements of both low-grade and aggressive B-cell NHL in the same biopsy specimen is sometimes referred to as a composite lymphoma.
In the United States, incidence varies by ethnicity, with DLBCL being more common in Caucasians than other races [16]. There is a slight male predominance (55%), median age at diagnosis is 65 years [16,17] and the incidence increases with age.
Presentation, Pathology, and Prognostic Factors
The most common presentation of patients with DLBCL is rapidly enlarging lymphadenopathy, usually in the neck or abdomen. Extranodal/extramedullary presentation is seen in approximately 40% of cases, with the gastrointestinal (GI) tract being the most common site. However, extranodal DLBCL can arise in virtually any tissue [18]. Nodal DLBCL presents with symptoms related to the sites of involvement (eg, shortness of breath or chest pain with mediastinal lymphadenopathy), while extranodal DLBCL typically presents with symptoms secondary to dysfunction at the site of origin. Up to one third of patients present with constitutional symptoms (B symptoms) and more than 50% have elevated serum lactate dehydrogenase (LDH) at diagnosis [19].
Approximately 40% of patients present with stage I/II disease. Of these, only a subset present with stage I, or truly localized disease (defined as that which can be contained within 1 irradiation field). About 60% of patients present with advanced (stage III–IV) disease [20]. The bone marrow is involved in about 15% to 30% of cases. DLBCL involvement of the bone marrow is associated with a less favorable prognosis. Patients with DLBCL elsewhere may have low-grade NHL involvement of the bone marrow. Referred to as discordant bone marrow involvement [21], this feature does not carry the same poor prognosis associated with transformed disease [22] or DLBCL involvement of the bone marrow [23].
DLBCL is defined as a neoplasm of large B-lymphoid cells with a diffuse growth pattern. The proliferative fraction of cells, as determined by Ki-67 staining, is usually greater than 40%, and may even exceed 90%. Lymph nodes usually demonstrate complete effacement of the normal architecture by sheets of atypical lymphoid cells. Tumor cells in DLBCL generally express pan B-cell antigens (CD19, CD20, CD22, CD79a, Pax-5) as well as CD45 and surface immunoglobulin. Between 20% and 37% of DLBCL cases express the BCL-2 protein [24], and about 70% express the BCL-6 protein [25]. C-MYC protein expression is seen in a higher percentage (~ 30%–50%) of cases of DLBCL [26].
Many factors are associated with outcome in DLBCL. The IPI score was developed in the pre-rituximab era and is a robust prognostic tool. This simple tool uses 5 easily obtained clinical factors (age > 60 years, impaired performance status, elevated LDH, > 1 extranodal site of disease, and stage III/IV disease). By summing these factors, 4 groups with distinct 5-year overall survival (OS) rates ranging from 26% to 73% were identified (Table 2). 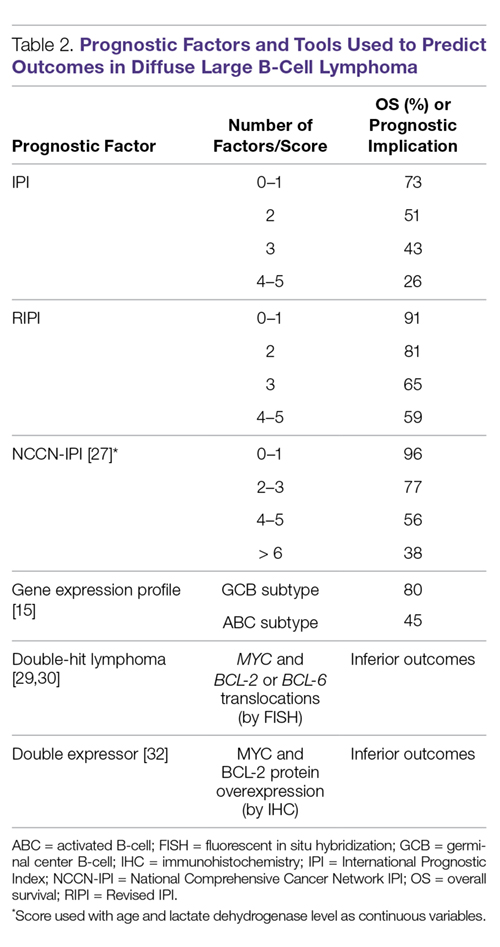
Cytogenetic and molecular factors also predict outcome in DLBCL. The ABC subtype distinguished by GEP has consistently been shown to have inferior outcomes with first-line therapy. As GEP is not routinely available in clinical practice, immunohistochemical (IHC) approaches (eg, the Hans algorithm) have been developed that can approximate the GEP subtypes. These IHC approaches have approximately 80% concordance with GEP [28]. The 3 most common chromosomal translocations in DLBCL involve BCL-2, BCL-6 and MYC. MYC-rearranged DLBCLs have a less favorable prognosis [29,30]. Cases in which a MYC translocation occurs in combination with a BCL-2 or BCL-6 translocation are commonly referred to as double-hit lymphoma (DHL); cases with all 3 translocations are referred to as triple-hit lymphoma (THL). Both DHL and THL have a worse prognosis with standard DLBCL therapy compared to non-DHL/THL cases. In the 2016 revised WHO classification, DHL and THL are an entity technically distinct from DLBCL, referred to as high-grade B-cell lymphoma [1]. In some cases, MYC and BCL-2 protein overexpression occurs in the absence of chromosomal translocations. Cases in which MYC and BCL-2 are overexpressed (by IHC) are referred to as double expressor lymphoma (DEL), and also have inferior outcome compared with non-DEL DLBCL [31,32]. Interestingly, MYC protein expression alone does not confer inferior outcomes, unlike isolated MYC translocation, which is associated with inferior outcomes.
Treatment
First-Line Therapy. DLBCL is an aggressive disease and, in most cases, survival without treatment can be measured in weeks to months. The advent of combination chemotherapy (CHOP [cyclophosphamide, doxorubicin, vincristine, and prednisone] or CHOP-like regimens) led to disease-free survival (DFS) rates of 35% to 40% at 3 to 5 years [33]. The addition of rituximab to CHOP (R-CHOP) has improved both progression-free surivial (PFS) and OS [34,35].
Treatment options vary for patients with localized (stage I/II) and advanced (stage III/IV) disease. Options for limited-stage DLBCL include an abbreviated course of R-CHOP (3 or 4 cycles) with involved-field radiation therapy (IFRT) versus a full course (6–8 cycles) of R-CHOP without radiation therapy (RT). Most studies comparing combined modality therapy (chemotherapy plus RT) versus chemotherapy alone were conducted in the pre-rituximab era. With the introduction of rituximab, Persky and colleagues [36] studied the use of 3 cycles of R-CHOP followed by RT, demonstrating a slightly improved OS of 92% at 4 years as compared to 88% in a historical cohort. The French LYSA/GOELAMS group performed the only direct comparison in the rituximab era (4 cycles of R-CHOP followed by RT versus 4 cycles of R-CHOP followed by 2 additional cycles of R-CHOP) and reported similar outcomes between both arms [37], with OS of 92% in the R-CHOP alone arm and 96% in the R-CHOP + RT arm (nonsignificant difference statistically). IFRT alone is not recommended other than for palliation in patients who cannot tolerate chemotherapy or combined modality therapy. Stage I and II patients with bulky disease (> 10 cm) have a prognosis similar to patients with advanced DLBCL and should be treated aggressively with 6 to 8 cycles of R-CHOP with or without RT [36].
For patients with advanced stage disease, a full course of R-CHOP-21 (6–8 cycles given on a 21-day cycle) is the standard of care. This approach results in OS rates of 70% and 60% at 2 and 5 years, respectively. For older adults unable to tolerate full-dose R-CHOP, attenuated versions of R-CHOP with decreased dose density or decreased dose intensity have been developed [38]. Numerous randomized trials have attempted to improve upon the results of R-CHOP-21 using strategies such as infusional chemotherapy (DA-EPOCH-R [etoposide, prednisone, vincristine, cyclophosphamide, doxorubicin, rituximab]) [39]; dose-dense therapy (R-CHOP-14); replacement of rituximab with obinutuzuimab [40]; addition of novel agents such as bortezomib [41], lenalidomide[42], or ibrutinib [43,44] to R-CHOP; and various maintenance strategies such as rituximab, lenalidomide [45], enzastaurin [46], and everolimus [47]. Unfortunately, none of these strategies has been shown to improve OS in DLBCL. In part this appears to be due to the fact that inclusion/exclusion criteria for DLBCL trials have been too strict, such that the most severely ill DLBCL patients are typically not included. As a result, the results in the control arms have ended up better than what was expected based on historical data. Efforts are underway to include all patients in future first-line DLBCL studies.
Currently, autologous hematopoietic cell transplantation (auto-HCT) is not routinely used in the initial treatment of DLBCL. In the pre-rituximab era, numerous trials were conducted in DLBCL patients with high and/or high-intermediate risk disease based on the IPI score to determine if outcomes could be improved with high-dose therapy and auto-HCT as consolidation after patients achieved complete remission with first-line therapy. The results of these trials were conflicting. A 2003 meta-analysis of 11 such trials concluded that the results were very heterogeneous and showed no OS benefit [48]. More recently, the Southwestern Oncology Group published the results of a prospective trial testing the impact of auto-HCT for consolidation of aggressive NHL patients with an IPI score of 3 to 5 who achieved complete remission with first-line therapy with CHOP or R-CHOP. In this study, 75% of the patients had DLBCL and, of the B-cell NHL patients, 47% received R-CHOP. A survival benefit was seen only in the subgroup that had an IPI score of 4 or 5; a subgroup analysis restricted to those receiving R-CHOP as induction was not performed, however [49]. As a result, this area remains controversial, with most institutions not routinely performing auto-HCT for any DLBCL patients in first complete remission and some institutions considering auto-HCT in first complete remission for patients with an IPI score of 4 or 5. These studies all used the IPI score to identify high-risk patients. It is possible that the use of newer biomarkers or minimal-residual disease analysis will lead to a more robust algorithm for identifying high-risk patients and selecting patients who might benefit from consolidation of first complete remission with auto-HCT.
For patients with DHL or THL, long-term PFS with standard R-CHOP therapy is poor (20% to 40%) [50,51]. Treatment with more intensive first-line regimens such as DA-EPOCH-R, R-hyperCVAD (rituximab plus hyperfractionated cyclophosphamide, vincristine, doxorubicin, dexamethasone), or CODOX-M/IVAC±R (cyclophosphamide, vincristine, doxorubicin, high‐dose methotrexate/ifosfamide, etoposide, high‐dose cytarabine ± rituximab), along with CNS prophylaxis, however, has been shown to produce superior outcomes [52], with 3-year relapse-free survival rates of 88% compared to 56% for R-CHOP. For patients who achieve a complete response by PET/CT scan after intensive induction, consolidation with auto-HCT has not been shown to improve outcomes based on retrospective analysis. However for DHL/THL patients who achieve complete response after R-CHOP, PFS was improved if auto-HCT was given as consolidation of first remission [53].
Patients with DLBCL have an approximately 5% risk of subsequently developing CNS involvement. Historically (in the pre-rituximab era), patients who presented with multiple sites of extranodal disease and/or extensive bone marrow involvement and/or an elevated LDH had an increased risk (up to 20%–30%) of developing CNS involvement. In addition, patients with involvement of certain anatomical sites (testicular, paranasal sinuses, epidural space) had an increased risk of CNS disease. Several algorithms have been proposed to identify patients who should receive prophylactic CNS therapy. One of the most robust tools for this purpose is the CNS-IPI, which is a 6-point score consisting of the 5 IPI elements, plus 1 additional point if the adrenal glands or kidneys are involved. Importantly, the CNS-IPI was developed and validated in patients treated with R-CHOP-like therapy. Subsequent risk of CNS relapse was 0.6%, 3.4%, and 10.2% for those with low-, intermediate- and high-risk CNS-IPI scores, respectively [54]. A reasonable strategy, therefore, is to perform CNS prophylaxis in those with a CNS-IPI score of 4 to 6. When CNS prophylaxis is used, intrathecal methotrexate or high-dose systemic methotrexate is most frequently given, with high-dose systemic methotrexate favored over intrathecal chemotherapy given that high-dose methotrexate penetrates the brain and spinal cord parenchyma, in addition to treating the cerebrospinal fluid (CSF) [55]. In contrast, intrathecal therapy only treats the CSF and requires repeated lumbar punctures or placement of an Ommaya reservoir. For DLBCL patients who present with active CSF involvement (known as lymphomatous meningitis), intrathecal chemotherapy treatments are typically given 2 or 3 times weekly until the CSF clears, followed by weekly intrathecal treatment for 4 weeks, and then monthly intrathecal treatment for 4 months [56]. For those with concurrent systemic and brain parenchymal DLBCL, a strategy of alternating R-CHOP with mid-cycle high-dose methotrexate can be successful. In addition, consolidation with high-dose therapy and auto-HCT improved survival in such patients in 1 retrospective series [57].
Relapsed/Refractory Disease. Between 30% and 40% of patients with advanced stage DLBCL will either fail to attain a remission with primary therapy (referred to as primary induction failure) or will relapse. In general, for those with progressive or relapsed disease, an updated tissue biopsy is recommended. This is especially true for patients who have had prior complete remission and have new lymph node enlargement, or those who have emergence of new sites of disease at the completion of first-line therapy.
Patients with relapsed disease are treated with systemic second-line platinum-based chemoimmunotherapy, with the usual goal of ultimately proceeding to auto-HCT. A number of platinum-based regimens have been used in this setting such as R-ICE, R-DHAP, R-GDP, R-Gem-Ox, and R-ESHAP. None of these regimens has been shown to be superior in terms of efficacy, and the choice of regimen is typically made based on the anticipated tolerance of the patient in light of comorbidities, laboratory studies, and physician preference. In the CORAL study, R-DHAP (rituximab, dexamethasone, high-dose cytarabine, cisplatin) seemed to show superior PFS in patients with the GCB subtype [58]. However, this was an unplanned subgroup analysis and R-DHAP was associated with higher renal toxicity.
Several studies have demonstrated that long-term PFS can be observed for relapsed/refractory DLBCL patients who respond to second-line therapy and then undergo high-dose therapy with auto-HCT. The Parma trial remains the only published prospective randomized trial performed in relapsed DLBCL comparing a transplant strategy to a non-transplant strategy. This study, performed in the pre-rituximab era, clearly showed a benefit in terms of DFS and OS in favor of auto-HCT versus salvage therapy alone [59]. The benefit of auto-HCT in patients treated in the rituximab era, even in patients who experience early failure (within 1 year of diagnosis), was confirmed in a retrospective analysis by the Center for International Blood and Marrow Transplant Research. In this study, a 44% 3-year PFS was seen in the early failure cohort versus 52% in the late failure cohort [60].
Some DLBCL patients are very unlikely to benefit from auto-HCT. The REFINE study focused on patients with primary induction failure or early relapse within 6 months of completing first-line therapy. Among such patients, primary progressive disease (defined as progression while still receiving first-line therapy), a high NCCN-IPI score at relapse, and MYC rearrangement were risk factors for poor PFS following auto-HCT [61]. Patients with 2 or 3 high-risk features had a 2-year OS of 10.7% compared to 74.3% for those without any high-risk features.
Allogeneic HCT (allo-HCT) is a treatment option for relapsed/refractory DLBCL. This option is more commonly considered for patients in whom an autotransplant has failed to achieve durable remission. For properly selected patients in this setting, a long-term PFS in the 30% to 40% range can be attained [62]. However, in practice, only about 20% of patients who fail auto-HCT end up undergoing allo-HCT due to rapid progression of disease, age, poor performance status, or lack of suitable donor. It has been proposed that in the coming years, allo-HCT will be utilized less commonly in this setting due to the advent of chimeric antigen receptor T-cell (CAR T) therapy.
CAR T-cell therapy genetically modifies the patient’s own T lymphocytes with a gene that encodes an antigen receptor to direct the T cells against lymphoma cells. Typically, the T cells are genetically modified and expanded in a production facility and then infused back into the patient. Axicabtagene ciloleucel is directed against the CD-19 receptor and has been approved by the US Food and Drug Administration (FDA) for treatment of patients with DLBCL who have failed 2 or more lines of systemic therapy. Use of CAR-T therapy in such patients was examined in a multicenter trial (ZUMA-1), which reported a 54% complete response rate and 52% OS rate at 18 months.63 CAR-T therapy is associated with serious side effects such as cytokine release syndrome, neurological toxicities, and prolonged cytopenias. While there are now some patients with ongoing remission 2 or more years after undergoing CAR-T therapy, it remains uncertain what proportion of patients have been truly cured with this modality. Nevertheless, this new treatment option remains a source of optimism for relapsed and refractory DLBCL patients.
Primary Mediastinal Large B-Cell Lymphoma
Primary mediastinal large B-cell lymphoma (PMBCL) is a form of DLBCL arising in the mediastinum from the thymic B cell. It is an uncommon entity and has clinical and pathologic features distinct from systemic DLBCL [64]. PMBCL accounts for 2% of all NHLs and about 7% of all DLBCL [20]. It typically affects women in the third to fourth decade of life.
Presentation and Prognostic Features
PMBCL usually presents as a locally invasive anterior mediastinal mass, often with a superior vena cava syndrome which may or may not be clinically obvious [64]. Other presentations include pericardial tamponade, thrombosis of neck veins, and acute airway obstruction. About 80% of patients present with bulky (> 10 cm) stage I or II disease [65], with distant spread uncommon on presentation. Morphologically and on GEP, PMBL has a profile more similar to classical Hodgkin lymphoma (cHL) than non-mediastinal DLBCL [66]. PMBL is distinguished from cHL by immunophenotyping: unlike cHL, PMBCL has pan B cell markers, rarely expresses CD15, and has weak CD30.
Poor prognostic features in PMBCL are Eastern Cooperative Oncology Group (ECOG) performance status greater than 2, pericardial effusion, bulky disease, and elevated serum LDH. The diagnosis of PMBCL can be difficult because the tumor is often encased with extensive fibrosis and necrosis. As a result, a needle biopsy may not yield sufficient tissue, thus making a surgical biopsy often the only viable way to obtain sufficient tissue.
Treatment
Early series suggested that PMBCL is unusually aggressive, with a poor prognosis [67]. This led to studies using more aggressive chemotherapy regimens (often in combination with mediastinal radiation) as well as upfront auto-HCT [68–70]. The addition of rituximab to treatment regimens significantly improved outcomes in PMBCL. For example, a subgroup analysis of the PMBCL patients in the MinT trial revealed a 3-year event-free survival (EFS) of 78% [71] when rituximab was combined with CHOP. Because of previous reports demonstrating radiosensitivity of PMBL, radiation was traditionally sequenced into treatment regimens for PMBL. However, this is associated with higher long-term toxicities, often a concern in PMBCL patients given that the disease frequently affects younger females, and given that breast tissue will be in the radiation field. For patients with a strong personal or family history of breast cancer or cardiovascular disease, these concerns are even more significant. More recently, the DA-EPOCH-R regimen has been shown to produce very high rates (80%–90%) of long-term DFS, without the need for mediastinal radiation in most cases [72,73]. For patients receiving R-CHOP, consolidation with mediastinal radiation is still commonly given. This approach also leads to high rates of long-term remission and, although utilizing mediastinal radiation, allows for less intensive chemotherapy. Determining which approach is most appropriate for an individual patient requires an assessment of the risks of each treatment option for that patient. A randomized trial by the International Extranodal Lymphoma Study Group (IELSG37) is evaluating whether RT may be safely omitted in PMBCL patients who achieve a complete metabolic response after R-CHOP.
Most relapses of PMBCL occur within the first 1 to 2 years and often present with extranodal disease in various organs. For those with relapsed or refractory disease, high-dose chemotherapy followed by auto-HCT provides 5-year survival rates of 50% to 80% [74–76] In a phase 1b trial evaluating the role of pembrolizumab in relapsed/refractory patients (KEYNOTE-13), 7 of 17 PMBCL patients achieved responses, with an additional 6 demonstrating stable disease [77]. This provides an additional option for patients who might be too weak to undergo auto-HCT or for those who relapse following auto-HCT.
Mantle Cell Lymphoma
The name mantle cell lymphoma (MCL) is based on the presumed normal cell counterpart to MCL, which is believed to be found in the mantle zone surrounding germinal center follicles. It represents approximately 6% of all NHL cases in the United States and Europe [78] MCL occurs at a median age of 63 to 68 years and has a male predominance.
Presentation and Prognostic Features
Patients can present with a broad spectrum of clinical features, and most patients (70%) present with advanced disease [79]. Up to one third of patients have B symptoms, with most demonstrating lymphadenopathy and bone marrow involvement. Approximately 25% present with extranodal disease as the primary presentation (eg, GI tract, pleura, breast, or orbits). MCL can involve any part of the GI tract and often presents as polypoid lesions.
Histologically, the pattern of MCL may be diffuse, nodular, mantle zone, or a combination of the these; morphologically, MCL can range from small, more irregular lymphocytes to lymphoblast-like cells. Blastoid and pleomorphic variants of MCL have a higher proliferation index and a more aggressive clinical course than other variants. MCL is characterized by the expression of pan B cell antigens (CD19+, CD20+) with coexpression of the T-cell antigen CD5, lack of CD23 expression, and nuclear expression of cyclin D1. Nuclear staining for cyclin D1 is present in more than 98% of cases [80]. In rare cases, CD5 or cyclin D1 may be negative [80]. Most MCL cases have a unique translocation that fuses the immunoglobulin heavy chain gene promoter (14q32) to the promoter of the BCL-1 gene (11q13), which encodes the cyclin D1 protein. This translocation is not unique to MCL and can be present in multiple myeloma as well. Interestingly, cyclin D1 is overproduced in cases lacking t(11:14), likely from other point mutations resulting in its overexpression [81]. Cyclin D1–negative tumors overexpress cyclin D2 or D3, with no apparent difference in clinical behavior or outcome [82]. In cyclin D1–negative cases, SOX11 expression may help with diagnosis [83]. A proliferation rate greater than 30% (as measured by Ki-67 staining), low SOX11 expression, and presence of p53 mutations have all been associated with adverse outcome.
In a minority of cases, MCL follows an indolent clinical course. For the remainder, however, MCL is an aggressive disease that generally requires treatment soon after diagnosis. When initially described in the 1980s and 1990s, treatment of MCL was characterized by low complete response rates, short durations of remission, repeated recurrences, and a median survival in the 2- to 5-year range [84]. In recent years, intensive regimens incorporating rituximab and high-dose cytarabine with or without auto-HCT have been developed and are associated with high complete response rates and median duration of first remission in the 6- to 9-year range [85–87]. Several prognostic indices have been applied to patients with MCL, including the IPI, the Follicular Lymphoma International Prognostic Index , and the Mantle Cell Lymphoma International Prognostic Index (MIPI). The MIPI was originally described based on a cohort from the period 1996 to 2004 [88], and subsequently confirmed in a separate cohort of 958 patients with MCL treated on prospective trials between 2004 and 2010 [89]. The MIPI score can identify 3 risk groups with significant survival differences (83%, 63%, and 34% survival at 5 years). A refined version of the MIPI score, the combined MIPI or MIPI-c, incorporates proliferation rate and is better able to stratify patients [90]. The blastoid variant of MCL follows a more aggressive clinical course and is associated with a high proliferation rate, shorter remissions, and a higher rate of CNS involvement [91].
In most patients, MCL is an aggressive disease with a short OS without treatment. A subset of patients may have a more indolent course [92], but unfortunately reliable factors that identify this group at the time of diagnosis are not available. Pretreatment evaluation is as with other lymphomas, with lumbar puncture and MRI of the brain also recommended for patients with the blastoid variant. For those presenting with GI symptoms, endoscopy is recommended as part of the initial evaluation as well.
Treatment
First-line Therapy. For patients under age 65 to 70 years with a good performance status and few comorbidities, an intensive induction regimen (such as R-CHOP/R-DHAP, Maxi-R-CHOP/R-araC, or R-DHAP) followed by consolidation with auto-HCT is commonly given, with a goal of achieving a durable (6–9 year) first remission [87,93,94]. Auto-HCT is now routinely followed by 3 years of maintenance rituximab based on the survival benefit seen in the recent LYSA trial [93]. At many centers, auto-HCT in first remission is a standard of care, with the greatest benefit seen in patients who have achieved a complete remission with no more than 2 lines of chemotherapy [95]. However, there remains some controversy about whether all patients truly benefit from auto-HCT in first remission, and current research efforts are focused on identifying patients most likely to benefit from auto-HCT and incorporation of new agents into first-line regimens. For patients who are not candidates for auto-HCT, bendamustine plus rituximab (BR) or R-CHOP alone or followed by maintenance rituximab is a reasonable approach [96]. Based on the StiL and BRIGHT trials, BR seems to have less toxicity and higher rates of response with no difference in OS when compared to R-CHOP [97,98].
In summary, dose-intense induction chemotherapy with consolidative auto-HCT results in high rates of long-term remission and can be considered in MCL patients who lack significant comorbidities and who understand the risks and benefits of this approach. For other patients, the less aggressive frontline approaches are more appropriate.
Relapsed/Refractory Disease
Despite initial high response rates, most patients with MCL will eventually relapse. For example, most patients given CHOP or R-CHOP alone as first-line therapy will relapse within 2 years [99]. In recent years, a number of therapies have emerged for relapsed/refractory MCL; however, the optimal sequencing of these is unclear. FDA-approved options for relapsed/refractory MCL include the proteasome inhibitor bortezomib [100,101], the BTK inhibitors ibrutinib [102,103] and acalabrutinib [104], and the immunomodulatory agent lenalidomide [105].
Auto-HCT can be considered for patients who did not undergo auto-HCT as part of first-line therapy and who had a reasonably long first remission [95]. Allo-HCT has curative potential in MCL with good evidence of a graft-versus-lymphoma effect. With a matched related or matched unrelated donor, the chance for treatment-related mortality is 15% to 25% at 1 to 2 years, with a 50% to 60% chance for long-term PFS. However, given the risk of treatment-related mortality and graft-versus-host disease, this option is typically reserved for patients with early relapse after auto-HCT, multiple relapses, or relatively chemotherapy-unresponsive disease [95,106]. A number of clinical trials for relapsed/refractory MCL are ongoing, and participation in these is encouraged whenever possible.
Burkitt Lymphoma
Burkitt lymphoma is a rare, aggressive and highly curable subtype of NHL. It can occur at any age, although peak incidence is in the first decade of life. There are 3 distinct clinical forms of Burkitt lymphoma [107]. The endemic form is common in African children and commonly involves the jaw and kidneys. The sporadic (nonendemic) form accounts for 1% to 2% of all lymphomas in the United States and Western Europe and usually has an abdominal presentation. The immunodeficiency-associated form is commonly seen in HIV patients with a relatively preserved CD4 cell count.
Patients typically present with rapidly growing masses and tumor lysis syndrome. CNS and bone marrow involvement are common. Burkitt lymphoma cells are high-grade, rapidly proliferating medium-sized cells with a monomorphic appearance. Biopsies show a classic histological appearance known as a “starry sky pattern” due to benign macrophages engulfing debris resulting from apoptosis. It is derived from a germinal center B cell and has distinct oncogenic pathways. Translocations such as t(8;14), t(2;8) or t(8;22) juxtapose the MYC locus with immunoglobulin heavy or light chain loci and result in MYC overexpression. Burkitt lymphoma is typically CD10-positive and BCL-2-negative, with a MYC translocation and a proliferation rate greater than 95%.
With conventional NHL regimens, Burkitt lymphoma had a poor prognosis, with complete remission in the 30% to 70% range and low rates of long-term remission. With the introduction of short-term, dose-intensive, multiagent chemotherapy regimens (adapted from pediatric acute lymphoblastic leukemia [ALL] regimens), the complete remission rate improved to 60% to 90% [107]. Early stage disease (localized or completely resected intra-abdominal disease) can have complete remission rates of 100%, with 2- to 5-year freedom-from-progression rates of 95%. CNS prophylaxis, including high-dose methotrexate, high-dose cytarabine, and intrathecal chemotherapy, is a standard component of Burkitt lymphoma regimens (CNS relapse rates can reach 50% without prophylactic therapy). Crucially, relapse after 1 to 2 years is very rare following complete response to induction therapy. Classically, several intensive regimens have been used for Burkitt lymphoma. In recent years, the most commonly used regimens have been the modified Magrath regimen of R-CODOX-M/IVAC and R-hyperCVAD. DA-EPOCH-R has also been used, typically for older, more frail, or HIV-positive patients. However, at the American Society of Hematology 2017 annual meeting, results from the NCI 9177 trial were presented which validated, in a prospective multi-center fashion, the use of DA-EPOCH-R in all Burkitt lymphoma patients [108]. In NCI 9177, low-risk patients (defined as normal LDH, ECOG performance score 0 or 1, ≤ stage II, and no tumor lesion > 7 cm) received 2 cycles of DA-EPOCH-R without intrathecal therapy followed by PET. If interim PET was negative, low-risk patients then received 1 more cycle of DA-EPOCH-R. High-risk patients with negative brain MRI and CSF cytology/flow cytometry received 2 cycles of DA-EPOCH-R with intrathecal therapy (2 doses per cycle) followed by PET. Unless interim PET showed progression, high-risk patients received 4 additional cycles of DA-EPOCH-R including methotrexate 12 mg intrathecally on days 1 and 5 (8 total doses). With a median follow-up of 36 months, this regimen resulted in an EFS of 85.7%. As expected, patients with CNS, marrow, or peripheral blood involvement fared worse. For those without CNS, marrow, or peripheral blood involvement, the results were excellent, with an EFS of 94.6% compared to 62.8% for those with CNS, bone marrow, or blood involvement at diagnosis.
Although no standard of care has been defined, patients with relapsed/refractory Burkitt lymphoma are often given standard second-line aggressive NHL regimens (eg, R-ICE); for those with chemosensitive disease, auto- or allo-HCT is often pursued, with long-term remissions possible following HCT [109].
Lymphoblastic Lymphoma
Lymphoblastic lymphoma (LBL) is a rare disease postulated to arise from precursor B or T lymphoblasts at varying stages of differentiation. Accounting for approximately 2% of all NHLs, 85% to 90% of all cases have a T-cell phenotype, while B-cell LBL comprises approximately 10% to 15% of cases. LBL and ALL are thought to represent the same disease entity, but LBL has been arbitrarily defined as cases with lymph node or mediastinal disease. Those with significant (> 25%) bone marrow or peripheral blood involvement are classified as ALL.
Precursor T-cell LBL patients are usually adolescent and young males who commonly present with a mediastinal mass and peripheral lymphadenopathy. Precursor B-cell LBL patients are usually older (median age 39 years) with peripheral lymphadenopathy and extranodal involvement. Mediastinal involvement with B-cell LBL is uncommon, and there is no male predominance. LBL has a propensity for dissemination to the bone marrow and CNS.
Morphologically, the tumor cells are medium sized, with a scant cytoplasm and finely dispersed chromatin. Mitotic features and apoptotic bodies are present since it is a high-grade malignancy. The lymphoblasts are typically positive for CD7 and either surface or cytoplasmic CD3. Terminal deoxynucleotidyl transferase expression is a defining feature. Other markers such as CD19, CD22, CD20, CD79a, CD45, and CD10 are variably expressed. Poor prognostic factors in T-cell LBL are female gender, age greater than 35 years, complex cytogenetics, and lack of a matched sibling donor.
Regimens for LBL are based on dose-dense, multi-agent protocols used in ALL. Most of these regimens are characterized by intensive remission-induction chemotherapy, CNS prophylaxis, a phase of consolidation therapy, and a prolonged maintenance phase, often lasting for 12 to 18 months with long-term DFS rates of 40% to 70% [110,111]. High-dose therapy with auto-HCT or allo-HCT in first complete response has been evaluated in an attempt to reduce the incidence of relapse [112]. However, the intensity of primary chemotherapy appears to be a stronger determinant of long-term survival than the use of HCT as consolidation. As a result, HCT is not routinely applied to patients in first complete remission following modern induction regimens. After relapse, prognosis is poor, with median survival rates of 6 to 9 months with conventional chemotherapy, although long-term survival rates of 30% and 20%, respectively, are reported after HCT in relapsed and primary refractory disease [113].
Treatment options in relapsed disease are limited. Nelarabine can produce responses in up to 40% of relapsed/refractory LBL/ALL patients [114]. For the minority of LBL patients with a B-cell phenotype, emerging options for relapsed/refractory LBL/ALL such as inotuzumab, blinatumomab, or anti-CD19 CAR T-cell therapy should be considered. These are not options for the majority who have a T-cell phenotype, and treatment options for these patients are limited to conventional relapsed/refractory ALL and aggressive NHL regimens.
Summary
Aggressive NHLs are characterized by rapid clinical progression without therapy. However, a significant proportion of patients are cured with appropriate combination chemotherapy or combined modality (chemotherapy + RT) regimens. In contrast, the indolent lymphomas have a relatively good prognosis (median survival of 10 years or longer) but usually are not curable in advanced clinical stages. Overall 5-year survival for aggressive NHLs with current treatment is approximately 50% to 60%, with relapses typically occurring within the first 5 years. Treatment strategies for relapsed patients offer some potential for cure; however, clinical trial participation should be encouraged whenever possible to investigate new approaches for improving outcomes in this patient population.
Corresponding author: Timothy S. Fenske, MD, Division of Hematology & Oncology, Medical College of Wisconsin, 9200 W. Wisconsin Ave., Milwaukee, WI 53226.
1. Swerdlow, SH, Campo E, Harris NL, et al. WHO classification of tumours of haematopoietic and lymphoid tissues. Revised 4th edition. Lyon, France: World Health Organization; 2017.
2. Surveillance, Epidemiology, and End Results (SEER) Program. www.seer.cancer.gov. Research Data 2017.
3. Boffetta P, de Vocht F. Occupation and the risk of non-Hodgkin lymphoma. Cancer Epidemiol Biomarkers Prev 2007;16:369–72.
4. Bower M. Acquired immunodeficiency syndrome-related systemic non-Hodgkin’s lymphoma. Br J Haematol 2001;112:863–73.
5. Ekstrom Smedby K, Vajdic CM, Falster M, et al. Autoimmune disorders and risk of non-Hodgkin lymphoma subtypes: a pooled analysis within the InterLymph Consortium. Blood 2008;111:4029–38.
6. Clarke CA, Morton LM, Lynch C, et al. Risk of lymphoma subtypes after solid organ transplantation in the United States. Br J Cancer 2013;109:280–8.
7. Wang SS, Slager SL, Brennan P, et al. Family history of hematopoietic malignancies and risk of non-Hodgkin lymphoma (NHL): a pooled analysis of 10 211 cases and 11 905 controls from the International Lymphoma Epidemiology Consortium (InterLymph). Blood 2007;109:3479–88.
8. Dong C, Hemminki K. Second primary neoplasms among 53 159 haematolymphoproliferative malignancy patients in Sweden, 1958–1996: a search for common mechanisms. Br J Cancer 2001;85:997–1005.
9. Hummel M, Anagnostopoulos I, Korbjuhn P, Stein H. Epstein-Barr virus in B-cell non-Hodgkin’s lymphomas: unexpected infection patterns and different infection incidence in low- and high-grade types. J Pathol 1995;175:263–71.
10. Cesarman E, Chang Y, Moore PS, et al. Kaposi’s sarcoma-associated herpesvirus-like DNA sequences in AIDS-related body-cavity-based lymphomas. N Engl J Med 1995;332:1186–91.
11. Viswanatha DS, Dogan A. Hepatitis C virus and lymphoma. J Clin Pathol 2007;60:1378–83.
12. Engels EA, Cho ER, Jee SH. Hepatitis B virus infection and risk of non-Hodgkin lymphoma in South Korea: a cohort study. Lancet Oncol 2010;11:827–34.
13. Marcucci F, Mele A. Hepatitis viruses and non-Hodgkin lymphoma: epidemiology, mechanisms of tumorigenesis, and therapeutic opportunities. Blood 2011;117:1792–8.
14. Cheson BD, Fisher RI, Barrington SF, et al. Recommendations for initial evaluation, staging, and response assessment of Hodgkin and non-Hodgkin lymphoma: the Lugano classification. J Clin Oncol 2014;32:3059–68.
15. Rosenwald A, Wright G, Chan WC, et al. The use of molecular profiling to predict survival after chemotherapy for diffuse large-B-cell lymphoma. N Engl J Med 2002;346:1937–47.
16. Teras LR, DeSantis CE, Cerhan JR, et al. 2016 US lymphoid malignancy statistics by World Health Organization subtypes. CA Cancer J Clin 2016;66:443–59.
17. Morton LM, Wang SS, Devesa SS, et al. Lymphoma incidence patterns by WHO subtype in the United States, 1992-2001. Blood 2006;107:265–76.
18. Møller MB, Pedersen NT, Christensen BE. Diffuse large B-cell lymphoma: clinical implications of extranodal versus nodal presentation--a population-based study of 1575 cases. Br J Haematol 2004;124:151–9.
19. Armitage JO, Weisenburger DD. New approach to classifying non-Hodgkin’s lymphomas: clinical features of the major histologic subtypes. Non-Hodgkin’s Lymphoma Classification Project. J Clin Oncol 1998;16:2780–95.
20. A clinical evaluation of the International Lymphoma Study Group classification of non-Hodgkin’s lymphoma. The Non-Hodgkin’s Lymphoma Classification Project. Blood 1997;89:3909–18.
21. Sehn LH, Scott DW, Chhanabhai M, et al. Impact of concordant and discordant bone marrow involvement on outcome in diffuse large B-cell lymphoma treated with R-CHOP. J Clin Oncol 2011;29:1452–7.
22. Fisher DE, Jacobson JO, Ault KA, Harris NL. Diffuse large cell lymphoma with discordant bone marrow histology. Clinical features and biological implications. Cancer 1989;64:1879–87.
23. Yao Z, Deng L, Xu-Monette ZY, et al. Concordant bone marrow involvement of diffuse large B-cell lymphoma represents a distinct clinical and biological entity in the era of immunotherapy. Leukemia 2018;32:353–63.
24. Gascoyne RD, Adomat SA, Krajewski S, et al. Prognostic significance of Bcl-2 protein expression and Bcl-2 gene rearrangement in diffuse aggressive non-Hodgkin’s lymphoma. Blood 1997;90:244–51.
25. Skinnider BF, Horsman DE, Dupuis B, Gascoyne RD. Bcl-6 and Bcl-2 protein expression in diffuse large B-cell lymphoma and follicular lymphoma: correlation with 3q27 and 18q21 chromosomal abnormalities. Hum Pathol 1999;30:803–8.
26. Chisholm KM, Bangs CD, Bacchi CE, et al. Expression profiles of MYC protein and MYC gene rearrangement in lymphomas. Am J Surg Pathol 2015;39:294–303.
27. Zhou Z, Sehn LH, Rademaker AW, et al. An enhanced International Prognostic Index (NCCN-IPI) for patients with diffuse large B-cell lymphoma treated in the rituximab era. Blood 2014;123:837–42.
28. Hans CP, Weisenburger DD, Greiner TC, et al. Confirmation of the molecular classification of diffuse large B-cell lymphoma by immunohistochemistry using a tissue microarray. Blood 2004;103:275–82.
29. Horn H, Ziepert M, Becher C, et al. MYC status in concert with BCL2 and BCL6 expression predicts outcome in diffuse large B-cell lymphoma. Blood 2013;121:2253–63.
30. Barrans S, Crouch S, Smith A, et al. Rearrangement of MYC is associated with poor prognosis in patients with diffuse large B-cell lymphoma treated in the era of rituximab. J Clin Oncol 2010;28:3360–5.
31. Hu S, Xu-Monette ZY, Tzankov A, et al. MYC/BCL2 protein coexpression contributes to the inferior survival of activated B-cell subtype of diffuse large B-cell lymphoma and demonstrates high-risk gene expression signatures: a report from The International DLBCL Rituximab-CHOP Consortium Program. Blood 2013;121:4021–31.
32. Green TM, Young KH, Visco C, et al. Immunohistochemical double-hit score is a strong predictor of outcome in patients with diffuse large B-cell lymphoma treated with rituximab plus cyclophosphamide, doxorubicin, vincristine, and prednisone. J Clin Oncol 2012;30:3460–7.
33. Fisher RI, Gaynor ER, Dahlberg S, et al. Comparison of a standard regimen (CHOP) with three intensive chemotherapy regimens for advanced non-Hodgkin’s lymphoma. N Engl J Med 1993;328:1002–6.
34. Pfreundschuh M, Kuhnt E, Trümper L, et al. CHOP-like chemotherapy with or without rituximab in young patients with good-prognosis diffuse large-B-cell lymphoma: 6-year results of an open-label randomised study of the MabThera International Trial (MInT) Group. Lancet Oncol 2011;12:1013–22.
35. Coiffier B, Lepage E, Brière J, et al. CHOP chemotherapy plus rituximab compared with CHOP alone in elderly patients with diffuse large-B-cell lymphoma. N Engl J Med 2002;346:235–42.
36. Persky DO, Unger JM, Spier CM, et al. Phase II study of rituximab plus three cycles of CHOP and involved-field radiotherapy for patients with limited-stage aggressive B-cell lymphoma: Southwest Oncology Group study 0014. J Clin Oncol 2008;26:2258–63.
37. Lamy T, Damaj G, Soubeyran P, et al. R-CHOP 14 with or without radiotherapy in nonbulky limited-stage diffuse large B-cell lymphoma. Blood 2018;131:174–81.
38. Peyrade F, Jardin F, Thieblemont C, et al. Attenuated immunochemotherapy regimen (R-miniCHOP) in elderly patients older than 80 years with diffuse large B-cell lymphoma: a multicentre, single-arm, phase 2 trial. Lancet Oncol 2011;12:460–8.
39. Wilson WH, sin-Ho J, Pitcher BN, et al. Phase III randomized study of R-CHOP versus DA-EPOCH-R and molecular analysis of untreated diffuse large B-cell lymphoma: CALGB/Alliance 50303. Blood 2016;128:469 LP-469. 38.
40. Vitolo U, Trne˘ný M, Belada D, et al. Obinutuzumab or rituximab plus cyclophosphamide, doxorubicin, vincristine, and prednisone in previously untreated diffuse large B-cell lymphoma. J Clin Oncol 2017;35:3529–37.
41. Leonard JP, Kolibaba KS, Reeves JA, et al. Randomized phase II study of R-CHOP with or without bortezomib in previously untreated patients with non-germinal center B-cell-like diffuse large B-cell lymphoma. J Clin Oncol 2017;35:3538–46.
42. Nowakowski GS, LaPlant B, Macon WR, et al. Lenalidomide combined with R-CHOP overcomes negative prognostic impact of non-germinal center B-cell phenotype in newly diagnosed diffuse large B-Cell lymphoma: a phase II study. J Clin Oncol 2015;33:251–7.
43. Younes A, Thieblemont C, Morschhauser F, et al. Combination of ibrutinib with rituximab, cyclophosphamide, doxorubicin, vincristine, and prednisone (R-CHOP) for treatment-naive patients with CD20-positive B-cell non-Hodgkin lymphoma: a non-randomised, phase 1b study. Lancet Oncol 2014;15:1019–26.
44. Younes A, Zinzani PL, Sehn LH, et al. A randomized, double-blind, placebo-controlled phase 3 study of ibrutinib in combination with rituximab, cyclophosphamide, doxorubicin, vincristine, and prednisone (R-CHOP) in subjects with newly diagnosed nongerminal center B-cell subtype of diffuse large B-cell lymphoma (DLBCL). J Clin Oncol 2014;32(15_suppl):TPS8615.
45. Delarue R, Tilly H, Mounier N, et al. Dose-dense rituximab-CHOP compared with standard rituximab-CHOP in elderly patients with diffuse large B-cell lymphoma (the LNH03-6B study): a randomised phase 3 trial. Lancet Oncol 2013;14:525–33.
46. Leppä S, Fayad LE, Lee J-J, et al. A phase III study of enzastaurin in patients with high-risk diffuse large B cell lymphoma following response to primary treatment: the Prelude trial. Blood 2013;122:371 LP-371.
47. Witzig TE, Tobinai K, Rigacci L, et al. Adjuvant everolimus in high-risk diffuse large B-cell lymphoma: final results from the PILLAR-2 randomized phase III trial. Ann Oncol 2018;29:707–14.
48. Strehl J, Mey U, Glasmacher A, et al. High-dose chemotherapy followed by autologous stem cell transplantation as first-line therapy in aggressive non-Hodgkin’s lymphoma: a meta-analysis. Haematologica 2003;88:1304–15.
49. Stiff PJ, Unger JM, Cook JR, et al. Autologous transplantation as consolidation for aggressive non-Hodgkin’s lymphoma. N Engl J Med 2013;369:1681–90.
50. Oki Y, Noorani M, Lin P, et al. Double hit lymphoma: the MD Anderson Cancer Center clinical experience. Br J Haematol 2014;166:891–901.
51. Petrich AM, Gandhi M, Jovanovic B, et al. Impact of induction regimen and stem cell transplantation on outcomes in double-hit lymphoma: a multicenter retrospective analysis. Blood 2014;124:2354–61.
52. Howlett C, Snedecor SJ, Landsburg DJ, et al. Front-line, dose-escalated immunochemotherapy is associated with a significant progression-free survival advantage in patients with double-hit lymphomas: a systematic review and meta-analysis. Br J Haematol 2015;170:504–14.
53. Landsburg DJ, Falkiewicz MK, Maly J, et al. Outcomes of patients with double-hit lymphoma who achieve first complete remission. J Clin Oncol 2017;35:2260–7.
54. Schmitz N, Zeynalova S, Nickelsen M, et al. CNS International Prognostic Index: a risk model for CNS relapse in patients with diffuse large B-cell lymphoma treated with R-CHOP. J Clin Oncol 2016;34:3150–6.
55. Abramson JS, Hellmann M, Barnes JA, et al. Intravenous methotrexate as central nervous system (CNS) prophylaxis is associated with a low risk of CNS recurrence in high-risk patients with diffuse large B-cell lymphoma. Cancer 2010;116:4283–90.
56. Dunleavy K, Roschewski M, Abramson JS, et al. Risk-adapted therapy in adults with Burkitt lymphoma: updated results of a multicenter prospective phase II study of DA-EPOCH-R. Hematol Oncol 2017;35(S2):133–4.
57. Damaj G, Ivanoff S, Coso D, et al. Concomitant systemic and central nervous system non-Hodgkin lymphoma: the role of consolidation in terms of high dose therapy and autologous stem cell transplantation. A 60-case retrospective study from LYSA and the LOC network. Haematologica 2015;100:1199–206.
58. Thieblemont C, Briere J, Mounier N, et al. The germinal center/activated B-cell subclassification has a prognostic impact for response to salvage therapy in relapsed/refractory diffuse large B-cell lymphoma: a bio-CORAL study. J Clin Oncol 2011;29:4079–87.
59. Philip T, Guglielmi C, Hagenbeek A, et al. Autologous bone marrow transplantation as compared with dalvage vhemotherapy in relapses of chemotherapy-densitive non-Hodgkin’s lymphoma. N Engl J Med 1995;333:1540–5.
60. Hamadani M, Hari PN, Zhang Y, et al. Early failure of frontline rituximab-containing chemo-immunotherapy in diffuse large B cell lymphoma does not predict futility of autologous hematopoietic cell transplantation. Biol Blood Marrow Transplant 2014;20:1729–36.
61. Costa LJ, Maddocks K, Epperla N, et al. Diffuse large B-cell lymphoma with primary treatment failure: Ultra-high risk features and benchmarking for experimental therapies. Am J Hematol 2017;92:e24615.
62. Fenske TS, Ahn KW, Graff TM, et al. Allogeneic transplantation provides durable remission in a subset of DLBCL patients relapsing after autologous transplantation. Br J Haematol 2016;174:235–48.
63. Neelapu SS, Locke FL, Bartlett NL, et al. Axicabtagene ciloleucel CAR T-cell therapy in refractory large B-cell lymphoma. N Engl J Med 2017;377:2531–44.
64. van Besien K, Kelta M, Bahaguna P. Primary mediastinal B-cell lymphoma: a review of pathology and management. J Clin Oncol 2001;19:1855–64.
65. Savage KJ, Al-Rajhi N, Voss N, et al. Favorable outcome of primary mediastinal large B-cell lymphoma in a single institution: the British Columbia experience. Ann Oncol Off J Eur Soc Med Oncol 2006;17:123–30.
66. Rosenwald A, Wright G, Leroy K, et al. Molecular diagnosis of primary mediastinal B cell lymphoma identifies a clinically favorable subgroup of diffuse large B cell lymphoma related to Hodgkin lymphoma. J Exp Med 2003;198:851–62.
67. Lavabre-Bertrand T, Donadio D, Fegueux N, et al. A study of 15 cases of primary mediastinal lymphoma of B-cell type. Cancer 1992;69:2561–6.
68. Lazzarino M, Orlandi E, Paulli M, et al. Treatment outcome and prognostic factors for primary mediastinal (thymic) B-cell lymphoma: a multicenter study of 106 patients. J Clin Oncol 1997;15:1646–53.
69. Zinzani PL, Martelli M, Magagnoli M, et al. Treatment and clinical management of primary mediastinal large B-cell lymphoma with sclerosis: MACOP-B regimen and mediastinal radiotherapy monitored by (67)Gallium scan in 50 patients. Blood 1999;94:3289–93.
70. Todeschini G, Secchi S, Morra E, et al. Primary mediastinal large B-cell lymphoma (PMLBCL): long-term results from a retrospective multicentre Italian experience in 138 patients treated with CHOP or MACOP-B/VACOP-B. Br J Cancer 2004;90:372–6.
71. Rieger M, Osterborg A, Pettengell R, et al. Primary mediastinal B-cell lymphoma treated with CHOP-like chemotherapy with or without rituximab: results of the Mabthera International Trial Group study. Ann Oncol Off J Eur Soc Med Oncol 2011;22:664–70.
72. Shah NN, Szabo A, Huntington SF, et al. R-CHOP versus dose-adjusted R-EPOCH in frontline management of primary mediastinal B-cell lymphoma: a multi-centre analysis. Br J Haematol 2018;180:534–44.
73. Dunleavy K, Pittaluga S, Maeda LS, et al. Dose-adjusted EPOCH-rituximab therapy in primary mediastinal B-cell lymphoma. N Engl J Med 2013;368:1408–16.
74. Aoki T, Shimada K, Suzuki R, et al. High-dose chemotherapy followed by autologous stem cell transplantation for relapsed/refractory primary mediastinal large B-cell lymphoma. Blood Cancer J 2015;5:e372–e372.
75. Sehn LH, Antin JH, Shulman LN, et al. Primary diffuse large B-cell lymphoma of the mediastinum: outcome following high-dose chemotherapy and autologous hematopoietic cell transplantation. Blood 1998;91:717–23.
76. Kuruvilla J, Pintilie M, Tsang R, et al. Salvage chemotherapy and autologous stem cell transplantation are inferior for relapsed or refractory primary mediastinal large B-cell lymphoma compared with diffuse large B-cell lymphoma. Leuk Lymphoma 2008;49:1329–36.
77. Zinzani PL, Ribrag V, Moskowitz CH, et al. Safety and tolerability of pembrolizumab in patients with relapsed/refractory primary mediastinal large B-cell lymphoma. Blood 2017;130:267–70.
78. Smith A, Howell D, Patmore R, et al. Incidence of haematological malignancy by sub-type: a report from the Haematological Malignancy Research Network. Br J Cancer 2011;105:1684–92.
79. Argatoff LH, Connors JM, Klasa RJ, et al. Mantle cell lymphoma: a clinicopathologic study of 80 cases. Blood 1997;89:2067–78.
80. Zukerberg LR, Yang WI, Arnold A, Harris NL. Cyclin D1 expression in non-Hodgkin’s lymphomas. Detection by immunohistochemistry. Am J Clin Pathol 1995;103:756–60.
81. Wiestner A, Tehrani M, Chiorazzi M, et al. Point mutations and genomic deletions in CCND1 create stable truncated cyclin D1 mRNAs that are associated with increased proliferation rate and shorter survival. Blood 2007;109:4599–606.
82. Fu K, Weisenburger DD, Greiner TC, et al. Cyclin D1-negative mantle cell lymphoma: a clinicopathologic study based on gene expression profiling. Blood 2005;106:4315–21.
83. Mozos A, Royo C, Hartmann E, et al. SOX11 expression is highly specific for mantle cell lymphoma and identifies the cyclin D1-negative subtype. Haematologica 2009;94:1555–62.
84. Norton AJ, Matthews J, Pappa V, et al. Mantle cell lymphoma: Natural history defined in a serially biopsied population over a 20-year period. Ann Oncol 1995;6:249–56.
85. Chihara D, Cheah CY, Westin JR, et al. Rituximab plus hyper-CVAD alternating with MTX/Ara-C in patients with newly diagnosed mantle cell lymphoma: 15-year follow-up of a phase II study from the MD Anderson Cancer Center. Br J Haematol 2016;172:80–8.
86. Delarue R, Haioun C, Ribrag V, et al. CHOP and DHAP plus rituximab followed by autologous stem cell transplantation in mantle cell lymphoma: a phase 2 study from the Groupe d’Etude des Lymphomes de l’Adulte. Blood 2013;121:48–53.
87. Eskelund CW, Kolstad A, Jerkeman M, et al. 15-year follow-up of the Second Nordic Mantle Cell Lymphoma trial (MCL2): prolonged remissions without survival plateau. Br J Haematol 2016;175:410–8.
88. Hoster E, Dreyling M, Klapper W, et al. A new prognostic index (MIPI) for patients with advanced-stage mantle cell lymphoma. Blood 2008;111:558–65.
89. Hoster E, Klapper W, Hermine O, et al. Confirmation of the mantle-cell lymphoma International Prognostic Index in randomized trials of the European Mantle-Cell Lymphoma Network. J Clin Oncol 2014;32:1338–46.
90. Hoster E, Rosenwald A, Berger F, et al. Prognostic value of Ki-67 index, cytology, and growth pattern in mantle-cell lymphoma: Results from randomized trials of the European Mantle Cell Lymphoma Network. J Clin Oncol 2016;34:1386–94.
91. Bernard M, Gressin R, Lefrère F, et al. Blastic variant of mantle cell lymphoma: a rare but highly aggressive subtype. Leukemia 2001;15:1785–91.
92. Martin P, Chadburn A, Christos P, et al. Outcome of deferred initial therapy in mantle-cell lymphoma. J Clin Oncol 2009;27:1209–13.
93. Le Gouill S, Thieblemont C, Oberic L, et al. Rituximab after autologous stem-cell transplantation in mantle-cell lymphoma. N Engl J Med. 2017 Sep 28;377(13):1250–60.
94. Hermine O, Hoster E, Walewski J, et al. Addition of high-dose cytarabine to immunochemotherapy before autologous stem-cell transplantation in patients aged 65 years or younger with mantle cell lymphoma (MCL Younger): a randomised, open-label, phase 3 trial of the European Mantle Cell Lymphoma Network. Lancet 2016;388:565–75.
95. Fenske TS, Zhang M-J, Carreras J, et al. Autologous or reduced-intensity conditioning allogeneic hematopoietic cell transplantation for chemotherapy-sensitive mantle-cell lymphoma: analysis of transplantation timing and modality. J Clin Oncol 2014;32:273–81.
96. Kluin-Nelemans HC, Hoster E, Hermine O, et al. Treatment of older patients with mantle-cell lymphoma. N Engl J Med 2012;367:520–31.
97. Flinn IW, van der Jagt R, Kahl BS, et al. Randomized trial of bendamustine-rituximab or R-CHOP/R-CVP in first-line treatment of indolent NHL or MCL: the BRIGHT study. Blood 2014;123:2944–52.
98. Rummel MJ, Niederle N, Maschmeyer G, et al. Bendamustine plus rituximab versus CHOP plus rituximab as first-line treatment for patients with indolent and mantle-cell lymphomas: an open-label, multicentre, randomised, phase 3 non-inferiority trial. Lancet 2013;381:1203–10.
99. Lenz G, Dreyling M, Hoster E, et al. Immunochemotherapy with rituximab and cyclophosphamide, doxorubicin, vincristine, and prednisone significantly improves response and time to treatment failure, but not long-term outcome in patients with previously untreated mantle cell lymphoma: results of a prospective randomized trial of the German Low Grade Lymphoma Study Group (GLSG). J Clin Oncol 2005;23:1984–92.
100. Belch A, Kouroukis CT, Crump M, et al. A phase II study of bortezomib in mantle cell lymphoma: the National Cancer Institute of Canada Clinical Trials Group trial IND.150. Ann Oncol Off J Eur Soc Med Oncol 2007;18:116–21.
101. Fisher RI, Bernstein SH, Kahl BS, et al. Multicenter phase II study of bortezomib in patients with relapsed or refractory mantle cell lymphoma. J Clin Oncol 2006;24:4867–74.
102. Dreyling M, Jurczak W, Jerkeman M, et al. Ibrutinib versus temsirolimus in patients with relapsed or refractory mantle-cell lymphoma: an international, randomised, open-label, phase 3 study. Lancet 2016;387:770–8.
103. Wang ML, Rule S, Martin P, Goy A, et al. Targeting BTK with ibrutinib in relapsed or refractory mantle-cell lymphoma. N Engl J Med 2013;369:507–16.
104. Wang M, Rule S, Zinzani PL, et al. Acalabrutinib in relapsed or refractory mantle cell lymphoma (ACE-LY-004): a single-arm, multicentre, phase 2 trial. Lancet 2018;391:659–67.
105. Goy A, Sinha R, Williams ME, et al. Single-agent lenalidomide in patients with mantle-cell lymphoma who relapsed or progressed after or were refractory to bortezomib: phase II MCL-001 (EMERGE) study. J Clin Oncol 2013;31:3688–95.
106. Khouri IF, Lee M-S, Saliba RM, et al. Nonablative allogeneic stem-cell transplantation for advanced/recurrent mantle-cell lymphoma. J Clin Oncol 2003;21:4407–12.
107. Blum KA, Lozanski G, Byrd JC. Adult Burkitt leukemia and lymphoma. Blood 2004;104:3009–20.
108. Roschewski M, Dunleavy K, Abramson JS, et al. Risk-adapted therapy in adults with Burkitt lymphoma: results of NCI 9177, a multicenter prospective phase II study of DA-EPOCH-R. Blood American Society of Hematology;2017;130(Suppl 1):188.
109. Maramattom L V, Hari PN, Burns LJ, et al. Autologous and allogeneic transplantation for burkitt lymphoma outcomes and changes in utilization: a report from the center for international blood and marrow transplant research. Biol Blood Marrow Transplant 2013;19:173–9.
110. Zinzani PL, Bendandi M, Visani G, et al. Adult lymphoblastic lymphoma: clinical features and prognostic factors in 53 patients. Leuk Lymphoma 1996;23:577–82.
111. Thomas DA, O’Brien S, Cortes J, et al. Outcome with the hyper-CVAD regimens in lymphoblastic lymphoma. Blood 2004;104:1624–30.
112. Aljurf M, Zaidi SZA. Chemotherapy and hematopoietic stem cell transplantation for adult T-cell lymphoblastic lymphoma: current status and controversies. Biol Blood Marrow Transplant 2005;11:739–54.
113. Sweetenham JW, Santini G, Qian W, et al. High-dose therapy and autologous stem-cell transplantation versus conventional-dose consolidation/maintenance therapy as postremission therapy for adult patients with lymphoblastic lymphoma: results of a randomized trial of the European Group for Blood and Marrow Transplantation and the United Kingdom Lymphoma Group. J Clin Oncol 2001;19:2927–36.
114. Zwaan CM, Kowalczyk J, Schmitt C, et al. Safety and efficacy of nelarabine in children and young adults with relapsed or refractory T-lineage acute lymphoblastic leukaemia or T-lineage lymphoblastic lymphoma: results of a phase 4 study. Br J Haematol 2017;179:284–93.
Abstract
- Objective: To review the diagnosis and management of aggressive B-cell non-Hodgkin lymphoma (NHL).
- Methods: Review of the literature.
- Results: NHL comprises a wide variety of malignant hematologic disorders with varying clinical and biological features. Aggressive NHLs are characterized by rapid clinical progression without therapy. However, a significant proportion of patients are cured with appropriate combination chemotherapy or combined modality regimens. In contrast, the indolent lymphomas have a relatively good prognosis (median survival of 10 years or longer) but usually are not curable in advanced clinical stages. Overall 5-year survival for aggressive NHLs with current treatment is approximately 50% to 60%, with relapses typically occurring within the first 5 years.
- Conclusion: Treatment strategies for relapsed patients offer some potential for cure; however, clinical trial participation should be encouraged whenever possible to investigate new approaches for improving outcomes in this patient population.
Non-Hodgkin lymphoma (NHL) comprises a wide variety of malignant hematologic disorders with varying clinical and biological features. The more than 60 separate NHL subtypes can be classified according to cell of origin (B cell versus T cell), anatomical location (eg, orbital, testicular, bone, central nervous system), clinical behavior (indolent versus aggressive), histological features, or cytogenetic abnormalities. Although various NHL classification schemes have been used over the years, the World Health Organization (WHO) classification is now widely accepted as the definitive pathologic classification system for lymphoproliferative disorders, incorporating morphologic, immunohistochemical, flow cytometric, cytogenetic, and molecular features [1]. While the pathologic and molecular subclassification of NHL has become increasingly refined in recent years, from a management standpoint, classification based on clinical behavior remains very useful. This approach separates NHL subtypes into indolent versus aggressive categories. Whereas indolent NHLs may remain clinically insignificant for months to years, aggressive B-cell NHLs generally become life-threatening within weeks to months without treatment.
Epidemiology
Data from cancer registries show a steady, unexplainable increase in the incidence of NHL during the second half of the 20th century; the incidence has subsequently plateaued. There was a significant increase in NHL incidence between 1970 and 1995, which has been attributed in part to the HIV epidemic. More than 72,000 new cases of NHL were diagnosed in the United States in 2017, compared to just over 8000 cases of Hodgkin lymphoma, making NHL the sixth most common cancer in adult men and the fifth most common in adult women [2]. NHL appears to occur more frequently in Western countries than in Asian populations.
Various factors associated with increased risk for B-cell NHL have been identified over the years, including occupational and environmental exposure to certain pesticides and herbicides [3], immunosuppression associated with HIV infection [4], autoimmune disorders [5], iatrogenically induced immune suppression in the post-transplant and other settings [6], family history of NHL [7], and a personal history of a prior cancer, including Hodgkin lymphoma and prior NHL [8]. In terms of infectious agents associated with aggressive B-cell NHLs, Epstein-Barr virus (EBV) has a clear pathogenic role in Burkitt lymphoma, in many cases of post-transplant lymphoproliferative disorders, and in some cases of HIV-related aggressive B-cell lymphoma [9]. Human herpesvirus-8 viral genomes have been found in virtually all cases of primary effusion lymphomas [10]. Epidemiological studies also have linked hepatitis B and C to increased incidences of certain NHL subtypes [11–13], including primary hepatic diffuse large B-cell lymphoma (DLBCL). Similarly, Helicobacter pylori has been associated with gastric DLBCL.
Staging and Workup
A tissue biopsy is essential in the diagnosis and management of NHL. The most significant disadvantage of fine-needle aspiration cytology is the lack of histologic architecture. The optimal specimen is an excisional biopsy; when this cannot be performed, a core needle biopsy, ideally using a 16-gauge or larger caliber needle, is the next best choice.
The baseline tests appropriate for most cases of newly diagnosed aggressive B-cell NHL are listed in Table 1.
Prior to the initiation of treatment, patients should always undergo a thorough cardiac and pulmonary evaluation, especially if the patient will be treated with an anthracycline or mediastinal irradiation. Central nervous system (CNS) evaluation with magnetic resonance imaging (MRI) and lumbar puncture is essential if there are neurological signs or symptoms. In addition, certain anatomical sites including the testicles, paranasal sinuses, kidney, adrenal glands, and epidural space have been associated with increased involvement of the CNS and may warrant MRI evaluation and lumbar puncture. Certain NHL subtypes like Burkitt lymphoma, high-grade NHL with translocations of MYC and BCL-2 or BCL-6 (double-hit lymphoma), blastoid mantle cell lymphoma, and lymphoblastic lymphoma have a high risk of CNS involvement, and patients with these subtypes need CNS evaluation.
The Lugano classification is used to stage patients with NHL [14]. This classification is based on the Ann Arbor staging system and uses the distribution and number of tumor sites to stage disease. In general, this staging system in isolation is of limited value in predicting survival after treatment. However, the Ann Arbor stage does have prognostic impact when incorporated into risk scoring systems such as the International Prognostic Index (IPI). In clinical practice, the Ann Arbor stage is useful primarily to determine eligibility for localized therapy approaches. The absence or presence of systemic symptoms such as fevers, drenching night sweats, or weight loss (> 10% of baseline over 6 months or less) is designated by A or B, respectively.
Diffuse Large B-Cell Lymphoma
DLBCL is the most common lymphoid neoplasm in adults, accounting for about 25% of all NHL cases [2]. It is increasingly clear that the diagnostic category of DLBCL is quite heterogeneous in terms of morphology, genetics, and biologic behavior. A number of clinicopathologic subtypes of DLBCL exist, such as T cell/histiocyte–rich large B-cell lymphoma, primary mediastinal large B-cell lymphoma, intravascular large B-cell lymphoma, DLBCL associated with chronic inflammation, lymphomatoid granulomatosis, and EBV-positive large B-cell lymphoma, among others. Gene expression profiling (GEP) can distinguish 2 cell of origin DLBCL subtypes: the germinal center B-cell (GCB) and activated B-cell (ABC) subtypes [15].
DLBCL may be primary (de novo) or may arise through the transformation of many different types of low-grade B-cell lymphomas. This latter scenario is referred to as histologic transformation or transformed lymphoma. In some cases, patients may have a previously diagnosed low-grade B-cell NHL; in other cases, both low-grade and aggressive B-cell NHL may be diagnosed concurrently. The presence of elements of both low-grade and aggressive B-cell NHL in the same biopsy specimen is sometimes referred to as a composite lymphoma.
In the United States, incidence varies by ethnicity, with DLBCL being more common in Caucasians than other races [16]. There is a slight male predominance (55%), median age at diagnosis is 65 years [16,17] and the incidence increases with age.
Presentation, Pathology, and Prognostic Factors
The most common presentation of patients with DLBCL is rapidly enlarging lymphadenopathy, usually in the neck or abdomen. Extranodal/extramedullary presentation is seen in approximately 40% of cases, with the gastrointestinal (GI) tract being the most common site. However, extranodal DLBCL can arise in virtually any tissue [18]. Nodal DLBCL presents with symptoms related to the sites of involvement (eg, shortness of breath or chest pain with mediastinal lymphadenopathy), while extranodal DLBCL typically presents with symptoms secondary to dysfunction at the site of origin. Up to one third of patients present with constitutional symptoms (B symptoms) and more than 50% have elevated serum lactate dehydrogenase (LDH) at diagnosis [19].
Approximately 40% of patients present with stage I/II disease. Of these, only a subset present with stage I, or truly localized disease (defined as that which can be contained within 1 irradiation field). About 60% of patients present with advanced (stage III–IV) disease [20]. The bone marrow is involved in about 15% to 30% of cases. DLBCL involvement of the bone marrow is associated with a less favorable prognosis. Patients with DLBCL elsewhere may have low-grade NHL involvement of the bone marrow. Referred to as discordant bone marrow involvement [21], this feature does not carry the same poor prognosis associated with transformed disease [22] or DLBCL involvement of the bone marrow [23].
DLBCL is defined as a neoplasm of large B-lymphoid cells with a diffuse growth pattern. The proliferative fraction of cells, as determined by Ki-67 staining, is usually greater than 40%, and may even exceed 90%. Lymph nodes usually demonstrate complete effacement of the normal architecture by sheets of atypical lymphoid cells. Tumor cells in DLBCL generally express pan B-cell antigens (CD19, CD20, CD22, CD79a, Pax-5) as well as CD45 and surface immunoglobulin. Between 20% and 37% of DLBCL cases express the BCL-2 protein [24], and about 70% express the BCL-6 protein [25]. C-MYC protein expression is seen in a higher percentage (~ 30%–50%) of cases of DLBCL [26].
Many factors are associated with outcome in DLBCL. The IPI score was developed in the pre-rituximab era and is a robust prognostic tool. This simple tool uses 5 easily obtained clinical factors (age > 60 years, impaired performance status, elevated LDH, > 1 extranodal site of disease, and stage III/IV disease). By summing these factors, 4 groups with distinct 5-year overall survival (OS) rates ranging from 26% to 73% were identified (Table 2).
Cytogenetic and molecular factors also predict outcome in DLBCL. The ABC subtype distinguished by GEP has consistently been shown to have inferior outcomes with first-line therapy. As GEP is not routinely available in clinical practice, immunohistochemical (IHC) approaches (eg, the Hans algorithm) have been developed that can approximate the GEP subtypes. These IHC approaches have approximately 80% concordance with GEP [28]. The 3 most common chromosomal translocations in DLBCL involve BCL-2, BCL-6 and MYC. MYC-rearranged DLBCLs have a less favorable prognosis [29,30]. Cases in which a MYC translocation occurs in combination with a BCL-2 or BCL-6 translocation are commonly referred to as double-hit lymphoma (DHL); cases with all 3 translocations are referred to as triple-hit lymphoma (THL). Both DHL and THL have a worse prognosis with standard DLBCL therapy compared to non-DHL/THL cases. In the 2016 revised WHO classification, DHL and THL are an entity technically distinct from DLBCL, referred to as high-grade B-cell lymphoma [1]. In some cases, MYC and BCL-2 protein overexpression occurs in the absence of chromosomal translocations. Cases in which MYC and BCL-2 are overexpressed (by IHC) are referred to as double expressor lymphoma (DEL), and also have inferior outcome compared with non-DEL DLBCL [31,32]. Interestingly, MYC protein expression alone does not confer inferior outcomes, unlike isolated MYC translocation, which is associated with inferior outcomes.
Treatment
First-Line Therapy. DLBCL is an aggressive disease and, in most cases, survival without treatment can be measured in weeks to months. The advent of combination chemotherapy (CHOP [cyclophosphamide, doxorubicin, vincristine, and prednisone] or CHOP-like regimens) led to disease-free survival (DFS) rates of 35% to 40% at 3 to 5 years [33]. The addition of rituximab to CHOP (R-CHOP) has improved both progression-free surivial (PFS) and OS [34,35].
Treatment options vary for patients with localized (stage I/II) and advanced (stage III/IV) disease. Options for limited-stage DLBCL include an abbreviated course of R-CHOP (3 or 4 cycles) with involved-field radiation therapy (IFRT) versus a full course (6–8 cycles) of R-CHOP without radiation therapy (RT). Most studies comparing combined modality therapy (chemotherapy plus RT) versus chemotherapy alone were conducted in the pre-rituximab era. With the introduction of rituximab, Persky and colleagues [36] studied the use of 3 cycles of R-CHOP followed by RT, demonstrating a slightly improved OS of 92% at 4 years as compared to 88% in a historical cohort. The French LYSA/GOELAMS group performed the only direct comparison in the rituximab era (4 cycles of R-CHOP followed by RT versus 4 cycles of R-CHOP followed by 2 additional cycles of R-CHOP) and reported similar outcomes between both arms [37], with OS of 92% in the R-CHOP alone arm and 96% in the R-CHOP + RT arm (nonsignificant difference statistically). IFRT alone is not recommended other than for palliation in patients who cannot tolerate chemotherapy or combined modality therapy. Stage I and II patients with bulky disease (> 10 cm) have a prognosis similar to patients with advanced DLBCL and should be treated aggressively with 6 to 8 cycles of R-CHOP with or without RT [36].
For patients with advanced stage disease, a full course of R-CHOP-21 (6–8 cycles given on a 21-day cycle) is the standard of care. This approach results in OS rates of 70% and 60% at 2 and 5 years, respectively. For older adults unable to tolerate full-dose R-CHOP, attenuated versions of R-CHOP with decreased dose density or decreased dose intensity have been developed [38]. Numerous randomized trials have attempted to improve upon the results of R-CHOP-21 using strategies such as infusional chemotherapy (DA-EPOCH-R [etoposide, prednisone, vincristine, cyclophosphamide, doxorubicin, rituximab]) [39]; dose-dense therapy (R-CHOP-14); replacement of rituximab with obinutuzuimab [40]; addition of novel agents such as bortezomib [41], lenalidomide[42], or ibrutinib [43,44] to R-CHOP; and various maintenance strategies such as rituximab, lenalidomide [45], enzastaurin [46], and everolimus [47]. Unfortunately, none of these strategies has been shown to improve OS in DLBCL. In part this appears to be due to the fact that inclusion/exclusion criteria for DLBCL trials have been too strict, such that the most severely ill DLBCL patients are typically not included. As a result, the results in the control arms have ended up better than what was expected based on historical data. Efforts are underway to include all patients in future first-line DLBCL studies.
Currently, autologous hematopoietic cell transplantation (auto-HCT) is not routinely used in the initial treatment of DLBCL. In the pre-rituximab era, numerous trials were conducted in DLBCL patients with high and/or high-intermediate risk disease based on the IPI score to determine if outcomes could be improved with high-dose therapy and auto-HCT as consolidation after patients achieved complete remission with first-line therapy. The results of these trials were conflicting. A 2003 meta-analysis of 11 such trials concluded that the results were very heterogeneous and showed no OS benefit [48]. More recently, the Southwestern Oncology Group published the results of a prospective trial testing the impact of auto-HCT for consolidation of aggressive NHL patients with an IPI score of 3 to 5 who achieved complete remission with first-line therapy with CHOP or R-CHOP. In this study, 75% of the patients had DLBCL and, of the B-cell NHL patients, 47% received R-CHOP. A survival benefit was seen only in the subgroup that had an IPI score of 4 or 5; a subgroup analysis restricted to those receiving R-CHOP as induction was not performed, however [49]. As a result, this area remains controversial, with most institutions not routinely performing auto-HCT for any DLBCL patients in first complete remission and some institutions considering auto-HCT in first complete remission for patients with an IPI score of 4 or 5. These studies all used the IPI score to identify high-risk patients. It is possible that the use of newer biomarkers or minimal-residual disease analysis will lead to a more robust algorithm for identifying high-risk patients and selecting patients who might benefit from consolidation of first complete remission with auto-HCT.
For patients with DHL or THL, long-term PFS with standard R-CHOP therapy is poor (20% to 40%) [50,51]. Treatment with more intensive first-line regimens such as DA-EPOCH-R, R-hyperCVAD (rituximab plus hyperfractionated cyclophosphamide, vincristine, doxorubicin, dexamethasone), or CODOX-M/IVAC±R (cyclophosphamide, vincristine, doxorubicin, high‐dose methotrexate/ifosfamide, etoposide, high‐dose cytarabine ± rituximab), along with CNS prophylaxis, however, has been shown to produce superior outcomes [52], with 3-year relapse-free survival rates of 88% compared to 56% for R-CHOP. For patients who achieve a complete response by PET/CT scan after intensive induction, consolidation with auto-HCT has not been shown to improve outcomes based on retrospective analysis. However for DHL/THL patients who achieve complete response after R-CHOP, PFS was improved if auto-HCT was given as consolidation of first remission [53].
Patients with DLBCL have an approximately 5% risk of subsequently developing CNS involvement. Historically (in the pre-rituximab era), patients who presented with multiple sites of extranodal disease and/or extensive bone marrow involvement and/or an elevated LDH had an increased risk (up to 20%–30%) of developing CNS involvement. In addition, patients with involvement of certain anatomical sites (testicular, paranasal sinuses, epidural space) had an increased risk of CNS disease. Several algorithms have been proposed to identify patients who should receive prophylactic CNS therapy. One of the most robust tools for this purpose is the CNS-IPI, which is a 6-point score consisting of the 5 IPI elements, plus 1 additional point if the adrenal glands or kidneys are involved. Importantly, the CNS-IPI was developed and validated in patients treated with R-CHOP-like therapy. Subsequent risk of CNS relapse was 0.6%, 3.4%, and 10.2% for those with low-, intermediate- and high-risk CNS-IPI scores, respectively [54]. A reasonable strategy, therefore, is to perform CNS prophylaxis in those with a CNS-IPI score of 4 to 6. When CNS prophylaxis is used, intrathecal methotrexate or high-dose systemic methotrexate is most frequently given, with high-dose systemic methotrexate favored over intrathecal chemotherapy given that high-dose methotrexate penetrates the brain and spinal cord parenchyma, in addition to treating the cerebrospinal fluid (CSF) [55]. In contrast, intrathecal therapy only treats the CSF and requires repeated lumbar punctures or placement of an Ommaya reservoir. For DLBCL patients who present with active CSF involvement (known as lymphomatous meningitis), intrathecal chemotherapy treatments are typically given 2 or 3 times weekly until the CSF clears, followed by weekly intrathecal treatment for 4 weeks, and then monthly intrathecal treatment for 4 months [56]. For those with concurrent systemic and brain parenchymal DLBCL, a strategy of alternating R-CHOP with mid-cycle high-dose methotrexate can be successful. In addition, consolidation with high-dose therapy and auto-HCT improved survival in such patients in 1 retrospective series [57].
Relapsed/Refractory Disease. Between 30% and 40% of patients with advanced stage DLBCL will either fail to attain a remission with primary therapy (referred to as primary induction failure) or will relapse. In general, for those with progressive or relapsed disease, an updated tissue biopsy is recommended. This is especially true for patients who have had prior complete remission and have new lymph node enlargement, or those who have emergence of new sites of disease at the completion of first-line therapy.
Patients with relapsed disease are treated with systemic second-line platinum-based chemoimmunotherapy, with the usual goal of ultimately proceeding to auto-HCT. A number of platinum-based regimens have been used in this setting such as R-ICE, R-DHAP, R-GDP, R-Gem-Ox, and R-ESHAP. None of these regimens has been shown to be superior in terms of efficacy, and the choice of regimen is typically made based on the anticipated tolerance of the patient in light of comorbidities, laboratory studies, and physician preference. In the CORAL study, R-DHAP (rituximab, dexamethasone, high-dose cytarabine, cisplatin) seemed to show superior PFS in patients with the GCB subtype [58]. However, this was an unplanned subgroup analysis and R-DHAP was associated with higher renal toxicity.
Several studies have demonstrated that long-term PFS can be observed for relapsed/refractory DLBCL patients who respond to second-line therapy and then undergo high-dose therapy with auto-HCT. The Parma trial remains the only published prospective randomized trial performed in relapsed DLBCL comparing a transplant strategy to a non-transplant strategy. This study, performed in the pre-rituximab era, clearly showed a benefit in terms of DFS and OS in favor of auto-HCT versus salvage therapy alone [59]. The benefit of auto-HCT in patients treated in the rituximab era, even in patients who experience early failure (within 1 year of diagnosis), was confirmed in a retrospective analysis by the Center for International Blood and Marrow Transplant Research. In this study, a 44% 3-year PFS was seen in the early failure cohort versus 52% in the late failure cohort [60].
Some DLBCL patients are very unlikely to benefit from auto-HCT. The REFINE study focused on patients with primary induction failure or early relapse within 6 months of completing first-line therapy. Among such patients, primary progressive disease (defined as progression while still receiving first-line therapy), a high NCCN-IPI score at relapse, and MYC rearrangement were risk factors for poor PFS following auto-HCT [61]. Patients with 2 or 3 high-risk features had a 2-year OS of 10.7% compared to 74.3% for those without any high-risk features.
Allogeneic HCT (allo-HCT) is a treatment option for relapsed/refractory DLBCL. This option is more commonly considered for patients in whom an autotransplant has failed to achieve durable remission. For properly selected patients in this setting, a long-term PFS in the 30% to 40% range can be attained [62]. However, in practice, only about 20% of patients who fail auto-HCT end up undergoing allo-HCT due to rapid progression of disease, age, poor performance status, or lack of suitable donor. It has been proposed that in the coming years, allo-HCT will be utilized less commonly in this setting due to the advent of chimeric antigen receptor T-cell (CAR T) therapy.
CAR T-cell therapy genetically modifies the patient’s own T lymphocytes with a gene that encodes an antigen receptor to direct the T cells against lymphoma cells. Typically, the T cells are genetically modified and expanded in a production facility and then infused back into the patient. Axicabtagene ciloleucel is directed against the CD-19 receptor and has been approved by the US Food and Drug Administration (FDA) for treatment of patients with DLBCL who have failed 2 or more lines of systemic therapy. Use of CAR-T therapy in such patients was examined in a multicenter trial (ZUMA-1), which reported a 54% complete response rate and 52% OS rate at 18 months.63 CAR-T therapy is associated with serious side effects such as cytokine release syndrome, neurological toxicities, and prolonged cytopenias. While there are now some patients with ongoing remission 2 or more years after undergoing CAR-T therapy, it remains uncertain what proportion of patients have been truly cured with this modality. Nevertheless, this new treatment option remains a source of optimism for relapsed and refractory DLBCL patients.
Primary Mediastinal Large B-Cell Lymphoma
Primary mediastinal large B-cell lymphoma (PMBCL) is a form of DLBCL arising in the mediastinum from the thymic B cell. It is an uncommon entity and has clinical and pathologic features distinct from systemic DLBCL [64]. PMBCL accounts for 2% of all NHLs and about 7% of all DLBCL [20]. It typically affects women in the third to fourth decade of life.
Presentation and Prognostic Features
PMBCL usually presents as a locally invasive anterior mediastinal mass, often with a superior vena cava syndrome which may or may not be clinically obvious [64]. Other presentations include pericardial tamponade, thrombosis of neck veins, and acute airway obstruction. About 80% of patients present with bulky (> 10 cm) stage I or II disease [65], with distant spread uncommon on presentation. Morphologically and on GEP, PMBL has a profile more similar to classical Hodgkin lymphoma (cHL) than non-mediastinal DLBCL [66]. PMBL is distinguished from cHL by immunophenotyping: unlike cHL, PMBCL has pan B cell markers, rarely expresses CD15, and has weak CD30.
Poor prognostic features in PMBCL are Eastern Cooperative Oncology Group (ECOG) performance status greater than 2, pericardial effusion, bulky disease, and elevated serum LDH. The diagnosis of PMBCL can be difficult because the tumor is often encased with extensive fibrosis and necrosis. As a result, a needle biopsy may not yield sufficient tissue, thus making a surgical biopsy often the only viable way to obtain sufficient tissue.
Treatment
Early series suggested that PMBCL is unusually aggressive, with a poor prognosis [67]. This led to studies using more aggressive chemotherapy regimens (often in combination with mediastinal radiation) as well as upfront auto-HCT [68–70]. The addition of rituximab to treatment regimens significantly improved outcomes in PMBCL. For example, a subgroup analysis of the PMBCL patients in the MinT trial revealed a 3-year event-free survival (EFS) of 78% [71] when rituximab was combined with CHOP. Because of previous reports demonstrating radiosensitivity of PMBL, radiation was traditionally sequenced into treatment regimens for PMBL. However, this is associated with higher long-term toxicities, often a concern in PMBCL patients given that the disease frequently affects younger females, and given that breast tissue will be in the radiation field. For patients with a strong personal or family history of breast cancer or cardiovascular disease, these concerns are even more significant. More recently, the DA-EPOCH-R regimen has been shown to produce very high rates (80%–90%) of long-term DFS, without the need for mediastinal radiation in most cases [72,73]. For patients receiving R-CHOP, consolidation with mediastinal radiation is still commonly given. This approach also leads to high rates of long-term remission and, although utilizing mediastinal radiation, allows for less intensive chemotherapy. Determining which approach is most appropriate for an individual patient requires an assessment of the risks of each treatment option for that patient. A randomized trial by the International Extranodal Lymphoma Study Group (IELSG37) is evaluating whether RT may be safely omitted in PMBCL patients who achieve a complete metabolic response after R-CHOP.
Most relapses of PMBCL occur within the first 1 to 2 years and often present with extranodal disease in various organs. For those with relapsed or refractory disease, high-dose chemotherapy followed by auto-HCT provides 5-year survival rates of 50% to 80% [74–76] In a phase 1b trial evaluating the role of pembrolizumab in relapsed/refractory patients (KEYNOTE-13), 7 of 17 PMBCL patients achieved responses, with an additional 6 demonstrating stable disease [77]. This provides an additional option for patients who might be too weak to undergo auto-HCT or for those who relapse following auto-HCT.
Mantle Cell Lymphoma
The name mantle cell lymphoma (MCL) is based on the presumed normal cell counterpart to MCL, which is believed to be found in the mantle zone surrounding germinal center follicles. It represents approximately 6% of all NHL cases in the United States and Europe [78] MCL occurs at a median age of 63 to 68 years and has a male predominance.
Presentation and Prognostic Features
Patients can present with a broad spectrum of clinical features, and most patients (70%) present with advanced disease [79]. Up to one third of patients have B symptoms, with most demonstrating lymphadenopathy and bone marrow involvement. Approximately 25% present with extranodal disease as the primary presentation (eg, GI tract, pleura, breast, or orbits). MCL can involve any part of the GI tract and often presents as polypoid lesions.
Histologically, the pattern of MCL may be diffuse, nodular, mantle zone, or a combination of the these; morphologically, MCL can range from small, more irregular lymphocytes to lymphoblast-like cells. Blastoid and pleomorphic variants of MCL have a higher proliferation index and a more aggressive clinical course than other variants. MCL is characterized by the expression of pan B cell antigens (CD19+, CD20+) with coexpression of the T-cell antigen CD5, lack of CD23 expression, and nuclear expression of cyclin D1. Nuclear staining for cyclin D1 is present in more than 98% of cases [80]. In rare cases, CD5 or cyclin D1 may be negative [80]. Most MCL cases have a unique translocation that fuses the immunoglobulin heavy chain gene promoter (14q32) to the promoter of the BCL-1 gene (11q13), which encodes the cyclin D1 protein. This translocation is not unique to MCL and can be present in multiple myeloma as well. Interestingly, cyclin D1 is overproduced in cases lacking t(11:14), likely from other point mutations resulting in its overexpression [81]. Cyclin D1–negative tumors overexpress cyclin D2 or D3, with no apparent difference in clinical behavior or outcome [82]. In cyclin D1–negative cases, SOX11 expression may help with diagnosis [83]. A proliferation rate greater than 30% (as measured by Ki-67 staining), low SOX11 expression, and presence of p53 mutations have all been associated with adverse outcome.
In a minority of cases, MCL follows an indolent clinical course. For the remainder, however, MCL is an aggressive disease that generally requires treatment soon after diagnosis. When initially described in the 1980s and 1990s, treatment of MCL was characterized by low complete response rates, short durations of remission, repeated recurrences, and a median survival in the 2- to 5-year range [84]. In recent years, intensive regimens incorporating rituximab and high-dose cytarabine with or without auto-HCT have been developed and are associated with high complete response rates and median duration of first remission in the 6- to 9-year range [85–87]. Several prognostic indices have been applied to patients with MCL, including the IPI, the Follicular Lymphoma International Prognostic Index , and the Mantle Cell Lymphoma International Prognostic Index (MIPI). The MIPI was originally described based on a cohort from the period 1996 to 2004 [88], and subsequently confirmed in a separate cohort of 958 patients with MCL treated on prospective trials between 2004 and 2010 [89]. The MIPI score can identify 3 risk groups with significant survival differences (83%, 63%, and 34% survival at 5 years). A refined version of the MIPI score, the combined MIPI or MIPI-c, incorporates proliferation rate and is better able to stratify patients [90]. The blastoid variant of MCL follows a more aggressive clinical course and is associated with a high proliferation rate, shorter remissions, and a higher rate of CNS involvement [91].
In most patients, MCL is an aggressive disease with a short OS without treatment. A subset of patients may have a more indolent course [92], but unfortunately reliable factors that identify this group at the time of diagnosis are not available. Pretreatment evaluation is as with other lymphomas, with lumbar puncture and MRI of the brain also recommended for patients with the blastoid variant. For those presenting with GI symptoms, endoscopy is recommended as part of the initial evaluation as well.
Treatment
First-line Therapy. For patients under age 65 to 70 years with a good performance status and few comorbidities, an intensive induction regimen (such as R-CHOP/R-DHAP, Maxi-R-CHOP/R-araC, or R-DHAP) followed by consolidation with auto-HCT is commonly given, with a goal of achieving a durable (6–9 year) first remission [87,93,94]. Auto-HCT is now routinely followed by 3 years of maintenance rituximab based on the survival benefit seen in the recent LYSA trial [93]. At many centers, auto-HCT in first remission is a standard of care, with the greatest benefit seen in patients who have achieved a complete remission with no more than 2 lines of chemotherapy [95]. However, there remains some controversy about whether all patients truly benefit from auto-HCT in first remission, and current research efforts are focused on identifying patients most likely to benefit from auto-HCT and incorporation of new agents into first-line regimens. For patients who are not candidates for auto-HCT, bendamustine plus rituximab (BR) or R-CHOP alone or followed by maintenance rituximab is a reasonable approach [96]. Based on the StiL and BRIGHT trials, BR seems to have less toxicity and higher rates of response with no difference in OS when compared to R-CHOP [97,98].
In summary, dose-intense induction chemotherapy with consolidative auto-HCT results in high rates of long-term remission and can be considered in MCL patients who lack significant comorbidities and who understand the risks and benefits of this approach. For other patients, the less aggressive frontline approaches are more appropriate.
Relapsed/Refractory Disease
Despite initial high response rates, most patients with MCL will eventually relapse. For example, most patients given CHOP or R-CHOP alone as first-line therapy will relapse within 2 years [99]. In recent years, a number of therapies have emerged for relapsed/refractory MCL; however, the optimal sequencing of these is unclear. FDA-approved options for relapsed/refractory MCL include the proteasome inhibitor bortezomib [100,101], the BTK inhibitors ibrutinib [102,103] and acalabrutinib [104], and the immunomodulatory agent lenalidomide [105].
Auto-HCT can be considered for patients who did not undergo auto-HCT as part of first-line therapy and who had a reasonably long first remission [95]. Allo-HCT has curative potential in MCL with good evidence of a graft-versus-lymphoma effect. With a matched related or matched unrelated donor, the chance for treatment-related mortality is 15% to 25% at 1 to 2 years, with a 50% to 60% chance for long-term PFS. However, given the risk of treatment-related mortality and graft-versus-host disease, this option is typically reserved for patients with early relapse after auto-HCT, multiple relapses, or relatively chemotherapy-unresponsive disease [95,106]. A number of clinical trials for relapsed/refractory MCL are ongoing, and participation in these is encouraged whenever possible.
Burkitt Lymphoma
Burkitt lymphoma is a rare, aggressive and highly curable subtype of NHL. It can occur at any age, although peak incidence is in the first decade of life. There are 3 distinct clinical forms of Burkitt lymphoma [107]. The endemic form is common in African children and commonly involves the jaw and kidneys. The sporadic (nonendemic) form accounts for 1% to 2% of all lymphomas in the United States and Western Europe and usually has an abdominal presentation. The immunodeficiency-associated form is commonly seen in HIV patients with a relatively preserved CD4 cell count.
Patients typically present with rapidly growing masses and tumor lysis syndrome. CNS and bone marrow involvement are common. Burkitt lymphoma cells are high-grade, rapidly proliferating medium-sized cells with a monomorphic appearance. Biopsies show a classic histological appearance known as a “starry sky pattern” due to benign macrophages engulfing debris resulting from apoptosis. It is derived from a germinal center B cell and has distinct oncogenic pathways. Translocations such as t(8;14), t(2;8) or t(8;22) juxtapose the MYC locus with immunoglobulin heavy or light chain loci and result in MYC overexpression. Burkitt lymphoma is typically CD10-positive and BCL-2-negative, with a MYC translocation and a proliferation rate greater than 95%.
With conventional NHL regimens, Burkitt lymphoma had a poor prognosis, with complete remission in the 30% to 70% range and low rates of long-term remission. With the introduction of short-term, dose-intensive, multiagent chemotherapy regimens (adapted from pediatric acute lymphoblastic leukemia [ALL] regimens), the complete remission rate improved to 60% to 90% [107]. Early stage disease (localized or completely resected intra-abdominal disease) can have complete remission rates of 100%, with 2- to 5-year freedom-from-progression rates of 95%. CNS prophylaxis, including high-dose methotrexate, high-dose cytarabine, and intrathecal chemotherapy, is a standard component of Burkitt lymphoma regimens (CNS relapse rates can reach 50% without prophylactic therapy). Crucially, relapse after 1 to 2 years is very rare following complete response to induction therapy. Classically, several intensive regimens have been used for Burkitt lymphoma. In recent years, the most commonly used regimens have been the modified Magrath regimen of R-CODOX-M/IVAC and R-hyperCVAD. DA-EPOCH-R has also been used, typically for older, more frail, or HIV-positive patients. However, at the American Society of Hematology 2017 annual meeting, results from the NCI 9177 trial were presented which validated, in a prospective multi-center fashion, the use of DA-EPOCH-R in all Burkitt lymphoma patients [108]. In NCI 9177, low-risk patients (defined as normal LDH, ECOG performance score 0 or 1, ≤ stage II, and no tumor lesion > 7 cm) received 2 cycles of DA-EPOCH-R without intrathecal therapy followed by PET. If interim PET was negative, low-risk patients then received 1 more cycle of DA-EPOCH-R. High-risk patients with negative brain MRI and CSF cytology/flow cytometry received 2 cycles of DA-EPOCH-R with intrathecal therapy (2 doses per cycle) followed by PET. Unless interim PET showed progression, high-risk patients received 4 additional cycles of DA-EPOCH-R including methotrexate 12 mg intrathecally on days 1 and 5 (8 total doses). With a median follow-up of 36 months, this regimen resulted in an EFS of 85.7%. As expected, patients with CNS, marrow, or peripheral blood involvement fared worse. For those without CNS, marrow, or peripheral blood involvement, the results were excellent, with an EFS of 94.6% compared to 62.8% for those with CNS, bone marrow, or blood involvement at diagnosis.
Although no standard of care has been defined, patients with relapsed/refractory Burkitt lymphoma are often given standard second-line aggressive NHL regimens (eg, R-ICE); for those with chemosensitive disease, auto- or allo-HCT is often pursued, with long-term remissions possible following HCT [109].
Lymphoblastic Lymphoma
Lymphoblastic lymphoma (LBL) is a rare disease postulated to arise from precursor B or T lymphoblasts at varying stages of differentiation. Accounting for approximately 2% of all NHLs, 85% to 90% of all cases have a T-cell phenotype, while B-cell LBL comprises approximately 10% to 15% of cases. LBL and ALL are thought to represent the same disease entity, but LBL has been arbitrarily defined as cases with lymph node or mediastinal disease. Those with significant (> 25%) bone marrow or peripheral blood involvement are classified as ALL.
Precursor T-cell LBL patients are usually adolescent and young males who commonly present with a mediastinal mass and peripheral lymphadenopathy. Precursor B-cell LBL patients are usually older (median age 39 years) with peripheral lymphadenopathy and extranodal involvement. Mediastinal involvement with B-cell LBL is uncommon, and there is no male predominance. LBL has a propensity for dissemination to the bone marrow and CNS.
Morphologically, the tumor cells are medium sized, with a scant cytoplasm and finely dispersed chromatin. Mitotic features and apoptotic bodies are present since it is a high-grade malignancy. The lymphoblasts are typically positive for CD7 and either surface or cytoplasmic CD3. Terminal deoxynucleotidyl transferase expression is a defining feature. Other markers such as CD19, CD22, CD20, CD79a, CD45, and CD10 are variably expressed. Poor prognostic factors in T-cell LBL are female gender, age greater than 35 years, complex cytogenetics, and lack of a matched sibling donor.
Regimens for LBL are based on dose-dense, multi-agent protocols used in ALL. Most of these regimens are characterized by intensive remission-induction chemotherapy, CNS prophylaxis, a phase of consolidation therapy, and a prolonged maintenance phase, often lasting for 12 to 18 months with long-term DFS rates of 40% to 70% [110,111]. High-dose therapy with auto-HCT or allo-HCT in first complete response has been evaluated in an attempt to reduce the incidence of relapse [112]. However, the intensity of primary chemotherapy appears to be a stronger determinant of long-term survival than the use of HCT as consolidation. As a result, HCT is not routinely applied to patients in first complete remission following modern induction regimens. After relapse, prognosis is poor, with median survival rates of 6 to 9 months with conventional chemotherapy, although long-term survival rates of 30% and 20%, respectively, are reported after HCT in relapsed and primary refractory disease [113].
Treatment options in relapsed disease are limited. Nelarabine can produce responses in up to 40% of relapsed/refractory LBL/ALL patients [114]. For the minority of LBL patients with a B-cell phenotype, emerging options for relapsed/refractory LBL/ALL such as inotuzumab, blinatumomab, or anti-CD19 CAR T-cell therapy should be considered. These are not options for the majority who have a T-cell phenotype, and treatment options for these patients are limited to conventional relapsed/refractory ALL and aggressive NHL regimens.
Summary
Aggressive NHLs are characterized by rapid clinical progression without therapy. However, a significant proportion of patients are cured with appropriate combination chemotherapy or combined modality (chemotherapy + RT) regimens. In contrast, the indolent lymphomas have a relatively good prognosis (median survival of 10 years or longer) but usually are not curable in advanced clinical stages. Overall 5-year survival for aggressive NHLs with current treatment is approximately 50% to 60%, with relapses typically occurring within the first 5 years. Treatment strategies for relapsed patients offer some potential for cure; however, clinical trial participation should be encouraged whenever possible to investigate new approaches for improving outcomes in this patient population.
Corresponding author: Timothy S. Fenske, MD, Division of Hematology & Oncology, Medical College of Wisconsin, 9200 W. Wisconsin Ave., Milwaukee, WI 53226.
1. Swerdlow, SH, Campo E, Harris NL, et al. WHO classification of tumours of haematopoietic and lymphoid tissues. Revised 4th edition. Lyon, France: World Health Organization; 2017.
2. Surveillance, Epidemiology, and End Results (SEER) Program. www.seer.cancer.gov. Research Data 2017.
3. Boffetta P, de Vocht F. Occupation and the risk of non-Hodgkin lymphoma. Cancer Epidemiol Biomarkers Prev 2007;16:369–72.
4. Bower M. Acquired immunodeficiency syndrome-related systemic non-Hodgkin’s lymphoma. Br J Haematol 2001;112:863–73.
5. Ekstrom Smedby K, Vajdic CM, Falster M, et al. Autoimmune disorders and risk of non-Hodgkin lymphoma subtypes: a pooled analysis within the InterLymph Consortium. Blood 2008;111:4029–38.
6. Clarke CA, Morton LM, Lynch C, et al. Risk of lymphoma subtypes after solid organ transplantation in the United States. Br J Cancer 2013;109:280–8.
7. Wang SS, Slager SL, Brennan P, et al. Family history of hematopoietic malignancies and risk of non-Hodgkin lymphoma (NHL): a pooled analysis of 10 211 cases and 11 905 controls from the International Lymphoma Epidemiology Consortium (InterLymph). Blood 2007;109:3479–88.
8. Dong C, Hemminki K. Second primary neoplasms among 53 159 haematolymphoproliferative malignancy patients in Sweden, 1958–1996: a search for common mechanisms. Br J Cancer 2001;85:997–1005.
9. Hummel M, Anagnostopoulos I, Korbjuhn P, Stein H. Epstein-Barr virus in B-cell non-Hodgkin’s lymphomas: unexpected infection patterns and different infection incidence in low- and high-grade types. J Pathol 1995;175:263–71.
10. Cesarman E, Chang Y, Moore PS, et al. Kaposi’s sarcoma-associated herpesvirus-like DNA sequences in AIDS-related body-cavity-based lymphomas. N Engl J Med 1995;332:1186–91.
11. Viswanatha DS, Dogan A. Hepatitis C virus and lymphoma. J Clin Pathol 2007;60:1378–83.
12. Engels EA, Cho ER, Jee SH. Hepatitis B virus infection and risk of non-Hodgkin lymphoma in South Korea: a cohort study. Lancet Oncol 2010;11:827–34.
13. Marcucci F, Mele A. Hepatitis viruses and non-Hodgkin lymphoma: epidemiology, mechanisms of tumorigenesis, and therapeutic opportunities. Blood 2011;117:1792–8.
14. Cheson BD, Fisher RI, Barrington SF, et al. Recommendations for initial evaluation, staging, and response assessment of Hodgkin and non-Hodgkin lymphoma: the Lugano classification. J Clin Oncol 2014;32:3059–68.
15. Rosenwald A, Wright G, Chan WC, et al. The use of molecular profiling to predict survival after chemotherapy for diffuse large-B-cell lymphoma. N Engl J Med 2002;346:1937–47.
16. Teras LR, DeSantis CE, Cerhan JR, et al. 2016 US lymphoid malignancy statistics by World Health Organization subtypes. CA Cancer J Clin 2016;66:443–59.
17. Morton LM, Wang SS, Devesa SS, et al. Lymphoma incidence patterns by WHO subtype in the United States, 1992-2001. Blood 2006;107:265–76.
18. Møller MB, Pedersen NT, Christensen BE. Diffuse large B-cell lymphoma: clinical implications of extranodal versus nodal presentation--a population-based study of 1575 cases. Br J Haematol 2004;124:151–9.
19. Armitage JO, Weisenburger DD. New approach to classifying non-Hodgkin’s lymphomas: clinical features of the major histologic subtypes. Non-Hodgkin’s Lymphoma Classification Project. J Clin Oncol 1998;16:2780–95.
20. A clinical evaluation of the International Lymphoma Study Group classification of non-Hodgkin’s lymphoma. The Non-Hodgkin’s Lymphoma Classification Project. Blood 1997;89:3909–18.
21. Sehn LH, Scott DW, Chhanabhai M, et al. Impact of concordant and discordant bone marrow involvement on outcome in diffuse large B-cell lymphoma treated with R-CHOP. J Clin Oncol 2011;29:1452–7.
22. Fisher DE, Jacobson JO, Ault KA, Harris NL. Diffuse large cell lymphoma with discordant bone marrow histology. Clinical features and biological implications. Cancer 1989;64:1879–87.
23. Yao Z, Deng L, Xu-Monette ZY, et al. Concordant bone marrow involvement of diffuse large B-cell lymphoma represents a distinct clinical and biological entity in the era of immunotherapy. Leukemia 2018;32:353–63.
24. Gascoyne RD, Adomat SA, Krajewski S, et al. Prognostic significance of Bcl-2 protein expression and Bcl-2 gene rearrangement in diffuse aggressive non-Hodgkin’s lymphoma. Blood 1997;90:244–51.
25. Skinnider BF, Horsman DE, Dupuis B, Gascoyne RD. Bcl-6 and Bcl-2 protein expression in diffuse large B-cell lymphoma and follicular lymphoma: correlation with 3q27 and 18q21 chromosomal abnormalities. Hum Pathol 1999;30:803–8.
26. Chisholm KM, Bangs CD, Bacchi CE, et al. Expression profiles of MYC protein and MYC gene rearrangement in lymphomas. Am J Surg Pathol 2015;39:294–303.
27. Zhou Z, Sehn LH, Rademaker AW, et al. An enhanced International Prognostic Index (NCCN-IPI) for patients with diffuse large B-cell lymphoma treated in the rituximab era. Blood 2014;123:837–42.
28. Hans CP, Weisenburger DD, Greiner TC, et al. Confirmation of the molecular classification of diffuse large B-cell lymphoma by immunohistochemistry using a tissue microarray. Blood 2004;103:275–82.
29. Horn H, Ziepert M, Becher C, et al. MYC status in concert with BCL2 and BCL6 expression predicts outcome in diffuse large B-cell lymphoma. Blood 2013;121:2253–63.
30. Barrans S, Crouch S, Smith A, et al. Rearrangement of MYC is associated with poor prognosis in patients with diffuse large B-cell lymphoma treated in the era of rituximab. J Clin Oncol 2010;28:3360–5.
31. Hu S, Xu-Monette ZY, Tzankov A, et al. MYC/BCL2 protein coexpression contributes to the inferior survival of activated B-cell subtype of diffuse large B-cell lymphoma and demonstrates high-risk gene expression signatures: a report from The International DLBCL Rituximab-CHOP Consortium Program. Blood 2013;121:4021–31.
32. Green TM, Young KH, Visco C, et al. Immunohistochemical double-hit score is a strong predictor of outcome in patients with diffuse large B-cell lymphoma treated with rituximab plus cyclophosphamide, doxorubicin, vincristine, and prednisone. J Clin Oncol 2012;30:3460–7.
33. Fisher RI, Gaynor ER, Dahlberg S, et al. Comparison of a standard regimen (CHOP) with three intensive chemotherapy regimens for advanced non-Hodgkin’s lymphoma. N Engl J Med 1993;328:1002–6.
34. Pfreundschuh M, Kuhnt E, Trümper L, et al. CHOP-like chemotherapy with or without rituximab in young patients with good-prognosis diffuse large-B-cell lymphoma: 6-year results of an open-label randomised study of the MabThera International Trial (MInT) Group. Lancet Oncol 2011;12:1013–22.
35. Coiffier B, Lepage E, Brière J, et al. CHOP chemotherapy plus rituximab compared with CHOP alone in elderly patients with diffuse large-B-cell lymphoma. N Engl J Med 2002;346:235–42.
36. Persky DO, Unger JM, Spier CM, et al. Phase II study of rituximab plus three cycles of CHOP and involved-field radiotherapy for patients with limited-stage aggressive B-cell lymphoma: Southwest Oncology Group study 0014. J Clin Oncol 2008;26:2258–63.
37. Lamy T, Damaj G, Soubeyran P, et al. R-CHOP 14 with or without radiotherapy in nonbulky limited-stage diffuse large B-cell lymphoma. Blood 2018;131:174–81.
38. Peyrade F, Jardin F, Thieblemont C, et al. Attenuated immunochemotherapy regimen (R-miniCHOP) in elderly patients older than 80 years with diffuse large B-cell lymphoma: a multicentre, single-arm, phase 2 trial. Lancet Oncol 2011;12:460–8.
39. Wilson WH, sin-Ho J, Pitcher BN, et al. Phase III randomized study of R-CHOP versus DA-EPOCH-R and molecular analysis of untreated diffuse large B-cell lymphoma: CALGB/Alliance 50303. Blood 2016;128:469 LP-469. 38.
40. Vitolo U, Trne˘ný M, Belada D, et al. Obinutuzumab or rituximab plus cyclophosphamide, doxorubicin, vincristine, and prednisone in previously untreated diffuse large B-cell lymphoma. J Clin Oncol 2017;35:3529–37.
41. Leonard JP, Kolibaba KS, Reeves JA, et al. Randomized phase II study of R-CHOP with or without bortezomib in previously untreated patients with non-germinal center B-cell-like diffuse large B-cell lymphoma. J Clin Oncol 2017;35:3538–46.
42. Nowakowski GS, LaPlant B, Macon WR, et al. Lenalidomide combined with R-CHOP overcomes negative prognostic impact of non-germinal center B-cell phenotype in newly diagnosed diffuse large B-Cell lymphoma: a phase II study. J Clin Oncol 2015;33:251–7.
43. Younes A, Thieblemont C, Morschhauser F, et al. Combination of ibrutinib with rituximab, cyclophosphamide, doxorubicin, vincristine, and prednisone (R-CHOP) for treatment-naive patients with CD20-positive B-cell non-Hodgkin lymphoma: a non-randomised, phase 1b study. Lancet Oncol 2014;15:1019–26.
44. Younes A, Zinzani PL, Sehn LH, et al. A randomized, double-blind, placebo-controlled phase 3 study of ibrutinib in combination with rituximab, cyclophosphamide, doxorubicin, vincristine, and prednisone (R-CHOP) in subjects with newly diagnosed nongerminal center B-cell subtype of diffuse large B-cell lymphoma (DLBCL). J Clin Oncol 2014;32(15_suppl):TPS8615.
45. Delarue R, Tilly H, Mounier N, et al. Dose-dense rituximab-CHOP compared with standard rituximab-CHOP in elderly patients with diffuse large B-cell lymphoma (the LNH03-6B study): a randomised phase 3 trial. Lancet Oncol 2013;14:525–33.
46. Leppä S, Fayad LE, Lee J-J, et al. A phase III study of enzastaurin in patients with high-risk diffuse large B cell lymphoma following response to primary treatment: the Prelude trial. Blood 2013;122:371 LP-371.
47. Witzig TE, Tobinai K, Rigacci L, et al. Adjuvant everolimus in high-risk diffuse large B-cell lymphoma: final results from the PILLAR-2 randomized phase III trial. Ann Oncol 2018;29:707–14.
48. Strehl J, Mey U, Glasmacher A, et al. High-dose chemotherapy followed by autologous stem cell transplantation as first-line therapy in aggressive non-Hodgkin’s lymphoma: a meta-analysis. Haematologica 2003;88:1304–15.
49. Stiff PJ, Unger JM, Cook JR, et al. Autologous transplantation as consolidation for aggressive non-Hodgkin’s lymphoma. N Engl J Med 2013;369:1681–90.
50. Oki Y, Noorani M, Lin P, et al. Double hit lymphoma: the MD Anderson Cancer Center clinical experience. Br J Haematol 2014;166:891–901.
51. Petrich AM, Gandhi M, Jovanovic B, et al. Impact of induction regimen and stem cell transplantation on outcomes in double-hit lymphoma: a multicenter retrospective analysis. Blood 2014;124:2354–61.
52. Howlett C, Snedecor SJ, Landsburg DJ, et al. Front-line, dose-escalated immunochemotherapy is associated with a significant progression-free survival advantage in patients with double-hit lymphomas: a systematic review and meta-analysis. Br J Haematol 2015;170:504–14.
53. Landsburg DJ, Falkiewicz MK, Maly J, et al. Outcomes of patients with double-hit lymphoma who achieve first complete remission. J Clin Oncol 2017;35:2260–7.
54. Schmitz N, Zeynalova S, Nickelsen M, et al. CNS International Prognostic Index: a risk model for CNS relapse in patients with diffuse large B-cell lymphoma treated with R-CHOP. J Clin Oncol 2016;34:3150–6.
55. Abramson JS, Hellmann M, Barnes JA, et al. Intravenous methotrexate as central nervous system (CNS) prophylaxis is associated with a low risk of CNS recurrence in high-risk patients with diffuse large B-cell lymphoma. Cancer 2010;116:4283–90.
56. Dunleavy K, Roschewski M, Abramson JS, et al. Risk-adapted therapy in adults with Burkitt lymphoma: updated results of a multicenter prospective phase II study of DA-EPOCH-R. Hematol Oncol 2017;35(S2):133–4.
57. Damaj G, Ivanoff S, Coso D, et al. Concomitant systemic and central nervous system non-Hodgkin lymphoma: the role of consolidation in terms of high dose therapy and autologous stem cell transplantation. A 60-case retrospective study from LYSA and the LOC network. Haematologica 2015;100:1199–206.
58. Thieblemont C, Briere J, Mounier N, et al. The germinal center/activated B-cell subclassification has a prognostic impact for response to salvage therapy in relapsed/refractory diffuse large B-cell lymphoma: a bio-CORAL study. J Clin Oncol 2011;29:4079–87.
59. Philip T, Guglielmi C, Hagenbeek A, et al. Autologous bone marrow transplantation as compared with dalvage vhemotherapy in relapses of chemotherapy-densitive non-Hodgkin’s lymphoma. N Engl J Med 1995;333:1540–5.
60. Hamadani M, Hari PN, Zhang Y, et al. Early failure of frontline rituximab-containing chemo-immunotherapy in diffuse large B cell lymphoma does not predict futility of autologous hematopoietic cell transplantation. Biol Blood Marrow Transplant 2014;20:1729–36.
61. Costa LJ, Maddocks K, Epperla N, et al. Diffuse large B-cell lymphoma with primary treatment failure: Ultra-high risk features and benchmarking for experimental therapies. Am J Hematol 2017;92:e24615.
62. Fenske TS, Ahn KW, Graff TM, et al. Allogeneic transplantation provides durable remission in a subset of DLBCL patients relapsing after autologous transplantation. Br J Haematol 2016;174:235–48.
63. Neelapu SS, Locke FL, Bartlett NL, et al. Axicabtagene ciloleucel CAR T-cell therapy in refractory large B-cell lymphoma. N Engl J Med 2017;377:2531–44.
64. van Besien K, Kelta M, Bahaguna P. Primary mediastinal B-cell lymphoma: a review of pathology and management. J Clin Oncol 2001;19:1855–64.
65. Savage KJ, Al-Rajhi N, Voss N, et al. Favorable outcome of primary mediastinal large B-cell lymphoma in a single institution: the British Columbia experience. Ann Oncol Off J Eur Soc Med Oncol 2006;17:123–30.
66. Rosenwald A, Wright G, Leroy K, et al. Molecular diagnosis of primary mediastinal B cell lymphoma identifies a clinically favorable subgroup of diffuse large B cell lymphoma related to Hodgkin lymphoma. J Exp Med 2003;198:851–62.
67. Lavabre-Bertrand T, Donadio D, Fegueux N, et al. A study of 15 cases of primary mediastinal lymphoma of B-cell type. Cancer 1992;69:2561–6.
68. Lazzarino M, Orlandi E, Paulli M, et al. Treatment outcome and prognostic factors for primary mediastinal (thymic) B-cell lymphoma: a multicenter study of 106 patients. J Clin Oncol 1997;15:1646–53.
69. Zinzani PL, Martelli M, Magagnoli M, et al. Treatment and clinical management of primary mediastinal large B-cell lymphoma with sclerosis: MACOP-B regimen and mediastinal radiotherapy monitored by (67)Gallium scan in 50 patients. Blood 1999;94:3289–93.
70. Todeschini G, Secchi S, Morra E, et al. Primary mediastinal large B-cell lymphoma (PMLBCL): long-term results from a retrospective multicentre Italian experience in 138 patients treated with CHOP or MACOP-B/VACOP-B. Br J Cancer 2004;90:372–6.
71. Rieger M, Osterborg A, Pettengell R, et al. Primary mediastinal B-cell lymphoma treated with CHOP-like chemotherapy with or without rituximab: results of the Mabthera International Trial Group study. Ann Oncol Off J Eur Soc Med Oncol 2011;22:664–70.
72. Shah NN, Szabo A, Huntington SF, et al. R-CHOP versus dose-adjusted R-EPOCH in frontline management of primary mediastinal B-cell lymphoma: a multi-centre analysis. Br J Haematol 2018;180:534–44.
73. Dunleavy K, Pittaluga S, Maeda LS, et al. Dose-adjusted EPOCH-rituximab therapy in primary mediastinal B-cell lymphoma. N Engl J Med 2013;368:1408–16.
74. Aoki T, Shimada K, Suzuki R, et al. High-dose chemotherapy followed by autologous stem cell transplantation for relapsed/refractory primary mediastinal large B-cell lymphoma. Blood Cancer J 2015;5:e372–e372.
75. Sehn LH, Antin JH, Shulman LN, et al. Primary diffuse large B-cell lymphoma of the mediastinum: outcome following high-dose chemotherapy and autologous hematopoietic cell transplantation. Blood 1998;91:717–23.
76. Kuruvilla J, Pintilie M, Tsang R, et al. Salvage chemotherapy and autologous stem cell transplantation are inferior for relapsed or refractory primary mediastinal large B-cell lymphoma compared with diffuse large B-cell lymphoma. Leuk Lymphoma 2008;49:1329–36.
77. Zinzani PL, Ribrag V, Moskowitz CH, et al. Safety and tolerability of pembrolizumab in patients with relapsed/refractory primary mediastinal large B-cell lymphoma. Blood 2017;130:267–70.
78. Smith A, Howell D, Patmore R, et al. Incidence of haematological malignancy by sub-type: a report from the Haematological Malignancy Research Network. Br J Cancer 2011;105:1684–92.
79. Argatoff LH, Connors JM, Klasa RJ, et al. Mantle cell lymphoma: a clinicopathologic study of 80 cases. Blood 1997;89:2067–78.
80. Zukerberg LR, Yang WI, Arnold A, Harris NL. Cyclin D1 expression in non-Hodgkin’s lymphomas. Detection by immunohistochemistry. Am J Clin Pathol 1995;103:756–60.
81. Wiestner A, Tehrani M, Chiorazzi M, et al. Point mutations and genomic deletions in CCND1 create stable truncated cyclin D1 mRNAs that are associated with increased proliferation rate and shorter survival. Blood 2007;109:4599–606.
82. Fu K, Weisenburger DD, Greiner TC, et al. Cyclin D1-negative mantle cell lymphoma: a clinicopathologic study based on gene expression profiling. Blood 2005;106:4315–21.
83. Mozos A, Royo C, Hartmann E, et al. SOX11 expression is highly specific for mantle cell lymphoma and identifies the cyclin D1-negative subtype. Haematologica 2009;94:1555–62.
84. Norton AJ, Matthews J, Pappa V, et al. Mantle cell lymphoma: Natural history defined in a serially biopsied population over a 20-year period. Ann Oncol 1995;6:249–56.
85. Chihara D, Cheah CY, Westin JR, et al. Rituximab plus hyper-CVAD alternating with MTX/Ara-C in patients with newly diagnosed mantle cell lymphoma: 15-year follow-up of a phase II study from the MD Anderson Cancer Center. Br J Haematol 2016;172:80–8.
86. Delarue R, Haioun C, Ribrag V, et al. CHOP and DHAP plus rituximab followed by autologous stem cell transplantation in mantle cell lymphoma: a phase 2 study from the Groupe d’Etude des Lymphomes de l’Adulte. Blood 2013;121:48–53.
87. Eskelund CW, Kolstad A, Jerkeman M, et al. 15-year follow-up of the Second Nordic Mantle Cell Lymphoma trial (MCL2): prolonged remissions without survival plateau. Br J Haematol 2016;175:410–8.
88. Hoster E, Dreyling M, Klapper W, et al. A new prognostic index (MIPI) for patients with advanced-stage mantle cell lymphoma. Blood 2008;111:558–65.
89. Hoster E, Klapper W, Hermine O, et al. Confirmation of the mantle-cell lymphoma International Prognostic Index in randomized trials of the European Mantle-Cell Lymphoma Network. J Clin Oncol 2014;32:1338–46.
90. Hoster E, Rosenwald A, Berger F, et al. Prognostic value of Ki-67 index, cytology, and growth pattern in mantle-cell lymphoma: Results from randomized trials of the European Mantle Cell Lymphoma Network. J Clin Oncol 2016;34:1386–94.
91. Bernard M, Gressin R, Lefrère F, et al. Blastic variant of mantle cell lymphoma: a rare but highly aggressive subtype. Leukemia 2001;15:1785–91.
92. Martin P, Chadburn A, Christos P, et al. Outcome of deferred initial therapy in mantle-cell lymphoma. J Clin Oncol 2009;27:1209–13.
93. Le Gouill S, Thieblemont C, Oberic L, et al. Rituximab after autologous stem-cell transplantation in mantle-cell lymphoma. N Engl J Med. 2017 Sep 28;377(13):1250–60.
94. Hermine O, Hoster E, Walewski J, et al. Addition of high-dose cytarabine to immunochemotherapy before autologous stem-cell transplantation in patients aged 65 years or younger with mantle cell lymphoma (MCL Younger): a randomised, open-label, phase 3 trial of the European Mantle Cell Lymphoma Network. Lancet 2016;388:565–75.
95. Fenske TS, Zhang M-J, Carreras J, et al. Autologous or reduced-intensity conditioning allogeneic hematopoietic cell transplantation for chemotherapy-sensitive mantle-cell lymphoma: analysis of transplantation timing and modality. J Clin Oncol 2014;32:273–81.
96. Kluin-Nelemans HC, Hoster E, Hermine O, et al. Treatment of older patients with mantle-cell lymphoma. N Engl J Med 2012;367:520–31.
97. Flinn IW, van der Jagt R, Kahl BS, et al. Randomized trial of bendamustine-rituximab or R-CHOP/R-CVP in first-line treatment of indolent NHL or MCL: the BRIGHT study. Blood 2014;123:2944–52.
98. Rummel MJ, Niederle N, Maschmeyer G, et al. Bendamustine plus rituximab versus CHOP plus rituximab as first-line treatment for patients with indolent and mantle-cell lymphomas: an open-label, multicentre, randomised, phase 3 non-inferiority trial. Lancet 2013;381:1203–10.
99. Lenz G, Dreyling M, Hoster E, et al. Immunochemotherapy with rituximab and cyclophosphamide, doxorubicin, vincristine, and prednisone significantly improves response and time to treatment failure, but not long-term outcome in patients with previously untreated mantle cell lymphoma: results of a prospective randomized trial of the German Low Grade Lymphoma Study Group (GLSG). J Clin Oncol 2005;23:1984–92.
100. Belch A, Kouroukis CT, Crump M, et al. A phase II study of bortezomib in mantle cell lymphoma: the National Cancer Institute of Canada Clinical Trials Group trial IND.150. Ann Oncol Off J Eur Soc Med Oncol 2007;18:116–21.
101. Fisher RI, Bernstein SH, Kahl BS, et al. Multicenter phase II study of bortezomib in patients with relapsed or refractory mantle cell lymphoma. J Clin Oncol 2006;24:4867–74.
102. Dreyling M, Jurczak W, Jerkeman M, et al. Ibrutinib versus temsirolimus in patients with relapsed or refractory mantle-cell lymphoma: an international, randomised, open-label, phase 3 study. Lancet 2016;387:770–8.
103. Wang ML, Rule S, Martin P, Goy A, et al. Targeting BTK with ibrutinib in relapsed or refractory mantle-cell lymphoma. N Engl J Med 2013;369:507–16.
104. Wang M, Rule S, Zinzani PL, et al. Acalabrutinib in relapsed or refractory mantle cell lymphoma (ACE-LY-004): a single-arm, multicentre, phase 2 trial. Lancet 2018;391:659–67.
105. Goy A, Sinha R, Williams ME, et al. Single-agent lenalidomide in patients with mantle-cell lymphoma who relapsed or progressed after or were refractory to bortezomib: phase II MCL-001 (EMERGE) study. J Clin Oncol 2013;31:3688–95.
106. Khouri IF, Lee M-S, Saliba RM, et al. Nonablative allogeneic stem-cell transplantation for advanced/recurrent mantle-cell lymphoma. J Clin Oncol 2003;21:4407–12.
107. Blum KA, Lozanski G, Byrd JC. Adult Burkitt leukemia and lymphoma. Blood 2004;104:3009–20.
108. Roschewski M, Dunleavy K, Abramson JS, et al. Risk-adapted therapy in adults with Burkitt lymphoma: results of NCI 9177, a multicenter prospective phase II study of DA-EPOCH-R. Blood American Society of Hematology;2017;130(Suppl 1):188.
109. Maramattom L V, Hari PN, Burns LJ, et al. Autologous and allogeneic transplantation for burkitt lymphoma outcomes and changes in utilization: a report from the center for international blood and marrow transplant research. Biol Blood Marrow Transplant 2013;19:173–9.
110. Zinzani PL, Bendandi M, Visani G, et al. Adult lymphoblastic lymphoma: clinical features and prognostic factors in 53 patients. Leuk Lymphoma 1996;23:577–82.
111. Thomas DA, O’Brien S, Cortes J, et al. Outcome with the hyper-CVAD regimens in lymphoblastic lymphoma. Blood 2004;104:1624–30.
112. Aljurf M, Zaidi SZA. Chemotherapy and hematopoietic stem cell transplantation for adult T-cell lymphoblastic lymphoma: current status and controversies. Biol Blood Marrow Transplant 2005;11:739–54.
113. Sweetenham JW, Santini G, Qian W, et al. High-dose therapy and autologous stem-cell transplantation versus conventional-dose consolidation/maintenance therapy as postremission therapy for adult patients with lymphoblastic lymphoma: results of a randomized trial of the European Group for Blood and Marrow Transplantation and the United Kingdom Lymphoma Group. J Clin Oncol 2001;19:2927–36.
114. Zwaan CM, Kowalczyk J, Schmitt C, et al. Safety and efficacy of nelarabine in children and young adults with relapsed or refractory T-lineage acute lymphoblastic leukaemia or T-lineage lymphoblastic lymphoma: results of a phase 4 study. Br J Haematol 2017;179:284–93.
Does Combination Treatment Prevent Stroke?
Combining clopidogrel and aspirin following a small stroke or minor stroke symptoms reduces the risk of a new stroke, heart attack, or other ischemic event within 90 days, say researchers from the National Institute of Neurological Disorders and Stroke.
In POINT (Platelet-Oriented Inhibition in New TIA and minor ischemic stroke), an international clinical trial, 5% of the combination therapy group and 6.5% of the aspirin-only group had an ischemic event within 90 days. The benefit of the combination was concentrated in the first 2 weeks, while the risk of bleeding was constant over 90 days, says Walter Koroshetz, MD, director of NINDS, thus the treatment may be most valuable in acute management of a minor ischemic stroke or TIA.
The study was stopped early not only because the combination therapy was more effective than aspirin alone in preventing severe strokes, but also due to the risk of severe hemorrhage. The combination therapy was associated with an increase in major bleeding, although many of the episodes were not fatal and occurred outside the brain: 0.9% of the combination group had a major hemorrhage, compared with 0.4% of the aspirin-only group.
“Overall, the risk of severe bleeding was very small,” says lead investigator S. Claiborne Johnston, MD, PhD, “but it was not zero.”
Management of Dyslipidemia in the Elderly
From the Harrison School of Pharmacy, Auburn University, Mobile, AL.
Abstract
- Objective: To summarize the literature relevant to managing dyslipidemia in the elderly and review recommendations for initiating lipid-lowering therapy.
- Methods: Review of the literature.
- Results: Statins are the most commonly utilized medication class for lipid-lowering in the general population, and they are recommended for primary prevention in patients between the ages of 40 to 75 with at least 1 risk factor for cardiovascular disease as well as for any patient needing secondary prevention. In the elderly, statins may be appropriate for both primary and secondary prevention if the benefits outweigh the risks. Based on the available evidence, it is safe to recommend statin therapy to elderly patients who require secondary prevention given the known benefits in reducing cardiovascular morbidity and mortality for patients up to the age of 80. For primary prevention, statin therapy may be beneficial, but one must carefully evaluate for comorbid conditions, life expectancy, concomitant medications, overall health status, frailty, and patient or family preference. Several other classes of lipid-lowering agents exist; however, there is not enough evidence for us to recommend use in the elderly population for cardiovascular risk reduction in either primary or secondary scenarios.
- Conclusion: Although clinical research in the elderly population is limited, evidence supports the use of statins in elderly patients for secondary prevention and in patients up to age 75 for primary prevention; however clinicians must use clinical judgement and take into consideration the patient’s situation regarding comorbidities, polypharmacy, and possible adverse effects. More high-quality evidence is necessary.
Key words: hyperlipidemia; geriatrics; elderly; patient-centered care; statin; cardiovascular disease.
The number of Americans age 65 years and older is projected to more than double, from 46 million today to over 98 million by 2060, and the 65-and-older age group’s share of the total population will rise to nearly 24% [1]. Life expectancy is now predicted to be > 20 years for women at age 65 and > 17 years for men at age 65 in many high-income countries, including the United States [2]. This demographic shift toward an older population will result in a higher burden of coronary heart disease and stroke, with atherosclerotic cardiovascular disease (ASCVD) prevalence and costs projected to increase substantially [3].
Among adults seeking medical care in the United States, roughly 95 million have a total cholesterol (TC) level of ≥ 200 mg/dL or more, and approximately 29 million have a TC > 240 mg/dL [4]. Cholesterol screening is important since most patients suffering from dyslipidemia are asymptomatic. Dyslipidemia is a major risk factor for the development of atherosclerotic disease. Because of the complications associated with dyslipidemia, it is vital that patients are provided with primary and/or secondary prevention strategies to reduce the risk of cardiovascular disease (CVD) and protect high-risk patients from recurring events. A clinical controversy exists surrounding the elderly population, concerning whether or not clinicians should be providing lipid-lowering treatment to this group of individuals for dyslipidemia. The evidence is limited for patients over age 65, and even more so for the very elderly (> 80 years); therefore, it is necessary to review the available evidence to make an appropriate decision when it comes to managing dyslipidemia in the elderly population
Currently, HMG-CoA reductase inhibitors (statins) are the only known class of medications for the treatment of dyslipidemia that will prevent both primary and secondary cardiovascular (CV) events, including death. Statin intensity (Table 1) 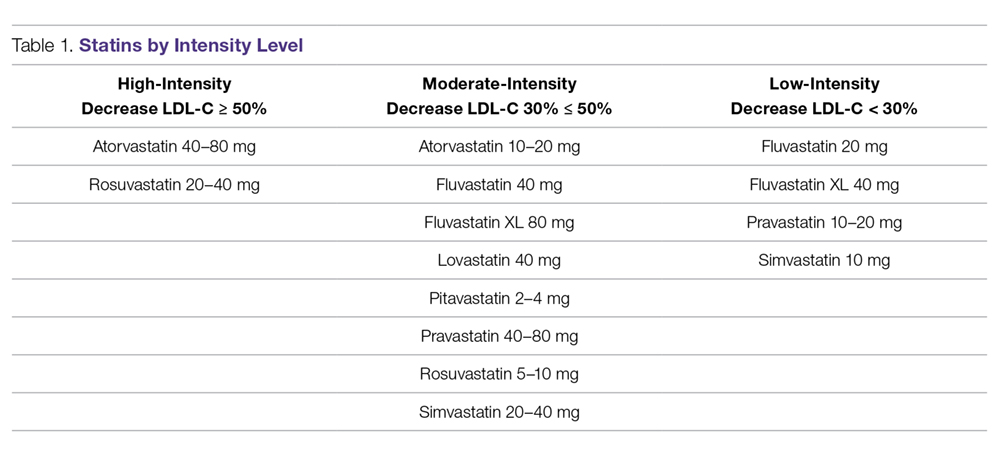
Guideline Recommendations
Current guidelines differ in their recommendations for treating dyslipidemia in the elderly population. In 2016, the Task Force for the Management of Dyslipidemias of the European Society of Cardiology (ESC) and the European Atherosclerosis Society (EAS) released updated guidelines for managing dyslipidemia. These guidelines recommend that older patients with established CVD be treated in the same way as younger patients because of the many benefits statin therapy demonstrated in clinical trials. They also suggest that statin therapy be started at a lower doses to achieve goals for primary prevention in the older population. In addition, CVD risk factors (hypertension, diabetes, dyslipidemia, smoking) should be addressed in this population to reduce CVD risk. They also acknowledged that primary prevention may not prolong life in the older adult, but treatment does reduce cardiovascular mortality and statin therapy is recommended to reduce the overall risk of CV morbidity in this population [11]. In contrast, The 2013 American College of Cardiology/American Heart Association (ACC/AHA) guidelines changed the management and treatment of dyslipidemia by highlighting “statin benefit groups” rather than recommending a treat-to-target goal as guidelines had done for many years. ACC/AHA recommends a moderate-intensity statin for patients > 75 years of age for secondary prevention versus the use of a high-intensity statin for patients who are between the ages of 40 and 75 based on the pooled cohort risk equation. In patients over age 75 with no history of CVD, no specific recommendation is available for the use of lipid-lowering therapy at this time [12]. ACC/AHA is expected to publish a new set of guidelines sometime in 2018 and they are projected to utilize lipid-lowering goals in combination with the pooled cohort equation to assess overall risk in patients with dyslipidemia.
The 2015 National Lipid Association (NLA) released “Part 1” guidelines for the management of dyslipidemia and then provided “Part 2” about a year later, which focuses on management for special populations. To summarize, the NLA guidelines recommend that elderly patients between the ages of 65 and 80 receive a high-intensity statin for secondary prevention after special consideration of the potential risks and benefits. In patients over the age of 80, NLA recommends a moderate-intensity statin for secondary prevention. For primary prevention, NLA recommends utilizing the pooled cohort risk equation to analyze patient characteristics, keeping in mind that age is a driving factor for increased risk of CVD and that the actual risk for developing a CV event may be “overestimated” if the patient has no other risk factors other than their age. When evaluating patients between the ages of 65 and 79 for primary prevention, NLA suggests following Part 1 of the guidelines. In Part 1, NLA recommends evaluating the patient’s characteristics and suggests a moderate- or high-intensity statin if the patient is considered “very high risk” or “high risk” and a moderate-intensity statin for patients who are considered “moderate risk”. For patients over the age of 80, they recommend utilizing a moderate- or a low-intensity statin depending on frailty status or if significant comorbidities or polypharmacy exist [13,14].
In 2017, the American Association of Clinical Endocrinologist (AACE) released guidelines for the management of dyslipidemia and CVD prevention. AACE recommends that patients over age 65 be screened for dyslipidemia, and those who have multiple risk factors, other than age, should be considered for treatment with lipid-lowering therapy. AACE focuses on specific target LDL-C levels as treatment goals [15].
In addition to statins, other lipid-lowering therapies are used to treat dyslipidemia. The 2016 American College of Cardiology (ACC) Task Force reported on the use of non-statin therapies for the management of dyslipidemia and prevention of clinical ASCVD [16]. The committee concluded that ezetimibe added to statin therapy, bile acid sequestrants as monotherapy, and niacin as monotherapy all have some benefit for the prevention of clinical ASCVD. These guidelines also discuss the use of PCSK-9 inhibitors and their potential to decrease the risk of clinical ASCVD, but trials are currently ongoing to determine actual benefit. These guidelines address special populations but they do not consider the elderly in their recommendations. Currently, the only special populations included are patients with heart failure, those on hemodialysis, women who are of childbearing age or pregnant, and those with autoimmune diseases [16]. The literature available for each individual medication is discussed in further detail below.
Evidence for Secondary Prevention
The benefits of statin therapy for secondary prevention in the elderly is more established than it is for primary prevention (Table 2). 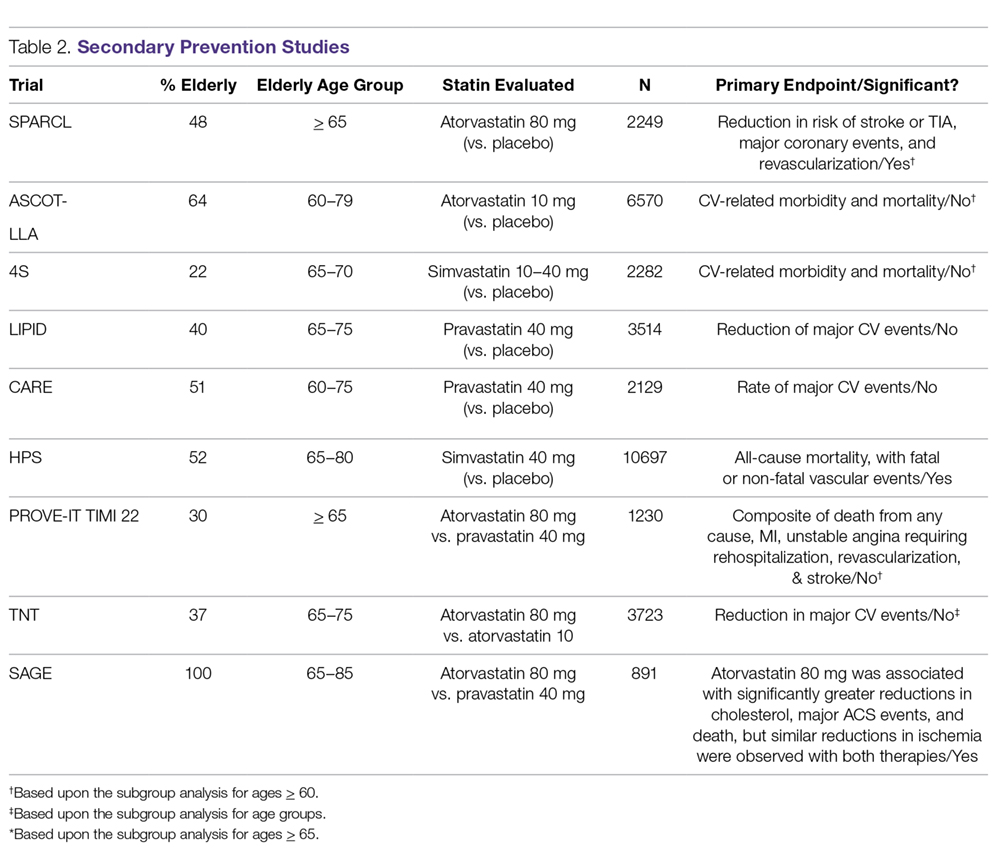
The ASCOT–LLA (Anglo-Scandinavian Cardiac Outcomes Trial–Lipid Lowering Arm), published in 2003, evaluated the effect of atorvastatin 10 mg on reducing ASCVD events in moderate-risk patients between 40–79 years of age who had hypertension and normal or slightly elevated LDL-C levels, with at least 2 other risk factors for CVD (age > 55 years was considered a risk factor). The primary outcome was non-fatal MI including silent MI and fatal CHD. A significant reduction was seen in the primary endpoint. Over half of the study population was > 60 years of age, with a mean age of 63 years. In a post-hoc analysis, stroke prevention was found to be similar in patients who were > 70 years of age and those < 70 years of age [19].
One of the first trials to specifically analyze the impact of age on lipid-lowering therapy in secondary ASCVD prevention was the Scandinavian Simvastatin Survival Study (4S), published in 1994. They evaluated the effect of simvastatin 20 mg on CV-related mortality and morbidity in patients 35–70 years of age with hyperlipidemia and a history of angina or acute MI occurring > 6 months of the study starting. The primary outcome was all-cause mortality. The secondary endpoint was time to first major CV event, which included coronary death, non-fatal acute MI, resuscitated cardiac arrest, and silent MI. Simvastatin significantly reduced the primary outcome and CHD-related deaths. A subgroup analysis of the study population > 60 years of age showed that age made no significant impact on primary or secondary outcomes; however, investigators noted that these subgroup analyses had less statistical power than the population as a whole [20].
Published in 1998, the LIPID (Long-Term Intervention with Pravastatin in Ischemic Disease) study evaluated the effects of pravastatin 40 mg daily on CHD-related mortality and overall mortality in patients with hyperlipidemia and clinical ASCVD (previous MI or unstable angina). The primary outcome observed was fatal CHD. Pravastatin significantly reduced the primary outcome, overall mortality, and pre-specified CV events. In a subgroup analysis, age group ( 65, and > 70 years) had no significant impact on the combined outcome of death from CHD and nonfatal MI; however, patients 65 to 70 years of age made up less than half of the study population [21].
The Cholesterol and Recurrent Events (CARE) trial, published in 1996, looked at the effect of pravastatin 40mg therapy for secondary ASCVD prevention following an MI in patients who had average cholesterol levels (defined as TC < 240 mg/dL and LDL-C 115–174 mg/dL). The primary endpoint assessed was time to fatal CHD or nonfatal MI. To meet statistical power they looked at subgroups for a broader outcome of a major coronary event (including fatal CHD, nonfatal MI, bypass surgery, and angioplasty). Pravastatin significantly reduced the primary outcome. The significant reduction in coronary events produced by pravastatin was noted to be significantly greater in women and in patients with higher pretreatment levels of LDL-C, but was not significantly impacted by age group (24–59 vs. 60–75 years) [22].
The Heart Protection Study (HPS), published in 2002, looked at the long-term effects of lowering LDL-C with simvastatin 40 mg in patients 40 to 80 years of age at high risk for mortality due to either vascular or nonvascular causes. The primary outcome assessed was all-cause mortality, with fatal or nonfatal vascular events as co-primary outcomes for subcategory analyses. Simvastatin significantly reduced both primary and co-primary outcomes, but there was no significant difference when they looked at nonvascular mortality between groups. Neither age nor baseline LDL levels were reported to have had a significant impact on outcomes. Over half the population was > 65 years of age, and about one-third of the population was > 70 years of age [23].
The PROVE-IT/TIMI 22 (Pravastatin or Atorvastatin Evaluation and Infection Therapy–Thrombolysis in Myocardial Infarction 22) trial, published in 2004, compared pravastatin 40 mg (moderate-intensity) to atorvastatin 80 mg (high-intensity) for secondary ASCVD prevention in patients with recent acute coronary syndrome (ACS) 65 years of age and the mean age was 58 years [24].
The TNT (Treating to New Targets) trial, published in 2005, looked at secondary ASCVD prevention in regards to targeting LDL-C levels to < 100 mg/dL or < 70 mg/dL with atorvastatin 10 mg and atorvastatin 80 mg. Patients had stable coronary artery disease (CAD) and baseline LDL-C levels < 130 mg/dL. The primary endpoint was the occurrence of a CV event (CAD mortality, nonfatal MI not related to procedure, resuscitation after cardiac arrest, or fatal or nonfatal stroke). High-intensity atorvastatin (80 mg) significantly reduced the primary outcome. The mean age of the study population was approximately 61 years. The study reported no statistical interaction for age or sex in the primary outcome measure [25].
The Study Assessing Goals in the Elderly (SAGE), published in 2007, evaluated the effects of pravastatin 40 mg (moderate-intensity) vs atorvastatin 80 mg (high-intensity) on secondary ASCVD prevention in patients 65 to 85 years (mean age 72) with stable CHD, LDL-C 100–250 mg/dL, with at least 1 episode of myocardial ischemia with total ischemia duration > 3 minutes. The primary efficacy outcome observed was absolute change in total duration of myocardial ischemia on 48-hour ambulatory electrocardiographic monitoring from baseline to month 12. No significant difference was observed in efficacy between the two groups for the primary endpoint, but the intensive statin therapy group showed greater benefit respective to several secondary outcomes, including major acute CV events and death [26].
In summary, while these trials provide evidence that statin therapy is beneficial in a wide range of patients with clinical ASCVD and dyslipidemia, the trial data does not provide definitive guidance for treating elderly patients at this time. Given the small percentage of elderly patients that were included, some of the trial results reporting statistical significance in this age group hold less clinical significance. It appears that high-intensity statin therapy was more likely to effectively prevent clinical ASCVD and death than moderate-intensity statin therapy, but more evidence is needed regarding secondary prevention in patients over age 75.
Evidence for Primary Prevention
The PROSPER (PROspective Study of Pravastatin in the Elderly at Risk) was published in 2002 to assess the efficacy of pravastatin in patients between the ages of 70 and 82 (mean age 75 years) with pre-existing vascular disease (coronary, cerebral, or peripheral) or at an elevated risk (smoking, hypertension, or diabetes). Patients were randomized to receive either placebo or pravastatin 40 mg (a moderate-intensity statin). They found that pravastatin therapy reduced the risk of the composite outcome of CHD-related death, nonfatal MI, and fatal or nonfatal stroke in this elderly population. A post-hoc analysis comparing primary versus secondary prevention groups found no significant differences between these subgroups [7].
Han et al recently conducted a post hoc secondary analysis of older participants (65 years and older) in the Antihypertensive and Lipid-Lowering Treatment to Prevent Heart Attack Trial–Lipid-Lowering Trial (ALLHAT-LLT). The intervention for ALLHAT-LLT was 40 mg pravastatin. They found no significant differences in all-cause mortality or cardiovascular outcomes between the pravastatin and usual care groups [27]
JUPITER (Justification for Use of Statins in Prevention: An Intervention Trial Evaluating Rosuvastatin), published in 2008, examined the efficacy of rosuvastatin vs. placebo in low- to moderate-risk men 50 years and older and women 60 years and older using a composite outcome of MI, unstable angina, stroke, arterial revascularization, or CVD death. Rosuvastatin did significantly decrease the primary endpoint, however it did not reduce the risk of overall death [28]. A subgroup analysis was performed on the elderly (65–75 years) study participants in JUPITER demonstrating a significant risk reduction for the combined CV endpoint and a nonsignificant reduction of all-cause mortality [29].
CARDS (Collaborative Atorvastatin Diabetes Study), published in 2004, looked at statin use for primary prevention in high-risk patients with type 2 diabetes without high LDL-C, but they had to have at least 1 additional risk factor for CVD. The primary outcome was first acute CHD event (myocardial infarction including silent infarction, unstable angina, acute coronary heart disease death, resuscitated cardiac arrest), coronary revascularization procedures, or stroke. Atorvastatin 10 mg, a moderate-intensity statin, significantly decreased occurrence of the primary outcome [30]. A subgroup analysis was performed to evaluate patients specifically between the ages of 65 and 75 and found a similar outcome in the elderly with a significant reduction in first major CV event and stroke [31].
A recent study evaluating primary prevention in patients with an intermediate risk for CVD was the HOPE-3 (Heart Outcomes Prevention Evaluation), published in 2016. Two co-primary outcomes were evaluated: the composite of death from cardiovascular causes, nonfatal myocardial infarction, or nonfatal stroke, while the second primary outcome also included revascularization, heart failure, and resuscitated cardiac arrest. Rosuvastatin significantly decreased occurrence of both co-primary endpoints. About half of the study populations was over the age of 65 with a median age of 71 [32].
In addition to these trials of primary prevention, summarized in Table 3, a meta-analysis was published in 2013 to assess whether statins reduce all-cause mortality and CV events in elderly people without established CV disease. 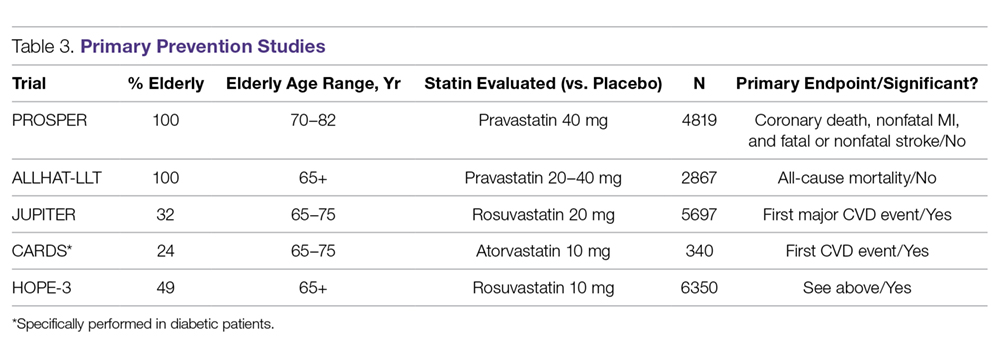
As demonstrated by the above studies, it is evident that statins do help reduce the risk of CV events, regardless of statin intensity, but they do not consistently prevent death. However, the trials that did not demonstrate a significant outcome related to death utilized a moderate-intensity statin; if a high-intensity statin was used in those trials, there may have been a benefit [7,27]. More study is needed to evaluate the use of high-intensity statins in the elderly for the prevention of all-cause mortality and CV-related death.
Fortunately, the ongoing STAREE (STAtin Therapy for Reducing Events in the Elderly) study is looking specifically at the impact of statin therapy in adults 70 and older. Patients with a history of CVD or dementia are excluded. Results are set to be released in 2020 [34].
Risks of Using Statins in Older Adults
Statin use has been linked to a number of unwanted adverse effects.
Myalgia
Myalgia is variable but may occur in up to 25% of patients using statin therapy, and elderly patients typically experience more statin-associated myalgia than younger patients [35,36]. Elderly patients are more prone to decreased muscle mass and therefore may be at a higher risk of developing myalgia pain. Elderly patients are also utilizing more medications, leading to the potential for increased drug-drug interactions that could lead to myalgia. Elderly patients may also lose the function of drug metabolizing enzymes responsible for breaking down statin therapy, which may also increase the risk for statin-associated myalgia. One study demonstrated that elderly patients were more likely to discontinue statin therapy due to muscle pain and elderly patients reported more muscle side effects than their younger cohorts [37]. It is important to monitor for muscle pain and weakness in every patient. If they experience any myalgia, it is recommended to either lower the dose or discontinue the statin once it is determined to be statin-related. After myalgia resolves, therapy can be reinitiated at a lower dose or with a different statin if the patient is deemed high-risk. If creatine phosphokinase levels are greater than 10 times above the upper limit of normal, then discontinue the statin and wait for levels to return to normal. Re-initiation may be appropriate, but the the risks and benefits must be weighed. Simvastatin and atorvastatin are associated with higher rates of myalgia while pravastatin and rosuvastatin have the least myalgia pain associated with use [38,39].
Statin Intolerance
Statin intolerance, while not very common, is typically seen more often in special populations such as women, Asian patients, and the elderly. For a patient to be considered intolerant to statins, they need to have documented muscle symptoms or an elevated creatine phosphokinase level. Although not well defined, many clinicians consider improvement of symptoms with statin withdrawal as a diagnosis for statin intolerance. Typically patients are then rechallenged with 1 to 2 other statins and if still unable to tolerate, then different lipid-lowering therapies may be utilized [40]. In the elderly, it is important to rule out other causes for myalgia and monitor for significant drug interactions that may lead to muscle pain, particularly if the patient is requiring secondary prevention with statin therapy, before discontinuation.
Dementia
In 2012, the FDA issued a warning about the potential risk of cognitive impairment with the use of statins, which was based on case reports, not clinical trial data [41]. The NLA guidelines do not recommend baseline cognitive assessments prior to starting therapy and recommend that if patients do report cognitive impairment, other contributing factors and the risk associated with stopping statin therapy must be considered. Statin therapy may be discontinued to assess reversibility of symptoms, and if symptoms resolve, then it may be more beneficial to keep the patient off statin therapy. Clinicians may also consider lowering the dose or switching to another statin if they feel it is necessary for the patient to continue with a statin, particularly if the patient requires secondary prevention. Evidence suggests that statins are not associated with adverse effects on cognition and should not be withheld due to the potential for causing cognitive impairment alone [42]. The prevalence of cognitive impairment increases with age, so it is important for a clinician to rule out age-related processes or other disease states, such as Alzheimer’s, before discontinuation of previously tolerated statin therapy.
Renal Impairment
Kidney function must be evaluated prior to initiation of a statin in an elderly person as well as during the time the patient is taking a statin. Because statins are eliminated via the kidney, and because most elderly patients have decreased kidney function, the potential for drug build-up in the body is higher than in a younger patient and may lead to more adverse effects. Atorvastatin is the only option that does not require dose adjustment. All other statins should be adjusted based upon the level of renal impairment. The results from the SHARP study, published in 2011, showed that the combination of ezetimibe and simvastatin versus placebo significantly reduced ASCVD events in patients with moderate to severe chronic kidney disease, including those receiving dialysis. Specifically, this trial showed a significant reduction of ischemic events and occurrence of arterial revascularization procedures. Although the trial did not show a significant difference in incidence of MI or CHD-related mortality, the trial was not adequately powered to show differences in results among the individual ASCVD events and it is not clear whether the results can guide the use of statin therapy in all patients with chronic kidney disease [43]. Statins may be beneficial in renal insufficiency to lower LDL-C, but more studies are needed to assess CVD outcomes related to statin use in patients with a history of kidney disease [44].
Hepatic Function
Statins have been known to increase liver enzymes and in rare cases lead to liver injury, which typically has led to underutilization of therapy in clinical practice. Risk factors associated with this include preexisting hepatitis, advanced age, chronic alcohol use, and use of concomitant medications that may also cause hepatotoxicity, such as acetaminophen. When a statin-induced hepatic effect is suspected, it is important to first rule out other causes or disease states that may be undiagnosed. If no other cause can be found, clinicians may choose to reduce the statin dose, switch the statin, or discontinue the statin altogether if the risk outweighs the benefit. Additionally, statins do not have to be held in patients who have preexisting hepatic dysfunction if use is clearly indicated because the cardiovascular benefits typically outweigh the risks of causing liver injury. Clinical judgement is still warranted and patients with preexisting liver conditions should be monitored regularly [45].
Cost Considerations
Several studies have demonstrated that statin therapy, in the general population, is economical for both primary and secondary prevention of CVD [46,47]. The 4S study found simvastatin therapy to be cost-effective; for example, the cost per life year gained for a 70-year-old man with high chlesterol was $3800 [48]. In contrast, primary prevention in middle-aged men, based on the West of Scotland trial, averages about $35,000 per year of life gained [46]. In a 2015 study that utilized an established Markov simulation model, researchers studied adults 75 to 94 years and examined the cost-effectiveness of generic statins for primary prevention in this population. The authors estimated treating this population with statins over the next decade would be cost-effective. However, the researchers cautioned that the CV benefits and cost-effectiveness would be offset with even a modest increased risk of cognitive impairments or functional limitations. Statin use was not cost-effective in diabetes patients who did not have elevated LDL-C levels [49].
Non-Statin Therapies
Several other classes of medications are available for the management of hyperlipidemia; however, none of these lipid-lowering therapies have been found to reduce CVD events or mortality in the elderly population.
Ezetimibe
Ezetimibe blocks the absorption of intestinal cholesterol and is typically combined with statin therapy to lower LDL-C. Up until the IMPROVE-IT trial was published in 2015, ezetimibe did not have much use in clinical practice. This landmark trial was a large double-blind study that looked at secondary prevention in patients with ACS, comparing ezetimibe 10 mg and simvastatin 40 mg versus simvastatin 40 mg alone. The authors included patients over the age of 50 (mean age 64) with clinical ASCVD. They found that the addition of ezetimibe to simvastatin did reduce the primary composite outcome (CV mortality, major CV events, or nonfatal stroke) when compared to simvastatin alone [50]. This trial demonstrates clinical benefit with the addition of ezetimibe to statin therapy and adds additional evidence to support a target LDL-C of less than 70 mg/dL; however, the elderly population was not adequately represented in the study to allow extrapolation of these results to older patients.
PCSK-9 Inhibitors
The proprotein convertase subtilisin/kexin type 9 (PCSK-9) inhibitors are a newer class of monoclonal antibodies that were first approved by the US Food and Drug Administration in 2015. Alirocumab and evolocumab, both approved PCSK-9 inhibitors, bind to LDL receptors on the surface of hepatocytes and assist in the internalization of LDL receptors for lysosomal degradation. By inhibiting the binding of PCSK-9 to the LDL receptors, there is an overall increase in LDL receptors available on the cell surface to bind to LDL particles, thereby lowering LDL-C levels. Treatment with these agents are currently considered (in addition to diet and maximally tolerated statin therapy) in adult patients with heterozygous familial hypercholesterolemia or clinical ASCVD requiring further reduction in LDL-C. Two studies were published focusing on the use of PCSK-9 inhibitors: Open-label Study of Long-term Evaluation against LDL Cholesterol (OSLER) and the Tolerability of Alirocumab in High Cardiovascular Risk Patients with Hypercholesterolemia Not Adequately Controlled with Their Lipid Modifying Therapy (ODYSSEY LONG TERM). Overall, these studies demonstrated a 60% reduction of LDL-C among patients with high CVD risk on maximum-tolerated statin therapy. Furthermore, the ODYSSEY LONG TERM trial did find that the rate of major CVD adverse events was significantly lower with alirocumab added to maximum-tolerated statin therapy, with a hazard ratio of 0.52 [51].
One recent study of evolocumab, named the Further Cardiovascular OUtcomes Research with PCSK9 Inhibition in Subjects with Elevated Risk (FOURIER), enrolled patients between the ages of 40 and 85 with 1 major CV risk factor or 2 minor CV risk factors. The primary endpoint was a composite of cardiovascular death, MI, stroke, hospitalization for unstable angina, or coronary revascularization. Evolocumab lowered major CV events by roughly 15% when added to statin therapy in patients who were at high risk for clinical ASCVD. The mean age of the patients in the trial was 63; however, it is unclear how many of the study participants were elderly [52].
Unfortunately, the studies discussed above do not represent the elderly population well and the agents have not been studied long-term to determine the effects of continued use beyond 2 years. Long-term outcome studies are currently underway; however, it is unknown at this time whether elderly patients are being considered in these studies. It is known that genetic variation of the PCSK-9 locus does lower LDL-C in the elderly but does not significantly lower their risk of vascular disease [51]. At this time, until further evidence is available, we do not recommend the use of PCSK-9 inhibitors in elderly patients.
Nicotinic Acid
Nicotinic acid (Niacin, Niacin ER), also known as vitamin B3, has been utilized for decades as a vitamin supplement, an anti-wrinkle agent, and is known to have neuroprotective effects. It has also been utilized for dyslipidemia and has had some benefits when used alone to decrease cardiovascular disease [53]. Unfortunately the Coronary Drug Project was completed in the 1980s and did not incorporate patients over the age of 64, therefore making the results difficult to apply to elderly patients today [54]. Other literature has been published in recent years to refute that study, claiming there is no additional benefit to using niacin for cardiovascular protection and these studies have included elderly patients. In the AIM-HIGH trial, published in 2011, approximately 46% of the patients were 65 or older. Patients who were previously taking statin therapy that had known cardiovascular disease were enrolled. Niacin added to simvastatin 40–80 mg lowered LDL-C, triglycerides, and increased HDL-C, but the addition of niacin was not proven to help lower the risk of cardiovascular events [55]. The HPS2-THRIVE study enrolled patients with known cardiovascular disease between the ages of 50 and 80 years and found no benefit in preventing CVD when adding niacin to statin therapy [56]. With its side effect profile, risk for increased glucose intolerance, and lack of evidence to demonstrate benefit for prevention of CV events, we do not recommend niacin for use in the elderly at this time.
Bile Acid Sequestrants
The ATP III guidelines [57] noted that when statins are not sufficient to lower high cholesterol, bile acid sequestrants also known as resins could be added. More recently, the 2016 ACC expert consensus on non-statin therapies for LDL-C lowering [16] stated resins may be considered in select circumstances as a second-line agent for adults with ezetimibe intolerance and with triglycerides
Fibrates
While fibrates (gemfibrozil, fenofibrate, clofibrate) have not been studied to demonstrate a reduction in CVD or CVD mortality in the elderly population, this medication class is beneficial in patients with hypertriglyceridemia to lower triglyceride levels and prevent pancreatitis. Fibrates are recommended for patients with triglyceride levels approaching 500 mg/dL. Fibrates can also increase high-density lipoproteins, which tend to be lower in the elderly population and considered a risk factor for CVD. Gemfibrozil is not recommended in combination with statin therapy due to an increased risk of myalgia. Fenofibrate is the drug of choice, particularly for diabetic patients with very uncontrolled triglyceride levels because it will not affect glucose levels [57]. At this time, we do not recommend the use of fibrates in the elderly population unless they are at risk for developing pancreatitis and have elevated triglyceride levels.
Patient-Centered Care
Evidence-based medicine can aid in making sound clinical decisions for proper patient care; however, treatment plans should consider the individual patient’s perspectives and needs, beliefs, expectations, and goals. In the elderly population, we must also consider factors such as finances, pill-burden, drug-drug interactions, physiological needs, comorbid disease states, and overall life expectancy. In addition, the elderly population is physiologically heterogeneous group and recommendations for therapy need to be individualized. Chronological age does not necessarily correspond to vascular age and risk factors for cardiovascular disease do not predict outcomes as well in the elderly as they do in younger patients. While older patients may view having to take 1 less medication as more important than preventing a heart attack or stroke at the age of 80, it is advisable to discuss all potential outcomes related to morbidity associated with the occurrence of an MI or stroke due to the lack of statin therapy. Additionally, pharmacists can play a vital role in evaluating elderly patients and their medication regimens. Elderly patients should undergo a medication reconciliation at each visit to evaluate drug-drug interactions, side effects, and potentially harmful medication combinations that may lead to increased adverse drug outcomes.
Conclusion
CHD increases with age, and most patients who have a CV event are more likely to die with advancing age. Based on the the limited available evidence, statin therapy is beneficial in the elderly population in reducing overall CV morbidity. We recommend beginning with with a moderate-intensity statin and adjusting accordingly. High-intensity statin therapy appears to be effective for elderly patients for secondary prevention, but clinicians should use clinical judgment and monitor for adverse events, particularly myalgia pain. At this time, we are unable to determine if non-statin therapies for the elderly would be beneficial and do not recommend their use unless the patient is at risk for pancreatitis, in which case a fenofibrate is recommended.
Corresponding author: Nicole A. Slater, PharmD, BCACP, Auburn University, Harrison School of Pharmacy, 650 Clinic Dr., Mobile, AL 36688.
Financial disclosures: None.
1. Fact sheet: Aging in the United States. Accessed at www.prb.org/aging-unitedstates-fact-sheet/.
2. Kontis JE, Bennett CD, Mathers G, et al. Future life expectancy in 35 industrialised countries: projections with a Bayesian model ensemble. Lancet 2017;389:1323–35.
3. Odden MD, Coxson PG, Moran A, et al. The impact of the aging population on coronary heart disease in the United States. Am J Med 2011;124:827–33.
4. Benjamin EJ, Blaha MJ, Chiuve SE, et al. Heart disease and stroke statistics—2017 update: a report from the American Heart Association. Circulation 2017;135:e1–e458.
5. Mills EJ, Rachlis B, Wu P, et al. Primary prevention of cardiovascular mortality and events with statin treatments: a network meta-analysis involving more than 65,000 patients. J Amer Col Cardiol 2008;52:1769–81.
6. Stone NJ. Statins in secondary prevention: intensity matters. J Am Coll Cardiol 2017;69: 2707–9.
7. Shepherd J, Blauw GJ, Murphy MB, et al; PROSPER study group. PROspective Study of Pravastatin in the Elderly at Risk. Pravastatin in elderly individuals at risk of vascular disease (PROSPER): a randomised controlled trial. Lancet 2002;360:1623–30.
8. Heart Protection Study Collaborative Group Writers. MRC/BHF Heart Protection Study of cholesterol lowering with simvastatin in 20,536 high-risk individuals: a randomised placebo-controlled trial. Lancet 2002;360:7–22.
9. Lefevre F, Nishida L. Special report: the efficacy and safety of statins in the elderly. TEC Assessment Program 2007;21
10. Pravastatin benefits elderly patients: results of PROSPER study. Cardiovasc J S Afr 2003;14:48.
11. Catapano AL, Graham I, Backer GD, et al. ESC/EAS Guidelines for the management of dyslipidaemias. Eur Heart J 2016;37:2999–3058.
12. Stone NJ, Robinson JG, Lichtenstein AH, et al. 2013 ACC/AHA guideline on the treatment of blood cholesterol to reduce atherosclerotic cardiovascular risk in adults: a report of the American College of Cardiology/American Heart Association Task Force on Practice Guidelines. J Am Coll Cardiol 2014;63:2889–934.
13. Jacobson TA, Ito MK, Maki K, et al. National lipid association recommendations for patient-centered management of dyslipidemia: part 1-full report. J Clin Lipidol 2015;9:129-169
14. Jacobson TA, Maki KC, Orringer CE, et al. National lipid association recommendations for patient-centered management of dyslipidemia: part 2. J Clin Lipidol 2015;9:S1–22.e1.
15. Jellinger PS, Handelsman Y, Rosenblit PD, et al. American association of clinical endocrinologist and american college of endocrinology guidelines for management of dyslipidemia and prevention of cardiovascular disease. Endocr Pract 2017;23:1–87.
16. Lloyd-Jones DM, Morris PB, Minissian MB, et al. 2016 ACC expert consensus decision pathway on the role of non-statin therapies for LDL-cholesterol lowering in the management of atherosclerotic cardiovascular disease risk: a report of the American college of cardiology task force on clinical expert consensus documents. J Am Coll Cardiol 2016;68:92–125.
17. Amarenco P, Bogousslavsky J, Callahan A 3rd, et al; Stroke Prevention by Aggressive Reduction in Cholesterol Levels (SPARCL) Investigators. High-dose atorvastatin after stroke or transient ischemic attack. N Engl J Med 2006;355:549–59.
18. Chaturvedi S, Zivin J, Breazna A, et al. Effect of atorvastatin in elderly patients with a recent stroke or transient ischemic attack. Neurology 2009;72:688–94.
19. Sever PS, Dahior B, Poulter NR, et al. Prevention of coronary and stroke events with atorvastatin in hypertensive patients who have average or lower-than-average cholesterol concentrations, in the Anglo-Scandinavian cardiac outcomes trial—lipid lowering arm (ASCOT-LLA): a multicentre randomised controlled trial. Lancet 2003;361:1149–58.
20. Scandinavian Simvastatin Survival Study Group. Randomised trial of cholesterol lowering in 4444 patients with coronary heart disease: the Scandinavian simvastatin survival study (4S). Lancet 1994;344:1383–9.
21. The Long-Term Intervention with Pravastatin in Ischaemic Disease (LIPID) Study Group. Prevention of cardiovascular events and death with pravastatin in patients with coronary heart disease and a broad range of initial cholesterol levels. N Engl J Med 1998;339:1349–57.
22. Sacks FM, Pfeffer MA, Moye LA, et al. The effect of pravastatin of coronary events after myocardial infarction in patients with average cholesterol levels. N Engl J Med 1996;335:1001–09.
23. Heart Protection Study Collaborative Group. MRC/BHF heart protection study of cholesterol lowering with simvastatin in 20,536 high-risk individuals: a randomised placebo-controlled trial. Lancet 2002;360:7–22.
24. Cannon CP, Braunwald E, McCabe CH, et al; Pravastatin or Atorvastatin Evaluation and Infection Therapy-Thrombolysis in Myocardial Infarction 22 Investigators. Intensive versus moderate lipid lowering with statins after acute coronary syndromes. N Engl J Med 2004;350:1495–04.
25. LaRosa JC, Grundy SM, Waters DD, et al; Treating to New Targets (TNT) Investigators. Intensive lipid lowering with atorvastatin in patients with stable coronary disease. N Engl J Med 2005;352:1425–35.
26. Deedwania P, Stone PH, Bairey CN, et al. Effects of intensive versus moderate lipid-lowering therapy on myocardial ischemia in older patients with coronary heart disease: results of the study assessing goals in the elderly (SAGE). Circulation 2007;115:700–7.
27. Han BH, Sutin D, Williamson JD, et al; ALLHAT Collaborative Research Group. Effect of statin treatment vs usual care on primary cardiovascular prevention among older adults: the ALLHAT-LLT randomized clinical trial. JAMA Intern Med 2017;177:955–65.
28. Ridker PM, Danielson E, Fonseca FA, et al; JUPITER Study Group. Rosuvastatin to prevent vascular events in men and women with elevated C Reactive protein. N Engl J Med 2008; 359:2195–207.
29. Glynn RJ, Koenig W, Nordestgaard BG, et al. Rosuvastatin for primary prevention in older persons with elevated C-reactive protein and low to average low-density lipoprotein cholesterol levels: Exploratory analysis of a randomized trial. Ann Intern Med 2010;152:488–96.
30. Colhoun HM, Betteridge DJ, Durrington PN, et al. Primary prevention of cardiovascular disease with atorvastatin in type 2 diabetes in the collaborative atorvastatin diabetes study (CARDS): multicentre randomised placebo-controlled trial. Lancet 2004;364:685–96.
31. Neil HA, DeMicco DA, Luo D, et al. Analysis of efficacy and safety in patients aged 65-75 years at randomization: collaborative atorvastatin diabetes study (CARDS). Diabetes Care 2006;29:2378–84.
32. Yusuf S, Bosch J, Dagenais G, et al; HOPE-3 Investigators. Cholesterol lowering in intermediate-risk persons without cardiovascular disease. N Engl J Med 2016;374:2021–31.
33. Savarese G, Gotta AM Jr, Paolillo S, et al. Benefits of statins in elderly subjects without established cardiovascular disease: a meta-analysis. J Am Coll Cardiol 2013;62:2090–99.
34. National Institute of Health. A clinical trial of STAtin therapy for reducing events in the elderly (STAREE). Clinical Trials. https://clinicaltrials.gov/ct2/show/NCT02099123. Accessed June 5, 2018.
35. Gaist D, Rodríquez, LA, Huerta C, et al. Lipid-lowering drugs and risk of myopathy: a population-based follow-up study. Epidemiology 2001;12:565–9.
36. Pasternak RC., Smith SC Jr, Bairey-Merz CN, et al. ACC/AHA/NHLBI clinical advisory on the use and safety of statins. J Am Coll Cardiol 2002;40:567–72.
37. Cohen JD, Brinton EA, Ito MK, Jacobson TA. Understanding statin use in America and gaps in patient education (USAGE): an internet-based survey of 10,138 current and former statin users. J Clin Lipidol 2012;6:208–15.
38. Harper CR, Jacobson TA. Evidence-based management of statin myopathy. Curr Atheroscler Rep 2010;12:322–30.
39. Bruckert E, Hayem G, Dejager S, et al. Mild to moderate muscular symptoms with high-dosage statin therapy in hyperlipidemic patients—the PRIMO study. Cardiovasc Drugs Ther 2005;19:403–14.
40. Ahmad Z. Statin intolerance. Am J Cardiol 2014;113:1765–71.
41. Food and Drug Administration. FDA drug safety communication: important safety label changes to cholesterol-lowering statin drugs. www.fda.gov/Drugs/DrugSafety/ucm293101.htm. Published February 28, 2012. Accessed June 5, 2018.
42. Gauthier JM, Massicotte A. Statins and their effect on cognition: let’s clear up the confusion. Can Pharm J (Ott) 2015;148:150–55.
43. Baigent C, Landray MJ, Reith C, et al. The effects of lowering LDL cholesterol with simvastatin plus ezetimibe in patients with chronic kidney disease (study of heart and renal protection): a randomised placebo-controlled trial. Lancet 2011;377:2181–92.
44. Vaziri ND, Anzalone DA, Catini J. Statins in chronic didney disease: when and when not to use them. J Fam Pract 2016;65:8 Suppl. www.mdedge.com/jfp/custom/statins-chronic-kidney-disease-when-and-when-not-use-them-1
45. Jose J. Statins and its hepatic effects: newer data, implications, and changing recommendations. J Pharm Bioallied Sci 2016;8:23–8.
46. Caro J, Klittich W, McGuire A, et al. The West of Scotland coronary prevention study: Economic benefit analysis of primary prevention with pravastatin. BMJ 1997;315:1577–82.
47. Schectman G, Wolff N, Byrd JC, et al. Physician extenders for cost-effective management of hypercholesterolemia. J Gen Intern Med 1996;11:277–86.
48. Johannesson M, Jonsson B, Kjekshus J, et al. Cost effectiveness of simvastatin treatment to lower cholesterol levels in patients with coronary heart disease. Scandinavian simvastatin survival study group. N Engl J Med 1997;336:332–6.
49. Odden MC, Pletcher MJ, Coxson PG, et al. Cost-effectiveness and population impact of statins for primary prevention in adults aged 75 years or older in the United States. Ann Intern Med 2015;162:533–41.
50. Cannon CP, Blazing MA, Giugliano RP, et al; IMPROVE-IT Investigators. Ezetimibe added to statin therapy after acute coronary syndromes. N Engl J Med 2015;372:2387–97.
51. Polisecki E, Peter I, Robertson M, et al. Genetic variation at the PCSK9 locus moderately lowers low-density lipoprotein cholesterol levels, but does not significantly lower vascular disease risk in an elderly population. Atherosclerosis 2008;200:95–101.
52. Sabatine MS, Giugliano RP, Keech AC, et al; FOURIER Steering Committee and Investigators. Evolocumab and clinical outcomes in patients with cardiovascular disease. N Engl J Med 2017;376:1713–22.
53. Sinthupoom N, Prachayasittikul V, Prachayasittikul S, et al. Nicotinic acid and derivatives as multifunctional pharmacophores for medical applications. Eur Food Res Technol 2015;240: 1–17.
54. Canner PL, Berge KG, Wenger NK, et al. Fifteen year mortality in coronary drug project patients: long-term benefit with niacin. J Am Coll Cardiol 1986;8:1245–55.
55. AIM-HIGH Investigators. Niacin in patients with low HDL cholesterol levels receiving intensive statin therapy. N Engl J Med 2011;365:2255–67.
56. HPS2-THRIVE Collaborative Group, Landray MJ, Haynes R, et al. Effects of extended-release niacin with laropiprant in high-risk patients. N Engl J Med 2014;371:203–12.
57. National Cholesterol Education Program (NCEP) Expert Panel on Detection, Evaluation, and Treatment of High Blood Cholesterol in Adults (Adult Treatment Panel III). Third report of the expert panel on detection, evaluation, and treatment of high blood cholesterol in adults (adult treatment panel III) final report. Circulation 2002;106:3143–421.
58. The lipid research clinics coronary primary prevention trial results. I. Reduction in incidence of coronary heart disease. JAMA 1984;251:351–64.
From the Harrison School of Pharmacy, Auburn University, Mobile, AL.
Abstract
- Objective: To summarize the literature relevant to managing dyslipidemia in the elderly and review recommendations for initiating lipid-lowering therapy.
- Methods: Review of the literature.
- Results: Statins are the most commonly utilized medication class for lipid-lowering in the general population, and they are recommended for primary prevention in patients between the ages of 40 to 75 with at least 1 risk factor for cardiovascular disease as well as for any patient needing secondary prevention. In the elderly, statins may be appropriate for both primary and secondary prevention if the benefits outweigh the risks. Based on the available evidence, it is safe to recommend statin therapy to elderly patients who require secondary prevention given the known benefits in reducing cardiovascular morbidity and mortality for patients up to the age of 80. For primary prevention, statin therapy may be beneficial, but one must carefully evaluate for comorbid conditions, life expectancy, concomitant medications, overall health status, frailty, and patient or family preference. Several other classes of lipid-lowering agents exist; however, there is not enough evidence for us to recommend use in the elderly population for cardiovascular risk reduction in either primary or secondary scenarios.
- Conclusion: Although clinical research in the elderly population is limited, evidence supports the use of statins in elderly patients for secondary prevention and in patients up to age 75 for primary prevention; however clinicians must use clinical judgement and take into consideration the patient’s situation regarding comorbidities, polypharmacy, and possible adverse effects. More high-quality evidence is necessary.
Key words: hyperlipidemia; geriatrics; elderly; patient-centered care; statin; cardiovascular disease.
The number of Americans age 65 years and older is projected to more than double, from 46 million today to over 98 million by 2060, and the 65-and-older age group’s share of the total population will rise to nearly 24% [1]. Life expectancy is now predicted to be > 20 years for women at age 65 and > 17 years for men at age 65 in many high-income countries, including the United States [2]. This demographic shift toward an older population will result in a higher burden of coronary heart disease and stroke, with atherosclerotic cardiovascular disease (ASCVD) prevalence and costs projected to increase substantially [3].
Among adults seeking medical care in the United States, roughly 95 million have a total cholesterol (TC) level of ≥ 200 mg/dL or more, and approximately 29 million have a TC > 240 mg/dL [4]. Cholesterol screening is important since most patients suffering from dyslipidemia are asymptomatic. Dyslipidemia is a major risk factor for the development of atherosclerotic disease. Because of the complications associated with dyslipidemia, it is vital that patients are provided with primary and/or secondary prevention strategies to reduce the risk of cardiovascular disease (CVD) and protect high-risk patients from recurring events. A clinical controversy exists surrounding the elderly population, concerning whether or not clinicians should be providing lipid-lowering treatment to this group of individuals for dyslipidemia. The evidence is limited for patients over age 65, and even more so for the very elderly (> 80 years); therefore, it is necessary to review the available evidence to make an appropriate decision when it comes to managing dyslipidemia in the elderly population
Currently, HMG-CoA reductase inhibitors (statins) are the only known class of medications for the treatment of dyslipidemia that will prevent both primary and secondary cardiovascular (CV) events, including death. Statin intensity (Table 1)
Guideline Recommendations
Current guidelines differ in their recommendations for treating dyslipidemia in the elderly population. In 2016, the Task Force for the Management of Dyslipidemias of the European Society of Cardiology (ESC) and the European Atherosclerosis Society (EAS) released updated guidelines for managing dyslipidemia. These guidelines recommend that older patients with established CVD be treated in the same way as younger patients because of the many benefits statin therapy demonstrated in clinical trials. They also suggest that statin therapy be started at a lower doses to achieve goals for primary prevention in the older population. In addition, CVD risk factors (hypertension, diabetes, dyslipidemia, smoking) should be addressed in this population to reduce CVD risk. They also acknowledged that primary prevention may not prolong life in the older adult, but treatment does reduce cardiovascular mortality and statin therapy is recommended to reduce the overall risk of CV morbidity in this population [11]. In contrast, The 2013 American College of Cardiology/American Heart Association (ACC/AHA) guidelines changed the management and treatment of dyslipidemia by highlighting “statin benefit groups” rather than recommending a treat-to-target goal as guidelines had done for many years. ACC/AHA recommends a moderate-intensity statin for patients > 75 years of age for secondary prevention versus the use of a high-intensity statin for patients who are between the ages of 40 and 75 based on the pooled cohort risk equation. In patients over age 75 with no history of CVD, no specific recommendation is available for the use of lipid-lowering therapy at this time [12]. ACC/AHA is expected to publish a new set of guidelines sometime in 2018 and they are projected to utilize lipid-lowering goals in combination with the pooled cohort equation to assess overall risk in patients with dyslipidemia.
The 2015 National Lipid Association (NLA) released “Part 1” guidelines for the management of dyslipidemia and then provided “Part 2” about a year later, which focuses on management for special populations. To summarize, the NLA guidelines recommend that elderly patients between the ages of 65 and 80 receive a high-intensity statin for secondary prevention after special consideration of the potential risks and benefits. In patients over the age of 80, NLA recommends a moderate-intensity statin for secondary prevention. For primary prevention, NLA recommends utilizing the pooled cohort risk equation to analyze patient characteristics, keeping in mind that age is a driving factor for increased risk of CVD and that the actual risk for developing a CV event may be “overestimated” if the patient has no other risk factors other than their age. When evaluating patients between the ages of 65 and 79 for primary prevention, NLA suggests following Part 1 of the guidelines. In Part 1, NLA recommends evaluating the patient’s characteristics and suggests a moderate- or high-intensity statin if the patient is considered “very high risk” or “high risk” and a moderate-intensity statin for patients who are considered “moderate risk”. For patients over the age of 80, they recommend utilizing a moderate- or a low-intensity statin depending on frailty status or if significant comorbidities or polypharmacy exist [13,14].
In 2017, the American Association of Clinical Endocrinologist (AACE) released guidelines for the management of dyslipidemia and CVD prevention. AACE recommends that patients over age 65 be screened for dyslipidemia, and those who have multiple risk factors, other than age, should be considered for treatment with lipid-lowering therapy. AACE focuses on specific target LDL-C levels as treatment goals [15].
In addition to statins, other lipid-lowering therapies are used to treat dyslipidemia. The 2016 American College of Cardiology (ACC) Task Force reported on the use of non-statin therapies for the management of dyslipidemia and prevention of clinical ASCVD [16]. The committee concluded that ezetimibe added to statin therapy, bile acid sequestrants as monotherapy, and niacin as monotherapy all have some benefit for the prevention of clinical ASCVD. These guidelines also discuss the use of PCSK-9 inhibitors and their potential to decrease the risk of clinical ASCVD, but trials are currently ongoing to determine actual benefit. These guidelines address special populations but they do not consider the elderly in their recommendations. Currently, the only special populations included are patients with heart failure, those on hemodialysis, women who are of childbearing age or pregnant, and those with autoimmune diseases [16]. The literature available for each individual medication is discussed in further detail below.
Evidence for Secondary Prevention
The benefits of statin therapy for secondary prevention in the elderly is more established than it is for primary prevention (Table 2).
The ASCOT–LLA (Anglo-Scandinavian Cardiac Outcomes Trial–Lipid Lowering Arm), published in 2003, evaluated the effect of atorvastatin 10 mg on reducing ASCVD events in moderate-risk patients between 40–79 years of age who had hypertension and normal or slightly elevated LDL-C levels, with at least 2 other risk factors for CVD (age > 55 years was considered a risk factor). The primary outcome was non-fatal MI including silent MI and fatal CHD. A significant reduction was seen in the primary endpoint. Over half of the study population was > 60 years of age, with a mean age of 63 years. In a post-hoc analysis, stroke prevention was found to be similar in patients who were > 70 years of age and those < 70 years of age [19].
One of the first trials to specifically analyze the impact of age on lipid-lowering therapy in secondary ASCVD prevention was the Scandinavian Simvastatin Survival Study (4S), published in 1994. They evaluated the effect of simvastatin 20 mg on CV-related mortality and morbidity in patients 35–70 years of age with hyperlipidemia and a history of angina or acute MI occurring > 6 months of the study starting. The primary outcome was all-cause mortality. The secondary endpoint was time to first major CV event, which included coronary death, non-fatal acute MI, resuscitated cardiac arrest, and silent MI. Simvastatin significantly reduced the primary outcome and CHD-related deaths. A subgroup analysis of the study population > 60 years of age showed that age made no significant impact on primary or secondary outcomes; however, investigators noted that these subgroup analyses had less statistical power than the population as a whole [20].
Published in 1998, the LIPID (Long-Term Intervention with Pravastatin in Ischemic Disease) study evaluated the effects of pravastatin 40 mg daily on CHD-related mortality and overall mortality in patients with hyperlipidemia and clinical ASCVD (previous MI or unstable angina). The primary outcome observed was fatal CHD. Pravastatin significantly reduced the primary outcome, overall mortality, and pre-specified CV events. In a subgroup analysis, age group ( 65, and > 70 years) had no significant impact on the combined outcome of death from CHD and nonfatal MI; however, patients 65 to 70 years of age made up less than half of the study population [21].
The Cholesterol and Recurrent Events (CARE) trial, published in 1996, looked at the effect of pravastatin 40mg therapy for secondary ASCVD prevention following an MI in patients who had average cholesterol levels (defined as TC < 240 mg/dL and LDL-C 115–174 mg/dL). The primary endpoint assessed was time to fatal CHD or nonfatal MI. To meet statistical power they looked at subgroups for a broader outcome of a major coronary event (including fatal CHD, nonfatal MI, bypass surgery, and angioplasty). Pravastatin significantly reduced the primary outcome. The significant reduction in coronary events produced by pravastatin was noted to be significantly greater in women and in patients with higher pretreatment levels of LDL-C, but was not significantly impacted by age group (24–59 vs. 60–75 years) [22].
The Heart Protection Study (HPS), published in 2002, looked at the long-term effects of lowering LDL-C with simvastatin 40 mg in patients 40 to 80 years of age at high risk for mortality due to either vascular or nonvascular causes. The primary outcome assessed was all-cause mortality, with fatal or nonfatal vascular events as co-primary outcomes for subcategory analyses. Simvastatin significantly reduced both primary and co-primary outcomes, but there was no significant difference when they looked at nonvascular mortality between groups. Neither age nor baseline LDL levels were reported to have had a significant impact on outcomes. Over half the population was > 65 years of age, and about one-third of the population was > 70 years of age [23].
The PROVE-IT/TIMI 22 (Pravastatin or Atorvastatin Evaluation and Infection Therapy–Thrombolysis in Myocardial Infarction 22) trial, published in 2004, compared pravastatin 40 mg (moderate-intensity) to atorvastatin 80 mg (high-intensity) for secondary ASCVD prevention in patients with recent acute coronary syndrome (ACS) 65 years of age and the mean age was 58 years [24].
The TNT (Treating to New Targets) trial, published in 2005, looked at secondary ASCVD prevention in regards to targeting LDL-C levels to < 100 mg/dL or < 70 mg/dL with atorvastatin 10 mg and atorvastatin 80 mg. Patients had stable coronary artery disease (CAD) and baseline LDL-C levels < 130 mg/dL. The primary endpoint was the occurrence of a CV event (CAD mortality, nonfatal MI not related to procedure, resuscitation after cardiac arrest, or fatal or nonfatal stroke). High-intensity atorvastatin (80 mg) significantly reduced the primary outcome. The mean age of the study population was approximately 61 years. The study reported no statistical interaction for age or sex in the primary outcome measure [25].
The Study Assessing Goals in the Elderly (SAGE), published in 2007, evaluated the effects of pravastatin 40 mg (moderate-intensity) vs atorvastatin 80 mg (high-intensity) on secondary ASCVD prevention in patients 65 to 85 years (mean age 72) with stable CHD, LDL-C 100–250 mg/dL, with at least 1 episode of myocardial ischemia with total ischemia duration > 3 minutes. The primary efficacy outcome observed was absolute change in total duration of myocardial ischemia on 48-hour ambulatory electrocardiographic monitoring from baseline to month 12. No significant difference was observed in efficacy between the two groups for the primary endpoint, but the intensive statin therapy group showed greater benefit respective to several secondary outcomes, including major acute CV events and death [26].
In summary, while these trials provide evidence that statin therapy is beneficial in a wide range of patients with clinical ASCVD and dyslipidemia, the trial data does not provide definitive guidance for treating elderly patients at this time. Given the small percentage of elderly patients that were included, some of the trial results reporting statistical significance in this age group hold less clinical significance. It appears that high-intensity statin therapy was more likely to effectively prevent clinical ASCVD and death than moderate-intensity statin therapy, but more evidence is needed regarding secondary prevention in patients over age 75.
Evidence for Primary Prevention
The PROSPER (PROspective Study of Pravastatin in the Elderly at Risk) was published in 2002 to assess the efficacy of pravastatin in patients between the ages of 70 and 82 (mean age 75 years) with pre-existing vascular disease (coronary, cerebral, or peripheral) or at an elevated risk (smoking, hypertension, or diabetes). Patients were randomized to receive either placebo or pravastatin 40 mg (a moderate-intensity statin). They found that pravastatin therapy reduced the risk of the composite outcome of CHD-related death, nonfatal MI, and fatal or nonfatal stroke in this elderly population. A post-hoc analysis comparing primary versus secondary prevention groups found no significant differences between these subgroups [7].
Han et al recently conducted a post hoc secondary analysis of older participants (65 years and older) in the Antihypertensive and Lipid-Lowering Treatment to Prevent Heart Attack Trial–Lipid-Lowering Trial (ALLHAT-LLT). The intervention for ALLHAT-LLT was 40 mg pravastatin. They found no significant differences in all-cause mortality or cardiovascular outcomes between the pravastatin and usual care groups [27]
JUPITER (Justification for Use of Statins in Prevention: An Intervention Trial Evaluating Rosuvastatin), published in 2008, examined the efficacy of rosuvastatin vs. placebo in low- to moderate-risk men 50 years and older and women 60 years and older using a composite outcome of MI, unstable angina, stroke, arterial revascularization, or CVD death. Rosuvastatin did significantly decrease the primary endpoint, however it did not reduce the risk of overall death [28]. A subgroup analysis was performed on the elderly (65–75 years) study participants in JUPITER demonstrating a significant risk reduction for the combined CV endpoint and a nonsignificant reduction of all-cause mortality [29].
CARDS (Collaborative Atorvastatin Diabetes Study), published in 2004, looked at statin use for primary prevention in high-risk patients with type 2 diabetes without high LDL-C, but they had to have at least 1 additional risk factor for CVD. The primary outcome was first acute CHD event (myocardial infarction including silent infarction, unstable angina, acute coronary heart disease death, resuscitated cardiac arrest), coronary revascularization procedures, or stroke. Atorvastatin 10 mg, a moderate-intensity statin, significantly decreased occurrence of the primary outcome [30]. A subgroup analysis was performed to evaluate patients specifically between the ages of 65 and 75 and found a similar outcome in the elderly with a significant reduction in first major CV event and stroke [31].
A recent study evaluating primary prevention in patients with an intermediate risk for CVD was the HOPE-3 (Heart Outcomes Prevention Evaluation), published in 2016. Two co-primary outcomes were evaluated: the composite of death from cardiovascular causes, nonfatal myocardial infarction, or nonfatal stroke, while the second primary outcome also included revascularization, heart failure, and resuscitated cardiac arrest. Rosuvastatin significantly decreased occurrence of both co-primary endpoints. About half of the study populations was over the age of 65 with a median age of 71 [32].
In addition to these trials of primary prevention, summarized in Table 3, a meta-analysis was published in 2013 to assess whether statins reduce all-cause mortality and CV events in elderly people without established CV disease.
As demonstrated by the above studies, it is evident that statins do help reduce the risk of CV events, regardless of statin intensity, but they do not consistently prevent death. However, the trials that did not demonstrate a significant outcome related to death utilized a moderate-intensity statin; if a high-intensity statin was used in those trials, there may have been a benefit [7,27]. More study is needed to evaluate the use of high-intensity statins in the elderly for the prevention of all-cause mortality and CV-related death.
Fortunately, the ongoing STAREE (STAtin Therapy for Reducing Events in the Elderly) study is looking specifically at the impact of statin therapy in adults 70 and older. Patients with a history of CVD or dementia are excluded. Results are set to be released in 2020 [34].
Risks of Using Statins in Older Adults
Statin use has been linked to a number of unwanted adverse effects.
Myalgia
Myalgia is variable but may occur in up to 25% of patients using statin therapy, and elderly patients typically experience more statin-associated myalgia than younger patients [35,36]. Elderly patients are more prone to decreased muscle mass and therefore may be at a higher risk of developing myalgia pain. Elderly patients are also utilizing more medications, leading to the potential for increased drug-drug interactions that could lead to myalgia. Elderly patients may also lose the function of drug metabolizing enzymes responsible for breaking down statin therapy, which may also increase the risk for statin-associated myalgia. One study demonstrated that elderly patients were more likely to discontinue statin therapy due to muscle pain and elderly patients reported more muscle side effects than their younger cohorts [37]. It is important to monitor for muscle pain and weakness in every patient. If they experience any myalgia, it is recommended to either lower the dose or discontinue the statin once it is determined to be statin-related. After myalgia resolves, therapy can be reinitiated at a lower dose or with a different statin if the patient is deemed high-risk. If creatine phosphokinase levels are greater than 10 times above the upper limit of normal, then discontinue the statin and wait for levels to return to normal. Re-initiation may be appropriate, but the the risks and benefits must be weighed. Simvastatin and atorvastatin are associated with higher rates of myalgia while pravastatin and rosuvastatin have the least myalgia pain associated with use [38,39].
Statin Intolerance
Statin intolerance, while not very common, is typically seen more often in special populations such as women, Asian patients, and the elderly. For a patient to be considered intolerant to statins, they need to have documented muscle symptoms or an elevated creatine phosphokinase level. Although not well defined, many clinicians consider improvement of symptoms with statin withdrawal as a diagnosis for statin intolerance. Typically patients are then rechallenged with 1 to 2 other statins and if still unable to tolerate, then different lipid-lowering therapies may be utilized [40]. In the elderly, it is important to rule out other causes for myalgia and monitor for significant drug interactions that may lead to muscle pain, particularly if the patient is requiring secondary prevention with statin therapy, before discontinuation.
Dementia
In 2012, the FDA issued a warning about the potential risk of cognitive impairment with the use of statins, which was based on case reports, not clinical trial data [41]. The NLA guidelines do not recommend baseline cognitive assessments prior to starting therapy and recommend that if patients do report cognitive impairment, other contributing factors and the risk associated with stopping statin therapy must be considered. Statin therapy may be discontinued to assess reversibility of symptoms, and if symptoms resolve, then it may be more beneficial to keep the patient off statin therapy. Clinicians may also consider lowering the dose or switching to another statin if they feel it is necessary for the patient to continue with a statin, particularly if the patient requires secondary prevention. Evidence suggests that statins are not associated with adverse effects on cognition and should not be withheld due to the potential for causing cognitive impairment alone [42]. The prevalence of cognitive impairment increases with age, so it is important for a clinician to rule out age-related processes or other disease states, such as Alzheimer’s, before discontinuation of previously tolerated statin therapy.
Renal Impairment
Kidney function must be evaluated prior to initiation of a statin in an elderly person as well as during the time the patient is taking a statin. Because statins are eliminated via the kidney, and because most elderly patients have decreased kidney function, the potential for drug build-up in the body is higher than in a younger patient and may lead to more adverse effects. Atorvastatin is the only option that does not require dose adjustment. All other statins should be adjusted based upon the level of renal impairment. The results from the SHARP study, published in 2011, showed that the combination of ezetimibe and simvastatin versus placebo significantly reduced ASCVD events in patients with moderate to severe chronic kidney disease, including those receiving dialysis. Specifically, this trial showed a significant reduction of ischemic events and occurrence of arterial revascularization procedures. Although the trial did not show a significant difference in incidence of MI or CHD-related mortality, the trial was not adequately powered to show differences in results among the individual ASCVD events and it is not clear whether the results can guide the use of statin therapy in all patients with chronic kidney disease [43]. Statins may be beneficial in renal insufficiency to lower LDL-C, but more studies are needed to assess CVD outcomes related to statin use in patients with a history of kidney disease [44].
Hepatic Function
Statins have been known to increase liver enzymes and in rare cases lead to liver injury, which typically has led to underutilization of therapy in clinical practice. Risk factors associated with this include preexisting hepatitis, advanced age, chronic alcohol use, and use of concomitant medications that may also cause hepatotoxicity, such as acetaminophen. When a statin-induced hepatic effect is suspected, it is important to first rule out other causes or disease states that may be undiagnosed. If no other cause can be found, clinicians may choose to reduce the statin dose, switch the statin, or discontinue the statin altogether if the risk outweighs the benefit. Additionally, statins do not have to be held in patients who have preexisting hepatic dysfunction if use is clearly indicated because the cardiovascular benefits typically outweigh the risks of causing liver injury. Clinical judgement is still warranted and patients with preexisting liver conditions should be monitored regularly [45].
Cost Considerations
Several studies have demonstrated that statin therapy, in the general population, is economical for both primary and secondary prevention of CVD [46,47]. The 4S study found simvastatin therapy to be cost-effective; for example, the cost per life year gained for a 70-year-old man with high chlesterol was $3800 [48]. In contrast, primary prevention in middle-aged men, based on the West of Scotland trial, averages about $35,000 per year of life gained [46]. In a 2015 study that utilized an established Markov simulation model, researchers studied adults 75 to 94 years and examined the cost-effectiveness of generic statins for primary prevention in this population. The authors estimated treating this population with statins over the next decade would be cost-effective. However, the researchers cautioned that the CV benefits and cost-effectiveness would be offset with even a modest increased risk of cognitive impairments or functional limitations. Statin use was not cost-effective in diabetes patients who did not have elevated LDL-C levels [49].
Non-Statin Therapies
Several other classes of medications are available for the management of hyperlipidemia; however, none of these lipid-lowering therapies have been found to reduce CVD events or mortality in the elderly population.
Ezetimibe
Ezetimibe blocks the absorption of intestinal cholesterol and is typically combined with statin therapy to lower LDL-C. Up until the IMPROVE-IT trial was published in 2015, ezetimibe did not have much use in clinical practice. This landmark trial was a large double-blind study that looked at secondary prevention in patients with ACS, comparing ezetimibe 10 mg and simvastatin 40 mg versus simvastatin 40 mg alone. The authors included patients over the age of 50 (mean age 64) with clinical ASCVD. They found that the addition of ezetimibe to simvastatin did reduce the primary composite outcome (CV mortality, major CV events, or nonfatal stroke) when compared to simvastatin alone [50]. This trial demonstrates clinical benefit with the addition of ezetimibe to statin therapy and adds additional evidence to support a target LDL-C of less than 70 mg/dL; however, the elderly population was not adequately represented in the study to allow extrapolation of these results to older patients.
PCSK-9 Inhibitors
The proprotein convertase subtilisin/kexin type 9 (PCSK-9) inhibitors are a newer class of monoclonal antibodies that were first approved by the US Food and Drug Administration in 2015. Alirocumab and evolocumab, both approved PCSK-9 inhibitors, bind to LDL receptors on the surface of hepatocytes and assist in the internalization of LDL receptors for lysosomal degradation. By inhibiting the binding of PCSK-9 to the LDL receptors, there is an overall increase in LDL receptors available on the cell surface to bind to LDL particles, thereby lowering LDL-C levels. Treatment with these agents are currently considered (in addition to diet and maximally tolerated statin therapy) in adult patients with heterozygous familial hypercholesterolemia or clinical ASCVD requiring further reduction in LDL-C. Two studies were published focusing on the use of PCSK-9 inhibitors: Open-label Study of Long-term Evaluation against LDL Cholesterol (OSLER) and the Tolerability of Alirocumab in High Cardiovascular Risk Patients with Hypercholesterolemia Not Adequately Controlled with Their Lipid Modifying Therapy (ODYSSEY LONG TERM). Overall, these studies demonstrated a 60% reduction of LDL-C among patients with high CVD risk on maximum-tolerated statin therapy. Furthermore, the ODYSSEY LONG TERM trial did find that the rate of major CVD adverse events was significantly lower with alirocumab added to maximum-tolerated statin therapy, with a hazard ratio of 0.52 [51].
One recent study of evolocumab, named the Further Cardiovascular OUtcomes Research with PCSK9 Inhibition in Subjects with Elevated Risk (FOURIER), enrolled patients between the ages of 40 and 85 with 1 major CV risk factor or 2 minor CV risk factors. The primary endpoint was a composite of cardiovascular death, MI, stroke, hospitalization for unstable angina, or coronary revascularization. Evolocumab lowered major CV events by roughly 15% when added to statin therapy in patients who were at high risk for clinical ASCVD. The mean age of the patients in the trial was 63; however, it is unclear how many of the study participants were elderly [52].
Unfortunately, the studies discussed above do not represent the elderly population well and the agents have not been studied long-term to determine the effects of continued use beyond 2 years. Long-term outcome studies are currently underway; however, it is unknown at this time whether elderly patients are being considered in these studies. It is known that genetic variation of the PCSK-9 locus does lower LDL-C in the elderly but does not significantly lower their risk of vascular disease [51]. At this time, until further evidence is available, we do not recommend the use of PCSK-9 inhibitors in elderly patients.
Nicotinic Acid
Nicotinic acid (Niacin, Niacin ER), also known as vitamin B3, has been utilized for decades as a vitamin supplement, an anti-wrinkle agent, and is known to have neuroprotective effects. It has also been utilized for dyslipidemia and has had some benefits when used alone to decrease cardiovascular disease [53]. Unfortunately the Coronary Drug Project was completed in the 1980s and did not incorporate patients over the age of 64, therefore making the results difficult to apply to elderly patients today [54]. Other literature has been published in recent years to refute that study, claiming there is no additional benefit to using niacin for cardiovascular protection and these studies have included elderly patients. In the AIM-HIGH trial, published in 2011, approximately 46% of the patients were 65 or older. Patients who were previously taking statin therapy that had known cardiovascular disease were enrolled. Niacin added to simvastatin 40–80 mg lowered LDL-C, triglycerides, and increased HDL-C, but the addition of niacin was not proven to help lower the risk of cardiovascular events [55]. The HPS2-THRIVE study enrolled patients with known cardiovascular disease between the ages of 50 and 80 years and found no benefit in preventing CVD when adding niacin to statin therapy [56]. With its side effect profile, risk for increased glucose intolerance, and lack of evidence to demonstrate benefit for prevention of CV events, we do not recommend niacin for use in the elderly at this time.
Bile Acid Sequestrants
The ATP III guidelines [57] noted that when statins are not sufficient to lower high cholesterol, bile acid sequestrants also known as resins could be added. More recently, the 2016 ACC expert consensus on non-statin therapies for LDL-C lowering [16] stated resins may be considered in select circumstances as a second-line agent for adults with ezetimibe intolerance and with triglycerides
Fibrates
While fibrates (gemfibrozil, fenofibrate, clofibrate) have not been studied to demonstrate a reduction in CVD or CVD mortality in the elderly population, this medication class is beneficial in patients with hypertriglyceridemia to lower triglyceride levels and prevent pancreatitis. Fibrates are recommended for patients with triglyceride levels approaching 500 mg/dL. Fibrates can also increase high-density lipoproteins, which tend to be lower in the elderly population and considered a risk factor for CVD. Gemfibrozil is not recommended in combination with statin therapy due to an increased risk of myalgia. Fenofibrate is the drug of choice, particularly for diabetic patients with very uncontrolled triglyceride levels because it will not affect glucose levels [57]. At this time, we do not recommend the use of fibrates in the elderly population unless they are at risk for developing pancreatitis and have elevated triglyceride levels.
Patient-Centered Care
Evidence-based medicine can aid in making sound clinical decisions for proper patient care; however, treatment plans should consider the individual patient’s perspectives and needs, beliefs, expectations, and goals. In the elderly population, we must also consider factors such as finances, pill-burden, drug-drug interactions, physiological needs, comorbid disease states, and overall life expectancy. In addition, the elderly population is physiologically heterogeneous group and recommendations for therapy need to be individualized. Chronological age does not necessarily correspond to vascular age and risk factors for cardiovascular disease do not predict outcomes as well in the elderly as they do in younger patients. While older patients may view having to take 1 less medication as more important than preventing a heart attack or stroke at the age of 80, it is advisable to discuss all potential outcomes related to morbidity associated with the occurrence of an MI or stroke due to the lack of statin therapy. Additionally, pharmacists can play a vital role in evaluating elderly patients and their medication regimens. Elderly patients should undergo a medication reconciliation at each visit to evaluate drug-drug interactions, side effects, and potentially harmful medication combinations that may lead to increased adverse drug outcomes.
Conclusion
CHD increases with age, and most patients who have a CV event are more likely to die with advancing age. Based on the the limited available evidence, statin therapy is beneficial in the elderly population in reducing overall CV morbidity. We recommend beginning with with a moderate-intensity statin and adjusting accordingly. High-intensity statin therapy appears to be effective for elderly patients for secondary prevention, but clinicians should use clinical judgment and monitor for adverse events, particularly myalgia pain. At this time, we are unable to determine if non-statin therapies for the elderly would be beneficial and do not recommend their use unless the patient is at risk for pancreatitis, in which case a fenofibrate is recommended.
Corresponding author: Nicole A. Slater, PharmD, BCACP, Auburn University, Harrison School of Pharmacy, 650 Clinic Dr., Mobile, AL 36688.
Financial disclosures: None.
1. Fact sheet: Aging in the United States. Accessed at www.prb.org/aging-unitedstates-fact-sheet/.
2. Kontis JE, Bennett CD, Mathers G, et al. Future life expectancy in 35 industrialised countries: projections with a Bayesian model ensemble. Lancet 2017;389:1323–35.
3. Odden MD, Coxson PG, Moran A, et al. The impact of the aging population on coronary heart disease in the United States. Am J Med 2011;124:827–33.
4. Benjamin EJ, Blaha MJ, Chiuve SE, et al. Heart disease and stroke statistics—2017 update: a report from the American Heart Association. Circulation 2017;135:e1–e458.
5. Mills EJ, Rachlis B, Wu P, et al. Primary prevention of cardiovascular mortality and events with statin treatments: a network meta-analysis involving more than 65,000 patients. J Amer Col Cardiol 2008;52:1769–81.
6. Stone NJ. Statins in secondary prevention: intensity matters. J Am Coll Cardiol 2017;69: 2707–9.
7. Shepherd J, Blauw GJ, Murphy MB, et al; PROSPER study group. PROspective Study of Pravastatin in the Elderly at Risk. Pravastatin in elderly individuals at risk of vascular disease (PROSPER): a randomised controlled trial. Lancet 2002;360:1623–30.
8. Heart Protection Study Collaborative Group Writers. MRC/BHF Heart Protection Study of cholesterol lowering with simvastatin in 20,536 high-risk individuals: a randomised placebo-controlled trial. Lancet 2002;360:7–22.
9. Lefevre F, Nishida L. Special report: the efficacy and safety of statins in the elderly. TEC Assessment Program 2007;21
10. Pravastatin benefits elderly patients: results of PROSPER study. Cardiovasc J S Afr 2003;14:48.
11. Catapano AL, Graham I, Backer GD, et al. ESC/EAS Guidelines for the management of dyslipidaemias. Eur Heart J 2016;37:2999–3058.
12. Stone NJ, Robinson JG, Lichtenstein AH, et al. 2013 ACC/AHA guideline on the treatment of blood cholesterol to reduce atherosclerotic cardiovascular risk in adults: a report of the American College of Cardiology/American Heart Association Task Force on Practice Guidelines. J Am Coll Cardiol 2014;63:2889–934.
13. Jacobson TA, Ito MK, Maki K, et al. National lipid association recommendations for patient-centered management of dyslipidemia: part 1-full report. J Clin Lipidol 2015;9:129-169
14. Jacobson TA, Maki KC, Orringer CE, et al. National lipid association recommendations for patient-centered management of dyslipidemia: part 2. J Clin Lipidol 2015;9:S1–22.e1.
15. Jellinger PS, Handelsman Y, Rosenblit PD, et al. American association of clinical endocrinologist and american college of endocrinology guidelines for management of dyslipidemia and prevention of cardiovascular disease. Endocr Pract 2017;23:1–87.
16. Lloyd-Jones DM, Morris PB, Minissian MB, et al. 2016 ACC expert consensus decision pathway on the role of non-statin therapies for LDL-cholesterol lowering in the management of atherosclerotic cardiovascular disease risk: a report of the American college of cardiology task force on clinical expert consensus documents. J Am Coll Cardiol 2016;68:92–125.
17. Amarenco P, Bogousslavsky J, Callahan A 3rd, et al; Stroke Prevention by Aggressive Reduction in Cholesterol Levels (SPARCL) Investigators. High-dose atorvastatin after stroke or transient ischemic attack. N Engl J Med 2006;355:549–59.
18. Chaturvedi S, Zivin J, Breazna A, et al. Effect of atorvastatin in elderly patients with a recent stroke or transient ischemic attack. Neurology 2009;72:688–94.
19. Sever PS, Dahior B, Poulter NR, et al. Prevention of coronary and stroke events with atorvastatin in hypertensive patients who have average or lower-than-average cholesterol concentrations, in the Anglo-Scandinavian cardiac outcomes trial—lipid lowering arm (ASCOT-LLA): a multicentre randomised controlled trial. Lancet 2003;361:1149–58.
20. Scandinavian Simvastatin Survival Study Group. Randomised trial of cholesterol lowering in 4444 patients with coronary heart disease: the Scandinavian simvastatin survival study (4S). Lancet 1994;344:1383–9.
21. The Long-Term Intervention with Pravastatin in Ischaemic Disease (LIPID) Study Group. Prevention of cardiovascular events and death with pravastatin in patients with coronary heart disease and a broad range of initial cholesterol levels. N Engl J Med 1998;339:1349–57.
22. Sacks FM, Pfeffer MA, Moye LA, et al. The effect of pravastatin of coronary events after myocardial infarction in patients with average cholesterol levels. N Engl J Med 1996;335:1001–09.
23. Heart Protection Study Collaborative Group. MRC/BHF heart protection study of cholesterol lowering with simvastatin in 20,536 high-risk individuals: a randomised placebo-controlled trial. Lancet 2002;360:7–22.
24. Cannon CP, Braunwald E, McCabe CH, et al; Pravastatin or Atorvastatin Evaluation and Infection Therapy-Thrombolysis in Myocardial Infarction 22 Investigators. Intensive versus moderate lipid lowering with statins after acute coronary syndromes. N Engl J Med 2004;350:1495–04.
25. LaRosa JC, Grundy SM, Waters DD, et al; Treating to New Targets (TNT) Investigators. Intensive lipid lowering with atorvastatin in patients with stable coronary disease. N Engl J Med 2005;352:1425–35.
26. Deedwania P, Stone PH, Bairey CN, et al. Effects of intensive versus moderate lipid-lowering therapy on myocardial ischemia in older patients with coronary heart disease: results of the study assessing goals in the elderly (SAGE). Circulation 2007;115:700–7.
27. Han BH, Sutin D, Williamson JD, et al; ALLHAT Collaborative Research Group. Effect of statin treatment vs usual care on primary cardiovascular prevention among older adults: the ALLHAT-LLT randomized clinical trial. JAMA Intern Med 2017;177:955–65.
28. Ridker PM, Danielson E, Fonseca FA, et al; JUPITER Study Group. Rosuvastatin to prevent vascular events in men and women with elevated C Reactive protein. N Engl J Med 2008; 359:2195–207.
29. Glynn RJ, Koenig W, Nordestgaard BG, et al. Rosuvastatin for primary prevention in older persons with elevated C-reactive protein and low to average low-density lipoprotein cholesterol levels: Exploratory analysis of a randomized trial. Ann Intern Med 2010;152:488–96.
30. Colhoun HM, Betteridge DJ, Durrington PN, et al. Primary prevention of cardiovascular disease with atorvastatin in type 2 diabetes in the collaborative atorvastatin diabetes study (CARDS): multicentre randomised placebo-controlled trial. Lancet 2004;364:685–96.
31. Neil HA, DeMicco DA, Luo D, et al. Analysis of efficacy and safety in patients aged 65-75 years at randomization: collaborative atorvastatin diabetes study (CARDS). Diabetes Care 2006;29:2378–84.
32. Yusuf S, Bosch J, Dagenais G, et al; HOPE-3 Investigators. Cholesterol lowering in intermediate-risk persons without cardiovascular disease. N Engl J Med 2016;374:2021–31.
33. Savarese G, Gotta AM Jr, Paolillo S, et al. Benefits of statins in elderly subjects without established cardiovascular disease: a meta-analysis. J Am Coll Cardiol 2013;62:2090–99.
34. National Institute of Health. A clinical trial of STAtin therapy for reducing events in the elderly (STAREE). Clinical Trials. https://clinicaltrials.gov/ct2/show/NCT02099123. Accessed June 5, 2018.
35. Gaist D, Rodríquez, LA, Huerta C, et al. Lipid-lowering drugs and risk of myopathy: a population-based follow-up study. Epidemiology 2001;12:565–9.
36. Pasternak RC., Smith SC Jr, Bairey-Merz CN, et al. ACC/AHA/NHLBI clinical advisory on the use and safety of statins. J Am Coll Cardiol 2002;40:567–72.
37. Cohen JD, Brinton EA, Ito MK, Jacobson TA. Understanding statin use in America and gaps in patient education (USAGE): an internet-based survey of 10,138 current and former statin users. J Clin Lipidol 2012;6:208–15.
38. Harper CR, Jacobson TA. Evidence-based management of statin myopathy. Curr Atheroscler Rep 2010;12:322–30.
39. Bruckert E, Hayem G, Dejager S, et al. Mild to moderate muscular symptoms with high-dosage statin therapy in hyperlipidemic patients—the PRIMO study. Cardiovasc Drugs Ther 2005;19:403–14.
40. Ahmad Z. Statin intolerance. Am J Cardiol 2014;113:1765–71.
41. Food and Drug Administration. FDA drug safety communication: important safety label changes to cholesterol-lowering statin drugs. www.fda.gov/Drugs/DrugSafety/ucm293101.htm. Published February 28, 2012. Accessed June 5, 2018.
42. Gauthier JM, Massicotte A. Statins and their effect on cognition: let’s clear up the confusion. Can Pharm J (Ott) 2015;148:150–55.
43. Baigent C, Landray MJ, Reith C, et al. The effects of lowering LDL cholesterol with simvastatin plus ezetimibe in patients with chronic kidney disease (study of heart and renal protection): a randomised placebo-controlled trial. Lancet 2011;377:2181–92.
44. Vaziri ND, Anzalone DA, Catini J. Statins in chronic didney disease: when and when not to use them. J Fam Pract 2016;65:8 Suppl. www.mdedge.com/jfp/custom/statins-chronic-kidney-disease-when-and-when-not-use-them-1
45. Jose J. Statins and its hepatic effects: newer data, implications, and changing recommendations. J Pharm Bioallied Sci 2016;8:23–8.
46. Caro J, Klittich W, McGuire A, et al. The West of Scotland coronary prevention study: Economic benefit analysis of primary prevention with pravastatin. BMJ 1997;315:1577–82.
47. Schectman G, Wolff N, Byrd JC, et al. Physician extenders for cost-effective management of hypercholesterolemia. J Gen Intern Med 1996;11:277–86.
48. Johannesson M, Jonsson B, Kjekshus J, et al. Cost effectiveness of simvastatin treatment to lower cholesterol levels in patients with coronary heart disease. Scandinavian simvastatin survival study group. N Engl J Med 1997;336:332–6.
49. Odden MC, Pletcher MJ, Coxson PG, et al. Cost-effectiveness and population impact of statins for primary prevention in adults aged 75 years or older in the United States. Ann Intern Med 2015;162:533–41.
50. Cannon CP, Blazing MA, Giugliano RP, et al; IMPROVE-IT Investigators. Ezetimibe added to statin therapy after acute coronary syndromes. N Engl J Med 2015;372:2387–97.
51. Polisecki E, Peter I, Robertson M, et al. Genetic variation at the PCSK9 locus moderately lowers low-density lipoprotein cholesterol levels, but does not significantly lower vascular disease risk in an elderly population. Atherosclerosis 2008;200:95–101.
52. Sabatine MS, Giugliano RP, Keech AC, et al; FOURIER Steering Committee and Investigators. Evolocumab and clinical outcomes in patients with cardiovascular disease. N Engl J Med 2017;376:1713–22.
53. Sinthupoom N, Prachayasittikul V, Prachayasittikul S, et al. Nicotinic acid and derivatives as multifunctional pharmacophores for medical applications. Eur Food Res Technol 2015;240: 1–17.
54. Canner PL, Berge KG, Wenger NK, et al. Fifteen year mortality in coronary drug project patients: long-term benefit with niacin. J Am Coll Cardiol 1986;8:1245–55.
55. AIM-HIGH Investigators. Niacin in patients with low HDL cholesterol levels receiving intensive statin therapy. N Engl J Med 2011;365:2255–67.
56. HPS2-THRIVE Collaborative Group, Landray MJ, Haynes R, et al. Effects of extended-release niacin with laropiprant in high-risk patients. N Engl J Med 2014;371:203–12.
57. National Cholesterol Education Program (NCEP) Expert Panel on Detection, Evaluation, and Treatment of High Blood Cholesterol in Adults (Adult Treatment Panel III). Third report of the expert panel on detection, evaluation, and treatment of high blood cholesterol in adults (adult treatment panel III) final report. Circulation 2002;106:3143–421.
58. The lipid research clinics coronary primary prevention trial results. I. Reduction in incidence of coronary heart disease. JAMA 1984;251:351–64.
Supporting Suicidal Patients After Discharge from the Emergency Department
From the Department of Psychiatry, Brigham and Women’s Hospital, and Harvard Medical School, Boston, MA.
Abstract
- Objective: To provide a review of emergency department (ED)-based psychosocial interventions that support adult patients with an identified suicide risk towards a goal of reducing subsequent suicidal behavior through the period after discharge, which is known to be a time of high risk for suicidal behavior.
- Methods: Non-systematic review of the literature.
- Results: Multiple methods of engaging patients after discharge from the ED have been shown to reduce subsequent suicidal behaviors. These methods include sending caring letters in the mail, facilitating supportive phone conversations, case management, and protocols that combine different services. Overall, the existing literature is insufficient to recommend widespread adoption of any individual strategy or protocol. However, providing psychosocial and emotional support to patients with an identified suicide risk after they are discharged from the ED is feasible and may reduce subsequent suicidal behaviors. Templates for providing supportive outreach using different modalities now exist, and these may help guide the ongoing development and widespread adoption of more effective and cost-effective solutions.
- Conclusion: Many ED–based interventions that provide enhanced support to patients with suicide risk after they are discharged have demonstrated a potential to reduce the risk of future suicidal behavior.
Key words: suicide; emergency department.
Despite the fact that emergency department (ED) providers often feel unprepared to manage suicide risk, patients with significant suicide risk frequently receive care in EDs, whether or not they have sustained physical injuries resulting from suicidal behavior [1,2]. Patients make greater than 400,000 visits to EDs in the United States each year for suicidal and self-injurious behaviors (suicide attempts and self-injurious behaviors are typically coded in ways that make them indistinguishable from each other in retrospective analyses) [3], and it is estimated that 6% to 10% of all patients in EDs endorse suicidal ideation when asked, regardless of their original chief complaints [4]. Meanwhile, suicide has become the 10th leading cause of death in the United States [5], and the Joint Commission has charged all accredited health care organizations with providing comprehensive treatment to suicidal patients, which may range from immediately containing an acute risk to ensuring continuity of care in follow-up [5].
When an acute suicide risk is identified in the ED, the provider’s immediate next steps should be to place the patient in a safe area under constant observation and to provide an emergency assessment [5,6]. Although psychiatric consultation and/or psychiatric admission may follow this assessment, suicide risk does not require admission in all cases; and some patients with suicide risk may be discharged to an outpatient setting even without receiving a psychiatric consultation [1]. Regardless of whether an outpatient disposition from the ED is appropriate, however, the period that immediately follows discharge is a time of high risk for repeated suicidal behavior and suicide death [7–9], and only 30% to 50% of patients who are discharged from EDs after a self-harm incident actually keep a follow-up mental health appointment [9,10]. Therefore, any support given to patients through this transition out of the emergency care setting could be especially high-yield.
The Joint Commission recommends that all patients with suicidal ideation receive, at minimum, a referral to treatment, telephone numbers for local and national crisis support resources (including the National Suicide Prevention Lifeline 1-800-273-TALK), collaborative safety planning, and counseling to restrict access to lethal means upon discharge [5]. However, some programs have demonstrated the capacity to provide enhanced support to patients beyond discharge from the ED, with some success in reducing the rates of subsequent suicidal behaviors. This non-systematic review describes interventions that can be initiated in the context of an ED encounter with the purpose of reducing future suicidal behavior among adult patients. They are primarily psychosocial rather than clinical. Clinical interventions that apply psychotherapy [11–13] psychopharmacology [14], and specialized inpatient treatments [15] have been studied as well but are beyond the scope of this review.
[polldaddy:10107269]
Interventions to Support Patients At Risk of Suicide After Discharge from the ED
Brief Contact Interventions
The idea that maintaining written correspondence with patients who have a known suicide risk after discharge can reduce subsequent suicide rates originated with a study of psychiatric inpatients conducted by Motto and Bostrom, in which patients who had been admitted for depression but had declined outpatient treatment were randomly assigned to periodically receive letters containing supportive messages from staff members over a period of 5 years [16]. This study remarkably found that these so-called brief contact interventions (BCIs), which were personalized to each recipient but did not contain psychotherapy per se, were associated with a reduced rate of suicide throughout the duration of the program compared with no written contacts [16].
BCIs have since been adapted to other communication formats and have been studied in patients who were discharged directly from the ED after an evaluation of suicide risk or suicidal behavior. Typically, BCIs consist of short, supportive messages that are delivered at regular intervals (often once every 1–2 months) over a period of 1 to 5 years [17,18]. They notably do not contain psychotherapy content, although they may reinforce coping strategies or remind recipients of how to access help if needed [17,19]. They may arrive as postcards [20,21], letters [22], telephone outreach [23–25], or a combination of modalities [26].
Protocols that rely on BCIs alone vary in their structure and have yielded mixed results [18]. A meta-analysis of 12 BCI protocols conducted by Milner et al found that, overall, BCIs administered after a presentation to the ED for self-harm have been associated with a significant reduction in repeat suicide attempts per recipient but not in total suicide deaths [27]. Milner’s group did not recommend large-scale promotion of BCIs based on the inadequacy of data so far, but suggested that this strategy may yet show promise upon further study [27]. A key advantage of BCIs is that they are inexpensive to implement, particularly if they do not include a telephone outreach component [28]. Thus, even if the potential benefit to patients is small, administering BCIs can be cost-effective [28].
It should not come as a surprise, therefore, that the potential for incorporation of BCIs into mobile smartphone technology is currently under investigation. Individuals who own mobile phones typically keep them on their persons and turned on continuously, and thus this is a reliable platform for maintaining contact with a wide range of patients in real-time [17,29]. Developers of at least 2 BCI smartphone programs that rely on mobile text messaging have published their protocols [17,30]. However, whether these programs will succeed in meaningfully reducing suicide rates remains to be determined by future research.
Green Cards
Morgan et al conducted a study in the United Kingdom in which individuals who presented to EDs after a self-harm event received a “green card,” which contained encouraging messages about seeking help and provided contact information for emergency services with 24-hour availability [31]. The green card also facilitated access to a crisis admission if necessary. The green card was distributed first in the ED and a second time by mail 3 weeks later. No suicides occurred in either the intervention or control group, which received usual care, and no statistically significant differences in suicide reattempt rate were found between groups after 1 year [31]. 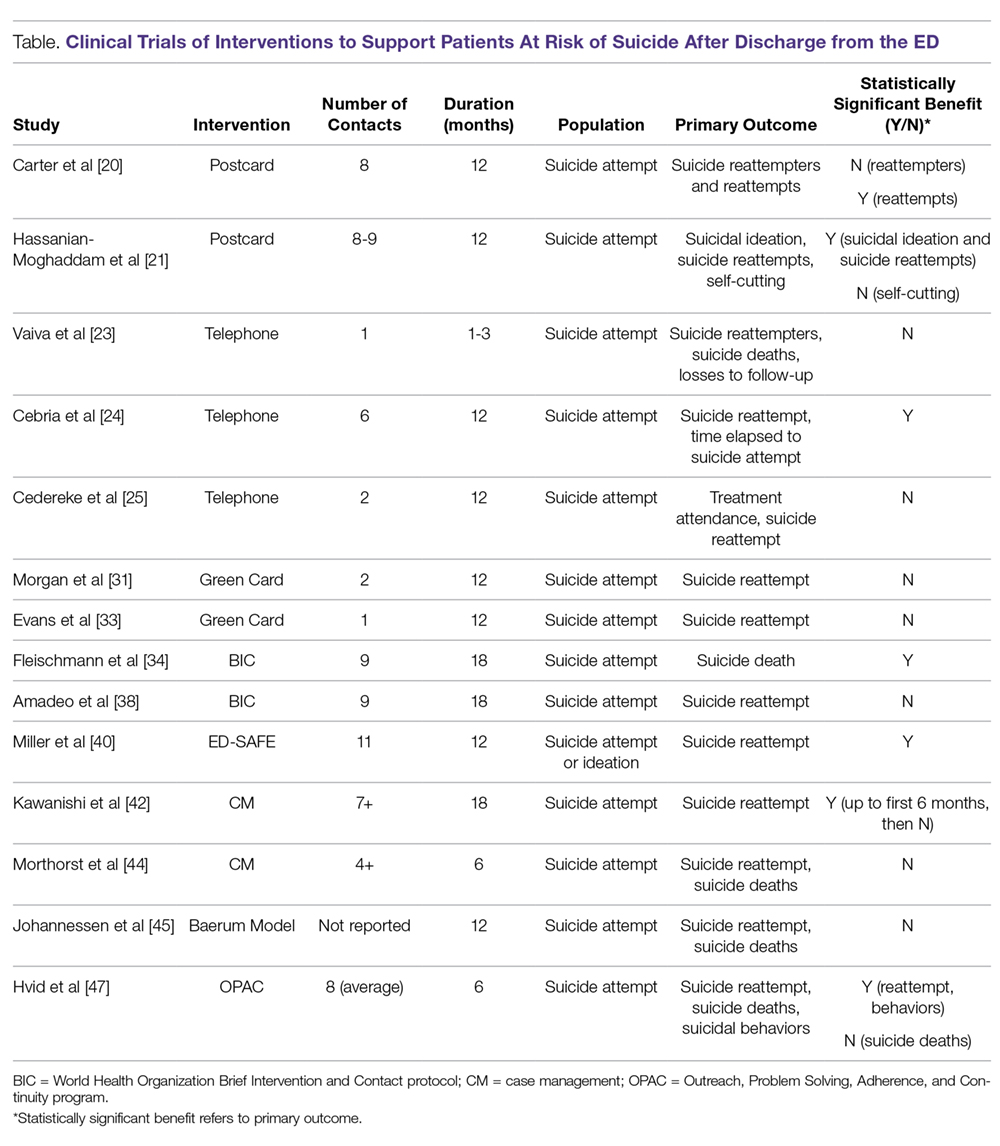
Evans et al studied an updated version of the green card intervention in which the green card facilitated access to an on-call psychiatrist with 24-hour availability by telephone [32]. The updated card included encouraging messages about seeking help similar to the original green card described by Morgan; however, the psychiatry consultation via telephone replaced the offer of hospital admission [32]. This second trial of green cards also failed to show a reduction in the rate of suicide reattempts among green card recipients at 6 months and 1 year [32,33].
Brief Intervention and Contact
The World Health Organization’s Brief Intervention and Contact (BIC) protocol is a standardized, multi-step suicide prevention program that has been studied primarily in patients who present to EDs after a suicide attempt in middle-income countries [34]. BIC includes a 1-hour information session that is administered shortly prior to discharge, and subsequently provides 9 follow-up contact interventions at specified intervals over an 18-month period. Unlike in a typical BCI, the contacts in BIC are conducted by a clinician either face-to-face or over the phone and include standardized assessments of the patient’s condition, although they still do not include psychotherapy. BIC has been shown to reduce suicide attempts, suicide deaths, or both in India [34–36], Iran [34,36,37], China [34,36], Brazil [34,36], and Sri Lanka [34,36] but was not found to directly improve clinical outcomes in a study conducted in French Polynesia [38]. A meta-analysis conducted by Riblet et al concluded that BIC is effective in reducing suicide risk overall [39].
ED-SAFE
The Emergency Department Safety Assessment and Follow-up Evaluation (ED-SAFE) protocol was validated in 8 EDs in 7 states in the US that did not already provide psychiatric services internally [40]. Under this model, all patients in the ED receive a screening for suicide risk, and those with an initial positive screen receive a secondary screen administered by the ED physician, a self-administered safety plan, and a series of up to 11 phone contacts over the following year that are administered by trained mental health clinicians in a central location. The ED-SAFE phone contacts follow the Coping Long Term with Active Suicide Program (CLASP) protocol [41] and provide support around safety planning and treatment engagement. They have the capacity to engage the patients’ significant others directly if a significant other is available and the patient chooses to involve that person.
In a single multicenter study, ED-SAFE reduced the absolute risk of suicide attempt by 5%, and the relative risk by 20% compared to usual treatment [40]. An intermediate phase of the study compared the universal suicide screening alone (ie, without the safety plan or follow-up contacts) with usual care and did not find this to improve outcomes [40].
Case Management
Kawanishi et al conducted a randomized controlled trial of assertive case management, the ACTION-J study, for patients with psychiatric diagnoses who presented with self-harm to 17 participating EDs in Japan [42]. In the ACTION-J study, case managers were mental health clinicians who provided clinical evaluations, treatment planning, encouragement, and care coordination over the course of 7 scheduled face-to-face or phone contacts in the first 18 months, and additional contacts at 6-month intervals until the completion of the trial (up to a total of 5 years) [43]. The comparison intervention, enhanced usual care, consisted of psychoeducation provided at the time of the encounter in the ED without case management services. The assertive case management intervention was associated with a decrease in suicidal behavior in the first 6 months but not for the duration of the study, except in women, for whom the benefit lasted the full 18 months [42]. A subsequent analysis also found a decrease in the total number of self-harm episodes per person-year compared to enhanced usual care, although there was not a difference in the number of participants who experienced a repeat self-harm episode [43]. The benefit was most strongly pronounced among patients who had presented with an index suicide attempt [43].
Morthorst et al applied an alternative case management model for the assertive intervention for deliberate self harm (AID) trial, which took place in Denmark [44]. Participants were aged 12 and older and could have been recruited from medical or pediatric inpatient units as well as the ED after a self-harm event. AID employed psychiatric nurses to provide crisis intervention, crisis planning, problem solving, motivational support, family mediation, and assistance with keeping appointments over a period of 6 months following discharge. Outreach took place over the phone, by text message, in participants’ homes, in cafes, and at health and social services appointments. The intervention required at least 4 contacts, although additional contacts could be made if appropriate. In comparison with a control group, in which participants received only usual care (which included ready access to short-term psychotherapy), the AID intervention was not associated with statistically significant differences in recurrent suicidal behaviors [44]. Subgroup analyses examining adult participants aged 20–39 and 40 and older also did not find differences in recurrent suicidal behavior between groups [44].
The Baerum Model and OPAC
A municipal suicide prevention team that provides comprehensive social services to suicide attempters has operated in Baerum, Norway, since 1983 [45]. Under the Baerum model, patients who attempt suicide, can be discharged from the general hospital without psychiatric admission, and are determined to have a high level of need for support are connected by a hospital-based suicide prevention team to a community-based team consisting of nurses and a consulting psychologist, who subsequently engage patients in own their homes and through follow-up phone calls. The services they provide include care coordination, encouragement, activation of social networks, psychological first-aid, and counseling focused on problem-solving. The ostensible goal of the suicide prevention team is to provide a bridge between inpatient medical care and outpatient mental health treatment; however, the intervention lasts approximately 1 year regardless of whether the patient connects with a treatment program [45].
A retrospective comparison of outcomes between recipients of the original Baerum program and non-recipients failed to find a difference in suicide attempts or suicide deaths between groups [45]. However, this was not a controlled study, and suicide attempters were preferentially referred to the program based on whether they had a higher level of need at baseline. Hvid and Wang adapted this model to patients who presented to EDs and general hospitals in Amager, Denmark [46] and have since conducted a series of randomized controlled trials comparing their adaptation to usual care. The Danish version of the Baerum model, renamed OPAC (for “outreach, problem solving, adherence, continuity”), provides similar case management and counseling services but for a maximum of 6 months. In their studies, OPAC significantly reduced the number of patients with a repeat suicide attempt and the total number of repeat suicide attempts at a 1-year interval, and this effect on total number of suicide attempts was sustained at 5 years [47,48]. Although the OPAC protocol begins with a patient’s presentation to the ED, the intervention is initiated after admission to the general hospital. Therefore, while this may inspire a model that provides similar services directly from the ED to patients who do not require general hospital admission, the existing model is not entirely based in the ED.
Discussion
The needs of suicidal patients are often multidimensional, and in some cases their risks are driven by psychosocial problems in addition to, or instead of, medically modifiable psychiatric conditions [49]. However, developing an ED-based program to support patients who are at risk of suicide after they are discharged from the ED is possible. Many such programs that provide or facilitate caring contacts, family support, case management, and/or treatment engagement with discharged patients have demonstrated that similar strategies may have the potential to impact future suicidal behavior. Nonetheless, it would be a stretch to say that all hospital systems should immediately begin doing so.
A new post-discharge support program is an investment of financial resources, personnel, and sometimes technology. Successful delivery of support or messages in any format requires that the intended recipient be able to receive it via reliable access to a working address, telephone number, or electronic device. Nonetheless, programs that rely on BCIs alone (excluding those conducted via telephone) cost relatively little to implement and thus would require a smaller investment than programs that require synchronous telephone or face-to-face contacts with staff in addition to or instead of BCIs. Costs for synchronous programs will also vary depending on the frequency and duration of contacts and the licensure and training required of the staff who provide them.
A trend toward better outcomes associating with more resource-intensive programs is easy to imagine but has not been definitively demonstrated. The wide variation between protocols in all types of programs makes comparisons between those that do and do not include synchronous contacts, and between types of synchronous contacts, difficult. Meanwhile, the low cost of BCIs alone could increase their attractiveness as an investment regardless of the magnitude of outcome improvement.
Denchev et al constructed a cost/benefit comparison model that included the postcard BCI study conducted by Carter et al [20], the telephone outreach study conducted by Vaiva et al [23], and a study of cognitive behavioral therapy (CBT) [11], all of which showed a clinical benefit. This model relied upon some numeric estimations and did not account for variation in outcomes between individual studies of each intervention strategy. However, it concluded that both telephone outreach and CBT were likely to be cost-prohibitive compared to asynchronous BCIs, which were associated with a reduction in costs overall [28].
Conclusion
There remains much to learn regarding how best to reduce suicide risk among adult patients in the period after discharge from the ED, during which patients with an identified suicide risk are known to be vulnerable. However, providing psychosocial and emotional support to patients with an identified suicide risk after they are discharged from the ED is feasible and may reduce subsequent suicidal behaviors. Templates for providing supportive outreach using different modalities now exist, and these may help guide the ongoing development and widespread adoption of more effective and cost-effective solutions.
Corresponding author: David S. Kroll, MD, [email protected].
Financial disclosure: Dr. Kroll has received research funding from Brigham and Women’s Hospital to study and develop technological solutions for supporting suicidal patients after discharge from the emergency department. He has additionally received research funding and a speaking honorarium from Avasure.
1. Betz ME, Boudreaux ED. Managing suicidal patients in the emergency department. Ann Emerg Med 2016;67:276–82.
2. McManus MC, Cramer RJ, Boshier M, et al. Mental health and drivers of need in emergent and non-emergent emergency department (ED) use: do living location and non-emergent care sources matter? Int J Environ Res Public Health 2018;15:129.
3. Ting SA, Sullivan AF, Boudreaux ED, et al. Trends in US emergency department visits for attempted suicide and self-inflicted injury, 1993-2008. Gen Hosp Psychiatry 2012;34:557–65.
4. Betz ME, Wintersteen M, Boudreaux ED, Brown G, Capoccia L, Currier G, et al. reducing suicide risk: challenges and opportunities in the emergency department. Ann Emerg Med 2016;68:758–65.
5. The Joint Commission. Sentinel event alert 56: detecting and treating suicide ideation in all settings. www.jointcommission.org/sea_issue_56/. Published February 24, 2016. Accessed June 4, 2018.
6. Mills PD, Watts BV, Hemphill RR. Suicide attempts and completions on medical-surgical and intensive care units. J Hosp Med 2014;9:182–5.
7. Crane EH. Patients with drug-related emergency department visits involving suicide attempts who left against medical advice. The CBHSQ Report. http://www.ncbi.nlm.nih.gov/books/NBK396153/ . Published September 13, 2016. Accessed June 4, 2018.
8. Fedyszyn IE, Erlangsen A, Hjorthøj C, et al. Repeated suicide attempts and suicide among individuals with a first emergency department contact for attempted suicide: a prospective, nationwide, Danish register-based study. J Clin Psychiatry 2016;77:832–40.
9. Hunter J, Maunder R, Kurdyak P, et al. Mental health follow-up after deliberate self-harm and risk for repeat self-harm and death. Psychiatry Res 2018;259:333–9.
10. Costemale-Lacoste JF, Balaguer E, Boniface B, et al. Outpatient treatment engagement after suicidal attempt: a multisite prospective study. Psychiatry Res 2017;258:21–3.
11. Brown GK, Ten Have T, Henriques GR, et al. Cognitive therapy for the prevention of suicide attempts: a randomized controlled trial. JAMA 2005;294:563–70.
12. Gysin-Maillart A, Schwab S, Soravia L, Megert M, Michel K. A novel brief therapy for patients who attempt suicide: a 24-months follow-up randomized controlled study of the attempted suicide short intervention program (ASSIP). PLoS Med 2016;13:e1001968.
13. Hawton K, Witt KG, Salisbury TLT, et al. Psychosocial interventions following self-harm in adults: a systematic review and meta-analysis. Lancet Psychiatry. 2016;3:740–50.
14. Battaglia J, Wolff TK, Wagner-Johnson DS, et al. Structured diagnostic assessment and depot fluphenazine treatment of multiple suicide attempters in the emergency department. Int Clin Psychopharmacol 1999;14:361–72.
15. van der Sande R, van Rooijen L, Buskens E, et al. Intensive in-patient and community intervention versus routine care after attempted suicide. A randomised controlled intervention study. Br J Psychiatry 1997;171:35–41.
16. Motto JA, Bostrom AG. A randomized controlled trial of postcrisis suicide prevention. Psychiatr Serv 2001;52:828–33.
17. Berrouiguet S, Larsen ME, Mesmeur C, Gravey M, Billot R, Walter M, et al. Toward mHealth brief contact interventions in suicide prevention: case series from the suicide intervention assisted by messages (SIAM) randomized controlled trial. JMIR MHealth UHealth 2018;6:e8.
18. Falcone G, Nardella A, Lamis DA, et al. Taking care of suicidal patients with new technologies and reaching-out means in the post-discharge period. World J Psychiatry 2017;7:163–76.
19. Milner A, Spittal MJ, Kapur N, et al. Mechanisms of brief contact interventions in clinical populations: a systematic review. BMC Psychiatry 2016;16:194.
20. Carter GL, Clover K, Whyte IM, et al. Postcards from the EDge: 5-year outcomes of a randomised controlled trial for hospital-treated self-poisoning. Br J Psychiatry 2013;202:372–80.
21. Hassanian-Moghaddam H, Sarjami S, Kolahi AA, Carter GL. Postcards in Persia: randomised controlled trial to reduce suicidal behaviours 12 months after hospital-treated self-poisoning. Br J Psychiatry 2011;198:309–16.
22. Luxton DD, Thomas EK, Chipps J, et al. Caring letters for suicide prevention: implementation of a multi-site randomized clinical trial in the U.S. military and Veteran Affairs healthcare systems. Contemp Clin Trials 2014;37(2):252–60.
23. Vaiva G, Vaiva G, Ducrocq F, et al. Effect of telephone contact on further suicide attempts in patients discharged from an emergency department: randomised controlled study. BMJ 2006;332:1241–5.
24. Cebrià AI, Parra I, Pàmias M, et al. Effectiveness of a telephone management programme for patients discharged from an emergency department after a suicide attempt: controlled study in a Spanish population. J Affect Disord 2013;147:269–76.
25. Cedereke M, Monti K, Ojehagen A. Telephone contact with patients in the year after a suicide attempt: does it affect treatment attendance and outcome? A randomised controlled study. Eur Psychiatry. 2002;17:82–91.
26. Vaiva G, Walter M, Al Arab AS, et al. ALGOS: the development of a randomized controlled trial testing a case management algorithm designed to reduce suicide risk among suicide attempters. BMC Psychiatry 2011;11:1.
27. Milner AJ, Carter G, Pirkis J, et al. Letters, green cards, telephone calls and postcards: systematic and meta-analytic review of brief contact interventions for reducing self-harm, suicide attempts and suicide. Br J Psychiatry. 2015;206:184–90.
28. Denchev P, Pearson JL, Allen MH, Claassen CA, Currier GW, Zatzick DF, et al. Modeling the cost-effectiveness of interventions to reduce suicide risk among hospital emergency department patients. Psychiatr Serv 2018;69:23–31.
29. Berrouiguet S, Courtet P, Larsen ME, et al. Suicide prevention: towards integrative, innovative and individualized brief contact interventions. Eur Psychiatry 2018;47:25–6.
30. Larsen ME, Shand F, Morley K, Batterham PJ, Petrie K, Reda B, et al. A mobile text message intervention to reduce repeat suicidal episodes: design and development of reconnecting after a suicide attempt (RAFT). JMIR Ment Health 2017;4:e56.
31. Morgan HG, Jones EM, Owen JH. Secondary prevention of non-fatal deliberate self-harm. The green card study. Br J Psychiatry 1993;163:111–2.
32. Evans MO, Morgan HG, Hayward A, Gunnell DJ. Crisis telephone consultation for deliberate self-harm patients: effects on repetition. Br J Psychiatry 1999;175:23–7.
33. Evans J, Evans M, Morgan HG, et al. Crisis card following self-harm: 12-month follow-up of a randomised controlled trial. Br J Psychiatry J 2005;187:186–7.
34. Fleischmann A, Bertolote JM, Wasserman D, et al. Effectiveness of brief intervention and contact for suicide attempters: a randomized controlled trial in five countries. Bull World Health Organ 2008;86:703–9.
35. Vijayakumar L, Umamaheswari C, Shujaath Ali ZS, et al. Intervention for suicide attempters: a randomized controlled study. Indian J Psychiatry 2011;53:244–8.
36. Bertolote JM, Fleischmann A, De Leo D, et al. Repetition of suicide attempts: data from emergency care settings in five culturally different low- and middle-income countries participating in the WHO SUPRE-MISS Study. Crisis 2010;31:194–201.
37. Mousavi SG, Zohreh R, Maracy MR, et al. The efficacy of telephonic follow up in prevention of suicidal reattempt in patients with suicide attempt history. Adv Biomed Res 2014;3:198.
38. Amadéo S, Rereao M, Malogne A, et al. Testing brief intervention and phone contact among subjects with suicidal behavior: a randomized controlled trial in French Polynesia in the frames of the World Health Organization/suicide trends in at-risk territories study. Ment Illn 2015;7:5818.
39. Riblet NBV, Shiner B, Young-Xu Y, Watts BV. Strategies to prevent death by suicide: meta-analysis of randomised controlled trials. Br J Psychiatry 2017;210:396–402.
40. Miller IW, Camargo CA Jr, Arias SA, et al. Suicide prevention in an emergency department population: the ED-SAFE study. JAMA Psychiatry 2017;74:563–70.
41. Miller IW, Gaudiano BA, Weinstock LM. The coping long term with active suicide program: description and pilot data. Suicide Life Threat Behav 2016;46:752–61.
42. Kawanishi C, Aruga T, Ishizuka N, et al. Assertive case management versus enhanced usual care for people with mental health problems who had attempted suicide and were admitted to hospital emergency departments in Japan (ACTION-J): a multicentre, randomised controlled trial. Lancet Psychiatry 2014;1:193–201.
43. Furuno T, Nakagawa M, Hino K, et al. Effectiveness of assertive case management on repeat self-harm in patients admitted for suicide attempt: findings from ACTION-J study. J Affect Disord 2018;225:460–5.
44. Morthorst B, Krogh J, Erlangsen A, et al. Effect of assertive outreach after suicide attempt in the AID (assertive intervention for deliberate self harm) trial: randomised controlled trial. BMJ 2012;345:e4972.
45. Johannessen HA, Dieserud G, De Leo D, Claussen B, et al. Chain of care for patients who have attempted suicide: a follow-up study from Bærum, Norway. BMC Public Health 2011;11:81.
46. Hvid M, Wang AG. Preventing repetition of attempted suicide—I. Feasibility (acceptability, adherence, and effectiveness) of a Baerum-model like aftercare. Nord J Psychiatry 2009;63:148–53.
47. Hvid M, Vangborg K, Sørensen HJ, et al. Preventing repetition of attempted suicide-II. The Amager project, a randomized controlled trial. Nord J Psychiatry 2011;65:292–8.
48. Lahoz T, Hvid M, Wang AG. Preventing repetition of attempted suicide-III. The Amager project, 5-year follow-up of a randomized controlled trial. Nord J Psychiatry 2016;70:547–53.
49. Kroll DS, Karno J, Mullen B, et al. Clinical severity alone does not determine disposition decisions for patients in the emergency department with suicide risk. Psychosomatics 2017; pii: S0033-3182(17)30247–5.
From the Department of Psychiatry, Brigham and Women’s Hospital, and Harvard Medical School, Boston, MA.
Abstract
- Objective: To provide a review of emergency department (ED)-based psychosocial interventions that support adult patients with an identified suicide risk towards a goal of reducing subsequent suicidal behavior through the period after discharge, which is known to be a time of high risk for suicidal behavior.
- Methods: Non-systematic review of the literature.
- Results: Multiple methods of engaging patients after discharge from the ED have been shown to reduce subsequent suicidal behaviors. These methods include sending caring letters in the mail, facilitating supportive phone conversations, case management, and protocols that combine different services. Overall, the existing literature is insufficient to recommend widespread adoption of any individual strategy or protocol. However, providing psychosocial and emotional support to patients with an identified suicide risk after they are discharged from the ED is feasible and may reduce subsequent suicidal behaviors. Templates for providing supportive outreach using different modalities now exist, and these may help guide the ongoing development and widespread adoption of more effective and cost-effective solutions.
- Conclusion: Many ED–based interventions that provide enhanced support to patients with suicide risk after they are discharged have demonstrated a potential to reduce the risk of future suicidal behavior.
Key words: suicide; emergency department.
Despite the fact that emergency department (ED) providers often feel unprepared to manage suicide risk, patients with significant suicide risk frequently receive care in EDs, whether or not they have sustained physical injuries resulting from suicidal behavior [1,2]. Patients make greater than 400,000 visits to EDs in the United States each year for suicidal and self-injurious behaviors (suicide attempts and self-injurious behaviors are typically coded in ways that make them indistinguishable from each other in retrospective analyses) [3], and it is estimated that 6% to 10% of all patients in EDs endorse suicidal ideation when asked, regardless of their original chief complaints [4]. Meanwhile, suicide has become the 10th leading cause of death in the United States [5], and the Joint Commission has charged all accredited health care organizations with providing comprehensive treatment to suicidal patients, which may range from immediately containing an acute risk to ensuring continuity of care in follow-up [5].
When an acute suicide risk is identified in the ED, the provider’s immediate next steps should be to place the patient in a safe area under constant observation and to provide an emergency assessment [5,6]. Although psychiatric consultation and/or psychiatric admission may follow this assessment, suicide risk does not require admission in all cases; and some patients with suicide risk may be discharged to an outpatient setting even without receiving a psychiatric consultation [1]. Regardless of whether an outpatient disposition from the ED is appropriate, however, the period that immediately follows discharge is a time of high risk for repeated suicidal behavior and suicide death [7–9], and only 30% to 50% of patients who are discharged from EDs after a self-harm incident actually keep a follow-up mental health appointment [9,10]. Therefore, any support given to patients through this transition out of the emergency care setting could be especially high-yield.
The Joint Commission recommends that all patients with suicidal ideation receive, at minimum, a referral to treatment, telephone numbers for local and national crisis support resources (including the National Suicide Prevention Lifeline 1-800-273-TALK), collaborative safety planning, and counseling to restrict access to lethal means upon discharge [5]. However, some programs have demonstrated the capacity to provide enhanced support to patients beyond discharge from the ED, with some success in reducing the rates of subsequent suicidal behaviors. This non-systematic review describes interventions that can be initiated in the context of an ED encounter with the purpose of reducing future suicidal behavior among adult patients. They are primarily psychosocial rather than clinical. Clinical interventions that apply psychotherapy [11–13] psychopharmacology [14], and specialized inpatient treatments [15] have been studied as well but are beyond the scope of this review.
[polldaddy:10107269]
Interventions to Support Patients At Risk of Suicide After Discharge from the ED
Brief Contact Interventions
The idea that maintaining written correspondence with patients who have a known suicide risk after discharge can reduce subsequent suicide rates originated with a study of psychiatric inpatients conducted by Motto and Bostrom, in which patients who had been admitted for depression but had declined outpatient treatment were randomly assigned to periodically receive letters containing supportive messages from staff members over a period of 5 years [16]. This study remarkably found that these so-called brief contact interventions (BCIs), which were personalized to each recipient but did not contain psychotherapy per se, were associated with a reduced rate of suicide throughout the duration of the program compared with no written contacts [16].
BCIs have since been adapted to other communication formats and have been studied in patients who were discharged directly from the ED after an evaluation of suicide risk or suicidal behavior. Typically, BCIs consist of short, supportive messages that are delivered at regular intervals (often once every 1–2 months) over a period of 1 to 5 years [17,18]. They notably do not contain psychotherapy content, although they may reinforce coping strategies or remind recipients of how to access help if needed [17,19]. They may arrive as postcards [20,21], letters [22], telephone outreach [23–25], or a combination of modalities [26].
Protocols that rely on BCIs alone vary in their structure and have yielded mixed results [18]. A meta-analysis of 12 BCI protocols conducted by Milner et al found that, overall, BCIs administered after a presentation to the ED for self-harm have been associated with a significant reduction in repeat suicide attempts per recipient but not in total suicide deaths [27]. Milner’s group did not recommend large-scale promotion of BCIs based on the inadequacy of data so far, but suggested that this strategy may yet show promise upon further study [27]. A key advantage of BCIs is that they are inexpensive to implement, particularly if they do not include a telephone outreach component [28]. Thus, even if the potential benefit to patients is small, administering BCIs can be cost-effective [28].
It should not come as a surprise, therefore, that the potential for incorporation of BCIs into mobile smartphone technology is currently under investigation. Individuals who own mobile phones typically keep them on their persons and turned on continuously, and thus this is a reliable platform for maintaining contact with a wide range of patients in real-time [17,29]. Developers of at least 2 BCI smartphone programs that rely on mobile text messaging have published their protocols [17,30]. However, whether these programs will succeed in meaningfully reducing suicide rates remains to be determined by future research.
Green Cards
Morgan et al conducted a study in the United Kingdom in which individuals who presented to EDs after a self-harm event received a “green card,” which contained encouraging messages about seeking help and provided contact information for emergency services with 24-hour availability [31]. The green card also facilitated access to a crisis admission if necessary. The green card was distributed first in the ED and a second time by mail 3 weeks later. No suicides occurred in either the intervention or control group, which received usual care, and no statistically significant differences in suicide reattempt rate were found between groups after 1 year [31].
Evans et al studied an updated version of the green card intervention in which the green card facilitated access to an on-call psychiatrist with 24-hour availability by telephone [32]. The updated card included encouraging messages about seeking help similar to the original green card described by Morgan; however, the psychiatry consultation via telephone replaced the offer of hospital admission [32]. This second trial of green cards also failed to show a reduction in the rate of suicide reattempts among green card recipients at 6 months and 1 year [32,33].
Brief Intervention and Contact
The World Health Organization’s Brief Intervention and Contact (BIC) protocol is a standardized, multi-step suicide prevention program that has been studied primarily in patients who present to EDs after a suicide attempt in middle-income countries [34]. BIC includes a 1-hour information session that is administered shortly prior to discharge, and subsequently provides 9 follow-up contact interventions at specified intervals over an 18-month period. Unlike in a typical BCI, the contacts in BIC are conducted by a clinician either face-to-face or over the phone and include standardized assessments of the patient’s condition, although they still do not include psychotherapy. BIC has been shown to reduce suicide attempts, suicide deaths, or both in India [34–36], Iran [34,36,37], China [34,36], Brazil [34,36], and Sri Lanka [34,36] but was not found to directly improve clinical outcomes in a study conducted in French Polynesia [38]. A meta-analysis conducted by Riblet et al concluded that BIC is effective in reducing suicide risk overall [39].
ED-SAFE
The Emergency Department Safety Assessment and Follow-up Evaluation (ED-SAFE) protocol was validated in 8 EDs in 7 states in the US that did not already provide psychiatric services internally [40]. Under this model, all patients in the ED receive a screening for suicide risk, and those with an initial positive screen receive a secondary screen administered by the ED physician, a self-administered safety plan, and a series of up to 11 phone contacts over the following year that are administered by trained mental health clinicians in a central location. The ED-SAFE phone contacts follow the Coping Long Term with Active Suicide Program (CLASP) protocol [41] and provide support around safety planning and treatment engagement. They have the capacity to engage the patients’ significant others directly if a significant other is available and the patient chooses to involve that person.
In a single multicenter study, ED-SAFE reduced the absolute risk of suicide attempt by 5%, and the relative risk by 20% compared to usual treatment [40]. An intermediate phase of the study compared the universal suicide screening alone (ie, without the safety plan or follow-up contacts) with usual care and did not find this to improve outcomes [40].
Case Management
Kawanishi et al conducted a randomized controlled trial of assertive case management, the ACTION-J study, for patients with psychiatric diagnoses who presented with self-harm to 17 participating EDs in Japan [42]. In the ACTION-J study, case managers were mental health clinicians who provided clinical evaluations, treatment planning, encouragement, and care coordination over the course of 7 scheduled face-to-face or phone contacts in the first 18 months, and additional contacts at 6-month intervals until the completion of the trial (up to a total of 5 years) [43]. The comparison intervention, enhanced usual care, consisted of psychoeducation provided at the time of the encounter in the ED without case management services. The assertive case management intervention was associated with a decrease in suicidal behavior in the first 6 months but not for the duration of the study, except in women, for whom the benefit lasted the full 18 months [42]. A subsequent analysis also found a decrease in the total number of self-harm episodes per person-year compared to enhanced usual care, although there was not a difference in the number of participants who experienced a repeat self-harm episode [43]. The benefit was most strongly pronounced among patients who had presented with an index suicide attempt [43].
Morthorst et al applied an alternative case management model for the assertive intervention for deliberate self harm (AID) trial, which took place in Denmark [44]. Participants were aged 12 and older and could have been recruited from medical or pediatric inpatient units as well as the ED after a self-harm event. AID employed psychiatric nurses to provide crisis intervention, crisis planning, problem solving, motivational support, family mediation, and assistance with keeping appointments over a period of 6 months following discharge. Outreach took place over the phone, by text message, in participants’ homes, in cafes, and at health and social services appointments. The intervention required at least 4 contacts, although additional contacts could be made if appropriate. In comparison with a control group, in which participants received only usual care (which included ready access to short-term psychotherapy), the AID intervention was not associated with statistically significant differences in recurrent suicidal behaviors [44]. Subgroup analyses examining adult participants aged 20–39 and 40 and older also did not find differences in recurrent suicidal behavior between groups [44].
The Baerum Model and OPAC
A municipal suicide prevention team that provides comprehensive social services to suicide attempters has operated in Baerum, Norway, since 1983 [45]. Under the Baerum model, patients who attempt suicide, can be discharged from the general hospital without psychiatric admission, and are determined to have a high level of need for support are connected by a hospital-based suicide prevention team to a community-based team consisting of nurses and a consulting psychologist, who subsequently engage patients in own their homes and through follow-up phone calls. The services they provide include care coordination, encouragement, activation of social networks, psychological first-aid, and counseling focused on problem-solving. The ostensible goal of the suicide prevention team is to provide a bridge between inpatient medical care and outpatient mental health treatment; however, the intervention lasts approximately 1 year regardless of whether the patient connects with a treatment program [45].
A retrospective comparison of outcomes between recipients of the original Baerum program and non-recipients failed to find a difference in suicide attempts or suicide deaths between groups [45]. However, this was not a controlled study, and suicide attempters were preferentially referred to the program based on whether they had a higher level of need at baseline. Hvid and Wang adapted this model to patients who presented to EDs and general hospitals in Amager, Denmark [46] and have since conducted a series of randomized controlled trials comparing their adaptation to usual care. The Danish version of the Baerum model, renamed OPAC (for “outreach, problem solving, adherence, continuity”), provides similar case management and counseling services but for a maximum of 6 months. In their studies, OPAC significantly reduced the number of patients with a repeat suicide attempt and the total number of repeat suicide attempts at a 1-year interval, and this effect on total number of suicide attempts was sustained at 5 years [47,48]. Although the OPAC protocol begins with a patient’s presentation to the ED, the intervention is initiated after admission to the general hospital. Therefore, while this may inspire a model that provides similar services directly from the ED to patients who do not require general hospital admission, the existing model is not entirely based in the ED.
Discussion
The needs of suicidal patients are often multidimensional, and in some cases their risks are driven by psychosocial problems in addition to, or instead of, medically modifiable psychiatric conditions [49]. However, developing an ED-based program to support patients who are at risk of suicide after they are discharged from the ED is possible. Many such programs that provide or facilitate caring contacts, family support, case management, and/or treatment engagement with discharged patients have demonstrated that similar strategies may have the potential to impact future suicidal behavior. Nonetheless, it would be a stretch to say that all hospital systems should immediately begin doing so.
A new post-discharge support program is an investment of financial resources, personnel, and sometimes technology. Successful delivery of support or messages in any format requires that the intended recipient be able to receive it via reliable access to a working address, telephone number, or electronic device. Nonetheless, programs that rely on BCIs alone (excluding those conducted via telephone) cost relatively little to implement and thus would require a smaller investment than programs that require synchronous telephone or face-to-face contacts with staff in addition to or instead of BCIs. Costs for synchronous programs will also vary depending on the frequency and duration of contacts and the licensure and training required of the staff who provide them.
A trend toward better outcomes associating with more resource-intensive programs is easy to imagine but has not been definitively demonstrated. The wide variation between protocols in all types of programs makes comparisons between those that do and do not include synchronous contacts, and between types of synchronous contacts, difficult. Meanwhile, the low cost of BCIs alone could increase their attractiveness as an investment regardless of the magnitude of outcome improvement.
Denchev et al constructed a cost/benefit comparison model that included the postcard BCI study conducted by Carter et al [20], the telephone outreach study conducted by Vaiva et al [23], and a study of cognitive behavioral therapy (CBT) [11], all of which showed a clinical benefit. This model relied upon some numeric estimations and did not account for variation in outcomes between individual studies of each intervention strategy. However, it concluded that both telephone outreach and CBT were likely to be cost-prohibitive compared to asynchronous BCIs, which were associated with a reduction in costs overall [28].
Conclusion
There remains much to learn regarding how best to reduce suicide risk among adult patients in the period after discharge from the ED, during which patients with an identified suicide risk are known to be vulnerable. However, providing psychosocial and emotional support to patients with an identified suicide risk after they are discharged from the ED is feasible and may reduce subsequent suicidal behaviors. Templates for providing supportive outreach using different modalities now exist, and these may help guide the ongoing development and widespread adoption of more effective and cost-effective solutions.
Corresponding author: David S. Kroll, MD, [email protected].
Financial disclosure: Dr. Kroll has received research funding from Brigham and Women’s Hospital to study and develop technological solutions for supporting suicidal patients after discharge from the emergency department. He has additionally received research funding and a speaking honorarium from Avasure.
1. Betz ME, Boudreaux ED. Managing suicidal patients in the emergency department. Ann Emerg Med 2016;67:276–82.
2. McManus MC, Cramer RJ, Boshier M, et al. Mental health and drivers of need in emergent and non-emergent emergency department (ED) use: do living location and non-emergent care sources matter? Int J Environ Res Public Health 2018;15:129.
3. Ting SA, Sullivan AF, Boudreaux ED, et al. Trends in US emergency department visits for attempted suicide and self-inflicted injury, 1993-2008. Gen Hosp Psychiatry 2012;34:557–65.
4. Betz ME, Wintersteen M, Boudreaux ED, Brown G, Capoccia L, Currier G, et al. reducing suicide risk: challenges and opportunities in the emergency department. Ann Emerg Med 2016;68:758–65.
5. The Joint Commission. Sentinel event alert 56: detecting and treating suicide ideation in all settings. www.jointcommission.org/sea_issue_56/. Published February 24, 2016. Accessed June 4, 2018.
6. Mills PD, Watts BV, Hemphill RR. Suicide attempts and completions on medical-surgical and intensive care units. J Hosp Med 2014;9:182–5.
7. Crane EH. Patients with drug-related emergency department visits involving suicide attempts who left against medical advice. The CBHSQ Report. http://www.ncbi.nlm.nih.gov/books/NBK396153/ . Published September 13, 2016. Accessed June 4, 2018.
8. Fedyszyn IE, Erlangsen A, Hjorthøj C, et al. Repeated suicide attempts and suicide among individuals with a first emergency department contact for attempted suicide: a prospective, nationwide, Danish register-based study. J Clin Psychiatry 2016;77:832–40.
9. Hunter J, Maunder R, Kurdyak P, et al. Mental health follow-up after deliberate self-harm and risk for repeat self-harm and death. Psychiatry Res 2018;259:333–9.
10. Costemale-Lacoste JF, Balaguer E, Boniface B, et al. Outpatient treatment engagement after suicidal attempt: a multisite prospective study. Psychiatry Res 2017;258:21–3.
11. Brown GK, Ten Have T, Henriques GR, et al. Cognitive therapy for the prevention of suicide attempts: a randomized controlled trial. JAMA 2005;294:563–70.
12. Gysin-Maillart A, Schwab S, Soravia L, Megert M, Michel K. A novel brief therapy for patients who attempt suicide: a 24-months follow-up randomized controlled study of the attempted suicide short intervention program (ASSIP). PLoS Med 2016;13:e1001968.
13. Hawton K, Witt KG, Salisbury TLT, et al. Psychosocial interventions following self-harm in adults: a systematic review and meta-analysis. Lancet Psychiatry. 2016;3:740–50.
14. Battaglia J, Wolff TK, Wagner-Johnson DS, et al. Structured diagnostic assessment and depot fluphenazine treatment of multiple suicide attempters in the emergency department. Int Clin Psychopharmacol 1999;14:361–72.
15. van der Sande R, van Rooijen L, Buskens E, et al. Intensive in-patient and community intervention versus routine care after attempted suicide. A randomised controlled intervention study. Br J Psychiatry 1997;171:35–41.
16. Motto JA, Bostrom AG. A randomized controlled trial of postcrisis suicide prevention. Psychiatr Serv 2001;52:828–33.
17. Berrouiguet S, Larsen ME, Mesmeur C, Gravey M, Billot R, Walter M, et al. Toward mHealth brief contact interventions in suicide prevention: case series from the suicide intervention assisted by messages (SIAM) randomized controlled trial. JMIR MHealth UHealth 2018;6:e8.
18. Falcone G, Nardella A, Lamis DA, et al. Taking care of suicidal patients with new technologies and reaching-out means in the post-discharge period. World J Psychiatry 2017;7:163–76.
19. Milner A, Spittal MJ, Kapur N, et al. Mechanisms of brief contact interventions in clinical populations: a systematic review. BMC Psychiatry 2016;16:194.
20. Carter GL, Clover K, Whyte IM, et al. Postcards from the EDge: 5-year outcomes of a randomised controlled trial for hospital-treated self-poisoning. Br J Psychiatry 2013;202:372–80.
21. Hassanian-Moghaddam H, Sarjami S, Kolahi AA, Carter GL. Postcards in Persia: randomised controlled trial to reduce suicidal behaviours 12 months after hospital-treated self-poisoning. Br J Psychiatry 2011;198:309–16.
22. Luxton DD, Thomas EK, Chipps J, et al. Caring letters for suicide prevention: implementation of a multi-site randomized clinical trial in the U.S. military and Veteran Affairs healthcare systems. Contemp Clin Trials 2014;37(2):252–60.
23. Vaiva G, Vaiva G, Ducrocq F, et al. Effect of telephone contact on further suicide attempts in patients discharged from an emergency department: randomised controlled study. BMJ 2006;332:1241–5.
24. Cebrià AI, Parra I, Pàmias M, et al. Effectiveness of a telephone management programme for patients discharged from an emergency department after a suicide attempt: controlled study in a Spanish population. J Affect Disord 2013;147:269–76.
25. Cedereke M, Monti K, Ojehagen A. Telephone contact with patients in the year after a suicide attempt: does it affect treatment attendance and outcome? A randomised controlled study. Eur Psychiatry. 2002;17:82–91.
26. Vaiva G, Walter M, Al Arab AS, et al. ALGOS: the development of a randomized controlled trial testing a case management algorithm designed to reduce suicide risk among suicide attempters. BMC Psychiatry 2011;11:1.
27. Milner AJ, Carter G, Pirkis J, et al. Letters, green cards, telephone calls and postcards: systematic and meta-analytic review of brief contact interventions for reducing self-harm, suicide attempts and suicide. Br J Psychiatry. 2015;206:184–90.
28. Denchev P, Pearson JL, Allen MH, Claassen CA, Currier GW, Zatzick DF, et al. Modeling the cost-effectiveness of interventions to reduce suicide risk among hospital emergency department patients. Psychiatr Serv 2018;69:23–31.
29. Berrouiguet S, Courtet P, Larsen ME, et al. Suicide prevention: towards integrative, innovative and individualized brief contact interventions. Eur Psychiatry 2018;47:25–6.
30. Larsen ME, Shand F, Morley K, Batterham PJ, Petrie K, Reda B, et al. A mobile text message intervention to reduce repeat suicidal episodes: design and development of reconnecting after a suicide attempt (RAFT). JMIR Ment Health 2017;4:e56.
31. Morgan HG, Jones EM, Owen JH. Secondary prevention of non-fatal deliberate self-harm. The green card study. Br J Psychiatry 1993;163:111–2.
32. Evans MO, Morgan HG, Hayward A, Gunnell DJ. Crisis telephone consultation for deliberate self-harm patients: effects on repetition. Br J Psychiatry 1999;175:23–7.
33. Evans J, Evans M, Morgan HG, et al. Crisis card following self-harm: 12-month follow-up of a randomised controlled trial. Br J Psychiatry J 2005;187:186–7.
34. Fleischmann A, Bertolote JM, Wasserman D, et al. Effectiveness of brief intervention and contact for suicide attempters: a randomized controlled trial in five countries. Bull World Health Organ 2008;86:703–9.
35. Vijayakumar L, Umamaheswari C, Shujaath Ali ZS, et al. Intervention for suicide attempters: a randomized controlled study. Indian J Psychiatry 2011;53:244–8.
36. Bertolote JM, Fleischmann A, De Leo D, et al. Repetition of suicide attempts: data from emergency care settings in five culturally different low- and middle-income countries participating in the WHO SUPRE-MISS Study. Crisis 2010;31:194–201.
37. Mousavi SG, Zohreh R, Maracy MR, et al. The efficacy of telephonic follow up in prevention of suicidal reattempt in patients with suicide attempt history. Adv Biomed Res 2014;3:198.
38. Amadéo S, Rereao M, Malogne A, et al. Testing brief intervention and phone contact among subjects with suicidal behavior: a randomized controlled trial in French Polynesia in the frames of the World Health Organization/suicide trends in at-risk territories study. Ment Illn 2015;7:5818.
39. Riblet NBV, Shiner B, Young-Xu Y, Watts BV. Strategies to prevent death by suicide: meta-analysis of randomised controlled trials. Br J Psychiatry 2017;210:396–402.
40. Miller IW, Camargo CA Jr, Arias SA, et al. Suicide prevention in an emergency department population: the ED-SAFE study. JAMA Psychiatry 2017;74:563–70.
41. Miller IW, Gaudiano BA, Weinstock LM. The coping long term with active suicide program: description and pilot data. Suicide Life Threat Behav 2016;46:752–61.
42. Kawanishi C, Aruga T, Ishizuka N, et al. Assertive case management versus enhanced usual care for people with mental health problems who had attempted suicide and were admitted to hospital emergency departments in Japan (ACTION-J): a multicentre, randomised controlled trial. Lancet Psychiatry 2014;1:193–201.
43. Furuno T, Nakagawa M, Hino K, et al. Effectiveness of assertive case management on repeat self-harm in patients admitted for suicide attempt: findings from ACTION-J study. J Affect Disord 2018;225:460–5.
44. Morthorst B, Krogh J, Erlangsen A, et al. Effect of assertive outreach after suicide attempt in the AID (assertive intervention for deliberate self harm) trial: randomised controlled trial. BMJ 2012;345:e4972.
45. Johannessen HA, Dieserud G, De Leo D, Claussen B, et al. Chain of care for patients who have attempted suicide: a follow-up study from Bærum, Norway. BMC Public Health 2011;11:81.
46. Hvid M, Wang AG. Preventing repetition of attempted suicide—I. Feasibility (acceptability, adherence, and effectiveness) of a Baerum-model like aftercare. Nord J Psychiatry 2009;63:148–53.
47. Hvid M, Vangborg K, Sørensen HJ, et al. Preventing repetition of attempted suicide-II. The Amager project, a randomized controlled trial. Nord J Psychiatry 2011;65:292–8.
48. Lahoz T, Hvid M, Wang AG. Preventing repetition of attempted suicide-III. The Amager project, 5-year follow-up of a randomized controlled trial. Nord J Psychiatry 2016;70:547–53.
49. Kroll DS, Karno J, Mullen B, et al. Clinical severity alone does not determine disposition decisions for patients in the emergency department with suicide risk. Psychosomatics 2017; pii: S0033-3182(17)30247–5.
Survey-Based Priming Intervention Linked to Improved Communication with the Seriously Ill
Study Overview
Objective. To evaluate the efficacy of an intervention targeting both patients and clinicians intended to increase goals-of-care conversations.
Design. Multicenter cluster-randomized controlled trial.
Setting and participants. Clinicians (physicians or nurse practitioners) were recruited between February 2014 and November 2015 from 2 large health centers in the Pacific Northwest and were eligible if they provided primary or specialty care and had at least 5 eligible patients in their panels. Using the electronic health record (EHR) and clinic schedules, study staff identified and contacted (via mail or telephone) consecutive patients cared for by participating clinicians between March 2014 and May 2016 with the following eligibility criteria: age 18 years or older, 2 or more visits with the clinician in the last 18 months, and 1 or more qualifying conditions. Qualifying conditions included (1) metastatic cancer or inoperable lung cancer; (2) COPD with FEV1 values below 35% of that predicted or oxygen dependence, restrictive lung disease with a total lung capacity below 50% of that predicted, or cystic fibrosis with FEV1 below 30% of that predicted; (3) New York Heart Association class III or IV heart failure, pulmonary arterial hypertension, or left ventricular assist device or implantable cardioverter defibrillator implant; 4) cirrhosis or end-stage liver disease; (5) dialysis-dependent renal failure and diabetes; (6) age 75 or older with one or more life-limiting chronic illness; (7) age 90 or older; (8) hospitalization in the last 18 months with a life-limiting illness; (9) Charlson comorbidity index of 6 or higher. The qualifying criteria were selected to identify a median survival of approximately 2 years, suggesting relevance of goals-of-care discussions.
Intervention. The intervention was the patient-specific Jumpstart-Tips intervention, intended to prime clinicians and patients for a brief discussion of goals of care during a routine clinic visit. Patients in the intervention group received a survey to assess their preferences, barriers and facilitators for communication about end-of-life care. Survey responses were used to (1) generate an abstracted version of the patient’s preferences, (2) identify the most important communication barrier or facilitator, and (3) provide communication tips based on curricular materials from VitalTalk (http://vitaltalk.org) tailored to patient responses. The 1-page communication guide, called Jumpstart-Tips, was sent to clinicians 1 or 2 days prior to the target clinic visit date. Patients also received 1-page patient-specific Jumpstart-Tips forms, which summarized their survey responses and provided suggestions for having a goals-of-care conversation with the clinician. Patients in the control group completed the same surveys, but no information was provided to the patients or clinicians. Clinicians were randomly assigned in a 1:1 ratio to intervention or enhanced usual care.
Main outcome measures. The primary outcome was patient-reported occurrence of goals-of-care communication, which was evaluated using a validated dichotomous survey item. Other outcomes included clinician documentation of a goals-of-care conversation in the medical record, patient-reported quality of communication (measured using Quality of Communication questionnaire) at 2 weeks, patient reports of goal-concordant care at 3 months, and patient-reported symptoms of depression and anxiety at 3 and 6 months. All analyses included covariate adjustment for the baseline measure of the outcome and adjustment for other variables found to confound the association between randomization group and outcome.
Main results. Of 485 potentially eligible clinicians, 65 clinicians were randomized to the intervention group and 69 were randomized to the control group. Of these 132 clinicians, 124 had patients participating in the study: 537 out of 917 eligible patients enrolled, with 249 allocated to intervention and 288 to usual care.
Patients in the intervention group were more likely to report a goals-of-care conversation with their provider among all patients (74%, n = 137 vs 31%, n = 66; P n = 112 vs 28%, n = 44; P n = 140 vs 17%, n = 45; P n = 114 vs 17%, n = 34; P
Patients in the intervention group also reported higher quality ratings of goals-of-care conversations at the target visit (mean values, 4.6 v 2.1, P = 0.01, on the 4-indicator construct). Additionally, intervention members reported statistically significant higher ratings on 3 of the 7 individual quality-of-communication survey items.
Patient-assessed goal concordant care did not increase significantly overall (70% vs 57%; P = 0.08) but did increase for patients with stable goals between 3-month follow-up and last prior assessment (73% vs 57%; P = 0.03). Symptoms of depression or anxiety were not different between groups at 3 or 6 months.
Conclusion. The Jumpstart-Tips intervention was associated with an increase in patient reports and clinician documentation of goals-of-care communication. Increased patient-reported goal-concordant care among patients with stable goals was also associated with the intervention. Statistical significance was not detected for changes in depression or anxiety as a result of the intervention. The impact on goals-of-care discussion between patients and caregivers is suggestive of enhanced patient-centered care; however, further studies are needed to evaluate whether this communication is associated with changes in health care delivery.
Commentary
Previous research has shown that patients with serious illness who discuss their goals-of-care fare better in terms of quality of life and reducing intensity of care at the end-of-life [1]. However, providers often fail to or inadequately discuss goals of care with seriously ill patients [2,3]. This contributes to the lack of concordance between patient wishes, particularly related to end-of-life care, and clinical plans of care [4,5]. Addressing this gap between care provided and care desired, as well as providing high-quality, patient-centered care is needed.
Access to palliative care providers (who are trained to address these priorities) in the outpatient setting lags, despite an increase in specialists [6,7]. Thus, primary and specialty care providers in the outpatient setting are best positioned to align their care strategy with the goals of their patients. However, there have been limited results in showing that goals-of-care communication can be improved within the practice setting [8,9]. A randomized clinical trial among hospitalized seniors at the end-of-life showed an association where those who received advanced care planning with had improved quality of life, reduced care at dying, and reduced psychological distress among family [10]. However, in another randomized trial, simulation-based communication training compared with usual education among internal medicine and nurse practitioner trainees did not improve quality of communication about end-of-life care or quality of end-of-life care but was associated with a small increase in patients’ depressive symptoms [11]. A recent 2018 literature review of strategies used to facilitate the discussion of advance care planning with older adults in primary care settings identified effective interventions, including delivering education using various delivery methods, computer-generated triggers for primary care physicians (PCPs), inclusion of multidisciplinary professionals for content delivery, and patient preparation for PCP visit [12].
This article adds to the literature by demonstrating the feasibility and impact of implementing an intervention to increase communication about goals of care and end-of-life care. Further, this study highlights how communication that is bilateral, predetermined, and structured can be integrated into primary care. Strengths of the study include the use of randomization; deployment of validated survey tools; and confirmatory factor analysis to assess whether the survey variables are consistent with the hypothesized constructs. In addition, study staff were blinded when extracting data from the EHR record around discussions and documentation of goals-of-care conversations during patient visits. However, several limitations are present. There may be limited generalizability as the study was performed at low-scale, across one region as well as selection bias among clinicians participating in the study. Clinicians were not blinded of their assignment, which may have influenced their behaviors to discuss and document goals-of-care conversations.
Applications for Clinical Practice
Increasing quality communication around the end of life and understanding of a patient’s goals is important. Good communication can facilitate the development of a comprehensive treatment plan that is medically sound and concordant with the patient’s wishes and values. Clinicians and practices should consider adopting approaches to communication priming and accurate documentation, including: (1) incorporating/automating Jumpstart-Tips forms into practice (and tailoring as needed); (2) identifying similar education material that can serve as a primer for patients; (3) creating a pre-visit form for patients/caregivers to document and inform the clinician of their goals prior to the visit; (4) incorporating a standard EHR note to document and update goals-of-care discussion at each visit; and (5) more broadly encouraging (or providing training for) clinicians to practice bilateral communications with patients during visits.
—Ronald Sanchez, MPH, and Katrina F. Mateo, MPH
1. Wright AA, Zhang B, Ray A, et al. Associations between end-of-life discussions, patient mental health, medical care near death, and caregiver bereavement adjustment. JAMA 2008;300:1665–73.
2. Anderson WG, Chase R, Pantilat SZ, et al. Code status discussions between attending hospitalist physicians and medical patients at hospital admission. J Gen Intern Med 2011;26:359–66.
3. Osborn TR, Curtis JR, Nielsen EL, et al. Identifying elements of ICU care that families report as important but unsatisfactory: decision-making, control, and ICU atmosphere. Chest 2012;142:1185–92.
4. Covinsky KE, Fuller JD, Yaffe K, et al. Communication and decision-making in seriously ill patients: findings of the SUPPORT project. The Study to Understand Prognoses and Preferences for Outcomes and Risks of Treatments. J Am Geriatr Soc 2000;48:S187–93.
5. Heyland DK, Dodek P, Rocker G, et al. What matters most in end-of-life care: perceptions of seriously ill patients and their family members. CMAJ 2006;174:627–33
6. Dumanovsky T, Augustin R, Rogers M, Lettang K, Meier DE, Morrison RS. The growth of palliative care in U.S. hospitals: a status report. J Palliat Med 2016;19:8–15.
7. Dumanovsky T, Rogers M, Spragens LH, Morrison RS, Meier DE. Impact of staffing on access to palliative care in U.S. hospitals. J Palliat Med 2015;18:998–9.
8. Roze des Ordons, AL, Sharma N, Heyland DK, et al. Strategies for effective goals of care discussions and decision-making: perspectives from a multi-centre survey of Canadian hospital-based healthcare providers. BMC Palliative Care, 2015;14:38.
9. You JJ, Dodek P, Lamontagne F, et al. What really matters in end-of-life discussions? Perspectives of patients in hospital with serious illness and their families. CMAJ 2014;18:E679–E687.
10. Detering KM, Hancock AD, Reade MC, Silvester W. The impact of advance care planning on end of life care in elderly patients: randomised controlled trial. BMJ. 2010;340:c1345.
11. Curtis JR, Back AL, Ford DW, et al. Effect of communication skills training for residents and nurse practitioners on quality of communication with patients with serious illness: a randomized trial. JAMA 2013;310:2271–81.
12. Solis GR, Mancera BM, Shen MJ. Strategies used to facilitate the discussion of advance care planning with older adults in primary care settings: A literature review. J Am Assoc Nurse Pract 2018;30:270–9.
Study Overview
Objective. To evaluate the efficacy of an intervention targeting both patients and clinicians intended to increase goals-of-care conversations.
Design. Multicenter cluster-randomized controlled trial.
Setting and participants. Clinicians (physicians or nurse practitioners) were recruited between February 2014 and November 2015 from 2 large health centers in the Pacific Northwest and were eligible if they provided primary or specialty care and had at least 5 eligible patients in their panels. Using the electronic health record (EHR) and clinic schedules, study staff identified and contacted (via mail or telephone) consecutive patients cared for by participating clinicians between March 2014 and May 2016 with the following eligibility criteria: age 18 years or older, 2 or more visits with the clinician in the last 18 months, and 1 or more qualifying conditions. Qualifying conditions included (1) metastatic cancer or inoperable lung cancer; (2) COPD with FEV1 values below 35% of that predicted or oxygen dependence, restrictive lung disease with a total lung capacity below 50% of that predicted, or cystic fibrosis with FEV1 below 30% of that predicted; (3) New York Heart Association class III or IV heart failure, pulmonary arterial hypertension, or left ventricular assist device or implantable cardioverter defibrillator implant; 4) cirrhosis or end-stage liver disease; (5) dialysis-dependent renal failure and diabetes; (6) age 75 or older with one or more life-limiting chronic illness; (7) age 90 or older; (8) hospitalization in the last 18 months with a life-limiting illness; (9) Charlson comorbidity index of 6 or higher. The qualifying criteria were selected to identify a median survival of approximately 2 years, suggesting relevance of goals-of-care discussions.
Intervention. The intervention was the patient-specific Jumpstart-Tips intervention, intended to prime clinicians and patients for a brief discussion of goals of care during a routine clinic visit. Patients in the intervention group received a survey to assess their preferences, barriers and facilitators for communication about end-of-life care. Survey responses were used to (1) generate an abstracted version of the patient’s preferences, (2) identify the most important communication barrier or facilitator, and (3) provide communication tips based on curricular materials from VitalTalk (http://vitaltalk.org) tailored to patient responses. The 1-page communication guide, called Jumpstart-Tips, was sent to clinicians 1 or 2 days prior to the target clinic visit date. Patients also received 1-page patient-specific Jumpstart-Tips forms, which summarized their survey responses and provided suggestions for having a goals-of-care conversation with the clinician. Patients in the control group completed the same surveys, but no information was provided to the patients or clinicians. Clinicians were randomly assigned in a 1:1 ratio to intervention or enhanced usual care.
Main outcome measures. The primary outcome was patient-reported occurrence of goals-of-care communication, which was evaluated using a validated dichotomous survey item. Other outcomes included clinician documentation of a goals-of-care conversation in the medical record, patient-reported quality of communication (measured using Quality of Communication questionnaire) at 2 weeks, patient reports of goal-concordant care at 3 months, and patient-reported symptoms of depression and anxiety at 3 and 6 months. All analyses included covariate adjustment for the baseline measure of the outcome and adjustment for other variables found to confound the association between randomization group and outcome.
Main results. Of 485 potentially eligible clinicians, 65 clinicians were randomized to the intervention group and 69 were randomized to the control group. Of these 132 clinicians, 124 had patients participating in the study: 537 out of 917 eligible patients enrolled, with 249 allocated to intervention and 288 to usual care.
Patients in the intervention group were more likely to report a goals-of-care conversation with their provider among all patients (74%, n = 137 vs 31%, n = 66; P n = 112 vs 28%, n = 44; P n = 140 vs 17%, n = 45; P n = 114 vs 17%, n = 34; P
Patients in the intervention group also reported higher quality ratings of goals-of-care conversations at the target visit (mean values, 4.6 v 2.1, P = 0.01, on the 4-indicator construct). Additionally, intervention members reported statistically significant higher ratings on 3 of the 7 individual quality-of-communication survey items.
Patient-assessed goal concordant care did not increase significantly overall (70% vs 57%; P = 0.08) but did increase for patients with stable goals between 3-month follow-up and last prior assessment (73% vs 57%; P = 0.03). Symptoms of depression or anxiety were not different between groups at 3 or 6 months.
Conclusion. The Jumpstart-Tips intervention was associated with an increase in patient reports and clinician documentation of goals-of-care communication. Increased patient-reported goal-concordant care among patients with stable goals was also associated with the intervention. Statistical significance was not detected for changes in depression or anxiety as a result of the intervention. The impact on goals-of-care discussion between patients and caregivers is suggestive of enhanced patient-centered care; however, further studies are needed to evaluate whether this communication is associated with changes in health care delivery.
Commentary
Previous research has shown that patients with serious illness who discuss their goals-of-care fare better in terms of quality of life and reducing intensity of care at the end-of-life [1]. However, providers often fail to or inadequately discuss goals of care with seriously ill patients [2,3]. This contributes to the lack of concordance between patient wishes, particularly related to end-of-life care, and clinical plans of care [4,5]. Addressing this gap between care provided and care desired, as well as providing high-quality, patient-centered care is needed.
Access to palliative care providers (who are trained to address these priorities) in the outpatient setting lags, despite an increase in specialists [6,7]. Thus, primary and specialty care providers in the outpatient setting are best positioned to align their care strategy with the goals of their patients. However, there have been limited results in showing that goals-of-care communication can be improved within the practice setting [8,9]. A randomized clinical trial among hospitalized seniors at the end-of-life showed an association where those who received advanced care planning with had improved quality of life, reduced care at dying, and reduced psychological distress among family [10]. However, in another randomized trial, simulation-based communication training compared with usual education among internal medicine and nurse practitioner trainees did not improve quality of communication about end-of-life care or quality of end-of-life care but was associated with a small increase in patients’ depressive symptoms [11]. A recent 2018 literature review of strategies used to facilitate the discussion of advance care planning with older adults in primary care settings identified effective interventions, including delivering education using various delivery methods, computer-generated triggers for primary care physicians (PCPs), inclusion of multidisciplinary professionals for content delivery, and patient preparation for PCP visit [12].
This article adds to the literature by demonstrating the feasibility and impact of implementing an intervention to increase communication about goals of care and end-of-life care. Further, this study highlights how communication that is bilateral, predetermined, and structured can be integrated into primary care. Strengths of the study include the use of randomization; deployment of validated survey tools; and confirmatory factor analysis to assess whether the survey variables are consistent with the hypothesized constructs. In addition, study staff were blinded when extracting data from the EHR record around discussions and documentation of goals-of-care conversations during patient visits. However, several limitations are present. There may be limited generalizability as the study was performed at low-scale, across one region as well as selection bias among clinicians participating in the study. Clinicians were not blinded of their assignment, which may have influenced their behaviors to discuss and document goals-of-care conversations.
Applications for Clinical Practice
Increasing quality communication around the end of life and understanding of a patient’s goals is important. Good communication can facilitate the development of a comprehensive treatment plan that is medically sound and concordant with the patient’s wishes and values. Clinicians and practices should consider adopting approaches to communication priming and accurate documentation, including: (1) incorporating/automating Jumpstart-Tips forms into practice (and tailoring as needed); (2) identifying similar education material that can serve as a primer for patients; (3) creating a pre-visit form for patients/caregivers to document and inform the clinician of their goals prior to the visit; (4) incorporating a standard EHR note to document and update goals-of-care discussion at each visit; and (5) more broadly encouraging (or providing training for) clinicians to practice bilateral communications with patients during visits.
—Ronald Sanchez, MPH, and Katrina F. Mateo, MPH
1. Wright AA, Zhang B, Ray A, et al. Associations between end-of-life discussions, patient mental health, medical care near death, and caregiver bereavement adjustment. JAMA 2008;300:1665–73.
2. Anderson WG, Chase R, Pantilat SZ, et al. Code status discussions between attending hospitalist physicians and medical patients at hospital admission. J Gen Intern Med 2011;26:359–66.
3. Osborn TR, Curtis JR, Nielsen EL, et al. Identifying elements of ICU care that families report as important but unsatisfactory: decision-making, control, and ICU atmosphere. Chest 2012;142:1185–92.
4. Covinsky KE, Fuller JD, Yaffe K, et al. Communication and decision-making in seriously ill patients: findings of the SUPPORT project. The Study to Understand Prognoses and Preferences for Outcomes and Risks of Treatments. J Am Geriatr Soc 2000;48:S187–93.
5. Heyland DK, Dodek P, Rocker G, et al. What matters most in end-of-life care: perceptions of seriously ill patients and their family members. CMAJ 2006;174:627–33
6. Dumanovsky T, Augustin R, Rogers M, Lettang K, Meier DE, Morrison RS. The growth of palliative care in U.S. hospitals: a status report. J Palliat Med 2016;19:8–15.
7. Dumanovsky T, Rogers M, Spragens LH, Morrison RS, Meier DE. Impact of staffing on access to palliative care in U.S. hospitals. J Palliat Med 2015;18:998–9.
8. Roze des Ordons, AL, Sharma N, Heyland DK, et al. Strategies for effective goals of care discussions and decision-making: perspectives from a multi-centre survey of Canadian hospital-based healthcare providers. BMC Palliative Care, 2015;14:38.
9. You JJ, Dodek P, Lamontagne F, et al. What really matters in end-of-life discussions? Perspectives of patients in hospital with serious illness and their families. CMAJ 2014;18:E679–E687.
10. Detering KM, Hancock AD, Reade MC, Silvester W. The impact of advance care planning on end of life care in elderly patients: randomised controlled trial. BMJ. 2010;340:c1345.
11. Curtis JR, Back AL, Ford DW, et al. Effect of communication skills training for residents and nurse practitioners on quality of communication with patients with serious illness: a randomized trial. JAMA 2013;310:2271–81.
12. Solis GR, Mancera BM, Shen MJ. Strategies used to facilitate the discussion of advance care planning with older adults in primary care settings: A literature review. J Am Assoc Nurse Pract 2018;30:270–9.
Are There Differences in Efficacy and Safety Between 2nd-Generation Drug-Eluting Stents for Left Main Coronary Intervention?
Study Overview
Objective. To compare the effectiveness and safety profiles of various second-generation drug-eluting stents (DES) for left main coronary intervention.
Design. Retrospective study using 3 multicenter prospective registries (IRIS-DES, IRIS-MAIN, PRECOMBAT).
Setting and participants. Among the 4470 patients enrolled in the 3 registries treated between July 2007 and July 2015, the authors identified 2692 patients with significant left main coronary artery disease who received second-generation DES for inclusion in the study. The centers for IRIS-DES and PRECOMBAT are academic and community hospitals in South Korea, with IRIS-MAIN involving academic and community hospitals in South Korea, China, India, Indonesia, Japan, Malaysia, Taiwan, and Thailand. Of the patients in these registries, 1254 received cobalt-chromium everolimus-eluting stents (CoCr-EES), 232 biodegradable polymer biolimus-eluting stents (BP-BES), 616 platinum-chromium EES (PtCr-EES) and 590 Resolute zotarolimus-eluting stents (Re-ZES).
Main outcome measure. Target-vessel failure.
Main results. At 3 years, rates of target-vessel failure were not significantly different for the different types of stents (16.7% for the CoCr-EES, 13.2% for the BP-BES, 18.7% for the PtCr-EES, and 14.7% for the Re-ZES; P = 0.15). The adjusted hazard ratios (HRs) for target-vessel failure were similar in between-group comparisons of the different stents, except for the PtCr-EES versus the BP-BES (HR 1.60, 95% confidence interval 1.01 to 2.54; P = 0.046). There were no significant differences in risk of composite of all-cause death, any myocardial infarction, or any revascularization and its individual components according to the different types of stents.
Conclusion. There was no significant between-group differences in 3-year risk of target-vessel failure, except for a higher risk of primary outcome with PtCr-EES compared to BP-BES.
Commentary
Left main coronary artery disease is identified in 5% to 7% of the population and is one of the more perplexing lesions to treat given the poorer outcome compared to non–left main lesion and the importance of the vessels the left main supplies [1]. Historically, coronary artery bypass grafting (CABG) has been the standard of care on the basis of the survival benefit observed in early trials compared with medical therapy. Left main percutaneous coronary intervention (PCI) has evolved as an alternative to CABG over the past few decades. Early studies using balloon angioplasty or bare metal stents were limited primarily due to high restenosis rate [1]. In the DES era, results have been overall comparable to CABG. Unprotected left main PCI using first-generation DES was non-inferior compared to CABG in the pre-specified sub-study of SYNTAX trial and in PRECOMBAT trial using paclitaxel-eluting stents and sirolimus-eluting stents, respectively [2,3]. Largely based on these trials, the 2014 ACC/AHA guidelines give class IIa recommendation for patients with low-risk anatomy (Syntax score 0–22) and class IIb recommendation for patients with intermediate-risk anatomy (Syntax score 23–32) for left main PCI [4]. Moreover, European guidelines give class Ib recommendation for patients with low-risk anatomy, and class IIa recommendation for intermediate-risk anatomy for left main PCI [5]. However, the SYNTAX trial and PRECOMBAT trial were limited by not meeting non-inferiority (SYNTAX) and wide non-inferiority (PRECOMBAT) and selection bias due to large exclusion criteria. In addition, first-generation DES were used in these trials (tacrolimis-eluting stent for SYNTAX and sirolimus-eluting stent for PRECOMBAT). The standard of care has now shifted to wide use of second-generation DES [1].
Subsequently, 2 larger-scale clinical trials using second-generation DES were designed and results have been reported recently [6,7]. The EXCEL trial enrolled 1905 patients with significant left main coronary disease and compared CoCr-EES to CABG. At 3 years, the primary endpoint of a composite of death from any cause, stroke, or myocardial infarction occurred in 15.4% of the PCI patients and in 14.7% of the CABG patients (P = 0.02 for non-inferiority; P = 0.98 for superiority). Similarly, the NOBLE trial enrolled 1201 patients with significant left main coronary disease and compared PCI to CABG. In this trial, the biolimus-eluting second-generation stent became their preferred stent during the study period. At 5 years, the primary endpoint of a composite of all-cause mortality, non-procedural myocardial infarction, any repeat coronary intervention, and stroke was higher in PCI compared to CABG patients (28% vs 18%, HR 1.51, 95% CI 1.13–2.00), exceeding the limit of non-inferiority, and CABG was significantly better compared to PCI (P = 0.004). The difference in the results is likely due to trial design. The primary endpoint was different in the 2 studies—EXCEL did not include repeat coronary intervention in the composite endpoint. The NOBLE study had a longer enrollment period and earlier-generation stents (sirolimus-eluting) were used in the earlier stages of the trial. In addition, the NOBLE study did not assess for peri-procedural myocardial infarction as an endpoint, which is known to be associated with adverse outcome. In both trials, cardiovascular mortality and all-cause mortality were similar at the end of follow-up.
In this context, the Lee et al study compared 4 types of currently available second-generation stents by pooling data from 3 large registries in Asia [8]. The main finding from this study was that target-vessel failure, defined as the composite of cardiac death, target-vessel myocardial infarction, or target-vessel revascularization at 3 years follow-up was not different among the types of second-generation drug eluting stents (P = 0.15).
Another important finding from this study was that the stent thrombosis rate at follow-up was very low (< 1%). This is consistent with the EXCEL study, which reported a definite stent thrombosis rate of 0.7% and was lower than in the NOBLE study, which reported a rate of 3%. One of the possible explanations for this difference could be stent selection. In contrast to the EXCEL study, which exclusively used Co-Cr EES by study protocol, NOBLE
study included first-generation sirolimus-drug eluting stent (11%) and BP-BES (89%). However, there are multiple factors that contribute to stent thrombosis other than stent selection, such as lesion characteristics, adequate stent expansion, and use of dual antiplatelet therapy [9].
The observed finding of small increase in target-vessel failure in PtCr-EES versus the BP-BES needs to be interpreted with caution. First, this was an observational study, and the treatment strategy or choice of stent was determined by a local interventional cardiologist, which could lead to selection bias. Although the authors performed propensity analysis, residual cofounding is likely. Second, since there was no difference in the primary analysis, the subgroup analysis becomes less important. In addition, authors did not perform statistical correction for multiple comparisons.
Despite the above limitations, this large-scale observational study gives us important insights to the performance of each second-generation DES. All currently available second-generation DES appear to be an option for use for left main coronary intervention.
Applications for Clinical Practice
In patients presenting with significant left main disease, left main PCI using a contemporary second-generation stent is safe and effective and likely has equivalent outcomes to CABG. However, PCI may be associated with higher rate of repeat revascularization. The rate of target-vessel failure was similar between different types of second-generation DES.
—Taishi Hirai, MD, and John E.A. Blair, MD, University of Chicago Medical Center, Chicago, IL
1. Rab T, Sheiban I, Louvard Y, et al. Current interventions for the left main bifurcation. JACC Cardiovasc Interv 2017;10:849–65.
2. Morice MC, Serruys PW, Kappetein AP, et al. Outcomes in patients with de novo left main disease treated with either percutaneous coronary intervention using paclitaxel-eluting stents or coronary artery bypass graft treatment in the Synergy Between Percutaneous Coronary Intervention with TAXUS and Cardiac Surgery (SYNTAX) trial. Circulation 2010;121:2645–53.
3. Park SJ, Kim YH, Park DW, et al. Randomized trial of stents versus bypass surgery for left main coronary artery disease. N Engl J Med 2011;364:1718–27.
4. Fihn SD, Blankenship JC, Alexander KP, et al. 2014 ACC/AHA/AATS/PCNA/SCAI/STS focused update of the guideline for the diagnosis and management of patients with stable ischemic heart disease: a report of the American College of Cardiology/American Heart Association Task Force on Practice Guidelines, and the American Association for Thoracic Surgery, Preventive Cardiovascular Nurses Association, Society for Cardiovascular Angiography and Interventions, and Society of Thoracic Surgeons. J Am Coll Cardiol 2014;64:1929–49.
5. Windecker S, Kolh P, Alfonso F, et al. 2014 ESC/EACTS Guidelines on myocardial revascularization: The Task Force on Myocardial Revascularization of the European Society of Cardiology (ESC) and the European Association for Cardio-Thoracic Surgery (EACTS)Developed with the special contribution of the European Association of Percutaneous Cardiovascular Interventions (EAPCI). Eur Heart J 2014;35:2541–619.
6. Stone GW, Sabik JF, Serruys PW, et al. Everolimus-eluting stents or bypass surgery for left main coronary artery disease. N Engl J Med 2016;375:2223–35.
7. Mäkikallio T, Holm NR, Lindsay M, et al. Percutaneous coronary angioplasty versus coronary artery bypass grafting in treatment of unprotected left main stenosis (NOBLE): a prospective, randomised, open-label, non-inferiority trial. Lancet 2016;388:2743–52.
8. Lee PH, Kwon O, Ahn JM, et al. Safety and effectiveness of second-generation drug-eluting stents in patients with left main coronary artery disease. J Am Coll Cardiol 2018;71:832–41.
9. Claessen BE, Henriques JP, Jaffer FA, et al. Stent thrombosis: a clinical perspective. JACC Cardiovasc Interv 2014;7:1081–92.
Study Overview
Objective. To compare the effectiveness and safety profiles of various second-generation drug-eluting stents (DES) for left main coronary intervention.
Design. Retrospective study using 3 multicenter prospective registries (IRIS-DES, IRIS-MAIN, PRECOMBAT).
Setting and participants. Among the 4470 patients enrolled in the 3 registries treated between July 2007 and July 2015, the authors identified 2692 patients with significant left main coronary artery disease who received second-generation DES for inclusion in the study. The centers for IRIS-DES and PRECOMBAT are academic and community hospitals in South Korea, with IRIS-MAIN involving academic and community hospitals in South Korea, China, India, Indonesia, Japan, Malaysia, Taiwan, and Thailand. Of the patients in these registries, 1254 received cobalt-chromium everolimus-eluting stents (CoCr-EES), 232 biodegradable polymer biolimus-eluting stents (BP-BES), 616 platinum-chromium EES (PtCr-EES) and 590 Resolute zotarolimus-eluting stents (Re-ZES).
Main outcome measure. Target-vessel failure.
Main results. At 3 years, rates of target-vessel failure were not significantly different for the different types of stents (16.7% for the CoCr-EES, 13.2% for the BP-BES, 18.7% for the PtCr-EES, and 14.7% for the Re-ZES; P = 0.15). The adjusted hazard ratios (HRs) for target-vessel failure were similar in between-group comparisons of the different stents, except for the PtCr-EES versus the BP-BES (HR 1.60, 95% confidence interval 1.01 to 2.54; P = 0.046). There were no significant differences in risk of composite of all-cause death, any myocardial infarction, or any revascularization and its individual components according to the different types of stents.
Conclusion. There was no significant between-group differences in 3-year risk of target-vessel failure, except for a higher risk of primary outcome with PtCr-EES compared to BP-BES.
Commentary
Left main coronary artery disease is identified in 5% to 7% of the population and is one of the more perplexing lesions to treat given the poorer outcome compared to non–left main lesion and the importance of the vessels the left main supplies [1]. Historically, coronary artery bypass grafting (CABG) has been the standard of care on the basis of the survival benefit observed in early trials compared with medical therapy. Left main percutaneous coronary intervention (PCI) has evolved as an alternative to CABG over the past few decades. Early studies using balloon angioplasty or bare metal stents were limited primarily due to high restenosis rate [1]. In the DES era, results have been overall comparable to CABG. Unprotected left main PCI using first-generation DES was non-inferior compared to CABG in the pre-specified sub-study of SYNTAX trial and in PRECOMBAT trial using paclitaxel-eluting stents and sirolimus-eluting stents, respectively [2,3]. Largely based on these trials, the 2014 ACC/AHA guidelines give class IIa recommendation for patients with low-risk anatomy (Syntax score 0–22) and class IIb recommendation for patients with intermediate-risk anatomy (Syntax score 23–32) for left main PCI [4]. Moreover, European guidelines give class Ib recommendation for patients with low-risk anatomy, and class IIa recommendation for intermediate-risk anatomy for left main PCI [5]. However, the SYNTAX trial and PRECOMBAT trial were limited by not meeting non-inferiority (SYNTAX) and wide non-inferiority (PRECOMBAT) and selection bias due to large exclusion criteria. In addition, first-generation DES were used in these trials (tacrolimis-eluting stent for SYNTAX and sirolimus-eluting stent for PRECOMBAT). The standard of care has now shifted to wide use of second-generation DES [1].
Subsequently, 2 larger-scale clinical trials using second-generation DES were designed and results have been reported recently [6,7]. The EXCEL trial enrolled 1905 patients with significant left main coronary disease and compared CoCr-EES to CABG. At 3 years, the primary endpoint of a composite of death from any cause, stroke, or myocardial infarction occurred in 15.4% of the PCI patients and in 14.7% of the CABG patients (P = 0.02 for non-inferiority; P = 0.98 for superiority). Similarly, the NOBLE trial enrolled 1201 patients with significant left main coronary disease and compared PCI to CABG. In this trial, the biolimus-eluting second-generation stent became their preferred stent during the study period. At 5 years, the primary endpoint of a composite of all-cause mortality, non-procedural myocardial infarction, any repeat coronary intervention, and stroke was higher in PCI compared to CABG patients (28% vs 18%, HR 1.51, 95% CI 1.13–2.00), exceeding the limit of non-inferiority, and CABG was significantly better compared to PCI (P = 0.004). The difference in the results is likely due to trial design. The primary endpoint was different in the 2 studies—EXCEL did not include repeat coronary intervention in the composite endpoint. The NOBLE study had a longer enrollment period and earlier-generation stents (sirolimus-eluting) were used in the earlier stages of the trial. In addition, the NOBLE study did not assess for peri-procedural myocardial infarction as an endpoint, which is known to be associated with adverse outcome. In both trials, cardiovascular mortality and all-cause mortality were similar at the end of follow-up.
In this context, the Lee et al study compared 4 types of currently available second-generation stents by pooling data from 3 large registries in Asia [8]. The main finding from this study was that target-vessel failure, defined as the composite of cardiac death, target-vessel myocardial infarction, or target-vessel revascularization at 3 years follow-up was not different among the types of second-generation drug eluting stents (P = 0.15).
Another important finding from this study was that the stent thrombosis rate at follow-up was very low (< 1%). This is consistent with the EXCEL study, which reported a definite stent thrombosis rate of 0.7% and was lower than in the NOBLE study, which reported a rate of 3%. One of the possible explanations for this difference could be stent selection. In contrast to the EXCEL study, which exclusively used Co-Cr EES by study protocol, NOBLE
study included first-generation sirolimus-drug eluting stent (11%) and BP-BES (89%). However, there are multiple factors that contribute to stent thrombosis other than stent selection, such as lesion characteristics, adequate stent expansion, and use of dual antiplatelet therapy [9].
The observed finding of small increase in target-vessel failure in PtCr-EES versus the BP-BES needs to be interpreted with caution. First, this was an observational study, and the treatment strategy or choice of stent was determined by a local interventional cardiologist, which could lead to selection bias. Although the authors performed propensity analysis, residual cofounding is likely. Second, since there was no difference in the primary analysis, the subgroup analysis becomes less important. In addition, authors did not perform statistical correction for multiple comparisons.
Despite the above limitations, this large-scale observational study gives us important insights to the performance of each second-generation DES. All currently available second-generation DES appear to be an option for use for left main coronary intervention.
Applications for Clinical Practice
In patients presenting with significant left main disease, left main PCI using a contemporary second-generation stent is safe and effective and likely has equivalent outcomes to CABG. However, PCI may be associated with higher rate of repeat revascularization. The rate of target-vessel failure was similar between different types of second-generation DES.
—Taishi Hirai, MD, and John E.A. Blair, MD, University of Chicago Medical Center, Chicago, IL
1. Rab T, Sheiban I, Louvard Y, et al. Current interventions for the left main bifurcation. JACC Cardiovasc Interv 2017;10:849–65.
2. Morice MC, Serruys PW, Kappetein AP, et al. Outcomes in patients with de novo left main disease treated with either percutaneous coronary intervention using paclitaxel-eluting stents or coronary artery bypass graft treatment in the Synergy Between Percutaneous Coronary Intervention with TAXUS and Cardiac Surgery (SYNTAX) trial. Circulation 2010;121:2645–53.
3. Park SJ, Kim YH, Park DW, et al. Randomized trial of stents versus bypass surgery for left main coronary artery disease. N Engl J Med 2011;364:1718–27.
4. Fihn SD, Blankenship JC, Alexander KP, et al. 2014 ACC/AHA/AATS/PCNA/SCAI/STS focused update of the guideline for the diagnosis and management of patients with stable ischemic heart disease: a report of the American College of Cardiology/American Heart Association Task Force on Practice Guidelines, and the American Association for Thoracic Surgery, Preventive Cardiovascular Nurses Association, Society for Cardiovascular Angiography and Interventions, and Society of Thoracic Surgeons. J Am Coll Cardiol 2014;64:1929–49.
5. Windecker S, Kolh P, Alfonso F, et al. 2014 ESC/EACTS Guidelines on myocardial revascularization: The Task Force on Myocardial Revascularization of the European Society of Cardiology (ESC) and the European Association for Cardio-Thoracic Surgery (EACTS)Developed with the special contribution of the European Association of Percutaneous Cardiovascular Interventions (EAPCI). Eur Heart J 2014;35:2541–619.
6. Stone GW, Sabik JF, Serruys PW, et al. Everolimus-eluting stents or bypass surgery for left main coronary artery disease. N Engl J Med 2016;375:2223–35.
7. Mäkikallio T, Holm NR, Lindsay M, et al. Percutaneous coronary angioplasty versus coronary artery bypass grafting in treatment of unprotected left main stenosis (NOBLE): a prospective, randomised, open-label, non-inferiority trial. Lancet 2016;388:2743–52.
8. Lee PH, Kwon O, Ahn JM, et al. Safety and effectiveness of second-generation drug-eluting stents in patients with left main coronary artery disease. J Am Coll Cardiol 2018;71:832–41.
9. Claessen BE, Henriques JP, Jaffer FA, et al. Stent thrombosis: a clinical perspective. JACC Cardiovasc Interv 2014;7:1081–92.