User login
Two changes are made to resuscitation practice in delivery room
CHICAGO – , according to Gary M. Weiner, MD, of the department of pediatrics and neonatal-perinatal medicine at the University of Michigan and C.S. Mott Children’s Hospital in Ann Arbor.
One is recommending an electronic cardiac (EC) monitor to assess heart rate during resuscitation instead of relying on pulse oximetry, and the other is no longer recommending routine tracheal suction in nonvigorous babies with meconium-stained fluid, he told attendees at the American Academy of Pediatrics annual meeting.

About two-thirds of all births have a risk factor for needing resuscitation, and about 10%-20% of babies with a risk factor will need positive pressure ventilation (PPV). But risk factors do not identify all newborns who will need it. The risk is greatest for newborns less than 36 weeks’ or greater than 40 weeks’ gestational age, but 7% of term newborns will need PPV despite having no risk factors.
Situations in which there is the highest risk for advanced resuscitation include the following:
- Fetal bradycardia: 24-fold greater odds.
- Intrauterine growth restriction (IUGR): 20-fold greater odds.
- Clinical chorioamnionitis: 17-fold greater odds.
- Forceps or vacuum: 17-fold greater odds.
- Meconium-stained amniotic fluid (MSAF): 17-fold greater odds.
- Gestational diabetes: 16-fold greater odds.
- Abruption: 12-fold greater odds.
- General anesthesia: 11-fold greater odds.
These risks were determined in a prospective multicenter, case-control study of 61,593 births (Arch Dis Child Fetal Neonatal Ed. 2017 Jan;102[1]:F44-F50).
Assembling a team and using checklists
Teamwork and communication are key in delivery room emergencies, and teams should debrief afterward, ideally having videotaped the resuscitation, if possible, Dr. Weiner said.
He discussed preparation for a very-low-birth-weight birth, a “routine emergency” requiring many tasks in a short period of time: 130 tasks in the first hour and 40 in the first 3 minutes.
“Decisions made during the first hour have long-term implications, so you need multiple caregivers and a high-performance team,” Dr. Weiner said. In addition to a thorough understanding of the clinical situation, a high-performance team should have both effective leadership, and clearly defined roles and responsibilities for each member. Clinicians on the team need highly developed technical skills that they reliably and consistently execute with precision. “Practice, refine, practice, refine,” he emphasized.
It’s also important to make use of preset protocols, scripts, and checklists, Dr. Weiner said. These tools assure consistency, facilitate communication among team members, and improve outcomes. Research has shown that use of protocols, scripts, and checklists leads to improved stroke and trauma care, decreased complications during intubation, fewer central-line complications, and decreased perioperative mortality and complications.
He also recommended implementing a standardized equipment check and team briefing “time-out,” similar to a surgical time-out. This time-out gives teams an opportunity to identify a team leader, define member roles and responsibilities, check all equipment and supplies, discuss risk factors and possible scenarios, talk with the obstetrician and, if possible, introduce the leader or another team member to the parents.
In a study from University of California, San Diego, Medical Center, using checklists as part of resuscitation of potentially high-risk infants reduced the occurrence of communication problems from 24% to 4% of resuscitations (P less than 0.001) over a 3-year period (Resuscitation. 2013 Nov;84[11]:1552-7).
Delayed cord clamping
Dr. Weiner also discussed the benefits of placental transfusion. The fetal-placental unit includes approximately 110 mL/kg of blood, and about one-third of its volume remains in the placenta immediately after birth. Immediate cord clamping means a loss of 10-20 mL/kg of “potential” newborn blood volume, and could contribute to unstable pulmonary blood flow or a carotid artery pressure spike (Matern Health Neonatol Perinatol. 2016. doi: 10.1186/s40748-016-0032-y).
“Umbilical blood flow is complex,” he said. Blood flows toward the baby via the umbilical vein during inhalation, but stops or reverses during crying. The umbilical artery primarily carries blood to the placenta, and flow stops after about 4 minutes in more than half of infants. Gravity’s role in blood flow is controversial (Lancet. 2014 Jul 19;384[9939]:235-40).
The two options for placental transfusion are delayed cord clamping and milking the umbilical cord (also called “stripping”). In vaginal births, delayed clamping allows 20 mL/kg blood to transfer to the baby by 3 minutes after birth, with 90% of that reaching the baby in the first minute (Lancet. 1969 Oct 25;294[7626]:871-3).
Blood transfer is less efficient in cesarean births, so milking may be more efficient than simply delaying clamping, according to a small randomized controlled trial of preterm infants around 28 weeks’ gestational age. No difference between the methods was seen in vaginal births. To milk the cord, pinch it near the placenta and squeeze it toward the newborn for 2 seconds; then release, refill and repeat.
The biggest benefits in delayed cord clamping or milking occur among preterm infants: decreased mortality, higher mean arterial pressure on day 1, and a lower risk of blood transfusion, necrotizing enterocolitis, and a Bayley Motor score below 85 at 18-22 months. Term babies also get benefits, though: increased hemoglobin at birth (approximately 2 g/dL), a 0.5- to 5-point average increase in boys’ Ages & Stages fine motor and social domain scores at age 4 years, and among high-risk infants, a lower risk of iron deficiency anemia at age 1 year (JAMA Pediatr. 2017;171[3]:264-70).
According to current guidelines from the American Academy of Pediatrics, “delayed cord clamping longer than 30 seconds is reasonable for both term and preterm infants who do not require resuscitation at birth,” but “there is insufficient evidence to recommend an approach to cord clamping for infants who require resuscitation.” They also recommend against routine milking for newborns less than 29 weeks’ gestation (Pediatrics. 2015 Nov;136 Suppl 2:S196-218).
Meconium-related complications
Meconium-stained amniotic fluid (MSAF) is common, occurring in about 8% of deliveries and increasing with gestational age, but meconium aspiration syndrome (MAS) is less common, occurring in about 2% of all MSAF cases (Int J Pediatr. 2012. doi: 10.1155/2012/321545).
Risk factors for severe MAS include thick meconium and an abnormal fetal heart rate. But about two-thirds of MAS cases are mild, not requiring ventilation or continuous positive airway pressure (CPAP), Dr. Weiner said. Practice should be driven by evidence from randomized controlled trials (RCTs).
“Nonrandomized observational studies can be misleading, and rational conjecture has led to many mistakes in medicine,” he said. “Be willing to challenge conventional wisdom.”
For example, the standard of care in the 1970s, based on two nonrandomized retrospective reviews of 175 babies, included orapharyngeal and nasopharyngeal suction by the obstetrician and endotracheal tube (ETT) suction by the pediatrician. In the 2000s, however, an RCT of 2,500 infants found no benefit from orapharyngeal and nasopharyngeal suction, even with thick MSAF, (Lancet. 2004 Aug 14-20;364[9434]:597-602) and another RCT with 2,100 infants found no benefit from ETT suction (Pediatrics. 2000 Jan;105[1 Pt 1]:1-7).
More recent, smaller studies have confirmed those conclusions and found similar lack of benefit from ETT in non-vigorous infants, contributing to the new recommendation (Resuscitation. 2016 Aug;105:79-84; Indian J Pediatr. 2016 Oct;83[10]:1125-30).
“Routine tracheal suction is no longer recommended for nonvigorous babies with meconium stained fluid,” Dr. Weiner said. Since MSAF is risk factor for resuscitation, though, at least two clinicians with Neonatal Resuscitation Program (NRP) training should be present, as well as a full team if resuscitation is expected.
Heart rate assessment and tracking
“The baby’s heart rate needs to be monitored during PPV [positive pressure ventilation] because a prompt increase in the baby’s heart rate is the most important indicator of effective PPV,” Dr. Weiner said in an interview. “Half of errors made during NRP [Neonatal Resuscitation Program] simulations are the result of incorrect heart rate assessment.”
Recent evidence comparing pulse oximetry to an EC monitor favored the latter for tracking heart rate, leading to the other new recommendation.
“The baby’s heart rate can be monitored using the pulse oximeter,” Dr. Weiner said. “However, health providers should consider using an electronic cardiac monitor in addition to pulse oximetry because studies show that it achieves a reliable signal faster.” He cited a study of 20 newborns that showed an EC monitor determined the heart rate in a median 34 seconds, compared with 122 seconds with the pulse oximeter (Pediatr Int. 2012 Apr;54[2]:205-7).
Pulse oximetry takes 90-120 seconds to attain a reliable signal and may not work if there’s poor perfusion, but an EC monitor provides continuous heart rate monitoring even with poor perfusion. So an initial heart rate assessment by auscultation is fine, but if PPV begins, EC monitoring may be better and is the preferred method with anticipated resuscitation or chest compressions.
However, pulse oximetry is still recommended “whenever positive pressure ventilation is started or oxygen is administered in order to guide the appropriate amount of oxygen supplementation,” Dr. Weiner noted.
He added that “preliminary studies suggest that handheld Doppler fetal heart monitors correlate well with ECG, provide a rapid audible heart rate and may be a promising alternative in the future” (Pediatr Int. 2017 Oct;59[10]:1069-73).
Correct ventilation techniques
“Ventilation of the lungs is the single most important and most effective step in cardiopulmonary resuscitation of the compromised newborn,” Dr. Weiner said. “If the heart rate is not rapidly increasing, ask if the chest is moving.”
He emphasized that no compressions should occur until after at least 30 seconds of PPV that moves the chest. He provided a “MR. SOPA” acronym: Mask adjustment, Reposition airway, Suction, Open mouth, Pressure increase, Alternative airway.
You also should be aware of possible leaking or obstruction around the mask, which is common, he said, so monitor pressure instead of volume.
“We are not good at identifying leak, obstruction, or adequate tidal volume,” Dr. Weiner said. “A colorimetric CO2 detector attached to the mask is a simple indicator of gas exchange” (Resuscitation. 2014 Nov;85[11]:1568-72).
He also strongly recommended inserting an alternative airway before starting chest compressions with either intubation or a laryngeal mask.
Dr. Weiner concluded with the following list of clinical practice changes you may consider:
- Use a standardized equipment checklist.
- Develop and practice standardized scripts.
- Debrief after all resuscitations; use videotape if you can.
- Delay cord clamping for most term and preterm babies.
- Do not routinely intubate/suction nonvigorous newborns with MSAF. Initiate resuscitation.
- Use an electronic cardiac monitor if resuscitation is required.
- Use a colorimetric CO2 detector with PPV.
- Intubate or place a laryngeal mask before starting compressions.
Dr. Weiner reported having no disclosures, and no external funding was used for the presentation.
CHICAGO – , according to Gary M. Weiner, MD, of the department of pediatrics and neonatal-perinatal medicine at the University of Michigan and C.S. Mott Children’s Hospital in Ann Arbor.
One is recommending an electronic cardiac (EC) monitor to assess heart rate during resuscitation instead of relying on pulse oximetry, and the other is no longer recommending routine tracheal suction in nonvigorous babies with meconium-stained fluid, he told attendees at the American Academy of Pediatrics annual meeting.
About two-thirds of all births have a risk factor for needing resuscitation, and about 10%-20% of babies with a risk factor will need positive pressure ventilation (PPV). But risk factors do not identify all newborns who will need it. The risk is greatest for newborns less than 36 weeks’ or greater than 40 weeks’ gestational age, but 7% of term newborns will need PPV despite having no risk factors.
Situations in which there is the highest risk for advanced resuscitation include the following:
- Fetal bradycardia: 24-fold greater odds.
- Intrauterine growth restriction (IUGR): 20-fold greater odds.
- Clinical chorioamnionitis: 17-fold greater odds.
- Forceps or vacuum: 17-fold greater odds.
- Meconium-stained amniotic fluid (MSAF): 17-fold greater odds.
- Gestational diabetes: 16-fold greater odds.
- Abruption: 12-fold greater odds.
- General anesthesia: 11-fold greater odds.
These risks were determined in a prospective multicenter, case-control study of 61,593 births (Arch Dis Child Fetal Neonatal Ed. 2017 Jan;102[1]:F44-F50).
Assembling a team and using checklists
Teamwork and communication are key in delivery room emergencies, and teams should debrief afterward, ideally having videotaped the resuscitation, if possible, Dr. Weiner said.
He discussed preparation for a very-low-birth-weight birth, a “routine emergency” requiring many tasks in a short period of time: 130 tasks in the first hour and 40 in the first 3 minutes.
“Decisions made during the first hour have long-term implications, so you need multiple caregivers and a high-performance team,” Dr. Weiner said. In addition to a thorough understanding of the clinical situation, a high-performance team should have both effective leadership, and clearly defined roles and responsibilities for each member. Clinicians on the team need highly developed technical skills that they reliably and consistently execute with precision. “Practice, refine, practice, refine,” he emphasized.
It’s also important to make use of preset protocols, scripts, and checklists, Dr. Weiner said. These tools assure consistency, facilitate communication among team members, and improve outcomes. Research has shown that use of protocols, scripts, and checklists leads to improved stroke and trauma care, decreased complications during intubation, fewer central-line complications, and decreased perioperative mortality and complications.
He also recommended implementing a standardized equipment check and team briefing “time-out,” similar to a surgical time-out. This time-out gives teams an opportunity to identify a team leader, define member roles and responsibilities, check all equipment and supplies, discuss risk factors and possible scenarios, talk with the obstetrician and, if possible, introduce the leader or another team member to the parents.
In a study from University of California, San Diego, Medical Center, using checklists as part of resuscitation of potentially high-risk infants reduced the occurrence of communication problems from 24% to 4% of resuscitations (P less than 0.001) over a 3-year period (Resuscitation. 2013 Nov;84[11]:1552-7).
Delayed cord clamping
Dr. Weiner also discussed the benefits of placental transfusion. The fetal-placental unit includes approximately 110 mL/kg of blood, and about one-third of its volume remains in the placenta immediately after birth. Immediate cord clamping means a loss of 10-20 mL/kg of “potential” newborn blood volume, and could contribute to unstable pulmonary blood flow or a carotid artery pressure spike (Matern Health Neonatol Perinatol. 2016. doi: 10.1186/s40748-016-0032-y).
“Umbilical blood flow is complex,” he said. Blood flows toward the baby via the umbilical vein during inhalation, but stops or reverses during crying. The umbilical artery primarily carries blood to the placenta, and flow stops after about 4 minutes in more than half of infants. Gravity’s role in blood flow is controversial (Lancet. 2014 Jul 19;384[9939]:235-40).
The two options for placental transfusion are delayed cord clamping and milking the umbilical cord (also called “stripping”). In vaginal births, delayed clamping allows 20 mL/kg blood to transfer to the baby by 3 minutes after birth, with 90% of that reaching the baby in the first minute (Lancet. 1969 Oct 25;294[7626]:871-3).
Blood transfer is less efficient in cesarean births, so milking may be more efficient than simply delaying clamping, according to a small randomized controlled trial of preterm infants around 28 weeks’ gestational age. No difference between the methods was seen in vaginal births. To milk the cord, pinch it near the placenta and squeeze it toward the newborn for 2 seconds; then release, refill and repeat.
The biggest benefits in delayed cord clamping or milking occur among preterm infants: decreased mortality, higher mean arterial pressure on day 1, and a lower risk of blood transfusion, necrotizing enterocolitis, and a Bayley Motor score below 85 at 18-22 months. Term babies also get benefits, though: increased hemoglobin at birth (approximately 2 g/dL), a 0.5- to 5-point average increase in boys’ Ages & Stages fine motor and social domain scores at age 4 years, and among high-risk infants, a lower risk of iron deficiency anemia at age 1 year (JAMA Pediatr. 2017;171[3]:264-70).
According to current guidelines from the American Academy of Pediatrics, “delayed cord clamping longer than 30 seconds is reasonable for both term and preterm infants who do not require resuscitation at birth,” but “there is insufficient evidence to recommend an approach to cord clamping for infants who require resuscitation.” They also recommend against routine milking for newborns less than 29 weeks’ gestation (Pediatrics. 2015 Nov;136 Suppl 2:S196-218).
Meconium-related complications
Meconium-stained amniotic fluid (MSAF) is common, occurring in about 8% of deliveries and increasing with gestational age, but meconium aspiration syndrome (MAS) is less common, occurring in about 2% of all MSAF cases (Int J Pediatr. 2012. doi: 10.1155/2012/321545).
Risk factors for severe MAS include thick meconium and an abnormal fetal heart rate. But about two-thirds of MAS cases are mild, not requiring ventilation or continuous positive airway pressure (CPAP), Dr. Weiner said. Practice should be driven by evidence from randomized controlled trials (RCTs).
“Nonrandomized observational studies can be misleading, and rational conjecture has led to many mistakes in medicine,” he said. “Be willing to challenge conventional wisdom.”
For example, the standard of care in the 1970s, based on two nonrandomized retrospective reviews of 175 babies, included orapharyngeal and nasopharyngeal suction by the obstetrician and endotracheal tube (ETT) suction by the pediatrician. In the 2000s, however, an RCT of 2,500 infants found no benefit from orapharyngeal and nasopharyngeal suction, even with thick MSAF, (Lancet. 2004 Aug 14-20;364[9434]:597-602) and another RCT with 2,100 infants found no benefit from ETT suction (Pediatrics. 2000 Jan;105[1 Pt 1]:1-7).
More recent, smaller studies have confirmed those conclusions and found similar lack of benefit from ETT in non-vigorous infants, contributing to the new recommendation (Resuscitation. 2016 Aug;105:79-84; Indian J Pediatr. 2016 Oct;83[10]:1125-30).
“Routine tracheal suction is no longer recommended for nonvigorous babies with meconium stained fluid,” Dr. Weiner said. Since MSAF is risk factor for resuscitation, though, at least two clinicians with Neonatal Resuscitation Program (NRP) training should be present, as well as a full team if resuscitation is expected.
Heart rate assessment and tracking
“The baby’s heart rate needs to be monitored during PPV [positive pressure ventilation] because a prompt increase in the baby’s heart rate is the most important indicator of effective PPV,” Dr. Weiner said in an interview. “Half of errors made during NRP [Neonatal Resuscitation Program] simulations are the result of incorrect heart rate assessment.”
Recent evidence comparing pulse oximetry to an EC monitor favored the latter for tracking heart rate, leading to the other new recommendation.
“The baby’s heart rate can be monitored using the pulse oximeter,” Dr. Weiner said. “However, health providers should consider using an electronic cardiac monitor in addition to pulse oximetry because studies show that it achieves a reliable signal faster.” He cited a study of 20 newborns that showed an EC monitor determined the heart rate in a median 34 seconds, compared with 122 seconds with the pulse oximeter (Pediatr Int. 2012 Apr;54[2]:205-7).
Pulse oximetry takes 90-120 seconds to attain a reliable signal and may not work if there’s poor perfusion, but an EC monitor provides continuous heart rate monitoring even with poor perfusion. So an initial heart rate assessment by auscultation is fine, but if PPV begins, EC monitoring may be better and is the preferred method with anticipated resuscitation or chest compressions.
However, pulse oximetry is still recommended “whenever positive pressure ventilation is started or oxygen is administered in order to guide the appropriate amount of oxygen supplementation,” Dr. Weiner noted.
He added that “preliminary studies suggest that handheld Doppler fetal heart monitors correlate well with ECG, provide a rapid audible heart rate and may be a promising alternative in the future” (Pediatr Int. 2017 Oct;59[10]:1069-73).
Correct ventilation techniques
“Ventilation of the lungs is the single most important and most effective step in cardiopulmonary resuscitation of the compromised newborn,” Dr. Weiner said. “If the heart rate is not rapidly increasing, ask if the chest is moving.”
He emphasized that no compressions should occur until after at least 30 seconds of PPV that moves the chest. He provided a “MR. SOPA” acronym: Mask adjustment, Reposition airway, Suction, Open mouth, Pressure increase, Alternative airway.
You also should be aware of possible leaking or obstruction around the mask, which is common, he said, so monitor pressure instead of volume.
“We are not good at identifying leak, obstruction, or adequate tidal volume,” Dr. Weiner said. “A colorimetric CO2 detector attached to the mask is a simple indicator of gas exchange” (Resuscitation. 2014 Nov;85[11]:1568-72).
He also strongly recommended inserting an alternative airway before starting chest compressions with either intubation or a laryngeal mask.
Dr. Weiner concluded with the following list of clinical practice changes you may consider:
- Use a standardized equipment checklist.
- Develop and practice standardized scripts.
- Debrief after all resuscitations; use videotape if you can.
- Delay cord clamping for most term and preterm babies.
- Do not routinely intubate/suction nonvigorous newborns with MSAF. Initiate resuscitation.
- Use an electronic cardiac monitor if resuscitation is required.
- Use a colorimetric CO2 detector with PPV.
- Intubate or place a laryngeal mask before starting compressions.
Dr. Weiner reported having no disclosures, and no external funding was used for the presentation.
EXPERT ANALYSIS FROM AAP 2017
Chinese school-based flu vaccination program reduced outbreaks
, said Yang Pan, PhD, of the Institute for Infectious Disease and Endemic Disease Control, Beijing Center for Disease Prevention and Control, and associates.
School-based trivalent inactivated influenza vaccination programs generally occurred Oct. 15-Nov. 30 each year since 2007, with greater than 50% vaccination coverage. In an 11-year retrospective study of school outbreaks of influenza in elementary, middle, and high schools in the Beijing area during Sept. 1, 2006-March 31, 2017, there were 286 febrile outbreaks in schools, involving 6,863 children.
During the 11 years, a mismatch between circulating strains and vaccine strains was identified in two influenza seasons, such as “the A(H3N2) 3C.1 (vaccine strain)-A(H3N2) 3C.3a (circulating strains) mismatch in 2014-2015, the B(Yamagata) Clade 2 (vaccine strain)-B(Yamagata) Clade 3 (circulating strain) mismatch in the 2014-2015 influenza season, and B(Yamagata) (vaccine strain)-B(Victoria) (circulating strains) mismatch in 2015-2016,” they reported.
A combination of high flu vaccine coverage because of school-based vaccinations and a good vaccine match reduced influenza outbreaks in schools by 89% (odds ratio, 0.111), Dr. Pan and associates concluded.
“The school-based influenza vaccination program has been in operation for nearly 10 years in the Beijing area, is unique in China, and is one of the few school-based influenza programs in the world,” the researchers explained. “These data can inform and improve vaccination policy locally and nationally.”
Read more in Vaccine (2017 Nov 8. doi: 10.1016/j.vaccine.2017.10.096).
FROM VACCINE
New opportunities for gastroenterology leadership in the evolving payment reform landscape
This year’s Congressional debate over repealing or reforming key provisions of the Affordable Care Act was contentious in large part because of the high and rising costs of health care. Though a new health care reform bill is now unlikely, it remains critical to continue the discussion on how to deliver and pay for care in a way that addresses these high costs and makes coverage more affordable through more efficient and high-quality approaches.1

Illustrating the bipartisan nature of payment reforms, the Medicare Access and CHIP Reauthorization Act (MACRA) passed with more than 90% support in both the House and Senate in 2015. MACRA provides a 5% bonus payment for physicians who receive a significant part of their Medicare payments in an advanced APM, which involves some downside financial risk. In addition, any physician who participates significantly in a broader range of Medicare APMs, including many without downside risk, receives an exception from the reporting requirements for the new Merit-Based Incentive Payment System (MIPS) and would report on APM performance measures instead.
However, the details of payment reform are challenging and will benefit from engagement and leadership by physicians – including in gastroenterology. A new survey shows that the Department of Health and Human Services has achieved its goal of having 30% of health care payments tied to APMs by the end of 2016.3 It hopes to have 50% by the end of 2018.

Physician-Focused Payment Model Technical Advisory Committee’s role in recommending new payment models
The paucity of APMs was one reason the MACRA law established the Physician-Focused Payment Model Technical Advisory Committee (PTAC). Organizations can submit proposals for new Medicare payment models to PTAC, which then are reviewed according to 10 established criteria. The criteria place particular emphasis on the scope of the APM, the APM’s ability to increase quality while maintaining or decreasing costs, and whether the payment methodology improves on current policy. PTAC then makes recommendations to CMS for full implementation of a proposal, limited testing (a pilot program), or no implementation.
The fate of the two GI APMs offers broad insight on the path forward for new specialized-care models. Although PTAC focuses on physician payment, its criteria and critiques emphasize that the primary focus of any APM should be on the full spectrum of patient care. Project Sonar likely received a positive recommendation because it focused on shifting payment to improving chronic care and avoiding complications. Although the colonoscopy proposal was withdrawn, we can gain a sense of PTAC’s concerns through the preliminary review.5 The review argues the proposal did not sufficiently address how it would lead to a more efficient, better integrated, and higher quality screening that improves patient health. More specifically, the review criticized the proposal for focusing primarily on a site-of-service shift and offering fewer details on how the APM would reduce overutilization.
Overall, PTAC’s deliberations at both its April and September meetings suggest that it will deeply scrutinize models focusing only on a single procedure or specialty, or ones that it believes do not sufficiently coordinate with primary care or other specialties, because it does not believe that such models have a sufficiently comprehensive patient focus. These PTAC reviews also suggest that the Committee will recommend programs with ideas they find viable, even if committee members have expressed concerns about certain aspects. Indeed, despite preliminary recommendations against 6 initial proposals, the full Committee has approved 3 of them for limited testing. The Committee was receptive to the argument that without testing APMs in the real world, even if those programs have limitations, the field cannot move forward.

Implications for gastrointestinal practice and planning
Despite the many challenges in payment model development, the broader march toward APMs will continue, driven by increasing pressures to provide access to quality care while controlling costs. Further developments in several areas bear watching because they could accelerate opportunities for gastroenterologists.
Most notable is the considerable payment model innovation underway in private health insurance plans and state Medicaid plans, models that could develop into PTAC submissions. Project Sonar was first implemented in collaboration with a private payer in Illinois. Similarly, the inflammatory bowel disease specialty medical home was developed at the University of Pittsburgh. Both successfully have achieved the Triple Aim, improving patient experience and population health while decreasing medical costs.6 The private sector can serve as a testing ground for new APMs and the new administration’s desire to support innovative private sector models of care reform makes CMS likely to take further steps to support these approaches.
Second, working with both private and public payers, gastroenterologists could expand the concept of a specialty medical home or a primary-specialty coordinated medical home by incorporating more aspects of GI care. Chronic liver disease, chronic pancreatitis, and irritable bowel syndrome all could benefit from these approaches.7 Medical home models generally include a shift from fee-for-service payments by providing per-patient payments (potentially risk-adjusted) to the coordinating physician for a period of time. That per-member per-month payment may enable additional patient-centric services such as extending access to care, regular patient outreach to monitor changes in health status, and partnering with primary care and other providers to help patients access treatment for comorbid conditions.
Third, as evidenced by the PTAC critique on the Comprehensive Colonoscopy APM, a revised approach is needed for bundled episode payment reforms to better support endoscopists focused on performing high-quality procedures. Given their procedural focus, these physicians will need to show the value of endoscopic services in well-coordinated patient care. Site-of-service shifts are helpful where appropriate, but bundle proposals also must consider coordination with primary care providers on appropriate referrals, encouragement of non-endoscopic approaches, preparation technique to minimize the number of procedures that have to be repeated, and reducing anesthesia care for low-risk patients. These considerations generally suggest a broader episode payment model related to the goals of the procedure, rather than endoscopy-based bundles alone.
For example, a bundled payment for colorectal cancer screening, covering a full episode of treatment beyond a single colonoscopy, would make it easier for gastroenterologists to work more effectively with primary care providers to reduce gaps in colorectal cancer screening rates at the lowest possible overall cost. This bundle could be implemented by a specialized GI practice in conjunction with a primary care medical home or an ACO. If such a broad bundle is too much of a practice shift, an endoscopy-based episode payment could include performance measures and limited additional payments related to these same patient-focused objectives.
The kinds of reforms described earlier could work well with both primary care–focused and ACO models. However, there are technical challenges in dealing with overlapping payment reforms, and gastroenterologists should look for further guidance from CMS on how bundled episode payments and other specialized-care payment reforms will interact with APMs for primary care, such as ACOs and the Project Sonar model recommended by PTAC.8
Despite the broader shift toward APMs, it remains likely that many gastroenterologists will participate in the fee-for-service–based MIPS program in the near term. These physicians still will face fundamental pressures to deliver better value. Here, there may be opportunities to improve coordination in the MIPS program through additional care coordination payments for chronic disease, complementing the chronic care management payments that primary care physicians receive. Such payments would encourage further development and testing of more meaningful and outcome-oriented performance measures related to GI care.
Finally, GI care would benefit from better evidence for all GI-related payment reforms. Many of these reforms will be implemented outside of Medicare, but do not have results reported in a manner that make it easy to assess their impact and potential for broader implementation. Building an evidence base is feasible without imposing large costs or additional burdens on practices, especially when evaluations are implemented along with payment reforms, and offers the best way for organizations to learn and improve based on what works and what does not.9
Conclusions
Though the health care debate has ended in Congress for now, the march toward payment reform will continue. To accelerate progress, continued leadership from gastroenterologists is needed, especially in finding solutions that move beyond traditional GI practice. Collaborative incremental models that advance population health and are feasible to implement will provide the best opportunity for practice reform. Effective partnerships with primary care are particularly important to help avoid traditional gatekeeper approaches, and move toward a patient-centric model of shared accountability in which specialists function as a key partner in a medical neighborhood.10 Gastroenterologists can shape these steps, not only through PTAC and Medicare APMs, but through the other steps described earlier, and have a unique role in developing new models that leverage their specialty expertise. However, these models cannot be developed in isolation, and increased collaboration with primary care and other medical and nonmedical specialists will be critical. Physicians should start identifying opportunities to improve their practices and build these relationships now. These investments will allow them to thrive as new payment models come online.
References
1. Dzau V.J., McClellan M.B., McGinnis J.M. Vital directions for health and health care: priorities from a National Academy of Medicine initiative. JAMA 2017;317:1461-70.
2. Alternative Payment Model Framework Progress Tracking Work Group. Alternative payment model (APM) framework. Health
Care Payment Learning and Action Network. Available from: https://hcp-lan.org/workproducts/apm-whitepaper.pdf. Accessed: January 12, 2016.
3. Health Care Payment Learning and Action Network. APM Measurement: Progress of Alternative Payment Models. Available from: http://hcp-lan.org/workproducts/measurement_discussion%20article_2017.pdf Accessed November 2, 2017.
4. McClellan M., McStay F., Saunders R. The roadmap to physician payment reform: what it will take for all clinicians to succeed
under MACRA. Health Affairs Blog. Available from: http://healthaffairs.org/blog/2016/08/30/the-roadmap-to-physicianpayment-reform-what-it-will-take-for-all-clinicians-to-succeedunder-macra/. Accessed: August 30, 2016.
5. Medows R., Casale P., Berenson R. Preliminary review team report to the physician-focused Payment Model Technical Advisory Committee (PTAC). Physician-Focused Payment Model Technical Advisory Committee. Available from: https://aspe.hhs.gov/system/files/pdf/255906/DHNPRTReport.pdf. Accessed: March 22, 2017.
6. Regueiro M., Click B., Holder D., et al. Constructing an inflammatory bowel disease patient–centered medical home. Clin Gastroenterol Hepatol. 2017;15:1148-53.
7. Meier S.K., Shah N.D., Talwalkar J.A., et al. Adapting the patient-centered specialty practice model for populations with cirrhosis. Clin Gastroenterol Hepatol. 2016;14:492-6.
8. Pham H., Chernew M., Shrank W., et al. Market momentum, spillover effects, and evidence-based decision making on payment reform. Health Affairs Blog. Available from: http:// healthaffairs.org/blog/2017/05/24/market-momentum-spillovereffects-and-evidence-based-decision-making-on-paymentreform/. Accessed: May 24, 2017.
9. McClellan M., Richards R., Japinga M. Evidence on payment reform: where are the gaps? Health Affairs Blog. Available from: http://healthaffairs.org/blog/2017/04/25/evidence-onpayment-reform-where-are-the-gaps/. Accessed: April 25, 2017.
10. Huang X., Rosenthal M.B. Transforming specialty practice – the patient-centered medical neighborhood. N Engl J Med 2014;370:1376-9.
Mr. Japinga, Dr. Saunders, and Dr. McClellan are at the Duke-Margolis Center for Health Policy, Washington; Dr. Gellad is in the division of gastroenterology at the Duke University School of Medicine and at the Durham VA Medical Center, Durham, N.C. Dr. Gellad was supported by a Career Development Award from Veterans Affairs Health Services Research (CDA 14-158). The authors had no conflicts of interest.
This year’s Congressional debate over repealing or reforming key provisions of the Affordable Care Act was contentious in large part because of the high and rising costs of health care. Though a new health care reform bill is now unlikely, it remains critical to continue the discussion on how to deliver and pay for care in a way that addresses these high costs and makes coverage more affordable through more efficient and high-quality approaches.1
Illustrating the bipartisan nature of payment reforms, the Medicare Access and CHIP Reauthorization Act (MACRA) passed with more than 90% support in both the House and Senate in 2015. MACRA provides a 5% bonus payment for physicians who receive a significant part of their Medicare payments in an advanced APM, which involves some downside financial risk. In addition, any physician who participates significantly in a broader range of Medicare APMs, including many without downside risk, receives an exception from the reporting requirements for the new Merit-Based Incentive Payment System (MIPS) and would report on APM performance measures instead.
However, the details of payment reform are challenging and will benefit from engagement and leadership by physicians – including in gastroenterology. A new survey shows that the Department of Health and Human Services has achieved its goal of having 30% of health care payments tied to APMs by the end of 2016.3 It hopes to have 50% by the end of 2018.
Physician-Focused Payment Model Technical Advisory Committee’s role in recommending new payment models
The paucity of APMs was one reason the MACRA law established the Physician-Focused Payment Model Technical Advisory Committee (PTAC). Organizations can submit proposals for new Medicare payment models to PTAC, which then are reviewed according to 10 established criteria. The criteria place particular emphasis on the scope of the APM, the APM’s ability to increase quality while maintaining or decreasing costs, and whether the payment methodology improves on current policy. PTAC then makes recommendations to CMS for full implementation of a proposal, limited testing (a pilot program), or no implementation.
The fate of the two GI APMs offers broad insight on the path forward for new specialized-care models. Although PTAC focuses on physician payment, its criteria and critiques emphasize that the primary focus of any APM should be on the full spectrum of patient care. Project Sonar likely received a positive recommendation because it focused on shifting payment to improving chronic care and avoiding complications. Although the colonoscopy proposal was withdrawn, we can gain a sense of PTAC’s concerns through the preliminary review.5 The review argues the proposal did not sufficiently address how it would lead to a more efficient, better integrated, and higher quality screening that improves patient health. More specifically, the review criticized the proposal for focusing primarily on a site-of-service shift and offering fewer details on how the APM would reduce overutilization.
Overall, PTAC’s deliberations at both its April and September meetings suggest that it will deeply scrutinize models focusing only on a single procedure or specialty, or ones that it believes do not sufficiently coordinate with primary care or other specialties, because it does not believe that such models have a sufficiently comprehensive patient focus. These PTAC reviews also suggest that the Committee will recommend programs with ideas they find viable, even if committee members have expressed concerns about certain aspects. Indeed, despite preliminary recommendations against 6 initial proposals, the full Committee has approved 3 of them for limited testing. The Committee was receptive to the argument that without testing APMs in the real world, even if those programs have limitations, the field cannot move forward.
Implications for gastrointestinal practice and planning
Despite the many challenges in payment model development, the broader march toward APMs will continue, driven by increasing pressures to provide access to quality care while controlling costs. Further developments in several areas bear watching because they could accelerate opportunities for gastroenterologists.
Most notable is the considerable payment model innovation underway in private health insurance plans and state Medicaid plans, models that could develop into PTAC submissions. Project Sonar was first implemented in collaboration with a private payer in Illinois. Similarly, the inflammatory bowel disease specialty medical home was developed at the University of Pittsburgh. Both successfully have achieved the Triple Aim, improving patient experience and population health while decreasing medical costs.6 The private sector can serve as a testing ground for new APMs and the new administration’s desire to support innovative private sector models of care reform makes CMS likely to take further steps to support these approaches.
Second, working with both private and public payers, gastroenterologists could expand the concept of a specialty medical home or a primary-specialty coordinated medical home by incorporating more aspects of GI care. Chronic liver disease, chronic pancreatitis, and irritable bowel syndrome all could benefit from these approaches.7 Medical home models generally include a shift from fee-for-service payments by providing per-patient payments (potentially risk-adjusted) to the coordinating physician for a period of time. That per-member per-month payment may enable additional patient-centric services such as extending access to care, regular patient outreach to monitor changes in health status, and partnering with primary care and other providers to help patients access treatment for comorbid conditions.
Third, as evidenced by the PTAC critique on the Comprehensive Colonoscopy APM, a revised approach is needed for bundled episode payment reforms to better support endoscopists focused on performing high-quality procedures. Given their procedural focus, these physicians will need to show the value of endoscopic services in well-coordinated patient care. Site-of-service shifts are helpful where appropriate, but bundle proposals also must consider coordination with primary care providers on appropriate referrals, encouragement of non-endoscopic approaches, preparation technique to minimize the number of procedures that have to be repeated, and reducing anesthesia care for low-risk patients. These considerations generally suggest a broader episode payment model related to the goals of the procedure, rather than endoscopy-based bundles alone.
For example, a bundled payment for colorectal cancer screening, covering a full episode of treatment beyond a single colonoscopy, would make it easier for gastroenterologists to work more effectively with primary care providers to reduce gaps in colorectal cancer screening rates at the lowest possible overall cost. This bundle could be implemented by a specialized GI practice in conjunction with a primary care medical home or an ACO. If such a broad bundle is too much of a practice shift, an endoscopy-based episode payment could include performance measures and limited additional payments related to these same patient-focused objectives.
The kinds of reforms described earlier could work well with both primary care–focused and ACO models. However, there are technical challenges in dealing with overlapping payment reforms, and gastroenterologists should look for further guidance from CMS on how bundled episode payments and other specialized-care payment reforms will interact with APMs for primary care, such as ACOs and the Project Sonar model recommended by PTAC.8
Despite the broader shift toward APMs, it remains likely that many gastroenterologists will participate in the fee-for-service–based MIPS program in the near term. These physicians still will face fundamental pressures to deliver better value. Here, there may be opportunities to improve coordination in the MIPS program through additional care coordination payments for chronic disease, complementing the chronic care management payments that primary care physicians receive. Such payments would encourage further development and testing of more meaningful and outcome-oriented performance measures related to GI care.
Finally, GI care would benefit from better evidence for all GI-related payment reforms. Many of these reforms will be implemented outside of Medicare, but do not have results reported in a manner that make it easy to assess their impact and potential for broader implementation. Building an evidence base is feasible without imposing large costs or additional burdens on practices, especially when evaluations are implemented along with payment reforms, and offers the best way for organizations to learn and improve based on what works and what does not.9
Conclusions
Though the health care debate has ended in Congress for now, the march toward payment reform will continue. To accelerate progress, continued leadership from gastroenterologists is needed, especially in finding solutions that move beyond traditional GI practice. Collaborative incremental models that advance population health and are feasible to implement will provide the best opportunity for practice reform. Effective partnerships with primary care are particularly important to help avoid traditional gatekeeper approaches, and move toward a patient-centric model of shared accountability in which specialists function as a key partner in a medical neighborhood.10 Gastroenterologists can shape these steps, not only through PTAC and Medicare APMs, but through the other steps described earlier, and have a unique role in developing new models that leverage their specialty expertise. However, these models cannot be developed in isolation, and increased collaboration with primary care and other medical and nonmedical specialists will be critical. Physicians should start identifying opportunities to improve their practices and build these relationships now. These investments will allow them to thrive as new payment models come online.
References
1. Dzau V.J., McClellan M.B., McGinnis J.M. Vital directions for health and health care: priorities from a National Academy of Medicine initiative. JAMA 2017;317:1461-70.
2. Alternative Payment Model Framework Progress Tracking Work Group. Alternative payment model (APM) framework. Health
Care Payment Learning and Action Network. Available from: https://hcp-lan.org/workproducts/apm-whitepaper.pdf. Accessed: January 12, 2016.
3. Health Care Payment Learning and Action Network. APM Measurement: Progress of Alternative Payment Models. Available from: http://hcp-lan.org/workproducts/measurement_discussion%20article_2017.pdf Accessed November 2, 2017.
4. McClellan M., McStay F., Saunders R. The roadmap to physician payment reform: what it will take for all clinicians to succeed
under MACRA. Health Affairs Blog. Available from: http://healthaffairs.org/blog/2016/08/30/the-roadmap-to-physicianpayment-reform-what-it-will-take-for-all-clinicians-to-succeedunder-macra/. Accessed: August 30, 2016.
5. Medows R., Casale P., Berenson R. Preliminary review team report to the physician-focused Payment Model Technical Advisory Committee (PTAC). Physician-Focused Payment Model Technical Advisory Committee. Available from: https://aspe.hhs.gov/system/files/pdf/255906/DHNPRTReport.pdf. Accessed: March 22, 2017.
6. Regueiro M., Click B., Holder D., et al. Constructing an inflammatory bowel disease patient–centered medical home. Clin Gastroenterol Hepatol. 2017;15:1148-53.
7. Meier S.K., Shah N.D., Talwalkar J.A., et al. Adapting the patient-centered specialty practice model for populations with cirrhosis. Clin Gastroenterol Hepatol. 2016;14:492-6.
8. Pham H., Chernew M., Shrank W., et al. Market momentum, spillover effects, and evidence-based decision making on payment reform. Health Affairs Blog. Available from: http:// healthaffairs.org/blog/2017/05/24/market-momentum-spillovereffects-and-evidence-based-decision-making-on-paymentreform/. Accessed: May 24, 2017.
9. McClellan M., Richards R., Japinga M. Evidence on payment reform: where are the gaps? Health Affairs Blog. Available from: http://healthaffairs.org/blog/2017/04/25/evidence-onpayment-reform-where-are-the-gaps/. Accessed: April 25, 2017.
10. Huang X., Rosenthal M.B. Transforming specialty practice – the patient-centered medical neighborhood. N Engl J Med 2014;370:1376-9.
Mr. Japinga, Dr. Saunders, and Dr. McClellan are at the Duke-Margolis Center for Health Policy, Washington; Dr. Gellad is in the division of gastroenterology at the Duke University School of Medicine and at the Durham VA Medical Center, Durham, N.C. Dr. Gellad was supported by a Career Development Award from Veterans Affairs Health Services Research (CDA 14-158). The authors had no conflicts of interest.
Systems biology – A primer
Systems biology is relatively new. It is an interdisciplinary field that focuses on complex interactions within biological systems using a holistic approach in the pursuit of scientific discovery.
The systems biology approach seeks to integrate biological knowledge to understand how cells and molecules interact with one another. A key component is computational and mathematical modeling. The ever-increasing amount of biological data, and the judgment that this data cannot be understood by simply drawing lines between interacting cells and molecules, explains the demand for a systematic approach.
Prominent examples for biological systems are the immune system and the nervous system, which already have the word ”system” included. Although the idea of system-level understanding is not new, the growing interest in applying the systems approach has been driven by breakthrough advances in molecular biology and bioinformatics.
Over the past 10 years, our group has identified highly significant differences in immune functioning between the 10% of children who frequently develop acute otitis media (i.e., those who are “otitis prone”) and the children who develop AOM infrequently (60% of children) or not at all (30% of children). We also have identified a cohort of about 10% of children who fail to respond to infant vaccinations (low vaccine responders), compared with children who respond with protective immunity and establishment of immune memory. The differences in children who are prone to AOM vs. those who are not and in low vaccine responders vs. normal vaccine responders include differences in cytokine molecules in blood (providing biosignatures), reduced antibodies, immune memory, and aberrant intercellular signaling networks after otopathogen exposure (AOM prone vs. non–AOM prone) and routine pediatric vaccination (low vs. normal vaccine responders).

Dr. Pichichero, a specialist in pediatric infectious diseases, is director of the Research Institute at Rochester (N.Y.) General Hospital. He is also a pediatrician at Legacy Pediatrics in Rochester. He has no relevant financial disclosures. Email him at [email protected].
Systems biology is relatively new. It is an interdisciplinary field that focuses on complex interactions within biological systems using a holistic approach in the pursuit of scientific discovery.
The systems biology approach seeks to integrate biological knowledge to understand how cells and molecules interact with one another. A key component is computational and mathematical modeling. The ever-increasing amount of biological data, and the judgment that this data cannot be understood by simply drawing lines between interacting cells and molecules, explains the demand for a systematic approach.
Prominent examples for biological systems are the immune system and the nervous system, which already have the word ”system” included. Although the idea of system-level understanding is not new, the growing interest in applying the systems approach has been driven by breakthrough advances in molecular biology and bioinformatics.
Over the past 10 years, our group has identified highly significant differences in immune functioning between the 10% of children who frequently develop acute otitis media (i.e., those who are “otitis prone”) and the children who develop AOM infrequently (60% of children) or not at all (30% of children). We also have identified a cohort of about 10% of children who fail to respond to infant vaccinations (low vaccine responders), compared with children who respond with protective immunity and establishment of immune memory. The differences in children who are prone to AOM vs. those who are not and in low vaccine responders vs. normal vaccine responders include differences in cytokine molecules in blood (providing biosignatures), reduced antibodies, immune memory, and aberrant intercellular signaling networks after otopathogen exposure (AOM prone vs. non–AOM prone) and routine pediatric vaccination (low vs. normal vaccine responders).
Dr. Pichichero, a specialist in pediatric infectious diseases, is director of the Research Institute at Rochester (N.Y.) General Hospital. He is also a pediatrician at Legacy Pediatrics in Rochester. He has no relevant financial disclosures. Email him at [email protected].
GIs should be able to prescribe the most beneficial treatments
Appealing step therapy protocols can be time consuming and burdensome for physicians and patients, and can takes months to resolve. The Restoring the Patient’s Voice Act (HR 2077), introduced by physicians Reps. Brad Wenstrup, R-OH, and Raul Ruiz, D-CA, would provide a clear and timely appeals process when a patient has been subjected to step therapy by their insurance provider.
AGA endorsed this legislation to provide patients with a clear, equitable and fair appeals process when subjected to step therapy protocols. AGA is working with patient advocacy groups, like the Crohn’s and Colitis Foundation, provider, and professional societies to educate members of Congress on this issue and the implications it has for patients being able to access the right treatment at the right time.
AGA remembers former AGA President Marvin Sleisenger, MD, AGAF
Marvin H. Sleisenger, MD, AGAF, of Kentfield, Calif., died at age 93 on Thursday, Oct. 19, 2017. Sleisenger served as editor of Gastroenterology from 1965 to 1970, and as president of AGA in 1976.
Sleisenger attended Harvard College and Harvard Medical School. He trained at Harvard, the University of Pennsylvania, and Cornell Medical School. During the Korean War, he served in the U.S. Naval Medical Corps. He was a member of the faculty at Cornell Medical School and in 1954, was appointed as chief of the division of gastroenterology. In 1968, he became professor and vice chairman of the department of medicine of the University of California, San Francisco and chief of the medical service at the Veterans Administration Hospital. His achievements as an outstanding educator were recognized in 1994 when he became the recipient of the AGA Distinguished Educator Award.

Sleisenger’s full obituary was published in the SFGate. Members, colleagues, and friends posted remembrances in the Community.
Memorial services were held on Sunday, Oct. 29, 2017, at 11 a.m., at the Chapel of the Mt. Tamalpais Cemetery, 2500 Fifth Avenue, San Rafael, Calif.
Marvin H. Sleisenger, MD, AGAF, of Kentfield, Calif., died at age 93 on Thursday, Oct. 19, 2017. Sleisenger served as editor of Gastroenterology from 1965 to 1970, and as president of AGA in 1976.
Sleisenger attended Harvard College and Harvard Medical School. He trained at Harvard, the University of Pennsylvania, and Cornell Medical School. During the Korean War, he served in the U.S. Naval Medical Corps. He was a member of the faculty at Cornell Medical School and in 1954, was appointed as chief of the division of gastroenterology. In 1968, he became professor and vice chairman of the department of medicine of the University of California, San Francisco and chief of the medical service at the Veterans Administration Hospital. His achievements as an outstanding educator were recognized in 1994 when he became the recipient of the AGA Distinguished Educator Award.
Sleisenger’s full obituary was published in the SFGate. Members, colleagues, and friends posted remembrances in the Community.
Memorial services were held on Sunday, Oct. 29, 2017, at 11 a.m., at the Chapel of the Mt. Tamalpais Cemetery, 2500 Fifth Avenue, San Rafael, Calif.
Clinical Challenges - December 2017 What's your diagnosis?
The diagnosis
Answer: Hydrogen peroxide ingestion causing significant portal venous gas and stomach wall thickening
Upon further questioning, it was found that the patient accidentally ingested approximately 50 mL of concentrated 35% hydrogen peroxide (H2O2) solution, which he was using in diluted form as a naturopathic treatment for his diabetes mellitus. He was admitted to our institution and closely monitored for evidence of perforation and respiratory distress. Given the extent of portal venous gas, he was promptly treated with hyperbaric oxygen to prevent cerebral gas embolism. Clinically, he remained stable over the next 24 hours and repeat imaging the next day revealed dramatic improvement of the portal venous gas (Figure C). He was discharged on day 4 of hospitalization with no obvious clinical sequelae. Outpatient gastroscopy was arranged to assess any further potential damage, but he was lost to follow-up.
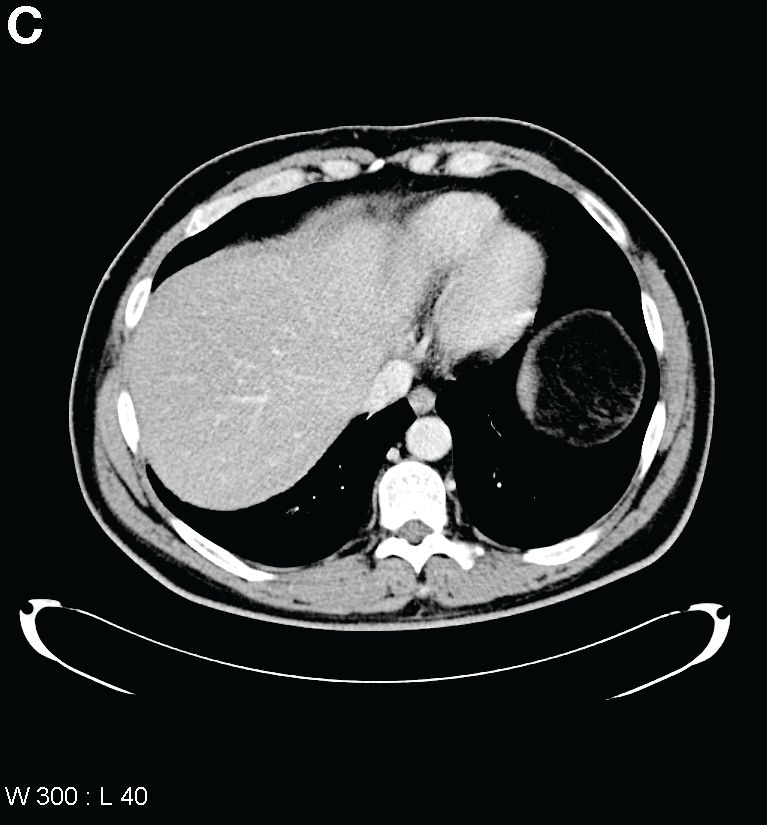
References
1. Watt, B.E., Proudfoot, A.T., Vale, J.A. Hydrogen peroxide poisoning. Toxicol Rev. 2004;23:51-7.
2. French, L.K., Horowitz, B.Z., McKeown, N.J. Hydrogen peroxide ingestion associated with portal venous gas and treatment with hyperbaric oxygen: a case series and review of the literature. Clin Toxicol. 2010;48:533-8.
The diagnosis
Answer: Hydrogen peroxide ingestion causing significant portal venous gas and stomach wall thickening
Upon further questioning, it was found that the patient accidentally ingested approximately 50 mL of concentrated 35% hydrogen peroxide (H2O2) solution, which he was using in diluted form as a naturopathic treatment for his diabetes mellitus. He was admitted to our institution and closely monitored for evidence of perforation and respiratory distress. Given the extent of portal venous gas, he was promptly treated with hyperbaric oxygen to prevent cerebral gas embolism. Clinically, he remained stable over the next 24 hours and repeat imaging the next day revealed dramatic improvement of the portal venous gas (Figure C). He was discharged on day 4 of hospitalization with no obvious clinical sequelae. Outpatient gastroscopy was arranged to assess any further potential damage, but he was lost to follow-up.
References
1. Watt, B.E., Proudfoot, A.T., Vale, J.A. Hydrogen peroxide poisoning. Toxicol Rev. 2004;23:51-7.
2. French, L.K., Horowitz, B.Z., McKeown, N.J. Hydrogen peroxide ingestion associated with portal venous gas and treatment with hyperbaric oxygen: a case series and review of the literature. Clin Toxicol. 2010;48:533-8.
By Mark C. Fok, BScPharm, Charles Zwirewich, MD, and Baljinder S. Salh, MBChB. Published previously in Gastroenterology (2013;144[3]:509, 658-9).
A 49-year-old man presented with severe epigastric pain and nonbloody emesis after ingestion of a naturopathic treatment for type 2 diabetes mellitus.
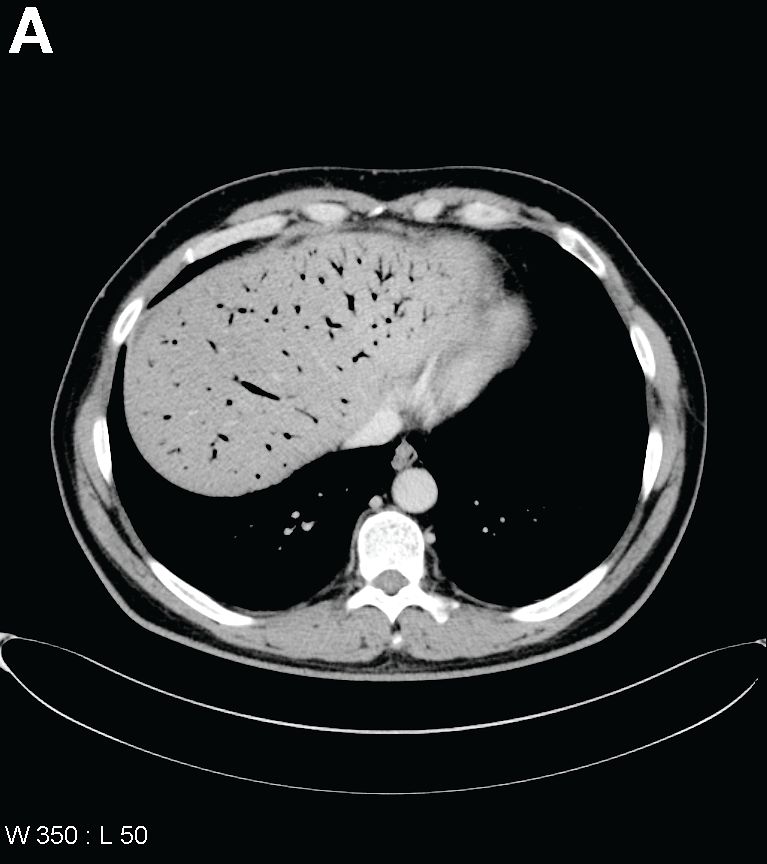
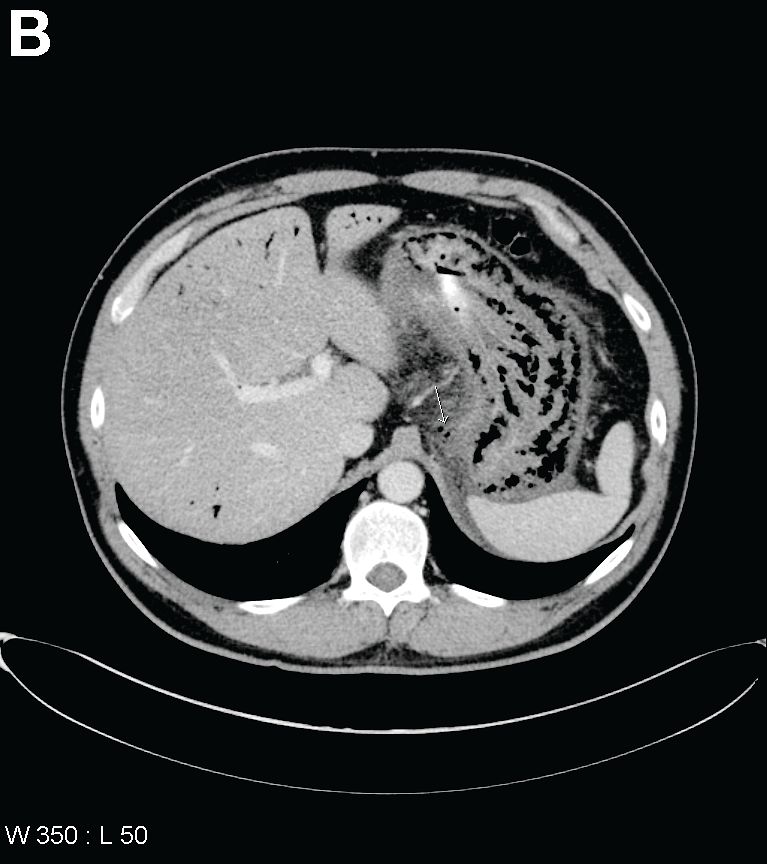
Urgent abdominal computed tomography was performed, which revealed extensive portal venous gas throughout the liver (Figure A) and pneumatosis with thickening of the stomach wall (Figure B).
What is your diagnosis and treatment?
Clinical implications of cesarean-induced isthmoceles
In a presentation of the Golden Hysteroscope Award Best Paper on Hysteroscopy at the 46th AAGL Global Congress on Minimally Invasive Surgery in National Harbor, Maryland, James Coad, MD, described a study that he and colleagues from West Virginia University School of Medicine in Morgantown, and Universidad Autónoma de Nuevo León in Monterrey, Mexico, conducted concerning the healing differences of cesarean incisions and the development of isthmoceles (cesarean scar defects).1
Detecting isthmoceles
Isthmoceles are variably sized evaginations into the anterior lower uterine segment at a previous cesarean delivery incision due to suboptimal myometrium healing. This leads to thinning of the anterior uterine wall, which creates an indentation and fluid-filled pouch at the cesarean scar site.1,2
Recent findings, say Coad and colleagues, associate isthmoceles with adverse reproductive and gynecologic conditions such as infertility, postmenstrual spotting, dysmenorrhea, and chronic pelvic pain. Patients who have undergone multiple cesarean deliveries tend to have larger isthmoceles with widths correlating to increased symptoms.1
While the presence of inner nonunion healing can be hysteroscopically visualized, it is difficult to detect outer nonunion healing. The reported incidence of isthmoceles differs by imaging technique used: up to 70% are found with transvaginal ultrasound, and up to 84% are detected by sonohysterography.3,4 This study found that 98% of isthomoceles can be detected by gross examination.1
Related article:
Cesarean scar defect: What is it and how should it be treated?
Study details
Researchers designed a prospective de-identified anatomic pathology study to evaluate the anatomy of uteri from 204 premenopausal women who underwent hysterectomy for benign disease due to abnormal uterine bleeding, fibroids, and/or adenomyosis. Uteri were midline sagittally sectioned and the area of cesarean section anatomy was documented, including the presence of inner and outer nonunion healing.1
Of the 204 uteri, 134 (66%) had at least 1 identifiable cesarean scar (22% had 1 scar, 19% had 2 scars, and 25% had 3 or more scars). Of these, 2 uteri (1.5%) had intact incisional healing with minimal wall narrowing showing complete union healing. Isolated inner nonunion healing with the formation of prominent isthmoceles was found in 111 uteri (82.8%). Five uteri (3.7%) showed isolated outer nonunion healing without the formation of isthmoceles. Fourteen uteri (10.5%) had both inner and outer nonunion healing. Two uteri (1.5%) had complete transmural union healing with localized loss of anterior lower segment wall integrity. No isthmoceles were detected in women who had not undergone cesarean delivery.1
Study results
When present, inner nonunion healing involved a mean (SD) 39% (23%; range, 5% – 90%) of the wall thickness and outer nonunion healing involved a mean (SD) 27% (17%; range, 10% – 60%). Due to nonunion healing, the resultant wall thicknesses at cesarean scar site were a mean (SD) 5.6 mm ( 2.60 mm; range, 0.0 mm – 14.2 mm). When compared with the adjacent uterine wall, the nonunion healing resulted in an approximate mean (SD) of 70% (16%) thinner wall. 1
Conclusions and a warning
The authors concluded that, following cesarean delivery, there is a high incidence of architectural healing–related change, including significant inner and outer wall thinning. While inner nonunion healing can be hysteroscopically visualized, outer-wall healing cannot be visualized and may result in finding a thinner wall than expected during procedures in this region, including isthmocele repairs.1
Share your thoughts! Send your Letter to the Editor to [email protected]. Please include your name and the city and state in which you practice.
- Coad JE, Fugett II JH, Wolfe T, et al. Anatomy of cesarean-induced isthmoceles: Clinical implications [abstract 159]. In: Abstracts of the 46th AAGL Global Congress on Minimally Invasive Surgery. JMIG. 2017;24(7 suppl):S64.
- Nezhat C, Grace L, Soliemannjad R, Razavi GM, Nezhat A. Cesarean scar defect: What is it and how should it be treated? OBG Manag. 2016;28(4):32,34,36,38–39,53.
- Bij de Vaate AJ, van der Voet LF, Naji O, et al. Prevalenc, potential risk factors for development and symptoms related to the presence of uterine niches following Cesarean section: systematic review. Ultrasound Obstet Gynecol. 2014;43(4):372–382.
- Osser OV, Jokubkiene L, Valentin L. High prevalence of defects in Cesarean section scars at transvaginal ultrasound examination. Ultrasound Obstet Gynecol. 2009;34(1):90–97.
In a presentation of the Golden Hysteroscope Award Best Paper on Hysteroscopy at the 46th AAGL Global Congress on Minimally Invasive Surgery in National Harbor, Maryland, James Coad, MD, described a study that he and colleagues from West Virginia University School of Medicine in Morgantown, and Universidad Autónoma de Nuevo León in Monterrey, Mexico, conducted concerning the healing differences of cesarean incisions and the development of isthmoceles (cesarean scar defects).1
Detecting isthmoceles
Isthmoceles are variably sized evaginations into the anterior lower uterine segment at a previous cesarean delivery incision due to suboptimal myometrium healing. This leads to thinning of the anterior uterine wall, which creates an indentation and fluid-filled pouch at the cesarean scar site.1,2
Recent findings, say Coad and colleagues, associate isthmoceles with adverse reproductive and gynecologic conditions such as infertility, postmenstrual spotting, dysmenorrhea, and chronic pelvic pain. Patients who have undergone multiple cesarean deliveries tend to have larger isthmoceles with widths correlating to increased symptoms.1
While the presence of inner nonunion healing can be hysteroscopically visualized, it is difficult to detect outer nonunion healing. The reported incidence of isthmoceles differs by imaging technique used: up to 70% are found with transvaginal ultrasound, and up to 84% are detected by sonohysterography.3,4 This study found that 98% of isthomoceles can be detected by gross examination.1
Related article:
Cesarean scar defect: What is it and how should it be treated?
Study details
Researchers designed a prospective de-identified anatomic pathology study to evaluate the anatomy of uteri from 204 premenopausal women who underwent hysterectomy for benign disease due to abnormal uterine bleeding, fibroids, and/or adenomyosis. Uteri were midline sagittally sectioned and the area of cesarean section anatomy was documented, including the presence of inner and outer nonunion healing.1
Of the 204 uteri, 134 (66%) had at least 1 identifiable cesarean scar (22% had 1 scar, 19% had 2 scars, and 25% had 3 or more scars). Of these, 2 uteri (1.5%) had intact incisional healing with minimal wall narrowing showing complete union healing. Isolated inner nonunion healing with the formation of prominent isthmoceles was found in 111 uteri (82.8%). Five uteri (3.7%) showed isolated outer nonunion healing without the formation of isthmoceles. Fourteen uteri (10.5%) had both inner and outer nonunion healing. Two uteri (1.5%) had complete transmural union healing with localized loss of anterior lower segment wall integrity. No isthmoceles were detected in women who had not undergone cesarean delivery.1
Study results
When present, inner nonunion healing involved a mean (SD) 39% (23%; range, 5% – 90%) of the wall thickness and outer nonunion healing involved a mean (SD) 27% (17%; range, 10% – 60%). Due to nonunion healing, the resultant wall thicknesses at cesarean scar site were a mean (SD) 5.6 mm ( 2.60 mm; range, 0.0 mm – 14.2 mm). When compared with the adjacent uterine wall, the nonunion healing resulted in an approximate mean (SD) of 70% (16%) thinner wall. 1
Conclusions and a warning
The authors concluded that, following cesarean delivery, there is a high incidence of architectural healing–related change, including significant inner and outer wall thinning. While inner nonunion healing can be hysteroscopically visualized, outer-wall healing cannot be visualized and may result in finding a thinner wall than expected during procedures in this region, including isthmocele repairs.1
Share your thoughts! Send your Letter to the Editor to [email protected]. Please include your name and the city and state in which you practice.
- Coad JE, Fugett II JH, Wolfe T, et al. Anatomy of cesarean-induced isthmoceles: Clinical implications [abstract 159]. In: Abstracts of the 46th AAGL Global Congress on Minimally Invasive Surgery. JMIG. 2017;24(7 suppl):S64.
- Nezhat C, Grace L, Soliemannjad R, Razavi GM, Nezhat A. Cesarean scar defect: What is it and how should it be treated? OBG Manag. 2016;28(4):32,34,36,38–39,53.
- Bij de Vaate AJ, van der Voet LF, Naji O, et al. Prevalenc, potential risk factors for development and symptoms related to the presence of uterine niches following Cesarean section: systematic review. Ultrasound Obstet Gynecol. 2014;43(4):372–382.
- Osser OV, Jokubkiene L, Valentin L. High prevalence of defects in Cesarean section scars at transvaginal ultrasound examination. Ultrasound Obstet Gynecol. 2009;34(1):90–97.

FDA approves sunitinib malate as adjuvant treatment for RCC
The Food and Drug Administration has approved sunitinib malate for the adjuvant treatment of adult patients at high risk of recurrent renal cell carcinoma (RCC) following nephrectomy.
“This is the first adjuvant treatment approved for patients with renal cell carcinoma, which is significant because patients with this disease who have a nephrectomy are often at high risk of the cancer returning,” Richard Pazdur, MD, director of the FDA’s Oncology Center of Excellence and acting director of the Office of Hematology and Oncology Products in the FDA’s Center for Drug Evaluation and Research, said in a written statement.

Approval for adjuvant treatment of RCC was based on median disease-free survival of 6.8 years for patients receiving sunitinib malate, compared with 5.6 years for patients receiving placebo in S-TRAC, a phase III trial of 615 patients with high risk of recurrent RCC following nephrectomy. In the trial, presented at the European Society for Medical Oncology Congress in 2016 and published in the New England Journal of Medicine, patients were randomized 1:1 to receive either 50 mg sunitinib malate once daily, 4 weeks on treatment followed by 2 weeks off, or placebo. Overall survival data were not mature at the time of data analysis.
The most common adverse reactions to sunitinib in the trial were fatigue/asthenia, diarrhea, mucositis/stomatitis, nausea, decreased appetite/anorexia, vomiting, abdominal pain, hand-foot syndrome, hypertension, bleeding events, dysgeusia, dyspepsia, and thrombocytopenia.
Severe side effects included hepatotoxicity, low left ventricular ejection fraction, myocardial ischemia/infarction, prolonged QT intervals/torsade de pointes, hypertension, hemorrhagic events, tumor lysis syndrome, thrombotic microangiopathy (including thrombotic thrombocytopenic purpura and hemolytic uremic syndrome), proteinuria, thyroid dysfunction, hypoglycemia, osteonecrosis, and wound-healing complications. A boxed warning alerts health care professionals and patients about the risk of hepatoxicity, which may result in liver failure or death.
Sunitinib malate is marketed as Sutent by Pfizer. The recommended dose for the adjuvant treatment of RCC is 50 mg orally once daily, with or without food, 4 weeks on treatment followed by 2 weeks off for nine 6-week cycles.
Full prescribing information is available here.
The Food and Drug Administration has approved sunitinib malate for the adjuvant treatment of adult patients at high risk of recurrent renal cell carcinoma (RCC) following nephrectomy.
“This is the first adjuvant treatment approved for patients with renal cell carcinoma, which is significant because patients with this disease who have a nephrectomy are often at high risk of the cancer returning,” Richard Pazdur, MD, director of the FDA’s Oncology Center of Excellence and acting director of the Office of Hematology and Oncology Products in the FDA’s Center for Drug Evaluation and Research, said in a written statement.
Approval for adjuvant treatment of RCC was based on median disease-free survival of 6.8 years for patients receiving sunitinib malate, compared with 5.6 years for patients receiving placebo in S-TRAC, a phase III trial of 615 patients with high risk of recurrent RCC following nephrectomy. In the trial, presented at the European Society for Medical Oncology Congress in 2016 and published in the New England Journal of Medicine, patients were randomized 1:1 to receive either 50 mg sunitinib malate once daily, 4 weeks on treatment followed by 2 weeks off, or placebo. Overall survival data were not mature at the time of data analysis.
The most common adverse reactions to sunitinib in the trial were fatigue/asthenia, diarrhea, mucositis/stomatitis, nausea, decreased appetite/anorexia, vomiting, abdominal pain, hand-foot syndrome, hypertension, bleeding events, dysgeusia, dyspepsia, and thrombocytopenia.
Severe side effects included hepatotoxicity, low left ventricular ejection fraction, myocardial ischemia/infarction, prolonged QT intervals/torsade de pointes, hypertension, hemorrhagic events, tumor lysis syndrome, thrombotic microangiopathy (including thrombotic thrombocytopenic purpura and hemolytic uremic syndrome), proteinuria, thyroid dysfunction, hypoglycemia, osteonecrosis, and wound-healing complications. A boxed warning alerts health care professionals and patients about the risk of hepatoxicity, which may result in liver failure or death.
Sunitinib malate is marketed as Sutent by Pfizer. The recommended dose for the adjuvant treatment of RCC is 50 mg orally once daily, with or without food, 4 weeks on treatment followed by 2 weeks off for nine 6-week cycles.
Full prescribing information is available here.
A letter from Dr. Robert S. Sandler, MPH, AGAF
Dear Colleagues,
Where would clinical practice be today without GI research?
The way we diagnose and treat patients is thanks to years of research. But as you know, federal research funding is at risk. Promising, early-stage investigators find it increasingly difficult to secure funding and many leave the field because they are unable to sustain a research career.
This is bad news for digestive health patients and the clinicians who care for them.
As a member of the GI community, you understand the need to continually advance the science and practice of gastroenterology. You understand the physical, emotional, and financial costs of digestive diseases. And you understand the tremendous value of research to advance patient care.
At a time when we are on the brink of major scientific breakthroughs, there is a growing gap in federal funding for research. Many well-qualified young investigators cannot get government funding. Gifts to the AGA Research Foundation this year directly supported 52 talented investigators. Despite this success, over 200 other innovative and promising research ideas went unfunded.
I am asking you to support a cause important to me and equally important to you. You can help fill the funding gap and protect the next generation of investigators by joining me in supporting the AGA Research Foundation through a personal gift.
Every dollar is a step forward...to new treatments. To cures impacting patients’ lives. To new generations of talented investigators in digestive disease research.
Please help us continue our efforts by making your tax-deductible donation. Donate today at www.gastro.org/donate.
Thank you in advance for your support and best wishes for a happy, healthy holiday season and successful New Year.
Three easy ways to give
Online: www.gastro.org/donateThrough the mail:
AGA Research Foundation
4930 Del Ray Avenue
Bethesda, MD 20814
Over the phone: 301-222-4002
All gifts are tax-deductible to the fullest extent of U.S. law.