User login
Five Situations Where Hospitalists Need a Healthcare Attorney
It is inevitable that, at some point in your career, you will need to hire a healthcare attorney. Proper representation is the best way to ensure a positive outcome in any situation.

Physicians often consider tackling certain issues on their own to reduce costs and avoid complicating matters. However, there are at least five situations in which you must retain an experienced healthcare attorney, or you could end up underpaid, subject to overreaching restrictive covenants, severely fined, or responsible for a large settlement.
1. Negotiating an Employment Contract
Whether you are considering a position as an employee of a physician group, hospital, or health system, it is critical that you understand the employment agreement presented to you so you can be sure it is fair and represents your best interests. The agreement itself defines the scope and conditions of your employment and consequently impacts your personal and professional satisfaction. It usually contains confusing legal terminology, such as noncompetition and nonsolicitation clauses. If you do not understand these terms, problems may arise in the future regarding your rights and capabilities upon termination of employment.

For these reasons, it is critical to engage a healthcare attorney who is well-versed in physician employment agreements. At a minimum, an attorney can confirm whether the compensation offered is comparable to that of physicians with similar experience and skills in your geographical area. The attorney can decipher confusing bonus compensation and may be able to negotiate more favorable terms. The same is true of understanding the benefits offered and establishing your call coverage.
An attorney will be able to advise you when it is appropriate to push back and request additional benefits or propose more favorable changes to your call coverage. Most important, the attorney will clarify the term of the employment agreement, the corresponding termination provisions, and any restrictions on your ability to practice upon termination of the agreement. Although the ultimate decision to accept the employment offer rests solely with you, an experienced healthcare attorney can help you understand the agreement and give you confidence in that decision.
2. Leaving a Practice for New Opportunities or Retirement
Whether you decide to leave a practice to pursue a new opportunity or because you are retiring, it is critical that you engage a healthcare attorney to help you navigate this road. If you are leaving to pursue new opportunities, an attorney can help you understand any restrictive covenants that may apply upon your departure and who retains ownership of the medical records of patients you treated while employed by the practice. In addition, you’ll be assisted in drafting any required notifications to patients alerting them of your departure.
If you are leaving the practice due to retirement, there are additional concerns. If you own the practice, you will need to decide whether to sell the practice or wind it down. If you decide to sell, an attorney can help you negotiate a favorable merger agreement and file any required change of ownership forms. If you choose to wind down your practice, your employee agreements and service and vendor contracts, including managed care participation agreements, will need to be reviewed for specific termination and notice requirements.
As with departure from a practice, there are certain notifications that must be issued to your patients detailing the closure of your practice and addressing patient options for continuity of care. An attorney can draft such notifications for you and, in addition, will be able to assist with notifying your malpractice carrier of your retirement and ensuring you have proper continuing coverage.
Finally, an attorney can arrange custody of your medical records in accordance with applicable state record retention requirements, help wind down your financial matters, and terminate your practice’s professional entity.
3. Practice Mergers
Engaging a healthcare transaction attorney protects your investment in your practice and in the practice with which you decide to merge. Healthcare mergers, due to the complex rules and regulations governing the industry, are uniquely complicated. A traditional business lawyer with merger experience likely will not understand regulations that solely impact healthcare mergers, which can lead to regulatory fines and penalties.
Therefore, if you are considering merging your practice, it is critical that you engage an attorney who is highly experienced in the legal implications of healthcare transactions and who has a deep understanding of the Anti-Kickback Statute, Stark Law, and other applicable regulations. Doing so is the only way to ensure compliance with healthcare rules and regulations.
4. Payor Audits
The number of payor audits is increasing dramatically. Payor audits can involve Medicare, Medicaid, or third-party payors. When an audit notice is received, there often is a limited time period to respond. Therefore, it is imperative that you engage an experienced healthcare attorney upon receipt of such a notice to draft a professional response to the audit request and help you gather the requested documents in accordance with the time frames specified in the notice.
In addition, an attorney can address procedural, legal, or factual flaws in the auditor’s position, which can prevent repayment of significant monetary penalties and suspension or revocation of billing privileges.
5. Malpractice Allegations
Without question, if you are subject to a medical malpractice lawsuit, you absolutely must retain an experienced healthcare attorney. Your insurance company will usually hire one for you, but that is not always the case.
Medical malpractice cases are extremely complicated. To prevail, you need an attorney who not only understands the law but also the practice of medicine. A healthcare attorney will not only know what litigation filings are required but will be able to arrange expert witnesses to help prove that you acted in accordance with professional standards.
In Sum
It is critical that an experienced healthcare attorney be hired to help manage these situations and many more. There is no better way to protect the professional and personal interests you have worked so hard to build. TH
It is inevitable that, at some point in your career, you will need to hire a healthcare attorney. Proper representation is the best way to ensure a positive outcome in any situation.
Physicians often consider tackling certain issues on their own to reduce costs and avoid complicating matters. However, there are at least five situations in which you must retain an experienced healthcare attorney, or you could end up underpaid, subject to overreaching restrictive covenants, severely fined, or responsible for a large settlement.
1. Negotiating an Employment Contract
Whether you are considering a position as an employee of a physician group, hospital, or health system, it is critical that you understand the employment agreement presented to you so you can be sure it is fair and represents your best interests. The agreement itself defines the scope and conditions of your employment and consequently impacts your personal and professional satisfaction. It usually contains confusing legal terminology, such as noncompetition and nonsolicitation clauses. If you do not understand these terms, problems may arise in the future regarding your rights and capabilities upon termination of employment.
For these reasons, it is critical to engage a healthcare attorney who is well-versed in physician employment agreements. At a minimum, an attorney can confirm whether the compensation offered is comparable to that of physicians with similar experience and skills in your geographical area. The attorney can decipher confusing bonus compensation and may be able to negotiate more favorable terms. The same is true of understanding the benefits offered and establishing your call coverage.
An attorney will be able to advise you when it is appropriate to push back and request additional benefits or propose more favorable changes to your call coverage. Most important, the attorney will clarify the term of the employment agreement, the corresponding termination provisions, and any restrictions on your ability to practice upon termination of the agreement. Although the ultimate decision to accept the employment offer rests solely with you, an experienced healthcare attorney can help you understand the agreement and give you confidence in that decision.
2. Leaving a Practice for New Opportunities or Retirement
Whether you decide to leave a practice to pursue a new opportunity or because you are retiring, it is critical that you engage a healthcare attorney to help you navigate this road. If you are leaving to pursue new opportunities, an attorney can help you understand any restrictive covenants that may apply upon your departure and who retains ownership of the medical records of patients you treated while employed by the practice. In addition, you’ll be assisted in drafting any required notifications to patients alerting them of your departure.
If you are leaving the practice due to retirement, there are additional concerns. If you own the practice, you will need to decide whether to sell the practice or wind it down. If you decide to sell, an attorney can help you negotiate a favorable merger agreement and file any required change of ownership forms. If you choose to wind down your practice, your employee agreements and service and vendor contracts, including managed care participation agreements, will need to be reviewed for specific termination and notice requirements.
As with departure from a practice, there are certain notifications that must be issued to your patients detailing the closure of your practice and addressing patient options for continuity of care. An attorney can draft such notifications for you and, in addition, will be able to assist with notifying your malpractice carrier of your retirement and ensuring you have proper continuing coverage.
Finally, an attorney can arrange custody of your medical records in accordance with applicable state record retention requirements, help wind down your financial matters, and terminate your practice’s professional entity.
3. Practice Mergers
Engaging a healthcare transaction attorney protects your investment in your practice and in the practice with which you decide to merge. Healthcare mergers, due to the complex rules and regulations governing the industry, are uniquely complicated. A traditional business lawyer with merger experience likely will not understand regulations that solely impact healthcare mergers, which can lead to regulatory fines and penalties.
Therefore, if you are considering merging your practice, it is critical that you engage an attorney who is highly experienced in the legal implications of healthcare transactions and who has a deep understanding of the Anti-Kickback Statute, Stark Law, and other applicable regulations. Doing so is the only way to ensure compliance with healthcare rules and regulations.
4. Payor Audits
The number of payor audits is increasing dramatically. Payor audits can involve Medicare, Medicaid, or third-party payors. When an audit notice is received, there often is a limited time period to respond. Therefore, it is imperative that you engage an experienced healthcare attorney upon receipt of such a notice to draft a professional response to the audit request and help you gather the requested documents in accordance with the time frames specified in the notice.
In addition, an attorney can address procedural, legal, or factual flaws in the auditor’s position, which can prevent repayment of significant monetary penalties and suspension or revocation of billing privileges.
5. Malpractice Allegations
Without question, if you are subject to a medical malpractice lawsuit, you absolutely must retain an experienced healthcare attorney. Your insurance company will usually hire one for you, but that is not always the case.
Medical malpractice cases are extremely complicated. To prevail, you need an attorney who not only understands the law but also the practice of medicine. A healthcare attorney will not only know what litigation filings are required but will be able to arrange expert witnesses to help prove that you acted in accordance with professional standards.
In Sum
It is critical that an experienced healthcare attorney be hired to help manage these situations and many more. There is no better way to protect the professional and personal interests you have worked so hard to build. TH
Drug produces similar results in older and younger ALL patients

Photo from MD Anderson
Data from two phase 2 studies suggests single-agent blinatumomab produces similar outcomes in adults with relapsed/refractory acute lymphoblastic leukemia (ALL), regardless of age.
Patients age 65 and older had similar hematologic response rates and relapse-free survival rates as patients younger than 65.
The incidence of grade 3 or higher adverse events (AEs) was similar between the age groups as well.
Older patients did have more serious AEs, however. And they had more neurologic events, but these were reversible.
Hagop M. Kantarjian, MD, of the University of Texas MD Anderson Cancer Center in Houston, and his colleagues reported these results in Cancer. The research was funded by Amgen Inc., makers of blinatumomab.
Patients
The researchers examined 261 adults with relapsed/refractory ALL who were enrolled in 2 different studies. There were 36 patients who were 65 or older and 225 patients who were younger than 65. The median ages were 70 (range, 65-79) and 34 (range, 18-64), respectively.
Among the older patients, 14% had primary refractory disease, 67% had 1 prior relapse, 14% had 2 prior relapses, and 6% had 3 or more. Among the younger patients, 9% had primary refractory disease, 55% had 1 prior relapse, 26% had 2 prior relapses, and 10% had 3 or more.
The younger patients were more likely to have received an allogeneic hematopoietic stem cell transplant (allo-HSCT) than the older patients—37% and 11%, respectively.
But older patients were more likely to have mild renal impairment (42% vs 13%) or moderate renal impairment (22% vs 1%).
Treatment
All patients received blinatumomab, and stepwise dosing was used to reduce the risk of cytokine release syndrome. A treatment cycle consisted of 4 weeks of continuous intravenous infusions, followed by a 2-week treatment-free interval.
The patients received 2 initial cycles. If they achieved a complete remission (CR) or CR with partial hematologic recovery (CRh) at this point, they could receive an additional 3 cycles as consolidation, unless they were scheduled to receive an allo-HSCT.
Patients also received intrathecal prophylaxis with dexamethasone and/or steroids, cytarabine, and methotrexate. And patients with a high blast percentage at baseline received a pre-phase treatment with dexamethasone and/or cyclophosphamide.
Older patients received a median of 2 cycles of blinatumomab (range, 1-6), as did the younger patients (range, 1-7).
Response and survival
Fifty-six percent of the older patients (20/36) achieved a CR/CRh during the first 2 cycles of blinatumomab, as did 46% of the younger patients (46/225). There were 14 CRs among the older patients (39%) and 78 CRs among the younger patients (35%).
There were 12 complete minimal residual disease responses among older patients (60% of responders) and 73 among the younger patients (70% of responders).
Of the responders, 3 older patients (15%) and 61 younger patients (59%) went on to allo-HSCT. Most of the patients received a transplant while in remission. However, 1 of the older patients and 8 of the younger patients went to transplant after an initial response to blinatumomab that was followed by a relapse.
The median relapse-free survival was 7.4 months for both age groups. The median overall survival was 5.5 months for older patients and 7.6 months for younger patients.
Safety
All of the older patients had at least 1 AE, and all but 1 of the younger patients had at least 1 AE. Older patients had higher rates of peripheral edema (42% vs 24%), fatigue (28% vs 18%), and dizziness (25% vs 11%) of any grade.
The incidence of grade 3 or higher AEs was similar between the groups—86% in the older group and 80% in the younger group. The same was true for AEs leading to treatment discontinuation—22% and 19%, respectively.
However, there was a higher incidence of serious AEs in the older patients (72% vs 64%). Device-related infection and encephalopathy were more common among older patients than younger patients (both 11% vs 3%).
The incidence of cytokine release syndrome was higher in the older group than the younger group—19% and 10%, respectively.
Older patients also had more neurologic events of any grade (72% vs 48%) and more grade 3 or higher neurologic events (28% vs 13%). However, all neurologic events were reversed by temporarily or permanently discontinuing blinatumomab.
There were 7 fatal treatment-emergent AEs in the older adults, including pneumonia (n=3), B-cell lymphoma (n=1), and disease progression (n=3). None of the fatal AEs were considered treatment-related. And none of the patients who were in remission died during treatment with blinatumomab. ![]()
Team identifies new function of Fanconi anemia genes

Image by Sarah Pfau
Research published in Cell has revealed a new function of genes in the Fanconi anemia (FA) pathway, and investigators believe this finding could have
implications for the treatment of FA and related disorders.
The team found that FA genes are required for selective autophagy.
In particular, the FANCC gene plays a key role in 2 types of selective autophagy: virophagy (the removal of viruses inside the cell) and mitophagy (the removal of mitochondria).
Experiments in mice showed that genetic deletion of FANCC blocks virophagy and increases the animals’ susceptibility to lethal viral encephalitis.
The investigators also found that FANCC protein is required for the clearance of damaged mitochondria and decreases the production of mitochondrial reactive oxygen species and inflammasome activation.
And other genes in the FA pathway are required for mitophagy as well—FANCA, FANCF, FANCL, FANCD2, BRCA1, and BRCA2.
“There’s increasing evidence that the failure of cells to appropriately clear damaged mitochondria leads to abnormal activation of the inflammasome—a process that is emerging as an important contributor to many different diseases,” said study author Beth Levine, MD, of UT Southwestern Medical Center in Dallas, Texas.
“The finding that FA genes function in clearing mitochondria and decreasing inflammasome activation provides a potential new inflammasome-targeted avenue of therapy for patients with diseases related to mutations in the FA genes.”
FA pathway genes were already known to play a role in DNA repair. The investigators said this new link to autophagy opens up unexplored horizons for understanding the function of these genes in human health and disease.
“Our findings suggest a novel mechanism by which mutations in FA genes may lead to the clinical manifestations in patients with FA and to cancers in patients with mutations in FA genes,” said study author Rhea Sumpter, MD, PhD, of UT Southwestern Medical Center.
“We’ve shown that this new function of the FA genes in the selective autophagy pathways does not depend on their role in DNA repair.”
In addition, the autophagy function may partly explain why patients with FA are highly susceptible to infection and cancer, Dr Levine said.
While further research is needed to understand how these findings may be used to treat disease, the investigators said they have identified a novel avenue for developing potential therapies for FA and cancer patients.
“I believe the clearest therapeutic possibilities to come from our study results are the development of new FA agents that target the inflammasome and production of interleukin 1 beta (IL-1β), a pro-inflammatory cytokine,” Dr Sumpter said.
“Clinically, IL-1β signaling has been targeted with FDA-approved drugs very successfully in several auto-inflammatory diseases that involve excessive inflammasome activation. Our results suggest that FA patients may also benefit from these therapies.” ![]()
Medical errors among leading causes of death in US

while another looks on
Photo courtesy of NCI
In recent years, medical errors may have become one of the top causes of death in the US, according to a study published in The BMJ.
Investigators analyzed medical death rate data over an 8-year period and calculated that more than 250,000 deaths per year may be due to medical error.
That figure surpasses the US Centers for Disease Control and Prevention’s (CDC) third leading cause of death—respiratory disease, which kills close to 150,000 people per year.
The investigators said the CDC’s way of collecting national health statistics fails to classify medical errors separately on the death certificate. So the team is advocating for updated criteria for classifying deaths.
“Incidence rates for deaths directly attributable to medical care gone awry haven’t been recognized in any standardized method for collecting national statistics,” said study author Martin Makary, MD, of the Johns Hopkins University School of Medicine in Baltimore, Maryland.
“The medical coding system was designed to maximize billing for physician services, not to collect national health statistics, as it is currently being used.”
Dr Makary noted that, in 1949, the US adopted an international form that used International Classification of Diseases (ICD) billing codes to tally causes of death.
“At that time, it was under-recognized that diagnostic errors, medical mistakes, and the absence of safety nets could result in someone’s death, and because of that, medical errors were unintentionally excluded from national health statistics,” Dr Makary said.
He pointed out that, since that time, national mortality statistics have been tabulated using billing codes, which don’t have a built-in way to recognize incidence rates of mortality due to medical care gone wrong.
For the current study, Dr Makary and Michael Daniel, also of Johns Hopkins, examined 4 separate studies that analyzed medical death rate data from 2000 to 2008.
Then, using hospital admission rates from 2013, the investigators extrapolated that, based on a total of 35,416,020 hospitalizations, 251,454 deaths stemmed from medical error. This translates to 9.5% of all deaths each year in the US.
According to the CDC, in 2013, 611,105 people died of heart disease, 584,881 died of cancer, and 149,205 died of chronic respiratory disease.
These were the top 3 causes of death in the US. The newly calculated figure for medical errors puts this cause of death behind cancer but ahead of respiratory disease.
“Top-ranked causes of death as reported by the CDC inform our country’s research funding and public health priorities,” Dr Makary said. “Right now, cancer and heart disease get a ton of attention, but since medical errors don’t appear on the list, the problem doesn’t get the funding and attention it deserves.”
The investigators said most medical errors aren’t due to inherently bad doctors, and reporting these errors shouldn’t be addressed by punishment or legal action.
Rather, the pair believes that most errors represent systemic problems, including poorly coordinated care, fragmented insurance networks, the absence or underuse of safety nets, and other protocols, in addition to unwarranted variation in physician practice patterns that lack accountability.
“Unwarranted variation is endemic in healthcare,” Dr Makary said. “Developing consensus protocols that streamline the delivery of medicine and reduce variability can improve quality and lower costs in healthcare. More research on preventing medical errors from occurring is needed to address the problem.” ![]()
CAR T-cell therapy granted orphan designation

The US Food and Drug Administration (FDA) has granted orphan drug designation for the chimeric antigen receptor (CAR) T-cell therapy KTE-C19 as a treatment for several hematologic malignancies.
This includes primary mediastinal B-cell lymphoma (PMBCL), mantle cell lymphoma (MCL), follicular lymphoma (FL), acute lymphoblastic leukemia (ALL), and chronic lymphocytic leukemia (CLL).
KTE-C19 previously received orphan designation from the FDA for the treatment of diffuse large B-cell lymphoma (DLBCL).
The FDA grants orphan designation to drugs and biologics intended to treat, diagnose, or prevent diseases/disorders that affect fewer than 200,000 people in the US.
The designation provides incentives for sponsors to develop products for rare diseases. This may include tax credits toward the cost of clinical trials, prescription drug user fee waivers, and 7 years of market exclusivity.
KTE-C19 also has breakthrough therapy designation from the FDA as a treatment for DLBCL, PMBCL, and transformed FL.
About KTE-C19
KTE-C19 is an investigational therapy in which a patient’s T cells are genetically modified to express a CAR designed to target CD19. The product is being developed by Kite Pharma, Inc.
In a study published in the Journal of Clinical Oncology, researchers evaluated KTE-C19 in 15 patients with advanced B-cell malignancies.
The patients received a conditioning regimen of cyclophosphamide and fludarabine, followed 1 day later by a single infusion of KTE-C19. The researchers noted that the conditioning regimen is known to be active against B-cell malignancies and could have made a direct contribution to patient responses.
Thirteen patients were evaluable for response. The overall response rate was 92%. Eight patients achieved a complete response (CR), and 4 had a partial response (PR).
Of the 7 patients with DLBCL, 4 achieved a CR, 2 achieved a PR, and 1 had stable disease. Three of the CRs were ongoing at the time of publication, with the duration ranging from 9 months to 22 months.
Of the 4 patients with CLL, 3 had a CR, and 1 had a PR. All 3 CRs were ongoing at the time of publication, with the duration ranging from 14 months to 23 months.
Among the 2 patients with indolent lymphomas, 1 achieved a CR, and 1 had a PR. The duration of the CR was 11 months at the time of publication.
KTE-C19 elicited a number of adverse events, including fever, hypotension, delirium, and other neurologic toxicities. All but 2 patients experienced grade 3/4 adverse events.
Three patients developed unexpected neurologic abnormalities. One patient experienced aphasia and right-sided facial paresis. One patient developed aphasia, confusion, and severe, generalized myoclonus. And 1 patient had aphasia, confusion, hemifacial spasms, apraxia, and gait disturbances.
KTE-C19 is currently under investigation in a phase 2 trial of refractory DLBCL, PMBCL, and transformed FL (ZUMA-1), a phase 2 trial of relapsed/refractory MCL (ZUMA-2), a phase 1/2 trial of relapsed/refractory adult ALL (ZUMA-3), and a phase 1/2 trial of relapsed/refractory pediatric ALL (ZUMA-4).
Results from ZUMA-1 were recently presented at the 2016 AACR Annual Meeting (abstract CT135). ![]()
Autism screening rises after process-based training
A 3- to 6-month learning program for pediatric and family medicine providers significantly improved their screening for autism spectrum disorders (ASD) at 18- and 24-month well child visits, based on data from 26 primary care practices that participated in the program and from 43 physicians who completed surveys before and after the program, according to findings published online May 5 in Pediatrics.
“Unlike traditional continuing medical education, the LC [learning collaborative] focused on improvement of processes of care at the practice level,” wrote Dr. Paul S. Carbone and his colleagues of the University of Utah, Salt Lake City. The first signs of ASD can be present as early as 2 years of age, but often remain undiagnosed for lack of screening at 18- and 24-month visits, they noted.

Rates of documented ASD screening among toddlers increased from 16% before starting the program to 91% during the last month of the program, and 70% of the practices sustained the 91% screening rate 4 years later.
Physician self-efficacy improved significantly from baseline to after the program on the nine autism conditions (such as sleep problems, constipation, and attention deficit/hyperactivity disorder [ADHD]) and seven autism needs (such as making referrals, addressing developmental concerns, and identifying community support services) included in the survey. On a scale of 1 to 10, the average physician’s progress rating was 6.5 after completing the program.
“A LC using the methods we describe is a successful approach to improving the early identification and ongoing care of children with ASD in primary care practices,” they researchers said.
Read the whole article at Pediatrics (2016 May. doi: 10.1542/peds.2015-1850).
A 3- to 6-month learning program for pediatric and family medicine providers significantly improved their screening for autism spectrum disorders (ASD) at 18- and 24-month well child visits, based on data from 26 primary care practices that participated in the program and from 43 physicians who completed surveys before and after the program, according to findings published online May 5 in Pediatrics.
“Unlike traditional continuing medical education, the LC [learning collaborative] focused on improvement of processes of care at the practice level,” wrote Dr. Paul S. Carbone and his colleagues of the University of Utah, Salt Lake City. The first signs of ASD can be present as early as 2 years of age, but often remain undiagnosed for lack of screening at 18- and 24-month visits, they noted.
Rates of documented ASD screening among toddlers increased from 16% before starting the program to 91% during the last month of the program, and 70% of the practices sustained the 91% screening rate 4 years later.
Physician self-efficacy improved significantly from baseline to after the program on the nine autism conditions (such as sleep problems, constipation, and attention deficit/hyperactivity disorder [ADHD]) and seven autism needs (such as making referrals, addressing developmental concerns, and identifying community support services) included in the survey. On a scale of 1 to 10, the average physician’s progress rating was 6.5 after completing the program.
“A LC using the methods we describe is a successful approach to improving the early identification and ongoing care of children with ASD in primary care practices,” they researchers said.
Read the whole article at Pediatrics (2016 May. doi: 10.1542/peds.2015-1850).
FROM PEDIATRICS

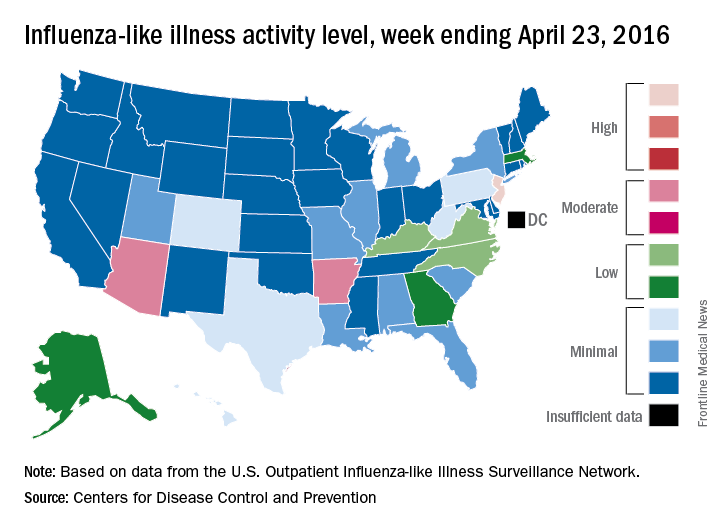
Seasonal flu holding strong in New Jersey
The 2015-2016 seasonal influenza virus has gotten hold of New Jersey and just won’t let go, according to the latest data from the Centers for Disease Control and Prevention.
For the week ending April 23, 2016, influenza-like illness (ILI) activity in the United States remained at level 10 on the CDC’s 1-10 scale for the 11th consecutive week, even as the country’s overall proportion of outpatient visits for ILI dropped to 2.0%, which is below the national baseline of 2.1%, the CDC reported.

Two other states – Arizona and Arkansas – joined New Jersey in bucking the trend of decreasing ILI activity, as both moved up to level 7 and the high end of the “moderate” range. Arizona had been at level 5 the week before, while Arkansas was at level 4. No other state was above level 5 for the most recent week, and 27 states were at level 1, data from the CDC’s Influenza-like Illness Surveillance Network (ILINet) show.
Four flu-related pediatric deaths were reported during the week ending April 23, only one of which occurred that week. The total number of pediatric deaths rose to 60 for the 2015-2016 season, with 27 states and Puerto Rico reporting deaths so far, the CDC noted.
The CDC also reported a cumulative influenza-associated hospitalization rate for the season of 29.8 such hospitalizations per 100,000 population. This data was based on 8,239 laboratory-confirmed influenza-associated hospitalizations reported between October 1, 2015 and April 23, 2016. The highest rate of hospitalization was among adults aged 65 years or older (79.6 per 100,000 population), followed by adults aged 50-64 (43.1 per 100,000 population) and children aged 0-4 years (40.5 per 100,000 population). Among all hospitalizations, 6,254 (75.9%) were associated with influenza A, 1,905 (23.1%) with influenza B, 41 (0.5%) with influenza A and B co-infection, and 39 (0.5%) had no virus type information.
The 2015-2016 seasonal influenza virus has gotten hold of New Jersey and just won’t let go, according to the latest data from the Centers for Disease Control and Prevention.
For the week ending April 23, 2016, influenza-like illness (ILI) activity in the United States remained at level 10 on the CDC’s 1-10 scale for the 11th consecutive week, even as the country’s overall proportion of outpatient visits for ILI dropped to 2.0%, which is below the national baseline of 2.1%, the CDC reported.
Two other states – Arizona and Arkansas – joined New Jersey in bucking the trend of decreasing ILI activity, as both moved up to level 7 and the high end of the “moderate” range. Arizona had been at level 5 the week before, while Arkansas was at level 4. No other state was above level 5 for the most recent week, and 27 states were at level 1, data from the CDC’s Influenza-like Illness Surveillance Network (ILINet) show.
Four flu-related pediatric deaths were reported during the week ending April 23, only one of which occurred that week. The total number of pediatric deaths rose to 60 for the 2015-2016 season, with 27 states and Puerto Rico reporting deaths so far, the CDC noted.
The CDC also reported a cumulative influenza-associated hospitalization rate for the season of 29.8 such hospitalizations per 100,000 population. This data was based on 8,239 laboratory-confirmed influenza-associated hospitalizations reported between October 1, 2015 and April 23, 2016. The highest rate of hospitalization was among adults aged 65 years or older (79.6 per 100,000 population), followed by adults aged 50-64 (43.1 per 100,000 population) and children aged 0-4 years (40.5 per 100,000 population). Among all hospitalizations, 6,254 (75.9%) were associated with influenza A, 1,905 (23.1%) with influenza B, 41 (0.5%) with influenza A and B co-infection, and 39 (0.5%) had no virus type information.
Aripiprazole linked to rare but serious compulsion problems
Rare but serious instances of impulse control problems have been reported in people taking the antipsychotic drug aripiprazole, according to a May 3 press release from the Food and Drug Administration.
Pathological gambling is listed as a side effect of aripiprazole (Abilify, Abilify Maintena, Aristada, and generics). Additional side effects seen in patients include compulsive eating, shopping, and sexual actions. The symptoms are rare but can affect anyone taking the medication and can result in serious harm to the patient.

All compulsive symptoms stopped when patients stopped taking aripiprazole or reduced their dosage. The FDA will add new warnings about the symptoms to all drug labels and patient medication guides.
“Health care professionals should make patients and caregivers aware of the risk of these uncontrollable urges when prescribing aripiprazole, and specifically ask patients about any new or increasing urges while they are being treated with aripiprazole. Closely monitor for new or worsening uncontrollable urges in patients at higher risk for impulse control problems,” the FDA said in the press release.
Find the full press release on the FDA website.
Rare but serious instances of impulse control problems have been reported in people taking the antipsychotic drug aripiprazole, according to a May 3 press release from the Food and Drug Administration.
Pathological gambling is listed as a side effect of aripiprazole (Abilify, Abilify Maintena, Aristada, and generics). Additional side effects seen in patients include compulsive eating, shopping, and sexual actions. The symptoms are rare but can affect anyone taking the medication and can result in serious harm to the patient.
All compulsive symptoms stopped when patients stopped taking aripiprazole or reduced their dosage. The FDA will add new warnings about the symptoms to all drug labels and patient medication guides.
“Health care professionals should make patients and caregivers aware of the risk of these uncontrollable urges when prescribing aripiprazole, and specifically ask patients about any new or increasing urges while they are being treated with aripiprazole. Closely monitor for new or worsening uncontrollable urges in patients at higher risk for impulse control problems,” the FDA said in the press release.
Find the full press release on the FDA website.

Vedolizumab use linked to high rate of postoperative complications in IBD patients
LOS ANGELES – Overall, 44% of inflammatory bowel disease (IBD) patients on vedolizumab had some form of infectious complication following intra-abdominal or anorectal surgery, results from a small single-center study suggest.
According to lead study author Dr. Samuel Eisenstein, there are currently no published surgical outcomes of patients receiving vedolizumab, an integrin receptor antagonist which was approved in May 2014 for the treatment of adults with moderate to severe ulcerative colitis as well as those with moderate to severe Crohn’s disease. “We’re not trying to alienate people who are proponents of the medication,” Dr. Eisenstein said in an interview in advance of the annual meeting of the American Society of Colon and Rectal Surgeons. “It’s an effective medication for treating Crohn’s and ulcerative colitis. We need to have a high index of suspicion that patients may have complications after these surgeries and to treat them with caution until we have better data.”

Dr. Eisenstein and his associates in the section of colon and rectal surgery at Moores Cancer Center, University of California, San Diego, Health System, retrospectively analyzed the medical records of 26 patients with IBD who underwent intra-abdominal or anorectal surgery at the center following treatment with vedolizumab. The patients underwent a total of 36 operations: 27 that were intra-abdominal and 9 that were anorectal. Their mean age was 31 years and 46% were female.
Dr. Eisenstein reported that 17 of the 26 patients (65%) had a Clavien-Dindo grade II or greater complication following 19 operations. In all, 26 complications occurred following these 19 operations, and 53% were infectious in nature. The overall rate of infectious complications following any operation was 44%. In addition, the rate of anastomotic leak was 15%, and two patients died from culture-negative sepsis following abdominal surgery, for an overall mortality rate of 7.7%.
The researchers also observed that there were 23 visits to the emergency room following surgery and 10 hospital readmissions. The only preoperative characteristics that differed significantly between patients who had complications and those who did not were level of hemoglobin (10.6 g/dL vs. 11.9 g/dL, respectively; P = .02) and platelet count (349 vs. 287 K/mm3; P = .025). No differences in the rate of complications were observed based on the number of biologic medications each patient failed prior to the initiation of vedolizumab (P = .718). Compared with patients who had no postoperative complications, those who did were more likely to have undergone intra-abdominal surgery (17 vs. 10 patients; P = .034), require postoperative transfusion (4 vs. none; P = .045), visit the emergency department (10 vs. none; P less than .001), or require hospital readmission (10 vs. none; P less than .001).
Dr. Eisenstein acknowledged certain limitations of the study including its small sample size, single-center, retrospective design, and the potential for selection bias. “The patients who were getting vedolizumab are the patients who failed all of the anti-TNFs, so we’re really selecting patients with the worst, most medically refractory disease,” he noted. “Because of that we can’t say for sure [if the complications] are due to their severity of disease or due to the medication itself.”
The data are “preliminary and retrospectively analyzed, but there is some concern that patients on these types of medications may have an increased risk of postoperative complications,” he concluded. “What we really need are bigger studies. To that end, we are actually starting an IBD collaborative based on some of the findings we have here, because we really want to analyze these data over a much larger population of patients.”
The researchers reported having no financial disclosures.
LOS ANGELES – Overall, 44% of inflammatory bowel disease (IBD) patients on vedolizumab had some form of infectious complication following intra-abdominal or anorectal surgery, results from a small single-center study suggest.
According to lead study author Dr. Samuel Eisenstein, there are currently no published surgical outcomes of patients receiving vedolizumab, an integrin receptor antagonist which was approved in May 2014 for the treatment of adults with moderate to severe ulcerative colitis as well as those with moderate to severe Crohn’s disease. “We’re not trying to alienate people who are proponents of the medication,” Dr. Eisenstein said in an interview in advance of the annual meeting of the American Society of Colon and Rectal Surgeons. “It’s an effective medication for treating Crohn’s and ulcerative colitis. We need to have a high index of suspicion that patients may have complications after these surgeries and to treat them with caution until we have better data.”
Dr. Eisenstein and his associates in the section of colon and rectal surgery at Moores Cancer Center, University of California, San Diego, Health System, retrospectively analyzed the medical records of 26 patients with IBD who underwent intra-abdominal or anorectal surgery at the center following treatment with vedolizumab. The patients underwent a total of 36 operations: 27 that were intra-abdominal and 9 that were anorectal. Their mean age was 31 years and 46% were female.
Dr. Eisenstein reported that 17 of the 26 patients (65%) had a Clavien-Dindo grade II or greater complication following 19 operations. In all, 26 complications occurred following these 19 operations, and 53% were infectious in nature. The overall rate of infectious complications following any operation was 44%. In addition, the rate of anastomotic leak was 15%, and two patients died from culture-negative sepsis following abdominal surgery, for an overall mortality rate of 7.7%.
The researchers also observed that there were 23 visits to the emergency room following surgery and 10 hospital readmissions. The only preoperative characteristics that differed significantly between patients who had complications and those who did not were level of hemoglobin (10.6 g/dL vs. 11.9 g/dL, respectively; P = .02) and platelet count (349 vs. 287 K/mm3; P = .025). No differences in the rate of complications were observed based on the number of biologic medications each patient failed prior to the initiation of vedolizumab (P = .718). Compared with patients who had no postoperative complications, those who did were more likely to have undergone intra-abdominal surgery (17 vs. 10 patients; P = .034), require postoperative transfusion (4 vs. none; P = .045), visit the emergency department (10 vs. none; P less than .001), or require hospital readmission (10 vs. none; P less than .001).
Dr. Eisenstein acknowledged certain limitations of the study including its small sample size, single-center, retrospective design, and the potential for selection bias. “The patients who were getting vedolizumab are the patients who failed all of the anti-TNFs, so we’re really selecting patients with the worst, most medically refractory disease,” he noted. “Because of that we can’t say for sure [if the complications] are due to their severity of disease or due to the medication itself.”
The data are “preliminary and retrospectively analyzed, but there is some concern that patients on these types of medications may have an increased risk of postoperative complications,” he concluded. “What we really need are bigger studies. To that end, we are actually starting an IBD collaborative based on some of the findings we have here, because we really want to analyze these data over a much larger population of patients.”
The researchers reported having no financial disclosures.
AT THE ASCRS ANNUAL MEETING
Key clinical point:Patients on vedolizumab have a high rate of postoperative complications.
Major finding: The overall rate of infectious complications following intra-abdominal or anorectal surgery was 44%.
Data source: A retrospective study of 26 patients with IBD who underwent intra-abdominal or anorectal surgery following treatment with vedolizumab.
Disclosures: Dr. Eisenstein reported having no financial disclosures.

Fistula developed after delivery: $50M verdict

Fistula developed after delivery: $50M verdict
During delivery of a 31-year-old woman's baby, a nuchal cord was encountered. In order to safely deliver the child, the ObGyn performed an episiotomy.
After delivery, the patient reported an odorous vaginal discharge. The ObGyn explained that the condition was a natural byproduct of delivery and suggested that it would resolve without treatment.
The patient became pregnant a second time shortly after her first delivery and was evaluated by a midwife. The patient again reported the odorous discharge, but the condition was not addressed. At delivery of her second child, the ObGyn determined that the patient had a rectovaginal fistula. The patient underwent 13 repair operations.
PATIENT’S CLAIM:
The fistula was a byproduct of the episiotomy performed during the first delivery. The episiotomy should not have been performed. The ObGyn should have diagnosed and treated the fistula prior to delivery of the second child and performed a cesarean delivery.
DEFENDANT'S DEFENSE:
The ObGyn reported that the patient's medical records showed that she did not report the odorous discharge until after her second delivery.
VERDICT:
A New York $50 million verdict was returned.
Related article:
Management of wound complications following obstetric anal sphincter injury (OASIS)
Abdominal wall hematoma during pregnancy: $2.5M award
At 35 weeks' gestation, a 38-year-old woman presented to the emergency department (ED) with right upper abdominal pain. Her pregnancy was at high risk because of her age and the fact that she had thrombophilia involving both factor V and protein S deficiency. During pregnancy she was anticoagulated. She had been coughing from bronchitis, which was treated with antibiotics and an inhaler.
In the ED, laboratory testing determined that her blood was not properly clotting. Upper abdominal ultrasonography (US) showed an abdominal wall hematoma and gall stones. The ED physician, after contacting the on-call ObGyn, told the patient that nothing further could be done until after the baby's birth and prescribed medications for nausea and pain. The patient was discharged.
Thirty-three hours later, the patient was rushed to the hospital after she was found barely responsive, pale, and in severe pain. US results showed that the hematoma had grown extensively. The patient was in hypovolemic shock having lost more than 50% of her blood volume. She was admitted to the intensive care unit.
After induced labor, a stillborn son was delivered. The autopsy report revealed that the child died from either asphyxiation or an hypoxic ischemic event that occurred when the mother went into shock.
PATIENT’S CLAIM:
The ED physician and staff were negligent. Once the hematoma was identified, the standard of care is to monitor the hematoma with regular US. Instead, the ED physician discharged the patient. The ED physician contacted the on-call ObGyn but did not ask for a consult. The patient should have been admitted for monitoring.
DEFENDANT'S DEFENSE:
The ED physician met the standard of care. The mother's condition would likely have been detected during a nonstress test scheduled for the following day but the mother missed the prenatal exam because she had just left the hospital.
VERDICT:
A $2.5 million Missouri verdict was returned.
Incorrect due date, child with brain injuries: $1.2M
When a pregnant woman presented for her first prenatal visit, she was unsure of the date of her last menstrual period. During subsequent prenatal visits, she underwent 3 ultrasounds.
Labor was induced on August 1 because she reported gastrointestinal reflux. The infant appeared healthy at birth but soon went into respiratory distress. He was slow to meet developmental goals and was believed to be autistic. At age 5 years, he was given a diagnosis of periventricular leukomalacia.
PARENT’S CLAIM:
The child, 11 years old at the time of trial, has permanent brain injuries due to premature delivery. The mother's due date should have been projected as August 25 according to prenatal US measurements. The ObGyn misinterpreted the US data and estimated a due date of August 15. Therefore induction on August 1st caused him to be premature.
PHYSICIAN’S DEFENSE:
The standard of care was met. Gestational age evaluation using US is an estimate based on the child's size at specific time points, not an exact calculation, especially if the mother is not sure about the date of her last menses.
VERDICT:
A $1.2 million New Jersey verdict was returned.
Related article:
Three good apps for calculating the date of delivery
Bacterial infection blamed for birth injury
A woman was at 28 weeks' gestation when her membranes ruptured on September 28. She began to leak amniotic fluid and was put on bed rest. She saw her ObGyn on October 13 with signs of a bacterial infection of her membranes. The ObGyn decided to induce labor; a baby girl was born 11 hours later. The child had meningitis at birth and other infection-related complications including a brain hemorrhage. She continues to have permanent neurologic deficits.
PARENT’S CLAIM:
The ObGyn was negligent in not immediately delivering the child via cesarean delivery on October 13. The delay exposed the baby to infection for 11 more hours; the extended exposure led to her permanent injury.
PHYSICIAN’S DEFENSE:
The patient's treatment met the standard of care.
VERDICT:
A Virginia defense verdict was returned.
These cases were selected by the editors of OBG Management from Medical Malpractice Verdicts, Settlements & Experts, with permission of the editor, Lewis Laska (www.verdictslaska.com). The information available to the editors about the cases presented here is sometimes incomplete. Moreover, the cases may or may not have merit. Nevertheless, these cases represent the types of clinical situations that typically result in litigation and are meant to illustrate nationwide variation in jury verdicts and awards.
Share your thoughts! Send your Letter to the Editor to [email protected]. Please include your name and the city and state in which you practice.