User login
Intractable shoulder dystocia: A posterior axilla maneuver may save the day
Shoulder dystocia is an unpredictable obstetric emergency that challenges all obstetricians and midwives. In response to a shoulder dystocia emergency, most clinicians implement a sequence of well-practiced steps that begin with early recognition of the problem, clear communication of the emergency with delivery room staff, and a call for help to available clinicians. Management steps may include:
- instructing the mother to stop pushing and moving the mother's buttocks to the edge of the bed
- ensuring there is not a tight nuchal cord
- committing to avoiding the use of excessive force on the fetal head and neck
- considering performing an episiotomy
- performing the McRoberts maneuver combined with suprapubic pressure
- using a rotational maneuver, such as the Woods maneuver or the Rubin maneuver
- delivering the posterior arm
- considering the Gaskin all-four maneuver.
When initial management steps are not enoughIf this sequence of steps does not result in successful vaginal delivery, additional options include: clavicle fracture, cephalic replacement followed by cesarean delivery (Zavanelli maneuver), symphysiotomy, or fundal pressure combined with a rotational maneuver. Another simple intervention that is not discussed widely in medical textbooks or taught during training is the posterior axilla maneuver.
Posterior axilla maneuversVarying posterior axilla maneuvers have been described by many expert obstetricians, including Willughby (17th Century),1 Holman (1963),2 Schramm (1983),3 Menticoglou (2006),4 and Hofmeyr and Cluver (2009, 2015).5−7
Willughby maneuverPercival Willughby’s (1596−1685) description of a posterior axilla maneuver was brief1:
After the head is born, if the child through the greatness of the shoulders, should stick at the neck, let the midwife put her fingers under the child's armpit and give it a nudge, thrusting it to the other side with her finger, drawing the child or she may quickly bring forth the shoulders, without offering to put it forth by her hands clasped about the neck, which might endanger the breaking of the neck.
Holman maneuverHolman described a maneuver with the following steps2:
- perform an episiotomy
- place a finger in the posterior axilla and draw the posterior shoulder down along the pelvic axis
- simultaneously have an assistant perform suprapubic pressure and
- if necessary, insert two supinated fingers under the pubic arch and press and rock the anterior shoulder, tilting the anterior shoulder toward the hollow of the sacrum while simultaneously gently pulling the posterior axilla along the pelvic axis.
Schramm maneuverSchramm, working with a population enriched with women with diabetes, frequently encountered shoulder dystocia and recommended3:
If the posterior axilla can be reached—in other words, if the posterior shoulder is engaged—in my experience it can always be delivered by rotating it to the anterior position while at the same time applying traction....I normally place 1 or 2 fingers of my right hand in the posterior axilla and “scruff” the neck with my left hand, applying both rotation and traction. Because this grip is somewhat insecure, the resultant tractive force is limited and I consider this manoeuvre to be the most effective and least traumatic method of relieving moderate to severe obstruction.
Practice your shoulder dystocia maneuvers using simulation
Obstetric emergencies trigger a rush of adrenaline and great stress for the obstetrician and delivery room team. This may adversely impact motor performance, decision making, and communication skills.1 Low- and high-fidelity simulation exercises create an environment in which the obstetrics team can practice the sequence of maneuvers and seamless teamwork needed to successfully resolve a shoulder dystocia.2,3 Implementing a shoulder dystocia protocol and practicing the protocol using team-based simulation may help to reduce the adverse outcomes of shoulder dystocia.3,4
Reference
1. Wetzel CM, Kneebone RL, Woloshynowych M, et al. The effects of stress on surgical performance. Am J Surg. 2006;191(1):5−10.
2. Crofts JF, Fox R, Ellis D, Winter C, Hinshaw K, Draycott TJ. Observations from 450 shoulder dystocia simulations. Obstet Gynecol. 2008;112(4):906−912.
3. Draycott TJ, Crofts JF, Ash JP, et al. Improving neonatal outcome through practical shoulder dystocia training. Obstet Gynecol. 2008;112(1):14−20.
4. Grobman WA, Miller D, Burke C, Hornbogen A, Tam K, Costello R. Outcomes associated with introduction of a shoulder dystocia protocol. Am J Obstet Gynecol. 2011;205(6):513−517.
Manipulation of the posterior axilla |
|
The right and left third fingers are locked into the posterior axilla, one finger from the front and one from the back of the fetus. Gentle downward guidance is provided by the fingers to draw the posterior shoulder down and out along the curve of the sacrum, thus releasing the anterior shoulder.4 In this drawing, an assistant gently holds the head up. |
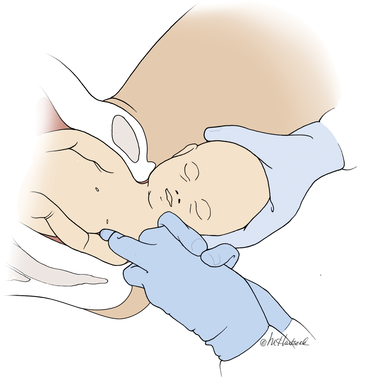
Menticoglou maneuverMenticoglou noted that delivery of the posterior arm generally resolves almost all cases of shoulder dystocia. However, if the posterior arm is extended and trapped between the fetus and maternal pelvic side-wall, it may be difficult to deliver the posterior arm. In these cases he recommended having an assistant gently hold, not pull, the fetal head upward and, at the same time, having the obstetrician get on one knee, placing the middle fingers of both hands into the posterior axilla of the fetus.4
The right middle finger is placed into the axilla from the left side of the maternal pelvis, and the left middle finger is placed into the axilla from the right side of the maternal pelvis, resulting in the two middle fingers overlapping in the fetal axilla (FIGURE).4 Gentle force is then used to pull the posterior shoulder and arm downward and outward along the curve of the sacrum. Once the shoulder has emerged from the pelvis, the posterior arm is delivered. Alternatively, if the posterior shoulder is brought well down into the pelvis, another attempt can be made at delivering the posterior arm.4
My preferred approach. The Menticoglou maneuver is my preferred posterior axilla maneuver because it can be accomplished rapidly; requires no equipment, such as a sling catheter; and the obstetrician has good tactile feedback throughout the application of gentle force.
Hofmeyr-Cluver maneuverIn cases of difficult shoulder dystocia, Dr. William Smellie (1762)8 recommended placing one or two fingers in the anterior or posterior fetal axilla and gentling pulling on the axilla to deliver the body. If the axillae were too high to reach, he recommended using a blunt hook in the axilla to draw forth the impacted child. He advised caution when using a blunt hook because the fetus might be injured or lacerated.
Instead of using a hook, Hofmeyr and Cluver5−7 have recommended using a catheter sling to deliver the posterior shoulder. In this maneuver, a loop of a suction catheter or firm urinary catheter is placed over the obstetrician’s index finger and the loop is pushed through the posterior axilla, back to front, with guidance from the index finger. The index finger of the opposite hand is used to catch the loop and pull the catheter through, creating a single-stranded sling that is positioned in the axilla. Gentle force is then applied to the sling in the axis of the pelvis to deliver the posterior shoulder.
“If the posterior arm does not follow it is then swept out easily because room has been created by delivering the posterior shoulder. If the aforementioned procedure fails, the sling can be used to rotate the shoulder. To perform a rotational maneuver, sling traction is directed laterally towards the side of the baby’s back then anteriorly while digital pressure is applied behind the anterior shoulder to assist rotation.”7
Use ACOG’s checklist for documenting a shoulder dystocia
Following the resolution of a shoulder dystocia, it is important to gather all the necessary facts to complete a detailed medical record entry describing the situation and interventions used. The checklist from the American College of Obstetricians and Gynecologists (ACOG) helps you to prepare a standardized medical record entry that is comprehensive.
My experience is that “free form” medical record entries describing the events at a shoulder dystocia event are generally not optimally organized, creating future problems when the case is reviewed.
ACOG obstetric checklists are available for download at http://www.acog.org/Resources-And-Publications, or use your web browser to search for “ACOG Shoulder Dystocia checklist.”
With scant literature, know the benefits and risksThe world’s literature on posterior axilla maneuvers to resolve shoulder dystocia consists of case series and individual case reports.2−7 Hence, the quality of the data supporting this intervention is not optimal, and risks associated with the maneuver are not well characterized. Application of a controlled and gentle force to the posterior axilla may cause fracture of the fetal humerus5 or dislocation of the fetal shoulder. The posterior axilla maneuver also may increase the risk of a maternal third- or fourth-degree perineal laceration.
As a general rule, as the number of maneuvers used to resolve a difficult shoulder dystocia increase, the risk of neonatal injury increases.9 Since the posterior axilla maneuver typically is only attempted after multiple previous maneuvers have failed, the risk of fetal injury is increased. However, as time passes and a shoulder dystocia remains unresolved for 4 or 5 minutes, the risk of neurologic injury and fetal death increases.10
In resolving a shoulder dystocia, speed and skill are essential. A posterior axilla maneuver can be performed more rapidly than a Zavanelli maneuver or a symphysiotomy. Although manipulation of the posterior axilla and arm may cause a fracture of the humerus, this complication is a modest price to pay for preventing permanent fetal brain injury or fetal death.
Share your thoughts! Send your Letter to the Editor to [email protected]. Please include your name and the city and state in which you practice.
- Willughby P. Observations in midwifery. New York, NY: MW Books; 1972:312−313.
- Holman MS. A new manoeuvre for delivery of an impacted shoulder based on a mechanical analysis. S Afr Med J. 1963;37:247−249.
- Schramm M. Impacted shoulders—a personal experience. Aust N Z J Obstet Gynaecol. 1983;23(1):28−31.
- Menticoglou SM. A modified technique to deliver the posterior arm in severe shoulder dystocia. Obstet Gynecol. 2006;108(3 pt 2):755−757.
- Cluver CA, Hofmeyr GJ. Posterior axilla sling traction: a technique for intractable shoulder dystocia. Obstet Gynecol. 2009;113(2 pt 2):486–488.
- Hofmeyr GJ, Cluver CA. Posterior axilla sling traction for intractable shoulder dystocia. BJOG. 2009;116(13):1818−1820.
- Cluver CA, Hofmeyr GJ. Posterior axilla sling traction for shoulder dystocia: case review and a new method for shoulder rotation with the sling. Am J Obstet Gynecol. 2015;212(6):784.e1−e7.
- Smellie W. A treatise on the theory and practice of midwifery. 4th ed. London, England; 1762:226−227.
- Hoffman MK, Bailit JL, Branch DW, et al; Consortium on Safe Labor. A comparison of obstetric maneuvers for the acute management of shoulder dystocia. Obstet Gynecol. 2011;117(6):1272−1278.
- Lerner H, Durlacher K, Smith S, Hamilton E. Relationship between head-to-body delivery interval in shoulder dystocia and neonatal depression. Obstet Gynecol. 2011;118(2 pt 1):318−322.

Dr. Barbieri is Editor in Chief, OBG Management; Chair, Obstetrics and Gynecology, Brigham and Women’s Hospital; and Kate Macy Ladd Professor of Obstetrics, Gynecology, and Reproductive Biology, Harvard Medical School, Boston, Massachusetts.
Dr. Barbieri reports no financial relationships relevant to this article.
Shoulder dystocia is an unpredictable obstetric emergency that challenges all obstetricians and midwives. In response to a shoulder dystocia emergency, most clinicians implement a sequence of well-practiced steps that begin with early recognition of the problem, clear communication of the emergency with delivery room staff, and a call for help to available clinicians. Management steps may include:
- instructing the mother to stop pushing and moving the mother's buttocks to the edge of the bed
- ensuring there is not a tight nuchal cord
- committing to avoiding the use of excessive force on the fetal head and neck
- considering performing an episiotomy
- performing the McRoberts maneuver combined with suprapubic pressure
- using a rotational maneuver, such as the Woods maneuver or the Rubin maneuver
- delivering the posterior arm
- considering the Gaskin all-four maneuver.
When initial management steps are not enoughIf this sequence of steps does not result in successful vaginal delivery, additional options include: clavicle fracture, cephalic replacement followed by cesarean delivery (Zavanelli maneuver), symphysiotomy, or fundal pressure combined with a rotational maneuver. Another simple intervention that is not discussed widely in medical textbooks or taught during training is the posterior axilla maneuver.
Posterior axilla maneuversVarying posterior axilla maneuvers have been described by many expert obstetricians, including Willughby (17th Century),1 Holman (1963),2 Schramm (1983),3 Menticoglou (2006),4 and Hofmeyr and Cluver (2009, 2015).5−7
Willughby maneuverPercival Willughby’s (1596−1685) description of a posterior axilla maneuver was brief1:
After the head is born, if the child through the greatness of the shoulders, should stick at the neck, let the midwife put her fingers under the child's armpit and give it a nudge, thrusting it to the other side with her finger, drawing the child or she may quickly bring forth the shoulders, without offering to put it forth by her hands clasped about the neck, which might endanger the breaking of the neck.
Holman maneuverHolman described a maneuver with the following steps2:
- perform an episiotomy
- place a finger in the posterior axilla and draw the posterior shoulder down along the pelvic axis
- simultaneously have an assistant perform suprapubic pressure and
- if necessary, insert two supinated fingers under the pubic arch and press and rock the anterior shoulder, tilting the anterior shoulder toward the hollow of the sacrum while simultaneously gently pulling the posterior axilla along the pelvic axis.
Schramm maneuverSchramm, working with a population enriched with women with diabetes, frequently encountered shoulder dystocia and recommended3:
If the posterior axilla can be reached—in other words, if the posterior shoulder is engaged—in my experience it can always be delivered by rotating it to the anterior position while at the same time applying traction....I normally place 1 or 2 fingers of my right hand in the posterior axilla and “scruff” the neck with my left hand, applying both rotation and traction. Because this grip is somewhat insecure, the resultant tractive force is limited and I consider this manoeuvre to be the most effective and least traumatic method of relieving moderate to severe obstruction.
Practice your shoulder dystocia maneuvers using simulation
Obstetric emergencies trigger a rush of adrenaline and great stress for the obstetrician and delivery room team. This may adversely impact motor performance, decision making, and communication skills.1 Low- and high-fidelity simulation exercises create an environment in which the obstetrics team can practice the sequence of maneuvers and seamless teamwork needed to successfully resolve a shoulder dystocia.2,3 Implementing a shoulder dystocia protocol and practicing the protocol using team-based simulation may help to reduce the adverse outcomes of shoulder dystocia.3,4
Reference
1. Wetzel CM, Kneebone RL, Woloshynowych M, et al. The effects of stress on surgical performance. Am J Surg. 2006;191(1):5−10.
2. Crofts JF, Fox R, Ellis D, Winter C, Hinshaw K, Draycott TJ. Observations from 450 shoulder dystocia simulations. Obstet Gynecol. 2008;112(4):906−912.
3. Draycott TJ, Crofts JF, Ash JP, et al. Improving neonatal outcome through practical shoulder dystocia training. Obstet Gynecol. 2008;112(1):14−20.
4. Grobman WA, Miller D, Burke C, Hornbogen A, Tam K, Costello R. Outcomes associated with introduction of a shoulder dystocia protocol. Am J Obstet Gynecol. 2011;205(6):513−517.
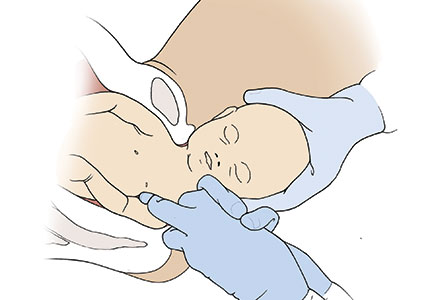
Manipulation of the posterior axilla |
|
The right and left third fingers are locked into the posterior axilla, one finger from the front and one from the back of the fetus. Gentle downward guidance is provided by the fingers to draw the posterior shoulder down and out along the curve of the sacrum, thus releasing the anterior shoulder.4 In this drawing, an assistant gently holds the head up. |
Menticoglou maneuverMenticoglou noted that delivery of the posterior arm generally resolves almost all cases of shoulder dystocia. However, if the posterior arm is extended and trapped between the fetus and maternal pelvic side-wall, it may be difficult to deliver the posterior arm. In these cases he recommended having an assistant gently hold, not pull, the fetal head upward and, at the same time, having the obstetrician get on one knee, placing the middle fingers of both hands into the posterior axilla of the fetus.4
The right middle finger is placed into the axilla from the left side of the maternal pelvis, and the left middle finger is placed into the axilla from the right side of the maternal pelvis, resulting in the two middle fingers overlapping in the fetal axilla (FIGURE).4 Gentle force is then used to pull the posterior shoulder and arm downward and outward along the curve of the sacrum. Once the shoulder has emerged from the pelvis, the posterior arm is delivered. Alternatively, if the posterior shoulder is brought well down into the pelvis, another attempt can be made at delivering the posterior arm.4
My preferred approach. The Menticoglou maneuver is my preferred posterior axilla maneuver because it can be accomplished rapidly; requires no equipment, such as a sling catheter; and the obstetrician has good tactile feedback throughout the application of gentle force.
Hofmeyr-Cluver maneuverIn cases of difficult shoulder dystocia, Dr. William Smellie (1762)8 recommended placing one or two fingers in the anterior or posterior fetal axilla and gentling pulling on the axilla to deliver the body. If the axillae were too high to reach, he recommended using a blunt hook in the axilla to draw forth the impacted child. He advised caution when using a blunt hook because the fetus might be injured or lacerated.
Instead of using a hook, Hofmeyr and Cluver5−7 have recommended using a catheter sling to deliver the posterior shoulder. In this maneuver, a loop of a suction catheter or firm urinary catheter is placed over the obstetrician’s index finger and the loop is pushed through the posterior axilla, back to front, with guidance from the index finger. The index finger of the opposite hand is used to catch the loop and pull the catheter through, creating a single-stranded sling that is positioned in the axilla. Gentle force is then applied to the sling in the axis of the pelvis to deliver the posterior shoulder.
“If the posterior arm does not follow it is then swept out easily because room has been created by delivering the posterior shoulder. If the aforementioned procedure fails, the sling can be used to rotate the shoulder. To perform a rotational maneuver, sling traction is directed laterally towards the side of the baby’s back then anteriorly while digital pressure is applied behind the anterior shoulder to assist rotation.”7
Use ACOG’s checklist for documenting a shoulder dystocia
Following the resolution of a shoulder dystocia, it is important to gather all the necessary facts to complete a detailed medical record entry describing the situation and interventions used. The checklist from the American College of Obstetricians and Gynecologists (ACOG) helps you to prepare a standardized medical record entry that is comprehensive.
My experience is that “free form” medical record entries describing the events at a shoulder dystocia event are generally not optimally organized, creating future problems when the case is reviewed.
ACOG obstetric checklists are available for download at http://www.acog.org/Resources-And-Publications, or use your web browser to search for “ACOG Shoulder Dystocia checklist.”
With scant literature, know the benefits and risksThe world’s literature on posterior axilla maneuvers to resolve shoulder dystocia consists of case series and individual case reports.2−7 Hence, the quality of the data supporting this intervention is not optimal, and risks associated with the maneuver are not well characterized. Application of a controlled and gentle force to the posterior axilla may cause fracture of the fetal humerus5 or dislocation of the fetal shoulder. The posterior axilla maneuver also may increase the risk of a maternal third- or fourth-degree perineal laceration.
As a general rule, as the number of maneuvers used to resolve a difficult shoulder dystocia increase, the risk of neonatal injury increases.9 Since the posterior axilla maneuver typically is only attempted after multiple previous maneuvers have failed, the risk of fetal injury is increased. However, as time passes and a shoulder dystocia remains unresolved for 4 or 5 minutes, the risk of neurologic injury and fetal death increases.10
In resolving a shoulder dystocia, speed and skill are essential. A posterior axilla maneuver can be performed more rapidly than a Zavanelli maneuver or a symphysiotomy. Although manipulation of the posterior axilla and arm may cause a fracture of the humerus, this complication is a modest price to pay for preventing permanent fetal brain injury or fetal death.
Share your thoughts! Send your Letter to the Editor to [email protected]. Please include your name and the city and state in which you practice.
Shoulder dystocia is an unpredictable obstetric emergency that challenges all obstetricians and midwives. In response to a shoulder dystocia emergency, most clinicians implement a sequence of well-practiced steps that begin with early recognition of the problem, clear communication of the emergency with delivery room staff, and a call for help to available clinicians. Management steps may include:
- instructing the mother to stop pushing and moving the mother's buttocks to the edge of the bed
- ensuring there is not a tight nuchal cord
- committing to avoiding the use of excessive force on the fetal head and neck
- considering performing an episiotomy
- performing the McRoberts maneuver combined with suprapubic pressure
- using a rotational maneuver, such as the Woods maneuver or the Rubin maneuver
- delivering the posterior arm
- considering the Gaskin all-four maneuver.
When initial management steps are not enoughIf this sequence of steps does not result in successful vaginal delivery, additional options include: clavicle fracture, cephalic replacement followed by cesarean delivery (Zavanelli maneuver), symphysiotomy, or fundal pressure combined with a rotational maneuver. Another simple intervention that is not discussed widely in medical textbooks or taught during training is the posterior axilla maneuver.
Posterior axilla maneuversVarying posterior axilla maneuvers have been described by many expert obstetricians, including Willughby (17th Century),1 Holman (1963),2 Schramm (1983),3 Menticoglou (2006),4 and Hofmeyr and Cluver (2009, 2015).5−7
Willughby maneuverPercival Willughby’s (1596−1685) description of a posterior axilla maneuver was brief1:
After the head is born, if the child through the greatness of the shoulders, should stick at the neck, let the midwife put her fingers under the child's armpit and give it a nudge, thrusting it to the other side with her finger, drawing the child or she may quickly bring forth the shoulders, without offering to put it forth by her hands clasped about the neck, which might endanger the breaking of the neck.
Holman maneuverHolman described a maneuver with the following steps2:
- perform an episiotomy
- place a finger in the posterior axilla and draw the posterior shoulder down along the pelvic axis
- simultaneously have an assistant perform suprapubic pressure and
- if necessary, insert two supinated fingers under the pubic arch and press and rock the anterior shoulder, tilting the anterior shoulder toward the hollow of the sacrum while simultaneously gently pulling the posterior axilla along the pelvic axis.
Schramm maneuverSchramm, working with a population enriched with women with diabetes, frequently encountered shoulder dystocia and recommended3:
If the posterior axilla can be reached—in other words, if the posterior shoulder is engaged—in my experience it can always be delivered by rotating it to the anterior position while at the same time applying traction....I normally place 1 or 2 fingers of my right hand in the posterior axilla and “scruff” the neck with my left hand, applying both rotation and traction. Because this grip is somewhat insecure, the resultant tractive force is limited and I consider this manoeuvre to be the most effective and least traumatic method of relieving moderate to severe obstruction.
Practice your shoulder dystocia maneuvers using simulation
Obstetric emergencies trigger a rush of adrenaline and great stress for the obstetrician and delivery room team. This may adversely impact motor performance, decision making, and communication skills.1 Low- and high-fidelity simulation exercises create an environment in which the obstetrics team can practice the sequence of maneuvers and seamless teamwork needed to successfully resolve a shoulder dystocia.2,3 Implementing a shoulder dystocia protocol and practicing the protocol using team-based simulation may help to reduce the adverse outcomes of shoulder dystocia.3,4
Reference
1. Wetzel CM, Kneebone RL, Woloshynowych M, et al. The effects of stress on surgical performance. Am J Surg. 2006;191(1):5−10.
2. Crofts JF, Fox R, Ellis D, Winter C, Hinshaw K, Draycott TJ. Observations from 450 shoulder dystocia simulations. Obstet Gynecol. 2008;112(4):906−912.
3. Draycott TJ, Crofts JF, Ash JP, et al. Improving neonatal outcome through practical shoulder dystocia training. Obstet Gynecol. 2008;112(1):14−20.
4. Grobman WA, Miller D, Burke C, Hornbogen A, Tam K, Costello R. Outcomes associated with introduction of a shoulder dystocia protocol. Am J Obstet Gynecol. 2011;205(6):513−517.
Manipulation of the posterior axilla |
|
The right and left third fingers are locked into the posterior axilla, one finger from the front and one from the back of the fetus. Gentle downward guidance is provided by the fingers to draw the posterior shoulder down and out along the curve of the sacrum, thus releasing the anterior shoulder.4 In this drawing, an assistant gently holds the head up. |
Menticoglou maneuverMenticoglou noted that delivery of the posterior arm generally resolves almost all cases of shoulder dystocia. However, if the posterior arm is extended and trapped between the fetus and maternal pelvic side-wall, it may be difficult to deliver the posterior arm. In these cases he recommended having an assistant gently hold, not pull, the fetal head upward and, at the same time, having the obstetrician get on one knee, placing the middle fingers of both hands into the posterior axilla of the fetus.4
The right middle finger is placed into the axilla from the left side of the maternal pelvis, and the left middle finger is placed into the axilla from the right side of the maternal pelvis, resulting in the two middle fingers overlapping in the fetal axilla (FIGURE).4 Gentle force is then used to pull the posterior shoulder and arm downward and outward along the curve of the sacrum. Once the shoulder has emerged from the pelvis, the posterior arm is delivered. Alternatively, if the posterior shoulder is brought well down into the pelvis, another attempt can be made at delivering the posterior arm.4
My preferred approach. The Menticoglou maneuver is my preferred posterior axilla maneuver because it can be accomplished rapidly; requires no equipment, such as a sling catheter; and the obstetrician has good tactile feedback throughout the application of gentle force.
Hofmeyr-Cluver maneuverIn cases of difficult shoulder dystocia, Dr. William Smellie (1762)8 recommended placing one or two fingers in the anterior or posterior fetal axilla and gentling pulling on the axilla to deliver the body. If the axillae were too high to reach, he recommended using a blunt hook in the axilla to draw forth the impacted child. He advised caution when using a blunt hook because the fetus might be injured or lacerated.
Instead of using a hook, Hofmeyr and Cluver5−7 have recommended using a catheter sling to deliver the posterior shoulder. In this maneuver, a loop of a suction catheter or firm urinary catheter is placed over the obstetrician’s index finger and the loop is pushed through the posterior axilla, back to front, with guidance from the index finger. The index finger of the opposite hand is used to catch the loop and pull the catheter through, creating a single-stranded sling that is positioned in the axilla. Gentle force is then applied to the sling in the axis of the pelvis to deliver the posterior shoulder.
“If the posterior arm does not follow it is then swept out easily because room has been created by delivering the posterior shoulder. If the aforementioned procedure fails, the sling can be used to rotate the shoulder. To perform a rotational maneuver, sling traction is directed laterally towards the side of the baby’s back then anteriorly while digital pressure is applied behind the anterior shoulder to assist rotation.”7
Use ACOG’s checklist for documenting a shoulder dystocia
Following the resolution of a shoulder dystocia, it is important to gather all the necessary facts to complete a detailed medical record entry describing the situation and interventions used. The checklist from the American College of Obstetricians and Gynecologists (ACOG) helps you to prepare a standardized medical record entry that is comprehensive.
My experience is that “free form” medical record entries describing the events at a shoulder dystocia event are generally not optimally organized, creating future problems when the case is reviewed.
ACOG obstetric checklists are available for download at http://www.acog.org/Resources-And-Publications, or use your web browser to search for “ACOG Shoulder Dystocia checklist.”
With scant literature, know the benefits and risksThe world’s literature on posterior axilla maneuvers to resolve shoulder dystocia consists of case series and individual case reports.2−7 Hence, the quality of the data supporting this intervention is not optimal, and risks associated with the maneuver are not well characterized. Application of a controlled and gentle force to the posterior axilla may cause fracture of the fetal humerus5 or dislocation of the fetal shoulder. The posterior axilla maneuver also may increase the risk of a maternal third- or fourth-degree perineal laceration.
As a general rule, as the number of maneuvers used to resolve a difficult shoulder dystocia increase, the risk of neonatal injury increases.9 Since the posterior axilla maneuver typically is only attempted after multiple previous maneuvers have failed, the risk of fetal injury is increased. However, as time passes and a shoulder dystocia remains unresolved for 4 or 5 minutes, the risk of neurologic injury and fetal death increases.10
In resolving a shoulder dystocia, speed and skill are essential. A posterior axilla maneuver can be performed more rapidly than a Zavanelli maneuver or a symphysiotomy. Although manipulation of the posterior axilla and arm may cause a fracture of the humerus, this complication is a modest price to pay for preventing permanent fetal brain injury or fetal death.
Share your thoughts! Send your Letter to the Editor to [email protected]. Please include your name and the city and state in which you practice.
- Willughby P. Observations in midwifery. New York, NY: MW Books; 1972:312−313.
- Holman MS. A new manoeuvre for delivery of an impacted shoulder based on a mechanical analysis. S Afr Med J. 1963;37:247−249.
- Schramm M. Impacted shoulders—a personal experience. Aust N Z J Obstet Gynaecol. 1983;23(1):28−31.
- Menticoglou SM. A modified technique to deliver the posterior arm in severe shoulder dystocia. Obstet Gynecol. 2006;108(3 pt 2):755−757.
- Cluver CA, Hofmeyr GJ. Posterior axilla sling traction: a technique for intractable shoulder dystocia. Obstet Gynecol. 2009;113(2 pt 2):486–488.
- Hofmeyr GJ, Cluver CA. Posterior axilla sling traction for intractable shoulder dystocia. BJOG. 2009;116(13):1818−1820.
- Cluver CA, Hofmeyr GJ. Posterior axilla sling traction for shoulder dystocia: case review and a new method for shoulder rotation with the sling. Am J Obstet Gynecol. 2015;212(6):784.e1−e7.
- Smellie W. A treatise on the theory and practice of midwifery. 4th ed. London, England; 1762:226−227.
- Hoffman MK, Bailit JL, Branch DW, et al; Consortium on Safe Labor. A comparison of obstetric maneuvers for the acute management of shoulder dystocia. Obstet Gynecol. 2011;117(6):1272−1278.
- Lerner H, Durlacher K, Smith S, Hamilton E. Relationship between head-to-body delivery interval in shoulder dystocia and neonatal depression. Obstet Gynecol. 2011;118(2 pt 1):318−322.
In this article
- Menticoglou maneuver
- Importance of simulation
Hepatitis Outlook: March 2016
If you work on the front lines of medical care treating patients with hepatitis, you may not have time to review all the hepatitis research that enters the medical literature every month. Here’s a quick look at some notable news items and journal articles published over the past month, covering a variety of the major hepatitis viruses.
In the United States, hepatitis C virus (HCV)-associated mortality is increasing. From 2003-2013, the number of deaths associated with HCV has now surpassed 60 other nationally notifiable infectious conditions combined.

Chronic hepatitis B infection increased mortality and complexity among a cohort of HIV-coinfected patients in South Africa, according to a study in HIV Medicine. Researchers found that mortality was increased for chronic hepatitis B patients with hepatitis B virus DNA levels greater than 10,000 copies/mL, compared with non-coinfected patients.
A study in the Journal of Infectious Diseases found that Interferon Lambda (IFNL) genotypes were individually linked to higher rates of fibrosis in HIV–hepatitis C co-infection. Investigators said IFNL genotypes may be useful to target hepatitis C virus treatments to those who are at higher risk of liver disease.
A phase I study of a new NS3/4A protease inhibitor for treatment of chronic hepatitis C virus genotype 1-4 infection yielded positive tolerability, efficacy, and pharmacokinetic results, indicating further evaluation is warranted. The drug, GS-9857, produced by Gilead Sciences, achieved mean and median maximum reductions in HCV RNA of greater than or equal to 3 log10 IU/mL following administration of a 100-mg dose in patients with HCV genotype 1a, 1b, 2, 3, or 4 infection.
High baseline bilirubin and low albumin predict liver decompensation and serious adverse events in hepatitis C-infected patients treated with sofosbuvir-containing regimens, according to a study in the Journal of Viral Hepatitis. Among 499 previously stable patients in the cohort, the incidence of decompensation/events was 4.5%, and the mortality rate was 0.6%.
A meta-analysis of national-level hepatitis C virus prevalence in the Arabian Gulf region found that it is comparable to global levels, although higher HCV prevalence is found in specific expatriate populations reflecting the prevalence in their countries of origin.
A resistance analysis of the drug GS-9190, a NS5B non-nucleoside analogue for the treatment of hepatitis C virus infection, found that the Y448H mutation was rapidly selected in the majority of patients receiving multiple doses of GS-9190 as monotherapy, despite undetectable levels in pretreatment samples. Researchers concluded that Y448H confers reduced susceptibility to GS-9190 and other non-nucleoside inhibitors and persisted in most patients for months post-treatment.
A study published in the International Journal of Infectious Diseases found that hepatitis delta virus (HDV) patients in the Amazon region can be treated with a combination of Pegylated Interferon Alpha and Entecavir for 48 weeks, with good chances of negative HDV RNA at week 24. The results suggest that HDV-3 in the native population may be an “easy to treat” variant compared to HDV-1.
Development of acute hepatitis B virus disease in successfully vaccinated individuals is a rare event, affirmed a study of the Italian Surveillance System for Acute Viral Hepatitis (SEIEVA) from 1993 to 2014. Only 3.2% of acute hepatitis B cases had been vaccinated. Investigators said further efforts are needed to enhance the vaccine coverage rate in people at increased risk of infection, as hepatitis B is a vaccine-preventable disease.
Lab-made hepatocyte transplantation has therapeutic potential as a bridge or even alternative to whole organ liver transplantation, but researchers say deficiencies and uncertainties must be addressed in future studies aimed at developing liver cell therapies with such hepatocytes.
A major concern in potential liver transplant candidates is of unintended harm by achieving sustained viral response rates to direct-acting antiviral treatment, but without improvement in hepatic function to an extent where the patients might function well. A review essay in the Journal of Viral Hepatitis says there is a growing sentiment in some transplant quarters that those with decompensated liver disease awaiting liver transplant be treated for HCV after liver transplant instead of pre-transplant. The authors say it is essential that to develop robust predictors of improvement in liver function so patients can be carefully selected for therapy in the context of liver transplantation.
Treating mild-stage hepatitis C infection in people who inject drugs had virtually no impact on HCV-related end-stage liver disease/hepatocellular carcinoma (ESLD/HCC) within 15 years, a recent study found, but the long timescale of liver disease means relatively few people who inject drugs reach cirrhosis before cessation of injecting. Investigators said strategies focusing on treating advanced disease have the potential for dramatic reductions in severe morbidity, but virtually no preventative impact.
On Twitter @richpizzi
If you work on the front lines of medical care treating patients with hepatitis, you may not have time to review all the hepatitis research that enters the medical literature every month. Here’s a quick look at some notable news items and journal articles published over the past month, covering a variety of the major hepatitis viruses.
In the United States, hepatitis C virus (HCV)-associated mortality is increasing. From 2003-2013, the number of deaths associated with HCV has now surpassed 60 other nationally notifiable infectious conditions combined.
Chronic hepatitis B infection increased mortality and complexity among a cohort of HIV-coinfected patients in South Africa, according to a study in HIV Medicine. Researchers found that mortality was increased for chronic hepatitis B patients with hepatitis B virus DNA levels greater than 10,000 copies/mL, compared with non-coinfected patients.
A study in the Journal of Infectious Diseases found that Interferon Lambda (IFNL) genotypes were individually linked to higher rates of fibrosis in HIV–hepatitis C co-infection. Investigators said IFNL genotypes may be useful to target hepatitis C virus treatments to those who are at higher risk of liver disease.
A phase I study of a new NS3/4A protease inhibitor for treatment of chronic hepatitis C virus genotype 1-4 infection yielded positive tolerability, efficacy, and pharmacokinetic results, indicating further evaluation is warranted. The drug, GS-9857, produced by Gilead Sciences, achieved mean and median maximum reductions in HCV RNA of greater than or equal to 3 log10 IU/mL following administration of a 100-mg dose in patients with HCV genotype 1a, 1b, 2, 3, or 4 infection.
High baseline bilirubin and low albumin predict liver decompensation and serious adverse events in hepatitis C-infected patients treated with sofosbuvir-containing regimens, according to a study in the Journal of Viral Hepatitis. Among 499 previously stable patients in the cohort, the incidence of decompensation/events was 4.5%, and the mortality rate was 0.6%.
A meta-analysis of national-level hepatitis C virus prevalence in the Arabian Gulf region found that it is comparable to global levels, although higher HCV prevalence is found in specific expatriate populations reflecting the prevalence in their countries of origin.
A resistance analysis of the drug GS-9190, a NS5B non-nucleoside analogue for the treatment of hepatitis C virus infection, found that the Y448H mutation was rapidly selected in the majority of patients receiving multiple doses of GS-9190 as monotherapy, despite undetectable levels in pretreatment samples. Researchers concluded that Y448H confers reduced susceptibility to GS-9190 and other non-nucleoside inhibitors and persisted in most patients for months post-treatment.
A study published in the International Journal of Infectious Diseases found that hepatitis delta virus (HDV) patients in the Amazon region can be treated with a combination of Pegylated Interferon Alpha and Entecavir for 48 weeks, with good chances of negative HDV RNA at week 24. The results suggest that HDV-3 in the native population may be an “easy to treat” variant compared to HDV-1.
Development of acute hepatitis B virus disease in successfully vaccinated individuals is a rare event, affirmed a study of the Italian Surveillance System for Acute Viral Hepatitis (SEIEVA) from 1993 to 2014. Only 3.2% of acute hepatitis B cases had been vaccinated. Investigators said further efforts are needed to enhance the vaccine coverage rate in people at increased risk of infection, as hepatitis B is a vaccine-preventable disease.
Lab-made hepatocyte transplantation has therapeutic potential as a bridge or even alternative to whole organ liver transplantation, but researchers say deficiencies and uncertainties must be addressed in future studies aimed at developing liver cell therapies with such hepatocytes.
A major concern in potential liver transplant candidates is of unintended harm by achieving sustained viral response rates to direct-acting antiviral treatment, but without improvement in hepatic function to an extent where the patients might function well. A review essay in the Journal of Viral Hepatitis says there is a growing sentiment in some transplant quarters that those with decompensated liver disease awaiting liver transplant be treated for HCV after liver transplant instead of pre-transplant. The authors say it is essential that to develop robust predictors of improvement in liver function so patients can be carefully selected for therapy in the context of liver transplantation.
Treating mild-stage hepatitis C infection in people who inject drugs had virtually no impact on HCV-related end-stage liver disease/hepatocellular carcinoma (ESLD/HCC) within 15 years, a recent study found, but the long timescale of liver disease means relatively few people who inject drugs reach cirrhosis before cessation of injecting. Investigators said strategies focusing on treating advanced disease have the potential for dramatic reductions in severe morbidity, but virtually no preventative impact.
On Twitter @richpizzi

New Analysis shows that Women who Develop Diabetes while Pregnant are Likely to Develop Fatty Liver Disease
(Reuters Health) - Women who develop diabetes while pregnant may be at elevated risk of also developing a dangerous build up of fat in their livers when they reach middle age, according to a new analysis.
The common risk factor for both gestational diabetes and non-alcoholic fatty liver disease, researchers say, is trouble making or using the hormone insulin to manage blood sugar, known as insulin resistance.
"We hope that early identification can promote healthy lifestyle changes that prevent or slow disease progression," said lead author Dr. Veeral Ajmera of the University of California, San Francisco.
"Pregnancy stresses the body in many ways, one of which is the ability to manage blood sugar," Ajmera said by email. "During pregnancy a woman's body becomes more resistant to insulin, which is the hormone required to decrease the blood sugar."
Insulin resistance is also "central to development of non-alcoholic fatty liver disease," which affects 20 percent to 30 percent of adults in the western world, the study team writes in The American Journal of Gastroenterology. Non-alcoholic fatty liver disease is the most common chronic liver disease in the United States.
Fatty liver disease is often diagnosed later in life, Ajmera told Reuters Health. So the researchers used long-term data to see if diabetes during pregnancy made a woman more likely to develop fatty liver disease 25 years later.
The researchers analyzed information about 1,115 black and white women recruited between 1985-1986 in four cities across the United States who gave birth to at least one child.
The participants did not have diabetes before becoming pregnant and the study excluded people who had liver issues related to alcohol, HIV, hepatitis or medications.
At the start of the study, women reported on whether they first experienced diabetes during pregnancy, and researchers confirmed the diagnosis with blood test results. Twenty-five years later, the women received more blood tests as well as CT scans of their livers to check if they had fatty liver disease.
At the beginning of the study, 124 women reported that they developed diabetes while they were pregnant. These women were more likely than those who did not experience gestational diabetes to be overweight. They also had higher degrees of insulin resistance when they were younger as well as at the 25-year follow up.
The women who experienced diabetes during pregnancy were also more likely to have developed diabetes again at some point in the following 25 years.
Overall, 75 women were diagnosed with non-alcoholic fatty liver disease when they were middle aged. Women who had diabetes during pregnancy were more than twice as likely as those who didn't to later develop fatty liver disease.
After researchers adjusted for diabetes that some women experienced outside of pregnancy, the risk of non-alcoholic fatty liver disease was still 50 percent higher for women who had gestational diabetes compared to those who didn't.
Fatty liver disease can have grave health effects and can even lead to cirrhosis, a condition that causes liver damage and possible failure, said Simon Taylor-Robinson, a professor of medicine at Imperial College London in the U.K. who wasn't involved in the study.
He advocates changes in diet to avoid the insulin resistance that leads to diabetes and fatty liver disease. "Many women are obese - so it is a matter of reducing weight and eating sensibly," he said.
Taylor-Robinson recommends eating fewer carbohydrates, more proteins and vegetables, and in particular, avoiding large amounts of fruit juice, which can contain a lot of sugar.
Ajmera also advised lifestyle changes, especially adding exercise. "We recommend either aerobic or resistance training for 30 minutes five times per week," he said.
"There are consequences to obesity and this includes cirrhosis, liver cancer and heart disease," Taylor-Robinson said. "Those people who become diabetic during pregnancy have strong risks of developing these complications later in life if attention isn't given to weight, diet and exercise."
EHR Report: Take your medicine!
“Drugs don’t work in patients who don’t take them.”
–C. Everett Koop, M.D.
While it would be hard to imagine accountable care organizations being able to get the data they need to manage care without electronic health records, and EHRs are critical as payment has evolved to emphasize the outcomes of treatment, one area remains the holy grail of disease management: how to get patients to take the medications that are prescribed.
Poor adherence to medications is a critical issue in the management of chronic disease. The causes for suboptimal adherence are numerous, including the cost of medications, patient-physician communication, patient education, motivation, and simple forgetfulness.

Approximately 1.5 billion prescriptions, at a cost of more than $250 billion, are dispensed each year in the United States. A large body of evidence supports the use of these medications. For patients with diabetes, for instance, correct medication use can lower blood sugar, blood pressure, and cholesterol, and by so doing, decrease morbidity and mortality from both microvascular and macrovascular disease.
The act of taking medications is influenced by many factors, and all of these factors come together at a point in time when patients are not directly engaged with the health care system. It is at that moment that patients remember and decide whether to take their medications.
Numerous studies show that individuals often do not take their medicines as prescribed. Adherence rates for medications for chronic disease show that patients on average take only about 50% of prescribed doses. For patients with diabetes, the average adherence rate is about 70%, with rates ranging in different studies from 31% to 87%.
When patients do not take their medications correctly, there can be severe consequences. Poor medication adherence can lead to poorer clinical outcomes, including increased hospitalizations. One large dataset of more than 56,000 individuals with type 2 diabetes covered by employer-sponsored health insurance showed that increased adherence to medications significantly reduced hospitalizations and emergency department visits. When adherence rates increased, the hospitalization rate fell 23%, and the rate of emergency department visits decreased 46%, resulting in significant cost savings for the health system.1
In response to this issue, many strategies have emerged. We now regularly get correspondence from insurance companies alerting us to nonadherence of individual patients. This information tends to be of little benefit, because the information is received long after the decision to take or not take the medication is made. Our response in the office to our patients is generally to remind them to take their medications, which is not much different from the discussion we have with them without that information.
Recently, a new set of apps for smartphones and tablets has emerged to help patients organize their approach to taking medications. Examples of some of these apps include Care4Today, Dosecast, Medisafe, MedSimple, MyMedREc, MyMeds, and OnTimeRx. Most of these apps allow a patient to put in their medication schedule and are organized to provide reminders when it is time to take medications.
The problem with reminders, of course, is that they don’t always happen at a time when it is convenient for a person to take their medications. For example, if your app reminds you to take your medicines at 9 p.m. each night, and you are at the movies on a Saturday night, you may extinguish the reminder and not remember to take the medications when you get home.
Many of the apps also track adherence rates so that patients can see how well they are doing in taking their medications. The results are often startling to patients, and it is hoped that such information would encourage more effort in taking medications.
One problem with many of the apps currently available is that they essentially function as sophisticated alarm clocks. They do not get at some of the fundamental reasons that people do not take their medications, which would require more behavioral input.
In fact, a recent article in the American Journal of Preventive Medicine looked at 166 medication adherence apps and concluded that current apps contained little in the way of evidence-based behavioral change techniques that have been shown to help change behavior. In fact, only about one-third of apps contained any feedback on behavior at all.2
While adherence apps still have a way to go, they can be helpful, and many contain interesting, novel features. Some allow the patient to input the name of a medication by scanning the name from the medication’s pill bottle. Some have the ability not only to remind a patient to take a medication, but also to text that patient’s caregiver (or parent, in the case of a teenager) if the medication is not taken.
While not perfect, these adherence apps are worth learning more about. They may be helpful additions to our efforts to achieve the best outcomes for our patients by helping them to actually take the medications that we so carefully prescribe.
References
1. Encinosa, W.E.; Bernard, D.; Dor, A. Does prescription drug adherence reduce hospitalizations and costs? The case of diabetes. Advances in Health Economics and Health Services Research 22, pp. 151-73, 2010 (AHRQ Publication No. 11-R008).
2. Am J Prev Med. 2015 Nov 17. pii: S0749-3797(15)00637-6. doi: 10.1016/j.amepre.2015.09.034.
Dr. Notte is a family physician and clinical informaticist for Abington (Pa.) Memorial Hospital. He is a partner in EHR Practice Consultants, a firm that aids physicians in adopting electronic health records. Dr. Skolnik is associate director of the family medicine residency program at Abington Memorial Hospital and professor of family and community medicine at Temple University in Philadelphia.
“Drugs don’t work in patients who don’t take them.”
–C. Everett Koop, M.D.
While it would be hard to imagine accountable care organizations being able to get the data they need to manage care without electronic health records, and EHRs are critical as payment has evolved to emphasize the outcomes of treatment, one area remains the holy grail of disease management: how to get patients to take the medications that are prescribed.
Poor adherence to medications is a critical issue in the management of chronic disease. The causes for suboptimal adherence are numerous, including the cost of medications, patient-physician communication, patient education, motivation, and simple forgetfulness.
Approximately 1.5 billion prescriptions, at a cost of more than $250 billion, are dispensed each year in the United States. A large body of evidence supports the use of these medications. For patients with diabetes, for instance, correct medication use can lower blood sugar, blood pressure, and cholesterol, and by so doing, decrease morbidity and mortality from both microvascular and macrovascular disease.
The act of taking medications is influenced by many factors, and all of these factors come together at a point in time when patients are not directly engaged with the health care system. It is at that moment that patients remember and decide whether to take their medications.
Numerous studies show that individuals often do not take their medicines as prescribed. Adherence rates for medications for chronic disease show that patients on average take only about 50% of prescribed doses. For patients with diabetes, the average adherence rate is about 70%, with rates ranging in different studies from 31% to 87%.
When patients do not take their medications correctly, there can be severe consequences. Poor medication adherence can lead to poorer clinical outcomes, including increased hospitalizations. One large dataset of more than 56,000 individuals with type 2 diabetes covered by employer-sponsored health insurance showed that increased adherence to medications significantly reduced hospitalizations and emergency department visits. When adherence rates increased, the hospitalization rate fell 23%, and the rate of emergency department visits decreased 46%, resulting in significant cost savings for the health system.1
In response to this issue, many strategies have emerged. We now regularly get correspondence from insurance companies alerting us to nonadherence of individual patients. This information tends to be of little benefit, because the information is received long after the decision to take or not take the medication is made. Our response in the office to our patients is generally to remind them to take their medications, which is not much different from the discussion we have with them without that information.
Recently, a new set of apps for smartphones and tablets has emerged to help patients organize their approach to taking medications. Examples of some of these apps include Care4Today, Dosecast, Medisafe, MedSimple, MyMedREc, MyMeds, and OnTimeRx. Most of these apps allow a patient to put in their medication schedule and are organized to provide reminders when it is time to take medications.
The problem with reminders, of course, is that they don’t always happen at a time when it is convenient for a person to take their medications. For example, if your app reminds you to take your medicines at 9 p.m. each night, and you are at the movies on a Saturday night, you may extinguish the reminder and not remember to take the medications when you get home.
Many of the apps also track adherence rates so that patients can see how well they are doing in taking their medications. The results are often startling to patients, and it is hoped that such information would encourage more effort in taking medications.
One problem with many of the apps currently available is that they essentially function as sophisticated alarm clocks. They do not get at some of the fundamental reasons that people do not take their medications, which would require more behavioral input.
In fact, a recent article in the American Journal of Preventive Medicine looked at 166 medication adherence apps and concluded that current apps contained little in the way of evidence-based behavioral change techniques that have been shown to help change behavior. In fact, only about one-third of apps contained any feedback on behavior at all.2
While adherence apps still have a way to go, they can be helpful, and many contain interesting, novel features. Some allow the patient to input the name of a medication by scanning the name from the medication’s pill bottle. Some have the ability not only to remind a patient to take a medication, but also to text that patient’s caregiver (or parent, in the case of a teenager) if the medication is not taken.
While not perfect, these adherence apps are worth learning more about. They may be helpful additions to our efforts to achieve the best outcomes for our patients by helping them to actually take the medications that we so carefully prescribe.
References
1. Encinosa, W.E.; Bernard, D.; Dor, A. Does prescription drug adherence reduce hospitalizations and costs? The case of diabetes. Advances in Health Economics and Health Services Research 22, pp. 151-73, 2010 (AHRQ Publication No. 11-R008).
2. Am J Prev Med. 2015 Nov 17. pii: S0749-3797(15)00637-6. doi: 10.1016/j.amepre.2015.09.034.
Dr. Notte is a family physician and clinical informaticist for Abington (Pa.) Memorial Hospital. He is a partner in EHR Practice Consultants, a firm that aids physicians in adopting electronic health records. Dr. Skolnik is associate director of the family medicine residency program at Abington Memorial Hospital and professor of family and community medicine at Temple University in Philadelphia.
Nevi, Melanoma, and the Ongoing Argument on Atypia
In a case study published online on March 2 in JAMA Dermatology, Geller et al examined the relationship between total nevi, atypical nevi, and melanoma thickness. The study included 566 patients with melanoma. They were administered written surveys and underwent skin examinations at academic centers in Michigan and California within 3 months of diagnosis, measuring current total nevus count and atypical nevus count in addition to cataloguing melanoma thickness, histologic subtype, patient age, sex, marital status, skin self-examination and physician skin examination tendency, other health care visits, and mode of melanoma discovery.
Many epidemiologic trends were noted, but in summary, most melanoma patients had 0 to 20 total nevi (66.4%) and no atypical nevi (73.3%), a trend most pronounced in older patients (≥60 years). In patients younger than 60 years, higher nevus count (>50) was associated with thinner melanomas (≤2.0 mm), and the presence of more than 5 atypical nevi was associated with thicker melanomas (>2.0 mm).
What’s the issue?Studies clarifying the overall clinical characteristics of patients with aggressive melanomas appear every month in reputable journals, touting that concurrent total nevus count is important; or nevus size is important; or atypia is important; or clinical stigmata, medical history, and family history are important. Who is correct? Is everyone correct? On the pathology arm of the argument, Rosendahl et al (J Am Acad Dermatol. 2015;73:507-512) highlighted the same dilemma in which clinicians do not agree on the histopathologic features of nevi that consistently put patients at risk for individual lesion or de novo melanoma.
For me, each clinic day involves performing many total-body skin examinations, and many of these patients have innumerable nevi and various scars from lesions removed over the years with “atypical mole,” “premelanoma,” “precancer,” and various other self-reported labels. Some lesions may have documented pathology reports, but many do not. Some reports refer to dysplasia as a gradient, some do not. Some reports include molecular testing or clinical markers to grade lesions, and each can vary between institutions and pathologists. On the macroscopic level, clinically atypical nevi do not have a widely agreed upon set of criteria or threshold for biopsy; some clinicians use dermoscopic markers, and others utilize some version of the ABCDE (a=asymmetry; b=border; c=color; d=diameter; e=evolving) features.
The Geller et al study supports that these melanoma patients did not necessarily have more total nevi, and younger patients with aggressive melanoma may have a tendency toward more clinically atypical nevi. Although the study establishes what those institutions and clinicians determined to be atypical, I’m not sure that this is something that most clinicians widely agree upon. Additionally, these features were not paired with histopathologic dysplasia because the lesions were not biopsied.
What I find in conversation with colleagues is that some agree with what Geller et al defined as atypical, but some clinicians do not even refer to nevi as clinically atypical in a medical record unless they have pathology evidence of atypia (or the term their pathologist may use), which may be to avoid controversy regarding legal implications of atypia or “open-note” misunderstanding that the patient may have about this term, likening it to Papanicolaou test premalignancy verbiage.
I am not aware of one dermatologist or dermatopathologist who does not find this quandary to be frustrating. How do any of us really know which patients to follow more often for melanoma surveillance? How does your practice or institution report atypia in the clinical and histopathologic setting, and what do you find are the most important markers for development of melanoma?

The Society of Hospital Medicine is partnering with 18 U.S. Hospitals to Improve Patient Outcomes through Medication Reconciliation
The Society of Hospital Medicine Center for Hospital Innovation is supporting the implementation of a second iteration of the Multi-Center Medication Reconciliation Quality Improvement Study, or MARQUIS2. This is a mentored implementation program developed to assist hospitals and hospital clinicians with developing better ways for medications to be prescribed, recorded and reconciled accurately and safely at times of care transitions, e.g., when patients enter and leave the hospital. The ultimate goal of the study is reduce medication errors, adverse drug events and patient harm during transitions of care. The program is funded through a grant provided by the Agency for Healthcare Research and Quality (AHRQ).
Unintentional medication discrepancies during transitions in care represent a major threat to patient safety. Medication reconciliation enables healthcare providers – and hospitalists in particular – to avoid medication errors such as omissions, duplications, dosing errors and adverse drug interactions and should be completed at every transition of care, including hospital admission and discharge. Beginning in April 2016, SHM will begin working with 18 selected hospital sites to identify, implement and sustain medication reconciliation interventions with guidance from expert physician mentors. Key examples of intervention components include educating providers on how to take a best possible medication history, improving access to preadmission medication sources, encouraging patient ownership of medication lists and identifying patients at higher risk for adverse drug events in need of more intensive efforts.
Intervening in the childhood obesity fight
A few weeks ago, a young man, a child psychiatrist, called saying that he had read the first Weighty Issues column and that he agreed that psychiatrists should be actively involved in the weight loss arena.
He shared that he had several children in his practice whose body-mass indices were over 40 and that he was frustrated that the pediatricians he had spoken with seemed to be only watching and waiting for the children to grow taller. I told him what he already knew: Pediatricians have in place a very specific protocol to follow regarding the treatment of overweight and obesity in children.
I had the impression from him that he was not exactly sure that the protocol was being followed and that he was absolutely sure that the pediatricians had no appreciation of the emotional aspects of these children’s weights. He said he was so fired up about this that he was going to pursue American Board of Obesity Medicine diplomate status himself. In addition to his background in child psychiatry, he also had studied public health, and his parents had worked in the area of disease prevention.
I was thrilled by his call because he got it! Overweight and obesity are a public health menace. Every day, psychiatrists see patients with these maladies, and we should be more knowledgeable about them or armed to get the treatment started ourselves. Although this child psychiatrist continues to intervene with his patients’ pediatricians and embarks on his own ABOM studies, he can, as he sees his patients and their families, write prescriptions for exercise and play time for the family, limited screen time (TV and computer) for the youngsters, no sweetened beverages, fewer simple carbohydrates, and more plain water. These interventions all are consistent with routine lifestyle recommendations for children (and adults), and they also can promote improved well-being for children and family members.
A recent report indicated that about a quarter of 2- to 5-year-olds and one-third of school-aged children (6-18 years) are overweight or obese in the United States (JAMA. 2014 Feb 26;311[8]:306-14). By convention, body-mass index, a measure of relative body fat, is used to indicate underweight, normal weight, overweight, and obesity. It is derived from a formula: weight in kilograms divided by height in meters squared. In adults, normal is 18.5-24.9, overweight is 25-29.9, and obese is greater than or equal to 30 (National Institutes of Health/World Health Organization guidelines for BMI). For children, one calculates the BMI and then plots this on a graph in comparison to other children of the same age and sex to derive a percentile scale number. Percentile scale numbers from 58-94 indicate overweight, and percentiles greater than or equal to 95 indicate obesity in children aged 2-18 years. For children aged 0-2, a weight for length above the 95th percentile indicates overweight.
Childhood obesity is a major risk factor for overweight and obesity in adulthood, and for depression and cardiovascular disease in childhood and adulthood. It also sets one up for potential trouble in the areas of self-esteem, body image, body protection, poor school performance, and relationship issues with peers. These are areas of importance for psychiatrists, child and adult, as we assess, plan for, and treat our patients day to day. Furthermore, childhood overweight puts children at risk for type 2 diabetes, metabolic syndrome, high cholesterol and high blood pressure, asthma, sleep disorders, early puberty or menstruation, Blount’s disease (progressive turning of the lower leg, resembling bowleg), and nonalcoholic fatty liver disease. Obesity in adulthood leads to high blood pressure, strokes, type 2 diabetes, dementia, osteoarthritis, sleep apnea, obesity hypoventilation syndrome, reproductive problems, gallstones, and some cancers (esophagus, pancreas, colon, rectum, breast-after menopause, endometrium, kidney, thyroid, and gallbladder).
The late Dr. Hilde Bruch, one of my mentors in the 1970s, was an early thought leader in childhood obesity. She did research in this area starting in 1937 while practicing pediatrics before she became a psychiatrist in 1943. She said that she was struck by the number of overweight and obese children she observed in the United States, compared with what she had observed in Germany and England. (She died in 1984 at the age of 80 and would be greatly saddened that childhood obesity is now a global issue.) In her 1973 book, “Eating Disorders: Obesity, Anorexia Nervosa, and the Person Within,” she grappled with the taking in of calories, and, speaking of hunger, said that “it is not innate, but something that contains important elements of learning.”
As an analyst, she thought of feeding learning as coming primarily from early mother-child interactions, but we now know that this learning can come through any repeated interaction and that genetic, social, cultural and environmental, and biological factors also apply.
The psychiatrist or anyone else working with children and families must endeavor to reduce self-blame, explore influences, and instill hope in the process toward normal weight and/or adequate management of weight. The psychiatrist and anyone else working with the child and family will appreciate that, if energy intake and physical activity output are manipulated consistently, the tendency for the child will be increasing height and decreasing BMI. The Prevention and Management of Obesity for Children and Adolescents Guideline is very clear about when to refer to a tertiary special weight management program for children. The guideline also speaks to use of weight-loss medication (orlistat for children 12 years and older, sibutramine for children 16 years and older). Bariatric surgery is recommended for children who have finished growing up (by growth plate evidence) and face imminent serious health issues if their weight cannot be brought under control. These children, after surgery, will need to radically restrain their eating, take supplements, and be followed for the rest of their lives to forestall complications and return to overweight and obesity. I believe that child and adult psychiatrists can be of tremendous use here in helping sort out both the physical and course-of-life issues that could threaten successful continued weight loss, whether the weight loss comes through lifestyle change, lifestyle change and medications, or bariatric surgery and subsequent lifestyle change.
I would like to thank that young child psychiatrist who called, because he spurred me to continue our “Weighty Issues” journey by looking at childhood and overweight and obesity and how it can affect our work as physicians and psychiatrists. Parental physical condition at conception and gestation, and genetics may set the stage, and then interaction with the family, the culture, the society, and the environment all interplay in the child’s development to produce an outcome of an overweight or obese child. We still are trying to discover why some but not all children in the same family, neighborhood, socioeconomic strata, culture, etc., are burdened by overweight. The reasons may be found through biological inquiry, but it may just as well in found in psychiatric/psychological inquiry.
Dr. Harris, a diplomate of the American Board of Obesity Medicine, is in private practice in adult and geriatric psychiatry in Hartford, Conn. She also works as a psychiatric consultant to continuing care retirement organizations and professional groups. Dr. Harris, a former president of the Black Psychiatrists of America, is a Distinguished Fellow of the American Psychiatric Association. Besides psychotherapy, her major clinical interests include geriatrics, and the interface between general medicine and psychiatry.
Cosmetic Corner: Dermatologists Weigh in on Scar Treatments
To improve patient care and outcomes, leading dermatologists offered their recommendations on scar treatments. Consideration must be given to:
- bioCorneum+
- Mederma Scar Cream Plus SPF 30
- Organic vitamin E oil
- ScarAway Silicone Scar Sheets
- Scar Recovery Gel with Centelline
Cutis invites readers to send us their recommendations. Body scrubs, OTC acne treatments, self-tanners, and cleansing devices will be featured in upcoming editions of Cosmetic Corner. Please e-mail your recommendation(s) to the Editorial Office.
Disclaimer: Opinions expressed herein do not necessarily reflect those of Cutis or Frontline Medical Communications Inc. and shall not be used for product endorsement purposes. Any reference made to a specific commercial product does not indicate or imply that Cutis or Frontline Medical Communications Inc. endorses, recommends, or favors the product mentioned. No guarantee is given to the effects of recommended products.

A Better Postexposure Anthrax Vaccine?
A phase 2 study findings suggest that AV7909, a new vaccine for postexposure prophylaxis of anthrax disease, may work faster and require fewer vaccinations with fewer antigens when compared with BioThrax. The authors also speculate that AV7909 might require shorter stints with antimicrobial drugs than the 60-day regimen currently recommended along with the 3-dose series of BioThrax vaccine, which could lead to increased patients adherence.
Related: Clinical Trials Begin for Another Anthrax Vaccine
The drug AV7909 combines BioThrax with CPG7909, a synthetic immunostimulatory oligonucleotide. Earlier trials identified a formulation that enhanced immune response without increasing adverse events (AEs). In a multicenter phase 2 trial that evaluated this formulation, researchers tested 3 vaccine schedules and 2 doses in 168 healthy volunteers. Serum samples were collected before the vaccination and on days 35, 42, 49, 63, and 84. Safety was assessed through Day 84.
Related: Better Anthrax Vaccine on the Horizon
The schedule of 2 full doses of AV7909, given 2 weeks apart, showed a comparable immune response to a 0/14/28-day BioThrax schedule but had a higher and earlier peak. The AV7909 vaccine was safe and well tolerated. Although the AV7909 group reported more AEs (79% for AV7909 vs 65% for BioThrax), no serious AEs were assessed as potentially vaccine related, and none were deemed of potential autoimmune etiology.
Source:Hopkin RJ, Kalsi G, Montalvo-Lugo VM, et al. Vaccine. 2016;34(18):2096-2105.doi: 10.1016/j.vaccine.2016.03.006.
Feds advance cancer moonshot with expert panel, outline of goals
Federal officials took the next step in their moonshot to end cancer by announcing on April 4 a blue ribbon panel to guide the effort.
A total of 28 leading researchers, clinicians, and patient advocates have been named to the panel charged with informing the scientific direction and goals of the National Cancer Moonshot Initiative, led by Vice President Joe Biden.

“This Blue Ribbon Panel will ensure that, as [the National Institutes of Health] allocates new resources through the Moonshot, decisions will be grounded in the best science,” Vice President Biden said in a statement. “I look forward to working with this panel and many others involved with the Moonshot to make unprecedented improvements in prevention, diagnosis, and treatment of cancer.”
The key goals of the initiative were set out simultaneously in a perspective from Dr. Francis S. Collins, NIH director, and Dr. Douglas R. Lowy, director of the National Cancer Institute. The editorial was published in the New England Journal of Medicine.
“Fueled by an additional $680 million in the proposed fiscal year 2017 budget for the NIH, plus additional resources for the Food and Drug Administration, the initiative will aim to accelerate progress toward the next generation of interventions that we hope will substantially reduce cancer incidence and dramatically improve patient outcomes,” Dr. Collins and Dr. Lowy wrote. “The NIH’s most compelling opportunities for progress will be set forth by late summer 2016 in a research plan informed by the deliberations of a blue-ribbon panel of experts, which will provide scientific input to the National Cancer Advisory Board. Some possible opportunities include vaccine development, early-detection technology, single-cell genomic analysis, immunotherapy, a focus on pediatric cancer, and enhanced data sharing.”
To read the full editorial, click here.
On Twitter @denisefulton
Federal officials took the next step in their moonshot to end cancer by announcing on April 4 a blue ribbon panel to guide the effort.
A total of 28 leading researchers, clinicians, and patient advocates have been named to the panel charged with informing the scientific direction and goals of the National Cancer Moonshot Initiative, led by Vice President Joe Biden.
“This Blue Ribbon Panel will ensure that, as [the National Institutes of Health] allocates new resources through the Moonshot, decisions will be grounded in the best science,” Vice President Biden said in a statement. “I look forward to working with this panel and many others involved with the Moonshot to make unprecedented improvements in prevention, diagnosis, and treatment of cancer.”
The key goals of the initiative were set out simultaneously in a perspective from Dr. Francis S. Collins, NIH director, and Dr. Douglas R. Lowy, director of the National Cancer Institute. The editorial was published in the New England Journal of Medicine.
“Fueled by an additional $680 million in the proposed fiscal year 2017 budget for the NIH, plus additional resources for the Food and Drug Administration, the initiative will aim to accelerate progress toward the next generation of interventions that we hope will substantially reduce cancer incidence and dramatically improve patient outcomes,” Dr. Collins and Dr. Lowy wrote. “The NIH’s most compelling opportunities for progress will be set forth by late summer 2016 in a research plan informed by the deliberations of a blue-ribbon panel of experts, which will provide scientific input to the National Cancer Advisory Board. Some possible opportunities include vaccine development, early-detection technology, single-cell genomic analysis, immunotherapy, a focus on pediatric cancer, and enhanced data sharing.”
To read the full editorial, click here.
On Twitter @denisefulton
FROM NEJM
