User login
Let’s talk about the evidence

One of my favorite professional activities is teaching an evidence-based continuing medical education course each year at state Academy of Family Physicians meetings. In 12 intensive hours, 4 evidence-based medicine (EBM) experts guide family physicians, nurse practitioners, and physician assistants through nearly 400 abstracts that summarize recent studies that impact primary care practice.
In some cases, the new studies support current practice and standards of care, but for many topics, the new evidence suggests we ought to change our practice, either by stopping something we are currently doing or by starting to do something new. Who would have thought, for instance, that we should abandon the routine bimanual pelvic exam because the potential for harm is greater than the potential for benefit?
Frequently, however, we conclude a talk by describing the uncertainty surrounding particular issues and the need for more high-quality research. For example, there is scant evidence that vitamin D supplementation in healthy Americans leads to any positive outcomes compared to a decent diet and 15 minutes in the sun each day. Luckily, there are several large randomized trials currently underway that will evaluate vitamin D supplementation.
The strength of the scientific evidence to support screening tests and treatments is important to consider. A study examining changes in 11 American College of Cardiology/American Heart Association guidelines found that, out of 619 recommendations, 90% were unchanged in the updated version if supported by multiple randomized trials, and 74% were unchanged if supported by expert opinion.1
In The Journal of Family Practice, we use the Strength of Recommendation Taxonomy (SORT) that was developed by family physician EBM experts2 because it is an approach to grading evidence that takes into account “patient-oriented evidence that matters.” An A-level recommendation is based on consistent and good-quality patient-oriented evidence; a B-level recommendation is based on inconsistent or limited-quality patient-oriented evidence; and a C-level recommendation is based on consensus, usual practice, opinion, disease-oriented evidence, or case series.
We ask our authors to carefully select the level of evidence supporting their clinical recommendations. But your input—and the lively discussion that can often follow—is important, too. Just last month, we published a letter from 2 readers who challenged the evidence-based answer to a Clinical Inquiries question on breastfeeding.
Such ongoing dialogue is useful and enlightening. And we encourage you to write us if you disagree with any of the SORT ratings published in the journal. Let’s keep talking about what the evidence says.
1. Neuman MD, Goldstein JN, Cirullo MA, et al. Durability of class I American College of Cardiology/American Heart Association clinical practice guideline recommendations. JAMA. 2014;311:2092-2100.
2. Ebell MH, Siwek J, Weiss BD, et al. Simplifying the language of evidence to improve patient care: Strength of recommendation taxonomy (SORT): a patient-centered approach to grading evidence in medical literature. J Fam Pract. 2004;53:111-120.
One of my favorite professional activities is teaching an evidence-based continuing medical education course each year at state Academy of Family Physicians meetings. In 12 intensive hours, 4 evidence-based medicine (EBM) experts guide family physicians, nurse practitioners, and physician assistants through nearly 400 abstracts that summarize recent studies that impact primary care practice.
In some cases, the new studies support current practice and standards of care, but for many topics, the new evidence suggests we ought to change our practice, either by stopping something we are currently doing or by starting to do something new. Who would have thought, for instance, that we should abandon the routine bimanual pelvic exam because the potential for harm is greater than the potential for benefit?
Frequently, however, we conclude a talk by describing the uncertainty surrounding particular issues and the need for more high-quality research. For example, there is scant evidence that vitamin D supplementation in healthy Americans leads to any positive outcomes compared to a decent diet and 15 minutes in the sun each day. Luckily, there are several large randomized trials currently underway that will evaluate vitamin D supplementation.
The strength of the scientific evidence to support screening tests and treatments is important to consider. A study examining changes in 11 American College of Cardiology/American Heart Association guidelines found that, out of 619 recommendations, 90% were unchanged in the updated version if supported by multiple randomized trials, and 74% were unchanged if supported by expert opinion.1
In The Journal of Family Practice, we use the Strength of Recommendation Taxonomy (SORT) that was developed by family physician EBM experts2 because it is an approach to grading evidence that takes into account “patient-oriented evidence that matters.” An A-level recommendation is based on consistent and good-quality patient-oriented evidence; a B-level recommendation is based on inconsistent or limited-quality patient-oriented evidence; and a C-level recommendation is based on consensus, usual practice, opinion, disease-oriented evidence, or case series.
We ask our authors to carefully select the level of evidence supporting their clinical recommendations. But your input—and the lively discussion that can often follow—is important, too. Just last month, we published a letter from 2 readers who challenged the evidence-based answer to a Clinical Inquiries question on breastfeeding.
Such ongoing dialogue is useful and enlightening. And we encourage you to write us if you disagree with any of the SORT ratings published in the journal. Let’s keep talking about what the evidence says.
1. Neuman MD, Goldstein JN, Cirullo MA, et al. Durability of class I American College of Cardiology/American Heart Association clinical practice guideline recommendations. JAMA. 2014;311:2092-2100.
2. Ebell MH, Siwek J, Weiss BD, et al. Simplifying the language of evidence to improve patient care: Strength of recommendation taxonomy (SORT): a patient-centered approach to grading evidence in medical literature. J Fam Pract. 2004;53:111-120.
Burning pain from chest to back • allodynia and hyperesthesia • extreme sensitivity at the left T5 dermatome • Dx?
THE CASE
A 27-year-old woman in the 21st week of her first pregnancy came to our clinic complaining of a constant burning pain that spread around her left chest wall to her back. She graded the pain as a 10 on a 0 to 10 visual analog scale. The pain, which began 3 months earlier, became worse when she took a deep breath, ate, or walked, but was alleviated by applying warm compresses. Our patient hadn’t slept well since the pain began. Her medical history was noteworthy for chickenpox at age 5.
During the physical examination, palpating her left upper abdominal quadrant and left lower chest wall elicited tenderness. We noted allodynia and hyperesthesia in these regions, and the left T5 dermatome revealed extreme sensitivity.
THE DIAGNOSIS
We decided to test for antibodies to the varicella-zoster virus (VZV) based on the location of the pain along a dermatome. A serum anti-VZV immunoglobulin G (IgG) level was high at 1.9. Since our patient hadn’t been vaccinated against VZV, her high IgG level may have been the result of reactivation of the virus. Based on this test result and our patient’s history and physical exam findings (ie, neuropathic pain along a dermatome without a typical herpes zoster rash), we diagnosed zoster sine herpete (ZSH).
DISCUSSION
One million new cases of herpes zoster (shingles) are diagnosed in the United States each year, with a rate of 3 to 4 cases per 1000 people.1 One in 3 patients develops postherpetic neuralgia, depending on age and immunocompetence.1
In ZSH, the neuropathic pain of herpes zoster occurs without the typical zoster rash.2 Since the rash is absent, the diagnosis is often missed. The incidence of ZSH is unknown.
Although many pregnant women suffer from thoracic and/or abdominal neuropathic pain, there are no reports in the literature that describe ZSH in pregnant women.3
The appropriate diagnostic tests for ZSH are polymerase chain reaction for VZV DNA and anti-VZV IgG.2,4-7 A definitive diagnosis can be reached by identifying herpes zoster DNA in cerebrospinal fluid (CSF) and organism-specific immunoglobulins. However, a high titer of serum IgG antibodies or a positive IgM antibodies test typically provides a high degree of certainty for the diagnosis.8 For our patient, we decided not to test her CSF because we felt that her clinical course and positive IgG test were sufficient to establish the diagnosis.
The differential diagnosis of radicular pain during pregnancy includes cutaneous nerve entrapment. The expanding uterus could increase pressure on cutaneous nerves in the abdominal wall and cause pain. Although nerve entrapment would be expected to cause impingement and sometimes hypoesthesia, ZSH usually causes allodynia and hyperesthesia, as was the case in our patient.3
Pregnancy affects choice of treatment
Treatments for ZSH include acyclovir and local anesthesia.8 A single injection of lidocaine (8 cc) may completely eliminate the ZSH pain by affecting the nerve action potential.9 Corticosteroids are used to suppress inflammation and decrease erythema, swelling, warmth at the site, and local tenderness.
Our patient. We decided to treat our patient with only a nerve block because the potential adverse effects of acyclovir in the second trimester of pregnancy are unclear.10 She received 1 cc of betamethasone acetate (3 mg) and betamethasone sodium phosphate (3 mg) and 8 cc of 2% lidocaine. The patient reported immediate pain relief, which lasted until delivery.
THE TAKEAWAY
ZSH is characterized by neuropathic pain along a dermatome that’s associated with herpes zoster and is not accompanied by the characteristic rash. Many pregnant women suffer from thoracic and abdominal wall neuropathic pain. Neuropathic radicular pain in the absence of a rash should raise suspicion of ZSH. Considering this syndrome at an early stage can avert unnecessary testing and reduce the patient’s pain.
1. Cohen JI. Clinical practice: Herpes zoster. N Engl J Med. 2013;369:255-263.
2. Nagel MA, Gilden DH. The protean neurologic manifestations of varicella-zoster virus infection. Cleve Clin J Med. 2007;74:489-504.
3. Peleg R, Gohar J, Koretz M, et al. Abdominal wall pain in pregnant women caused by thoracic lateral cutaneous nerve entrapment. Eur J Obstet Gynecol Reprod Biol. 1997;74:169-171.
4. Gilden DH, Wright RR, Schneck SA, et al. Zoster sine herpete, a clinical variant. Ann Neurol. 1994;35:530-533.
5. Amlie-Lefond C, Mackin GA, Ferguson M, et al. Another case of virologically confirmed zoster sine herpete, with electrophysiologic correlation. J Neurovirol. 1996;2:136-138.
6. Blumenthal DT, Shacham-Shmueli E, Bokstein F, et al. Zoster sine herpete: virologic verification by detection of anti-VZV IgG antibody in CSF. Neurology. 2011;76:484-485.
7. Lewis GW. Zoster sine herpete. Br Med J. 1958;2:418-421.
8. Kennedy PG. Zoster sine herpete: it would be rash to ignore it. Neurology. 2011;76:416-417.
9. Baranowski AP, De Courcey J, Bonello E. A trial of intravenous lidocaine on the pain and allodynia of postherpetic neuralgia. J Pain Symptom Manage. 1999;17:429-433.
10. Stone KM, Reiff-Eldridge R, White AD, et al. Pregnancy outcomes following systemic prenatal acyclovir exposure: Conclusions from the international acyclovir pregnancy registry, 1984-1999. Birth Defects Res A Clin Mol Teratol. 2004;70:201-207.
THE CASE
A 27-year-old woman in the 21st week of her first pregnancy came to our clinic complaining of a constant burning pain that spread around her left chest wall to her back. She graded the pain as a 10 on a 0 to 10 visual analog scale. The pain, which began 3 months earlier, became worse when she took a deep breath, ate, or walked, but was alleviated by applying warm compresses. Our patient hadn’t slept well since the pain began. Her medical history was noteworthy for chickenpox at age 5.
During the physical examination, palpating her left upper abdominal quadrant and left lower chest wall elicited tenderness. We noted allodynia and hyperesthesia in these regions, and the left T5 dermatome revealed extreme sensitivity.
THE DIAGNOSIS
We decided to test for antibodies to the varicella-zoster virus (VZV) based on the location of the pain along a dermatome. A serum anti-VZV immunoglobulin G (IgG) level was high at 1.9. Since our patient hadn’t been vaccinated against VZV, her high IgG level may have been the result of reactivation of the virus. Based on this test result and our patient’s history and physical exam findings (ie, neuropathic pain along a dermatome without a typical herpes zoster rash), we diagnosed zoster sine herpete (ZSH).
DISCUSSION
One million new cases of herpes zoster (shingles) are diagnosed in the United States each year, with a rate of 3 to 4 cases per 1000 people.1 One in 3 patients develops postherpetic neuralgia, depending on age and immunocompetence.1
In ZSH, the neuropathic pain of herpes zoster occurs without the typical zoster rash.2 Since the rash is absent, the diagnosis is often missed. The incidence of ZSH is unknown.
Although many pregnant women suffer from thoracic and/or abdominal neuropathic pain, there are no reports in the literature that describe ZSH in pregnant women.3
The appropriate diagnostic tests for ZSH are polymerase chain reaction for VZV DNA and anti-VZV IgG.2,4-7 A definitive diagnosis can be reached by identifying herpes zoster DNA in cerebrospinal fluid (CSF) and organism-specific immunoglobulins. However, a high titer of serum IgG antibodies or a positive IgM antibodies test typically provides a high degree of certainty for the diagnosis.8 For our patient, we decided not to test her CSF because we felt that her clinical course and positive IgG test were sufficient to establish the diagnosis.
The differential diagnosis of radicular pain during pregnancy includes cutaneous nerve entrapment. The expanding uterus could increase pressure on cutaneous nerves in the abdominal wall and cause pain. Although nerve entrapment would be expected to cause impingement and sometimes hypoesthesia, ZSH usually causes allodynia and hyperesthesia, as was the case in our patient.3
Pregnancy affects choice of treatment
Treatments for ZSH include acyclovir and local anesthesia.8 A single injection of lidocaine (8 cc) may completely eliminate the ZSH pain by affecting the nerve action potential.9 Corticosteroids are used to suppress inflammation and decrease erythema, swelling, warmth at the site, and local tenderness.
Our patient. We decided to treat our patient with only a nerve block because the potential adverse effects of acyclovir in the second trimester of pregnancy are unclear.10 She received 1 cc of betamethasone acetate (3 mg) and betamethasone sodium phosphate (3 mg) and 8 cc of 2% lidocaine. The patient reported immediate pain relief, which lasted until delivery.
THE TAKEAWAY
ZSH is characterized by neuropathic pain along a dermatome that’s associated with herpes zoster and is not accompanied by the characteristic rash. Many pregnant women suffer from thoracic and abdominal wall neuropathic pain. Neuropathic radicular pain in the absence of a rash should raise suspicion of ZSH. Considering this syndrome at an early stage can avert unnecessary testing and reduce the patient’s pain.
1. Cohen JI. Clinical practice: Herpes zoster. N Engl J Med. 2013;369:255-263.
2. Nagel MA, Gilden DH. The protean neurologic manifestations of varicella-zoster virus infection. Cleve Clin J Med. 2007;74:489-504.
3. Peleg R, Gohar J, Koretz M, et al. Abdominal wall pain in pregnant women caused by thoracic lateral cutaneous nerve entrapment. Eur J Obstet Gynecol Reprod Biol. 1997;74:169-171.
4. Gilden DH, Wright RR, Schneck SA, et al. Zoster sine herpete, a clinical variant. Ann Neurol. 1994;35:530-533.
5. Amlie-Lefond C, Mackin GA, Ferguson M, et al. Another case of virologically confirmed zoster sine herpete, with electrophysiologic correlation. J Neurovirol. 1996;2:136-138.
6. Blumenthal DT, Shacham-Shmueli E, Bokstein F, et al. Zoster sine herpete: virologic verification by detection of anti-VZV IgG antibody in CSF. Neurology. 2011;76:484-485.
7. Lewis GW. Zoster sine herpete. Br Med J. 1958;2:418-421.
8. Kennedy PG. Zoster sine herpete: it would be rash to ignore it. Neurology. 2011;76:416-417.
9. Baranowski AP, De Courcey J, Bonello E. A trial of intravenous lidocaine on the pain and allodynia of postherpetic neuralgia. J Pain Symptom Manage. 1999;17:429-433.
10. Stone KM, Reiff-Eldridge R, White AD, et al. Pregnancy outcomes following systemic prenatal acyclovir exposure: Conclusions from the international acyclovir pregnancy registry, 1984-1999. Birth Defects Res A Clin Mol Teratol. 2004;70:201-207.
Bifrontal headache • blurred vision • vomiting • Dx?
THE CASE
A 55-year-old woman presented to the emergency department (ED) with a bifrontal headache that she’d had for one day. She also had blurred vision and was vomiting shortly before coming to the hospital. The patient had no history of hypertension, migraine headaches, seizure disorder, autoimmune disorders, or cerebrovascular disease.
Her vital signs, including a blood pressure of 114/63 mm Hg, were normal, but a physical examination revealed subjective vision loss. She was only able to see objects moving on a horizontal plane. Her finger-to-nose exam, pupillary reflexes, and extra-ocular movements were normal, but peripheral vision was limited on her left side. No other neurologic deficits were noted.
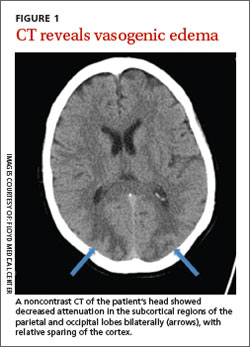
The patient was admitted to the hospital and most of her laboratory work-up was normal, including a basic metabolic panel, complete blood count, coagulation studies, brain natriuretic peptide test, and cardiac enzymes. Her white blood cell count was 19,700/mcL, but no source of infection was found. A computed tomography (CT) scan of her head without contrast showed low-density, patchy areas in the subcortical regions of the parietal and occipital lobes bilaterally (FIGURE 1, arrows), with relative sparing of the cortex.
THE DIAGNOSIS
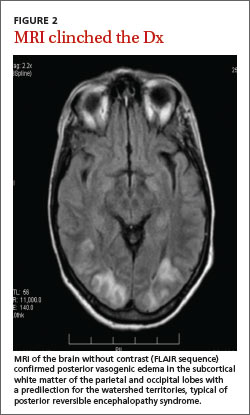
Based on our patient’s presentation and radiologic findings, we made a diagnosis of posterior reversible encephalopathy syndrome (PRES). However, because we could not rule out an ischemic cerebrovascular event at the time of presentation, we started the patient on aspirin and clopidogrel 75 mg to prevent possible future ischemic events. The next day, we ordered magnetic resonance imaging (MRI) of the head and neck, which documented the edema and confirmed the diagnosis of PRES (FIGURE 2).
DISCUSSION
PRES is a neurotoxic state associated with a unique pattern of brain vasogenic edema seen on CT or MRI. The edema is often widespread but is predominantly found in the parietal and occipital regions.1 PRES is seen in patients with a variety of conditions, including hypertension and bone marrow or organ transplantation, as well as in those receiving immunosuppressive or cytotoxic medications.1 Patients with PRES typically present with headaches and seizures.2 Visual abnormalities (most commonly cortical blindness), occur in 15% to 20% of patients with PRES.2-4
Hinchey et al3 first described reversible posterior leukoencephalopathy syndrome (which later became known as PRES) in 1996. Most of the 15 patients included in this original report had a history of hypertension or immunosuppression. These cases were associated with cerebral edema in portions of the posterior cerebral white matter. It is thought that hypertension alters the blood-brain barrier and causes the acute changes that occur in PRES.3
Besides hypertension and immunosuppression, the risk factors most commonly associated with PRES include preeclampsia/eclampsia; sepsis, particularly due to grampositive organisms; Wegener’s granulomatosis, scleroderma, and polyarteritis nodosa; cancer chemotherapy; bone marrow or stem cell transplantation; and renal disease.1,4-6
Although a clear cause of PRES has not yet been established, researchers have proposed 2 theories. The first postulates that a sudden increase in systemic blood pressure causes vasoconstriction, which leads to ischemia and edema.1-4,7,8 However, several studies have also described cases of PRES in patients with mild elevations in blood pressure,1,5-7 and mild edema has been observed even in normotensive patients1,5 (as was the case with our patient).
The second theory links PRES to the loss of brain autoregulation, a function that maintains steady blood flow when blood pressure fluctuates.6 A loss of this regulatory mechanism causes endothelial dysfunction, capillary leakage, and disruption in the blood-brain barrier.1,2,4,6-8 These changes then lead to cerebral vasodilatation and edema.2 Immunotherapy has also been associated with increased endothelial dysfunction.2
The evidence on the link between the severity of PRES and clinical outcomes is conflicting.
One study that followed 113 PRES patients over 6 years did not find an association between the severity of clinical presentation and the extent of vasogenic edema found on imaging studies.5 Of these 113 patients, 69 had PRES primarily due to hypertension, and 21 were receiving cytotoxic medications.5 In contrast, a larger retrospective study that followed patients with PRES for 12 years found that severe cases, which included patients with severe cerebral edema and altered mental status, had poor outcomes.4 Small studies have reported that 14% of patients with PRES develop cerebral hemorrhage.8
When to suspect this condition. PRES should be part of the differential diagnosis for any patient who presents with headache and vision loss. It is important to distinguish PRES from an acute cerebrovascular accident (CVA) because the 2 conditions are managed differently.2 In addition, PRES lesions can be misdiagnosed as tumors, especially in a patient with a history of malignant disease in whom the condition appears after chemotherapy.9
Treatment targets the underlying causes
Treatment options for PRES are limited. Hypertension in a patient with PRES requires prompt intervention to avoid progression of the disease.2 The use of intravenous (IV) calcium-channel blockers or IV beta-blockers for these patients is common.2,8
Patients with seizures should be treated with anticonvulsant medication, but longterm antiepileptic treatment usually is not required.2 Patients who take immunosuppressant or cytotoxic drugs should stop them indefinitely upon presenting with PRES.2
For a pregnant woman with preeclampsia/eclampsia, delivery of the placenta, which is considered to be the cause of PRES in these cases, is curative.1 However, women can develop PRES several weeks after delivery.1
In most cases, the symptoms associated with PRES will resolve once treatment is initiated, and neurologic recovery can be expected within 2 weeks.2
Our patient regained her sight the following morning and was discharged home 2 days after admission. Her blood pressure remained normal. She returned to the hospital unresponsive the day after she had been discharged. Family members stated that she had taken 15 packets of an aspirin/caffeine combination to control a new headache.
Her blood pressure was elevated at 159/79 mm Hg. A CT of the brain showed a hemorrhagic stroke within the left occipital lobe and posterior parietal lobe with a midline shift of 8 mm. We don’t know if the aspirin use contributed to the hemorrhagic event or if it was a sequela of PRES.
The patient died 4 days later.
THE TAKEAWAY
PRES is a neurotoxic condition that causes headache, seizures, and vision loss. Most patients will present with elevated blood pressure and imaging studies will reveal a specific pattern of vasogenic edema that is predominately found in the parietal and occipital regions.
Treating the hypertension may result in a more favorable recovery. Normotensive patients are harder to treat because there is no specific therapy for PRES. Follow-up imaging may help to assess the resolution of the syndrome.
1. Bartynski WS. Posterior reversible encephalopathy syndrome, part 1: fundamental imaging and clinical features. AJNR Am J Neuroradiol. 2008;29:1036-1042.
2. Stott VL, Hurrell MA, Anderson TJ. Reversible posterior leukoencephalopathy syndrome: a misnomer reviewed. Intern Med J. 2005;35:83-90.
3. Hinchey J, Chaves C, Appignani B, et al. A reversible posterior leukoencephalopathy syndrome. N Engl J Med. 1996;334:494-500.
4. Liman TG, Bohner G, Endres M, et al. Discharge status and in-hospital mortality in posterior reversible encephalopathy syndrome. Acta Neurol Scand. 2014;130:34-39.
5. Fugate JE, Claassen DO, Cloft HJ, et al. Posterior reversible encephalopathy syndrome: associated clinical and radiologic findings. Mayo Clin Proc. 2010;85:427-432.
6. Bartynski WS. Posterior reversible encephalopathy syndrome, part 2: controversies surrounding pathophysiology of vasogenic edema. AJNR Am J Neuroradiol. 2008;29:1043-1049.
7. Ay H, Buonanno FS, Schaefer PW, et al. Posterior leukoencephalopathy without severe hypertension: utility of diffusion-weighted MRI. Neurology. 1998;51:1369-1376.
8. Legriel S, Schraub O, Azoulay E, et al; Critically III Posterior Reversible Encephalopathy Syndrome Study Group (CYPRESS). Determinants of recovery from severe posterior reversible encephalopathy syndrome. PLoS ONE. 2012;7:e44534.
9. Morina D, Ntoulias G, Maslehaty H, et al. Posterior reversible encephalopathy syndrome mimicking cerebral metastasis: contraindication for biopsy. Clin Pract. 2014;4:632.
THE CASE
A 55-year-old woman presented to the emergency department (ED) with a bifrontal headache that she’d had for one day. She also had blurred vision and was vomiting shortly before coming to the hospital. The patient had no history of hypertension, migraine headaches, seizure disorder, autoimmune disorders, or cerebrovascular disease.
Her vital signs, including a blood pressure of 114/63 mm Hg, were normal, but a physical examination revealed subjective vision loss. She was only able to see objects moving on a horizontal plane. Her finger-to-nose exam, pupillary reflexes, and extra-ocular movements were normal, but peripheral vision was limited on her left side. No other neurologic deficits were noted.
The patient was admitted to the hospital and most of her laboratory work-up was normal, including a basic metabolic panel, complete blood count, coagulation studies, brain natriuretic peptide test, and cardiac enzymes. Her white blood cell count was 19,700/mcL, but no source of infection was found. A computed tomography (CT) scan of her head without contrast showed low-density, patchy areas in the subcortical regions of the parietal and occipital lobes bilaterally (FIGURE 1, arrows), with relative sparing of the cortex.
THE DIAGNOSIS
Based on our patient’s presentation and radiologic findings, we made a diagnosis of posterior reversible encephalopathy syndrome (PRES). However, because we could not rule out an ischemic cerebrovascular event at the time of presentation, we started the patient on aspirin and clopidogrel 75 mg to prevent possible future ischemic events. The next day, we ordered magnetic resonance imaging (MRI) of the head and neck, which documented the edema and confirmed the diagnosis of PRES (FIGURE 2).
DISCUSSION
PRES is a neurotoxic state associated with a unique pattern of brain vasogenic edema seen on CT or MRI. The edema is often widespread but is predominantly found in the parietal and occipital regions.1 PRES is seen in patients with a variety of conditions, including hypertension and bone marrow or organ transplantation, as well as in those receiving immunosuppressive or cytotoxic medications.1 Patients with PRES typically present with headaches and seizures.2 Visual abnormalities (most commonly cortical blindness), occur in 15% to 20% of patients with PRES.2-4
Hinchey et al3 first described reversible posterior leukoencephalopathy syndrome (which later became known as PRES) in 1996. Most of the 15 patients included in this original report had a history of hypertension or immunosuppression. These cases were associated with cerebral edema in portions of the posterior cerebral white matter. It is thought that hypertension alters the blood-brain barrier and causes the acute changes that occur in PRES.3
Besides hypertension and immunosuppression, the risk factors most commonly associated with PRES include preeclampsia/eclampsia; sepsis, particularly due to grampositive organisms; Wegener’s granulomatosis, scleroderma, and polyarteritis nodosa; cancer chemotherapy; bone marrow or stem cell transplantation; and renal disease.1,4-6
Although a clear cause of PRES has not yet been established, researchers have proposed 2 theories. The first postulates that a sudden increase in systemic blood pressure causes vasoconstriction, which leads to ischemia and edema.1-4,7,8 However, several studies have also described cases of PRES in patients with mild elevations in blood pressure,1,5-7 and mild edema has been observed even in normotensive patients1,5 (as was the case with our patient).
The second theory links PRES to the loss of brain autoregulation, a function that maintains steady blood flow when blood pressure fluctuates.6 A loss of this regulatory mechanism causes endothelial dysfunction, capillary leakage, and disruption in the blood-brain barrier.1,2,4,6-8 These changes then lead to cerebral vasodilatation and edema.2 Immunotherapy has also been associated with increased endothelial dysfunction.2
The evidence on the link between the severity of PRES and clinical outcomes is conflicting.
One study that followed 113 PRES patients over 6 years did not find an association between the severity of clinical presentation and the extent of vasogenic edema found on imaging studies.5 Of these 113 patients, 69 had PRES primarily due to hypertension, and 21 were receiving cytotoxic medications.5 In contrast, a larger retrospective study that followed patients with PRES for 12 years found that severe cases, which included patients with severe cerebral edema and altered mental status, had poor outcomes.4 Small studies have reported that 14% of patients with PRES develop cerebral hemorrhage.8
When to suspect this condition. PRES should be part of the differential diagnosis for any patient who presents with headache and vision loss. It is important to distinguish PRES from an acute cerebrovascular accident (CVA) because the 2 conditions are managed differently.2 In addition, PRES lesions can be misdiagnosed as tumors, especially in a patient with a history of malignant disease in whom the condition appears after chemotherapy.9
Treatment targets the underlying causes
Treatment options for PRES are limited. Hypertension in a patient with PRES requires prompt intervention to avoid progression of the disease.2 The use of intravenous (IV) calcium-channel blockers or IV beta-blockers for these patients is common.2,8
Patients with seizures should be treated with anticonvulsant medication, but longterm antiepileptic treatment usually is not required.2 Patients who take immunosuppressant or cytotoxic drugs should stop them indefinitely upon presenting with PRES.2
For a pregnant woman with preeclampsia/eclampsia, delivery of the placenta, which is considered to be the cause of PRES in these cases, is curative.1 However, women can develop PRES several weeks after delivery.1
In most cases, the symptoms associated with PRES will resolve once treatment is initiated, and neurologic recovery can be expected within 2 weeks.2
Our patient regained her sight the following morning and was discharged home 2 days after admission. Her blood pressure remained normal. She returned to the hospital unresponsive the day after she had been discharged. Family members stated that she had taken 15 packets of an aspirin/caffeine combination to control a new headache.
Her blood pressure was elevated at 159/79 mm Hg. A CT of the brain showed a hemorrhagic stroke within the left occipital lobe and posterior parietal lobe with a midline shift of 8 mm. We don’t know if the aspirin use contributed to the hemorrhagic event or if it was a sequela of PRES.
The patient died 4 days later.
THE TAKEAWAY
PRES is a neurotoxic condition that causes headache, seizures, and vision loss. Most patients will present with elevated blood pressure and imaging studies will reveal a specific pattern of vasogenic edema that is predominately found in the parietal and occipital regions.
Treating the hypertension may result in a more favorable recovery. Normotensive patients are harder to treat because there is no specific therapy for PRES. Follow-up imaging may help to assess the resolution of the syndrome.
1. Bartynski WS. Posterior reversible encephalopathy syndrome, part 1: fundamental imaging and clinical features. AJNR Am J Neuroradiol. 2008;29:1036-1042.
2. Stott VL, Hurrell MA, Anderson TJ. Reversible posterior leukoencephalopathy syndrome: a misnomer reviewed. Intern Med J. 2005;35:83-90.
3. Hinchey J, Chaves C, Appignani B, et al. A reversible posterior leukoencephalopathy syndrome. N Engl J Med. 1996;334:494-500.
4. Liman TG, Bohner G, Endres M, et al. Discharge status and in-hospital mortality in posterior reversible encephalopathy syndrome. Acta Neurol Scand. 2014;130:34-39.
5. Fugate JE, Claassen DO, Cloft HJ, et al. Posterior reversible encephalopathy syndrome: associated clinical and radiologic findings. Mayo Clin Proc. 2010;85:427-432.
6. Bartynski WS. Posterior reversible encephalopathy syndrome, part 2: controversies surrounding pathophysiology of vasogenic edema. AJNR Am J Neuroradiol. 2008;29:1043-1049.
7. Ay H, Buonanno FS, Schaefer PW, et al. Posterior leukoencephalopathy without severe hypertension: utility of diffusion-weighted MRI. Neurology. 1998;51:1369-1376.
8. Legriel S, Schraub O, Azoulay E, et al; Critically III Posterior Reversible Encephalopathy Syndrome Study Group (CYPRESS). Determinants of recovery from severe posterior reversible encephalopathy syndrome. PLoS ONE. 2012;7:e44534.
9. Morina D, Ntoulias G, Maslehaty H, et al. Posterior reversible encephalopathy syndrome mimicking cerebral metastasis: contraindication for biopsy. Clin Pract. 2014;4:632.

Oral device reduced obstructive sleep apnea, not sleepiness
An oral appliance that advances a patient’s lower jaw reduced episodes of obstructive sleep apnea, snoring, and restless legs symptoms, according to a report published online June 1 in JAMA Internal Medicine.
The device, however, failed to improve daytime sleepiness or quality of life in a Swedish study of adults who had daytime sleepiness and either snoring or mild to moderate sleep apnea, said Marie Marklund, Ph.D., D.D.S., of the department of odontology at Umeå (Sweden) University and her associates (JAMA Intern. Med. 2015 June 1 [doi:10.1001/jamainternmed.2015.2051]).
Previous studies of oral appliances have focused on patients with more severe sleep apnea and have yielded conflicting results, particularly regarding daytime sleepiness.
A total of 91 patients who were randomly assigned to receive either a placebo device (46 patients) or an oral appliance individually made by a dental technician using separate plaster casts of the upper and lower teeth (45 participants) completed the study. The device’s elastomer pieces fitted over the teeth and were connected with a screw that allowed continuous gradual advancement of the lower jaw by 6-7 mm. Holding the lower mandible forward improves breathing during sleep.
After 4 months of follow-up, at-home overnight polysomnography showed “a clear, significant treatment effect”: the mean apnea-hypopnea index (AHI) was 6.7 in the active-treatment group, compared with 16.7 in the placebo group. A total of 49% of the patients receiving active treatment had an AHI lower than 5, compared with only 11% of those using the placebo device, for an odds ratio of 7.8 and a number needed to treat of 3.
Snoring and symptoms of restless legs also were significantly less frequent with the active treatment, Dr. Marklund and her associates said.
In addition, 73% of patients who used oral appliances said that their expectations of treatment were either “totally” or “sufficiently” fulfilled, compared with only 11% of those who used placebo devices. And 89% of patients who used oral appliances said they would continue the treatment after completing the study, compared with only 52% of those who used the sham device.
However, daytime sleepiness, measured subjectively using the Epworth Sleepiness Scale and the Karolinska Sleepiness Scale and measured objectively using the Oxford Sleep Resistance test, did not differ significantly between the two study groups. The number of days with headaches, the intensity of headaches, the presence of nasal congestion, difficulty falling asleep, nighttime awakenings, nightmares, and reaction times also were not significantly different, nor were scores on a quality of life measure.
The study was supported by grants from the Swedish Research Council, the Swedish Heart and Lung Foundation, and the County Council of Vasterbotten. Dr. Marklund and her associates reported no conflicts of interest.
It appears that patients generally prefer these devices to continuous positive airway pressure (CPAP) therapy. Better adherence to an oral appliance may outweigh the fact that it is not as effective as CPAP. Long-term studies comparing the two approaches are warranted.
The benefits of the mandibular advancement devices used in this study cannot be translated automatically to other devices, because there is a huge variety of these appliances on the market.
The extent of the protrusion of the lower jaw, the stability of the material, and the structural design of the devices vary widely. Several experts currently recommend avoiding the less sophisticated appliances that are not tailored to the individual’s jaw and oral cavity and instead using only customized adjustable appliances made by a trained specialist.
Dr. Winfried J. Randerath is with the pneumonology clinic and the Allergology Center for Sleep Medicine and Respiratory Care at Bethanien Hospital in Solingen, Germany. He reported having no relevant financial disclosures. He has, however, received speaking fees and research funds from companies that produce positive airway pressure devices: Heinen und Lowenstein, Resmed, Respironics, and Weinmann. Dr. Randerath made these remarks in an invited commentary (JAMA Intern. Med. 2015 June 1 [doi:10.1001/jamainternmed.2015.2059]).
An oral appliance that advances a patient’s lower jaw reduced episodes of obstructive sleep apnea, snoring, and restless legs symptoms, according to a report published online June 1 in JAMA Internal Medicine.
The device, however, failed to improve daytime sleepiness or quality of life in a Swedish study of adults who had daytime sleepiness and either snoring or mild to moderate sleep apnea, said Marie Marklund, Ph.D., D.D.S., of the department of odontology at Umeå (Sweden) University and her associates (JAMA Intern. Med. 2015 June 1 [doi:10.1001/jamainternmed.2015.2051]).
Previous studies of oral appliances have focused on patients with more severe sleep apnea and have yielded conflicting results, particularly regarding daytime sleepiness.
A total of 91 patients who were randomly assigned to receive either a placebo device (46 patients) or an oral appliance individually made by a dental technician using separate plaster casts of the upper and lower teeth (45 participants) completed the study. The device’s elastomer pieces fitted over the teeth and were connected with a screw that allowed continuous gradual advancement of the lower jaw by 6-7 mm. Holding the lower mandible forward improves breathing during sleep.
After 4 months of follow-up, at-home overnight polysomnography showed “a clear, significant treatment effect”: the mean apnea-hypopnea index (AHI) was 6.7 in the active-treatment group, compared with 16.7 in the placebo group. A total of 49% of the patients receiving active treatment had an AHI lower than 5, compared with only 11% of those using the placebo device, for an odds ratio of 7.8 and a number needed to treat of 3.
Snoring and symptoms of restless legs also were significantly less frequent with the active treatment, Dr. Marklund and her associates said.
In addition, 73% of patients who used oral appliances said that their expectations of treatment were either “totally” or “sufficiently” fulfilled, compared with only 11% of those who used placebo devices. And 89% of patients who used oral appliances said they would continue the treatment after completing the study, compared with only 52% of those who used the sham device.
However, daytime sleepiness, measured subjectively using the Epworth Sleepiness Scale and the Karolinska Sleepiness Scale and measured objectively using the Oxford Sleep Resistance test, did not differ significantly between the two study groups. The number of days with headaches, the intensity of headaches, the presence of nasal congestion, difficulty falling asleep, nighttime awakenings, nightmares, and reaction times also were not significantly different, nor were scores on a quality of life measure.
The study was supported by grants from the Swedish Research Council, the Swedish Heart and Lung Foundation, and the County Council of Vasterbotten. Dr. Marklund and her associates reported no conflicts of interest.
FROM JAMA INTERNAL MEDICINE
Key clinical point: An oral appliance to advance the lower jaw reduced apneic episodes, snoring, and restless legs symptoms.
Major finding: Half of the patients receiving active treatment had an apnea-hypopnea index lower than 5, compared with only 11% of those using the placebo device, for an odds ratio of 7.8 and a number-needed-to-treat of 3.
Data source: A randomized, single-blind trial comparing a customized oral appliance against a placebo device in 96 adults with daytime sleepiness and either snoring or mild to moderate obstructive sleep apnea.
Disclosures: This study was supported by grants from the Swedish Research Council, the Swedish Heart and Lung Foundation, and the County Council of Vasterbotten. Dr. Marklund and her associates reported no conflicts of interest.
Another Good Reason to Recommend Low-dose Aspirin
PRACTICE CHANGER
Prescribe low-dose aspirin (eg, 81 mg/d) to pregnant women who are at high risk for preeclampsia because it reduces the risk for this complication, as well as preterm birth and intrauterine growth restriction.1
STRENGTH OF RECOMMENDATION
A: Based on a systematic review and meta-analysis of 23 studies, including 21 randomized controlled trials.1
ILLUSTRATIVE CASE
A 22-year-old G2P1 pregnant woman at 18 weeks’ gestation who has a history of preeclampsia comes to your office for a routine prenatal visit. On exam, her blood pressure continues to be in the 110s/60s, as it has been for several visits. Her history puts her at risk for preeclampsia again, and you wonder if anything can be done to prevent this from happening.
The incidence of preeclampsia, which occurs in 2% to 8% of pregnancies worldwide and 3.4% of pregnancies in the United States, appears to be steadily increasing.2,3 Preeclampsia is defined as new-onset hypertension at > 20 weeks’ gestation, plus proteinuria, thrombocytopenia, renal insufficiency, impaired liver function, pulmonary edema, and/or cerebral or visual symptoms.4
The condition is associated with several adverse maternal and fetal outcomes, including eclampsia, abruption, intrauterine growth restriction (IUGR), preterm birth, stillbirth, and maternal death.2,4 Risk factors include previous preeclampsia, maternal age 40 or older, chronic medical conditions, and multifetal pregnancy.5
The only effective treatment for preeclampsia is delivery.4 Given the lack of other treatments, strategies for prevention would be highly valuable.
In 1996, the US Preventive Services Task Force (USPSTF) addressed this issue and concluded that there was insufficient evidence to recommend for or against using aspirin to prevent preeclampsia.6 More recently, Henderson et al1 conducted a systematic review and meta-analysis to support the USPSTF in a revision of its earlier recommendation.
STUDY SUMMARY
Aspirin lowers risk for preeclampsia and preterm birth
Henderson et al1 evaluated the impact of low-dose aspirin on maternal and fetal outcomes among pregnant women at risk for preeclampsia. The review of 23 studies included 21 randomized, placebo-controlled trials that evaluated 24,666 patients. Slightly more than half of the studies that evaluated maternal and fetal health benefits were graded as good quality, and 67% of those that evaluated maternal, perinatal, and developmental harms were rated good quality.
Most study participants were white and ages 20 to 33. Aspirin doses ranged from 60 to 150 mg/d; most studies used doses of 60 or 100 mg/d. Aspirin was initiated between 12 to 36 weeks’ gestation, with nine trials initiating aspirin before 16 weeks. In most trials, aspirin was continued until delivery.
Among women at high preeclampsia risk (10 studies), the pooled relative risk (RR) for perinatal death was 0.81 for low-dose aspirin, compared to placebo. However, this finding was not statistically significant (P = .78).
Among women who received low-dose aspirin, researchers noted a 14% risk reduction for preterm birth (RR, 0.86), a 20% risk reduction for IUGR (RR, 0.80), and a 24% risk reduction for preeclampsia (RR, 0.76). The absolute risk reduction for preeclampsia was estimated to be 2% to 5%.
While the results for preterm birth, IUGR, and preeclampsia were statistically significant, the authors noted that these results could have been biased by “small study effects” (the tendency of smaller studies to report positive findings, which in turn can skew the results of a meta-analysis based primarily on such studies). The timing and dosage of aspirin had no significant effect on outcomes.
There was no evidence of increased maternal postpartum hemorrhage with aspirin use (RR, 1.02). Aspirin use did not seem to increase perinatal mortality among all risk levels (RR, 0.92; P = .65). No differences were noted in the toddlers’ development at 18 months.
WHAT’S NEW
Low-dose aspirin use is now recommended
The 1996 USPSTF recommendation concluded that there was insufficient evidence to recommend aspirin use for preventing preeclampsia. This systematic review and meta-analysis, along with findings from a 2007 Cochrane review7 and a meta-analysis from the PARIS Collaborative Group,8 provide good-quality evidence that aspirin reduces negative maternal and fetal outcomes associated with preeclampsia. In 2014, the USPSTF cited this evidence when it decided to recommend using low-dose aspirin (81 mg/d) to prevent preeclampsia in women who are at high risk for the complication (Grade B).9
CAVEATS
Much of the data came from small studies
A substantial portion of the data in this systematic review and meta-analysis came from small studies with positive findings. Because small studies with null findings tend not to be published, there is concern that the results reported by Henderson et al1 may be somewhat biased, and that future studies may push the overall observed effect toward a null finding.
Also, the criteria used to define “high risk” for preeclampsia varied by study, so it’s unclear which groups of women would benefit most from aspirin use during pregnancy. Finally, there is a lack of high-quality data on the effects of aspirin use during pregnancy on long-term outcomes in children. Despite these caveats, the cumulative evidence strongly points to greater benefit than harm.
CHALLENGES TO IMPLEMENTATION
You need to determine which patients are at highest risk
The principle challenge lies in the identification of patients who are at high risk for preeclampsia and thus will likely benefit from this intervention. This systematic review and meta-analysis used a large variety of risk factors to determine whether a woman was at high risk. A 2013 American College of Obstetricians and Gynecologists Task Force on Hypertension in Pregnancy report defined as high risk women with a history of preeclampsia in more than one previous pregnancy or women with a previous preterm delivery due to preeclampsia.4
The updated USPSTF recommendation suggests that women be considered high risk if they have any of the following: previous preeclampsia, multifetal gestation, chronic hypertension, diabetes, renal disease, or autoimmune disease.9 We consider both sets of criteria reasonable for identifying women who may benefit from low-dose aspirin during pregnancy.
REFERENCES
1. Henderson J, Whitlock E, O’Connor E, et al. Low-dose aspirin for prevention of morbidity and mortality from preeclampsia: a systematic evidence review for the US Preventive Services Task Force. Ann Intern Med. 2014;160:695-703.
2. Ghulmiyyah L, Sibai B. Maternal mortality from preeclampsia/eclampsia. Semin Perinatol. 2012;36:56-59.
3. Ananth CV, Keyes KM, Wapner RJ. Pre-eclampsia rates in the United States, 1980-2010: age-period-cohort analysis. BMJ. 2013;347:f6564.
4. American College of Obstetricians and Gynecologists; Task Force on Hypertension in Pregnancy. Hypertension in pregnancy. Obstet Gynecol. 2013;122:1122-1131.
5. Duckitt K, Harrington D. Risk factors for pre-eclampsia at antenatal booking: systematic review of controlled studies. BMJ. 2005; 330:565.
6. US Preventive Services Task Force. Aspirin prophylaxis in pregnancy. In: Guide to Clinical Preventive Services: Report of the US Preventive Services Task Force. 2nd ed. Washington, DC: US Department of Health and Human Services; 1996.
7. Duley L, Henderson-Smart DJ, Meher S, et al. Antiplatelet agents for preventing pre-eclampsia and its complications. Cochrane Database Syst Rev. 2007(2):CD004659. 8. Askie LM, Duley L, Henderson-Smart DJ, et al; PARIS Collaborative Group. Antiplatelet agents for prevention of pre-eclampsia: a meta-analysis of individual patient data. Lancet. 2007;369: 1791-1798. 9. LeFevre ML; US Preventive Services Task Force. Low-dose aspirin use for the prevention of morbidity and mortality from preeclampsia [recommendation statement]. Ann Intern Med. 2014;161:819-826.
ACKNOWLEDGEMENT
The PURLs Surveillance System was supported in part by Grant Number UL1RR024999 from the National Center For Research Resources, a Clinical Translational Science Award to the University of Chicago. The content is solely the responsibility of the authors and does not necessarily represent the official views of the National Center For Research Resources or the National Institutes of Health.
Copyright © 2015. The Family Physicians Inquiries Network. All rights reserved.
Reprinted with permission from The Family Physicians Inquiries Network and The Journal of Family Practice. 2015;64(5):301-303.
Hospitalists Should Make Commitment to Improve Healthcare Safety

Peter Pronovost, MD, PhD, FCCM, knows how to deliver a great talk. It is no wonder he is highly sought after and was asked to speak at the plenary for SHM’s annual meeting. Dr. Pronovost, also known as the “Checklist Doctor,” knows how to combine just the right amount of sadness, inspiration, and humor to make his audience feel motivated and compelled to DO something. And, in fact, he implores you—DO something.
Most of us feel excited and inspired during the annual meeting. But those feelings serve little purpose unless we translate them into actions that will make the medical industry a better place for clinicians to work and for patients to receive care. As Dr. Pronovost said, “We are the only hope that the healthcare system has of improving quality and safety.”
He was inspired years ago by the watershed event that will forever be imprinted upon Johns Hopkins Hospital in Baltimore, the preventable death of 18-month-old Josie King on Feb. 22, 2001. Years after the event, her mother, Sorrel King, a passionate patient safety advocate, wanted to know if hospitals are any safer than they were the day that Josie died. She wanted to know what patient safety experts at Hopkins had done to ensure there would not be another Josie King story.
Patients and their families consistently voice similar desires after they have suffered preventable harm. They want to know what happened, why it happened, what it means for them, and what will be done to prevent it from happening again.1 The latter question is one I am frequently asked by patients and their families at my hospital. “What are you going to do to make sure this does not happen again?”
I would venture to guess most hospitalists have been responsible for some type of preventable patient harm during their careers. We work in complex, high-volume, unpredictable, and continuously changing environments. Many of the patients and families in our care are new to us and are with us for only short periods of time. Those of us who have been responsible for preventable patient harm know that it is an unforgettable moment in time that can weigh upon your conscious. And, of course, we all want to do something to make sure it does not happen again.
That is exactly what patients and their families expect of all of us—to DO something—and they should.
But this can be an overwhelming responsibility, especially when the root causes of harm are difficult either to identify or to fix—such as a miscommunication, a diagnostic error, or an inadequate handoff.
Which gets me back to Dr. Pronovost giving a great talk. His appeal to our audience of about 3,000 hospitalists was to DO something. To make the healthcare system improve quality and safety for future patients. To not wait until we or our colleagues are involved in a preventable harm event. To do something, anything, now, that contributes to safer care, today and every day going forward.
He ended his talk with “I will….” Dr. Pronovost (and I would venture to guess patients and their families) wants each of us to fill in the blank with a statement of personal accountability for action. Unfortunately, many of us still believe that we are personally unable to make complex systems safer for patients. Many of us still believe that patients and the systems they traverse are too complex, unpredictable, unreliable, or noncompliant.
The truth is, patients and systems are indeed complex, unpredictable, unreliable, and noncompliant. The further truth is, the only way to make care safer is for each of us to start with a collective shared mental model that we can make it better—and for each of us to commit to personal accountability for action.
My “I Will”
So, while I really enjoyed Dr. Pronovost’s talk, what I enjoyed even more was reading the section in last month’s edition of The Hospitalist in which about a half dozen hospitalists interviewed after the plenary accepted the challenge of filling in the blank “I will….” A few excerpts:
- “I will let them know that everything is possible…”
- “I will improve healthcare…”
- “[I will] make sure the patient is heard…”
By a simple proclamation of personal accountability, a mere thousand hospitalists attending an annual meeting can collectively and progressively change the safety of healthcare in thousands of hospitals around the country. It starts with thinking we can do it and publicly committing to the journey. Although we are still a relatively new specialty, we have permeated almost every hospital in the country, and we have outpaced the growth of any specialty in the history of modern medicine. We are perfectly poised to be the safety change agents for every hospital system. As Margaret Meade famously said, “Never doubt that a small group of thoughtful, committed citizens can change the world; indeed, it’s the only thing that ever has….”
So don’t delay. Whether or not you had the good fortune of being inspired at the SHM annual meeting, each of us owes it to our patients to commit to improving the safety of healthcare and paving the future of hospital care. Get out your pen, craft a commitment now, follow through with it, and make hospitals safer tomorrow than they were yesterday.
I will…

Reference
- Gallagher TH, Waterman AD, Ebers AG, Fraser VJ, Levinson W. Patients’ and physicians’ attitudes regarding the disclosure of medical errors. JAMA. 2003;289(8):1001-1007.
Peter Pronovost, MD, PhD, FCCM, knows how to deliver a great talk. It is no wonder he is highly sought after and was asked to speak at the plenary for SHM’s annual meeting. Dr. Pronovost, also known as the “Checklist Doctor,” knows how to combine just the right amount of sadness, inspiration, and humor to make his audience feel motivated and compelled to DO something. And, in fact, he implores you—DO something.
Most of us feel excited and inspired during the annual meeting. But those feelings serve little purpose unless we translate them into actions that will make the medical industry a better place for clinicians to work and for patients to receive care. As Dr. Pronovost said, “We are the only hope that the healthcare system has of improving quality and safety.”
He was inspired years ago by the watershed event that will forever be imprinted upon Johns Hopkins Hospital in Baltimore, the preventable death of 18-month-old Josie King on Feb. 22, 2001. Years after the event, her mother, Sorrel King, a passionate patient safety advocate, wanted to know if hospitals are any safer than they were the day that Josie died. She wanted to know what patient safety experts at Hopkins had done to ensure there would not be another Josie King story.
Patients and their families consistently voice similar desires after they have suffered preventable harm. They want to know what happened, why it happened, what it means for them, and what will be done to prevent it from happening again.1 The latter question is one I am frequently asked by patients and their families at my hospital. “What are you going to do to make sure this does not happen again?”
I would venture to guess most hospitalists have been responsible for some type of preventable patient harm during their careers. We work in complex, high-volume, unpredictable, and continuously changing environments. Many of the patients and families in our care are new to us and are with us for only short periods of time. Those of us who have been responsible for preventable patient harm know that it is an unforgettable moment in time that can weigh upon your conscious. And, of course, we all want to do something to make sure it does not happen again.
That is exactly what patients and their families expect of all of us—to DO something—and they should.
But this can be an overwhelming responsibility, especially when the root causes of harm are difficult either to identify or to fix—such as a miscommunication, a diagnostic error, or an inadequate handoff.
Which gets me back to Dr. Pronovost giving a great talk. His appeal to our audience of about 3,000 hospitalists was to DO something. To make the healthcare system improve quality and safety for future patients. To not wait until we or our colleagues are involved in a preventable harm event. To do something, anything, now, that contributes to safer care, today and every day going forward.
He ended his talk with “I will….” Dr. Pronovost (and I would venture to guess patients and their families) wants each of us to fill in the blank with a statement of personal accountability for action. Unfortunately, many of us still believe that we are personally unable to make complex systems safer for patients. Many of us still believe that patients and the systems they traverse are too complex, unpredictable, unreliable, or noncompliant.
The truth is, patients and systems are indeed complex, unpredictable, unreliable, and noncompliant. The further truth is, the only way to make care safer is for each of us to start with a collective shared mental model that we can make it better—and for each of us to commit to personal accountability for action.
My “I Will”
So, while I really enjoyed Dr. Pronovost’s talk, what I enjoyed even more was reading the section in last month’s edition of The Hospitalist in which about a half dozen hospitalists interviewed after the plenary accepted the challenge of filling in the blank “I will….” A few excerpts:
- “I will let them know that everything is possible…”
- “I will improve healthcare…”
- “[I will] make sure the patient is heard…”
By a simple proclamation of personal accountability, a mere thousand hospitalists attending an annual meeting can collectively and progressively change the safety of healthcare in thousands of hospitals around the country. It starts with thinking we can do it and publicly committing to the journey. Although we are still a relatively new specialty, we have permeated almost every hospital in the country, and we have outpaced the growth of any specialty in the history of modern medicine. We are perfectly poised to be the safety change agents for every hospital system. As Margaret Meade famously said, “Never doubt that a small group of thoughtful, committed citizens can change the world; indeed, it’s the only thing that ever has….”
So don’t delay. Whether or not you had the good fortune of being inspired at the SHM annual meeting, each of us owes it to our patients to commit to improving the safety of healthcare and paving the future of hospital care. Get out your pen, craft a commitment now, follow through with it, and make hospitals safer tomorrow than they were yesterday.
I will…
Reference
- Gallagher TH, Waterman AD, Ebers AG, Fraser VJ, Levinson W. Patients’ and physicians’ attitudes regarding the disclosure of medical errors. JAMA. 2003;289(8):1001-1007.
How Should a Patient with Pulmonary Hypertension Be Evaluated, Managed?
Case
A 62-year-old female with no significant past medical history presents with three weeks of progressive dyspnea on exertion and bilateral lower extremity edema. Family members report that the patient often snores and “gasps for air” during sleep. B-type natriuretic peptide is elevated at 2,261 pg/ml. Due to concern for congestive heart failure, transthoracic echocardiography (TTE) is performed and shows normal left ventricular systolic function, mild left ventricular diastolic dysfunction, severely elevated right ventricular systolic pressure of 74 mm Hg, and right ventricular dilatation and hypokinesis.
How should this patient with newfound pulmonary hypertension (PH) be evaluated and managed?
Background
PH is a progressive disease that presents with nonspecific signs and symptoms and can be fatal if untreated. Ernst von Romberg first identified the disease in 1891, and efforts have been made through the last century to understand its etiology and mechanisms.1
PH is defined as an elevated mean pulmonary arterial pressure (mPAP) of ≥25 mmHg at rest; a mPAP of ≤20 mmHg is considered normal, and a mPAP of 21-24 mmHg is borderline.2 This elevation of the mPAP can be due to a primary elevation of pressures in the pulmonary arterial system alone (pulmonary arterial hypertension) or secondary to elevation in pressures in the pulmonary venous and pulmonary capillary systems (pulmonary venous hypertension).
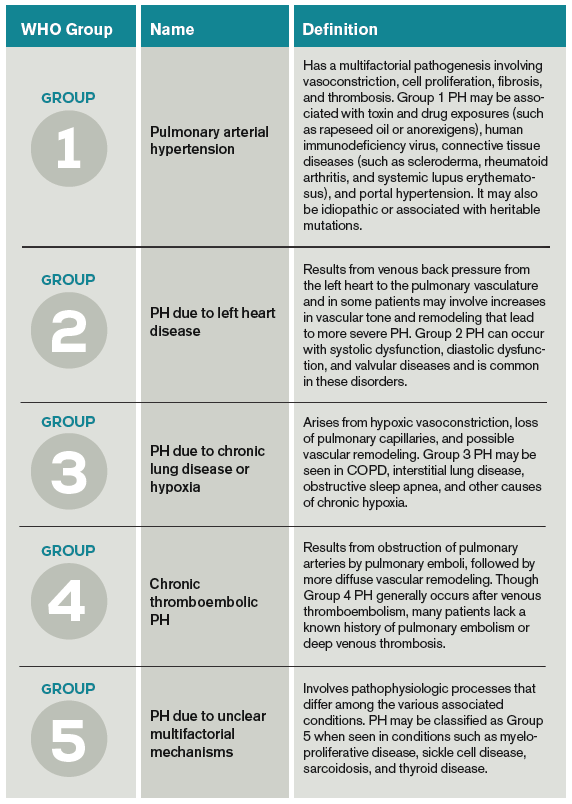
PH classification has endured many modifications through the years with better understanding of its pathophysiology. Currently, the World Health Organization (WHO) classification system includes five groups based on etiology (see Table 1):3,4
- Group 1: Pulmonary arterial hypertension (PAH);
- Group 2: PH due to left heart disease;
- Group 3: PH due to chronic lung disease and hypoxemia;
- Group 4: Chronic thromboembolic PH (CTEPH); and
- Group 5: PH due to unclear multifactorial mechanisms.
The pathophysiology differs among the groups, and much of what is known has come from studies performed in patients with idiopathic PAH. It is a proliferative vasculopathy characterized by vasoconstriction, cell proliferation, fibrosis, and thrombosis. Both genetic predisposition and modifiers that include drugs and toxins, human immunodeficiency virus (HIV), congenital heart disease with left-to-right shunting, and potassium channel dysfunction play a role in the pathogenesis.3,5,6 Although many processes underlying the pathophysiology of PH groups 2, 3, 4, and 5 are not fully understood, vascular remodeling and increased vascular resistance are common to all of them.
PH affects both genders and all age groups and races. Due to its broad classification and multiple etiologies, it is difficult to assess PH prevalence in the general population. There are wide ranges among different populations, with PH prevalence in sickle cell disease ranging from 20% to 40%, in systemic sclerosis from 10% to 15%, and in portal hypertension from 2% to 16%.7,8,9 PH in COPD is usually mild to moderate, with preserved cardiac output, although a minority of patients develop severe PH.10-12 PH is present in approximately 20% of patients with moderate to severe sleep apnea.13 The prevalence of PH in left heart disease is unknown due to variability in populations assessed and methods used in various studies; estimates have ranged from 25-100%.14
Evaluation
Initial evaluation: A thorough history and physical examination can help determine PH etiology, identify associated conditions, and determine the severity of disease. Dyspnea on exertion is the most common presenting complaint; weakness, fatigue, and angina may be present.15 Lower extremity edema and ascites are indicative of more advanced disease.
A patient’s symptoms may suggest the presence of undiagnosed conditions that are associated with PH, and past medical history should evaluate for previous diagnoses of these conditions (see Table 1).
Family history may reveal relatives with PH, given the genetic predisposition to development of Group 1 PH. Physical exam findings include a prominent pulmonic valve closure during the second heart sound, a palpable left parasternal heave, and a tricuspid regurgitation murmur.
Electrocardiogram (ECG) and chest X-ray (CXR) are not sufficiently sensitive or specific to diagnose PH but may provide initial supporting evidence that prompts further testing. Signs of right ventricular hypertrophy and right atrial enlargement may be present on ECG. The CXR may show pruning (prominent hilar vasculature with reduced vasculature peripherally) and right ventricular hypertrophy, as evidenced by shrinking of the retrosternal window on lateral CXR. An unremarkable ECG or normal CXR does not rule out PH.
Echocardiography: TTE allows estimation of pulmonary artery systolic pressure (PASP) via measurement of tricuspid regurgitation jet velocity and estimation of right atrial pressure. Although results of TTE do correlate with measurements from right heart catheterization (RHC), underestimation and overestimation commonly occur. PASP thresholds for diagnosing or ruling out PH cannot thus be defined easily. An elevated PASP less than 36 mmHg, tricuspid regurgitation velocity <2.8 m/s, and no additional echocardiographic variables suggestive of PH may indicate that PH is unlikely, based on arbitrary criteria from one clinical practice guideline.16
The guideline suggested that tricuspid regurgitation velocity >3.4 m/s or estimated PASP >50 mmHg indicated that PH was likely. Other echocardiographic variables that may suggest the presence of PH include right ventricular enlargement or intraventricular septal flattening. Finally, TTE should also be used to assess for possible causes of PH, such as left heart disease or cardiac shunts.
Further evaluation: Following identification of PH via TTE, further testing can confirm the diagnosis, determine the etiology of the PH, and allow appropriate treatment (see Table 2). Much of this evaluation may occur after hospital discharge and, in cases of unexplained PH, referral to a pulmonologist for further evaluation and management is appropriate. Depending on patient stability, test availability, and patient ability to follow up, some testing may be reasonable during the inpatient stay.
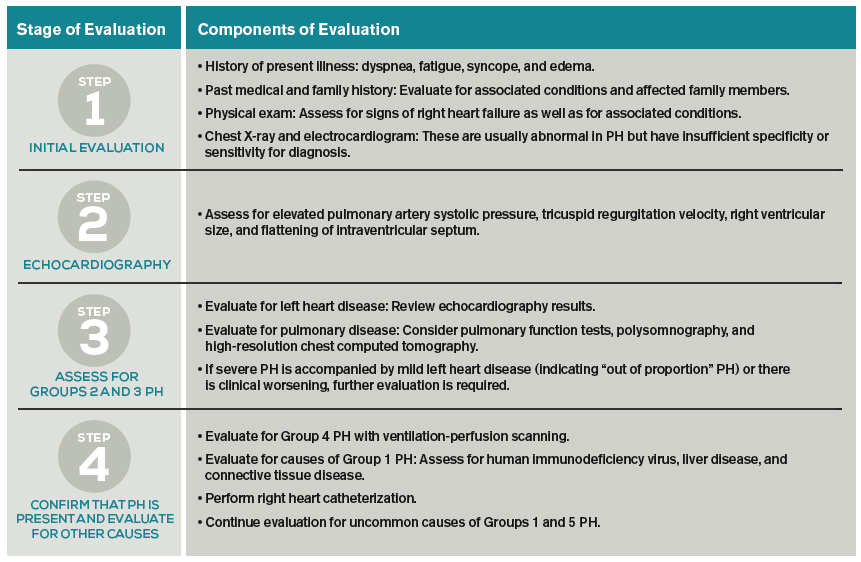
Patients should undergo a stepwise series of testing that initially may be guided by clinical suspicion for underlying conditions.15-19 Polysomnography can identify sleep-disordered breathing, and pulmonary function tests and high-resolution chest CT can assess for chronic pulmonary diseases. Patients with groups 2 and 3 PH, whose PH can be explained by left heart disease or lung disease, do not necessarily require RHC or extensive evaluation for other etiologies of PH.2,17 These patients may be monitored while their underlying conditions are managed.
Patients with worsening clinical course or PH that is “out of proportion” to their lung disease or heart disease, however, do require further evaluation, including RHC. “Out of proportion” has not been consistently defined but generally refers to severe PH observed in patients with mild left heart or lung disease.18 More precise terminology and criteria to define patients with out of proportion PH have been proposed.14
Ventilation-perfusion scanning is required in all cases of PH of unknown etiology to evaluate for CTEPH (Group 4 PH). CT angiography, while appropriate to use in testing for acute pulmonary embolism, is not sufficiently sensitive to evaluate for CTEPH. Tests for liver function, HIV, and connective tissue disease may identify conditions associated with Group 1 PH. Ultimately, RHC is required to confirm the diagnosis of PH, given the shortcomings of TTE. A vasodilator study during RHC allows identification of candidates for advanced therapies, such as patients with Group 1 PH.
Management
The prognosis and treatment of PH varies by WHO Group. The hospitalist will often undertake initial management of symptomatic patients (see Table 3). Intravenous loop diuretics will successfully treat peripheral edema and hepatic congestion in all PH patients.20 Due to the possibility of decreased cardiac output or worsened hypotension in some PH groups, patients should be monitored closely during initial diuresis.

All patients with PH should be assessed for hypoxia during rest, ambulation, and sleep during their hospitalization. Supplemental oxygen therapy should be initiated in all patients with evidence of persistent hypoxia (arterial oxygen blood pressure <60 mmHg).20 Vaccination against pneumococcus and influenza should also be performed during the initial hospitalization. Pregnant patients diagnosed with PH require urgent maternal-fetal medicine consultation.
Further management should be guided by the underlying etiology of the PH:17,18
- Group 1 PH. These patients should be evaluated by a pulmonology consultant, if one is available, as they require intense outpatient follow-up with a pulmonologist. Specialized treatment regimens include calcium channel blockers, phosphodiesterase inhibitors, prostanoids, endothelin receptor antagonists, or newly approved guanylate cyclase stimulants. In previously diagnosed patients, these medications should be continued during a patient’s admission unless the medication is clearly causing the patient harm (such as worsening hypotension) or preventing improvement. Many of these patients are placed on chronic anticoagulation with warfarin, with a goal international normalized ratio (INR) of 1.5 to 2.5.
- Group 2 PH. Patients with left heart or valvular dysfunction and PH have a worse prognosis than similar patients without PH. Management of these patients should focus on treating the underlying etiology. Use of prostanoids may be harmful in this patient population.18
- Group 3 PH. Patients whose PH is fully explained by pulmonary disease should be started on continuous oxygen therapy to treat persistent hypoxemia, and their underlying disorder should be treated, with pulmonologist consultation and referral if necessary.
- Group 4 PH. Patients with newly diagnosed CTEPH should be initiated on warfarin with a goal INR of 2.0 to 3.0. They should undergo evaluation by a pulmonologist for thromboendarterectomy and possibly advanced medical therapies.
- Group 5 PH. Patients with sarcoidosis as the cause of their PH may benefit from prostanoid or endothelin receptor antagonist therapy and should undergo evaluation by a pulmonologist.21,22
Patients with sickle cell anemia, metabolic disorders, and other causes should undergo further subspecialist evaluation prior to initiating therapy to treat their PH.
Back to the Case
The patient underwent diuresis with intravenous furosemide over several days, with gradual improvement in her lower extremity edema and dyspnea. She was placed on oxygen therapy for persistent hypoxemia. As her highly elevated pulmonary artery pressure appeared to be “out of proportion” to her mild left ventricular diastolic dysfunction, further evaluation was pursued. Ventilation-perfusion scanning was performed and showed no mismatch of perfusion and ventilation, effectively ruling out CTEPH. Liver function, HIV, and connective tissue disease testing yielded unremarkable results.
The patient was euvolemic after one week of diuresis and was discharged home with plans for PH specialist follow-up, polysomnography to evaluate for sleep-disordered breathing, and likely RHC. The etiology of her PH was not clear at discharge.
Bottom Line
Evaluation of PH is a step-wise process that starts with history and physical exam and may require extensive evaluation, including right heart catheterization to confirm the diagnosis and define the etiology. A primary goal of evaluation is to define the appropriate therapy for a given patient, which may include advanced therapies in some cases.
Dr. Griffith is a quality improvement fellow and instructor of medicine in the Hospital Medicine Division at the University of Colorado Denver. Drs. McFarland and Smolkin are hospitalists and instructors of medicine at the University of Colorado Denver.
References
- von Romberg E. Über sklerose der lungenarterie. Dtsch Arch Klin Med. 1891;48:197-206.
- Hoeper MM, Bogaard HJ, Condliffe R, et al. Definitions and diagnosis of pulmonary hypertension. J Am Coll Cardiol. 2013;62(25 Suppl):D42-D50.
- Simonneau G, Gatzoulis MA, Adatia I, et al. Updated clinical classification of pulmonary hypertension. J Am Coll Cardiol. 2013;62(25 Suppl):D34-D41.
- Rich S, Rubin L, Abenhail L, et al. Executive summary from the World Symposium on primary pulmonary hypertension. Evian, France: The World Health Organization; 1998.
- Newman JH, Wheeler L, Lane KB, et al. Mutation in the gene for bone morphogenetic protein receptor II as a cause of primary pulmonary hypertension in a large kindred. New Engl J Med. 2001;345(5):319-24.'
- Petitpretz P, Brenot F, Azarian R, et al. Pulmonary hypertension in patients with human immunodeficiency virus infection. Comparison with primary pulmonary hypertension. Circulation. 1994;89(6):2722-2727.
- Gladwin MT, Vichinsky E. Pulmonary complications of sickle cell disease. New Engl J Med. 2008;359(21):2254-2265.
- Wigley FM, Lima JA, Mayes M, McLain D, Chapin JL, Ward-Able C. The prevalence of undiagnosed pulmonary arterial hypertension in subjects with connective tissue disease at the secondary health care level of community-based rheumatologists (the UNCOVER study). Arthritis Rheum. 2005;52(7):2125-2132.
- Ramsay MA, Simpson BR, Nguyen AT, Ramsay KJ, East C, Klintmalm GB. Severe pulmonary hypertension in liver transplant candidates. Liver Transpl Surg. 1997;3(5):494-500.
- Kessler R, Faller M, Weitzenblum E, et al. “Natural history” of pulmonary hypertension in a series of 131 patients with chronic obstructive lung disease. Am J Respir Crit Care Med. 2001;164(2):219-24.
- Chaouat A, Bugnet AS, Kadaoui N, et al. Severe pulmonary hypertension and chronic obstructive pulmonary disease. Am J Respir Crit Care Med. 2005;172(2):189-94.
- Thabut G, Dauriat G, Stern JB, et al. Pulmonary hemodynamics in advanced COPD candidates for lung volume reduction surgery or lung transplantation. Chest. 2005;127(5):1531-1536.
- Yamakawa H, Shiomi T, Sasanabe R, et al. Pulmonary hypertension in patients with severe obstructive sleep apnea. Psychiatry Clin Neurosci. 2002;56(3):311-312.
- Vachiery JL, Adir Y, Barberà JA, et al. Pulmonary hypertension due to left heart diseases. J Am Coll Cardiol. 2013;62(25 Suppl):D100-D108.
- McGoon M, Gutterman D, Steen V, et al. Screening, early detection, and diagnosis of pulmonary arterial hypertension: ACCP evidence-based clinical practice guidelines. Chest. 2004;126(1 Suppl):14S-34S.
- Grünig E, Barner A, Bell M, et al. Non-invasive diagnosis of pulmonary hypertension: ESC/ERS Guidelines with Updated Commentary of the Cologne Consensus Conference 2011. Int J Cardiol. 2011;154 Suppl 1:S3-12.
- Galiè N, Hoeper MM, Humbert M, et al. Guidelines for the diagnosis and treatment of pulmonary hypertension: the Task Force for the Diagnosis and Treatment of Pulmonary Hypertension of the European Society of Cardiology (ESC) and the European Respiratory Society (ERS), endorsed by the International Society of Heart and Lung Transplantation (ISHLT). Eur Heart J. 2009;30(20):2493-2537.
- McLaughlin VV, Archer SL, Badesch DB, et al. ACCF/AHA 2009 expert consensus document on pulmonary hypertension: a report of the American College of Cardiology Foundation Task Force on Expert Consensus Documents and the American Heart Association: developed in collaboration with the American College of Chest Physicians, American Thoracic Society, Inc., and the Pulmonary Hypertension Association. Circulation. 2009;119(16):2250-2294.
- Brown K, Gutierrez AJ, Mohammed TL, et al. ACR Appropriateness Criteria(R) pulmonary hypertension. J Thorac Imaging. 2013;28(4):W57-60.
- Galiè N, Corris PA, Frost A, et al. Updated treatment algorithm of pulmonary arterial hypertension. J Am Coll Cardiol. 2013;62(25 Suppl):D60-72.
- Fisher KA, Serlin DM, Wilson KC, Walter RE, Berman JS, Farber HW. Sarcoidosis-associated pulmonary hypertension: outcome with long-term epoprostenol treatment. Chest. 2006;130(5):1481-1488.
- Steiner MK, Preston IR, Klinger JR, et al. Conversion to bosentan from prostacyclin infusion therapy in pulmonary arterial hypertension: a pilot study. Chest. 2006;130(5):1471-1480.
Case
A 62-year-old female with no significant past medical history presents with three weeks of progressive dyspnea on exertion and bilateral lower extremity edema. Family members report that the patient often snores and “gasps for air” during sleep. B-type natriuretic peptide is elevated at 2,261 pg/ml. Due to concern for congestive heart failure, transthoracic echocardiography (TTE) is performed and shows normal left ventricular systolic function, mild left ventricular diastolic dysfunction, severely elevated right ventricular systolic pressure of 74 mm Hg, and right ventricular dilatation and hypokinesis.
How should this patient with newfound pulmonary hypertension (PH) be evaluated and managed?
Background
PH is a progressive disease that presents with nonspecific signs and symptoms and can be fatal if untreated. Ernst von Romberg first identified the disease in 1891, and efforts have been made through the last century to understand its etiology and mechanisms.1
PH is defined as an elevated mean pulmonary arterial pressure (mPAP) of ≥25 mmHg at rest; a mPAP of ≤20 mmHg is considered normal, and a mPAP of 21-24 mmHg is borderline.2 This elevation of the mPAP can be due to a primary elevation of pressures in the pulmonary arterial system alone (pulmonary arterial hypertension) or secondary to elevation in pressures in the pulmonary venous and pulmonary capillary systems (pulmonary venous hypertension).
PH classification has endured many modifications through the years with better understanding of its pathophysiology. Currently, the World Health Organization (WHO) classification system includes five groups based on etiology (see Table 1):3,4
- Group 1: Pulmonary arterial hypertension (PAH);
- Group 2: PH due to left heart disease;
- Group 3: PH due to chronic lung disease and hypoxemia;
- Group 4: Chronic thromboembolic PH (CTEPH); and
- Group 5: PH due to unclear multifactorial mechanisms.
The pathophysiology differs among the groups, and much of what is known has come from studies performed in patients with idiopathic PAH. It is a proliferative vasculopathy characterized by vasoconstriction, cell proliferation, fibrosis, and thrombosis. Both genetic predisposition and modifiers that include drugs and toxins, human immunodeficiency virus (HIV), congenital heart disease with left-to-right shunting, and potassium channel dysfunction play a role in the pathogenesis.3,5,6 Although many processes underlying the pathophysiology of PH groups 2, 3, 4, and 5 are not fully understood, vascular remodeling and increased vascular resistance are common to all of them.
PH affects both genders and all age groups and races. Due to its broad classification and multiple etiologies, it is difficult to assess PH prevalence in the general population. There are wide ranges among different populations, with PH prevalence in sickle cell disease ranging from 20% to 40%, in systemic sclerosis from 10% to 15%, and in portal hypertension from 2% to 16%.7,8,9 PH in COPD is usually mild to moderate, with preserved cardiac output, although a minority of patients develop severe PH.10-12 PH is present in approximately 20% of patients with moderate to severe sleep apnea.13 The prevalence of PH in left heart disease is unknown due to variability in populations assessed and methods used in various studies; estimates have ranged from 25-100%.14
Evaluation
Initial evaluation: A thorough history and physical examination can help determine PH etiology, identify associated conditions, and determine the severity of disease. Dyspnea on exertion is the most common presenting complaint; weakness, fatigue, and angina may be present.15 Lower extremity edema and ascites are indicative of more advanced disease.
A patient’s symptoms may suggest the presence of undiagnosed conditions that are associated with PH, and past medical history should evaluate for previous diagnoses of these conditions (see Table 1).
Family history may reveal relatives with PH, given the genetic predisposition to development of Group 1 PH. Physical exam findings include a prominent pulmonic valve closure during the second heart sound, a palpable left parasternal heave, and a tricuspid regurgitation murmur.
Electrocardiogram (ECG) and chest X-ray (CXR) are not sufficiently sensitive or specific to diagnose PH but may provide initial supporting evidence that prompts further testing. Signs of right ventricular hypertrophy and right atrial enlargement may be present on ECG. The CXR may show pruning (prominent hilar vasculature with reduced vasculature peripherally) and right ventricular hypertrophy, as evidenced by shrinking of the retrosternal window on lateral CXR. An unremarkable ECG or normal CXR does not rule out PH.
Echocardiography: TTE allows estimation of pulmonary artery systolic pressure (PASP) via measurement of tricuspid regurgitation jet velocity and estimation of right atrial pressure. Although results of TTE do correlate with measurements from right heart catheterization (RHC), underestimation and overestimation commonly occur. PASP thresholds for diagnosing or ruling out PH cannot thus be defined easily. An elevated PASP less than 36 mmHg, tricuspid regurgitation velocity <2.8 m/s, and no additional echocardiographic variables suggestive of PH may indicate that PH is unlikely, based on arbitrary criteria from one clinical practice guideline.16
The guideline suggested that tricuspid regurgitation velocity >3.4 m/s or estimated PASP >50 mmHg indicated that PH was likely. Other echocardiographic variables that may suggest the presence of PH include right ventricular enlargement or intraventricular septal flattening. Finally, TTE should also be used to assess for possible causes of PH, such as left heart disease or cardiac shunts.
Further evaluation: Following identification of PH via TTE, further testing can confirm the diagnosis, determine the etiology of the PH, and allow appropriate treatment (see Table 2). Much of this evaluation may occur after hospital discharge and, in cases of unexplained PH, referral to a pulmonologist for further evaluation and management is appropriate. Depending on patient stability, test availability, and patient ability to follow up, some testing may be reasonable during the inpatient stay.
Patients should undergo a stepwise series of testing that initially may be guided by clinical suspicion for underlying conditions.15-19 Polysomnography can identify sleep-disordered breathing, and pulmonary function tests and high-resolution chest CT can assess for chronic pulmonary diseases. Patients with groups 2 and 3 PH, whose PH can be explained by left heart disease or lung disease, do not necessarily require RHC or extensive evaluation for other etiologies of PH.2,17 These patients may be monitored while their underlying conditions are managed.
Patients with worsening clinical course or PH that is “out of proportion” to their lung disease or heart disease, however, do require further evaluation, including RHC. “Out of proportion” has not been consistently defined but generally refers to severe PH observed in patients with mild left heart or lung disease.18 More precise terminology and criteria to define patients with out of proportion PH have been proposed.14
Ventilation-perfusion scanning is required in all cases of PH of unknown etiology to evaluate for CTEPH (Group 4 PH). CT angiography, while appropriate to use in testing for acute pulmonary embolism, is not sufficiently sensitive to evaluate for CTEPH. Tests for liver function, HIV, and connective tissue disease may identify conditions associated with Group 1 PH. Ultimately, RHC is required to confirm the diagnosis of PH, given the shortcomings of TTE. A vasodilator study during RHC allows identification of candidates for advanced therapies, such as patients with Group 1 PH.
Management
The prognosis and treatment of PH varies by WHO Group. The hospitalist will often undertake initial management of symptomatic patients (see Table 3). Intravenous loop diuretics will successfully treat peripheral edema and hepatic congestion in all PH patients.20 Due to the possibility of decreased cardiac output or worsened hypotension in some PH groups, patients should be monitored closely during initial diuresis.
All patients with PH should be assessed for hypoxia during rest, ambulation, and sleep during their hospitalization. Supplemental oxygen therapy should be initiated in all patients with evidence of persistent hypoxia (arterial oxygen blood pressure <60 mmHg).20 Vaccination against pneumococcus and influenza should also be performed during the initial hospitalization. Pregnant patients diagnosed with PH require urgent maternal-fetal medicine consultation.
Further management should be guided by the underlying etiology of the PH:17,18
- Group 1 PH. These patients should be evaluated by a pulmonology consultant, if one is available, as they require intense outpatient follow-up with a pulmonologist. Specialized treatment regimens include calcium channel blockers, phosphodiesterase inhibitors, prostanoids, endothelin receptor antagonists, or newly approved guanylate cyclase stimulants. In previously diagnosed patients, these medications should be continued during a patient’s admission unless the medication is clearly causing the patient harm (such as worsening hypotension) or preventing improvement. Many of these patients are placed on chronic anticoagulation with warfarin, with a goal international normalized ratio (INR) of 1.5 to 2.5.
- Group 2 PH. Patients with left heart or valvular dysfunction and PH have a worse prognosis than similar patients without PH. Management of these patients should focus on treating the underlying etiology. Use of prostanoids may be harmful in this patient population.18
- Group 3 PH. Patients whose PH is fully explained by pulmonary disease should be started on continuous oxygen therapy to treat persistent hypoxemia, and their underlying disorder should be treated, with pulmonologist consultation and referral if necessary.
- Group 4 PH. Patients with newly diagnosed CTEPH should be initiated on warfarin with a goal INR of 2.0 to 3.0. They should undergo evaluation by a pulmonologist for thromboendarterectomy and possibly advanced medical therapies.
- Group 5 PH. Patients with sarcoidosis as the cause of their PH may benefit from prostanoid or endothelin receptor antagonist therapy and should undergo evaluation by a pulmonologist.21,22
Patients with sickle cell anemia, metabolic disorders, and other causes should undergo further subspecialist evaluation prior to initiating therapy to treat their PH.
Back to the Case
The patient underwent diuresis with intravenous furosemide over several days, with gradual improvement in her lower extremity edema and dyspnea. She was placed on oxygen therapy for persistent hypoxemia. As her highly elevated pulmonary artery pressure appeared to be “out of proportion” to her mild left ventricular diastolic dysfunction, further evaluation was pursued. Ventilation-perfusion scanning was performed and showed no mismatch of perfusion and ventilation, effectively ruling out CTEPH. Liver function, HIV, and connective tissue disease testing yielded unremarkable results.
The patient was euvolemic after one week of diuresis and was discharged home with plans for PH specialist follow-up, polysomnography to evaluate for sleep-disordered breathing, and likely RHC. The etiology of her PH was not clear at discharge.
Bottom Line
Evaluation of PH is a step-wise process that starts with history and physical exam and may require extensive evaluation, including right heart catheterization to confirm the diagnosis and define the etiology. A primary goal of evaluation is to define the appropriate therapy for a given patient, which may include advanced therapies in some cases.
Dr. Griffith is a quality improvement fellow and instructor of medicine in the Hospital Medicine Division at the University of Colorado Denver. Drs. McFarland and Smolkin are hospitalists and instructors of medicine at the University of Colorado Denver.
References
- von Romberg E. Über sklerose der lungenarterie. Dtsch Arch Klin Med. 1891;48:197-206.
- Hoeper MM, Bogaard HJ, Condliffe R, et al. Definitions and diagnosis of pulmonary hypertension. J Am Coll Cardiol. 2013;62(25 Suppl):D42-D50.
- Simonneau G, Gatzoulis MA, Adatia I, et al. Updated clinical classification of pulmonary hypertension. J Am Coll Cardiol. 2013;62(25 Suppl):D34-D41.
- Rich S, Rubin L, Abenhail L, et al. Executive summary from the World Symposium on primary pulmonary hypertension. Evian, France: The World Health Organization; 1998.
- Newman JH, Wheeler L, Lane KB, et al. Mutation in the gene for bone morphogenetic protein receptor II as a cause of primary pulmonary hypertension in a large kindred. New Engl J Med. 2001;345(5):319-24.'
- Petitpretz P, Brenot F, Azarian R, et al. Pulmonary hypertension in patients with human immunodeficiency virus infection. Comparison with primary pulmonary hypertension. Circulation. 1994;89(6):2722-2727.
- Gladwin MT, Vichinsky E. Pulmonary complications of sickle cell disease. New Engl J Med. 2008;359(21):2254-2265.
- Wigley FM, Lima JA, Mayes M, McLain D, Chapin JL, Ward-Able C. The prevalence of undiagnosed pulmonary arterial hypertension in subjects with connective tissue disease at the secondary health care level of community-based rheumatologists (the UNCOVER study). Arthritis Rheum. 2005;52(7):2125-2132.
- Ramsay MA, Simpson BR, Nguyen AT, Ramsay KJ, East C, Klintmalm GB. Severe pulmonary hypertension in liver transplant candidates. Liver Transpl Surg. 1997;3(5):494-500.
- Kessler R, Faller M, Weitzenblum E, et al. “Natural history” of pulmonary hypertension in a series of 131 patients with chronic obstructive lung disease. Am J Respir Crit Care Med. 2001;164(2):219-24.
- Chaouat A, Bugnet AS, Kadaoui N, et al. Severe pulmonary hypertension and chronic obstructive pulmonary disease. Am J Respir Crit Care Med. 2005;172(2):189-94.
- Thabut G, Dauriat G, Stern JB, et al. Pulmonary hemodynamics in advanced COPD candidates for lung volume reduction surgery or lung transplantation. Chest. 2005;127(5):1531-1536.
- Yamakawa H, Shiomi T, Sasanabe R, et al. Pulmonary hypertension in patients with severe obstructive sleep apnea. Psychiatry Clin Neurosci. 2002;56(3):311-312.
- Vachiery JL, Adir Y, Barberà JA, et al. Pulmonary hypertension due to left heart diseases. J Am Coll Cardiol. 2013;62(25 Suppl):D100-D108.
- McGoon M, Gutterman D, Steen V, et al. Screening, early detection, and diagnosis of pulmonary arterial hypertension: ACCP evidence-based clinical practice guidelines. Chest. 2004;126(1 Suppl):14S-34S.
- Grünig E, Barner A, Bell M, et al. Non-invasive diagnosis of pulmonary hypertension: ESC/ERS Guidelines with Updated Commentary of the Cologne Consensus Conference 2011. Int J Cardiol. 2011;154 Suppl 1:S3-12.
- Galiè N, Hoeper MM, Humbert M, et al. Guidelines for the diagnosis and treatment of pulmonary hypertension: the Task Force for the Diagnosis and Treatment of Pulmonary Hypertension of the European Society of Cardiology (ESC) and the European Respiratory Society (ERS), endorsed by the International Society of Heart and Lung Transplantation (ISHLT). Eur Heart J. 2009;30(20):2493-2537.
- McLaughlin VV, Archer SL, Badesch DB, et al. ACCF/AHA 2009 expert consensus document on pulmonary hypertension: a report of the American College of Cardiology Foundation Task Force on Expert Consensus Documents and the American Heart Association: developed in collaboration with the American College of Chest Physicians, American Thoracic Society, Inc., and the Pulmonary Hypertension Association. Circulation. 2009;119(16):2250-2294.
- Brown K, Gutierrez AJ, Mohammed TL, et al. ACR Appropriateness Criteria(R) pulmonary hypertension. J Thorac Imaging. 2013;28(4):W57-60.
- Galiè N, Corris PA, Frost A, et al. Updated treatment algorithm of pulmonary arterial hypertension. J Am Coll Cardiol. 2013;62(25 Suppl):D60-72.
- Fisher KA, Serlin DM, Wilson KC, Walter RE, Berman JS, Farber HW. Sarcoidosis-associated pulmonary hypertension: outcome with long-term epoprostenol treatment. Chest. 2006;130(5):1481-1488.
- Steiner MK, Preston IR, Klinger JR, et al. Conversion to bosentan from prostacyclin infusion therapy in pulmonary arterial hypertension: a pilot study. Chest. 2006;130(5):1471-1480.
Your postop patient is confused and agitated—next steps?
› Conduct a baseline cognitive assessment during your patient’s routine visits and preoperative assessments to gauge his or her risk for delirium. A
› Work with the hospital team to implement nonpharmacologic interventions, such as reorienting the patient to day and time and avoiding sensory deprivation, as an initial treatment for delirium. B
Strength of recommendation (SOR)
A Good-quality patient-oriented evidence
B Inconsistent or limited-quality patient-oriented evidence
C Consensus, usual practice, opinion, disease-oriented evidence, case series
CASE › Your patient, Mark Q, age 80, is admitted to the hospital to undergo hemicolectomy for colon cancer. His medical history includes hypertension, benign prostatic hyperplasia, and colon cancer. He did well immediately postop, but when you make morning rounds the day after his surgery, you notice that he is confused and agitated. Mr. Q’s chart reveals that earlier that morning, he pulled out his Foley catheter and intravenous (IV) line when his nurse declined his request to walk him to the bathroom.
How would you proceed?
Up to 50% of older adults who undergo surgical procedures develop delirium—a disturbance in attention and awareness accompanied by changes in cognition.1 Older adults are at heightened risk for this postoperative complication for several reasons. For one thing, older patients have a reduced capacity for homeostatic regulation when they undergo anesthesia and surgery.2 For another, age-related changes in brain neurochemistry and drug metabolism increase the likelihood of adverse drug effects, including those that could precipitate delirirum.3
Although postop delirium is a common complication in older patients, it sometimes goes unrecognized. Missed or delayed diagnosis of delirium can result in patients exhibiting behaviors that can compromise their safety, delay recuperation, and result in longer hospital stays, a greater financial burden, and increased morbidity and mortality.4 The American Geriatric Society recently published clinical guidelines and a best practices statement for preventing and treating postop delirium in patients ages >65 years.1,5 This article describes steps family physicians can take to assess their patients’ risk of delirium before they undergo surgery, and to recognize and treat delirium in the postop period.
Defining delirium
According to the American Psychiatric Association’s Diagnostic and Statistical Manual of Mental Disorders, 5th edition (DSM-5), the criteria for delirium are:6
A. A disturbance in attention (ie, reduced ability to direct, focus, sustain, and shift attention) and awareness (reduced orientation to the environment).
B. The disturbance develops over a short time (usually hours to a few days), represents a change from baseline attention and awareness, and tends to fluctuate in severity during the course of a day.
C. An additional disturbance in cognition (eg, memory deficits, disorientation, language, visuospatial ability, perception).
D. The disturbances in attention, awareness, and cognition aren’t better explained by another preexisting or evolving neurocognitive disorder and don’t occur in the context of a severely reduced level of arousal.
E. History, physical, or laboratory findings show that the disturbance is caused by the direct physiologic consequences of a general medical condition, substance intoxication/withdrawal, exposure to a toxin, or multiple etiologies.
The 3 subtypes of delirium are based on patients’ psychomotor activity.7 In hyperactive delirium, patients exhibit heightened arousal, restlessness, agitation, hallucinations, and inappropriate behavior. Hypoactive delirium is characterized by lethargy, reduced motor activity, incoherent speech, and lack of interest. Mixed delirium consists of a combination of hyperactive and hypoactive signs and symptoms.
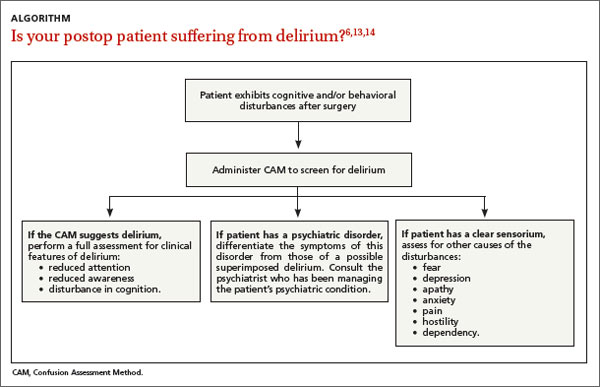
Gauge risk before patients undergo surgery
Family physicians can assess their patients’ risk for developing delirium by conducting baseline screening during routine office visits as well as during preoperative evaluations. Factors that increase postop delirium risk include:1
• age >65 years
• dementia
• poor vision
• decreased hearing
• severe illness
• infection.
Routine cognitive screening can be done easily and efficiently using readily available tools such as the Alzheimer Association’s Cognitive Assessment Toolkit.8 This toolkit includes 3 brief, validated screening tools to identify patients with probable cognitive impairment: the General Practitioner Assessment of Cognition, the Memory Impairment Screen, and the Mini-Cog.
If preop screening indicates that the patient is at increased risk for delirium, the family physician should work with hospital’s interdisciplinary teams to institute prevention measures, such as the Hospital Elder Life Program (HELP).9 This program offers a structured curriculum for instructing volunteers to deliver daily orientation, early mobilization, feeding assistance, therapeutic activities, and other measures to help prevent delirium.
Prompt screening after surgery is essential, too
In addition to preop delirium risk assessment, all patients who undergo surgery should receive daily delirium screening during the first postoperative week. The Confusion Assessment Method (CAM) is a quick screening tool for assessing a patient’s level of arousal and consciousness.10 Based on the results of 7 high-quality studies (N=1071), CAM has a sensitivity of 94% (95% confidence interval [CI], 91%-97%) and specificity of 89% (95% CI, 85%-94%).11,12
Feature 1 of CAM, “Acute onset and fluctuating course,” requires that you compare the patient’s current mental status to his or her pre-hospital baseline mental status; the baseline status should be obtained from a family member, caretaker, or clinician who has observed the patient over time.10 This is intended to determine if the patient has experienced an acute change in mental status (eg, attention, orientation, cognition), usually over the course of hours to days.10 Feature 2, “Inattention,” is used to determine if the patient has a reduced ability to maintain attention to external stimuli and to appropriately shift attention to new external stimuli, and if the patient is unaware or out of touch with the environment.10 Feature 3, “Disorganized thinking,” is used to assess the patient’s organization of thought as expressed by speech or writing. Disorganized thinking typically manifests as rambling and irrelevant or incoherent speech.10 Feature 4, “Altered level of consciousness,” is used to rate the patient’s alertness level.10
A positive screen for delirium requires the presence of Feature 1 (acute onset and/or fluctuation) and Feature 2, plus either Feature 3 or Feature 4.
Is delirium—or something else—at work?
If an older adult is exhibiting cognitive and/or behavioral disturbances after undergoing surgery, it’s important to discern if these manifestations are the result of delirium, a preexisting psychiatric disorder, or some other cause if the patient has a clear sensorium (ALGORITHM).6,13,14
Delirium. If a patient’s CAM screen suggests delirium, conduct a thorough assessment for the signs and symptoms of delirium to determine if the patient meets DSM-5 criteria for the diagnosis.1 In order to avoid missing hypoactive, subtle, or atypical cases of delirium, conduct a thorough medical record and medications review, and gather assessments from the nursing staff and other team members regarding the patient’s behavior.
Preexisting psychiatric disorder. It’s important to differentiate psychiatric symptoms from those of a superimposed delirium.13 Because patients with preoperative depressive symptoms may be at increased risk for postop delirium, pre-surgical psychiatric evaluations are important for identifying even subtle psychopathological symptoms.15 (The psychiatric interview is the gold standard for diagnosis.16) For patients who have an established psychiatric diagnosis, consider consulting with the psychiatrist who is managing the patient’s psychiatric care.13
Other causes. If a patient who is exhibiting postop cognitive and/or behavioral disturbances has a reasonably accurate memory and a correct orientation for time, place, and person, interviews with the patient and caregivers (along with the psychiatric interview) will likely reveal potential causes for the behavioral problems.13
Is the patient suffering from dehydration? Drug withdrawal?
Assessment for an underlying organic cause must be performed because specific treatment for the underlying diagnosis may improve delirium.17 Common causes include hypoxia, infection, dehydration, acute metabolic disturbance, endocrinopathies, cardiac or vascular disorders, and drug withdrawal.13 An appropriate diagnostic work-up might consist of serum urea, glucose, electrolytes, liver function tests, arterial blood gas analyses, urinalysis, nutritional evaluation, electrocardiogram, and a complete blood count.
Ask patients about their use of alcohol and benzodiazepines, and consider alcohol or drug withdrawal as potential etiologies.18 Patients with delirium should also be assessed for iatrogenic hospital-related factors that could be causing or contributing to the condition, such as immobilization or malnutrition.13
Medications are a common culprit: Approximately 40% of cases of delirium are related to medication use.18 Commonly used postop medications such as analgesics, sedatives, proton pump inhibitors, and others can cause delirium.19 Carefully review the patient’s medication list.13 Medication-induced delirium is influenced by the number of medications taken (generally >3),20 the use of psychoactive medications,21 and the specific agent's anticholinergic potential.22 The 2012 updated Beers Criteria (American Geriatrics Society) is a useful resource for determining if “inappropriate polypharmacy” is the cause of postop delirium.23
Inadequate pain control. In a multisite trial,24 patients who received <10 mg/d of parenteral morphine sulfate equivalents were more likely to develop delirium than patients who received more analgesia. In cognitively intact patients, severe pain significantly increased the risk of delirium. With the exception of meperidine, opioids do not precipitate delirium in patients with acute pain.24 Not treating pain or administering very low—or excessively high—doses of opioids is associated with an increased risk of delirium for both cognitively intact and impaired patients.24
Constipation can contribute to the development of delirium.25 After surgery, patients tend to be less mobile and may be receiving medications that can cause constipation, such as opioids, iron, calcium, and channel blockers. Preventing and treating constipation in postop patients can reduce delirium risk.25
Begin treatment with nonpharmacologic measures
Regardless of whether a patient suffers from hyperactive, hypoactive, or mixed delirium, nonpharmacologic interventions are firstline treatment.19 Such interventions can help patients develop a sense of control over their environment, which can help relieve agitation.13 Because environmental shifts contribute to the development of delirium, avoiding transfers and securing a single room can be helpful.19 Patients with delirium have altered perceptions, and may view normal objects and routine clinician actions as harmful and threatening. Therefore, it is helpful to avoid sensory deprivation by making sure patients have access to their eyeglasses and hearing aids, and to provide nonthreatening cognitive/environmental stimulation.1,13,19 Patients should be encouraged to resume walking as soon as possible.1,19 Other nonpharmacologic interventions are listed in the TABLE.1,13,19
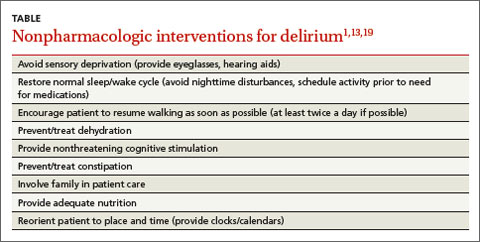
Safety issues must also be addressed.17 Patients with mixed or hyperactive delirium may become agitated, which can lead them to pull tubes, drains, or lines, as occurred with Mr. Q. Patients with hypoactive delirium may be prone to wandering, or receive less attention due to their hypoactive state.17 All patients with delirium are at risk of falls.
Patients should be evaluated for these risks to determine whether assigning a "sitter" or transfer to a stepdown unit or intensive care unit is warranted.17 Restraints are not recommended because they can exacerbate delirium and lead to injuries.26
Pharmacologic treatment should be reserved for patients whose behavior compromises their safety, and implemented only when the cause of the delirium is known. The primary objectives of drug therapy are to achieve and maintain safe and rapid behavioral control so the patient can receive necessary medical care, and to enhance functional recovery.14 The choice of a specific medication is individualized and depends on each patient’s clinical condition.14
For a patient with hyperactive delirium, an antipsychotic typically is the treatment of choice because these medications are dopamine receptor antagonists, and excessive dopamine transmission has been implicated in this type of delirium.27 Haloperidol often is the preferred treatment; a low-dose oral form is recommended for older patients who exhibit severe agitation because there is less risk of QT prolongation compared to IV administration.28
Second-generation antipsychotics (eg, risperidone, olanzapine, and quetiapine) are increasingly used due to their lower risk for adverse extrapyramidal symptoms, which are common in older patients.29-31 Despite this, increasing data show that morbidity with these agents may be underestimated, and the risks of adverse effects may vary among the medications in this class.32
For hypoactive or mixed delirium, nonpharmacologic interventions should be the mainstay of treatment. When medications are used, they should be used to target the underlying etiology of delirium (eg, treating a urinary tract infection with an antibiotic).33
A few final words about medication use for delirium ... Most medications that modify symptoms of delirium can actually prolong the delirium.33 Therefore, it's important to carefully consider the balance between effectively managing symptoms and causing adverse effects. Because older adults have increased sensitivity to medications, always start with small dosages and titrate to effect.34 Benzodiazepines and other hypnotics should be avoided in older patients, except when treating alcohol or benzodiazepine withdrawal.35
CASE › Mr. Q’s postop delirium screen is positive, and assessment for underlying causes reveals that he is suffering from postoperative pain and is constipated. Due to roommate noise and insomnia, he is transferred to a private room, where quiet times are observed. He receives oxycodone 5 mg every 4 hours for his pain and senna 30 mg at bedtime and a bisacodyl rectal suppository 10 mg/d for constipation. After 3 days Mr. Q’s postop pain and delirium resolves, and he is discharged home.
CORRESPONDENCE
Jackson Ng, MD, Teresa Lang Research Center, New York Hospital Queens, 56-45 Main St., Flushing, NY 11355; [email protected]
1. American Geriatrics Society Expert Panel on Postoperative Delirium in Older Adults. Postoperative delirium in older adults: best practice statement from the American Geriatrics Society. J Am Coll Surg. 2015;220:136-148.
2. Rivera R, Antognini JF. Perioperative drug therapy in elderly patients. Anesthesiology. 2009;110:1176-1181.
3. O’Keeffe ST, Ní Chonchubhair A. Postoperative delirium in the elderly. Br J Anaesth. 1994;73:673-687.
4. Mangnall LT, Gallagher R, Stein-Parbury J. Postoperative delirium after colorectal surgery in older patients. Am J Crit Care. 2011;20:45-55.
5. American Geriatrics Society. American Geriatrics Society Clinical Practice Guideline for Postoperative Delirium in Older Adults: November 2014. American Geriatrics Society Web site. Available at: http://geriatricscareonline.org/ProductAbstract/americangeriatrics-society-clinical-practice-guideline-for-postoperativedelirium-in-older-adults/CL018. Accessed April 7, 2015.
6. American Psychiatric Association. Diagnostic and Statistical Manual of Mental Disorders. 5th ed. Arlington, VA: American Psychiatric Publishing: 2013.
7. Potter J, George J; Guideline Development Group. The prevention, diagnosis and management of delirium in older people: concise guidelines. Clin Med. 2006;6:303-308.
8. Alzheimer’s Association. Cognitive Assessment Toolkit: A guide to detect cognitive impairment quickly and efficiently during the Medicare Annual Wellness Visit. 1999. Alzheimer’s Association Web site. Available at: http://www.alz.org/documents_custom/The%20Cognitive%20Assessment%20Toolkit%20Copy_v1.pdf. Accessed April 6, 2015.
9. The Hospital Elder Life Program. Hospital Elder Life Program (HELP) for Prevention of Delirium. The Hospital Elder Life Program Web site. Available at: http://www.hospitalelderlifeprogram.org. Accessed April 9, 2015.
10. Inouye SK, van Dyck CH, Alessi CA, Balkin S, Siegal AP, Horwitz RI. Clarifying confusion: the confusion assessment method. A new method for detection of delirium. Ann Intern Med. 1990;113:941-948.
11. Wei LA, Fearing MA, Sternberg EJ, et al. The Confusion Assessment Method: a systematic review of current usage. J Am Geriatr Soc. 2008;56:823-830.
12. Pisani MA, Araujo KL, Van Ness PH, et al. A research algorithm to improve detection of delirium in the intensive care unit. Crit Care. 2006;10:R121.
13. Simon L, Jewell N, Brokel J. Management of acute delirium in hospitalized elderly: a process improvement project. Geriatr Nurs. 1997;18:150-154.
14. Fish DN. Treatment of delirium in the critically ill patient. Clin Pharm. 1991;10:456-466.
15. Böhner H, Hummel TC, Habel U, et al. Predicting delirium after vascular surgery: a model based on pre- and intraoperative data. Ann Surg. 2003;238:149-156.
16. Nordgaard J, Sass LA, Parnas J. The psychiatric interview: validity, structure, and subjectivity. Eur Arch Psychiatry Clin Neurosci. 2013;263:353-364.
17. Robinson TN, Eiseman B. Postoperative delirium in the elderly: diagnosis and management. Clin Interven Aging. 2008;3:351-355.
18. Demeure MJ, Fain MJ. The elderly surgical patient and postoperative delirium. J Am Coll Surg. 2006;203:752-757.
19. Ghandour A, Saab R, Mehr DR. Detecting and treating delirium—key interventions you may be missing. J Fam Pract. 2011;60:726-734.
20. Inouye SK, Charpentier PA. Precipitating factors for delirium in hospitalized elderly persons. Predictive model and interrelationship with baseline vulnerability. JAMA. 1996;275:852-857.
21. Gaudreau JD, Gagnon P, Roy MA, et al. Association between psychoactive medications and delirium in hospitalized patients: a critical review. Psychosomatics. 2005;46:302-316.
22. Tune L, Carr S, Cooper T, et al. Association of anticholinergic activity of prescribed medications with postoperative delirium. J Neuropsychiatry Clin Neurosci. 1993;5:208-210.
23. Hitzeman N, Belsky K. Appropriate use of polypharmacy for older patients. Am Fam Physician. 2013;87:483-484.
24. Morrison RS, Magaziner J, Gilbert M, et al. Relationship between pain and opioid analgesics on the development of delirium following hip fracture. J Gerontol A Biol Sci Med Sci. 2003;58:76-81.
25. Ross DD, Alexander CS. Management of common symptoms in terminally ill patients: Part II. Constipation, delirium, and dyspnea. Am Fam Physician. 2001;64:1019-1027.
26. Practice guideline for the treatment of patients with delirium. American Psychiatric Association. Am J Psychiatry. 1999;156:1-20.
27. Mantz J, Hemmings HC, Boddaert J. Case scenario: postoperative delirium in elderly surgical patients. Anesthesiology. 2010;112:189-195.
28. Gleason OC. Delirium. Am Fam Physician. 2003;67:1027-1034.
29. Pae CU, Lee SJ, Lee CU, et al. A pilot trial of quetiapine for the treatment of patients with delirium. Hum Psychopharmacol. 2004;19:125-127.
30. Schwartz TL, Masand PS. The role of atypical antipsychotics in the treatment of delirium. Psychosomatics. 2002;43:171-174.
31. Skrobik YK, Bergeron N, Dumont M, et al. Olanzapine vs haloperidol: treating delirium in a critical care setting. Intensive Care Med. 2004;30:444-449.
32. Kohen I, Lester PE, Lam S. Antipsychotic treatments for the elderly: efficacy and safety of aripiprazole. Neuropsychiatr Dis Treat. 2010;6:47-58.
33. Farrell TW, Dosa D. The assessment and management of hypoactive delirium. Geriatrics for the Practicing Physician. 2007;90:393-395.
34. Rivera R, Antognini JF. Perioperative drug therapy in elderly patients. Anesthesiology. 2009;110:1176-1181.
35. Alagiakrishnan K, Wiens CA. An approach to drug induced delirium in the elderly. Postgrad Med J. 2004;80:388-393.
› Conduct a baseline cognitive assessment during your patient’s routine visits and preoperative assessments to gauge his or her risk for delirium. A
› Work with the hospital team to implement nonpharmacologic interventions, such as reorienting the patient to day and time and avoiding sensory deprivation, as an initial treatment for delirium. B
Strength of recommendation (SOR)
A Good-quality patient-oriented evidence
B Inconsistent or limited-quality patient-oriented evidence
C Consensus, usual practice, opinion, disease-oriented evidence, case series
CASE › Your patient, Mark Q, age 80, is admitted to the hospital to undergo hemicolectomy for colon cancer. His medical history includes hypertension, benign prostatic hyperplasia, and colon cancer. He did well immediately postop, but when you make morning rounds the day after his surgery, you notice that he is confused and agitated. Mr. Q’s chart reveals that earlier that morning, he pulled out his Foley catheter and intravenous (IV) line when his nurse declined his request to walk him to the bathroom.
How would you proceed?
Up to 50% of older adults who undergo surgical procedures develop delirium—a disturbance in attention and awareness accompanied by changes in cognition.1 Older adults are at heightened risk for this postoperative complication for several reasons. For one thing, older patients have a reduced capacity for homeostatic regulation when they undergo anesthesia and surgery.2 For another, age-related changes in brain neurochemistry and drug metabolism increase the likelihood of adverse drug effects, including those that could precipitate delirirum.3
Although postop delirium is a common complication in older patients, it sometimes goes unrecognized. Missed or delayed diagnosis of delirium can result in patients exhibiting behaviors that can compromise their safety, delay recuperation, and result in longer hospital stays, a greater financial burden, and increased morbidity and mortality.4 The American Geriatric Society recently published clinical guidelines and a best practices statement for preventing and treating postop delirium in patients ages >65 years.1,5 This article describes steps family physicians can take to assess their patients’ risk of delirium before they undergo surgery, and to recognize and treat delirium in the postop period.
Defining delirium
According to the American Psychiatric Association’s Diagnostic and Statistical Manual of Mental Disorders, 5th edition (DSM-5), the criteria for delirium are:6
A. A disturbance in attention (ie, reduced ability to direct, focus, sustain, and shift attention) and awareness (reduced orientation to the environment).
B. The disturbance develops over a short time (usually hours to a few days), represents a change from baseline attention and awareness, and tends to fluctuate in severity during the course of a day.
C. An additional disturbance in cognition (eg, memory deficits, disorientation, language, visuospatial ability, perception).
D. The disturbances in attention, awareness, and cognition aren’t better explained by another preexisting or evolving neurocognitive disorder and don’t occur in the context of a severely reduced level of arousal.
E. History, physical, or laboratory findings show that the disturbance is caused by the direct physiologic consequences of a general medical condition, substance intoxication/withdrawal, exposure to a toxin, or multiple etiologies.
The 3 subtypes of delirium are based on patients’ psychomotor activity.7 In hyperactive delirium, patients exhibit heightened arousal, restlessness, agitation, hallucinations, and inappropriate behavior. Hypoactive delirium is characterized by lethargy, reduced motor activity, incoherent speech, and lack of interest. Mixed delirium consists of a combination of hyperactive and hypoactive signs and symptoms.
Gauge risk before patients undergo surgery
Family physicians can assess their patients’ risk for developing delirium by conducting baseline screening during routine office visits as well as during preoperative evaluations. Factors that increase postop delirium risk include:1
• age >65 years
• dementia
• poor vision
• decreased hearing
• severe illness
• infection.
Routine cognitive screening can be done easily and efficiently using readily available tools such as the Alzheimer Association’s Cognitive Assessment Toolkit.8 This toolkit includes 3 brief, validated screening tools to identify patients with probable cognitive impairment: the General Practitioner Assessment of Cognition, the Memory Impairment Screen, and the Mini-Cog.
If preop screening indicates that the patient is at increased risk for delirium, the family physician should work with hospital’s interdisciplinary teams to institute prevention measures, such as the Hospital Elder Life Program (HELP).9 This program offers a structured curriculum for instructing volunteers to deliver daily orientation, early mobilization, feeding assistance, therapeutic activities, and other measures to help prevent delirium.
Prompt screening after surgery is essential, too
In addition to preop delirium risk assessment, all patients who undergo surgery should receive daily delirium screening during the first postoperative week. The Confusion Assessment Method (CAM) is a quick screening tool for assessing a patient’s level of arousal and consciousness.10 Based on the results of 7 high-quality studies (N=1071), CAM has a sensitivity of 94% (95% confidence interval [CI], 91%-97%) and specificity of 89% (95% CI, 85%-94%).11,12
Feature 1 of CAM, “Acute onset and fluctuating course,” requires that you compare the patient’s current mental status to his or her pre-hospital baseline mental status; the baseline status should be obtained from a family member, caretaker, or clinician who has observed the patient over time.10 This is intended to determine if the patient has experienced an acute change in mental status (eg, attention, orientation, cognition), usually over the course of hours to days.10 Feature 2, “Inattention,” is used to determine if the patient has a reduced ability to maintain attention to external stimuli and to appropriately shift attention to new external stimuli, and if the patient is unaware or out of touch with the environment.10 Feature 3, “Disorganized thinking,” is used to assess the patient’s organization of thought as expressed by speech or writing. Disorganized thinking typically manifests as rambling and irrelevant or incoherent speech.10 Feature 4, “Altered level of consciousness,” is used to rate the patient’s alertness level.10
A positive screen for delirium requires the presence of Feature 1 (acute onset and/or fluctuation) and Feature 2, plus either Feature 3 or Feature 4.
Is delirium—or something else—at work?
If an older adult is exhibiting cognitive and/or behavioral disturbances after undergoing surgery, it’s important to discern if these manifestations are the result of delirium, a preexisting psychiatric disorder, or some other cause if the patient has a clear sensorium (ALGORITHM).6,13,14
Delirium. If a patient’s CAM screen suggests delirium, conduct a thorough assessment for the signs and symptoms of delirium to determine if the patient meets DSM-5 criteria for the diagnosis.1 In order to avoid missing hypoactive, subtle, or atypical cases of delirium, conduct a thorough medical record and medications review, and gather assessments from the nursing staff and other team members regarding the patient’s behavior.
Preexisting psychiatric disorder. It’s important to differentiate psychiatric symptoms from those of a superimposed delirium.13 Because patients with preoperative depressive symptoms may be at increased risk for postop delirium, pre-surgical psychiatric evaluations are important for identifying even subtle psychopathological symptoms.15 (The psychiatric interview is the gold standard for diagnosis.16) For patients who have an established psychiatric diagnosis, consider consulting with the psychiatrist who is managing the patient’s psychiatric care.13
Other causes. If a patient who is exhibiting postop cognitive and/or behavioral disturbances has a reasonably accurate memory and a correct orientation for time, place, and person, interviews with the patient and caregivers (along with the psychiatric interview) will likely reveal potential causes for the behavioral problems.13
Is the patient suffering from dehydration? Drug withdrawal?
Assessment for an underlying organic cause must be performed because specific treatment for the underlying diagnosis may improve delirium.17 Common causes include hypoxia, infection, dehydration, acute metabolic disturbance, endocrinopathies, cardiac or vascular disorders, and drug withdrawal.13 An appropriate diagnostic work-up might consist of serum urea, glucose, electrolytes, liver function tests, arterial blood gas analyses, urinalysis, nutritional evaluation, electrocardiogram, and a complete blood count.
Ask patients about their use of alcohol and benzodiazepines, and consider alcohol or drug withdrawal as potential etiologies.18 Patients with delirium should also be assessed for iatrogenic hospital-related factors that could be causing or contributing to the condition, such as immobilization or malnutrition.13
Medications are a common culprit: Approximately 40% of cases of delirium are related to medication use.18 Commonly used postop medications such as analgesics, sedatives, proton pump inhibitors, and others can cause delirium.19 Carefully review the patient’s medication list.13 Medication-induced delirium is influenced by the number of medications taken (generally >3),20 the use of psychoactive medications,21 and the specific agent's anticholinergic potential.22 The 2012 updated Beers Criteria (American Geriatrics Society) is a useful resource for determining if “inappropriate polypharmacy” is the cause of postop delirium.23
Inadequate pain control. In a multisite trial,24 patients who received <10 mg/d of parenteral morphine sulfate equivalents were more likely to develop delirium than patients who received more analgesia. In cognitively intact patients, severe pain significantly increased the risk of delirium. With the exception of meperidine, opioids do not precipitate delirium in patients with acute pain.24 Not treating pain or administering very low—or excessively high—doses of opioids is associated with an increased risk of delirium for both cognitively intact and impaired patients.24
Constipation can contribute to the development of delirium.25 After surgery, patients tend to be less mobile and may be receiving medications that can cause constipation, such as opioids, iron, calcium, and channel blockers. Preventing and treating constipation in postop patients can reduce delirium risk.25
Begin treatment with nonpharmacologic measures
Regardless of whether a patient suffers from hyperactive, hypoactive, or mixed delirium, nonpharmacologic interventions are firstline treatment.19 Such interventions can help patients develop a sense of control over their environment, which can help relieve agitation.13 Because environmental shifts contribute to the development of delirium, avoiding transfers and securing a single room can be helpful.19 Patients with delirium have altered perceptions, and may view normal objects and routine clinician actions as harmful and threatening. Therefore, it is helpful to avoid sensory deprivation by making sure patients have access to their eyeglasses and hearing aids, and to provide nonthreatening cognitive/environmental stimulation.1,13,19 Patients should be encouraged to resume walking as soon as possible.1,19 Other nonpharmacologic interventions are listed in the TABLE.1,13,19
Safety issues must also be addressed.17 Patients with mixed or hyperactive delirium may become agitated, which can lead them to pull tubes, drains, or lines, as occurred with Mr. Q. Patients with hypoactive delirium may be prone to wandering, or receive less attention due to their hypoactive state.17 All patients with delirium are at risk of falls.
Patients should be evaluated for these risks to determine whether assigning a "sitter" or transfer to a stepdown unit or intensive care unit is warranted.17 Restraints are not recommended because they can exacerbate delirium and lead to injuries.26
Pharmacologic treatment should be reserved for patients whose behavior compromises their safety, and implemented only when the cause of the delirium is known. The primary objectives of drug therapy are to achieve and maintain safe and rapid behavioral control so the patient can receive necessary medical care, and to enhance functional recovery.14 The choice of a specific medication is individualized and depends on each patient’s clinical condition.14
For a patient with hyperactive delirium, an antipsychotic typically is the treatment of choice because these medications are dopamine receptor antagonists, and excessive dopamine transmission has been implicated in this type of delirium.27 Haloperidol often is the preferred treatment; a low-dose oral form is recommended for older patients who exhibit severe agitation because there is less risk of QT prolongation compared to IV administration.28
Second-generation antipsychotics (eg, risperidone, olanzapine, and quetiapine) are increasingly used due to their lower risk for adverse extrapyramidal symptoms, which are common in older patients.29-31 Despite this, increasing data show that morbidity with these agents may be underestimated, and the risks of adverse effects may vary among the medications in this class.32
For hypoactive or mixed delirium, nonpharmacologic interventions should be the mainstay of treatment. When medications are used, they should be used to target the underlying etiology of delirium (eg, treating a urinary tract infection with an antibiotic).33
A few final words about medication use for delirium ... Most medications that modify symptoms of delirium can actually prolong the delirium.33 Therefore, it's important to carefully consider the balance between effectively managing symptoms and causing adverse effects. Because older adults have increased sensitivity to medications, always start with small dosages and titrate to effect.34 Benzodiazepines and other hypnotics should be avoided in older patients, except when treating alcohol or benzodiazepine withdrawal.35
CASE › Mr. Q’s postop delirium screen is positive, and assessment for underlying causes reveals that he is suffering from postoperative pain and is constipated. Due to roommate noise and insomnia, he is transferred to a private room, where quiet times are observed. He receives oxycodone 5 mg every 4 hours for his pain and senna 30 mg at bedtime and a bisacodyl rectal suppository 10 mg/d for constipation. After 3 days Mr. Q’s postop pain and delirium resolves, and he is discharged home.
CORRESPONDENCE
Jackson Ng, MD, Teresa Lang Research Center, New York Hospital Queens, 56-45 Main St., Flushing, NY 11355; [email protected]
1. American Geriatrics Society Expert Panel on Postoperative Delirium in Older Adults. Postoperative delirium in older adults: best practice statement from the American Geriatrics Society. J Am Coll Surg. 2015;220:136-148.
2. Rivera R, Antognini JF. Perioperative drug therapy in elderly patients. Anesthesiology. 2009;110:1176-1181.
3. O’Keeffe ST, Ní Chonchubhair A. Postoperative delirium in the elderly. Br J Anaesth. 1994;73:673-687.
4. Mangnall LT, Gallagher R, Stein-Parbury J. Postoperative delirium after colorectal surgery in older patients. Am J Crit Care. 2011;20:45-55.
5. American Geriatrics Society. American Geriatrics Society Clinical Practice Guideline for Postoperative Delirium in Older Adults: November 2014. American Geriatrics Society Web site. Available at: http://geriatricscareonline.org/ProductAbstract/americangeriatrics-society-clinical-practice-guideline-for-postoperativedelirium-in-older-adults/CL018. Accessed April 7, 2015.
6. American Psychiatric Association. Diagnostic and Statistical Manual of Mental Disorders. 5th ed. Arlington, VA: American Psychiatric Publishing: 2013.
7. Potter J, George J; Guideline Development Group. The prevention, diagnosis and management of delirium in older people: concise guidelines. Clin Med. 2006;6:303-308.
8. Alzheimer’s Association. Cognitive Assessment Toolkit: A guide to detect cognitive impairment quickly and efficiently during the Medicare Annual Wellness Visit. 1999. Alzheimer’s Association Web site. Available at: http://www.alz.org/documents_custom/The%20Cognitive%20Assessment%20Toolkit%20Copy_v1.pdf. Accessed April 6, 2015.
9. The Hospital Elder Life Program. Hospital Elder Life Program (HELP) for Prevention of Delirium. The Hospital Elder Life Program Web site. Available at: http://www.hospitalelderlifeprogram.org. Accessed April 9, 2015.
10. Inouye SK, van Dyck CH, Alessi CA, Balkin S, Siegal AP, Horwitz RI. Clarifying confusion: the confusion assessment method. A new method for detection of delirium. Ann Intern Med. 1990;113:941-948.
11. Wei LA, Fearing MA, Sternberg EJ, et al. The Confusion Assessment Method: a systematic review of current usage. J Am Geriatr Soc. 2008;56:823-830.
12. Pisani MA, Araujo KL, Van Ness PH, et al. A research algorithm to improve detection of delirium in the intensive care unit. Crit Care. 2006;10:R121.
13. Simon L, Jewell N, Brokel J. Management of acute delirium in hospitalized elderly: a process improvement project. Geriatr Nurs. 1997;18:150-154.
14. Fish DN. Treatment of delirium in the critically ill patient. Clin Pharm. 1991;10:456-466.
15. Böhner H, Hummel TC, Habel U, et al. Predicting delirium after vascular surgery: a model based on pre- and intraoperative data. Ann Surg. 2003;238:149-156.
16. Nordgaard J, Sass LA, Parnas J. The psychiatric interview: validity, structure, and subjectivity. Eur Arch Psychiatry Clin Neurosci. 2013;263:353-364.
17. Robinson TN, Eiseman B. Postoperative delirium in the elderly: diagnosis and management. Clin Interven Aging. 2008;3:351-355.
18. Demeure MJ, Fain MJ. The elderly surgical patient and postoperative delirium. J Am Coll Surg. 2006;203:752-757.
19. Ghandour A, Saab R, Mehr DR. Detecting and treating delirium—key interventions you may be missing. J Fam Pract. 2011;60:726-734.
20. Inouye SK, Charpentier PA. Precipitating factors for delirium in hospitalized elderly persons. Predictive model and interrelationship with baseline vulnerability. JAMA. 1996;275:852-857.
21. Gaudreau JD, Gagnon P, Roy MA, et al. Association between psychoactive medications and delirium in hospitalized patients: a critical review. Psychosomatics. 2005;46:302-316.
22. Tune L, Carr S, Cooper T, et al. Association of anticholinergic activity of prescribed medications with postoperative delirium. J Neuropsychiatry Clin Neurosci. 1993;5:208-210.
23. Hitzeman N, Belsky K. Appropriate use of polypharmacy for older patients. Am Fam Physician. 2013;87:483-484.
24. Morrison RS, Magaziner J, Gilbert M, et al. Relationship between pain and opioid analgesics on the development of delirium following hip fracture. J Gerontol A Biol Sci Med Sci. 2003;58:76-81.
25. Ross DD, Alexander CS. Management of common symptoms in terminally ill patients: Part II. Constipation, delirium, and dyspnea. Am Fam Physician. 2001;64:1019-1027.
26. Practice guideline for the treatment of patients with delirium. American Psychiatric Association. Am J Psychiatry. 1999;156:1-20.
27. Mantz J, Hemmings HC, Boddaert J. Case scenario: postoperative delirium in elderly surgical patients. Anesthesiology. 2010;112:189-195.
28. Gleason OC. Delirium. Am Fam Physician. 2003;67:1027-1034.
29. Pae CU, Lee SJ, Lee CU, et al. A pilot trial of quetiapine for the treatment of patients with delirium. Hum Psychopharmacol. 2004;19:125-127.
30. Schwartz TL, Masand PS. The role of atypical antipsychotics in the treatment of delirium. Psychosomatics. 2002;43:171-174.
31. Skrobik YK, Bergeron N, Dumont M, et al. Olanzapine vs haloperidol: treating delirium in a critical care setting. Intensive Care Med. 2004;30:444-449.
32. Kohen I, Lester PE, Lam S. Antipsychotic treatments for the elderly: efficacy and safety of aripiprazole. Neuropsychiatr Dis Treat. 2010;6:47-58.
33. Farrell TW, Dosa D. The assessment and management of hypoactive delirium. Geriatrics for the Practicing Physician. 2007;90:393-395.
34. Rivera R, Antognini JF. Perioperative drug therapy in elderly patients. Anesthesiology. 2009;110:1176-1181.
35. Alagiakrishnan K, Wiens CA. An approach to drug induced delirium in the elderly. Postgrad Med J. 2004;80:388-393.

Girl, 5, With Fever and Hip Pain
A 5-year-old Filipino girl was brought to a pediatric clinic for follow up of an unresolved fever and for new-onset right hip pain, which occurred intermittently for the past week and was associated with a right-sided limp. She had been experiencing nightly fevers ranging from 101°F to 105°F for the past two weeks, for which her parents had been giving ibuprofen with mixed results; she remained afebrile during daytime hours.
Using the Wong-Baker FACES pain scale, the patient rated the pain as a 4/10 in severity (“Hurts a Little More” face).1 Standing and walking aggravated the pain but did not limit activity. Although ibuprofen decreased the fever, it did not alleviate the hip pain. Other symptoms included vomiting one to two times daily, without hematemesis, and four to five episodes of diarrhea daily, without abdominal pain, hematochezia, or melena. She also experienced decreased appetite, but her parents reported no change in her dietary or fluid intake. The patient and her parents denied additional symptoms.
Further investigation revealed that the patient had been seen a week earlier by two other clinicians in the office for complaints of fever, rash, nausea, hematemesis, and diarrhea. She had been diagnosed with a herpes simplex viral (HSV) lesion of the nose, epistaxis, and viral gastroenteritis. Her treatment plan consisted of acyclovir ointment for the HSV lesion and symptomatic support for the gastroenteritis associated diarrhea. The complaint of hematemesis was attributed to postnasal drip from the epistaxis, and reassurance was provided to the patient and family. In addition, six weeks earlier, the patient had been treated for otitis media with a full course of amoxicillin.
Medical history was negative for surgeries, trauma, injuries, and chronic medical conditions. She took no medications or supplements on a regular basis. Her parents denied any known drug allergies and stated that her immunizations were up to date.
The patient lived at home with her biological parents and two brothers, all of whom were healthy, without any recent infections or illnesses. Of significance, the family had travelled to the Philippines for vacation about four months earlier. Results of a tuberculin skin test done six weeks earlier (because the patient presented with respiratory symptoms shortly after traveling to the Philippines) were negative.
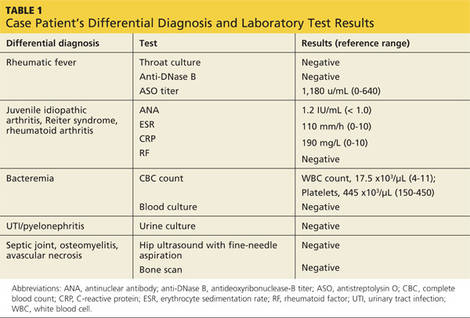
Physical examination revealed a well-developed, well-nourished 40-lb girl, in no acute distress, who was active and playful with her brother while in the exam room. Vital signs were significant for a fever of 101.9°F (last dose of ibuprofen was approximately six hours earlier) but were otherwise stable. Skin exam revealed that the prior HSV lesion of the nose had resolved. HEENT, cardiovascular, and pulmonary exam findings were noncontributory. Urine dipstick was negative.
Abdominal exam revealed normoactive bowel sounds in all four quadrants, and on palpation, the abdomen was soft, nontender, and without organomegaly. Specialized abdominal exams to assess for peritonitis, including those to elicit Rovsing, rebound tenderness, obturator, and psoas signs, were all negative. Bilateral extremity exams of the hips, knees, and ankles revealed full range of motion (active and passive), with normal muscle strength throughout. The only significant finding on the physical exam was mild pain of the right anterior hip at 15° of flexion, appreciated while the patient was supine on the exam table. The patient was also observed pushing off her right lower extremity when climbing onto the exam table, and she skipped down the hall when leaving the exam.
With fever of unknown origin (FUO) and a largely negative history and physical, the working list of differential diagnoses included
• Avascular necrosis
• Bacteremia
• Juvenile idiopathic arthritis
• Osteomyelitis
• Pyelonephritis
• Reiter syndrome
• Rheumatic fever
• Rheumatoid arthritis
• Septic joint
• Urinary tract infection
To begin the diagnostic process, a number of laboratory tests and imaging procedures were ordered. Table 1 presents the results of these studies. A tuberculin skin test was not repeated. While awaiting test results, the patient was started on naproxen oral suspension (125 mg/5 mL; 4 mL bid) for fever and pain control.
Based on findings consistent with an inflammatory pattern, the history of otitis media (of possible streptococcal origin) six weeks prior to this visit, and the elevated ASO titer, the patient was started on penicillin V (250 mg bid) and instructed to return for follow up in two days.
At the follow-up visit, no improvement was noted; the patient continued to experience nightly fevers and hip pain. Rovsing, rebound tenderness, obturator, and psoas signs continued to be negative. Physical examination did, however, reveal a mild abdominal tenderness in the right lower quadrant.
Due to this new finding, an abdominal ultrasound was ordered to screen for appendicitis. Despite the parents’ appropriate concern for the child, misunderstanding about the urgent need to obtain the abdominal ultrasound led to a two-day delay in scheduling the exam. Results of ultrasonography revealed psoas abscess, and the patient was promptly admitted to the pediatric floor of the local hospital.
Continue for discussion >>
DISCUSSION
Psoas abscess is a collection of pus in the iliopsoas compartment, an extraperitoneal space containing the psoas and iliacus muscles.2 It can be life-threatening if the infection progresses to septic shock. Historically, psoas abscesses were a frequent complication of tuberculosis (TB) of the spine; but with modern TB treatment, these abscesses have become rare.2 Paradoxically, increased utilization of CT to evaluate sepsis of unknown etiology has led to a recent increase in the frequency of psoas abscess diagnosis.3
Psoas abscesses are categorized as either primary or secondary, with primary infections originating in the psoas muscle and secondary infections spreading from adjacent organs.2 In 42% to 88% of cases (depending on the study), primary psoas abscesses are caused by the hematogenous spread of Staphylococcus aureus from distant infection sites.2,4,5 The psoas muscle is particularly susceptible to this mode of infection because of its rich vascular supply.6 Children, immunosuppressed adults (ie, patients with diabetes, HIV/AIDS, or renal failure), IV drug users, and patients with a history of trauma to the muscle are most susceptible to developing a primary psoas abscess.2,5
Secondary psoas abscesses are caused by infections involving adjacent structures of the gastrointestinal, urinary, and skeletal systems. They are most frequently associated with intra-abdominal inflammatory processes, with the most common etiology being Crohn disease.5 Secondary psoas abscesses, though more diverse in their bacterial flora, tend to follow certain microbiologic patterns based on the inoculating source; Escherichia coli is the most common pathogen in secondary abscesses caused by gastrointestinal (42%) and urinary (61%) sources, and S aureus the most common (35%) from skeletal origins (ie, osteomyelitis).4,5Mycobacterium tuberculosis is the more frequently found cause in developing countries but should be considered if the patient has recently travelled outside the United States.
Review of the literature suggests that the incidence of methicillin-resistant S aureus (MRSA) as the causative agent of psoas abscesses may be increasing. However, there is a wide variance in the incidence reported, ranging from 1.1% to 12% of confirmed microbial infections.5,7,8
The classic historical presentation of psoas abscess has been described as the triad of back pain, fever, and limp5,6; however, this triad has only been described in approximately 30% of cases.5 The typical presentation consists of flank or lower limb pain (91%), fever (75%), anorexia (46%), and/or weakness (43%).4 Laboratory abnormalities include leukocytosis (67%) and elevated markers of inflammation (eg, erythrocyte sedimentation rate, seen in 73% of cases).4
Imaging via abdominal ultrasound may be helpful to screen for psoas abscess; however, its utility is limited by a low diagnostic yield of 60% or less.2,4 Direct visualization of the retroperitoneal structures, for example, can be problematic due to the presence of bowel gas.9 Abdominal CT is considered the gold standard for the definitive diagnosis of psoas abscess due to its high sensitivity (100%) and specificity (77%); it can also be used simultaneously to guide percutaneous drainage to treat the abscess if needed.7 However, some clinicians prefer abdominal MRI because of its ability to enhance soft-tissue visualization without requiring use of IV contrast.2,4
The approach to treating psoas abscess varies from a strictly antibiotic regimen to percutaneous drainage, and in rare circumstances, open surgical drainage. Antibiotic therapy without drainage or surgical intervention is a sufficient starting point for treatment of abscesses less than 3 cm in size.3
The antibiotic regimen choice depends on the suspected pathogen. In cases of suspected S aureus, empiric antistaphylococcal antibiotics should be initiated while culture results are pending.2,4 Secondary psoas abscesses thought to be derived from a urinary or gastrointestinal source should prompt use of a broader spectrum antibiotic due to the higher probability of gram-negative, anaerobic, or polymicrobial involvement.2,4
Once final culture and sensitivity results are obtained, antibiotic therapy should be modified to target the isolated pathogen(s). Treatment duration is typically six weeks but may vary, depending on serial culture results and the inoculating source.4 Review of the literature reveals that abscesses resulting from skeletal sources have traditionally been treated longer, usually with antibiotics alone, than those from urinary or gastrointestinal sources, which are often treated with the combination of antibiotics and percutaneous drainage.4
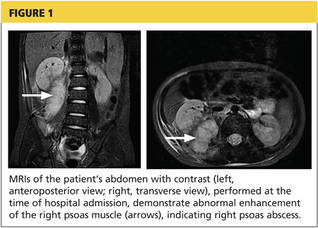
In cases of psoas abscesses larger than 3 cm, management should include both appropriate antibiotics and percutaneous drainage of the abscess.2 Percutaneous drainage is preferred to open surgical drainage because outcomes are similar, it is less invasive, and there is less risk of spreading abscess contents.2-4 In a retrospective analysis by Dietrich et al, 50% of patients treated with antibiotics and percutaneous drainage responded after one drainage, but the success rate increased to 100% after a second drainage.7 In addition, percutaneous drainage was associated with a lower mortality rate and a shorter hospital stay when compared to open surgical drainage.7
Open surgical drainage is rarely performed and usually only considered if the patient is not responding to a combination of focused antibiotic treatment and percutaneous drainage or has associated comorbidities, such as Crohn ileocolitis.2-4 In a retrospective analysis by Tabrizian et al, percutaneous drainage served as a bridge to open surgical drainage in nearly all patients with a gastrointestinal origin, such as Crohn disease, diverticulitis, appendicitis, and/or pancreatitis.6
Treatment of psoas abscesses has an overall failure rate of 15.8%, with an associated mortality rate of less than 7%.4 Overall prognosis is good, but outcomes can be negatively affected by such factors as advanced age, delay in diagnosis, bacteremia, and other comorbidities.4
Next page: Outcome for the case patient >>
OUTCOME FOR THE CASE PATIENT
The patient required an 11-day hospitalization; her day-by-day course is described briefly below.
Day 1. Upon admission, abdominal MRI was ordered (see Figure 1) and empiric piperacillin/tazobactam IV was initiated. C-reactive protein (CRP) level and white blood cell (WBC) counts were elevated (see Table 2). Infectious disease, surgery, and urology consults were obtained.
Day 2. Fine-needle aspiration of the abscess was performed for cultures, and 40 mL of purulent fluid was drained. Piperacillin/tazobactam administration was continued, but the patient experienced ongoing fever and vomiting.
Day 3. Preliminary aspirate culture results revealed S aureus infection. Piperacillin/tazobactam was discontinued, and vancomycin IV was started. CRP levels and WBC counts decreased, as did fever and vomiting.
Day 4. Final aspirate culture results identified MRSA infection, sensitive to clindamycin. Vancomycin was discontinued, and clindamycin IV was started. Although the patient’s condition improved somewhat, fever and vomiting persisted.
Day 5. Both CRP levels and WBC counts increased from day 3. A surgical consult was sought.
Day 6. Repeat abdominal MRI revealed a decrease in the size of the abscess (see Figure 2, page 30. CRP levels and WBC counts remained high, with persistent fever and vomiting.
Day 7. The clinical team, in consultation with the parents, determined that placement of a peripherally inserted central catheter (PICC) line for drainage of the abscess was necessary.
Day 8. A 10-French pigtail catheter was inserted into the abscess, 20 mL of purulent fluid was drained, and a PICC line was inserted. Clindamycin IV was continued and, eight hours after the catheter was placed, fever and vomiting resolved.
Day 9. Both CRP levels and WBC counts dropped by half (WBC count was normal), while 10 mL of clear fluid drained from the catheter. The patient remained afebrile, without nausea or vomiting, on clindamycin IV.
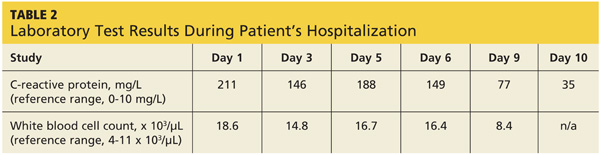
Day 10. After 36 hours of clear drainage, the catheter was removed. CRP level further decreased. Clindamycin IV was discontinued, and the patient, now asymptomatic, was started on oral clindamycin.
Day 11. The patient was discharged on a regimen of oral clindamycin for six weeks, with weekly abdominal ultrasounds. She completed her entire course of antibiotics and fully recovered from the infection.
Next page: Conclusion >>
CONCLUSION
Since children generally compensate well during times of increased stress on the body, it is vital that persistent FUOs continue to be evaluated until a definitive source is identified, especially in this population. Early diagnosis and treatment of psoas abscess is essential for better outcomes, since delay is associated with a greater risk for sepsis.
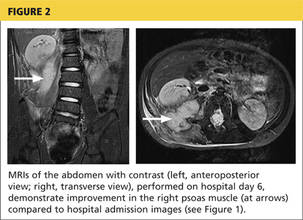
While the likelihood of developing psoas abscess is low, it is worth keeping the diagnosis in mind for cases of unexplained lower abdominal pain, flank pain, or hip pain when more common etiologies have been excluded. This is especially important in the setting of recent travel to a developing country due to the fact that a psoas abscess can be a complication of TB of the spine.
The authors would like to thank Jeff Brand, MD, for his assistance in the preparation of this manuscript.
REFERENCES
1. Wong-Baker Faces Corporation. Wong-Baker FACES Pain Rating Scale. www.wongbakerfaces.org. Accessed May 19, 2015.
2. Mallick IH, Thoufreeq MH, Rajendren TP. Iliopsoas abscesses. Postgrad Med J. 2004;80(946):459-462.
3. Yacoub WN, Sohn HJ, Chan S, et al. Psoas abscess rarely requires surgical intervention. Am J Surg. 2008;196(2):223-227.
4. Lopez VN, Ramos JM, Meseguer V, et al; The Infectious Diseases Study Group of the Spanish Society of Internal Medicine. Microbiology and outcome of iliopsoas abscess in 124 patients. Medicine. 2009;88(2):120-130.
5. Shields D, Robinson P, Crowley TP. Iliopsoas abscess—a review and update on the literature. Int J Surg. 2012;10(9):466-469.
6. Tabrizian P, Nguyen SQ, Greenstein A, et al. Management and treatment of iliopsoas abscess. Arch Surg. 2009;144(10):946-949.
7. Dietrich A, Vaccarezza H, Vaccaro CA. Iliopsoas abscess: presentation, management, and outcomes. Surg Laparosc Endosc Percutan Tech. 2013;23(1):45-48.
8. Wong OF, Ho PL, Lam SK. Retrospective review of clinical presentations, microbiology, and outcomes of patients with psoas abscess. Hong Kong Med J. 2013;19(5):416-423.
9. Woo MY. Psoas abscess. J Emerg Med. 2014;47(5):e129-e130.
A 5-year-old Filipino girl was brought to a pediatric clinic for follow up of an unresolved fever and for new-onset right hip pain, which occurred intermittently for the past week and was associated with a right-sided limp. She had been experiencing nightly fevers ranging from 101°F to 105°F for the past two weeks, for which her parents had been giving ibuprofen with mixed results; she remained afebrile during daytime hours.
Using the Wong-Baker FACES pain scale, the patient rated the pain as a 4/10 in severity (“Hurts a Little More” face).1 Standing and walking aggravated the pain but did not limit activity. Although ibuprofen decreased the fever, it did not alleviate the hip pain. Other symptoms included vomiting one to two times daily, without hematemesis, and four to five episodes of diarrhea daily, without abdominal pain, hematochezia, or melena. She also experienced decreased appetite, but her parents reported no change in her dietary or fluid intake. The patient and her parents denied additional symptoms.
Further investigation revealed that the patient had been seen a week earlier by two other clinicians in the office for complaints of fever, rash, nausea, hematemesis, and diarrhea. She had been diagnosed with a herpes simplex viral (HSV) lesion of the nose, epistaxis, and viral gastroenteritis. Her treatment plan consisted of acyclovir ointment for the HSV lesion and symptomatic support for the gastroenteritis associated diarrhea. The complaint of hematemesis was attributed to postnasal drip from the epistaxis, and reassurance was provided to the patient and family. In addition, six weeks earlier, the patient had been treated for otitis media with a full course of amoxicillin.
Medical history was negative for surgeries, trauma, injuries, and chronic medical conditions. She took no medications or supplements on a regular basis. Her parents denied any known drug allergies and stated that her immunizations were up to date.
The patient lived at home with her biological parents and two brothers, all of whom were healthy, without any recent infections or illnesses. Of significance, the family had travelled to the Philippines for vacation about four months earlier. Results of a tuberculin skin test done six weeks earlier (because the patient presented with respiratory symptoms shortly after traveling to the Philippines) were negative.
Physical examination revealed a well-developed, well-nourished 40-lb girl, in no acute distress, who was active and playful with her brother while in the exam room. Vital signs were significant for a fever of 101.9°F (last dose of ibuprofen was approximately six hours earlier) but were otherwise stable. Skin exam revealed that the prior HSV lesion of the nose had resolved. HEENT, cardiovascular, and pulmonary exam findings were noncontributory. Urine dipstick was negative.
Abdominal exam revealed normoactive bowel sounds in all four quadrants, and on palpation, the abdomen was soft, nontender, and without organomegaly. Specialized abdominal exams to assess for peritonitis, including those to elicit Rovsing, rebound tenderness, obturator, and psoas signs, were all negative. Bilateral extremity exams of the hips, knees, and ankles revealed full range of motion (active and passive), with normal muscle strength throughout. The only significant finding on the physical exam was mild pain of the right anterior hip at 15° of flexion, appreciated while the patient was supine on the exam table. The patient was also observed pushing off her right lower extremity when climbing onto the exam table, and she skipped down the hall when leaving the exam.
With fever of unknown origin (FUO) and a largely negative history and physical, the working list of differential diagnoses included
• Avascular necrosis
• Bacteremia
• Juvenile idiopathic arthritis
• Osteomyelitis
• Pyelonephritis
• Reiter syndrome
• Rheumatic fever
• Rheumatoid arthritis
• Septic joint
• Urinary tract infection
To begin the diagnostic process, a number of laboratory tests and imaging procedures were ordered. Table 1 presents the results of these studies. A tuberculin skin test was not repeated. While awaiting test results, the patient was started on naproxen oral suspension (125 mg/5 mL; 4 mL bid) for fever and pain control.
Based on findings consistent with an inflammatory pattern, the history of otitis media (of possible streptococcal origin) six weeks prior to this visit, and the elevated ASO titer, the patient was started on penicillin V (250 mg bid) and instructed to return for follow up in two days.
At the follow-up visit, no improvement was noted; the patient continued to experience nightly fevers and hip pain. Rovsing, rebound tenderness, obturator, and psoas signs continued to be negative. Physical examination did, however, reveal a mild abdominal tenderness in the right lower quadrant.
Due to this new finding, an abdominal ultrasound was ordered to screen for appendicitis. Despite the parents’ appropriate concern for the child, misunderstanding about the urgent need to obtain the abdominal ultrasound led to a two-day delay in scheduling the exam. Results of ultrasonography revealed psoas abscess, and the patient was promptly admitted to the pediatric floor of the local hospital.
Continue for discussion >>
DISCUSSION
Psoas abscess is a collection of pus in the iliopsoas compartment, an extraperitoneal space containing the psoas and iliacus muscles.2 It can be life-threatening if the infection progresses to septic shock. Historically, psoas abscesses were a frequent complication of tuberculosis (TB) of the spine; but with modern TB treatment, these abscesses have become rare.2 Paradoxically, increased utilization of CT to evaluate sepsis of unknown etiology has led to a recent increase in the frequency of psoas abscess diagnosis.3
Psoas abscesses are categorized as either primary or secondary, with primary infections originating in the psoas muscle and secondary infections spreading from adjacent organs.2 In 42% to 88% of cases (depending on the study), primary psoas abscesses are caused by the hematogenous spread of Staphylococcus aureus from distant infection sites.2,4,5 The psoas muscle is particularly susceptible to this mode of infection because of its rich vascular supply.6 Children, immunosuppressed adults (ie, patients with diabetes, HIV/AIDS, or renal failure), IV drug users, and patients with a history of trauma to the muscle are most susceptible to developing a primary psoas abscess.2,5
Secondary psoas abscesses are caused by infections involving adjacent structures of the gastrointestinal, urinary, and skeletal systems. They are most frequently associated with intra-abdominal inflammatory processes, with the most common etiology being Crohn disease.5 Secondary psoas abscesses, though more diverse in their bacterial flora, tend to follow certain microbiologic patterns based on the inoculating source; Escherichia coli is the most common pathogen in secondary abscesses caused by gastrointestinal (42%) and urinary (61%) sources, and S aureus the most common (35%) from skeletal origins (ie, osteomyelitis).4,5Mycobacterium tuberculosis is the more frequently found cause in developing countries but should be considered if the patient has recently travelled outside the United States.
Review of the literature suggests that the incidence of methicillin-resistant S aureus (MRSA) as the causative agent of psoas abscesses may be increasing. However, there is a wide variance in the incidence reported, ranging from 1.1% to 12% of confirmed microbial infections.5,7,8
The classic historical presentation of psoas abscess has been described as the triad of back pain, fever, and limp5,6; however, this triad has only been described in approximately 30% of cases.5 The typical presentation consists of flank or lower limb pain (91%), fever (75%), anorexia (46%), and/or weakness (43%).4 Laboratory abnormalities include leukocytosis (67%) and elevated markers of inflammation (eg, erythrocyte sedimentation rate, seen in 73% of cases).4
Imaging via abdominal ultrasound may be helpful to screen for psoas abscess; however, its utility is limited by a low diagnostic yield of 60% or less.2,4 Direct visualization of the retroperitoneal structures, for example, can be problematic due to the presence of bowel gas.9 Abdominal CT is considered the gold standard for the definitive diagnosis of psoas abscess due to its high sensitivity (100%) and specificity (77%); it can also be used simultaneously to guide percutaneous drainage to treat the abscess if needed.7 However, some clinicians prefer abdominal MRI because of its ability to enhance soft-tissue visualization without requiring use of IV contrast.2,4
The approach to treating psoas abscess varies from a strictly antibiotic regimen to percutaneous drainage, and in rare circumstances, open surgical drainage. Antibiotic therapy without drainage or surgical intervention is a sufficient starting point for treatment of abscesses less than 3 cm in size.3
The antibiotic regimen choice depends on the suspected pathogen. In cases of suspected S aureus, empiric antistaphylococcal antibiotics should be initiated while culture results are pending.2,4 Secondary psoas abscesses thought to be derived from a urinary or gastrointestinal source should prompt use of a broader spectrum antibiotic due to the higher probability of gram-negative, anaerobic, or polymicrobial involvement.2,4
Once final culture and sensitivity results are obtained, antibiotic therapy should be modified to target the isolated pathogen(s). Treatment duration is typically six weeks but may vary, depending on serial culture results and the inoculating source.4 Review of the literature reveals that abscesses resulting from skeletal sources have traditionally been treated longer, usually with antibiotics alone, than those from urinary or gastrointestinal sources, which are often treated with the combination of antibiotics and percutaneous drainage.4
In cases of psoas abscesses larger than 3 cm, management should include both appropriate antibiotics and percutaneous drainage of the abscess.2 Percutaneous drainage is preferred to open surgical drainage because outcomes are similar, it is less invasive, and there is less risk of spreading abscess contents.2-4 In a retrospective analysis by Dietrich et al, 50% of patients treated with antibiotics and percutaneous drainage responded after one drainage, but the success rate increased to 100% after a second drainage.7 In addition, percutaneous drainage was associated with a lower mortality rate and a shorter hospital stay when compared to open surgical drainage.7
Open surgical drainage is rarely performed and usually only considered if the patient is not responding to a combination of focused antibiotic treatment and percutaneous drainage or has associated comorbidities, such as Crohn ileocolitis.2-4 In a retrospective analysis by Tabrizian et al, percutaneous drainage served as a bridge to open surgical drainage in nearly all patients with a gastrointestinal origin, such as Crohn disease, diverticulitis, appendicitis, and/or pancreatitis.6
Treatment of psoas abscesses has an overall failure rate of 15.8%, with an associated mortality rate of less than 7%.4 Overall prognosis is good, but outcomes can be negatively affected by such factors as advanced age, delay in diagnosis, bacteremia, and other comorbidities.4
Next page: Outcome for the case patient >>
OUTCOME FOR THE CASE PATIENT
The patient required an 11-day hospitalization; her day-by-day course is described briefly below.
Day 1. Upon admission, abdominal MRI was ordered (see Figure 1) and empiric piperacillin/tazobactam IV was initiated. C-reactive protein (CRP) level and white blood cell (WBC) counts were elevated (see Table 2). Infectious disease, surgery, and urology consults were obtained.
Day 2. Fine-needle aspiration of the abscess was performed for cultures, and 40 mL of purulent fluid was drained. Piperacillin/tazobactam administration was continued, but the patient experienced ongoing fever and vomiting.
Day 3. Preliminary aspirate culture results revealed S aureus infection. Piperacillin/tazobactam was discontinued, and vancomycin IV was started. CRP levels and WBC counts decreased, as did fever and vomiting.
Day 4. Final aspirate culture results identified MRSA infection, sensitive to clindamycin. Vancomycin was discontinued, and clindamycin IV was started. Although the patient’s condition improved somewhat, fever and vomiting persisted.
Day 5. Both CRP levels and WBC counts increased from day 3. A surgical consult was sought.
Day 6. Repeat abdominal MRI revealed a decrease in the size of the abscess (see Figure 2, page 30. CRP levels and WBC counts remained high, with persistent fever and vomiting.
Day 7. The clinical team, in consultation with the parents, determined that placement of a peripherally inserted central catheter (PICC) line for drainage of the abscess was necessary.
Day 8. A 10-French pigtail catheter was inserted into the abscess, 20 mL of purulent fluid was drained, and a PICC line was inserted. Clindamycin IV was continued and, eight hours after the catheter was placed, fever and vomiting resolved.
Day 9. Both CRP levels and WBC counts dropped by half (WBC count was normal), while 10 mL of clear fluid drained from the catheter. The patient remained afebrile, without nausea or vomiting, on clindamycin IV.
Day 10. After 36 hours of clear drainage, the catheter was removed. CRP level further decreased. Clindamycin IV was discontinued, and the patient, now asymptomatic, was started on oral clindamycin.
Day 11. The patient was discharged on a regimen of oral clindamycin for six weeks, with weekly abdominal ultrasounds. She completed her entire course of antibiotics and fully recovered from the infection.
Next page: Conclusion >>
CONCLUSION
Since children generally compensate well during times of increased stress on the body, it is vital that persistent FUOs continue to be evaluated until a definitive source is identified, especially in this population. Early diagnosis and treatment of psoas abscess is essential for better outcomes, since delay is associated with a greater risk for sepsis.
While the likelihood of developing psoas abscess is low, it is worth keeping the diagnosis in mind for cases of unexplained lower abdominal pain, flank pain, or hip pain when more common etiologies have been excluded. This is especially important in the setting of recent travel to a developing country due to the fact that a psoas abscess can be a complication of TB of the spine.
The authors would like to thank Jeff Brand, MD, for his assistance in the preparation of this manuscript.
REFERENCES
1. Wong-Baker Faces Corporation. Wong-Baker FACES Pain Rating Scale. www.wongbakerfaces.org. Accessed May 19, 2015.
2. Mallick IH, Thoufreeq MH, Rajendren TP. Iliopsoas abscesses. Postgrad Med J. 2004;80(946):459-462.
3. Yacoub WN, Sohn HJ, Chan S, et al. Psoas abscess rarely requires surgical intervention. Am J Surg. 2008;196(2):223-227.
4. Lopez VN, Ramos JM, Meseguer V, et al; The Infectious Diseases Study Group of the Spanish Society of Internal Medicine. Microbiology and outcome of iliopsoas abscess in 124 patients. Medicine. 2009;88(2):120-130.
5. Shields D, Robinson P, Crowley TP. Iliopsoas abscess—a review and update on the literature. Int J Surg. 2012;10(9):466-469.
6. Tabrizian P, Nguyen SQ, Greenstein A, et al. Management and treatment of iliopsoas abscess. Arch Surg. 2009;144(10):946-949.
7. Dietrich A, Vaccarezza H, Vaccaro CA. Iliopsoas abscess: presentation, management, and outcomes. Surg Laparosc Endosc Percutan Tech. 2013;23(1):45-48.
8. Wong OF, Ho PL, Lam SK. Retrospective review of clinical presentations, microbiology, and outcomes of patients with psoas abscess. Hong Kong Med J. 2013;19(5):416-423.
9. Woo MY. Psoas abscess. J Emerg Med. 2014;47(5):e129-e130.
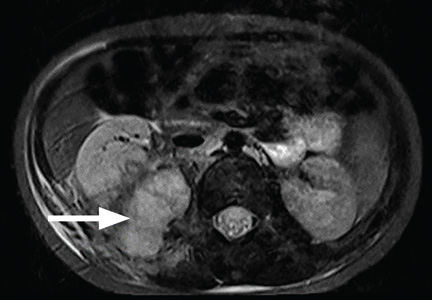
CDC investigating accidental anthrax shipment to labs
The Centers for Disease Control and Prevention is investigating a shipment of anthrax mistakenly sent to labs in the United States and abroad from the Department of Defense, the agency said in a May 30 announcement.
The presence of anthrax was confirmed after a laboratory working with the DOD reported being able to grow live Bacillus anthracis bacteria, although an inactive agent was expected. The lab was working with the DOD to develop a diagnostic test to identify biological threats, the CDC reported.
The accidental shipment is not believed to pose a risk to the public, the CDC said. Samples are being sent to the CDC or Laboratory Response Network labs for testing, and CDC officials are performing onsite investigations at the laboratories involved.