User login
5 reasons why EHRs can’t be called failures
Much has been said about the failures of electronic health records. The shortcomings discussed have ranged from lack of cost benefits to interoperability with medical devices and security of interoperability with medical devices. We use IT via computers or smartphones daily for social, financial, or consumer aspects of lives. Health care has lagged behind other sectors of society in the adoption of digital technology because of regulatory issues, cost, and resistance to change. There are many positive aspects of EHRs, some more obvious than others.
They are what patients expect.
Patients live in the digital world. Seventy-eight percent of office-based physicians use an EHR, according to a study in the journal Health Affairs. Patients expect that their test results and records are easily accessible by all their providers. The promise of interoperability – the easy digital transfer of data from one data source or EHR system to another – has yet to be realized. This is one of the fundamental potential benefits of digital health technology. HIMSS, an advocacy organization focused on better health with information technology, has sent to Congress its recommendations on achieving interoperability within the next 3 years. This is a pivotal issue in creating the EHR envisioned by both patients and physicians.
They can be used to mitigate risk management.
Adoption of any significant change in health care practice presents challenges specifically with regards to risk management. HIPAA privacy regulations and security are of paramount importance. Most risk managers deal with legal issues after an incident has occurred. Digital health technologies can also potentially mitigate risk.
They can (Yes!) enhance the patient encounter.
While many physicians believe that EHRs destroy the patient encounter, there is another way of viewing the interaction. It all depends upon how it is presented in the office. The computer screen may impede the all-important eye contact between the physician and patient (either because of the physical presence of the screen or the physician’s persistent gaze at it). This is a surefire recipe for disengagement and subsequent destruction of the patient-physician relationship. However, the introduction of the computer (asking permission to use it) with physician and patient triangulated with the screen produces a care team atmosphere. Demonstrating the EHR’s functionality while highlighting pertinent clinical information provides a positive experience for both participants.
They brought health care into the digital age.
EHRs are not the face of all of digital health technologies. They do represent the hub around which other technologies need to flow, because this is where the patient interfaces (pun intended) with the physician. Digital technologies will enhance patient engagement. EHRs are the first experience many physicians have with digital health technologies, and they have yet to fulfill their intended goals. They are in their first iteration. Physician groups and health care enterprises have made themselves heard to the EHR vendors and change is coming. Other digital health technologies are here and will improve health care on many fronts. They themselves will transform the EHR into a more useful clinical tool, which will increase patient education, engagement, and connectivity.
They will be much different and better in the near future.
The American Medical Association got it right, in my opinion, with respect to its recommendations for design overhaul of EHRs. The organization outlined an extension of its study with the Rand Corp. and listed priorities of what should constitute design overhaul of the EHR. These include the incorporation of tools that support team-based care, promotion of care coordination among providers, product modularity and ability for configuration, the reduction of cognitive workload, the promotion of data liquidity, the facilitation of digital and mobile patient engagement, and the ability to expedite user input into design and postimplementation feedback.
As digital technology becomes a more substantive part of health care, there will be a need for physician IT champions who can make this process easier and more fulfilling for others. I look forward to seeing this happen.
Dr. Scher is an electrophysiologist with the Heart Group of Lancaster (Pa.) General Health. He is also director of DLS Healthcare Consulting, Harrisburg, Pa., and clinical associate professor of medicine at the Pennsylvania State University, Hershey.

Larger and more severe strokes seen with aspirin resistance
Patients with acute ischemic stroke who test positive for aspirin resistance had both larger stroke volume and increased severity, compared with patients without resistance, in an observational study of 311 patients at Korean centers.
Given that previous studies have shown that the use of aspirin is associated with lower stroke severity and decreased infarction growth, the current study’s findings may help to define the effect of aspirin resistance (AR) on stroke severity, since previous studies had provided inconclusive results, Dr. Mi Sun Oh and colleagues at Hallym University Sacred Heart Hospital, Anyang, South Korea, wrote in their abstract. The findings were released Feb. 23 in advance of the annual meeting in April of the American Academy of Neurology.
The investigators enrolled patients with acute ischemic stroke confirmed by diffusion-weighted imaging (DWI) who had received at least 7 days of aspirin therapy before initial stroke symptoms and had been checked for AR within 24 hours of hospital admission. Patients with high prestroke disability scores (modified Rankin Scale score > 2) were excluded, as were those who were taking another antiplatelet or anticoagulant medication concurrently with aspirin on hospital admission.
The abstract did not report detailed patient characteristics or information about type or dose of aspirin; the full results of the study will be presented at the meeting in Washington.
Enrollees were deemed aspirin resistant if a rapid assay detected greater than 550 Aspirin Reaction Units. DWI-observed stroke volume was assessed via a semiautomated threshold technique, and investigators employed the National Institutes of Health Stroke Scale (NIHSS) score to measure initial stroke severity.
Seventy-eight of the 311 patients (25.1%) had AR. Dr. Oh and colleagues reported that median stroke volume was higher for these patients, compared with the aspirin-sensitive group (2.8 cc vs. 1.6 cc), as was least-square mean on multivariate analysis (1.6 cc [95% CI, 1.1-2.1] vs. 1.1 cc [95% CI, 0.7-1.4], P = .036). Median NIHSS scores were also higher for the AR group (4 vs. 3), indicating greater stroke severity, a result that was confirmed by multivariate analysis.
Aspirin resistance is a complicated and heterogeneous concept, and not a well defined entity, according to vascular neurologist Dr. Philip Gorelick, head of the Hauenstein Neuroscience Center at St. Mary’s Health Care in Grand Rapids, Mich. Dr. Gorelick is an honorary member of the Korean Stroke Society but was not involved in the present study. In an interview, he expanded on the diverse mechanisms that can impede the stroke prevention effect of antiplatelet agents such as aspirin (Stroke Res. Treat. 2013;Article ID 727842 [doi:10.1155/2013/727842]).
In contrast to the traditional notion of “resistance” as an inherent or acquired defense or chemical blockage of a drug, whether by a microbe or the host, aspirin resistance may be either a laboratory-defined lack of inhibition of thromboxane A2, or a clinically-defined entity. In either case, a host of factors may contribute, Dr. Gorelick said. Poor adherence to an aspirin therapy regimen may be a primary contributor to AR. Further, enterically coated aspirin may not be as well absorbed in the gut, leading to lower effective aspirin dosing. A host of other factors, including concurrent medication administration, comorbidities impacting platelet turnover, and genetic polymorphisms may also contribute to aspirin failure.
Although patient characteristics were not reported in this study, Dr. Gorelick did issue a general note of caution: “Another major issue in these types of studies,” he noted, is to determine if “patients are similar in terms of background factors. Patients on aspirin therapy may be more likely to have more severe preexisting vascular disease,” predisposing them to more severe stroke.
The Korea Healthcare Technology R&D Project, Ministry of Health and Family Welfare, and the Republic of Korea supported the study. The authors had no disclosures.
FROM THE AAN 2015 ANNUAL MEETING
Key clinical point: Volume and severity of ischemic stroke were larger in patients with aspirin resistance.
Major finding: Patients with acute ischemic stroke and aspirin resistance had greater median stroke volume than did aspirin-sensitive patients (2.8 cc vs. 1.6 cc) and had more severe strokes according to median NIHSS score (4 vs. 3).
Data source: Study of 311 patients with MRI-confirmed acute ischemic stroke and at least 7 days of aspirin therapy preceding stroke.
Disclosures: The Korea Healthcare Technology R&D Project, Ministry of Health and Family Welfare, and the Republic of Korea supported the study. The authors had no disclosures.
Oral bisphosphonates linked with lower risk of endometrial cancer
A large prospective study found that among 89,918 women aged 50-79 years, bisphosphonate use was inversely associated with age-adjusted endometrial cancer risk, investigators reported. The study was published online Feb. 23 in the Journal of Clinical Oncology.
Crude incidence of endometrial cancer was 12 per 10,000 person-years for nonusers and 8 per 10,000 years for bisphosphonate users (bisphosphonate users: HR 0.76, 95% CI 0.61 to 0.94; P = .01). During the median 12.5-year follow up, 1,123 women (1,070 nonusers and 53 users) were diagnosed with endometrial cancer, reported Dr. Polly A. Newcomb and associates (J. Clin. Oncol. 2015 Feb. 23 [doi:10.1200/JCO.2014.58.6842]).
Bisphosphonate use was 2% at baseline and increased to 10% by year 6. It was treated as a time-varying never/ever variable that was updated at 1, 3, and 6 years. Compared with nonusers, bisphosphonate users were slightly older, leaner, more educated, and less likely to smoke.
This observational study is limited by the possibility of confounding factors. Women may have taken oral bisphosphonates because they had high fracture risk due to low endogenous estrogen from low weight, which is associated with low endometrial cancer risk. After the researchers controlled for weight and other confounding factors, such as fracture risk, the statistical analysis yielded similar measures of association (HR 0.80, 0.64 to 1.00; P = .05).
“In summary, our findings suggest that use of bisphosphonates is modestly associated with reduced endometrial cancer risk, a finding consistent with the inverse association between use of this medication and breast cancer risk,” wrote Dr. Newcomb of Fred Hutchinson Cancer and University of Washington Research Center, Seattle, and associates.
Dr. Newcomb and most coauthors had no disclosures. One coauthor reported consulting or advisory roles with Novartis, Pfizer, Genentech, Novo Nordisk, Genomic Health.
FROM THE JOURNAL OF CLINICAL ONCOLOGY
Key clinical point: Oral bisphosphonate use was modestly associated with reduced risk of endometrial cancer.
Major finding: Risk of endometrial cancer was lower among bisphosphonate users: hazard ratio 0.76, 95% CI 0.61 to 0.94, P = .01.
Data source: The Women’s Health Initiative prospective cohort of 89,918 women with 1,123 cases of incident endometrial cancer.
Disclosures: Dr. Newcomb and most coauthors had no disclosures. One coauthor reported consulting or advisory roles with Novartis, Pfizer, Genentech, Novo Nordisk, Genomic Health.
Outcomes: Getting to the patient’s bottom line
It’s easy to get so caught up in our day-to-day routines. At the hospital, we’re meeting core measures, documenting correctly, following clinical guidelines, and simply striving to stay up to date with the literature. At home, there are soccer games, recitals, and homework – and some rare personal time. We often shift to automatic pilot in a desperate attempt to balance the seemingly never-ending demands.
But does the very nature of our hectic lives sometimes prevent us from seeing the bigger picture, especially when it comes to the things that are really important to our patients? Yes, we know what lab values automatically trigger an order for a statin, and what ejection fraction on the echocardiogram warrants an ACE inhibitor, but how often do we really take the time to find out about the outcomes that are important to our patients? Sometimes they aren’t the evidence-based clinical outcomes we are trying to reproduce with our treatments.

For many patients, the desired outcome is to feel better, plain and simple. All the fancy lingo and drugs with unpronounceable names and unintelligible indications can be overwhelming. They make some patients shut down, and ultimately shut us out. We may not even realize it until our patients are readmitted as a result of noncompliance with our well-thought-out treatment plans.
There are our male patients who rarely take their blood pressure medicine because of the side effect of sexual dysfunction. And then there are those patients who don’t take their medications or see their doctors regularly because they just cannot afford it. While they seem to be in agreement with the follow-up plan for medical visits and testing, patients may be ashamed to admit they are uninsured or underinsured. They know they will never be adherent because they just cannot afford the costs of our treatment plan.
Instead of getting frustrated with our noncompliant patients, we could better serve them by getting more personal – gaining their trust as we carefully and respectfully uncover the layers of the limitations they face and the outcomes that matter to them. We need to aim to be viewed as our patients’ caring advocates and not just aloof professionals with no clue about their daily struggles.
Dr. Hester is a hospitalist at Baltimore-Washington Medical Center in Glen Burnie, Md. She is the creator of the Patient Whiz, a patient-engagement app for iOS. Reach her at [email protected].
It’s easy to get so caught up in our day-to-day routines. At the hospital, we’re meeting core measures, documenting correctly, following clinical guidelines, and simply striving to stay up to date with the literature. At home, there are soccer games, recitals, and homework – and some rare personal time. We often shift to automatic pilot in a desperate attempt to balance the seemingly never-ending demands.
But does the very nature of our hectic lives sometimes prevent us from seeing the bigger picture, especially when it comes to the things that are really important to our patients? Yes, we know what lab values automatically trigger an order for a statin, and what ejection fraction on the echocardiogram warrants an ACE inhibitor, but how often do we really take the time to find out about the outcomes that are important to our patients? Sometimes they aren’t the evidence-based clinical outcomes we are trying to reproduce with our treatments.
For many patients, the desired outcome is to feel better, plain and simple. All the fancy lingo and drugs with unpronounceable names and unintelligible indications can be overwhelming. They make some patients shut down, and ultimately shut us out. We may not even realize it until our patients are readmitted as a result of noncompliance with our well-thought-out treatment plans.
There are our male patients who rarely take their blood pressure medicine because of the side effect of sexual dysfunction. And then there are those patients who don’t take their medications or see their doctors regularly because they just cannot afford it. While they seem to be in agreement with the follow-up plan for medical visits and testing, patients may be ashamed to admit they are uninsured or underinsured. They know they will never be adherent because they just cannot afford the costs of our treatment plan.
Instead of getting frustrated with our noncompliant patients, we could better serve them by getting more personal – gaining their trust as we carefully and respectfully uncover the layers of the limitations they face and the outcomes that matter to them. We need to aim to be viewed as our patients’ caring advocates and not just aloof professionals with no clue about their daily struggles.
Dr. Hester is a hospitalist at Baltimore-Washington Medical Center in Glen Burnie, Md. She is the creator of the Patient Whiz, a patient-engagement app for iOS. Reach her at [email protected].

Woman, 64, With Eye Pain, Swelling, and Tearing
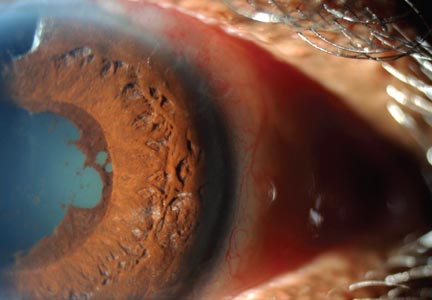
A 64-year-old woman presented to the clinic with a two-to-three-week history of significant pain, swelling, and excessive tearing of the left eye. The patient had a persistent cough but denied wheezing or shortness of breath.
Medical history was remarkable for uveitis, severe recurrent sinusitis, and allergic rhinitis. The patient reported that she had been exposed to benzene and burning paint fumes about 10 years ago but had no known symptoms or problems at the time.
Vital signs included a temperature of 97.0°F; respiratory rate, 18 breaths/min; pulse, 100 beats/min; and blood pressure, 144/80 mm Hg. Her height was 65 in; weight, 122 lb; and O2 saturation, 100% on room air.
Physical examination revealed a left palpebral lacrimal mass with an enlarged lacrimal gland. The left lacrimal gland and conjunctiva were mildly erythematous, with a cobblestone appearance. The right eye was stable, with no significant inflammation. Pupils were equal, round, and reactive to light and accommodation. Extraocular movements were intact. Nasal turbinates were swollen and mildly erythematous. Oropharynx was stable and tonsils absent. Left parotid gland was slightly swollen and tender.
The neck was supple with no jugular venous distension. Palpable cervical and supraclavicular lymphadenopathy, measuring approximately 1.5 x 1.5 cm bilaterally, was present. The lungs were clear to auscultation and percussion. The heart rate and rhythm were regular, with normal S1 and S2 sounds. The abdomen was soft, nontender, and without hepatosplenomegaly. Extremities were stable, with no rashes, lesions, or cutaneous skin nodules.
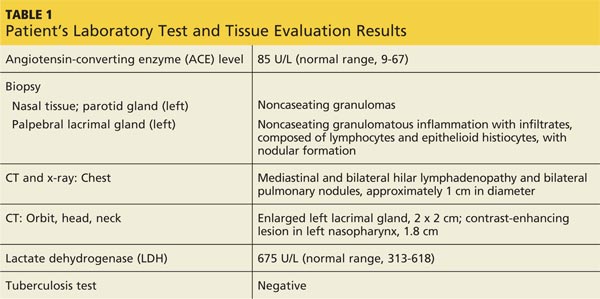
The patient was referred to a specialist for a complete ophthalmologic examination and further work-up. This included a complete blood count, comprehensive metabolic panel, tissue biopsies of the affected lacrimal gland and parotid gland, CT, and x-rays; results are shown in Table 1. In addition, the patient’s persistent nasosinus congestion was determined, by otolaryngologic consultation, to be the result of a deviated septum, for which she underwent endoscopic nasal septal repair with tissue biopsy.
The lacrimal gland biopsy led to a diagnosis of chronic noncaseating granulomatous dacryoadenitis, with an extensive area of necrosis. Significant findings included histiocytes and discrete nodules in the gland. Biopsies of the parotid gland and nasal tissue also identified noncaseating granulomas.
The patient’s test results suggested several possible diagnoses, including
• Granulomatosis with polyangiitis
• Tuberculosis (TB) or similar pulmonary infectious disease
• Sarcoidosis (ocular and/or pulmonary)
Continue for differential diagnosis >>
DISCUSSION
Differential diagnosis
Granulomatosis with polyangiitis. GPA, also known as Wegener granulomatosis, is characterized by necrotizing granulomatous inflammation with necrotizing vasculitis, usually of small and medium vessels; ocular involvement is frequent.1 Ocular granulomas of GPA can be mistaken for those caused by other diseases, such as mycobacterial or syphilitic infection or idiopathic uveitis.2
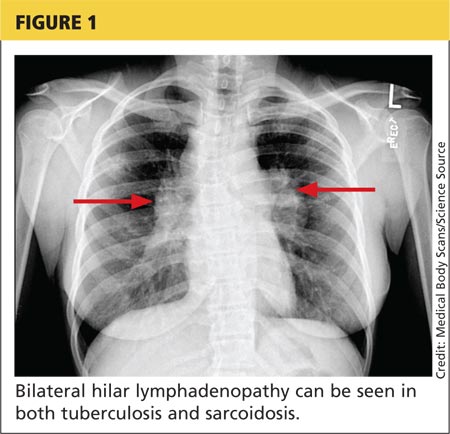
Tuberculosis. Common symptoms of TB include fever, cough, dyspnea, weight loss, malaise, and fatigue. Granulomas are typically necrotizing but are occasionally nonnecrotizing.3 TB can manifest with hilar and diffuse lymphadenopathy,4 which the patient’s chest imaging revealed (see Figure 1). Granulomas produced by Mycobacterium tuberculosis and atypical mycobacteria are similar histopathologically to sarcoidosis granulomas, complicating the diagnostic process.5
Next page: Sarcoidosis >>
Sarcoidosis. Sarcoidosis is a multisystem inflammatory disease characterized by noncaseating epithelioid granulomas in affected organs.6 More than 90% of patients with sarcoidosis present with pulmonary symptoms, including shortness of breath, cough, and pleuritic chest pain.6-8 Ocular manifestations, such as uveitis, iritis, or conjunctivitis, are less common, developing in 30% to 60% of patients.2,9,10 In addition, rashes, lesions, or cutaneous skin nodules, including erythema nodosum and lupus pernio, are seen in 25% to 35% of patients.2,6
In up to two-thirds of patients, sarcoidosis resolves spontaneously2; in others, it may become chronic and progressive.4 Patients may have few or no symptoms; some require no treatment, while others may be severely affected by the disease.
Ocular involvement in sarcoidosis generally manifests as uveitis, most commonly in the anterior chamber. Uveitis is a potentially vision-threatening inflammatory disease involving both the uveal tract and adjacent structures.11 In a review of records for 2,619 patients with uveitis, 59.9% had anterior disease, of whom 2.1% were diagnosed with sarcoidosis.11
While the etiology of sarcoidosis continues to be studied,7 the prevailing theory is that, in genetically predisposed individuals, sarcoidosis is a cell-mediated immune response to as-yet unknown antigen triggers that leads to granuloma formation.3,6,7
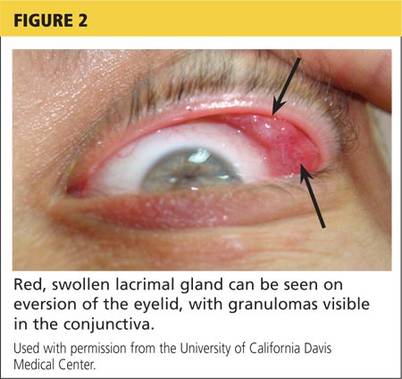
CD4+ activated T-cells stimulate the immune reaction against an antigen, producing cytokines that activate immune cells (eg, B cells, macrophages, monocytes, and neutrophils).2 Immune cells accumulate and aggregate at antigen sites in an exaggerated response, resulting in the formation of granulomas (see Figure 2).7,12,13
Infectious agents have long been investigated as possible causative agents in sarcoidosis, with Mycobacterium species most frequently identified.5 Additional possibilities include Propionibacterium acnes (found predominantly in skin lesions) and herpesviruses, although viruses are not known to cause epitheliod granulomas.14
Environmental triggers have also been explored. One large study found a possible association between exposure to insecticides, agricultural environments, and microbial bioaerosols and sarcoidosis.15
The difficulty of pinpointing a single etiology for sarcoidosis—with its varying clinical manifestations, severity, and disease course—suggests that sarcoidosis may be a spectrum of disorders caused by the interaction of genetic, immunologic, infectious, and environmental factors.14
Next page: Diagnosis of sarcoidosis >>
Diagnosis
The diagnosis of sarcoidosis is based on clinical and radiologic features, histologic evidence of noncaseating granulomas, and exclusion of other possible causes of granulomas.2,12 In addition, when ocular sarcoidosis is suspected, other possible causes of uveitis must be excluded.
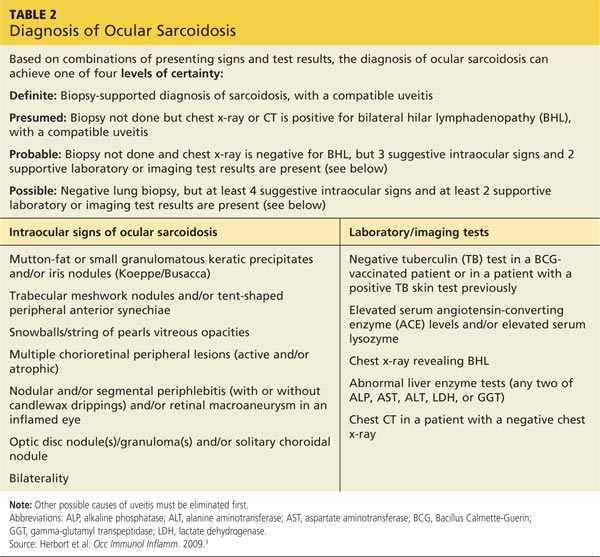
In an effort to address these challenges, the International Workshop on Ocular Sarcoidosis (IWOS) developed a standardized approach to diagnosis.9 The group first identified seven intraocular signs of ocular sarcoidosis and then five laboratory or imaging tests that are of value in making the diagnosis in patients with these signs. Last, they established four levels of certainty for the diagnosis of ocular sarcoidosis, based on these signs, tests, and biopsy results, if available (see Table 2).
Treatment
Anterior uveitis in sarcoidosis is usually treated initially with a topical corticosteroid (eg, prednisolone or difluprednate drops), particularly if the patient’s symptoms are mild. In more severe cases (eg, posterior or bilateral uveitis) or when topical corticosteroids are ineffective, systemic (oral) corticosteroids (eg, prednisone) may be initiated. Topical therapy can also be added to an oral regimen as a means of decreasing the oral dosage and thereby reducing the adverse effects of systemic corticosteroids. When the patient’s disease is refractory to corticosteroids or there are concerns about long-term adverse effects, chronic cases may be treated with immunosuppressive agents (eg, methotrexate, azathioprine, mycophenolate mofetil). Finally, refractory cases of ocular sarcoidosis may be treated with anti–tumor necrosis factor α (TNF-α) biologic agents such as infliximab and adalimumab.10,17
Continue for case patient outcome >>
OUTCOME FOR THE CASE PATIENT
Histologic evaluation of tissue from the lacrimal gland, parotid gland, and sinus cavity revealed inflammatory noncaseating granulomas, strongly suggestive of sarcoidosis. Diagnosis of ocular sarcoidosis was based on the noncaseating granulomas in the lacrimal gland.9,16 Pulmonary sarcoidosis was also diagnosed, based on the presence of hilar and mediastinal lymphadenopathy.7
The mass in the patient’s lacrimal gland was surgically removed. She was treated with a combination of topical and oral corticosteroids tapered over two weeks, which induced remission of her ocular disease. The patient will be seen annually by an ophthalmologic specialist and was advised to contact her clinician immediately if acute ocular symptoms recurred.10,17
The patient’s persistent cough was determined to be secondary to acute bronchitis, rather than to her pulmonary sarcoidosis, which required no treatment. She received a short course of antibiotics and antitussives for her bronchitis. Systemic corticosteroid treatment of her ocular sarcoidosis also had the benefit of decreasing the size of her pulmonary nodules. She will be followed with annual CT and chest x-rays to monitor the status of her hilar and mediastinal lymphadenopathy and the nodules.3 Periodic pulmonary function testing will also be performed.7
Continue for conclusion >>
CONCLUSION
The elusive nature of the diagnosis of sarcoidosis is well documented in the medical literature. In this case, histologic evaluation of biopsied tissue, correlated with clinical symptoms and radiographic findings, were essential in making the diagnosis.
Primary care providers may be the first to evaluate patients with ocular sarcoidosis and will oversee long-term management. Patients who present with symptoms of eye pain, visual disturbances, abnormal inflammatory ocular features, or swollen lacrimal glands should be referred to an ophthalmologic specialist for further evaluation.
REFERENCES
1. Jennette JC, Falk RJ, Bacon PA, et al. 2012 Revised International Chapel Hill Consensus Conference Nomenclature of Vasculitides. Arthritis Rheum. 2013;65(1):1-11.
2. Culver DA. Sarcoidosis. Immunol Allergy Clin North Am. 2012;32(4):487-511.
3. Spagnolo P, Luppi F, Roversi P, et al. Sarcoidosis: challenging diagnostic aspects of an old disease. Am J Med. 2012;125(2):118-125.
4. Dempsey OJ, Peterson EW, Kerr KM, Denison AR. Sarcoidosis. BMJ. 2009;339:620-625.
5. Brownell I, Ramirez-Valle F, Sanchez M, Prystowsky S. Evidence for mycobacteria in sarcoidosis. Am J Respir Cell Mol Biol. 2011;45(5):899-905.
6. Iannuzzi MC, Fontana JR. Sarcoidosis: clinical presentation, immunopathogenesis, and therapeutics. JAMA. 2011;305(4):391-399.
7. Baughman MD, Culver DA, Judson MA. A concise review of pulmonary sarcoidosis. Am J Respir Crit Care Med. 2011;183(5):573-581.
8. Koyama T, Ueda H, Togashi K, et al. Radiologic manifestations of sarcoidosis in various organs. Radiographics. 2004;24(1):87-104.
9. Herbort CP, Rao NA, Mochizuki M; for the Scientific Committee of First International Workshop on Ocular Sarcoidosis. International criteria for the diagnosis of ocular sarcoidosis: results of the first International Workshop on Ocular Sarcoidosis (IWOS). Ocul Immunol Inflamm. 2009; 17(3):160-169.
10. Jamilloux Y, Kodjikian L, Broussolle C, Seve P. Sarcoidosis and uveitis. Autoimmun Rev. 2014;13(8):840-849.
11. Barisani-Asenbauer T, Maca SM, Mejdoubi L, et al. Uveitis—a rare disease often associated with systemic diseases and infections—a systematic review of 2619 patients. Orphanet J Rare Dis. 2012;7:57.
12. Iannuzzi MC, Rybicki BA, Teirstein AS. Sarcoidosis. New Engl J Med. 2007;357(21):2153-2165.
13. Fontenot A, King T. Pathogenesis of sarcoidosis. www.uptodate.com/contents/pathogenesis-of-sarcoidosis?source=search_result&search=Pathogenesis+of+sarcoidosis&selectedTitle=1%7E150. Accessed February 17, 2015.
14. Saidha S, Sotirchos ES, Eckstein C. Etiology of sarcoidosis: does infection play a role? Yale J Biol Med. 2012;85(1):133-141.
15. Newman LS, Rose CS, Bresnitz EA, et al; for the ACCESS Research Group. A case control etiologic study of sarcoidosis. Environmental and occupational risk factors. Am J Respir Crit Care Med. 2004;170:1324-1330.
16. Kawaguchi T, Hanada A, Horie S, et al. Evaluation of characteristic ocular signs and systemic investigations in ocular sarcoidosis patients. Jpn J Opthalmol. 2007;51(2):121-126.
17. Bodaghi B, Touitou V, Fardeau C, et al. Ocular sarcoidosis. Presse Med. 2012;41(6 Pt 2):e349-e354.
A 64-year-old woman presented to the clinic with a two-to-three-week history of significant pain, swelling, and excessive tearing of the left eye. The patient had a persistent cough but denied wheezing or shortness of breath.
Medical history was remarkable for uveitis, severe recurrent sinusitis, and allergic rhinitis. The patient reported that she had been exposed to benzene and burning paint fumes about 10 years ago but had no known symptoms or problems at the time.
Vital signs included a temperature of 97.0°F; respiratory rate, 18 breaths/min; pulse, 100 beats/min; and blood pressure, 144/80 mm Hg. Her height was 65 in; weight, 122 lb; and O2 saturation, 100% on room air.
Physical examination revealed a left palpebral lacrimal mass with an enlarged lacrimal gland. The left lacrimal gland and conjunctiva were mildly erythematous, with a cobblestone appearance. The right eye was stable, with no significant inflammation. Pupils were equal, round, and reactive to light and accommodation. Extraocular movements were intact. Nasal turbinates were swollen and mildly erythematous. Oropharynx was stable and tonsils absent. Left parotid gland was slightly swollen and tender.
The neck was supple with no jugular venous distension. Palpable cervical and supraclavicular lymphadenopathy, measuring approximately 1.5 x 1.5 cm bilaterally, was present. The lungs were clear to auscultation and percussion. The heart rate and rhythm were regular, with normal S1 and S2 sounds. The abdomen was soft, nontender, and without hepatosplenomegaly. Extremities were stable, with no rashes, lesions, or cutaneous skin nodules.
The patient was referred to a specialist for a complete ophthalmologic examination and further work-up. This included a complete blood count, comprehensive metabolic panel, tissue biopsies of the affected lacrimal gland and parotid gland, CT, and x-rays; results are shown in Table 1. In addition, the patient’s persistent nasosinus congestion was determined, by otolaryngologic consultation, to be the result of a deviated septum, for which she underwent endoscopic nasal septal repair with tissue biopsy.
The lacrimal gland biopsy led to a diagnosis of chronic noncaseating granulomatous dacryoadenitis, with an extensive area of necrosis. Significant findings included histiocytes and discrete nodules in the gland. Biopsies of the parotid gland and nasal tissue also identified noncaseating granulomas.
The patient’s test results suggested several possible diagnoses, including
• Granulomatosis with polyangiitis
• Tuberculosis (TB) or similar pulmonary infectious disease
• Sarcoidosis (ocular and/or pulmonary)
Continue for differential diagnosis >>
DISCUSSION
Differential diagnosis
Granulomatosis with polyangiitis. GPA, also known as Wegener granulomatosis, is characterized by necrotizing granulomatous inflammation with necrotizing vasculitis, usually of small and medium vessels; ocular involvement is frequent.1 Ocular granulomas of GPA can be mistaken for those caused by other diseases, such as mycobacterial or syphilitic infection or idiopathic uveitis.2
Tuberculosis. Common symptoms of TB include fever, cough, dyspnea, weight loss, malaise, and fatigue. Granulomas are typically necrotizing but are occasionally nonnecrotizing.3 TB can manifest with hilar and diffuse lymphadenopathy,4 which the patient’s chest imaging revealed (see Figure 1). Granulomas produced by Mycobacterium tuberculosis and atypical mycobacteria are similar histopathologically to sarcoidosis granulomas, complicating the diagnostic process.5
Next page: Sarcoidosis >>
Sarcoidosis. Sarcoidosis is a multisystem inflammatory disease characterized by noncaseating epithelioid granulomas in affected organs.6 More than 90% of patients with sarcoidosis present with pulmonary symptoms, including shortness of breath, cough, and pleuritic chest pain.6-8 Ocular manifestations, such as uveitis, iritis, or conjunctivitis, are less common, developing in 30% to 60% of patients.2,9,10 In addition, rashes, lesions, or cutaneous skin nodules, including erythema nodosum and lupus pernio, are seen in 25% to 35% of patients.2,6
In up to two-thirds of patients, sarcoidosis resolves spontaneously2; in others, it may become chronic and progressive.4 Patients may have few or no symptoms; some require no treatment, while others may be severely affected by the disease.
Ocular involvement in sarcoidosis generally manifests as uveitis, most commonly in the anterior chamber. Uveitis is a potentially vision-threatening inflammatory disease involving both the uveal tract and adjacent structures.11 In a review of records for 2,619 patients with uveitis, 59.9% had anterior disease, of whom 2.1% were diagnosed with sarcoidosis.11
While the etiology of sarcoidosis continues to be studied,7 the prevailing theory is that, in genetically predisposed individuals, sarcoidosis is a cell-mediated immune response to as-yet unknown antigen triggers that leads to granuloma formation.3,6,7
CD4+ activated T-cells stimulate the immune reaction against an antigen, producing cytokines that activate immune cells (eg, B cells, macrophages, monocytes, and neutrophils).2 Immune cells accumulate and aggregate at antigen sites in an exaggerated response, resulting in the formation of granulomas (see Figure 2).7,12,13
Infectious agents have long been investigated as possible causative agents in sarcoidosis, with Mycobacterium species most frequently identified.5 Additional possibilities include Propionibacterium acnes (found predominantly in skin lesions) and herpesviruses, although viruses are not known to cause epitheliod granulomas.14
Environmental triggers have also been explored. One large study found a possible association between exposure to insecticides, agricultural environments, and microbial bioaerosols and sarcoidosis.15
The difficulty of pinpointing a single etiology for sarcoidosis—with its varying clinical manifestations, severity, and disease course—suggests that sarcoidosis may be a spectrum of disorders caused by the interaction of genetic, immunologic, infectious, and environmental factors.14
Next page: Diagnosis of sarcoidosis >>
Diagnosis
The diagnosis of sarcoidosis is based on clinical and radiologic features, histologic evidence of noncaseating granulomas, and exclusion of other possible causes of granulomas.2,12 In addition, when ocular sarcoidosis is suspected, other possible causes of uveitis must be excluded.
In an effort to address these challenges, the International Workshop on Ocular Sarcoidosis (IWOS) developed a standardized approach to diagnosis.9 The group first identified seven intraocular signs of ocular sarcoidosis and then five laboratory or imaging tests that are of value in making the diagnosis in patients with these signs. Last, they established four levels of certainty for the diagnosis of ocular sarcoidosis, based on these signs, tests, and biopsy results, if available (see Table 2).
Treatment
Anterior uveitis in sarcoidosis is usually treated initially with a topical corticosteroid (eg, prednisolone or difluprednate drops), particularly if the patient’s symptoms are mild. In more severe cases (eg, posterior or bilateral uveitis) or when topical corticosteroids are ineffective, systemic (oral) corticosteroids (eg, prednisone) may be initiated. Topical therapy can also be added to an oral regimen as a means of decreasing the oral dosage and thereby reducing the adverse effects of systemic corticosteroids. When the patient’s disease is refractory to corticosteroids or there are concerns about long-term adverse effects, chronic cases may be treated with immunosuppressive agents (eg, methotrexate, azathioprine, mycophenolate mofetil). Finally, refractory cases of ocular sarcoidosis may be treated with anti–tumor necrosis factor α (TNF-α) biologic agents such as infliximab and adalimumab.10,17
Continue for case patient outcome >>
OUTCOME FOR THE CASE PATIENT
Histologic evaluation of tissue from the lacrimal gland, parotid gland, and sinus cavity revealed inflammatory noncaseating granulomas, strongly suggestive of sarcoidosis. Diagnosis of ocular sarcoidosis was based on the noncaseating granulomas in the lacrimal gland.9,16 Pulmonary sarcoidosis was also diagnosed, based on the presence of hilar and mediastinal lymphadenopathy.7
The mass in the patient’s lacrimal gland was surgically removed. She was treated with a combination of topical and oral corticosteroids tapered over two weeks, which induced remission of her ocular disease. The patient will be seen annually by an ophthalmologic specialist and was advised to contact her clinician immediately if acute ocular symptoms recurred.10,17
The patient’s persistent cough was determined to be secondary to acute bronchitis, rather than to her pulmonary sarcoidosis, which required no treatment. She received a short course of antibiotics and antitussives for her bronchitis. Systemic corticosteroid treatment of her ocular sarcoidosis also had the benefit of decreasing the size of her pulmonary nodules. She will be followed with annual CT and chest x-rays to monitor the status of her hilar and mediastinal lymphadenopathy and the nodules.3 Periodic pulmonary function testing will also be performed.7
Continue for conclusion >>
CONCLUSION
The elusive nature of the diagnosis of sarcoidosis is well documented in the medical literature. In this case, histologic evaluation of biopsied tissue, correlated with clinical symptoms and radiographic findings, were essential in making the diagnosis.
Primary care providers may be the first to evaluate patients with ocular sarcoidosis and will oversee long-term management. Patients who present with symptoms of eye pain, visual disturbances, abnormal inflammatory ocular features, or swollen lacrimal glands should be referred to an ophthalmologic specialist for further evaluation.
REFERENCES
1. Jennette JC, Falk RJ, Bacon PA, et al. 2012 Revised International Chapel Hill Consensus Conference Nomenclature of Vasculitides. Arthritis Rheum. 2013;65(1):1-11.
2. Culver DA. Sarcoidosis. Immunol Allergy Clin North Am. 2012;32(4):487-511.
3. Spagnolo P, Luppi F, Roversi P, et al. Sarcoidosis: challenging diagnostic aspects of an old disease. Am J Med. 2012;125(2):118-125.
4. Dempsey OJ, Peterson EW, Kerr KM, Denison AR. Sarcoidosis. BMJ. 2009;339:620-625.
5. Brownell I, Ramirez-Valle F, Sanchez M, Prystowsky S. Evidence for mycobacteria in sarcoidosis. Am J Respir Cell Mol Biol. 2011;45(5):899-905.
6. Iannuzzi MC, Fontana JR. Sarcoidosis: clinical presentation, immunopathogenesis, and therapeutics. JAMA. 2011;305(4):391-399.
7. Baughman MD, Culver DA, Judson MA. A concise review of pulmonary sarcoidosis. Am J Respir Crit Care Med. 2011;183(5):573-581.
8. Koyama T, Ueda H, Togashi K, et al. Radiologic manifestations of sarcoidosis in various organs. Radiographics. 2004;24(1):87-104.
9. Herbort CP, Rao NA, Mochizuki M; for the Scientific Committee of First International Workshop on Ocular Sarcoidosis. International criteria for the diagnosis of ocular sarcoidosis: results of the first International Workshop on Ocular Sarcoidosis (IWOS). Ocul Immunol Inflamm. 2009; 17(3):160-169.
10. Jamilloux Y, Kodjikian L, Broussolle C, Seve P. Sarcoidosis and uveitis. Autoimmun Rev. 2014;13(8):840-849.
11. Barisani-Asenbauer T, Maca SM, Mejdoubi L, et al. Uveitis—a rare disease often associated with systemic diseases and infections—a systematic review of 2619 patients. Orphanet J Rare Dis. 2012;7:57.
12. Iannuzzi MC, Rybicki BA, Teirstein AS. Sarcoidosis. New Engl J Med. 2007;357(21):2153-2165.
13. Fontenot A, King T. Pathogenesis of sarcoidosis. www.uptodate.com/contents/pathogenesis-of-sarcoidosis?source=search_result&search=Pathogenesis+of+sarcoidosis&selectedTitle=1%7E150. Accessed February 17, 2015.
14. Saidha S, Sotirchos ES, Eckstein C. Etiology of sarcoidosis: does infection play a role? Yale J Biol Med. 2012;85(1):133-141.
15. Newman LS, Rose CS, Bresnitz EA, et al; for the ACCESS Research Group. A case control etiologic study of sarcoidosis. Environmental and occupational risk factors. Am J Respir Crit Care Med. 2004;170:1324-1330.
16. Kawaguchi T, Hanada A, Horie S, et al. Evaluation of characteristic ocular signs and systemic investigations in ocular sarcoidosis patients. Jpn J Opthalmol. 2007;51(2):121-126.
17. Bodaghi B, Touitou V, Fardeau C, et al. Ocular sarcoidosis. Presse Med. 2012;41(6 Pt 2):e349-e354.
FDA approves adhesive treatment for superficial varicose veins
The VenaSeal closure system, which uses an adhesive directly injected into the vein, has been approved as a permanent treatment for symptomatic, superficial varicose veins, the Food and Drug Administration announced on Feb. 20.
“This new system is the first to permanently treat varicose veins by sealing them with an adhesive,” Dr. William Maisel, acting director of the Office of Device Evaluation in the FDA’s Center for Devices and Radiological Health, said in the FDA’s statement. Because the system “does not incorporate heat application or cutting, the in-office procedure can allow patients to quickly return to their normal activities, with less bruising,” he added.
The VenaSeal system differs from other procedures used to treat varicose veins, which use drugs, lasers, radiofrequency, or incisions, the FDA statement points out. The complete sterile kit includes the adhesive (n-butyl-2-cyanoacrylate), which solidifies when injected directly into the target vein via a catheter, under ultrasound guidance. The additional system components include the catheter, the adhesive, a guidewire, dispenser gun, dispenser tips, and syringes.
Approval was based on data from three clinical trials sponsored by the manufacturer. In the U.S. study that compared results in 108 patients treated with the VenaSeal system and 114 patients treated with radiofrequency ablation therapy, the device was shown “to be safe and effective for vein closure for the treatment of symptomatic superficial varicose veins of the legs,” according to the FDA. In the study, adverse events associated with the VenaSeal treatment included phlebitis and paresthesias in the treated areas, which are “generally associated with treatments of this condition,” the FDA statement noted.
The agency reviewed the VenaSeal System as a class III medical device, considered the highest risk type of medical devices that are subjected to the highest level of regulatory control, and which must be approved before marketing.
VenaSeal is manufactured by Covidien, which acquired Sapheon, the company that developed VenaSeal, in 2014. The system has also been approved in Canada, Europe, and Hong Kong, according to a Covidien statement issued last year.
Abnormal calcium level in a psychiatric presentation? Rule out parathyroid disease
In some patients, symptoms of depression, psychosis, delirium, or dementia exist concomitantly with, or as a result of, an abnormal (elevated or low) serum calcium concentration that has been precipitated by an unrecognized endocrinopathy. The apparent psychiatric presentations of such patients might reflect parathyroid pathology—not psychopathology.
Hypercalcemia and hypocalcemia often are related to a distinct spectrum of conditions, such as diseases of the parathyroid glands, kidneys, and various neoplasms including malignancies. Be alert to the possibility of parathyroid disease in patients whose presentation suggests mental illness concurrent with, or as a direct consequence of, an abnormal calcium level, and investigate appropriately.
The Table1-9 illustrates how 3 clinical laboratory tests—serum calcium, serum parathyroid hormone (PTH), and phosphate—can narrow the differential diagnosis when the clinical impression is parathyroid-related illness. Seek endocrinology consultation whenever a parathyroid-associated ailment is discovered or suspected. Serum calcium is routinely assayed in hospitalized patients; when managing a patient with treatment-refractory psychiatric illness, (1) always check the reported result of that test and (2) consider measuring PTH.
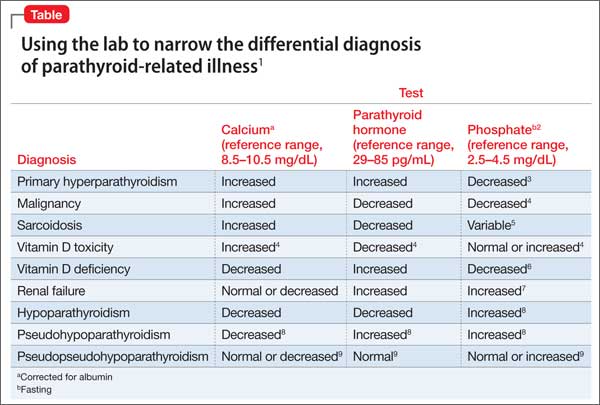
Case reports1
Case 1: Woman with chronic depression. The patient was hospitalized while suicidal. Serial serum calcium levels were 12.5 mg/dL and 15.8 mg/dL (reference range, 8.2–10.2 mg/dL). The PTH level was elevated at 287 pg/mL (reference range, 10–65 pg/mL).
After thyroid imaging, surgery revealed a parathyroid mass, which was resected. Histologic examination confirmed an adenoma.
The calcium concentration declined to 8.6 mg/dL postoperatively and stabilized at 9.2 mg/dL. Psychiatric symptoms resolved fully; she experienced a complete recovery.
Case 2: Man on long-term lithium maintenance. The patient was admitted in a delusional psychotic state. The serum calcium level was 14.3 mg/dL initially, decreasing to 11.5 mg/dL after lithium was discontinued. The PTH level was elevated at 97 pg/mL at admission, consistent with hyperparathyroidism.
A parathyroid adenoma was resected. Serum calcium level normalized at 10.7 mg/dL; psychosis resolved with striking, sustained improvement in mental status.
Full return to mental, physical health
The diagnosis of parathyroid adenoma in these 2 patients, which began with a psychiatric presentation, was properly made after an abnormal serum calcium level was documented. Surgical treatment of the endocrinopathy produced full remission and a return to normal mental and physical health.
Although psychiatric manifestations are associated with an abnormal serum calcium concentration, the severity of those presentations does not correlate with the degree of abnormality of the calcium level.10
Disclosures
The authors report no financial relationships with any company whose products are mentioned in this article or with manufacturers of competing products.
1. Velasco PJ, Manshadi M, Breen K, et al. Psychiatric aspects of parathyroid disease. Psychosomatics. 1999;40(6):486-490.
2. Harrop JS, Bailey JE, Woodhead JS. Incidence of hypercalcaemia and primary hyperparathyroidism in relation to the biochemical profile. J Clin Pathol. 1982; 35(4):395-400.
3. Assadi F. Hypophosphatemia: an evidence-based problem-solving approach to clinical cases. Iran J Kidney Dis. 2010;4(3):195-201.
4. Ozkhan B, Hatun S, Bereket A. Vitamin D intoxication. Turk J Pediatr. 2012;54(2):93-98.
5. Studdy PR, Bird R, Neville E, et al. Biochemical findings in sarcoidosis. J Clin Pathol. 1980;33(6):528-533.
6. Geller JL, Adam JS. Vitamin D therapy. Curr Osteoporos Rep. 2008;6(1):5-11.
7. Albaaj F, Hutchison A. Hyperphosphatemia in renal failure: causes, consequences and current management. Drugs. 2003;63(6):577-596.
8. Al-Azem H, Khan AA. Hypoparathyroidism. Best Pract Res Clin Endocrinol Metab. 2012;26(4):517-522.
9. Brown H, Englert E, Wallach S. The syndrome of pseudo-pseudohypoparathyroidism. AMA Arch Intern Med. 1956;98(4):517-524.
10. Pfitzenmeyer P, Besancenot JF, Verges B, et al. Primary hyperparathyroidism in very old patients. Eur J Med. 1993;2(8):453-456.
In some patients, symptoms of depression, psychosis, delirium, or dementia exist concomitantly with, or as a result of, an abnormal (elevated or low) serum calcium concentration that has been precipitated by an unrecognized endocrinopathy. The apparent psychiatric presentations of such patients might reflect parathyroid pathology—not psychopathology.
Hypercalcemia and hypocalcemia often are related to a distinct spectrum of conditions, such as diseases of the parathyroid glands, kidneys, and various neoplasms including malignancies. Be alert to the possibility of parathyroid disease in patients whose presentation suggests mental illness concurrent with, or as a direct consequence of, an abnormal calcium level, and investigate appropriately.
The Table1-9 illustrates how 3 clinical laboratory tests—serum calcium, serum parathyroid hormone (PTH), and phosphate—can narrow the differential diagnosis when the clinical impression is parathyroid-related illness. Seek endocrinology consultation whenever a parathyroid-associated ailment is discovered or suspected. Serum calcium is routinely assayed in hospitalized patients; when managing a patient with treatment-refractory psychiatric illness, (1) always check the reported result of that test and (2) consider measuring PTH.
Case reports1
Case 1: Woman with chronic depression. The patient was hospitalized while suicidal. Serial serum calcium levels were 12.5 mg/dL and 15.8 mg/dL (reference range, 8.2–10.2 mg/dL). The PTH level was elevated at 287 pg/mL (reference range, 10–65 pg/mL).
After thyroid imaging, surgery revealed a parathyroid mass, which was resected. Histologic examination confirmed an adenoma.
The calcium concentration declined to 8.6 mg/dL postoperatively and stabilized at 9.2 mg/dL. Psychiatric symptoms resolved fully; she experienced a complete recovery.
Case 2: Man on long-term lithium maintenance. The patient was admitted in a delusional psychotic state. The serum calcium level was 14.3 mg/dL initially, decreasing to 11.5 mg/dL after lithium was discontinued. The PTH level was elevated at 97 pg/mL at admission, consistent with hyperparathyroidism.
A parathyroid adenoma was resected. Serum calcium level normalized at 10.7 mg/dL; psychosis resolved with striking, sustained improvement in mental status.
Full return to mental, physical health
The diagnosis of parathyroid adenoma in these 2 patients, which began with a psychiatric presentation, was properly made after an abnormal serum calcium level was documented. Surgical treatment of the endocrinopathy produced full remission and a return to normal mental and physical health.
Although psychiatric manifestations are associated with an abnormal serum calcium concentration, the severity of those presentations does not correlate with the degree of abnormality of the calcium level.10
Disclosures
The authors report no financial relationships with any company whose products are mentioned in this article or with manufacturers of competing products.
1. Velasco PJ, Manshadi M, Breen K, et al. Psychiatric aspects of parathyroid disease. Psychosomatics. 1999;40(6):486-490.
2. Harrop JS, Bailey JE, Woodhead JS. Incidence of hypercalcaemia and primary hyperparathyroidism in relation to the biochemical profile. J Clin Pathol. 1982; 35(4):395-400.
3. Assadi F. Hypophosphatemia: an evidence-based problem-solving approach to clinical cases. Iran J Kidney Dis. 2010;4(3):195-201.
4. Ozkhan B, Hatun S, Bereket A. Vitamin D intoxication. Turk J Pediatr. 2012;54(2):93-98.
5. Studdy PR, Bird R, Neville E, et al. Biochemical findings in sarcoidosis. J Clin Pathol. 1980;33(6):528-533.
6. Geller JL, Adam JS. Vitamin D therapy. Curr Osteoporos Rep. 2008;6(1):5-11.
7. Albaaj F, Hutchison A. Hyperphosphatemia in renal failure: causes, consequences and current management. Drugs. 2003;63(6):577-596.
8. Al-Azem H, Khan AA. Hypoparathyroidism. Best Pract Res Clin Endocrinol Metab. 2012;26(4):517-522.
9. Brown H, Englert E, Wallach S. The syndrome of pseudo-pseudohypoparathyroidism. AMA Arch Intern Med. 1956;98(4):517-524.
10. Pfitzenmeyer P, Besancenot JF, Verges B, et al. Primary hyperparathyroidism in very old patients. Eur J Med. 1993;2(8):453-456.
Can Vitamin D Supplements Help With Hypertension?
Q) One of my patients came in and said he had read that vitamin D supplementation will help with hypertension. Now he wants to quit his blood pressure meds and use vitamin D instead. Do you have any background on this?
Vitamin D is critical for utilization of calcium, a vital nutrient for multiple metabolic and cellular processes; deficiency is associated with worsening of autoimmune disorders, osteoporosis, and certain cardiovascular conditions, among others.7 An association between vitamin D level and blood pressure has been recognized for some time, but the pathophysiology is not well understood.
A literature review of studies from 1988 to 2013 found contradictory results regarding vitamin D deficiency and concurrent elevated blood pressure (systolic and/or diastolic), as well as the impact on blood pressure with restoration of vitamin D levels. The findings were limited by several factors, including differences in study design, variables evaluated, and type of vitamin D compound used. The results suggested a link between the renin-angiotensin-aldosterone system, fibroblast growth factor 23/klotho axis, and vitamin D level.8
A study of 158 subjects (98 with newly diagnosed essential hypertension, 60 with normal blood pressure) found significantly lower 25(OH)D3 serum levels in hypertensive patients. Furthermore, the 25(OH)D3 level was significantly correlated with both systolic (r = –0.33) and diastolic blood pressure (r = –0.26). Using multiple regression analysis, after adjustment for age, smoking status, and BMI, the impact of 25(OH)D3 level accounted for 10% of the variation in systolic blood pressure.9
In a mendelian randomization study of 108,173 subjects from 35 studies, an inverse association between vitamin D level and systolic blood pressure (P = .0003) was found. A reduced risk for essential hypertension with increased vitamin D level (P = .0003) was also noted. However, no association was found between increasing vitamin D level and a reduction in diastolic blood pressure
(P = .37).10
With the ever-increasing access to health information from sources such as “Doctor Google,” it can be difficult for a non–health care professional to separate hype from evidence-based recommendations. While current evidence suggests optimal vitamin D levels may be beneficial for improving blood pressure control and may be a useful adjunctive therapy, there is no evidence to support discontinuing antihypertensive therapy and replacing it with vitamin D therapy.
Cynthia A. Smith, DNP, APRN, FNP-BC
Renal Consultants, South Charleston, West Virginia
REFERENCES
1. Monfared A, Heidarzadeh A, Ghaffari M, Akbarpour M. Effect of megestrol acetate on serum albumin level in malnourished dialysis patients. J Renal Nutr. 2009;19(2):167-171.
2. Byham-Gray L, Stover J, Wiesen K. A clinical guide to nutrition care in kidney disease. Acad Nutr Diet. 2013.
3. White JV, Guenter P, Jensen G, Malone A, Schofield M; Academy of Nutrition and Dietetics Malnutrition Work Group; ASPEN Malnutrition Task Force; ASPEN Board of Directors. Consensus statement of the Academy of Nutrition and Dietetics/American Society for Parenteral and Enteral Nutrition: characteristics recommended for the identification and documentation of adult malnutrition (undernutrition) [erratum appears in J Acad Nutr Diet. 2012 Nov;112(11):1899].
J Acad Nutr Diet. 2012;112(5):730-738.
4. Rammohan M, Kalantar-Zedeh K, Liang A, Ghossein C. Megestrol acetate in a moderate dose for the treatment of malnutrition-inflammation complex in maintenance dialysis patients. J Ren Nutr. 2005;15(3):345-355.
5. Yeh S, Marandi M, Thode H Jr, et al. Report of a pilot, double blind, placebo-controlled study of megestrol acetate in elderly dialysis patients with cachexia. J Ren Nutr. 2010; 20(1):52-62.
6. Golebiewska JE, Lichodziejewska-Niemierko M, Aleksandrowicz-Wrona E, et al. Megestrol acetate use in hypoalbuminemic dialysis patients [comment]. J Ren Nutr. 2011;21(2): 200-202.
7. Bendik I, Friedel A, Roos FF, et al. Vitamin D: a critical and necessary micronutrient for human health. Front Physiol. 2014;5:248.
8. Cabone F, Mach F, Vuilleumier N, Montecucco F. Potential pathophysiological role for the vitamin D deficiency in essential hypertension. World J Cardiol. 2014;6(5):260-276.
9. Sypniewska G, Pollak J, Strozecki P, et al. 25-hydroxyvitamin D, biomarkers of endothelial dysfunction and subclinical organ damage in adults with hypertension. Am J Hypertens. 2014;27(1):114-121.
10. Vimaleswaran KS, Cavadino A, Berry DJ, et al. Association of vitamin D status with arterial blood pressure and hypertension risk: a mendelian randomisation study. Lancet Diabetes Endocrinol. 2014;2(9):719-729.
| Clinician Reviews in partnership with |
Renal Consult is edited by Jane S. Davis, CRNP, DNP, a member of the Clinician Reviews editorial board, who is a nurse practitioner in the Division of Nephrology at the University of Alabama at Birmingham and is the communications chairperson for the National Kidney Foundation’s Council of Advanced Practitioners (NKF-CAP); and Kim Zuber, PA-C, MSPS, DFAAPA, who is a physician assistant with Metropolitan Nephrology in Alexandria, Virginia, and Clinton, Maryland; she is also past chair of the NKF-CAP. This month’s responses were authored by Luanne DiGuglielmo, MS, RD, CSR, who practices at DaVita Summit Renal Center in Mountainside, New Jersey, and is the Clinical Coordinator for the Dietetic Internship at the College of Saint Elizabeth in Morristown, New Jersey, and Cynthia A. Smith, DNP, APRN, FNP-BC, who practices at Renal Consultants, South Charleston, West Virginia.
Q) One of my patients came in and said he had read that vitamin D supplementation will help with hypertension. Now he wants to quit his blood pressure meds and use vitamin D instead. Do you have any background on this?
Vitamin D is critical for utilization of calcium, a vital nutrient for multiple metabolic and cellular processes; deficiency is associated with worsening of autoimmune disorders, osteoporosis, and certain cardiovascular conditions, among others.7 An association between vitamin D level and blood pressure has been recognized for some time, but the pathophysiology is not well understood.
A literature review of studies from 1988 to 2013 found contradictory results regarding vitamin D deficiency and concurrent elevated blood pressure (systolic and/or diastolic), as well as the impact on blood pressure with restoration of vitamin D levels. The findings were limited by several factors, including differences in study design, variables evaluated, and type of vitamin D compound used. The results suggested a link between the renin-angiotensin-aldosterone system, fibroblast growth factor 23/klotho axis, and vitamin D level.8
A study of 158 subjects (98 with newly diagnosed essential hypertension, 60 with normal blood pressure) found significantly lower 25(OH)D3 serum levels in hypertensive patients. Furthermore, the 25(OH)D3 level was significantly correlated with both systolic (r = –0.33) and diastolic blood pressure (r = –0.26). Using multiple regression analysis, after adjustment for age, smoking status, and BMI, the impact of 25(OH)D3 level accounted for 10% of the variation in systolic blood pressure.9
In a mendelian randomization study of 108,173 subjects from 35 studies, an inverse association between vitamin D level and systolic blood pressure (P = .0003) was found. A reduced risk for essential hypertension with increased vitamin D level (P = .0003) was also noted. However, no association was found between increasing vitamin D level and a reduction in diastolic blood pressure
(P = .37).10
With the ever-increasing access to health information from sources such as “Doctor Google,” it can be difficult for a non–health care professional to separate hype from evidence-based recommendations. While current evidence suggests optimal vitamin D levels may be beneficial for improving blood pressure control and may be a useful adjunctive therapy, there is no evidence to support discontinuing antihypertensive therapy and replacing it with vitamin D therapy.
Cynthia A. Smith, DNP, APRN, FNP-BC
Renal Consultants, South Charleston, West Virginia
REFERENCES
1. Monfared A, Heidarzadeh A, Ghaffari M, Akbarpour M. Effect of megestrol acetate on serum albumin level in malnourished dialysis patients. J Renal Nutr. 2009;19(2):167-171.
2. Byham-Gray L, Stover J, Wiesen K. A clinical guide to nutrition care in kidney disease. Acad Nutr Diet. 2013.
3. White JV, Guenter P, Jensen G, Malone A, Schofield M; Academy of Nutrition and Dietetics Malnutrition Work Group; ASPEN Malnutrition Task Force; ASPEN Board of Directors. Consensus statement of the Academy of Nutrition and Dietetics/American Society for Parenteral and Enteral Nutrition: characteristics recommended for the identification and documentation of adult malnutrition (undernutrition) [erratum appears in J Acad Nutr Diet. 2012 Nov;112(11):1899].
J Acad Nutr Diet. 2012;112(5):730-738.
4. Rammohan M, Kalantar-Zedeh K, Liang A, Ghossein C. Megestrol acetate in a moderate dose for the treatment of malnutrition-inflammation complex in maintenance dialysis patients. J Ren Nutr. 2005;15(3):345-355.
5. Yeh S, Marandi M, Thode H Jr, et al. Report of a pilot, double blind, placebo-controlled study of megestrol acetate in elderly dialysis patients with cachexia. J Ren Nutr. 2010; 20(1):52-62.
6. Golebiewska JE, Lichodziejewska-Niemierko M, Aleksandrowicz-Wrona E, et al. Megestrol acetate use in hypoalbuminemic dialysis patients [comment]. J Ren Nutr. 2011;21(2): 200-202.
7. Bendik I, Friedel A, Roos FF, et al. Vitamin D: a critical and necessary micronutrient for human health. Front Physiol. 2014;5:248.
8. Cabone F, Mach F, Vuilleumier N, Montecucco F. Potential pathophysiological role for the vitamin D deficiency in essential hypertension. World J Cardiol. 2014;6(5):260-276.
9. Sypniewska G, Pollak J, Strozecki P, et al. 25-hydroxyvitamin D, biomarkers of endothelial dysfunction and subclinical organ damage in adults with hypertension. Am J Hypertens. 2014;27(1):114-121.
10. Vimaleswaran KS, Cavadino A, Berry DJ, et al. Association of vitamin D status with arterial blood pressure and hypertension risk: a mendelian randomisation study. Lancet Diabetes Endocrinol. 2014;2(9):719-729.
How to write a suicide risk assessment that’s clinically sound and legally defensible
Suicidologists and legal experts implore clinicians to document their suicide risk assessments (SRAs) thoroughly. It’s difficult, however, to find practical guidance on how to write a clinically sound, legally defensible SRA.
The crux of every SRA is written justification of suicide risk. That justification should reveal your thinking and present a well-reasoned basis for your decision.
Reasoned vs right
It’s more important to provide a justification of suicide risk that’s well-reasoned rather than one that’s right. Suicide is impossible to predict. Instead of prediction, legally we are asked to reasonably anticipate suicide based on clinical facts. In hindsight, especially in the context of a courtroom, decisions might look ill-considered. You need to craft a logical argument, be clear, and avoid jargon.
Convey thoroughness by covering each component of an SRA. Use the mnemonic device CAIPS to help the reader (and you) understand how a conclusion was reached based on the facts of the case.
Chronic and Acute factors. Address the chronic and acute factors that weigh heaviest in your mind. Chronic factors are conditions, past events, and demographics that generally do not change. Acute factors are recent events or conditions that potentially are modifiable. Pay attention to combinations of factors that dramatically elevate risk (eg, previous attempts in the context of acute depression). Avoid repeating every factor, especially when these are documented elsewhere, such as on a checklist.
Imminent warning signs for suicide. Address warning signs (Table 1),1 the nature of current suicidal thoughts (Table 2), and other aspects of mental status (eg, future orientation) that influenced your decision. Use words like “moreover,” “however,” and “in addition” to draw the reader’s attention to the building blocks of your argument.


Protective factors. Discuss the protective factors last; they deserve the least weight because none has been shown to immunize people against suicide. Don’t solely rely on your judgment of what is protective (eg, children in the home). Instead, elicit the patient’s reasons for living and dying. Be concerned if he (she) reports more of the latter.
Summary statement. Make an explicit statement about risk, focusing on imminent risk (ie, the next few hours and days). Avoid a “plot twist,” which is a risk level inconsistent with the preceding evidence, because it suggests an error in judgment. The Box gives an example of a justification that follows the CAIPS method. 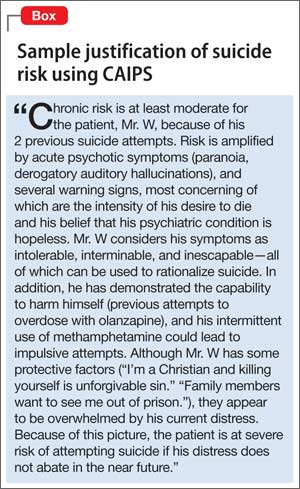
Additional tips
Consider these strategies:
• Bolster your argument by explicitly addressing hopelessness (the strongest psychological correlate of suicide); use quotes from the patient that support your decision; refer to consultation with family members and colleagues; and include pertinent negatives to show completeness2 (ie, “denied suicide plans”).
• Critically resolve discrepancies between what the patient says and behavior that suggests suicidal intent (eg, a patient who minimizes suicidal intent but shopped for a gun yesterday).
• Last, while reviewing your justification, imagine that your patient completed suicide after leaving your office and that you are in court for negligence. In our experience, this exercise reveals dangerous errors of judgment. A clear and reasoned justification will reduce the risk of litigation and help you make prudent treatment plans.
Disclosures
The authors report no financial relationships with any companies whose products are mentioned in this article or with manufacturers of competing products.
1. American Association of Suicidology. Know the warning signs of suicide. http://www.suicidology.org/resources/ warning-signs. Accessed February 9, 2014.
2. Ballas C. How to write a suicide note: practical tips for documenting the evaluation of a suicidal patient. Psychiatric Times. http://www.psychiatrictimes.com/articles/how-write-suicide-note-practical-tips-documenting-evaluation-suicidal-patient. Published May 1, 2007. Accessed July 29, 2013.
Suicidologists and legal experts implore clinicians to document their suicide risk assessments (SRAs) thoroughly. It’s difficult, however, to find practical guidance on how to write a clinically sound, legally defensible SRA.
The crux of every SRA is written justification of suicide risk. That justification should reveal your thinking and present a well-reasoned basis for your decision.
Reasoned vs right
It’s more important to provide a justification of suicide risk that’s well-reasoned rather than one that’s right. Suicide is impossible to predict. Instead of prediction, legally we are asked to reasonably anticipate suicide based on clinical facts. In hindsight, especially in the context of a courtroom, decisions might look ill-considered. You need to craft a logical argument, be clear, and avoid jargon.
Convey thoroughness by covering each component of an SRA. Use the mnemonic device CAIPS to help the reader (and you) understand how a conclusion was reached based on the facts of the case.
Chronic and Acute factors. Address the chronic and acute factors that weigh heaviest in your mind. Chronic factors are conditions, past events, and demographics that generally do not change. Acute factors are recent events or conditions that potentially are modifiable. Pay attention to combinations of factors that dramatically elevate risk (eg, previous attempts in the context of acute depression). Avoid repeating every factor, especially when these are documented elsewhere, such as on a checklist.
Imminent warning signs for suicide. Address warning signs (Table 1),1 the nature of current suicidal thoughts (Table 2), and other aspects of mental status (eg, future orientation) that influenced your decision. Use words like “moreover,” “however,” and “in addition” to draw the reader’s attention to the building blocks of your argument.
Protective factors. Discuss the protective factors last; they deserve the least weight because none has been shown to immunize people against suicide. Don’t solely rely on your judgment of what is protective (eg, children in the home). Instead, elicit the patient’s reasons for living and dying. Be concerned if he (she) reports more of the latter.
Summary statement. Make an explicit statement about risk, focusing on imminent risk (ie, the next few hours and days). Avoid a “plot twist,” which is a risk level inconsistent with the preceding evidence, because it suggests an error in judgment. The Box gives an example of a justification that follows the CAIPS method.
Additional tips
Consider these strategies:
• Bolster your argument by explicitly addressing hopelessness (the strongest psychological correlate of suicide); use quotes from the patient that support your decision; refer to consultation with family members and colleagues; and include pertinent negatives to show completeness2 (ie, “denied suicide plans”).
• Critically resolve discrepancies between what the patient says and behavior that suggests suicidal intent (eg, a patient who minimizes suicidal intent but shopped for a gun yesterday).
• Last, while reviewing your justification, imagine that your patient completed suicide after leaving your office and that you are in court for negligence. In our experience, this exercise reveals dangerous errors of judgment. A clear and reasoned justification will reduce the risk of litigation and help you make prudent treatment plans.
Disclosures
The authors report no financial relationships with any companies whose products are mentioned in this article or with manufacturers of competing products.
1. American Association of Suicidology. Know the warning signs of suicide. http://www.suicidology.org/resources/ warning-signs. Accessed February 9, 2014.
2. Ballas C. How to write a suicide note: practical tips for documenting the evaluation of a suicidal patient. Psychiatric Times. http://www.psychiatrictimes.com/articles/how-write-suicide-note-practical-tips-documenting-evaluation-suicidal-patient. Published May 1, 2007. Accessed July 29, 2013.
When your diagnosis is questioned
When patients question your diagnosis, how do you react?
As physicians, we take great pride in our ability to diagnose and treat disease, and as hospitalists, our patients are sicker, so we need to make the right diagnosis and make it fast. A diagnostic delay of even a few days can sometimes cost a patient his life.

So when the patient or a family member disagrees with your diagnosis – especially when they have no remote understanding of the condition – it can be easy to dismiss their concerns. And then there are the times when you’ve missed something and they are right.
I will never forget a 60-year-old male patient I encountered early in my career as a hospitalist. He had presented with diffuse abdominal pain which later localized to both lower quadrants, diarrhea, and CT scan evidence of gastroenteritis. Multiple doctors who saw the patient before me all had the same diagnosis, a simple case of gastroenteritis. By day 2, he was afebrile, had a normal white blood cell count, was eating, and was ambulating down the hallway with his large family, seemingly in no distress.
He related that he still had abdominal pain, but felt comfortable with his diagnosis and was amenable to being discharged to follow-up with the gastroenterologist who had consulted on him during his stay in the hospital. His niece, on the other hand, was not happy with the diagnosis. The look on her face was intense, not disrespectful, as she related her conviction that her uncle had something more going on than a bout of gastroenteritis. She knew her uncle far better than I did, and his pain was concerning to her.
So I went back to the drawing board to make sure nothing had been missed, and there, hidden in plain sight, was a vital piece of information that we had all overlooked. The CT scan report that showed signs consistent with gastroenteritis made no mention whatsoever of his appendix.
Not satisfied with simply having another radiologist read the film, I insisted that a surgeon see the patient. To the surgeon’s great surprise, and mine, he found evidence of appendicitis. By 10 a.m. the next morning, the patient was in the OR having a now-perforated appendix removed. After numerous apologies to the family and patient, he was discharged home on postop day 2, doing well.
That very scary near miss taught me a valuable lesson: Sometimes the gut instinct of patients and their family members is just as accurate as the gut instinct of a physician, and we need to fully respect their input, whether or not we agree with them.
Dr. Hester is a hospitalist at Baltimore-Washington Medical Center in Glen Burnie, Md. She is the creator of the Patient Whiz, a patient-engagement app for iOS. Reach her at [email protected].
When patients question your diagnosis, how do you react?
As physicians, we take great pride in our ability to diagnose and treat disease, and as hospitalists, our patients are sicker, so we need to make the right diagnosis and make it fast. A diagnostic delay of even a few days can sometimes cost a patient his life.
So when the patient or a family member disagrees with your diagnosis – especially when they have no remote understanding of the condition – it can be easy to dismiss their concerns. And then there are the times when you’ve missed something and they are right.
I will never forget a 60-year-old male patient I encountered early in my career as a hospitalist. He had presented with diffuse abdominal pain which later localized to both lower quadrants, diarrhea, and CT scan evidence of gastroenteritis. Multiple doctors who saw the patient before me all had the same diagnosis, a simple case of gastroenteritis. By day 2, he was afebrile, had a normal white blood cell count, was eating, and was ambulating down the hallway with his large family, seemingly in no distress.
He related that he still had abdominal pain, but felt comfortable with his diagnosis and was amenable to being discharged to follow-up with the gastroenterologist who had consulted on him during his stay in the hospital. His niece, on the other hand, was not happy with the diagnosis. The look on her face was intense, not disrespectful, as she related her conviction that her uncle had something more going on than a bout of gastroenteritis. She knew her uncle far better than I did, and his pain was concerning to her.
So I went back to the drawing board to make sure nothing had been missed, and there, hidden in plain sight, was a vital piece of information that we had all overlooked. The CT scan report that showed signs consistent with gastroenteritis made no mention whatsoever of his appendix.
Not satisfied with simply having another radiologist read the film, I insisted that a surgeon see the patient. To the surgeon’s great surprise, and mine, he found evidence of appendicitis. By 10 a.m. the next morning, the patient was in the OR having a now-perforated appendix removed. After numerous apologies to the family and patient, he was discharged home on postop day 2, doing well.
That very scary near miss taught me a valuable lesson: Sometimes the gut instinct of patients and their family members is just as accurate as the gut instinct of a physician, and we need to fully respect their input, whether or not we agree with them.
Dr. Hester is a hospitalist at Baltimore-Washington Medical Center in Glen Burnie, Md. She is the creator of the Patient Whiz, a patient-engagement app for iOS. Reach her at [email protected].
