User login
How Should Hyponatremia Be Evaluated and Managed?
Case
A 67-year-old male patient who has depression and is on sertraline presents with increasing confusion over the past week. Initial plasma sodium is 109 mEq/L. On exam, he weighs 70 kg and is euvolemic. His urine osmolarity (Uosm) is 800 mosm/L with a urine sodium (UNa) of 40 mEq/L. He is somnolent but awakens to sternal rub. How should this patient’s hyponatremia be evaluated and managed?
Overview
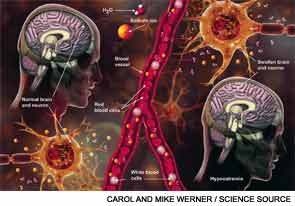
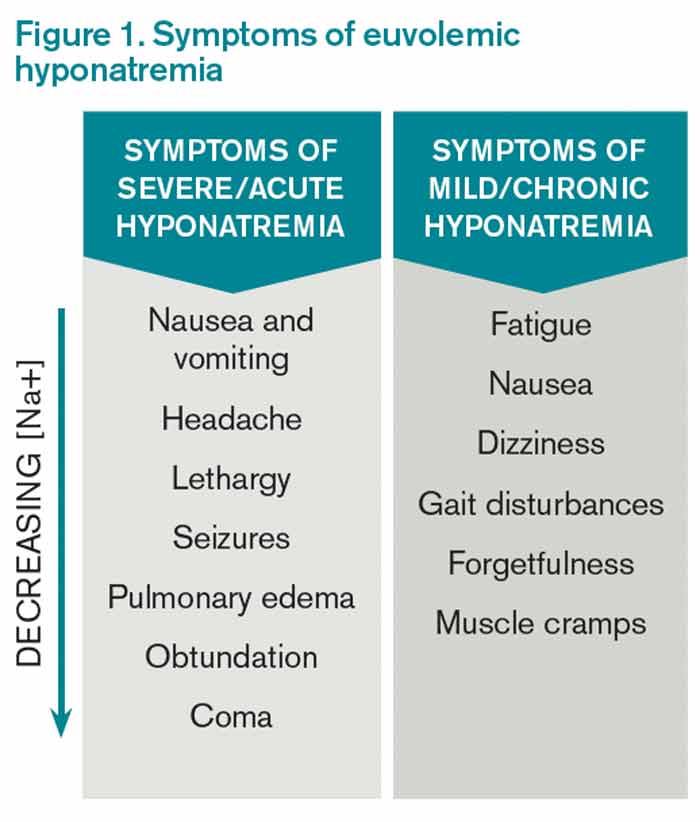
Hyponatremia, a disorder of excess total body water in relation to sodium, occurs in up to 42% of hospitalized patients.1,2 Regardless of the cause, hyponatremia is usually associated with the syndrome of inappropriate antidiuretic hormone secretion (SIADH) or with the appropriate elevation of antidiuretic hormone (ADH), known as hypovolemia. ADH is produced in the hypothalamus and released in the posterior pituitary in response to increasing plasma osmolarity (pOSM) or effective circulating volume depletion. ADH acts in the cortical collecting duct to increase the number of luminal aquaporin channels, increasing water reabsorption and decreasing plasma osmolarity. When hyponatremia is severe, the movement of water into cells causes cellular brain swelling, and clinical symptoms progress from malaise, headache, and nausea to obtundation, seizures, or respiratory arrest (see Figure 1). Even mild, chronic hyponatremia (120-131 mEq/L) is associated with an increased risk of falls due to mild gait and attention impairment.3
Evaluation
Step 1: Plasma osmolarity
The first step in diagnosing the cause of hyponatremia and treating it is to measure pOSM. The majority of patients with hyponatremia have hypoosmolar hyponatremia and therefore have a low pOSM; however, patients may have normal or high osmolarity. Hyponatremia with normal osmolarity can be caused by pseudohyponatremia (i.e., hyperglycemia, paraproteinemia, hyperlipidemia), severe renal failure, ingestion of excess alcohol, or post-transurethral resection of prostate or bladder.
Hyponatremia with high pOSM occurs as a result of elevated levels of an extra solute in the plasma that does not readily enter cells. This draws water into the extracellular fluid and lowers the sodium concentration. This will most commonly result from hyperglycemia or infusion of mannitol.
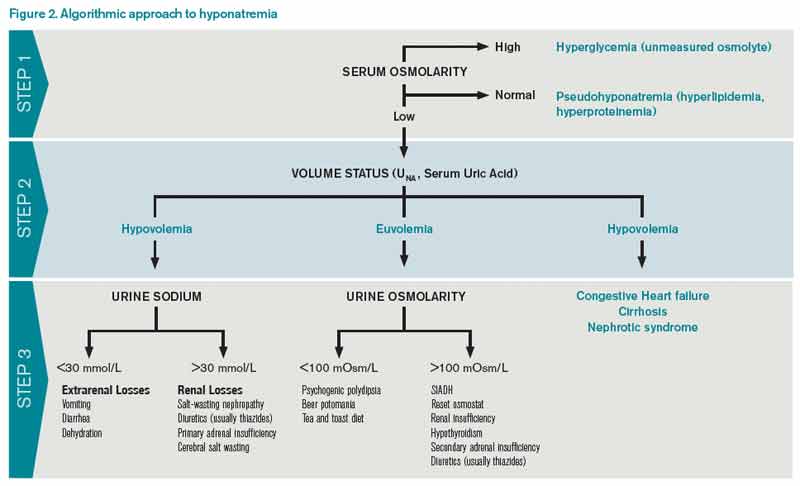
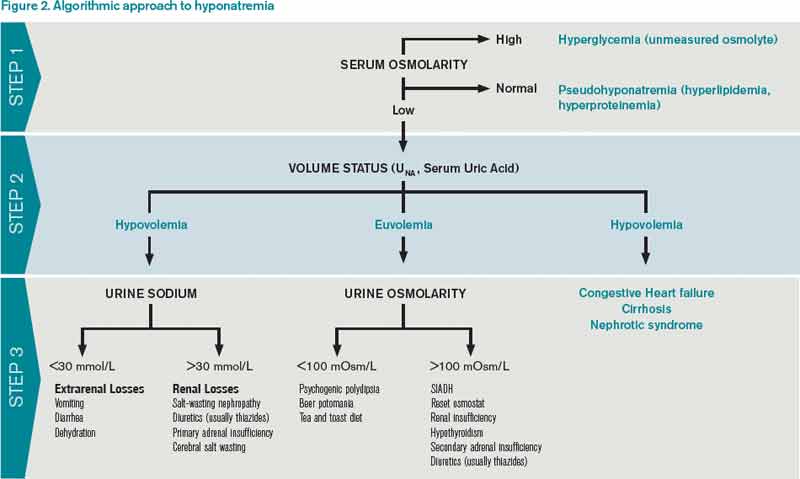
Step 2: Assess volume status with physical exam, urine sodium (UNa)
The majority of patients with hyponatremia will have low pOSM. These patients should be categorized by volume status: hypovolemic, euvolemic, or hypervolemic (see Figure 2). On exam, hypervolemia is usually evident, and the cause of hypervolemic hyponatremia is usually elicited from a patient’s history; however, differentiating between hypovolemic and euvolemic hyponatremia by history and physical exam can be difficult, because examination findings are neither sensitive nor specific.4 UNa should always be evaluated, especially when differentiating between hypovolemic and euvolemic. This was illustrated in a study of 58 non-edematous patients with hyponatremia. Investigators determined which patients had hypovolemic hyponatremia based on their response to saline infusion. Of the patients identified as hypovolemic using physical exam, only 47% responded to saline. In contrast, a spot UNa of less than 30 mEq/L was 80% sensitive and 100% specific for saline responsiveness.5 Although the majority of hypovolemic hyponatremia patients will have a low UNa, the following causes of hypovolemic hyponatremia can result in high UNa: diuretics, adrenal insufficiency, salt-wasting nephropathy, and cerebral salt-wasting.
A low serum uric acid can also be useful in differentiating hypovolemic and euvolemic hyponatremia, which is most commonly caused by SIADH. In SIADH, there is urinary wasting of uric acid, which leads to low serum uric acid. In a study of 105 patients with lung cancer, a serum uric acid of less than 4 mg/dL was 75% sensitive and 89% specific for SIADH.6
Step 3: Urine osmolarity
After determining volume status, the physician should determine if there is excess ADH by measuring Uosm. Under normal conditions, hyponatremia should suppress ADH secretion and allow the kidney to excrete water by diluting the urine to less than 100 mosm/L. If Uosm is less than 100 mosm/L, then the kidneys are responding appropriately and can only persist in the following situations: The patient is drinking large volumes of water (e.g. primary polydipsia), there is insufficient solute to excrete free water (e.g. beer potomania, “tea and toast” diet), or the patient has a different set point for ADH suppression (i.e., reset osmostat). After determining volume status, UNa, and Uosm, the physician will have narrowed the cause of hyponatremia significantly (see Figure 2). Of note, when SIADH is diagnosed, it is important to look for and reverse causes (see Figure 3).
Treatment
Severe symptomatic hyponatremia
In patients with severe neurologic symptoms, physicians must balance the need to reduce symptoms quickly with the dangers of overly rapid correction. After its use in marathon runners, several experts have endorsed the following regimen to reduce symptoms rapidly: an intravenous bolus of 100 mL of 3% saline is given and repeated if symptoms persist after 10 minutes.7,8 Once symptoms improve, the basal rate can be calculated using the equation below, but the rate of sodium correction in 24 hours with this regimen should not exceed 6 to 8 mEq/L in 24 hours or 12 to 14 mEq/L in 48 hours.9,10 This is based on several case studies showing that there were no cases of central pontine myelinolysis (CPM) if correction rates were less than 10 mEq/L over 24 hours.11,12
It is important to remember that this is only a rough guide, because the equation assumes the entire infusate is retained and there is no sodium or water output. The best way to avoid overly rapid correction is to check serum sodium every two hours and monitor urine output closely. If the patient is making large volumes of urine, serum sodium may be rising too quickly. If the patient corrects too rapidly, it may be possible to avoid CPM by re-lowering the sodium.13 This can be accomplished by giving desmopressin to slow urinary free water loss while simultaneously giving hypotonic fluids.
Asymptomatic or mildly symptomatic hyponatremia
Hypovolemic hyponatremia: Treatment of hypovolemic hyponatremia is aimed at correcting volume status, the underlying problem that drives ADH secretion. The body will always choose to preserve volume over osmolarity. In most cases, normal saline (NS) should be used to restore intravascular volume, and the rate of infusion can be calculated using the same equation as above. Once volume is replete, ADH release will cease. Patients will be in danger of overly rapid correction of serum sodium, so fluids should be switched to hypotonic solutions, such as ½ NS.
Euvolemic Hyponatremia: Euvolemic hyponatremia, typically caused by SIADH, is characterized by a high Uosm (>100 mosm/L) and a high UNa (>30 mEq/L). All patients require free water restriction, and fluid intake should be at least 500 mL below a patient’s urine output, usually one liter or less. If this is ineffective, salt tabs can be given. Salt tabs will increase the solute load, necessitating an increase in urine output. Patients should be given approximately nine grams of salt tabs in three divided doses (equivalent to 1 L of NS). Patients with highly concentrated urine (Uosm >500 mosm/L) will not respond as well to the salt load, because the kidneys will continue to excrete much of the sodium in a concentrated urine. In such patients, a loop diuretic can be used to help excrete free water, because it decreases the Uosm to about ½ NS (154 mOsm/L). One possible regimen is 20-40 mg of oral furosemide two to three times daily.
Hypervolemic Hyponatremia: Hypervolemic hyponatremia is caused by congestive heart failure (CHF), cirrhosis, or nephrotic syndrome. In all cases, there is excess ADH as a result of the carotid baroreceptors sensing a decrease in effective circulation volume. In the case of CHF and cirrhosis, the degree of hyponatremia is a marker of disease severity, but there is no data to show that correction of hyponatremia improves outcomes. Fluid restriction is the cornerstone of therapy, but if the patient’s volume status is not optimized, then loop diuretics may improve hyponatremia through excretion of diluted urine. In addition, angiotensin-converting enzyme inhibitors can improve hyponatremia in CHF by reducing ADH levels and improving cardiac output via afterload reduction.
There has been recent interest in the use of vasopressin V2 receptor antagonists or “vaptans.” The SALT 1 and 2 trials, which included patients with CHF and cirrhosis, showed that they are effective in increasing serum sodium and improving mental function in the short term. But there are concerns about hepatotoxicity, overly rapid correction of serum sodium, lack of mortality benefit, and cost.14 The latest American Heart Association CHF guidelines recommend (class IIb) vaptans in patients with “hyponatremia that may be causing cognitive symptoms when standard measures have failed.”15 Tolvaptan, in particular, should not be used in cirrhotic patients due to concerns of hepatotoxicity.
Outcome of the Case
Because of the high UNa and Uosm and the use of a selective serotonin reuptake inhibitor (SSRI), the treating physician suspects the patient has SIADH. Given the severe symptoms, he is given 100 mL of 3% hypertonic saline and experiences improvement in his lethargy. Repeat sodium is 112 mEq/L. Using the equation above, a basal rate is calculated:
Change in serum sodium from 1 L of 3% saline= 514 mEq/L -112 mEq/L = 9.4 mEq 43 L
Because the goal correction rate is 6-8 mEq/L in 24 hours and the sodium has already increased by three, the physician elects to increase the sodium by 5 mEq/L for a total of 8 mEq/L for 24 hours:
5.0 mEq x 1000 ml = 532 ml of 3% saline ÷ 24 hours = 22 mL/hr. 9.4 mEq
Serum sodium is checked every two hours. The following day, the sodium is 115 mEq/L and the patient is fully alert. The hypertonic saline is stopped and the patient is maintained on free water restriction. Some 72 hours later, the sodium is 124 mEq/L.
Dr. Chang is co-director of the medicine-geriatrics clerkship, director of education in the division of hospital medicine, and assistant professor in the department of medicine at Mount Sinai Medical Center in New York City. Dr. Madeira is clinical instructor in the department of general internal medicine at the NYU School of Medicine and a hospitalist at the VA NY Harbor Healthcare System.
References
- Hoorn EJ, Lindemans J, Zietse R. Development of severe hyponatraemia in hospitalized patients: Treatment-related risk factors and inadequate management. Nephrol Dial Transplant. 2006;21(1):70-76.
- Hawkins RC. Age and gender as risk factors for hyponatremia and hypernatremia. Clin Chim Acta. 2003;337(1-2):169-172.
- Renneboog B, Musch W, Vandemergel X, Manto MU, Decaux G. Mild chronic hyponatremia is associated with falls, unsteadiness, and attention deficits. Am J Med. 2006;119(1):71.e1-8.
- McGee S, Abernethy WB 3rd, Simel DL. The rational clinical examination: Is this patient hypovolemic? JAMA. 1999;281(11):1022-1029.
- Chung HM, Kluge R, Schrier RW, Anderson RJ. Clinical assessment of extracellular fluid volume in hyponatremia. Am J Med. 1987;83(5):905-908.
- Passamonte PM. Hypouricemia, inappropriate secretion of antidiuretic hormone, and small cell carcinoma of the lung. Arch Intern Med. 1984;144(8):1569-1570.
- Verbalis JG, Goldsmith SR, Greenberg A, et al. Diagnosis, evaluation, and treatment of hyponatremia: expert panel recommendations. Am J Med. 2013;126(10 Suppl 1):S1-42.
- Rogers IR, Hook G, Stuempfle KJ, Hoffman MD, Hew-Butler, T. An intervention study of oral versus intravenous hypertonic saline administration in ultramarathon runners with exercise-associated hyponatremia: a preliminary randomized trial. Clin J Sport Med. 2011;21(3):200-203.
- Adrogué HJ, Madias NE. Hyponatremia. N Engl J Med. 2000;342(21):1581-1589.
- Tzamaloukas AH, Malhotra D, Rosen BH, Raj DS, Murata GH, Shapiro JI. Principles of management of severe hyponatremia. J Am Heart Assoc. 2013;2(1):e005199.
- Sterns RH. Severe symptomatic hyponatremia: Treatment and outcome. A study of 64 cases. Ann Intern Med. 1987;107(5):656-664.
- Karp BI, Laureno R. Pontine and extrapontine myelinolysis: a neurologic disorder following rapid correction of hyponatremia. Medicine (Baltimore). 1993;72(6):359-373.
- Soupart A, Penninckx R, Crenier L, Stenuit A, Perier O, Decaux G. Prevention of brain demyelination in rats after excessive correction of chronic hyponatremia by serum sodium lowering. Kidney Int. 1994;45(1):193-200.
- Schrier RW, Gross P, Gheorghiade M, et al. Tolvaptan, a selective oral vasopressin V2-receptor antagonist, for hyponatremia. N Engl J Med. 2006;355(20):2099-2112.
- Yancy CW, Jessup M, Bozkurt B, et al. 2013 ACCF/AHA guideline for the management of heart failure: A report of the American College of Cardiology Foundation/American Heart Association Task Force on Practice Guidelines. J Am Coll Cardiol. 2013;62(16):e147-239.
Case
A 67-year-old male patient who has depression and is on sertraline presents with increasing confusion over the past week. Initial plasma sodium is 109 mEq/L. On exam, he weighs 70 kg and is euvolemic. His urine osmolarity (Uosm) is 800 mosm/L with a urine sodium (UNa) of 40 mEq/L. He is somnolent but awakens to sternal rub. How should this patient’s hyponatremia be evaluated and managed?
Overview
Hyponatremia, a disorder of excess total body water in relation to sodium, occurs in up to 42% of hospitalized patients.1,2 Regardless of the cause, hyponatremia is usually associated with the syndrome of inappropriate antidiuretic hormone secretion (SIADH) or with the appropriate elevation of antidiuretic hormone (ADH), known as hypovolemia. ADH is produced in the hypothalamus and released in the posterior pituitary in response to increasing plasma osmolarity (pOSM) or effective circulating volume depletion. ADH acts in the cortical collecting duct to increase the number of luminal aquaporin channels, increasing water reabsorption and decreasing plasma osmolarity. When hyponatremia is severe, the movement of water into cells causes cellular brain swelling, and clinical symptoms progress from malaise, headache, and nausea to obtundation, seizures, or respiratory arrest (see Figure 1). Even mild, chronic hyponatremia (120-131 mEq/L) is associated with an increased risk of falls due to mild gait and attention impairment.3
Evaluation
Step 1: Plasma osmolarity
The first step in diagnosing the cause of hyponatremia and treating it is to measure pOSM. The majority of patients with hyponatremia have hypoosmolar hyponatremia and therefore have a low pOSM; however, patients may have normal or high osmolarity. Hyponatremia with normal osmolarity can be caused by pseudohyponatremia (i.e., hyperglycemia, paraproteinemia, hyperlipidemia), severe renal failure, ingestion of excess alcohol, or post-transurethral resection of prostate or bladder.
Hyponatremia with high pOSM occurs as a result of elevated levels of an extra solute in the plasma that does not readily enter cells. This draws water into the extracellular fluid and lowers the sodium concentration. This will most commonly result from hyperglycemia or infusion of mannitol.
Step 2: Assess volume status with physical exam, urine sodium (UNa)
The majority of patients with hyponatremia will have low pOSM. These patients should be categorized by volume status: hypovolemic, euvolemic, or hypervolemic (see Figure 2). On exam, hypervolemia is usually evident, and the cause of hypervolemic hyponatremia is usually elicited from a patient’s history; however, differentiating between hypovolemic and euvolemic hyponatremia by history and physical exam can be difficult, because examination findings are neither sensitive nor specific.4 UNa should always be evaluated, especially when differentiating between hypovolemic and euvolemic. This was illustrated in a study of 58 non-edematous patients with hyponatremia. Investigators determined which patients had hypovolemic hyponatremia based on their response to saline infusion. Of the patients identified as hypovolemic using physical exam, only 47% responded to saline. In contrast, a spot UNa of less than 30 mEq/L was 80% sensitive and 100% specific for saline responsiveness.5 Although the majority of hypovolemic hyponatremia patients will have a low UNa, the following causes of hypovolemic hyponatremia can result in high UNa: diuretics, adrenal insufficiency, salt-wasting nephropathy, and cerebral salt-wasting.
A low serum uric acid can also be useful in differentiating hypovolemic and euvolemic hyponatremia, which is most commonly caused by SIADH. In SIADH, there is urinary wasting of uric acid, which leads to low serum uric acid. In a study of 105 patients with lung cancer, a serum uric acid of less than 4 mg/dL was 75% sensitive and 89% specific for SIADH.6
Step 3: Urine osmolarity
After determining volume status, the physician should determine if there is excess ADH by measuring Uosm. Under normal conditions, hyponatremia should suppress ADH secretion and allow the kidney to excrete water by diluting the urine to less than 100 mosm/L. If Uosm is less than 100 mosm/L, then the kidneys are responding appropriately and can only persist in the following situations: The patient is drinking large volumes of water (e.g. primary polydipsia), there is insufficient solute to excrete free water (e.g. beer potomania, “tea and toast” diet), or the patient has a different set point for ADH suppression (i.e., reset osmostat). After determining volume status, UNa, and Uosm, the physician will have narrowed the cause of hyponatremia significantly (see Figure 2). Of note, when SIADH is diagnosed, it is important to look for and reverse causes (see Figure 3).
Treatment
Severe symptomatic hyponatremia
In patients with severe neurologic symptoms, physicians must balance the need to reduce symptoms quickly with the dangers of overly rapid correction. After its use in marathon runners, several experts have endorsed the following regimen to reduce symptoms rapidly: an intravenous bolus of 100 mL of 3% saline is given and repeated if symptoms persist after 10 minutes.7,8 Once symptoms improve, the basal rate can be calculated using the equation below, but the rate of sodium correction in 24 hours with this regimen should not exceed 6 to 8 mEq/L in 24 hours or 12 to 14 mEq/L in 48 hours.9,10 This is based on several case studies showing that there were no cases of central pontine myelinolysis (CPM) if correction rates were less than 10 mEq/L over 24 hours.11,12
It is important to remember that this is only a rough guide, because the equation assumes the entire infusate is retained and there is no sodium or water output. The best way to avoid overly rapid correction is to check serum sodium every two hours and monitor urine output closely. If the patient is making large volumes of urine, serum sodium may be rising too quickly. If the patient corrects too rapidly, it may be possible to avoid CPM by re-lowering the sodium.13 This can be accomplished by giving desmopressin to slow urinary free water loss while simultaneously giving hypotonic fluids.
Asymptomatic or mildly symptomatic hyponatremia
Hypovolemic hyponatremia: Treatment of hypovolemic hyponatremia is aimed at correcting volume status, the underlying problem that drives ADH secretion. The body will always choose to preserve volume over osmolarity. In most cases, normal saline (NS) should be used to restore intravascular volume, and the rate of infusion can be calculated using the same equation as above. Once volume is replete, ADH release will cease. Patients will be in danger of overly rapid correction of serum sodium, so fluids should be switched to hypotonic solutions, such as ½ NS.
Euvolemic Hyponatremia: Euvolemic hyponatremia, typically caused by SIADH, is characterized by a high Uosm (>100 mosm/L) and a high UNa (>30 mEq/L). All patients require free water restriction, and fluid intake should be at least 500 mL below a patient’s urine output, usually one liter or less. If this is ineffective, salt tabs can be given. Salt tabs will increase the solute load, necessitating an increase in urine output. Patients should be given approximately nine grams of salt tabs in three divided doses (equivalent to 1 L of NS). Patients with highly concentrated urine (Uosm >500 mosm/L) will not respond as well to the salt load, because the kidneys will continue to excrete much of the sodium in a concentrated urine. In such patients, a loop diuretic can be used to help excrete free water, because it decreases the Uosm to about ½ NS (154 mOsm/L). One possible regimen is 20-40 mg of oral furosemide two to three times daily.
Hypervolemic Hyponatremia: Hypervolemic hyponatremia is caused by congestive heart failure (CHF), cirrhosis, or nephrotic syndrome. In all cases, there is excess ADH as a result of the carotid baroreceptors sensing a decrease in effective circulation volume. In the case of CHF and cirrhosis, the degree of hyponatremia is a marker of disease severity, but there is no data to show that correction of hyponatremia improves outcomes. Fluid restriction is the cornerstone of therapy, but if the patient’s volume status is not optimized, then loop diuretics may improve hyponatremia through excretion of diluted urine. In addition, angiotensin-converting enzyme inhibitors can improve hyponatremia in CHF by reducing ADH levels and improving cardiac output via afterload reduction.
There has been recent interest in the use of vasopressin V2 receptor antagonists or “vaptans.” The SALT 1 and 2 trials, which included patients with CHF and cirrhosis, showed that they are effective in increasing serum sodium and improving mental function in the short term. But there are concerns about hepatotoxicity, overly rapid correction of serum sodium, lack of mortality benefit, and cost.14 The latest American Heart Association CHF guidelines recommend (class IIb) vaptans in patients with “hyponatremia that may be causing cognitive symptoms when standard measures have failed.”15 Tolvaptan, in particular, should not be used in cirrhotic patients due to concerns of hepatotoxicity.
Outcome of the Case
Because of the high UNa and Uosm and the use of a selective serotonin reuptake inhibitor (SSRI), the treating physician suspects the patient has SIADH. Given the severe symptoms, he is given 100 mL of 3% hypertonic saline and experiences improvement in his lethargy. Repeat sodium is 112 mEq/L. Using the equation above, a basal rate is calculated:
Change in serum sodium from 1 L of 3% saline= 514 mEq/L -112 mEq/L = 9.4 mEq 43 L
Because the goal correction rate is 6-8 mEq/L in 24 hours and the sodium has already increased by three, the physician elects to increase the sodium by 5 mEq/L for a total of 8 mEq/L for 24 hours:
5.0 mEq x 1000 ml = 532 ml of 3% saline ÷ 24 hours = 22 mL/hr. 9.4 mEq
Serum sodium is checked every two hours. The following day, the sodium is 115 mEq/L and the patient is fully alert. The hypertonic saline is stopped and the patient is maintained on free water restriction. Some 72 hours later, the sodium is 124 mEq/L.
Dr. Chang is co-director of the medicine-geriatrics clerkship, director of education in the division of hospital medicine, and assistant professor in the department of medicine at Mount Sinai Medical Center in New York City. Dr. Madeira is clinical instructor in the department of general internal medicine at the NYU School of Medicine and a hospitalist at the VA NY Harbor Healthcare System.
References
- Hoorn EJ, Lindemans J, Zietse R. Development of severe hyponatraemia in hospitalized patients: Treatment-related risk factors and inadequate management. Nephrol Dial Transplant. 2006;21(1):70-76.
- Hawkins RC. Age and gender as risk factors for hyponatremia and hypernatremia. Clin Chim Acta. 2003;337(1-2):169-172.
- Renneboog B, Musch W, Vandemergel X, Manto MU, Decaux G. Mild chronic hyponatremia is associated with falls, unsteadiness, and attention deficits. Am J Med. 2006;119(1):71.e1-8.
- McGee S, Abernethy WB 3rd, Simel DL. The rational clinical examination: Is this patient hypovolemic? JAMA. 1999;281(11):1022-1029.
- Chung HM, Kluge R, Schrier RW, Anderson RJ. Clinical assessment of extracellular fluid volume in hyponatremia. Am J Med. 1987;83(5):905-908.
- Passamonte PM. Hypouricemia, inappropriate secretion of antidiuretic hormone, and small cell carcinoma of the lung. Arch Intern Med. 1984;144(8):1569-1570.
- Verbalis JG, Goldsmith SR, Greenberg A, et al. Diagnosis, evaluation, and treatment of hyponatremia: expert panel recommendations. Am J Med. 2013;126(10 Suppl 1):S1-42.
- Rogers IR, Hook G, Stuempfle KJ, Hoffman MD, Hew-Butler, T. An intervention study of oral versus intravenous hypertonic saline administration in ultramarathon runners with exercise-associated hyponatremia: a preliminary randomized trial. Clin J Sport Med. 2011;21(3):200-203.
- Adrogué HJ, Madias NE. Hyponatremia. N Engl J Med. 2000;342(21):1581-1589.
- Tzamaloukas AH, Malhotra D, Rosen BH, Raj DS, Murata GH, Shapiro JI. Principles of management of severe hyponatremia. J Am Heart Assoc. 2013;2(1):e005199.
- Sterns RH. Severe symptomatic hyponatremia: Treatment and outcome. A study of 64 cases. Ann Intern Med. 1987;107(5):656-664.
- Karp BI, Laureno R. Pontine and extrapontine myelinolysis: a neurologic disorder following rapid correction of hyponatremia. Medicine (Baltimore). 1993;72(6):359-373.
- Soupart A, Penninckx R, Crenier L, Stenuit A, Perier O, Decaux G. Prevention of brain demyelination in rats after excessive correction of chronic hyponatremia by serum sodium lowering. Kidney Int. 1994;45(1):193-200.
- Schrier RW, Gross P, Gheorghiade M, et al. Tolvaptan, a selective oral vasopressin V2-receptor antagonist, for hyponatremia. N Engl J Med. 2006;355(20):2099-2112.
- Yancy CW, Jessup M, Bozkurt B, et al. 2013 ACCF/AHA guideline for the management of heart failure: A report of the American College of Cardiology Foundation/American Heart Association Task Force on Practice Guidelines. J Am Coll Cardiol. 2013;62(16):e147-239.
Epidemiology, Consequences of Non-Leg VTE
Clinical question: Which risk factors are key in the development of nonleg deep vein thromboses (NLDVTs) and what are the expected clinical sequelae from these events?
Background: Critically ill patients are at increased risk of venous thrombosis. Despite adherence to recommended daily thromboprophylaxis, many patients will develop a venous thrombosis in a vein other than the lower extremity. The association between NLDVT and pulmonary embolism (PE) or death is less clearly identified.
Study design: The PROphylaxis for ThromboEmbolism in Critical Care Trial (PROTECT), a multicenter, randomized, blinded, and concealed prospective cohort study occurring between May 2006 and June 2010.
Setting: Sixty-seven international secondary and tertiary care ICUs in both academic and community settings.
Synopsis: Researchers enrolled 3,746 ICU patients in a randomized controlled trial of dalteparin vs. standard heparin for thromboprophylaxis. Of these patients, 84 (2.2%) developed a NLDVT. These thromboses were more likely to be deep and located proximally.
Risk factors were assessed using five selected variables: APACHE [acute physiology and chronic health evaluation], BMI, malignancy, and treatment with vasopressors or statins. Outside of indwelling upper extremity central venous catheters, cancer was the only independent predictor of NLDVT.
Compared to patients without any VTE, those with NLDVT were more likely to develop PE (14.9% vs. 1.9%) and have longer ICU stays (19 vs. nine days). On average, one in seven patients with NLDVT developed PE during their hospital stay. Despite the association with PE, NLDVT was not associated with an increased ICU mortality in an adjusted model.
However, the PROTECT trial may have been underpowered to detect a difference. Additional limitations of the study included a relatively small total number of NLDVTs and a lack of standardized screening protocols for both NLDVT and PE.
Bottom line: Despite universal heparin thromboprophylaxis, many medical-surgical critically ill patients may develop NLDVT, placing them at higher risk for longer ICU stays and PE.
Citation: Lamontagne F, McIntyre L, Dodek P, et al. Nonleg venous thrombosis in critically ill adults: a nested prospective cohort study. JAMA Intern Med. 2014;174(5):689-696.
PODCAST: Highlights of the August 2014 issue of The Hospitalist
Enter text here
Enter text here
Enter text here
Model for End-Stage Liver Disease (MELD) May Help Determine Mortality Risk
Clinical question: How can the model for end-stage liver disease (MELD)-based model be updated and utilized to predict inpatient mortality rates of hospitalized cirrhotic patients with acute variceal bleeding (AVB)?
Background: AVB in cirrhosis continues to carry mortality rates as high as 20%. Risk prediction for individual patients is important to determine when a step-up in acuity of care is needed and to identify patients who would most benefit from preemptive treatments such as a transjugular intrahepatic portosystemic shunt. Many predictive models are available but are currently difficult to apply in the clinical setting.
Study design: Initial comparison data was collected via a prospective study from clinical records. Confirmation of updated MELD model occurred via cohort validation studies.
Setting: Prospective data collected from Hospital Clinic in Barcelona, Spain. Validation cohorts for new MELD model calibration completed in hospital settings in Canada and Spain.
Synopsis: Data was collected from 178 patients with cirrhosis and esophageal AVB receiving standard therapy from 2007-2010. Esophageal bleeding was confirmed endoscopically. The primary endpoint was six-week, bleeding-related mortality. Among all the subjects studied, the average six-week mortality rate was 16%. Models evaluated for validity included the Child-Pugh, the D’Amico and Augustin models, and the MELD score.
Each model was assessed via discrimination, calibration, and overall performance in mortality prediction. The MELD was identified as the best model in terms of discrimination and overall performance but was miscalibrated. The original validation cohort from the Hospital Clinic in Spain was utilized to update the MELD calibration via logistic regression. External validation was completed via cohort studies in Canada (N=240) and at Vall D’Hebron Hospital in Spain (N=221).
Using the updated model, the MELD score adds a predictive component in the setting of AVB that has not been available. MELD values of 19 and higher predict mortality >20%, whereas MELD values lower than 11 predict mortality of 5%.
Bottom line: Utilization of the updated MELD model may provide a more accurate method to identify patients in which more aggressive preemptive therapies are indicated using prognostic predictions of mortality.
Citation: Reverter E, Tandon P, Augustin S, et al. A MELD-based model to determine risk of mortality among patients with acute variceal bleeding. Gastroenterology. 2014;146(2):412-419.
Emergency Department Visits, Hospitalizations Due to Insulin
Clinical question: What is the national burden of ED visits and hospitalizations for insulin-related hypoglycemia?
Background: As the prevalence of diabetes mellitus continues to rise, the use of insulin and the burden of insulin-related hypoglycemia on our healthcare system will increase. By identifying high-risk populations and analyzing the circumstances of insulin-related hypoglycemia, we might be able to identify and employ strategies to decrease the risk of insulin use.
Study design: Observational study using national adverse drug surveillance database and national household survey.
Setting: U.S. hospitals, excluding psychiatric and penal institutions.
Synopsis: Using data from the National Electronic Injury Surveillance System–Cooperative Adverse Drug Event Surveillance (NEISS-CADES) Project and the National Health Interview Survey (NHIS), the authors estimated the rates and characteristics of ED visits and hospitalizations for insulin-related hypoglycemia. The authors estimated that about 100,000 ED visits occur nationally and that almost one-third of those visits result in hospitalization. Compared to younger patients treated with insulin, patients 80 years or older were more likely to present to the ED (rate ratio, 2.5; 95% CI, 1.5-4.3) and much more likely to be subsequently hospitalized (rate ratio, 4.9; 95% CI, 2.6-9.1) for insulin-related hypoglycemia.
The most common causes of insulin-induced hypoglycemia were failure to reduce insulin during periods of reduced food intake and confusion between short-acting and long-acting insulin. The authors suggest that looser glycemic control be sought in elderly patients to decrease the risk of insulin-related hypoglycemia and subsequent sequelae. Patient education addressing common insulin errors might also decrease the burden of ED visits and hospitalizations related to insulin.
Bottom line: Risks of hypoglycemia in patients older than 80 should be considered prior to starting an insulin regimen or prior to increasing the dose of insulin.
Citation: Geller AI, Shehab N, Lovegrove MC, et al. National estimates of insulin-related hypoglycemia and errors leading to emergency department visits and hospitalizations. JAMA Intern Med. 2014;174(5):678-686.
Healthcare Worker Attire Recommendations
Clinical question: What are the perceptions of patients and healthcare personnel (HCP) regarding attire, and what evidence exists for contamination and transmission of pathogenic microorganisms by HCP attire?
Background: HCP attire is an important aspect of the healthcare profession. There is increasing concern for microorganism transmission in the hospital by fomites, including HCP apparel, and studies demonstrate contamination of HCP apparel; however, there is a lack of evidence demonstrating the role of HCP apparel in transmission of microorganisms to patients.
Study design: Literature and policy review, survey of Society for Healthcare Epidemiology of America (SHEA) members.
Setting: Literature search from January 2013 to March 2013 for articles related to bacterial contamination and laundering of HCP attire and patient and provider perceptions of HCP attire and/or footwear. Review of policies related to HCP attire from seven large teaching hospitals.
Synopsis: The search identified 26 articles that studied patients’ perceptions of HCP attire and only four studies that reviewed HCP preferences relating to attire. There were 11 small prospective studies related to pathogen contamination of HCP apparel but no clinical studies demonstrating transmission of pathogens from HCP attire to patients. There was one report of a pathogen outbreak potentially related to HCP apparel.
Hospital policies primarily related to general appearance and dress for all employees without significant specifications for HCP outside of sterile or procedure-based areas. One institution recommended bare below the elbows (BBE) attire for physicians during patient care activities.
There were 337 responses (21.7% response rate) to the survey, which showed poor enforcement of HCP attire policies, but a majority of respondents felt that the role of HCP attire in the transmission of pathogens in the healthcare setting was very important or somewhat important.
Patients preferred formal attire, including a white coat, but this preference had limited impact on patient satisfaction or confidence in practitioners. Patients did not perceive HCP attire as an infection risk but were willing to change their preference for formal attire when informed of this potential risk.
BBE policies are in effect at some U.S. hospitals and in the United Kingdom, but the effect on healthcare-associated infection rates and transmission of pathogens to patients is unknown.
Bottom line: Contamination of HCP attire with healthcare pathogens occurs, but no clinical data currently exists related to transmission of these pathogens to patients and its impact on the healthcare system. Patient satisfaction and confidence are not affected by less formal attire when informed of potential infection risks.
Citation: Bearman G, Bryant K, Leekha S, et al. Healthcare personnel attire in non-operating-room settings. Infect Control Hosp Epidemiol. 2014;35(2):107-121.
Prediction Tool for Readmissions Due to End-of-Life Care
Clinical question: What are the risk factors associated with potentially avoidable readmissions (PARs) for end-of-life care issues?
Background: The 6% of Medicare beneficiaries who die each year account for 30% of yearly Medicare expenditures on medical treatments, with repeated hospitalizations a frequent occurrence at the end of life. There are many opportunities to improve the care of patients at the end of life.
Study design: Nested case-control.
Setting: Academic, tertiary-care medical center.
Synopsis: There were 10,275 eligible admissions to Brigham and Women’s Hospital in Boston from July 1, 2009 to June 30, 2010, with a length of stay less than one day. There were 2,301 readmissions within 30 days of the index hospitalization, of which 826 were considered potentially avoidable. From a random sample of 594 of these patients, 80 patients had PAR related to end-of-life care issues. There were 7,974 patients who were not admitted within 30 days of index admission (controls). The primary study outcome was any 30-day PAR due to end-of-life care issues. A readmission was considered a PAR if it related to previously known conditions from the index hospitalization or was due to a complication of treatment.
The four factors that were significantly associated with 30-day PAR for end-of-life care issues were: neoplasm (OR 5.6, 95% CI: 2.85-11.0), opiate medication at discharge (OR 2.29, 95% CI: 1.29-4.07), Elixhauser comorbidity index, per five-unit increase (OR 1.16, 95% CI: 1.10-1.22), and number of admissions in previous 12 months (OR 1.10, 95% CI: 1.02-1.20). The model that included all four variables had excellent discrimination power, with a C-statistic of 0.85.
Bottom line: The factors from this prediction model can be used, formally or informally, to identify those patients at higher risk for readmission for end-of-life care issues and prioritize resources to help minimize this risk.
Citation: Donzé J, Lipsitz S, Schnipper JL. Risk factors for potentially avoidable readmissions due to end-of-life care issues. J Hosp Med. 2014;9(5):310-314.
Colonic Malignancy Risk Appears Low After Uncomplicated Diverticulitis
Clinical question: What is the benefit of routine colonic evaluation after an episode of acute diverticulitis?
Background: Currently accepted guidelines recommend routine colonic evaluation (colonoscopy, computed tomography (CT) colonography) after an episode of acute diverticulitis to confirm the diagnosis and exclude malignancy. Increased use of CT to confirm the diagnosis of acute diverticulitis and exclude associated complications has brought into question the recommendation for routine colonic evaluation after an episode of acute diverticulitis.
Study design: Meta-analysis.
Setting: Search of online databases and the Cochrane Library.
Synopsis: Eleven studies from seven countries included 1,970 patients who had a colonic evaluation after an episode of acute diverticulitis. The risk of finding a malignancy was 1.6%. Within this population, 1,497 patients were identified as having uncomplicated diverticulitis. Cancer was found in only five patients (proportional risk estimate 0.7%).
For the 79 patients identified as having complicated diverticulitis, the risk of finding a malignancy on subsequent screening was 10.8%.
Every systematic review is limited by the quality of the studies available for review and the differences in design and methodology of the studies. In this meta-analysis, the risk of finding cancer after an episode of uncomplicated diverticulitis appears to be low. Given the limited resources of the healthcare system and the small but real risk of morbidity and mortality associated with invasive colonic procedures, the routine recommendation for colon cancer screening after an episode of acute uncomplicated diverticulitis should be further evaluated.
Bottom line: The risk of malignancy after a radiologically proven episode of acute uncomplicated diverticulitis is low. In the absence of other indications, additional routine colonic evaluation may not be necessary.
Citation: Sharma PV, Eglinton T, Hider P, Frizelle F. Systematic review and meta-analysis of the role of routine colonic evaluation after radiologically confirmed acute diverticulitis. Ann Surg. 2014;259(2):263-272.
Physician Burnout Reduced with Intervention Groups
Clinical question: Does an intervention involving a facilitated physician small group result in improvement in well-being and reduction in burnout?
Background: Burnout affects nearly half of medical students, residents, and practicing physicians in the U.S.; however, very few interventions have been tested to address this problem.
Study design: Randomized controlled trial (RCT).
Setting: Department of Medicine at the Mayo Clinic, Rochester, Minn.
Synopsis: Practicing physicians were randomly assigned to facilitated, small-group intervention curriculum for one hour every two weeks (N=37) or control with unstructured, protected time for one hour every two weeks (N=37). A non-trial cohort of 350 practicing physicians was surveyed annually. This study showed a significant increase in empowerment and engagement at three months that was sustained for 12 months, and a significant decrease in high depersonalization scores was seen at both three and 12 months in the intervention group. There were no significant differences in stress, depression, quality of life, or job satisfaction.
Compared to the non-trial cohort, depersonalization, emotional exhaustion, and overall burnout decreased substantially in the intervention arm and slightly in the control arm.
Sample size was small and results may not be generalizable. Topics covered included reflection, self-awareness, and mindfulness, with a combination of community building and skill acquisition to promote connectedness and meaning in work. It is not clear which elements of the curriculum were most effective.
Bottom line: A facilitated, small-group intervention with institution-provided protected time can improve physician empowerment and engagement and reduce depersonalization, an important component of burnout.
Citation: West CP, Dyrbye LN, Rabatin JT, et al. Intervention to promote physician well-being, job satisfaction, and professionalism: a randomized clinical trial. JAMA Intern Med. 2014;174(4):527-533.
Society of Hospital Medicine’s Project BOOST Pays Off
–Manasi Kekan, MD, MS, FACP, medical director for Houston Methodist Hospital
Financial pressures to reduce 30-day hospital readmissions and improve discharge processes continue to grow. The Centers for Medicare and Medicaid Services started by penalizing hospitals for up to 1% of their Medicare reimbursement via the Hospital Readmissions Reduction Program. By 2015, the program will penalize hospitals up to 3%.
This is no longer news to the hospital C-suite. A 2013 survey reported that 85% of hospital leaders had addressed the readmissions penalty in their business plan (http://content.hcpro.com/pdf/content/296905.pdf); however, the same survey revealed that only 62% of hospital leaders reported changes to clinical protocols and practices during acute care, and even fewer were providing care navigators or coaches for high-risk patients.
That’s where hospitalists can help. Through SHM’s Project BOOST, hospitalists and hospital-based care teams improve transition from hospital to home. Project BOOST also helps hospitals identify high-risk patients and target risk-specific interventions, a critical part of reducing readmissions.
Beyond the immediate financial implications, implementing programs like Project BOOST to reduce readmissions can position hospitals as leaders for better healthcare in their communities.
“I recommend Project BOOST enthusiastically and unequivocally,” says Manasi Kekan, MD, MS, FACP, medical director for Houston Methodist Hospital. “If implemented efficiently, it could result in a ‘win-win’ situation for patients, the hospital, and the healthcare providers.”
SHM is accepting applications for the 2014 Project BOOST cohort through August 30. For details and application, visit www.hospitalmedicine.org/boost.