User login
How Hospitalists Can Prepare for the Physician VBPM Program
Engage
For hospitalists, the first order of business should be ensuring that your group is participating in the Physician Quality Reporting System (PQRS) and receiving the current 0.5% participation bonus (in some cases, that may require an electronic billing system add-on that adds the necessary PQRS codes to claims). If not, you could be leaving an estimated $800 in reporting incentives per hospitalist on the table. Once the PQRS penalty phase begins in 2015, your group could lose 1.5% of CMS reimbursements. Eventually, failure to engage will spur an additional 1% penalty through the Value-Based Payment Modifier (VBPM).
Respond
SHM’s early feedback to CMS was based in part on a problematic Quality and Resource Use Report (QRUR) brought to the society’s attention by a member hospitalist. Dr. Torcson says SHM carefully reviewed that report to register its concerns about proper attribution, fair comparisons, relevant metrics, and other issues. In turn, CMS signaled its appreciation of SHM’s due diligence and has indicated a willingness to work with SHM to address its concerns. The lesson is that a constructive, collaborative process was eased by the willingness of an SHM member to help the society develop a thoughtful and thorough response—one that is more likely to yield sought-after changes by federal officials. “CMS reacts much better to physician groups that are willing to collaborate with them versus the ones that just want to deny, deny, deny that changes are coming,” Dr. Whitcomb says.
Communicate
CMS has indicated that lack of communication among individual physicians and groups won’t excuse anyone from the PQRS and VBPM programs. Hospitalists clearly have an advantage here, and experts say a continued focus on collaborative teamwork and making sure providers are on the same page could help ensure that everyone is making the necessary improvements in care. To keep the conversation going, initiate and take part in online discussions with fellow HM providers via the advocacy and public policy community of SHM’s Hospital Medical Exchange.
Plan
Which PQRS measures are most applicable to you and your colleagues? Make sure you review the final rules and develop a plan for how to address the performance measures that you can control, either directly or indirectly. For group practices with 100 or more eligible providers, the first performance year for the VBPM program begins Jan. 1.
Education, Audits, and Feedback Are Key to Billing Success
The intricacies of billing and coding typically aren’t taught in physician residency training programs.
“Residents want to learn how to take care of patients. They’re not really focused on learning [Centers for Medicare & Medicaid Services] rules,” says Balazs Zsenits, MD, FACP, SFHM, medical director of the Rochester General Hospitalist Group in Rochester, N.Y. As a result, “there’s a knowledge gap” between newly minted physicians and experienced practitioners when it comes to documenting their work.
To bridge that gap, some hospitalist groups offer training on the business side of medicine during physician orientation, as well as provide constructive reviews of hospitalists’ progress notes on a periodic basis. Some hospitals provide seminars in proper documentation.
“I’ve seen a lot of hospitals do ‘lunch and learn’” sessions on documentation requirements, says Angie Comfort, RHIT, CCS, a director of HIM Solutions at the American Health Information Management Association. The goal is to facilitate reimbursement for the hospital from patients’ insurance providers.
“If more specific documentation is not in the record, the coder must ask the physician for additional clarification,” Comfort says. “Without the clarification, sometimes the conditions are not able to be coded.”
The HM group in Rochester, which employs 46 hospitalists, provides about six hours of billing compliance education for new hires during orientation and holds regular, topic-based presentations at weekly staff meetings.
Physicians “need timely information as we submit our own charges, and we set up our productivity bonus so that it depends on our billing accuracy, not just volume,” Dr. Zsenits says. Using an internal Web portal, physicians can look up billing codes and explanations. “They realize the risks involved if they don’t do it right,” she says, so they also accept feedback from reviews of their patient charts.
Easy-to-access information is key to helping hospitalists learn coding requirements. “We have a Web-based documentation education module, so the provider is able to log on from home,” says David Grace, MD, FHM, senior medical officer at The Schumacher Group’s hospital medicine division in Lafayette, La. The practice management company employs hospitalists in 12 states.
Its initial module takes about an hour to review. For those who are already proficient in billing and coding, a test-out option lasting 10 to 15 minutes is available online as well. Pocket cards are provided as a reference thereafter.
“Documentation and coding is a complex entity, and certainly we don’t expect them to remember all the details after one educational module,” Dr. Grace says. “They do have access to be able to go back to it for a refresher whenever they want.”
Internal coding experts audit about 20% of the hospitalists’ work, and audited physicians are provided feedback on compliance. The Schumacher Group also uses a proprietary template to help hospitalists capture the important data points in their patient progress notes.
“Physicians are under a lot of scrutiny by regulatory agencies,” says Peter Thompson, MD, chief of clinical operations at Apogee Physicians, a national hospitalist management company based in Phoenix.
At new hospitalist orientation, called Apogee University, providers spend several hours learning the rules for documentation. The group follows up with regular reviews of hospitalists’ notes through an audit system. A program director “breaks down the components that make it a compliant note or not,” Dr. Thompson says. Audits are performed monthly on every physician.
“It takes a commitment to knowing what the requirements are,” he adds. “And it takes repetition and it takes practice to make something a habit.”
Susan Kreimer is a freelance medical writer in New York.
The Social Network
"Do you think I need Botox?" Nora asks.
This is her first visit. On the sign-in sheet, next to "Reason for today’s visit," she’s written, "Mole check. Questions about Botox and fillers. Skin care advice." I check the moles on her neck that concern her.
"I just turned 40." she says, "Is Botox is something I ought to do? My wrinkles aren’t so deep" – she furrows her face, "but maybe I should do it before they get deeper.
"I just moved to Boston from Los Angeles," she continues. "I saw an esthetician there, who looked at the hollows under my eyes and said, ‘You definitely need Juvéderm.’ Do you think I need that?"
Nora is obviously a "cosmetic" patient, but the problem with labeling her that way has something in common with labeling any patient, even a "medical" one, as an individual, in isolation. No one lives in isolation. We live with other people, and what we think of our health, or our appearance, has a lot to do with what other people think.
How many patients come in with an itch, a rash, or a lesion, that’s been there a long time? Why come today? Because someone – a relative, friend, grandchild – said, "Get that looked at!" The relevance of this homely observation is that we don’t necessarily have to bother people with treatment for symptoms that don’t trouble them just because they bother other people in their vicinity: A few unobtrusive spots of psoriasis, some pimples on the mid-back, a keratosis. If it isn’t scabies, we can leave the family out of it.
Medical school teaches us to take a social history: Where does the patient live? What’s her occupation? Family background? You can use this as a bullet point for coding purposes. But there is no slot for the social context of the disease. We only look at the individual. If the question is medical, we’re supposed to ask whether the patient has a disease, and if so which one? If it’s cosmetic, is the patient vain, narcissistic, perhaps dysmorphic? Who cares what their neighbors are saying?
Actually, patients do. When my son moved from Manhattan to Beverly Hills, within days several people had taken one look at his beat-up car and announced, "You can’t drive that! It has to be detailed." He didn’t know what that meant (I still don’t), but he detailed it soon enough. A year later he moved back east, where the car quickly undetailed.
Boston is more buttoned down, but here, too, what people say matters. Matrons who pahk their cah near Hahvahd Yahd don’t color their gray hair. One who does would stand out. In the western suburbs ladies of a certain age do their faces. One who doesn’t grows uneasy. "Shouldn’t I be doing something?" she wonders.
Most people don’t like to stand out. Attention makes them uncomfortable. They would rather not have other people take note of any deviance, whether symptoms or wrinkles.
So let’s get back to Nora. Her moles are clearly a pretext for her real concern, which is whether she should be doing something about aging. Was the esthetician in L.A. right?
A rounded summary of Nora’s predicament would sound something like this: The patient is concerned about getting old and deteriorating. In her mind’s eye are images of people she has known who aged well or poorly. In her ears are statements made by people who told her to do something or warned her to stay away from doing anything. In her mirror is a largely unlined face with a few furrows on the forehead. What will people say if she takes action? What will they say if she doesn’t?
Poor Nora. If I’m making her sound like Hamlet, that’s because in this sense she is. But enough philosophy, let’s talk about what’s important: How should we code her visit? We’ll choose the evaluation and management code of appropriate complexity and list the diagnosis as "Nevus, benign." We will feed this into the giant medical data machine in the cloud. This information will capture precisely nothing about what her visit was really about. But what can you do? Even ICD-10, with its 140,000 diagnoses, won’t have one for "Angst promoted by the social milieu."
Maybe ICD-11.
Dr. Rockoff practices dermatology in Brookline, Mass. To respond to this column, e-mail him at our editorial offices at [email protected].

ID Predictions for 2013
It is that time of year when 2013 predictions come your way, with insights into upcoming changes and/or developments in the specialty of pediatric infectious diseases. The theme this year: drugs, bugs, and the new immunization schedule.
Antimicrobial resistance for Gram negative organisms will reach new heights in 2013, new antibiotics will not likely appear on the market, and you will see an increase in emphasis on judicious antibiotic use in other venues such as the animal industry.
Particularly worrisome is the increased rate of hospital acquired carbapenem-resistant Klebsiella pneumoniae infections as few good therapeutic options currently exist for these pathogens. Judicious use of antibiotics in all instances is key, and pediatricians should particularly focus on their practice patterns for common infections (streptococcal pharyngitis, otitis media, and sinusitis), and avoiding antibiotics for upper respiratory infections and bronchitis.

The United States is the fifth greatest user of antibiotics in the world (France, Greece, Italy, and Belgium exceed us), and Kentucky, West Virginia, Tennessee, Mississippi, and Louisiana are the states with the highest use. Check out the map of this data to see antibiotic use for your state.
The winter scourge of rotavirus infection has virtually disappeared following the introduction of rotavirus vaccine but two diarrheal pathogens you’ll likely hear more about in 2013 are norovirus and cryptosporidia.
Norovirus (think cruise ship diarrhea) moves front and center as the most important cause of diarrheal outbreaks in the United States. While foodborne disease occurs, most outbreaks relate to person-to-person transmission, and you are most likely to see disease this time of year (November through April). This might be explained by the fact that infected individuals shed billions of norovirus particles, and it only takes 18 particles to infect another, plus folks are more likely to be closely quartered in winter months.
In terms of cryptosporidiosis, famous outbreaks have followed contamination of drinking water, and sporadic cases are often seen in summer following recreational water exposure. While self-limited in the healthy child, cryptosporidiosis is hard to treat and causes significant morbidity in immunocompromised individuals, such as organ transplant patients. Pediatricians should alert parents to the risk related to recreational water exposure for high-risk patients who should avoid ingesting such water, and particularly avoid pools where diapered children may contaminate the water.
Speaking of diarrhea, as rates for Clostridium difficile associated disease (CDAD) in children have been increasing over the last decade, I suspect clinicians will need to gain a better understanding of the specifics regarding newer C. difficile tests. Many institutions have gone to molecular assays. Polymerase chain reaction (PCR) testing, for instance, has been introduced, which is very sensitive, and doubled the rate of positivity (compared with enzyme immunoassay) in some studies. We know that asymptomatic carriage of C. difficile is common in infants younger than 12 months of age, but several studies suggest that 25%-33% of 0- to 36-month control patients had stools that were positive for C. difficile toxin. Take a highly sensitive test, high rates of asymptomatic colonization, and the overall low prevalence CDAD, and you are likely to see diagnosis and treatment instituted inappropriately in some cases. The key to diagnosis of CDAD is to perform testing only on liquid stools and to make sure that other etiologies of diarrhea have been excluded in those less than 3 years of age. Don’t test young infants younger than 1 year (unless they have Hirschsprung’s disease), and do not perform tests to check for cure. See the new guideline published in the January issue of Pediatrics (2013; 131:196-200).
We may still be months away from knowing the full extent of the 2012 national fungal meningitis outbreak; however, based on what we know now, there is a clear need for legislation to ensure safe practices in compounding pharmacies, and I predict this will come in 2013. The first case of fungal meningitis cases was reported Sept. 18, 2012, in a man in Tennessee, and within a week, seven other cases were diagnosed; all had epidural steroid injections at the same center (N. Engl. J. Med. 2012 Dec. 19 [doi: 10.1056/NEJMoa1213978]).
Since then, a Centers for Disease Control and Prevention investigation has found that more than 600 infected patients and 39 patients have died. Three lots of methylprednisolone products from a compounding pharmacy in New England were found to be the source, and the CDC investigation found that more than 14,000 individuals in 70-plus clinics in 22 states were exposed to the products, mostly adult patients with chronic back pain. The organism in all but one case is an unusual environmental fungus (Exserohilum rostratum) that likely was introduced into the products during drug preparation. The Food and Drug Administration has since inspected the company’s processing room and noted a number of different issues that may have resulted in contamination. Products have been recalled from the implicated pharmacy (New England Compounding Center), and a sister pharmacy (Ameridose) has voluntarily recalled its products. This is not the first time that an outbreak has been tracked to contamination at a compounding pharmacies, but the extent of this outbreak emphasizes the need for definitive action to prevent this from ever happening again.
The 2013 Immunization Schedule will be out soon, and I predict practitioners may be happy to see a comprehensive footnote table, a harmonized schedule for those 0-18 years, and separate tables for the high-risk patient and for those requiring catch-up schedules.
In terms of vaccines, an important goal for practitioners may be to increase vaccine coverage in teens. Human papillomavirus (HPV) coverage rates are still dismal; 35% of girls and 1% of boys completed three vaccines in 2011, according to the National Immunization Survey–Teen. Parents who refused HPV vaccines in their daughters more likely cited safety concerns, but those who refused for their sons were more likely not to be aware of the recommendation for vaccination, according to data from the NIS-Teen. Geographic disparities also have been noted, with the southeastern U.S. states having lowest rates for immunization and some of the highest rates for cervical cancer. Recommend HPV vaccine every time another teen platform vaccine is recommended, and use a standing order in your practice so every encounter is an opportunity to immunize.
I wish you blessings in the coming year and hope that at least some of my predictions have utility for those of you in practice.
Dr. Jackson is the chief of infectious diseases at Children’s Mercy Hospitals and Clinics in Kansas City, Mo., and professor of pediatrics at the University of Missouri–Kansas City. She said she has no relevant financial disclosures. E-mail her at [email protected].
It is that time of year when 2013 predictions come your way, with insights into upcoming changes and/or developments in the specialty of pediatric infectious diseases. The theme this year: drugs, bugs, and the new immunization schedule.
Antimicrobial resistance for Gram negative organisms will reach new heights in 2013, new antibiotics will not likely appear on the market, and you will see an increase in emphasis on judicious antibiotic use in other venues such as the animal industry.
Particularly worrisome is the increased rate of hospital acquired carbapenem-resistant Klebsiella pneumoniae infections as few good therapeutic options currently exist for these pathogens. Judicious use of antibiotics in all instances is key, and pediatricians should particularly focus on their practice patterns for common infections (streptococcal pharyngitis, otitis media, and sinusitis), and avoiding antibiotics for upper respiratory infections and bronchitis.
The United States is the fifth greatest user of antibiotics in the world (France, Greece, Italy, and Belgium exceed us), and Kentucky, West Virginia, Tennessee, Mississippi, and Louisiana are the states with the highest use. Check out the map of this data to see antibiotic use for your state.
The winter scourge of rotavirus infection has virtually disappeared following the introduction of rotavirus vaccine but two diarrheal pathogens you’ll likely hear more about in 2013 are norovirus and cryptosporidia.
Norovirus (think cruise ship diarrhea) moves front and center as the most important cause of diarrheal outbreaks in the United States. While foodborne disease occurs, most outbreaks relate to person-to-person transmission, and you are most likely to see disease this time of year (November through April). This might be explained by the fact that infected individuals shed billions of norovirus particles, and it only takes 18 particles to infect another, plus folks are more likely to be closely quartered in winter months.
In terms of cryptosporidiosis, famous outbreaks have followed contamination of drinking water, and sporadic cases are often seen in summer following recreational water exposure. While self-limited in the healthy child, cryptosporidiosis is hard to treat and causes significant morbidity in immunocompromised individuals, such as organ transplant patients. Pediatricians should alert parents to the risk related to recreational water exposure for high-risk patients who should avoid ingesting such water, and particularly avoid pools where diapered children may contaminate the water.
Speaking of diarrhea, as rates for Clostridium difficile associated disease (CDAD) in children have been increasing over the last decade, I suspect clinicians will need to gain a better understanding of the specifics regarding newer C. difficile tests. Many institutions have gone to molecular assays. Polymerase chain reaction (PCR) testing, for instance, has been introduced, which is very sensitive, and doubled the rate of positivity (compared with enzyme immunoassay) in some studies. We know that asymptomatic carriage of C. difficile is common in infants younger than 12 months of age, but several studies suggest that 25%-33% of 0- to 36-month control patients had stools that were positive for C. difficile toxin. Take a highly sensitive test, high rates of asymptomatic colonization, and the overall low prevalence CDAD, and you are likely to see diagnosis and treatment instituted inappropriately in some cases. The key to diagnosis of CDAD is to perform testing only on liquid stools and to make sure that other etiologies of diarrhea have been excluded in those less than 3 years of age. Don’t test young infants younger than 1 year (unless they have Hirschsprung’s disease), and do not perform tests to check for cure. See the new guideline published in the January issue of Pediatrics (2013; 131:196-200).
We may still be months away from knowing the full extent of the 2012 national fungal meningitis outbreak; however, based on what we know now, there is a clear need for legislation to ensure safe practices in compounding pharmacies, and I predict this will come in 2013. The first case of fungal meningitis cases was reported Sept. 18, 2012, in a man in Tennessee, and within a week, seven other cases were diagnosed; all had epidural steroid injections at the same center (N. Engl. J. Med. 2012 Dec. 19 [doi: 10.1056/NEJMoa1213978]).
Since then, a Centers for Disease Control and Prevention investigation has found that more than 600 infected patients and 39 patients have died. Three lots of methylprednisolone products from a compounding pharmacy in New England were found to be the source, and the CDC investigation found that more than 14,000 individuals in 70-plus clinics in 22 states were exposed to the products, mostly adult patients with chronic back pain. The organism in all but one case is an unusual environmental fungus (Exserohilum rostratum) that likely was introduced into the products during drug preparation. The Food and Drug Administration has since inspected the company’s processing room and noted a number of different issues that may have resulted in contamination. Products have been recalled from the implicated pharmacy (New England Compounding Center), and a sister pharmacy (Ameridose) has voluntarily recalled its products. This is not the first time that an outbreak has been tracked to contamination at a compounding pharmacies, but the extent of this outbreak emphasizes the need for definitive action to prevent this from ever happening again.
The 2013 Immunization Schedule will be out soon, and I predict practitioners may be happy to see a comprehensive footnote table, a harmonized schedule for those 0-18 years, and separate tables for the high-risk patient and for those requiring catch-up schedules.
In terms of vaccines, an important goal for practitioners may be to increase vaccine coverage in teens. Human papillomavirus (HPV) coverage rates are still dismal; 35% of girls and 1% of boys completed three vaccines in 2011, according to the National Immunization Survey–Teen. Parents who refused HPV vaccines in their daughters more likely cited safety concerns, but those who refused for their sons were more likely not to be aware of the recommendation for vaccination, according to data from the NIS-Teen. Geographic disparities also have been noted, with the southeastern U.S. states having lowest rates for immunization and some of the highest rates for cervical cancer. Recommend HPV vaccine every time another teen platform vaccine is recommended, and use a standing order in your practice so every encounter is an opportunity to immunize.
I wish you blessings in the coming year and hope that at least some of my predictions have utility for those of you in practice.
Dr. Jackson is the chief of infectious diseases at Children’s Mercy Hospitals and Clinics in Kansas City, Mo., and professor of pediatrics at the University of Missouri–Kansas City. She said she has no relevant financial disclosures. E-mail her at [email protected].

Of patients and patience
On online review sites, one of the measures doctors are judged by is how long patients are kept waiting in the waiting room before they are seen. But is that a fair measure?
One of my patients is habitually late, always 15-20 minutes late for her 15-minute follow-up visit. And she’s not a straightforward patient. If I am lucky, the person scheduled to come after her arrives early, so I see him or her first and my schedule is thrown off by only a few minutes. But more often I end up running late, and the rest of the patients have to wait longer than they normally would.
The last time I saw her, I politely asked her why she was late again, and after her initial protestations that she was actually on time, she said to me: "I don’t yell at you when you make me wait."
I do my best not to keep patients waiting. Of course, in a busy rheumatology practice, that is not always realistic. I need to take a history, perform a physical exam, monitor labs and x-rays and bone densities, as well as counsel on smoking cessation. Not to mention the elderly man who needs time for a good cry because he still feels guilty about having put his wife in a nursing home, or the lovely gentleman with a bad stutter who takes a very long time to finish his sentences.
Although I am typically quite prompt, sometimes I am a little late. I don’t make a habit of it, and if I am late it is with good reason. Trust me, I was not twiddling my thumbs.
But when patients are habitually late, it implies a certain expectation that they’ll be seen anyway even if they’re late. It signifies complacency toward the doctor and a lack of consideration for the other people who are inconvenienced – all the subsequent patients who are then kept waiting.
The difference between a doctor being late and a patient being late is that the doctor is providing a service, not only to that patient but to all the other patients on their schedule. If I keep you waiting, you know it’s because I was giving the patients before you the same kind of attention and level of care that you can and should expect to get. This is why patients don’t usually yell at their doctors for being late, nor do doctors deserve to be yelled at when they are.
Asking patients if they were kept waiting is not a useful question. How much or how little a doctor keeps a patient waiting is not an indication of the quality of care that the doctor is capable of giving.
Dr. Chan practices rheumatology in Pawtucket, R.I. E-mail her at [email protected].

The sword of Damocles
As Washington hurtled toward the fiscal cliff, I watched with increasing confidence that savvy politicians would announce a last-minute deal. However, I gained even more confidence that it would not actually deal with the problem. Far from forming a grand bargain, Congress just kicked the can a bit further down the road.
The next hurdle the federal government will face and crawl under will be raising the debt ceiling by the end of February 2013. I have no plans to write my next column on that subject. This column is not meant to be a fount for political analysis. But there are two important ways in which the fiscal cliff debacle impacts physicians. One is exemplified by the legend of the sword of Damocles. The other comes from an aphorism attributed to Mahatma Gandhi.
In 1997, Congress created a correction factor, based on a Sustainable Growth Rate (SGR), to control runaway increases in health care spending. Starting in 1999, Medicare fees were to be adjusted so that the rate of growth in Medicare spending was no larger than the growth of the gross domestic product (GDP). In short, if spending increased more than that, physician fees for a given service would be reduced by a proportionate amount. However, each year since then, an act of Congress has postponed, but not repealed, implementation of the correction factor. This has happened so repeatedly that it has acquired the nickname "the doc fix." In total, these accumulated corrections now exceed 27%. Once again, as part of the bill passed by the Senate on Jan. 1, 2013, a postponement was authorized. Physicians will not see a sudden 27% drop in Medicare fees in 2013. But the threat of such a reduction in fees for 2014 remains on the legislative books.
By legend, Damocles temporarily sat upon the throne of Dionysius, but could not enjoy its luxury because over his head was a large sword suspended by a single hair of a horse’s tail. For physicians, the sword of Damocles grows larger annually. As the size of the Medicare SGR correction has accumulated, fewer people believe it will ever be implemented. I am reminded of an adage that "experience allows us to repeat the same mistakes with increasing levels of confidence." The longer the sword remains over our heads, the less worried we become that it will actually fall. That may not be wise in a world of political brinkmanship.
The second take-home message from Washington’s paralysis is more cynical and insidious. Health care in the United States, particularly public health, has been very successful, adding 10 years to the average life expectancy over the past 50 years. But it has created a Faustian bargain with unsustainable cost increases. We’ve gone from 6% of the GDP to 17% spent on health care. Of course, if the average working person gets to live 10 years longer, he might be willing to pay for that with 11% of the GDP. But other countries have obtained the same benefit for half the price. The state of Oregon once tried to prioritize Medicaid spending, creating a list of which medical interventions would be covered and which were too extravagant. The process failed. The fiscal cliff debacle is further demonstration that our current form of government cannot handle these difficult choices over diverse ideals.
The financing of health care in the United States has fostered wasteful and futile care for the elderly while services for children, particularly dental and mental health, remained woefully underfunded. It appears to be irrational to continue to wait for government to create a just framework for allocating medical care. Inaction is collusion with this insanity.
Change is needed before the sword falls. Instead of relying on centralized planning, can we find salvation in the individual choices of physicians? What could you personally do to increase access to the most beneficial types of health care services rather than the most lucrative? As Gandhi suggested, "You must be the change you want to see in the world."
This column, "Beyond the White Coat," regularly appears in Pediatric News. Dr. Powell is associate professor of pediatrics at St. Louis University and a pediatric hospitalist at SSM Cardinal Glennon Children’s Medical Center in St. Louis. E-mail Dr. Powell at [email protected].

Evidence-based medicine depends on quality evidence
Efforts to improve the quality of health care often emphasize evidence-based medicine, but flaws in how research is designed, conducted, and reported make this "a great time for skeptics, in looking at clinical trials," according to Dr. J. Russell Hoverman.
Multiple studies in recent years suggest that increasing influence from industry and researchers’ desire to emphasize positive results, as well as other factors, may be distorting choices about which studies get done and how they get reported, said Dr. Hoverman, a medical oncologist and hematologist at Texas Oncology in Austin, Tex.

If researchers don’t improve the way they conduct and assess clinical trials, a lot of money could be wasted on misguided research, he said at a quality care symposium sponsored by the American Society of Clinical Oncology.
He’s not the only one making the case. Physicians at Yale recently argued for greater transparency in pharmaceutical industry–sponsored research to improve the integrity of medical research (Am. J. Public Health 2012;102:72-80).
Over the last three decades, sponsorship of breast, colon, and lung cancer studies by for-profit companies increased from 4% to 57%, Dr. Hoverman noted. Industry sponsorship was associated with trial results that endorsed the experimental agent, according to one study (J. Clin. Oncol. 2008;26:5458-64).
A separate study showed that abstracts of study results presented at major oncology meetings before final publication were discordant from the published article 63% of the time. In 10% of cases, the abstract and article presented substantially different conclusions (J. Clin. Oncol. 2009;3938-44).
One example of this was a trial of a cancer treatment regimen using gemcitabine, cisplatin, and bevacizumab. The investigators initially released an early abstract reporting an improvement in progression-free survival using the regimen. "That actually changed some [oncologists’] practices," he noted. But that was before the study reached its main outcome measure – overall survival – which, in the end, did not improve significantly with the new regimen.
Only half of phase II clinical trials with positive findings lead to positive phase III trials, another study found. For some reason, industry-sponsored trials are much more likely to report positive findings, compared with all other trials – 90% and 45%, respectively (J. Clin. Oncol. 2008;26:1511-8).
When reading or interpreting abstract summaries from a medical conference, "one needs to be a little careful," Dr. Hoverman advised.
Yet another study found that only 45% of randomized clinical trials were registered, even though trial registration has been required since 2005 by the International Committee of Medical Journal Editors in order for the results to be published in participating journals.
Among the registered studies, 31% showed discrepancies between what the investigators said they would be studying and the published outcomes. Half of the studies with discrepancies could be assessed to try to figure out why this was so; of those, 83% of the time it appeared that the investigators decided to favor statistically significant findings in the published article (JAMA 2009;302:977-84).
One set of experts from within industry and from Johns Hopkins University called for "transformational change" in how randomized clinical trials are conducted (Ann. Intern. Med. 2009;151:206-209).
"Without major changes in how we conceive, design, conduct, and analyze randomized controlled trials, the nation risks spending large sums of money inefficiently to answer the wrong questions, or the right questions too late," Dr. Hoverman said.
"In fact, we probably can’t do randomized clinical trials on everything we want to know about. It’s simply impossible. There’s not enough money, and many things involve competing industries or competing members within an industry," making it unlikely that some head-to-head comparisons will ever be done, he added. "So, we are challenged to make decisions based on evidence."
The broader challenge for clinicians and researchers will be to improve the quality and integrity of medical studies while maintaining a healthy skepticism about the available evidence. Medicine has always been an art and a science. Where the science behind medicine is lacking, the art takes over.
Dr. Hoverman reported having no financial disclosures.
-- Sherry Boschert
On Twitter @sherryboschert
Efforts to improve the quality of health care often emphasize evidence-based medicine, but flaws in how research is designed, conducted, and reported make this "a great time for skeptics, in looking at clinical trials," according to Dr. J. Russell Hoverman.
Multiple studies in recent years suggest that increasing influence from industry and researchers’ desire to emphasize positive results, as well as other factors, may be distorting choices about which studies get done and how they get reported, said Dr. Hoverman, a medical oncologist and hematologist at Texas Oncology in Austin, Tex.
If researchers don’t improve the way they conduct and assess clinical trials, a lot of money could be wasted on misguided research, he said at a quality care symposium sponsored by the American Society of Clinical Oncology.
He’s not the only one making the case. Physicians at Yale recently argued for greater transparency in pharmaceutical industry–sponsored research to improve the integrity of medical research (Am. J. Public Health 2012;102:72-80).
Over the last three decades, sponsorship of breast, colon, and lung cancer studies by for-profit companies increased from 4% to 57%, Dr. Hoverman noted. Industry sponsorship was associated with trial results that endorsed the experimental agent, according to one study (J. Clin. Oncol. 2008;26:5458-64).
A separate study showed that abstracts of study results presented at major oncology meetings before final publication were discordant from the published article 63% of the time. In 10% of cases, the abstract and article presented substantially different conclusions (J. Clin. Oncol. 2009;3938-44).
One example of this was a trial of a cancer treatment regimen using gemcitabine, cisplatin, and bevacizumab. The investigators initially released an early abstract reporting an improvement in progression-free survival using the regimen. "That actually changed some [oncologists’] practices," he noted. But that was before the study reached its main outcome measure – overall survival – which, in the end, did not improve significantly with the new regimen.
Only half of phase II clinical trials with positive findings lead to positive phase III trials, another study found. For some reason, industry-sponsored trials are much more likely to report positive findings, compared with all other trials – 90% and 45%, respectively (J. Clin. Oncol. 2008;26:1511-8).
When reading or interpreting abstract summaries from a medical conference, "one needs to be a little careful," Dr. Hoverman advised.
Yet another study found that only 45% of randomized clinical trials were registered, even though trial registration has been required since 2005 by the International Committee of Medical Journal Editors in order for the results to be published in participating journals.
Among the registered studies, 31% showed discrepancies between what the investigators said they would be studying and the published outcomes. Half of the studies with discrepancies could be assessed to try to figure out why this was so; of those, 83% of the time it appeared that the investigators decided to favor statistically significant findings in the published article (JAMA 2009;302:977-84).
One set of experts from within industry and from Johns Hopkins University called for "transformational change" in how randomized clinical trials are conducted (Ann. Intern. Med. 2009;151:206-209).
"Without major changes in how we conceive, design, conduct, and analyze randomized controlled trials, the nation risks spending large sums of money inefficiently to answer the wrong questions, or the right questions too late," Dr. Hoverman said.
"In fact, we probably can’t do randomized clinical trials on everything we want to know about. It’s simply impossible. There’s not enough money, and many things involve competing industries or competing members within an industry," making it unlikely that some head-to-head comparisons will ever be done, he added. "So, we are challenged to make decisions based on evidence."
The broader challenge for clinicians and researchers will be to improve the quality and integrity of medical studies while maintaining a healthy skepticism about the available evidence. Medicine has always been an art and a science. Where the science behind medicine is lacking, the art takes over.
Dr. Hoverman reported having no financial disclosures.
-- Sherry Boschert
On Twitter @sherryboschert

A Double‐Edged Sword
The approach to clinical conundrums by an expert clinician is revealed through the presentation of an actual patient's case in an approach typical of a morning report. Similarly to patient care, sequential pieces of information are provided to the clinician, who is unfamiliar with the case. The focus is on the thought processes of both the clinical team caring for the patient and the discussant.
A 40‐year‐old man with human immunodeficiency virus (HIV) infection and a CD4 count of 58 cells/L was admitted to the hospital with 1 month of fevers, night sweats, a 5‐kg weight loss, several weeks of progressive dyspnea on exertion, and a nonproductive cough. He denied headaches, vision changes, odynophagia, diarrhea, or rash. He had no history of opportunistic infections, HIV‐associated neoplasms, or other relevant past medical history. He was diagnosed with HIV 3 years ago and had been off antiretroviral therapy (ART) for the last 10 months. Two weeks prior to this presentation, he was seen in clinic but did not report his symptoms. He was prescribed trimethoprim/sulfamethoxazole (TMP/SMX) for prophylaxis against Pneumocystis jirovecii pneumonia (PCP). He had recently moved from New York City to San Francisco, had quit smoking within the last month, and denied alcohol or illicit drug use.
At a CD4 cell count of 58 cells/L, the patient is at risk for the entire spectrum of HIV‐associated opportunistic infections and neoplasms. The presence of fevers, night sweats, and weight loss suggests the possibility of a disseminated infection, although a neoplastic process with accompanying B symptoms should also be considered. Dyspnea and nonproductive cough indicate cardiopulmonary involvement. The duration of these complaints is more suggestive of a nonbacterial infectious etiology (e.g., PCP, mycobacterial or fungal disease) than a bacterial etiology (e.g., Streptococcus pneumoniae). Irrespective of CD4 count, patients with HIV are at increased risk for cardiovascular events and pulmonary arterial hypertension, although the time course and presence of constitutional symptoms makes these diagnoses less likely. Similarly, patients with HIV are at increased risk for chronic obstructive pulmonary disease (COPD), and the patient does have a history of cigarette smoking, but the clinical history and systemic involvement make COPD unlikely.
On physical examination, the patient was in no acute distress. The temperature was 36C, the blood pressure 117/68 mm Hg, the heart rate 106 beats per minute, the respiratory rate 18 breaths per minute, and the oxygen saturation 100% on ambient air. No oral lesions were noted, and his neck was supple with nontender bilateral cervical lymphadenopathy measuring up to 1.5 cm. There was no jugular venous distension or peripheral edema. The cardiovascular exam revealed tachycardia with a regular rhythm and no murmurs or gallops. His lungs were clear to auscultation. The spleen tipwas palpable. No rashes were identified. The neurological examination, including mental status, was normal.
The white blood cell count was 2400/mm3, the hemoglobin 7 g/dL with mean corpuscular volume of 86 fL, and the platelet count 162,000/mm3. Basic chemistry, liver, and glucose‐6‐phosphate dehydrogenase (G6PD) tests were within the laboratory's normal range. The HIV viral load was 150,000 copies/mL. Chest radiography revealed bibasilar hazy opacities, and computerized tomography (CT) of the chest revealed a focal nodular consolidation in the right middle lobe along with subcentimeter bilateral axillary and mediastinal lymphadenopathy. There were no ground‐glass opacities.
The patient's physical examination does not support a cardiac disorder. Lymphadenopathy is nonspecific, but it is consistent with a potential infectious or neoplastic process. Leukopenia and anemia suggest potential bone‐marrow infiltration or suppression by TMP/SMX. Although the pulmonary exam was nonfocal, chest imaging is the cornerstone of the evaluation of suspected pulmonary disease in persons with HIV. The focal nodular consolidation on chest CT is nonspecific but is more characteristic of typical or atypical bacterial pneumonia, mycobacterial disease such as tuberculosis, or fungal pneumonia than PCP or viral pneumonia. A lack of ground‐glass opacities also makes PCP and interstitial lung diseases less likely.
The patient was treated for community‐acquired pneumonia with ceftriaxone and doxycycline with improvement in dyspnea. Antiretroviral therapy with darunavir, ritonavir, tenofovir, and emtricitabine was initiated. Azithromycin was started for prophylaxis against Mycobacterium avium complex (MAC). The TMP/SMX was changed to dapsone, given concern for bone‐marrow suppression. Blood cultures for bacteria, fungi, and mycobacteria were negative. Polymerase chain reaction from pharyngeal swab for influenza A and B, parainfluenza types 13, rhinovirus, and respiratory syncytial virus were negative. Several attempts to obtain sputum for acid‐fast bacillus staining and culture were unsuccessful because the patient was unable to expectorate sputum. Serum interferon‐gamma release assay for M. tuberculosis and thefollowing serologic studies were also negative: cytomegalovirus, Epstein‐Barr virus, parvovirus, Bartonella species, Coccidioides immitis, and Cryptococcus neoformans antigen. Given his improvement, the patient was discharged from the hospital on ART, doxycycline for community‐acquired pneumonia, and prophylactic azithromycin and dapsone with scheduled outpatient follow‐up.
Ten days later, he was seen in clinic. Though his dyspnea had improved after completing the doxycycline, he noted a persistent dry cough and daily fevers to 40C. The physical exam was unchanged, including persistent cervical lymphadenopathy. Laboratories revealed a white blood cell count of 2400/mm3, hemoglobin of 4.8 g/dL, and a platelet count of 122,000/mm3. The absolute reticulocyte count was 21,000/L (normal value, 20,000100,000/L). A peripheral blood smear was unremarkable, and serum lactate dehydrogenase (LDH) was within normal limits. The direct antiglobulin test (DAT) was negative. The patient was readmitted to the hospital.
The initial improvement in dyspnea but persistent fevers and cough and worsening pancytopenia are suggestive of multiple processes occurring simultaneously. Dapsone can cause both hemolytic anemia and aplastic anemia, although the peripheral smear, normal LDH and G6PD, and negative DAT are not consistent with the former. Bone‐marrow suppression from a combination of ART medications and dapsone cannot be ruled out. An infiltrative process involving the bone marrow, including tuberculosis, MAC, disseminated fungal infection, or malignancy, remains a possibility. Repeat chest imaging is warranted to assess the prior right middle lobe consolidation and to further evaluate the persistent respiratory complaints.
Prophylaxis of PCP with dapsone was switched to atovaquone due to persistent anemia. A repeat CT of the chest and a concurrent abdominal CT revealed interval enlargement of mediastinal lymph nodes with multiple periportal, retroperitoneal, and hilar nodes not present on prior chest imaging, in addition to new bilateral centrilobular nodules and interval development of small bilateral pleural effusions. The abdominal CT also showed hepatosplenomegaly with splenic‐vein engorgement. Empiric treatment for disseminated MAC infection with clarithromycin and ethambutol was initiated in addition to vancomycin and cefepime for possible healthcare‐associated pneumonia. Over the next several days, the patient continued to have daily fevers up to 39.8C. A repeat CD4 count 3 weeks after starting ART was 121 cells/L. The HIV RNA level had decreased to 854 copies/mL.
The patient has developed progressive, generalized lymphadenopathy, worsening pancytopenia, and persistent fevers in the setting of negative cultures and serologic studies and despite treatment for MAC. This constellation, along with the radiographic findings of hilar lymphadenopathy and pleural effusions, is suggestive of non‐Hodgkin lymphoma (NHL). Alternatively, Kaposi sarcoma (KS) or tuberculosis can have a similar radiographic and clinical presentation, although pancytopenia from KS seems unusual. The lymphadenopathy could be consistent with multicentric Castleman disease or bacillary angiomatosis (BA), although the latter diagnosis would be unlikely given recent antibiotic therapy. At this time, a careful search for other manifestations and reasonable targets for biopsy is warranted. An appropriate suppression of the HIV viral load after initiation of ART, with improvement in CD4 count, is the proper context for the immune reconstitution inflammatory syndrome (IRIS), which is characterized by paradoxical worsening or unmasking of a disseminated process.
A bone‐marrow biopsy revealed marked dysmegakaryopoiesis and mild dyserythropoiesis, but no other abnormalities. Flow cytometry and histoimmunochemical staining did not show evidence of lymphoproliferative disorder in the marrow. Smears and cultures of the bone marrow for bacteria, acid‐fast bacilli, and fungi were negative. A right cervical lymph node biopsy was performed, with multiple fine‐needle aspiration and core samples taken. Bacterial, fungal, and acid‐fast bacilli tissue cultures were without growth, and initial pathology results were concerning for high‐grade lymphoma. A monoclonal proliferation of lymphocytes was noted on flow cytometry of the tissue sample. The patient developed progressive dyspnea, tachypnea, and hypoxemia. A chest x‐ray revealed worsening perihilar and basilar opacities.
The possibility of bone‐marrow sampling error must be considered in a patient that has such a high pretest probability for lymphoma or infection, but staining, immunological assays, cultures, and direct assessment by pathologists generally give some suggestion of an alternative diagnosis. The bone‐marrow findings are compatible with HIV‐related changes, but continued vigilance for infection and malignancy is warranted. Although the diagnosis of NHL based on the cervical biopsy result is only preliminary, the patient's rapidly deteriorating clinical status warrants initiation of treatment with steroids while awaiting definitive results, particularly given his poor response to aggressive management of potential infectious causes. A bronchoscopy should be considered given the predominance of pulmonary symptoms and his rapid respiratory decline.
Approximately 1 week after admission, high‐dose systemic corticosteroids were administered for presumed aggressive lymphoma. Over the next 48 hours, the patient's hypoxemia worsened, and he was intubated for hypoxemic respiratory failure. A repeat chest CT (see Fig. 1) showed bilateral peribronchovascular patchy consolidations and pleural effusions without evidence of pulmonary embolism. The patient was also noted to have a single, discrete violaceous nodule on the hard palate as well as a nodule with similar appearance on his upper chest (neither lesion was present on admission). A skin biopsy was obtained. Despite steroids, antibiotic therapy, and aggressive critical‐care management, severe acidosis, progressive acute kidney injury, and anuria ensued. Continuous venovenous hemodialysis was initiated.

Discrete violaceous nodules with mucocutaneous localization in the context of AIDS are virtually pathognomonic for KS. Rarely, BA may be misdiagnosed as KS, or they may occur concurrently. The patient's current clinical deterioration, radiographic findings, and development of new skin lesions in the setting of response to ART are concerning for KS‐related IRIS with visceral involvement. It is likely that systemic corticosteroids are potentiating KS‐related IRIS. At this point, there is compelling evidence of 2 distinct systemic disease processes: lymphoma and KS‐related IRIS, both of which may be contributing to respiratory failure. Steroids can be highly effective in the treatment of high‐grade lymphoma but can be harmful in patients with KS, where they have been shown to potentially exacerbate underlying disease. Given the patient's worsening respiratory status, discontinuation of corticosteroids and initiation of chemotherapy against both opportunistic malignancies should be considered.
The patient's condition deteriorated with progressive acidosis and hypoxemia, and he died shortly after being transitioned to comfort‐care measures. Review of the skin biopsy revealed KS. Autopsy revealed disseminated KS involving the skin, lymph nodes, and lungs, and high‐grade anaplastic plasmablastic lymphoma infiltrating multiple lymph nodes and organs, including the lungs (see Fig. 2). There was no evidence of infection.
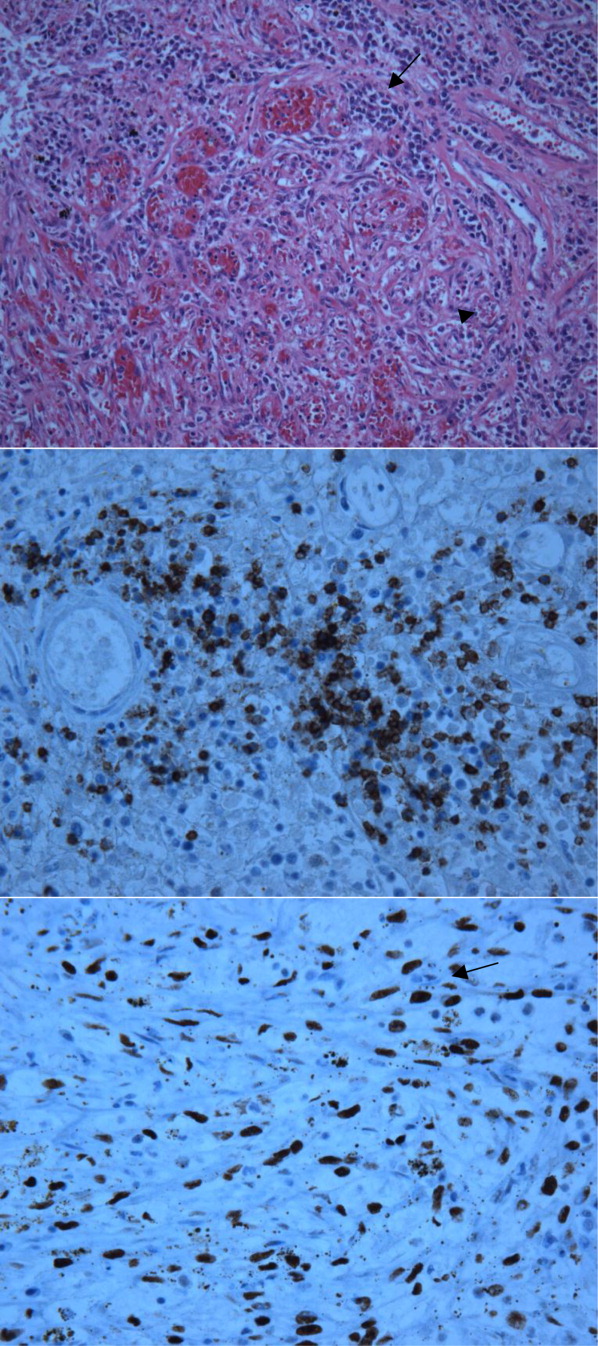
COMMENTARY
This case demonstrates the simultaneous fatal progression of 2 treatable HIV‐associated malignancies in an era in which the end‐stage manifestations of untreated HIV are becoming less common, particularly in developed countries. Modern ARTthe centerpiece of progress with HIVhas yielded dramatic improvements in prognosis, but in this case, by precipitating KS‐IRIS, ART paradoxically contributed to this patient's demise. Similarly, high‐dose systemic corticosteroids, which were deemed necessary to stabilize the progression of his high‐grade lymphoma, likely accelerated his KS. This corticosteroid‐mediated worsening appears to be unique to KS given that corticosteroids are often recommended to treat severe presentations of IRIS in other diseases (eg, tuberculosis, MAC, PCP).
Immune reconstitution inflammatory syndrome is the paradoxical worsening of well‐controlled disease or progression of previously occult disease after initiation of ART.1
Although infectious diseasesincluding mycobacteria, cytomegalovirus, cryptococcosis, or PCPare best known for their ability to recrudesce or manifest with a recovering immune system, opportunistic malignancies such as KS can do the same. Risk factors for development of IRIS are low pre‐ART CD4 count, high pre‐ART viral load, and rapid response to ART.2 In 1 large series, the median time to diagnosis of IRIS was 33 days.2 Immune reconstitution inflammatory syndrome is a clinical diagnosis without specific pathologic findings. Because IRIS is a diagnosis of exclusion, other explanations for worsening disease, including drug resistance, drug reactions (eg, abacavir hypersensitivity syndrome), and poor adherence to medications, should be ruled out before making the diagnosis.
Kaposi sarcoma is a vascular tumor associated with infection by human herpesvirus 8 (HHV‐8). The incidence of AIDS‐related KS has declined substantially in the post‐ART era.2, 4 The classic radiographic presentation of pulmonary KS includes central bilateral opacities with a peribronchovascular distribution as well as pulmonary nodules, intraseptal thickening, mediastinal lymphadenopathy, and associated pleural effusions.5, 6 Kaposi sarcomarelated IRIS has been described as developing within weeks of ART initiation and is associated with substantial morbidity and mortality, particularly in the context of pulmonary involvement, with 1 recent series showing 100% mortality in patients who did not receive chemotherapy.79
Human immunodeficiency virusassociated KS can respond well to ART alone. Indications for systemic chemotherapy for KS include extensive mucocutaneous disease, symptomatic visceral disease, or KS‐related IRIS.10 The main chemotherapeutic agents used systemically for KS are liposomal anthracyclines such as doxorubicin or daunorubicin, or taxanes such as paclitaxel.11 An association between corticosteroids and progression of KS has been previously described, even as early as several days after steroid administration.1214 Recently, revised diagnostic criteria for corticosteroid‐associated KS‐IRIS have been proposed; this patient met those criteria.15
Plasmablastic lymphoma is a highly aggressive systemic NHL seen predominantly in HIV‐positive patients. There is a strong association with Epstein‐Barr virus; HHV‐8 is more variably associated and is of unclear significance.16 Most HIV‐infected patients have extranodal involvement at diagnosis; in a series of 53 HIV‐positive patients, the oral cavity was the most frequent site, and lung involvement was seen in 12%. The prognosis is poor, with a mean survival of approximately 1 year.17
Treatment for systemic NHL in HIV‐positive patients generally consists of a chemotherapy regimen while ART is continued or initiated.18 The most commonly used chemotherapy combination is cyclophosphamide, doxorubicin, vincristine, and prednisone, often supplemented with the anti‐CD20 monoclonal antibody rituximab. In the case of aggressive systemic NHL, more intensive treatment regimens are often utilized, though it remains unclear if they are associated with improved outcomes.17, 19 Antiretroviral therapy is continued, as it has been shown to reduce the rate of opportunistic infections and decrease mortality.20
Despite the remarkable progress that has been made in the past 30 years, HIV/AIDS remains a devastating and remarkably complex disease. As the landscape of HIV/AIDS evolves, clinicians will continue to be faced with new challenging and vexing decisions. Perhaps no greater challenge exists than the presence of 2 simultaneous, rapidly fatal malignancies with directly competing therapeutic strategies, as in this case, where the ART and steroids employed to address NHL fostered widespread KS‐IRIS. This case reminds us that a single unifying diagnosis can often be the exception rather than the rule in the care of patients with advanced HIV. It also illustrates how the mainstay of HIV treatment, ART, can be a double‐edged sword.
KEY TEACHING POINTS
-
In HIV/AIDS patients receiving ART who become paradoxically more ill despite improvements in their CD4 counts, consider IRIS.
-
Though corticosteroids are a hallmark of treatment for most types of IRIS‐and for aggressive lymphomas‐they can worsen KS.
- , , , et al. Defining immune reconstitution inflammatory syndrome: evaluation of expert opinion versus 2 case definitions in a South African cohort. Clin Infect Dis. 2009;49:1424–1432.
- , , , et al. Risk factor analyses for immune reconstitution inflammatory syndrome in a randomized study of early vs. deferred ART during an opportunistic infection. PLoS One. 2010;5:e11416.
- , . Kaposi's sarcoma. N Engl J Med. 2000;342:1027–1038.
- , , , et al. The changing pattern of Kaposi sarcoma in patients with HIV, 1994–2003: the EuroSIDA Study. Cancer. 2004;100:2644–2654.
- , , , , , . Imaging features of pulmonary Kaposi sarcoma–associated immune reconstitution syndrome. AJR Am J Roentgenol. 2007;189:956–965.
- , , , et al. Pulmonary involvement in Kaposi sarcoma: correlation between imaging and pathology. Orphanet J Rare Dis. 2009;4:18.
- , , , et al. Immune reconstitution inflammatory syndrome associated with Kaposi's sarcoma. J Clin Oncol. 2005;23:5224–5228.
- , . Recrudescent Kaposi's sarcoma after initiation of HAART: a manifestation of immune reconstitution syndrome. AIDS Patient Care STDS. 2005;19:635–644.
- , , , , , . Paradoxical immune reconstitution inflammatory syndrome in HIV‐infected patients treated with combination antiretroviral therapy after AIDS‐defining opportunistic infection. Clin Infect Dis. 2012;54:424–433.
- , , , et al. British HIV Association guidelines for HIV‐associated malignancies 2008. HIV Med. 2008;9:336–388.
- , , , , . HIV/AIDS: epidemiology, pathophysiology, and treatment of Kaposi sarcoma–associated herpesvirus disease: Kaposi sarcoma, primary effusion lymphoma, and multicentric Castleman disease. Clin Infect Dis. 2008;47(9):1209–1215.
- , , . A 36‐year‐old man with AIDS and relapsing, nonproductive cough. Chest. 2007;131:1929–1931.
- , , , , . Life‐threatening exacerbation of Kaposi's sarcoma after prednisone treatment for immune reconstitution inflammatory syndrome. AIDS. 2008;22:663–665.
- , , , , , . Clinical effect of glucocorticoids on Kaposi sarcoma related to the acquired immunodeficiency syndrome (AIDS). Ann Intern Med. 1989;110:937–940.
- , , , . Kaposi sarcoma–associated immune reconstitution inflammatory syndrome: in need of a specific case definition. Clin Infect Dis. 2012;55(1):157–158.
- , , , , , . Plasmablastic lymphoma in HIV‐positive patients: an aggressive Epstein‐Barr virus–associated extramedullary plasmacytic neoplasm. Am J Surg Pathol. 2005;29:1633–1641.
- , , , et al. Human immunodeficiency virus–associated plasmablastic lymphoma: poor prognosis in the era of highly active antiretroviral therapy. Cancer. 2012;118:5270–5277.
- , , . Modern management of non‐Hodgkin lymphoma in HIV‐infected patients. Br J Haematol. 2007;136(5):685–698.
- , , , et al. CD20‐negative large‐cell lymphoma with plasmablastic features: a clinically heterogeneous spectrum in both HIV‐positive and ‐negative patients. Ann Oncol. 2004;15(11):1673–1679.
- , , , et al. Concomitant cyclophosphamide, doxorubicin, vincristine, and prednisone chemotherapy plus highly active antiretroviral therapy in patients with human immunodeficiency virus–related, non‐Hodgkin lymphoma. Cancer. 2001;91(1):155–163.
The approach to clinical conundrums by an expert clinician is revealed through the presentation of an actual patient's case in an approach typical of a morning report. Similarly to patient care, sequential pieces of information are provided to the clinician, who is unfamiliar with the case. The focus is on the thought processes of both the clinical team caring for the patient and the discussant.
A 40‐year‐old man with human immunodeficiency virus (HIV) infection and a CD4 count of 58 cells/L was admitted to the hospital with 1 month of fevers, night sweats, a 5‐kg weight loss, several weeks of progressive dyspnea on exertion, and a nonproductive cough. He denied headaches, vision changes, odynophagia, diarrhea, or rash. He had no history of opportunistic infections, HIV‐associated neoplasms, or other relevant past medical history. He was diagnosed with HIV 3 years ago and had been off antiretroviral therapy (ART) for the last 10 months. Two weeks prior to this presentation, he was seen in clinic but did not report his symptoms. He was prescribed trimethoprim/sulfamethoxazole (TMP/SMX) for prophylaxis against Pneumocystis jirovecii pneumonia (PCP). He had recently moved from New York City to San Francisco, had quit smoking within the last month, and denied alcohol or illicit drug use.
At a CD4 cell count of 58 cells/L, the patient is at risk for the entire spectrum of HIV‐associated opportunistic infections and neoplasms. The presence of fevers, night sweats, and weight loss suggests the possibility of a disseminated infection, although a neoplastic process with accompanying B symptoms should also be considered. Dyspnea and nonproductive cough indicate cardiopulmonary involvement. The duration of these complaints is more suggestive of a nonbacterial infectious etiology (e.g., PCP, mycobacterial or fungal disease) than a bacterial etiology (e.g., Streptococcus pneumoniae). Irrespective of CD4 count, patients with HIV are at increased risk for cardiovascular events and pulmonary arterial hypertension, although the time course and presence of constitutional symptoms makes these diagnoses less likely. Similarly, patients with HIV are at increased risk for chronic obstructive pulmonary disease (COPD), and the patient does have a history of cigarette smoking, but the clinical history and systemic involvement make COPD unlikely.
On physical examination, the patient was in no acute distress. The temperature was 36C, the blood pressure 117/68 mm Hg, the heart rate 106 beats per minute, the respiratory rate 18 breaths per minute, and the oxygen saturation 100% on ambient air. No oral lesions were noted, and his neck was supple with nontender bilateral cervical lymphadenopathy measuring up to 1.5 cm. There was no jugular venous distension or peripheral edema. The cardiovascular exam revealed tachycardia with a regular rhythm and no murmurs or gallops. His lungs were clear to auscultation. The spleen tipwas palpable. No rashes were identified. The neurological examination, including mental status, was normal.
The white blood cell count was 2400/mm3, the hemoglobin 7 g/dL with mean corpuscular volume of 86 fL, and the platelet count 162,000/mm3. Basic chemistry, liver, and glucose‐6‐phosphate dehydrogenase (G6PD) tests were within the laboratory's normal range. The HIV viral load was 150,000 copies/mL. Chest radiography revealed bibasilar hazy opacities, and computerized tomography (CT) of the chest revealed a focal nodular consolidation in the right middle lobe along with subcentimeter bilateral axillary and mediastinal lymphadenopathy. There were no ground‐glass opacities.
The patient's physical examination does not support a cardiac disorder. Lymphadenopathy is nonspecific, but it is consistent with a potential infectious or neoplastic process. Leukopenia and anemia suggest potential bone‐marrow infiltration or suppression by TMP/SMX. Although the pulmonary exam was nonfocal, chest imaging is the cornerstone of the evaluation of suspected pulmonary disease in persons with HIV. The focal nodular consolidation on chest CT is nonspecific but is more characteristic of typical or atypical bacterial pneumonia, mycobacterial disease such as tuberculosis, or fungal pneumonia than PCP or viral pneumonia. A lack of ground‐glass opacities also makes PCP and interstitial lung diseases less likely.
The patient was treated for community‐acquired pneumonia with ceftriaxone and doxycycline with improvement in dyspnea. Antiretroviral therapy with darunavir, ritonavir, tenofovir, and emtricitabine was initiated. Azithromycin was started for prophylaxis against Mycobacterium avium complex (MAC). The TMP/SMX was changed to dapsone, given concern for bone‐marrow suppression. Blood cultures for bacteria, fungi, and mycobacteria were negative. Polymerase chain reaction from pharyngeal swab for influenza A and B, parainfluenza types 13, rhinovirus, and respiratory syncytial virus were negative. Several attempts to obtain sputum for acid‐fast bacillus staining and culture were unsuccessful because the patient was unable to expectorate sputum. Serum interferon‐gamma release assay for M. tuberculosis and thefollowing serologic studies were also negative: cytomegalovirus, Epstein‐Barr virus, parvovirus, Bartonella species, Coccidioides immitis, and Cryptococcus neoformans antigen. Given his improvement, the patient was discharged from the hospital on ART, doxycycline for community‐acquired pneumonia, and prophylactic azithromycin and dapsone with scheduled outpatient follow‐up.
Ten days later, he was seen in clinic. Though his dyspnea had improved after completing the doxycycline, he noted a persistent dry cough and daily fevers to 40C. The physical exam was unchanged, including persistent cervical lymphadenopathy. Laboratories revealed a white blood cell count of 2400/mm3, hemoglobin of 4.8 g/dL, and a platelet count of 122,000/mm3. The absolute reticulocyte count was 21,000/L (normal value, 20,000100,000/L). A peripheral blood smear was unremarkable, and serum lactate dehydrogenase (LDH) was within normal limits. The direct antiglobulin test (DAT) was negative. The patient was readmitted to the hospital.
The initial improvement in dyspnea but persistent fevers and cough and worsening pancytopenia are suggestive of multiple processes occurring simultaneously. Dapsone can cause both hemolytic anemia and aplastic anemia, although the peripheral smear, normal LDH and G6PD, and negative DAT are not consistent with the former. Bone‐marrow suppression from a combination of ART medications and dapsone cannot be ruled out. An infiltrative process involving the bone marrow, including tuberculosis, MAC, disseminated fungal infection, or malignancy, remains a possibility. Repeat chest imaging is warranted to assess the prior right middle lobe consolidation and to further evaluate the persistent respiratory complaints.
Prophylaxis of PCP with dapsone was switched to atovaquone due to persistent anemia. A repeat CT of the chest and a concurrent abdominal CT revealed interval enlargement of mediastinal lymph nodes with multiple periportal, retroperitoneal, and hilar nodes not present on prior chest imaging, in addition to new bilateral centrilobular nodules and interval development of small bilateral pleural effusions. The abdominal CT also showed hepatosplenomegaly with splenic‐vein engorgement. Empiric treatment for disseminated MAC infection with clarithromycin and ethambutol was initiated in addition to vancomycin and cefepime for possible healthcare‐associated pneumonia. Over the next several days, the patient continued to have daily fevers up to 39.8C. A repeat CD4 count 3 weeks after starting ART was 121 cells/L. The HIV RNA level had decreased to 854 copies/mL.
The patient has developed progressive, generalized lymphadenopathy, worsening pancytopenia, and persistent fevers in the setting of negative cultures and serologic studies and despite treatment for MAC. This constellation, along with the radiographic findings of hilar lymphadenopathy and pleural effusions, is suggestive of non‐Hodgkin lymphoma (NHL). Alternatively, Kaposi sarcoma (KS) or tuberculosis can have a similar radiographic and clinical presentation, although pancytopenia from KS seems unusual. The lymphadenopathy could be consistent with multicentric Castleman disease or bacillary angiomatosis (BA), although the latter diagnosis would be unlikely given recent antibiotic therapy. At this time, a careful search for other manifestations and reasonable targets for biopsy is warranted. An appropriate suppression of the HIV viral load after initiation of ART, with improvement in CD4 count, is the proper context for the immune reconstitution inflammatory syndrome (IRIS), which is characterized by paradoxical worsening or unmasking of a disseminated process.
A bone‐marrow biopsy revealed marked dysmegakaryopoiesis and mild dyserythropoiesis, but no other abnormalities. Flow cytometry and histoimmunochemical staining did not show evidence of lymphoproliferative disorder in the marrow. Smears and cultures of the bone marrow for bacteria, acid‐fast bacilli, and fungi were negative. A right cervical lymph node biopsy was performed, with multiple fine‐needle aspiration and core samples taken. Bacterial, fungal, and acid‐fast bacilli tissue cultures were without growth, and initial pathology results were concerning for high‐grade lymphoma. A monoclonal proliferation of lymphocytes was noted on flow cytometry of the tissue sample. The patient developed progressive dyspnea, tachypnea, and hypoxemia. A chest x‐ray revealed worsening perihilar and basilar opacities.
The possibility of bone‐marrow sampling error must be considered in a patient that has such a high pretest probability for lymphoma or infection, but staining, immunological assays, cultures, and direct assessment by pathologists generally give some suggestion of an alternative diagnosis. The bone‐marrow findings are compatible with HIV‐related changes, but continued vigilance for infection and malignancy is warranted. Although the diagnosis of NHL based on the cervical biopsy result is only preliminary, the patient's rapidly deteriorating clinical status warrants initiation of treatment with steroids while awaiting definitive results, particularly given his poor response to aggressive management of potential infectious causes. A bronchoscopy should be considered given the predominance of pulmonary symptoms and his rapid respiratory decline.
Approximately 1 week after admission, high‐dose systemic corticosteroids were administered for presumed aggressive lymphoma. Over the next 48 hours, the patient's hypoxemia worsened, and he was intubated for hypoxemic respiratory failure. A repeat chest CT (see Fig. 1) showed bilateral peribronchovascular patchy consolidations and pleural effusions without evidence of pulmonary embolism. The patient was also noted to have a single, discrete violaceous nodule on the hard palate as well as a nodule with similar appearance on his upper chest (neither lesion was present on admission). A skin biopsy was obtained. Despite steroids, antibiotic therapy, and aggressive critical‐care management, severe acidosis, progressive acute kidney injury, and anuria ensued. Continuous venovenous hemodialysis was initiated.
Discrete violaceous nodules with mucocutaneous localization in the context of AIDS are virtually pathognomonic for KS. Rarely, BA may be misdiagnosed as KS, or they may occur concurrently. The patient's current clinical deterioration, radiographic findings, and development of new skin lesions in the setting of response to ART are concerning for KS‐related IRIS with visceral involvement. It is likely that systemic corticosteroids are potentiating KS‐related IRIS. At this point, there is compelling evidence of 2 distinct systemic disease processes: lymphoma and KS‐related IRIS, both of which may be contributing to respiratory failure. Steroids can be highly effective in the treatment of high‐grade lymphoma but can be harmful in patients with KS, where they have been shown to potentially exacerbate underlying disease. Given the patient's worsening respiratory status, discontinuation of corticosteroids and initiation of chemotherapy against both opportunistic malignancies should be considered.
The patient's condition deteriorated with progressive acidosis and hypoxemia, and he died shortly after being transitioned to comfort‐care measures. Review of the skin biopsy revealed KS. Autopsy revealed disseminated KS involving the skin, lymph nodes, and lungs, and high‐grade anaplastic plasmablastic lymphoma infiltrating multiple lymph nodes and organs, including the lungs (see Fig. 2). There was no evidence of infection.
COMMENTARY
This case demonstrates the simultaneous fatal progression of 2 treatable HIV‐associated malignancies in an era in which the end‐stage manifestations of untreated HIV are becoming less common, particularly in developed countries. Modern ARTthe centerpiece of progress with HIVhas yielded dramatic improvements in prognosis, but in this case, by precipitating KS‐IRIS, ART paradoxically contributed to this patient's demise. Similarly, high‐dose systemic corticosteroids, which were deemed necessary to stabilize the progression of his high‐grade lymphoma, likely accelerated his KS. This corticosteroid‐mediated worsening appears to be unique to KS given that corticosteroids are often recommended to treat severe presentations of IRIS in other diseases (eg, tuberculosis, MAC, PCP).
Immune reconstitution inflammatory syndrome is the paradoxical worsening of well‐controlled disease or progression of previously occult disease after initiation of ART.1
Although infectious diseasesincluding mycobacteria, cytomegalovirus, cryptococcosis, or PCPare best known for their ability to recrudesce or manifest with a recovering immune system, opportunistic malignancies such as KS can do the same. Risk factors for development of IRIS are low pre‐ART CD4 count, high pre‐ART viral load, and rapid response to ART.2 In 1 large series, the median time to diagnosis of IRIS was 33 days.2 Immune reconstitution inflammatory syndrome is a clinical diagnosis without specific pathologic findings. Because IRIS is a diagnosis of exclusion, other explanations for worsening disease, including drug resistance, drug reactions (eg, abacavir hypersensitivity syndrome), and poor adherence to medications, should be ruled out before making the diagnosis.
Kaposi sarcoma is a vascular tumor associated with infection by human herpesvirus 8 (HHV‐8). The incidence of AIDS‐related KS has declined substantially in the post‐ART era.2, 4 The classic radiographic presentation of pulmonary KS includes central bilateral opacities with a peribronchovascular distribution as well as pulmonary nodules, intraseptal thickening, mediastinal lymphadenopathy, and associated pleural effusions.5, 6 Kaposi sarcomarelated IRIS has been described as developing within weeks of ART initiation and is associated with substantial morbidity and mortality, particularly in the context of pulmonary involvement, with 1 recent series showing 100% mortality in patients who did not receive chemotherapy.79
Human immunodeficiency virusassociated KS can respond well to ART alone. Indications for systemic chemotherapy for KS include extensive mucocutaneous disease, symptomatic visceral disease, or KS‐related IRIS.10 The main chemotherapeutic agents used systemically for KS are liposomal anthracyclines such as doxorubicin or daunorubicin, or taxanes such as paclitaxel.11 An association between corticosteroids and progression of KS has been previously described, even as early as several days after steroid administration.1214 Recently, revised diagnostic criteria for corticosteroid‐associated KS‐IRIS have been proposed; this patient met those criteria.15
Plasmablastic lymphoma is a highly aggressive systemic NHL seen predominantly in HIV‐positive patients. There is a strong association with Epstein‐Barr virus; HHV‐8 is more variably associated and is of unclear significance.16 Most HIV‐infected patients have extranodal involvement at diagnosis; in a series of 53 HIV‐positive patients, the oral cavity was the most frequent site, and lung involvement was seen in 12%. The prognosis is poor, with a mean survival of approximately 1 year.17
Treatment for systemic NHL in HIV‐positive patients generally consists of a chemotherapy regimen while ART is continued or initiated.18 The most commonly used chemotherapy combination is cyclophosphamide, doxorubicin, vincristine, and prednisone, often supplemented with the anti‐CD20 monoclonal antibody rituximab. In the case of aggressive systemic NHL, more intensive treatment regimens are often utilized, though it remains unclear if they are associated with improved outcomes.17, 19 Antiretroviral therapy is continued, as it has been shown to reduce the rate of opportunistic infections and decrease mortality.20
Despite the remarkable progress that has been made in the past 30 years, HIV/AIDS remains a devastating and remarkably complex disease. As the landscape of HIV/AIDS evolves, clinicians will continue to be faced with new challenging and vexing decisions. Perhaps no greater challenge exists than the presence of 2 simultaneous, rapidly fatal malignancies with directly competing therapeutic strategies, as in this case, where the ART and steroids employed to address NHL fostered widespread KS‐IRIS. This case reminds us that a single unifying diagnosis can often be the exception rather than the rule in the care of patients with advanced HIV. It also illustrates how the mainstay of HIV treatment, ART, can be a double‐edged sword.
KEY TEACHING POINTS
-
In HIV/AIDS patients receiving ART who become paradoxically more ill despite improvements in their CD4 counts, consider IRIS.
-
Though corticosteroids are a hallmark of treatment for most types of IRIS‐and for aggressive lymphomas‐they can worsen KS.
- , , , et al. Defining immune reconstitution inflammatory syndrome: evaluation of expert opinion versus 2 case definitions in a South African cohort. Clin Infect Dis. 2009;49:1424–1432.
- , , , et al. Risk factor analyses for immune reconstitution inflammatory syndrome in a randomized study of early vs. deferred ART during an opportunistic infection. PLoS One. 2010;5:e11416.
- , . Kaposi's sarcoma. N Engl J Med. 2000;342:1027–1038.
- , , , et al. The changing pattern of Kaposi sarcoma in patients with HIV, 1994–2003: the EuroSIDA Study. Cancer. 2004;100:2644–2654.
- , , , , , . Imaging features of pulmonary Kaposi sarcoma–associated immune reconstitution syndrome. AJR Am J Roentgenol. 2007;189:956–965.
- , , , et al. Pulmonary involvement in Kaposi sarcoma: correlation between imaging and pathology. Orphanet J Rare Dis. 2009;4:18.
- , , , et al. Immune reconstitution inflammatory syndrome associated with Kaposi's sarcoma. J Clin Oncol. 2005;23:5224–5228.
- , . Recrudescent Kaposi's sarcoma after initiation of HAART: a manifestation of immune reconstitution syndrome. AIDS Patient Care STDS. 2005;19:635–644.
- , , , , , . Paradoxical immune reconstitution inflammatory syndrome in HIV‐infected patients treated with combination antiretroviral therapy after AIDS‐defining opportunistic infection. Clin Infect Dis. 2012;54:424–433.
- , , , et al. British HIV Association guidelines for HIV‐associated malignancies 2008. HIV Med. 2008;9:336–388.
- , , , , . HIV/AIDS: epidemiology, pathophysiology, and treatment of Kaposi sarcoma–associated herpesvirus disease: Kaposi sarcoma, primary effusion lymphoma, and multicentric Castleman disease. Clin Infect Dis. 2008;47(9):1209–1215.
- , , . A 36‐year‐old man with AIDS and relapsing, nonproductive cough. Chest. 2007;131:1929–1931.
- , , , , . Life‐threatening exacerbation of Kaposi's sarcoma after prednisone treatment for immune reconstitution inflammatory syndrome. AIDS. 2008;22:663–665.
- , , , , , . Clinical effect of glucocorticoids on Kaposi sarcoma related to the acquired immunodeficiency syndrome (AIDS). Ann Intern Med. 1989;110:937–940.
- , , , . Kaposi sarcoma–associated immune reconstitution inflammatory syndrome: in need of a specific case definition. Clin Infect Dis. 2012;55(1):157–158.
- , , , , , . Plasmablastic lymphoma in HIV‐positive patients: an aggressive Epstein‐Barr virus–associated extramedullary plasmacytic neoplasm. Am J Surg Pathol. 2005;29:1633–1641.
- , , , et al. Human immunodeficiency virus–associated plasmablastic lymphoma: poor prognosis in the era of highly active antiretroviral therapy. Cancer. 2012;118:5270–5277.
- , , . Modern management of non‐Hodgkin lymphoma in HIV‐infected patients. Br J Haematol. 2007;136(5):685–698.
- , , , et al. CD20‐negative large‐cell lymphoma with plasmablastic features: a clinically heterogeneous spectrum in both HIV‐positive and ‐negative patients. Ann Oncol. 2004;15(11):1673–1679.
- , , , et al. Concomitant cyclophosphamide, doxorubicin, vincristine, and prednisone chemotherapy plus highly active antiretroviral therapy in patients with human immunodeficiency virus–related, non‐Hodgkin lymphoma. Cancer. 2001;91(1):155–163.
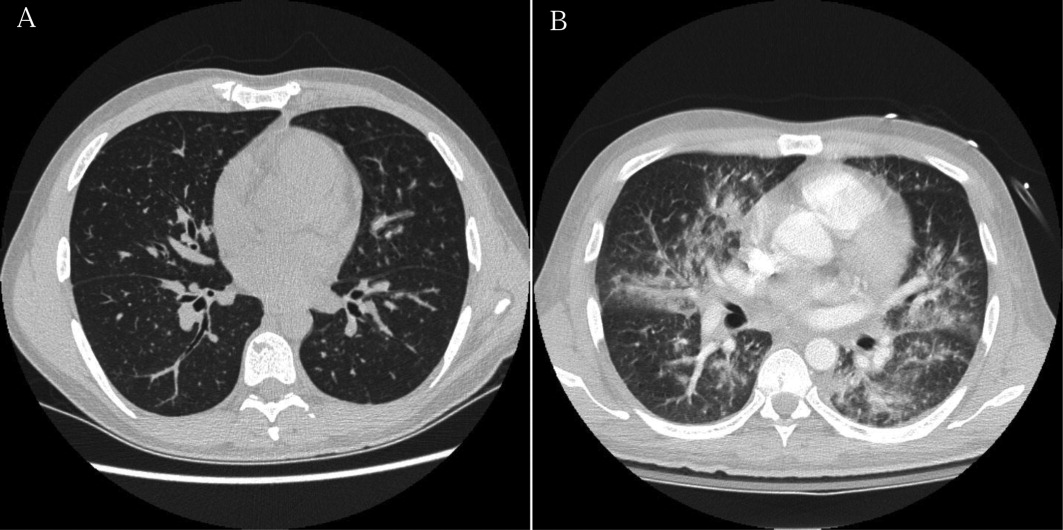
FDA approves apixaban for patients with NVAF
The FDA has approved the anticoagulant apixaban (Eliquis) as prophylaxis for stroke and systemic embolism in patients with nonvalvular atrial fibrillation (NVAF).
The agency’s decision is based on results of the ARISTOTLE trial, in which NVAF patients taking apixaban experienced fewer strokes than those on warfarin.
Apixaban use also resulted in lower rates of major bleeding and treatment discontinuation than warfarin.
The FDA had previously put off making a decision about apixaban, first last March and then in June, pending the receipt of additional data from the ARISTOTLE trial.
Though initial results of that study were promising, in other trials, apixaban produced mixed results.
In the APPRAISE-2 study, apixaban increased major bleeding in patients with acute coronary syndrome, without reducing recurrent ischemic events.
And although results of the ADVANCE-2 study suggested apixaban was superior to enoxaparin for the prevention of venous thromboembolism (VTE), the earlier ADVANCE study indicated the drugs were comparable in efficacy.
In the more recent AMPLIFY-EXTENSION study, apixaban reduced the incidence of VTE, VTE-related events, and death, when compared to placebo.
And in the AVERROES trial, apixaban proved superior to aspirin at preventing stroke in patients with atrial fibrillation who could not use vitamin K agonists.
Now, apixaban is approved for use in NVAF patients to reduce the risk of stroke and systemic embolism. The recommended dose for most patients is 5 mg orally twice daily.
But patients with at least 2 of the following characteristics—age of 80 years or older, weight of 60 kg or less, or serum creatinine of 1.5 mg/dL or greater—should receive 2.5 mg orally twice daily.
Patients with prosthetic heart valves should not take apixaban, nor should patients with atrial fibrillation caused by a heart valve problem. These patients have not been studied in clinical trials.
Bleeding, including life-threatening and fatal bleeding, is the most serious risk with apixaban. Additionally, the drug’s anticoagulant effects are irreversible.
Apixaban has also been approved in Japan, Canada, and the European Union. The drug is manufactured by Bristol-Myers Squibb Company of Princeton, New Jersey, and marketed by BMS and Pfizer Inc., of New York.
For additional information on apixaban, see the package insert. ![]()
Hospitalist Care and Patient Satisfaction
Payers and policymakers are increasingly holding hospitals accountable for patients' experiences with their care. Since 2006, the Centers for Medicare and Medicaid Services (CMS) have collected data on patients' experiences with inpatient care using the Hospital Consumer Assessment of Healthcare Providers and Systems (HCAHPS) survey, a well‐validated and widely used tool. In 2008, these data on patient experience began to be publicly reported, and CMS now plans to base part of its payments to hospitals on HCAHPS performance scores. In this context, hospitals are looking for ways to improve patient satisfaction.
The effort to hold hospitals accountable for patient experience may conflict with another major trend in US hospitals: the increasing use of hospitalists.[1] Although hospitalists may have greater expertise in the day‐to‐day care of the hospitalized patient, they generally do not know the patient and cannot cater to patients' preferences in ways that the primary‐care provider might. Therefore, given that patients may prefer to be seen by their primary‐care provider,[2] greater use of hospitalists may actually lead to a decrease in patient satisfaction. Unfortunately, we are unaware of any national examination of the relationship between hospitalist use in an institution and that entity's performance on patient‐experience scores.
To better understand the relationship between greater hospitalist staffing and patient‐centered care, we examined the association between hospitalist staffing and patient satisfaction with both overall care and specific domains of patient‐centered care. We hypothesized that hospitals that used a high proportion of hospitalists would generally have lower patient‐experience scores. Further, we expected that the relationship would be monotonic (greater use of hospitalists associated with lower scores) and particularly pronounced in 2 domains: patient experience with discharge planning and patient experience with physician communication.
METHODS
Data
We sought to identify acute‐care hospitals with elderly medical patients cared for by hospitalists, non‐hospitalists, or some combination of the 2. To construct this cohort, we used 3 2009 Medicare files. The Beneficiary Summary File contains demographic information on Medicare beneficiaries and data on enrollment in managed‐care plans. To identify medical hospitalizations, we used the Medicare Provider Analysis and Review (MedPAR) 100% Files, which contain the clinical diagnoses and payments for all fee‐for‐service Medicare beneficiaries discharged from acute‐care hospitals. To identify hospitalists and non‐hospitalists, we used the 5% Carrier File, which contains physician billing data for a 5% random sample of fee‐for‐service Medicare beneficiaries. We also obtained information on hospital characteristics from the American Hospital Association (AHA) Annual Survey. We supplemented this with hospital‐level data on patient satisfaction from the HCAHPS survey conducted in 2009. The HCAHPS is a standard survey developed by the Agency for Healthcare Research and Quality (AHRQ) and administered by hospitals to a random sample of adult patients 48 hours to 6 weeks after discharge. The HCAHPS results are adjusted for patient mix and have been tested for nonresponse bias.[3] Details about the development and design of HCAHPS have been described previously.[4]
Patient and Hospital Sample
We started with 48,861,000 Medicare beneficiaries in the Beneficiary Summary File and excluded 38% either because their age was <65 years or they were members of an HMO. At the same time, from the 1,850,000 patients in the 5% Carrier File, we excluded 55% who had not been cared for by a general internist. Finally, we used the MedPAR File to identify 17,387,000 hospital admissions by fee‐for‐service Medicare beneficiaries. From MedPAR, we excluded admissions to a facility other than an acute‐care hospital (24%), surgical admissions identified by diagnosis‐related group (DRG) (29%), and admissions to hospitals with <5 medicine admissions in 2009 (<0.1%). After merging these 3 files (Beneficiary Summary, MedPAR, and 5% Carrier), we were left with 229,496 admissions among 180,399 patients at 3365 hospitals. We subsequently excluded readmissions and were left with 156,333 admissions at 3244 hospitals. Finally, we excluded those patients cared for by both hospitalists and non‐hospitalists during the same hospitalization, and those hospitals missing AHA or HCAHPS data, leaving us with 132,814 patients at 2843 hospitals.
Definition of Hospitalist
We used the claims‐based definition developed and validated by Kuo and Goodwin in earlier work.[1] Hospitalists are defined as those general internists (providers in general practice or internal medicine) who had 5 evaluation and management (E&M) billings (in a 5% sample of Medicare beneficiaries) in 2009 and generated >90% of their claims from the care of hospitalized patients in 2009.
Measures of Patient Satisfaction
There are 2 HCAHPS questions about overall satisfaction, one that asks patients to rate their experience on a scale of 0 to 10 and another that asks whether they would recommend the hospital. Not surprisingly, hospitals' performance on these 2 questions is highly correlated.[5] We measured overall patient experience using commonly used approaches: the proportion of patients who gave the hospital a 9 or 10 (on the 10‐point scale) or the proportion of patients who reported that they would definitely recommend the hospital. The HCAHPS also contains 24 questions, which are reported by CMS in 8 domains: communication with nurse, communication with physician, responsiveness of the staff, pain control, communication about medications, adequacy of discharge planning, cleanliness of the room, and quietness of the room. The patient‐satisfaction score for each of these domains represents the proportion of patients who answered always to each of the questions, or who answered yes to the question about discharge.
Potentially Confounding Variables
Because we were worried that hospitals with hospitalists would be different from hospitals without hospitalists, we identified a series of covariates for adjustment in a multivariable model. We extracted data from the AHA on hospitals' structural characteristics that we assumed might be associated both with having a hospitalist and with patient experience. These variables were size (number of beds), teaching status (membership in the Council of Teaching Hospitals vs no membership), location (urban vs rural), region (the 4 census regions), ownership (for profit, private nonprofit, or public), and presence of advanced clinical capabilities (as measured by having a medical, surgical, and/or cardiac intensive care unit [ICU]). We also used information about the patient population (proportion of patients with Medicare or with Medicaid) as well as nurse‐staffing level (ratio of full‐time equivalent registered nurses to total hospital beds).
Statistical Analyses
We first quantified hospital variation in the proportion of general‐medicine patients cared for by hospitalists, using basic descriptive statistics. Based on these analyses, we categorized hospitals into 3 groups: non‐hospitalist, mixed, and hospitalist (corresponding to lowest, middle, and highest tertile of hospitalist use respectively). We used bivariate techniques to describe the patient and hospital characteristics of hospitals in each group. Patient characteristics included number of comorbidities, which were calculated using software from the Healthcare Cost and Utilization Project (HCUP),[6] based on methods developed by Elixhauser et al.[7] We used the ‐square test to assess whether hospital or patient characteristics differed between hospitalist, mixed, and non‐hospitalist hospitals.
To examine the association between hospitalist care and patient satisfaction, we first constructed bivariate models for each measure of patient satisfaction. In these models, hospital type (hospitalist, mixed, and non‐hospitalist) was our predictor. We next constructed multivariable models, which adjusted for each of the hospital characteristics described above in order to assess the independent relationship between hospitalist care and HCAHPS performance.
In sensitivity analyses, we first examined hospitalist use as a continuous variable and had qualitatively very similar results. Those data are not presented. Additionally, we conducted a propensity score analysis, with results presented in the Appendix (see Supporting Information, Appendix 1, in the online version of this article). In our first‐stage logistic regression model, being a hospitalist hospital (defined as being in the top tertile of hospitalist use vs bottom 2 tertiles) was the outcome. Hospital structural factors were covariates. Based on this first‐stage model, each hospital was assigned a propensity of being a hospitalist hospital. We divided the hospitals into 3 groups (highest propensity tertile, middle propensity tertile, and lowest propensity tertile). In a second‐stage linear regression model, patient satisfaction score was the outcome. The predictors were hospital type (dichotomized, and defined as being in the top tertile of hospitalist use vs bottom 2 tertiles), and propensity of being a hospitalist hospital (3 categories, with low propensity as the reference).
All analyses were performed using SAS version 9.2. The project was reviewed by the Institutional Review Board at the University of Michigan and determined to be not regulated given our use of publicly available datasets.
RESULTS
Among all hospitals, the median proportion of general‐medicine admissions cared for by hospitalists was 41.2% (interquartile range [IQR], 11.5%67.4%). However, US hospitals varied widely in the proportion of general‐medicine patients cared for by hospitalists (Figure 1). Whereas 3.5% of hospitals had all of their general‐medicine patients cared for by hospitalists, 16.6% had none of their general‐medicine patients seen by hospitalists. For hospitals with at least some hospitalist care, the proportion of patients cared for by hospitalists was distributed fairly evenly across the range of possibilities (Figure 1).

Because hospitalist care varied widely among hospitals, we categorized hospitals into 3 groups (non‐hospitalist, mixed, and hospitalist). The median proportion of patients cared for by hospitalists in the 3 groups was 0%, 39.5%, and 76.5%, respectively (Table 1). The non‐hospitalist hospitals, when compared with mixed and hospitalist hospitals, were more likely to be small, nonteaching, for‐profit institutions located in the Midwestern United States. They also were less likely to have an ICU and had lower nurse‐to‐bed ratios.
| Hospital Characteristics | Hospital Type | P Value | ||
|---|---|---|---|---|
| Non‐Hospitalist (N = 943) | Mixed (N = 948) | Hospitalist (N = 952) | ||
| ||||
| GM admissions cared for by hospitalists, median (range), % | 0 (021) | 40 (2158) | 77 (58100) | <0.001 |
| Nurse‐to‐bed ratio | 1 | 1 | 2 | <0.001 |
| Presence of MICU, % | 79 | 84 | 85 | 0.001 |
| Medicaid patients, % | 19 | 18 | 18 | 0.06 |
| Hospital beds, % | <0.001 | |||
| Small (99) | 36 | 16 | 24 | |
| Medium (100399) | 59 | 64 | 58 | |
| Large (400) | 6 | 21 | 18 | |
| COTH membership, % | <0.001 | |||
| Yes | 3 | 13 | 11 | |
| No | 97 | 87 | 89 | |
| Urban, % | 0.10 | |||
| Yes | 88 | 89 | 91 | |
| No | 12 | 11 | 9 | |
| Profit status, % | <0.001 | |||
| For profit | 21 | 17 | 18 | |
| Not for profit, private | 62 | 71 | 67 | |
| Other | 18 | 12 | 15 | |
| Region, % | <0.001 | |||
| South | 41 | 42 | 42 | |
| Northeast | 14 | 21 | 16 | |
| Midwest | 30 | 22 | 18 | |
| West | 15 | 15 | 24 | |
The types of patients cared for at all 3 hospital types (non‐hospitalist, mixed, and hospitalist) were similar in age and day of admission (Table 2). Patients cared for at non‐hospitalist hospitals were slightly more likely to be female and non‐White, and less likely to be admitted from the emergency department or another hospital or healthcare facility.
| Patient Characteristics | Hospital Type | P Value | ||
|---|---|---|---|---|
| Non‐Hospitalist (N = 33,265) | Mixed (N = 52,844) | Hospitalist (N = 46,705) | ||
| ||||
| Age, y | 0.51 | |||
| 6574 | 27 | 27 | 27 | |
| 7584 | 39 | 39 | 39 | |
| 85 | 34 | 34 | 34 | |
| Sex | <0.001 | |||
| M | 35 | 35 | 36 | |
| F | 65 | 65 | 64 | |
| Race/ethnicity | <0.001 | |||
| White | 85 | 85 | 87 | |
| Black | 10 | 11 | 9 | |
| Other | 5 | 4 | 4 | |
| Unknown | 0 | 0 | 0 | |
| Comorbidities, % | <0.001 | |||
| 0 | 8 | 8 | 7 | |
| 1 | 23 | 23 | 22 | |
| 2+ | 69 | 69 | 71 | |
| Day of admission | 0.08 | |||
| Weekday | 73 | 73 | 73 | |
| Weekend | 27 | 27 | 27 | |
| Admission source | <0.001 | |||
| ED | 75 | 78 | 80 | |
| Another ACH | 1 | 2 | 3 | |
| Other healthcare facility | 4 | 4 | 4 | |
| Other | 20 | 17 | 13 | |
| ICU stay | <0.001 | |||
| Yes | 13 | 12 | 12 | |
| No | 87 | 88 | 88 | |
| Length of stay, d | <0.001 | |||
| Median (Q1, Q3) | 4 (3, 6) | 4 (2, 6) | 3 (2, 5) | |
| DRG | <0.001 | |||
| Septicemia or severe sepsis | 3 | 4 | 4 | |
| Esophagitis, gastroenteritis | 3 | 3 | 3 | |
| Kidney and urinary tract infections | 3 | 3 | 3 | |
| Syncope | 3 | 3 | 3 | |
| Pneumonia | 3 | 3 | 3 | |
When we examined unadjusted relationships between type of hospital and patient experience, we found that patients at hospitalist vs non‐hospitalist hospitals were more likely to recommend the hospital (69.4% vs 65.1%: P < 0.001), and report higher overall satisfaction (65.9% vs 63.6%: P < 0.001) ((see Supporting Information, Appendix, Table A1, in the online version of this article)). Care at hospitalist hospitals was associated with higher satisfaction with discharge, but lower satisfaction with room cleanliness and communication with doctors. These differences were statistically significant at the P < 0.05 level.
When we examined the relationship between having more hospitalists and patient experience using multivariable models that accounted for differences in hospital characteristics, we found largely similar results: The proportion of patients who were satisfied with their overall care was still higher at hospitalist compared with non‐hospitalist hospitals (65.6% vs 63.9%: P < 0.001) (Figure 2). Similarly, patients were more likely to definitely recommend their hospital if they had been cared for at a hospitalist vs non‐hospitalist hospital (66.0% vs 63.4%: P < 0.001).
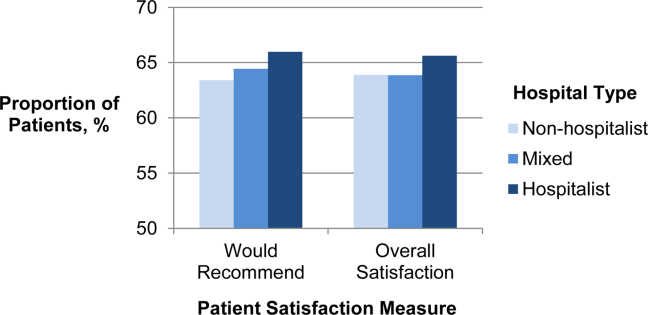
To better understand which domains of care might be contributing to greater overall satisfaction, we also examined patient satisfaction with specific domains of care at hospitalist vs non‐hospitalist hospitals (Table 3) in our adjusted analyses. Among 8 domains, the largest difference in satisfaction between patients cared for at hospitalist vs non‐hospitalist hospitals occurred with discharge. At hospitalist hospitals, 80.3% of patients said they were satisfied with the quality of the discharge planning compared with 78.1% at non‐hospitalist hospitals (P < 0.001). Patients at hospitalist hospitals were more satisfied with most other domains of care as well. Patients cared for at hospitalist hospitals were slightly less likely to be satisfied with communication with doctors, but this difference was not statistically significant (P = 0.45). Results were qualitatively similar in propensity‐score analyses (see Supporting Information, Appendix, Table A2, in the online version of this article).
| Specific Domains of Care | Hospital Type, % Satisfied | Hospitalist vs Non‐Hospitalist | |||
|---|---|---|---|---|---|
| Non‐Hospitalist | Mixed | Hospitalist | Difference in % Satisfied | P Value | |
| |||||
| Discharge | 78.1 | 79.1 | 80.3 | 2.1 | <0.001 |
| Nursing services | 66.0 | 65.8 | 67.1 | 1.1 | <0.001 |
| Quiet | 63.3 | 63.1 | 64.4 | 1.1 | 0.001 |
| Communication, nurse | 76.7 | 76.7 | 77.7 | 1.0 | <0.001 |
| Pain control | 69.7 | 69.7 | 70.4 | 0.7 | 0.001 |
| Medications | 60.5 | 60.5 | 61.2 | 0.7 | 0.002 |
| Cleanliness | 72.7 | 72.1 | 72.9 | 0.2 | 0.56 |
| Communication, physician | 83.6 | 83.1 | 83.5 | 0.2 | 0.45 |
DISCUSSION
We found that in 2009, US hospitals varied widely in the proportion of general medicine patients cared for by hospitalists. Hospitals with higher levels of hospitalist care did better on most measures of patient satisfaction. Differences were largest in overall satisfaction and for discharge planning. In 5 other domains of care, differences were smaller, but hospitals with more hospitalist care consistently performed better than non‐hospitalist hospitals. Hospitalist care was not associated with patient satisfaction in 2 domains: communication with doctors and cleanliness of room.
Our findings of modestly higher patient satisfaction at hospitalist hospitals along most dimensions of care are surprising and reassuring. Indeed, when hospitalists first began caring for inpatients, some expressed concerns that hospitalist care would decrease patient satisfaction.[8, 9] Though this has been an ongoing concern, we found no evidence to support this contention. It may be that as a response to the concern, hospitals with hospitalists have paid particular attention to issues such as effective handoffs to primary‐care providers.[10, 11, 12, 13] Whether due to these efforts or other factors such as the 24/7 inpatient presence of hospitalists, we found that patients at hospitalist hospitals were more likely to be satisfied with their inpatient care, including their experience at discharge. In contrast, one area that may offer room for improvement for hospitalist hospitals is communication with physicians. It may be that patients cared for by hospitalists do not know their physicians as well as patients whose care is being orchestrated by their primary‐care provider, and thus the benefits of having an ever‐present hospitalist are diminished.
The magnitude of the associations that we found should also be placed in the context of existing research on patient satisfaction. Prior work has described baseline hospital performance, changes over time, and factors associated with greater inpatient satisfaction.[5, 14, 15] The associations that we found between hospitalist care and satisfaction with care at discharge were larger than those found for teaching (vs non‐teaching) hospitals.[5] However, compared with other hospital characteristics such as nurse staffing or profit status, hospitalist care was associated with smaller differences in patient satisfaction. In one study, hospitals in the highest quartile of nurse staffing had HCAHPS scores (ie, willingness to recommend measure) that were 6.7 points higher than those in the lowest quartile of nurse staffing, and similar differences existed between not‐for‐profit, public hospitals vs for‐profit hospitals.[5]
Taken together, our findings address an important gap in knowledge about hospitalist care. Prior research has documented growth in the use of hospitalist care[1] and described the association of hospitalist care with outcomes such as mortality and resource use, and receipt of recommended care.[16, 17, 18, 19] However, we are unaware of any national study that has examined the association of hospitalist care with patient satisfaction. One study surveyed patients in a single health system and found that patients were similarly satisfied with care provided by hospitalists and primary‐care physicians.[20] Our findings should be reassuring to clinical leaders and policymakers who have advocated greater use of hospitalists: the results suggest that there need be no tradeoff between greater use of hospitalist services and patient satisfaction. Indeed, patients appear to be even more satisfied in hospitals that have greater use of hospitalist physicians.
Our study has several limitations. First, it was a cross‐sectional study, and thus we cannot make any conclusions about causality. Although we adjusted for several potential confounders (eg, teaching status, advanced care capabilities, nurse staffing), it is possible that hospitalist care is a surrogate marker for features of hospitals that we could not measure but that directly influence patient experience. In addition, it is possible that patients cared for at hospitalist hospitals differ in unmeasured ways from patients cared for at other types of hospitals. Second, we constructed our primary predictor and outcome from different cohorts. Our primary predictor was derived from the proportion of general‐medicine patients cared for by hospitalists in Medicare claims data. In contrast, our primary outcome was based on HCAHPS responses from a random sampling of all hospital admissions. This misclassification likely would have biased us towards finding small or no associations. Therefore, we are likely underestimating the true association between hospitalist use and patient experience. Third, our findings may not be generalizable to hospitals that serve younger patients or have a large number of specialist hospitalists (who were not included in our definition of hospitalists). For example, compared with older patients with multiple comorbidities, relatively healthy younger patients may derive less benefit from an ever‐present hospitalist who can explain discharge plans or an attentive nurse.
In summary, we found that US hospitals varied widely in their use of hospitalist physicians, and those which a greater proportion of care was delivered by hospitalists generally had better scores on patient experience, especially on the global assessment of satisfaction and in discharge care. Our findings suggest that adoption of the hospitalist modelone of the strategies employed by US hospitals in the past 2 decades to provide efficient careshould not detract from achieving the goal of more patient‐centered care.
Disclosures
Dr. Chen's work is supported in part by the National Institutes of Health/National Institute on Aging (AG024824, University of Michigan Claude D. Pepper Older Americans Independence Center), and the National Institutes of Health/National Center for Research Resources (UL1‐RR024986, Michigan Institute for Clinical and Health Research). Dr. Chen is also supported by a Career Development Grant Award (K08HS020671) from the Agency for Healthcare Research and Quality.
- , , , . Growth in the care of older patients by hospitalists in the United States. N Engl J Med. 2009;360(11):1102–1112.
- , , . How do patients view the role of the primary care physician in inpatient care? Dis Mon. 2002;48(4):230–238.
- , , , et al. Effects of survey mode, patient mix, and nonresponse on CAHPS hospital survey scores. Health Serv Res. 2009;44(2 pt 1):501–518.
- , , , , . Development, implementation, and public reporting of the HCAHPS survey. Med Care Res Rev. 2010;67(1):27–37.
- , , , . Patients' perception of hospital care in the United States. N Engl J Med. 2008;359(18):1921–1931.
- Agency for Healthcare Research and Quality. Healthcare Cost and Utilization Project (HCUP). HCUP Comorbidity Software. http://www.hcup‐us.ahrq.gov/toolssoftware/comorbidity/comorbidity.jsp Accessed November 12, 2012.
- , , , . Comorbidity measures for use with administrative data. Med Care. 1998;36(1):8–27.
- , , . Physician views on caring for hospitalized patients and the hospitalist model of inpatient care. J Gen Intern Med. 2001;16(2):116–119.
- , , , . How physicians perceive hospitalist services after implementation: anticipation vs reality. Arch Intern Med. 2003;163(19):2330–2336.
- , , , et al. Association of communication between hospital‐based physicians and primary care providers with patient outcomes. J Gen Intern Med. 2009;24(3):381–386.
- , , . Passing the clinical baton: 6 principles to guide the hospitalist. Dis Mon. 2002;48(4):260–266.
- , , , . Primary care physician attitudes regarding communication with hospitalists. Am J Med. 2001;111(9B):15S–20S.
- , , , et al. Transitions of Care Consensus policy statement: American College of Physicians, Society of General Internal Medicine, Society of Hospital Medicine, American Geriatrics Society, American College Of Emergency Physicians, and Society for Academic Emergency Medicine. J Hosp Med. 2009;4(6):364–370.
- , , , et al. Hospital survey shows improvements in patient experience. Health Aff (Millwood). 2010;29(11):2061–2067.
- , , , , , . Characteristics of hospitals demonstrating superior performance in patient experience and clinical process measures of care. Med Care Res Rev. 2010;67(1):38–55.
- , . The impact of hospitalists on the cost and quality of inpatient care in the United States: a research synthesis. Med Care Res Rev. 2005;62(4):379–406.
- , , , , . Quality of care for patients hospitalized with heart failure: assessing the impact of hospitalists. Arch Intern Med. 2002;162(11):1251–1256.
- , , , , . Hospitalists and the quality of care in hospitals. Arch Intern Med. 2009;169(15):1389–1394.
- , , , et al. Quality of care for decompensated heart failure: comparable performance between academic hospitalists and non‐hospitalists. J Gen Intern Med. 2008;23(9):1399–1406.
- , , , et al. Patient satisfaction with hospital care provided by hospitalists and primary care physicians. J Hosp Med. 2012;7(2):131–136.
Payers and policymakers are increasingly holding hospitals accountable for patients' experiences with their care. Since 2006, the Centers for Medicare and Medicaid Services (CMS) have collected data on patients' experiences with inpatient care using the Hospital Consumer Assessment of Healthcare Providers and Systems (HCAHPS) survey, a well‐validated and widely used tool. In 2008, these data on patient experience began to be publicly reported, and CMS now plans to base part of its payments to hospitals on HCAHPS performance scores. In this context, hospitals are looking for ways to improve patient satisfaction.
The effort to hold hospitals accountable for patient experience may conflict with another major trend in US hospitals: the increasing use of hospitalists.[1] Although hospitalists may have greater expertise in the day‐to‐day care of the hospitalized patient, they generally do not know the patient and cannot cater to patients' preferences in ways that the primary‐care provider might. Therefore, given that patients may prefer to be seen by their primary‐care provider,[2] greater use of hospitalists may actually lead to a decrease in patient satisfaction. Unfortunately, we are unaware of any national examination of the relationship between hospitalist use in an institution and that entity's performance on patient‐experience scores.
To better understand the relationship between greater hospitalist staffing and patient‐centered care, we examined the association between hospitalist staffing and patient satisfaction with both overall care and specific domains of patient‐centered care. We hypothesized that hospitals that used a high proportion of hospitalists would generally have lower patient‐experience scores. Further, we expected that the relationship would be monotonic (greater use of hospitalists associated with lower scores) and particularly pronounced in 2 domains: patient experience with discharge planning and patient experience with physician communication.
METHODS
Data
We sought to identify acute‐care hospitals with elderly medical patients cared for by hospitalists, non‐hospitalists, or some combination of the 2. To construct this cohort, we used 3 2009 Medicare files. The Beneficiary Summary File contains demographic information on Medicare beneficiaries and data on enrollment in managed‐care plans. To identify medical hospitalizations, we used the Medicare Provider Analysis and Review (MedPAR) 100% Files, which contain the clinical diagnoses and payments for all fee‐for‐service Medicare beneficiaries discharged from acute‐care hospitals. To identify hospitalists and non‐hospitalists, we used the 5% Carrier File, which contains physician billing data for a 5% random sample of fee‐for‐service Medicare beneficiaries. We also obtained information on hospital characteristics from the American Hospital Association (AHA) Annual Survey. We supplemented this with hospital‐level data on patient satisfaction from the HCAHPS survey conducted in 2009. The HCAHPS is a standard survey developed by the Agency for Healthcare Research and Quality (AHRQ) and administered by hospitals to a random sample of adult patients 48 hours to 6 weeks after discharge. The HCAHPS results are adjusted for patient mix and have been tested for nonresponse bias.[3] Details about the development and design of HCAHPS have been described previously.[4]
Patient and Hospital Sample
We started with 48,861,000 Medicare beneficiaries in the Beneficiary Summary File and excluded 38% either because their age was <65 years or they were members of an HMO. At the same time, from the 1,850,000 patients in the 5% Carrier File, we excluded 55% who had not been cared for by a general internist. Finally, we used the MedPAR File to identify 17,387,000 hospital admissions by fee‐for‐service Medicare beneficiaries. From MedPAR, we excluded admissions to a facility other than an acute‐care hospital (24%), surgical admissions identified by diagnosis‐related group (DRG) (29%), and admissions to hospitals with <5 medicine admissions in 2009 (<0.1%). After merging these 3 files (Beneficiary Summary, MedPAR, and 5% Carrier), we were left with 229,496 admissions among 180,399 patients at 3365 hospitals. We subsequently excluded readmissions and were left with 156,333 admissions at 3244 hospitals. Finally, we excluded those patients cared for by both hospitalists and non‐hospitalists during the same hospitalization, and those hospitals missing AHA or HCAHPS data, leaving us with 132,814 patients at 2843 hospitals.
Definition of Hospitalist
We used the claims‐based definition developed and validated by Kuo and Goodwin in earlier work.[1] Hospitalists are defined as those general internists (providers in general practice or internal medicine) who had 5 evaluation and management (E&M) billings (in a 5% sample of Medicare beneficiaries) in 2009 and generated >90% of their claims from the care of hospitalized patients in 2009.
Measures of Patient Satisfaction
There are 2 HCAHPS questions about overall satisfaction, one that asks patients to rate their experience on a scale of 0 to 10 and another that asks whether they would recommend the hospital. Not surprisingly, hospitals' performance on these 2 questions is highly correlated.[5] We measured overall patient experience using commonly used approaches: the proportion of patients who gave the hospital a 9 or 10 (on the 10‐point scale) or the proportion of patients who reported that they would definitely recommend the hospital. The HCAHPS also contains 24 questions, which are reported by CMS in 8 domains: communication with nurse, communication with physician, responsiveness of the staff, pain control, communication about medications, adequacy of discharge planning, cleanliness of the room, and quietness of the room. The patient‐satisfaction score for each of these domains represents the proportion of patients who answered always to each of the questions, or who answered yes to the question about discharge.
Potentially Confounding Variables
Because we were worried that hospitals with hospitalists would be different from hospitals without hospitalists, we identified a series of covariates for adjustment in a multivariable model. We extracted data from the AHA on hospitals' structural characteristics that we assumed might be associated both with having a hospitalist and with patient experience. These variables were size (number of beds), teaching status (membership in the Council of Teaching Hospitals vs no membership), location (urban vs rural), region (the 4 census regions), ownership (for profit, private nonprofit, or public), and presence of advanced clinical capabilities (as measured by having a medical, surgical, and/or cardiac intensive care unit [ICU]). We also used information about the patient population (proportion of patients with Medicare or with Medicaid) as well as nurse‐staffing level (ratio of full‐time equivalent registered nurses to total hospital beds).
Statistical Analyses
We first quantified hospital variation in the proportion of general‐medicine patients cared for by hospitalists, using basic descriptive statistics. Based on these analyses, we categorized hospitals into 3 groups: non‐hospitalist, mixed, and hospitalist (corresponding to lowest, middle, and highest tertile of hospitalist use respectively). We used bivariate techniques to describe the patient and hospital characteristics of hospitals in each group. Patient characteristics included number of comorbidities, which were calculated using software from the Healthcare Cost and Utilization Project (HCUP),[6] based on methods developed by Elixhauser et al.[7] We used the ‐square test to assess whether hospital or patient characteristics differed between hospitalist, mixed, and non‐hospitalist hospitals.
To examine the association between hospitalist care and patient satisfaction, we first constructed bivariate models for each measure of patient satisfaction. In these models, hospital type (hospitalist, mixed, and non‐hospitalist) was our predictor. We next constructed multivariable models, which adjusted for each of the hospital characteristics described above in order to assess the independent relationship between hospitalist care and HCAHPS performance.
In sensitivity analyses, we first examined hospitalist use as a continuous variable and had qualitatively very similar results. Those data are not presented. Additionally, we conducted a propensity score analysis, with results presented in the Appendix (see Supporting Information, Appendix 1, in the online version of this article). In our first‐stage logistic regression model, being a hospitalist hospital (defined as being in the top tertile of hospitalist use vs bottom 2 tertiles) was the outcome. Hospital structural factors were covariates. Based on this first‐stage model, each hospital was assigned a propensity of being a hospitalist hospital. We divided the hospitals into 3 groups (highest propensity tertile, middle propensity tertile, and lowest propensity tertile). In a second‐stage linear regression model, patient satisfaction score was the outcome. The predictors were hospital type (dichotomized, and defined as being in the top tertile of hospitalist use vs bottom 2 tertiles), and propensity of being a hospitalist hospital (3 categories, with low propensity as the reference).
All analyses were performed using SAS version 9.2. The project was reviewed by the Institutional Review Board at the University of Michigan and determined to be not regulated given our use of publicly available datasets.
RESULTS
Among all hospitals, the median proportion of general‐medicine admissions cared for by hospitalists was 41.2% (interquartile range [IQR], 11.5%67.4%). However, US hospitals varied widely in the proportion of general‐medicine patients cared for by hospitalists (Figure 1). Whereas 3.5% of hospitals had all of their general‐medicine patients cared for by hospitalists, 16.6% had none of their general‐medicine patients seen by hospitalists. For hospitals with at least some hospitalist care, the proportion of patients cared for by hospitalists was distributed fairly evenly across the range of possibilities (Figure 1).
Because hospitalist care varied widely among hospitals, we categorized hospitals into 3 groups (non‐hospitalist, mixed, and hospitalist). The median proportion of patients cared for by hospitalists in the 3 groups was 0%, 39.5%, and 76.5%, respectively (Table 1). The non‐hospitalist hospitals, when compared with mixed and hospitalist hospitals, were more likely to be small, nonteaching, for‐profit institutions located in the Midwestern United States. They also were less likely to have an ICU and had lower nurse‐to‐bed ratios.
| Hospital Characteristics | Hospital Type | P Value | ||
|---|---|---|---|---|
| Non‐Hospitalist (N = 943) | Mixed (N = 948) | Hospitalist (N = 952) | ||
| ||||
| GM admissions cared for by hospitalists, median (range), % | 0 (021) | 40 (2158) | 77 (58100) | <0.001 |
| Nurse‐to‐bed ratio | 1 | 1 | 2 | <0.001 |
| Presence of MICU, % | 79 | 84 | 85 | 0.001 |
| Medicaid patients, % | 19 | 18 | 18 | 0.06 |
| Hospital beds, % | <0.001 | |||
| Small (99) | 36 | 16 | 24 | |
| Medium (100399) | 59 | 64 | 58 | |
| Large (400) | 6 | 21 | 18 | |
| COTH membership, % | <0.001 | |||
| Yes | 3 | 13 | 11 | |
| No | 97 | 87 | 89 | |
| Urban, % | 0.10 | |||
| Yes | 88 | 89 | 91 | |
| No | 12 | 11 | 9 | |
| Profit status, % | <0.001 | |||
| For profit | 21 | 17 | 18 | |
| Not for profit, private | 62 | 71 | 67 | |
| Other | 18 | 12 | 15 | |
| Region, % | <0.001 | |||
| South | 41 | 42 | 42 | |
| Northeast | 14 | 21 | 16 | |
| Midwest | 30 | 22 | 18 | |
| West | 15 | 15 | 24 | |
The types of patients cared for at all 3 hospital types (non‐hospitalist, mixed, and hospitalist) were similar in age and day of admission (Table 2). Patients cared for at non‐hospitalist hospitals were slightly more likely to be female and non‐White, and less likely to be admitted from the emergency department or another hospital or healthcare facility.
| Patient Characteristics | Hospital Type | P Value | ||
|---|---|---|---|---|
| Non‐Hospitalist (N = 33,265) | Mixed (N = 52,844) | Hospitalist (N = 46,705) | ||
| ||||
| Age, y | 0.51 | |||
| 6574 | 27 | 27 | 27 | |
| 7584 | 39 | 39 | 39 | |
| 85 | 34 | 34 | 34 | |
| Sex | <0.001 | |||
| M | 35 | 35 | 36 | |
| F | 65 | 65 | 64 | |
| Race/ethnicity | <0.001 | |||
| White | 85 | 85 | 87 | |
| Black | 10 | 11 | 9 | |
| Other | 5 | 4 | 4 | |
| Unknown | 0 | 0 | 0 | |
| Comorbidities, % | <0.001 | |||
| 0 | 8 | 8 | 7 | |
| 1 | 23 | 23 | 22 | |
| 2+ | 69 | 69 | 71 | |
| Day of admission | 0.08 | |||
| Weekday | 73 | 73 | 73 | |
| Weekend | 27 | 27 | 27 | |
| Admission source | <0.001 | |||
| ED | 75 | 78 | 80 | |
| Another ACH | 1 | 2 | 3 | |
| Other healthcare facility | 4 | 4 | 4 | |
| Other | 20 | 17 | 13 | |
| ICU stay | <0.001 | |||
| Yes | 13 | 12 | 12 | |
| No | 87 | 88 | 88 | |
| Length of stay, d | <0.001 | |||
| Median (Q1, Q3) | 4 (3, 6) | 4 (2, 6) | 3 (2, 5) | |
| DRG | <0.001 | |||
| Septicemia or severe sepsis | 3 | 4 | 4 | |
| Esophagitis, gastroenteritis | 3 | 3 | 3 | |
| Kidney and urinary tract infections | 3 | 3 | 3 | |
| Syncope | 3 | 3 | 3 | |
| Pneumonia | 3 | 3 | 3 | |
When we examined unadjusted relationships between type of hospital and patient experience, we found that patients at hospitalist vs non‐hospitalist hospitals were more likely to recommend the hospital (69.4% vs 65.1%: P < 0.001), and report higher overall satisfaction (65.9% vs 63.6%: P < 0.001) ((see Supporting Information, Appendix, Table A1, in the online version of this article)). Care at hospitalist hospitals was associated with higher satisfaction with discharge, but lower satisfaction with room cleanliness and communication with doctors. These differences were statistically significant at the P < 0.05 level.
When we examined the relationship between having more hospitalists and patient experience using multivariable models that accounted for differences in hospital characteristics, we found largely similar results: The proportion of patients who were satisfied with their overall care was still higher at hospitalist compared with non‐hospitalist hospitals (65.6% vs 63.9%: P < 0.001) (Figure 2). Similarly, patients were more likely to definitely recommend their hospital if they had been cared for at a hospitalist vs non‐hospitalist hospital (66.0% vs 63.4%: P < 0.001).
To better understand which domains of care might be contributing to greater overall satisfaction, we also examined patient satisfaction with specific domains of care at hospitalist vs non‐hospitalist hospitals (Table 3) in our adjusted analyses. Among 8 domains, the largest difference in satisfaction between patients cared for at hospitalist vs non‐hospitalist hospitals occurred with discharge. At hospitalist hospitals, 80.3% of patients said they were satisfied with the quality of the discharge planning compared with 78.1% at non‐hospitalist hospitals (P < 0.001). Patients at hospitalist hospitals were more satisfied with most other domains of care as well. Patients cared for at hospitalist hospitals were slightly less likely to be satisfied with communication with doctors, but this difference was not statistically significant (P = 0.45). Results were qualitatively similar in propensity‐score analyses (see Supporting Information, Appendix, Table A2, in the online version of this article).
| Specific Domains of Care | Hospital Type, % Satisfied | Hospitalist vs Non‐Hospitalist | |||
|---|---|---|---|---|---|
| Non‐Hospitalist | Mixed | Hospitalist | Difference in % Satisfied | P Value | |
| |||||
| Discharge | 78.1 | 79.1 | 80.3 | 2.1 | <0.001 |
| Nursing services | 66.0 | 65.8 | 67.1 | 1.1 | <0.001 |
| Quiet | 63.3 | 63.1 | 64.4 | 1.1 | 0.001 |
| Communication, nurse | 76.7 | 76.7 | 77.7 | 1.0 | <0.001 |
| Pain control | 69.7 | 69.7 | 70.4 | 0.7 | 0.001 |
| Medications | 60.5 | 60.5 | 61.2 | 0.7 | 0.002 |
| Cleanliness | 72.7 | 72.1 | 72.9 | 0.2 | 0.56 |
| Communication, physician | 83.6 | 83.1 | 83.5 | 0.2 | 0.45 |
DISCUSSION
We found that in 2009, US hospitals varied widely in the proportion of general medicine patients cared for by hospitalists. Hospitals with higher levels of hospitalist care did better on most measures of patient satisfaction. Differences were largest in overall satisfaction and for discharge planning. In 5 other domains of care, differences were smaller, but hospitals with more hospitalist care consistently performed better than non‐hospitalist hospitals. Hospitalist care was not associated with patient satisfaction in 2 domains: communication with doctors and cleanliness of room.
Our findings of modestly higher patient satisfaction at hospitalist hospitals along most dimensions of care are surprising and reassuring. Indeed, when hospitalists first began caring for inpatients, some expressed concerns that hospitalist care would decrease patient satisfaction.[8, 9] Though this has been an ongoing concern, we found no evidence to support this contention. It may be that as a response to the concern, hospitals with hospitalists have paid particular attention to issues such as effective handoffs to primary‐care providers.[10, 11, 12, 13] Whether due to these efforts or other factors such as the 24/7 inpatient presence of hospitalists, we found that patients at hospitalist hospitals were more likely to be satisfied with their inpatient care, including their experience at discharge. In contrast, one area that may offer room for improvement for hospitalist hospitals is communication with physicians. It may be that patients cared for by hospitalists do not know their physicians as well as patients whose care is being orchestrated by their primary‐care provider, and thus the benefits of having an ever‐present hospitalist are diminished.
The magnitude of the associations that we found should also be placed in the context of existing research on patient satisfaction. Prior work has described baseline hospital performance, changes over time, and factors associated with greater inpatient satisfaction.[5, 14, 15] The associations that we found between hospitalist care and satisfaction with care at discharge were larger than those found for teaching (vs non‐teaching) hospitals.[5] However, compared with other hospital characteristics such as nurse staffing or profit status, hospitalist care was associated with smaller differences in patient satisfaction. In one study, hospitals in the highest quartile of nurse staffing had HCAHPS scores (ie, willingness to recommend measure) that were 6.7 points higher than those in the lowest quartile of nurse staffing, and similar differences existed between not‐for‐profit, public hospitals vs for‐profit hospitals.[5]
Taken together, our findings address an important gap in knowledge about hospitalist care. Prior research has documented growth in the use of hospitalist care[1] and described the association of hospitalist care with outcomes such as mortality and resource use, and receipt of recommended care.[16, 17, 18, 19] However, we are unaware of any national study that has examined the association of hospitalist care with patient satisfaction. One study surveyed patients in a single health system and found that patients were similarly satisfied with care provided by hospitalists and primary‐care physicians.[20] Our findings should be reassuring to clinical leaders and policymakers who have advocated greater use of hospitalists: the results suggest that there need be no tradeoff between greater use of hospitalist services and patient satisfaction. Indeed, patients appear to be even more satisfied in hospitals that have greater use of hospitalist physicians.
Our study has several limitations. First, it was a cross‐sectional study, and thus we cannot make any conclusions about causality. Although we adjusted for several potential confounders (eg, teaching status, advanced care capabilities, nurse staffing), it is possible that hospitalist care is a surrogate marker for features of hospitals that we could not measure but that directly influence patient experience. In addition, it is possible that patients cared for at hospitalist hospitals differ in unmeasured ways from patients cared for at other types of hospitals. Second, we constructed our primary predictor and outcome from different cohorts. Our primary predictor was derived from the proportion of general‐medicine patients cared for by hospitalists in Medicare claims data. In contrast, our primary outcome was based on HCAHPS responses from a random sampling of all hospital admissions. This misclassification likely would have biased us towards finding small or no associations. Therefore, we are likely underestimating the true association between hospitalist use and patient experience. Third, our findings may not be generalizable to hospitals that serve younger patients or have a large number of specialist hospitalists (who were not included in our definition of hospitalists). For example, compared with older patients with multiple comorbidities, relatively healthy younger patients may derive less benefit from an ever‐present hospitalist who can explain discharge plans or an attentive nurse.
In summary, we found that US hospitals varied widely in their use of hospitalist physicians, and those which a greater proportion of care was delivered by hospitalists generally had better scores on patient experience, especially on the global assessment of satisfaction and in discharge care. Our findings suggest that adoption of the hospitalist modelone of the strategies employed by US hospitals in the past 2 decades to provide efficient careshould not detract from achieving the goal of more patient‐centered care.
Disclosures
Dr. Chen's work is supported in part by the National Institutes of Health/National Institute on Aging (AG024824, University of Michigan Claude D. Pepper Older Americans Independence Center), and the National Institutes of Health/National Center for Research Resources (UL1‐RR024986, Michigan Institute for Clinical and Health Research). Dr. Chen is also supported by a Career Development Grant Award (K08HS020671) from the Agency for Healthcare Research and Quality.
- , , , . Growth in the care of older patients by hospitalists in the United States. N Engl J Med. 2009;360(11):1102–1112.
- , , . How do patients view the role of the primary care physician in inpatient care? Dis Mon. 2002;48(4):230–238.
- , , , et al. Effects of survey mode, patient mix, and nonresponse on CAHPS hospital survey scores. Health Serv Res. 2009;44(2 pt 1):501–518.
- , , , , . Development, implementation, and public reporting of the HCAHPS survey. Med Care Res Rev. 2010;67(1):27–37.
- , , , . Patients' perception of hospital care in the United States. N Engl J Med. 2008;359(18):1921–1931.
- Agency for Healthcare Research and Quality. Healthcare Cost and Utilization Project (HCUP). HCUP Comorbidity Software. http://www.hcup‐us.ahrq.gov/toolssoftware/comorbidity/comorbidity.jsp Accessed November 12, 2012.
- , , , . Comorbidity measures for use with administrative data. Med Care. 1998;36(1):8–27.
- , , . Physician views on caring for hospitalized patients and the hospitalist model of inpatient care. J Gen Intern Med. 2001;16(2):116–119.
- , , , . How physicians perceive hospitalist services after implementation: anticipation vs reality. Arch Intern Med. 2003;163(19):2330–2336.
- , , , et al. Association of communication between hospital‐based physicians and primary care providers with patient outcomes. J Gen Intern Med. 2009;24(3):381–386.
- , , . Passing the clinical baton: 6 principles to guide the hospitalist. Dis Mon. 2002;48(4):260–266.
- , , , . Primary care physician attitudes regarding communication with hospitalists. Am J Med. 2001;111(9B):15S–20S.
- , , , et al. Transitions of Care Consensus policy statement: American College of Physicians, Society of General Internal Medicine, Society of Hospital Medicine, American Geriatrics Society, American College Of Emergency Physicians, and Society for Academic Emergency Medicine. J Hosp Med. 2009;4(6):364–370.
- , , , et al. Hospital survey shows improvements in patient experience. Health Aff (Millwood). 2010;29(11):2061–2067.
- , , , , , . Characteristics of hospitals demonstrating superior performance in patient experience and clinical process measures of care. Med Care Res Rev. 2010;67(1):38–55.
- , . The impact of hospitalists on the cost and quality of inpatient care in the United States: a research synthesis. Med Care Res Rev. 2005;62(4):379–406.
- , , , , . Quality of care for patients hospitalized with heart failure: assessing the impact of hospitalists. Arch Intern Med. 2002;162(11):1251–1256.
- , , , , . Hospitalists and the quality of care in hospitals. Arch Intern Med. 2009;169(15):1389–1394.
- , , , et al. Quality of care for decompensated heart failure: comparable performance between academic hospitalists and non‐hospitalists. J Gen Intern Med. 2008;23(9):1399–1406.
- , , , et al. Patient satisfaction with hospital care provided by hospitalists and primary care physicians. J Hosp Med. 2012;7(2):131–136.
Copyright © 2012 Society of Hospital Medicine
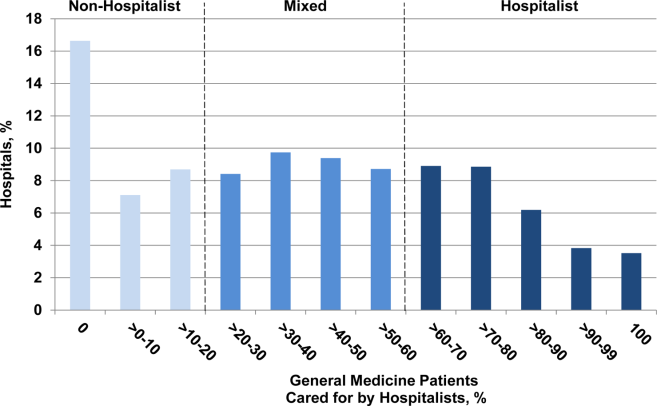