User login
Follow-Up Appointments Essential for Heart Failure Patients
When heart-failure patients have follow-up appointments with their outpatient doctors, outcomes are good, Dr. Fonarow says. However, they are not done nearly enough.
“Early follow-up is essential,” he says. “Follow-up within seven days—in higher-risk patients, even earlier, within three days—is something that has been associated with a lower risk of rehospitalization.”
Despite the research, only about 30% to 40% of patients hospitalized with heart failure are seen by any outpatient provider in the first week post-discharge.
“We have a real opportunity there,” Dr. Fonarow says. “The inpatient physicians can play a really critical role in ensuring that there’s early and appropriate follow-up, and good communication and handoff to the outpatient physician.”
Managing the Customer Care Experience in Hospital Care

I needed an oil change, so I took my car to Jiffy Lube. I had just pulled into the entrance to one of the service bays when a smiling man whose nametag read “Tony” approached me. “Welcome back, Mr. Wellikson. What can we help you with today?” Well, that was nice and so unexpected, as I had not remembered ever going to that Jiffy Lube. As it turns out, they have a video camera that shows incoming cars in their control room. They can read my license plate and call up my car on their computer system, access my record, and create a personal greeting. They also used my car’s past history as a starting point for this encounter. We were off to a good start.
Once I indicated I just wanted a routine oil change, Tony indicated he would be back in five to 10 minutes. He told me I should wait in the waiting room where they had wireless Internet, TV, magazines, and comfortable chairs.
In less than 10 minutes, Tony was back, clipboard in hand, with an assessment of my car’s status, including previous work and manufacturer’s recommendations, based on my car’s age and mileage. Once we negotiated not replacing all of the fluids and filters, Tony smiled and said the work should be completed in 10 minutes.
Soon, Tony came back to lead me out to my car, which had been wheeled out to the front of the garage bay with an open driver’s door waiting for me. After helping me into my seat, Tony came around and sat in the passenger seat and, once again with his ready clipboard, walked me through the 29 steps of inspections and fluid changes that had been made on my visit, reviewed the frequency of future needs for my vehicle, put a sticker on my inside windshield as a reminder, included $5 off for my next service, then patiently asked me if I had any questions.
Total time at Jiffy Lube: less than 30 minutes. Total cost: $29.99. Total customer experience: exceptional. Considering it was the third Jiffy Lube location I had used in the past three years, I can tell you the experience and system is the same throughout the company, whether the uniform name is Tony or Jose or Gladys.
Can such experiences offer hospitalists lessons about how we manage the customer experience in hospital care?
Scalable Innovation
In August 2012, Atul Gawande, MD, wrote a thought-provoking article in The New Yorker in which he coupled his detailed observation of how the restaurant chain The Cheesecake Factory manages to deliver 8 million meals annually nationwide with high quality at a reasonable cost and strong corporate profits with the emerging trend of healthcare delivery innovations being sought by large hospital chains and such innovations as ICU telemedicine.1
He noted that, according to the Bureau of Labor Statistics, less than 25% of physicians are currently self-employed, and the growing trend is hospitals being acquired or merged into larger and larger hospital chains. He observed that recent and future financial changes are moving toward payment for results and efficiencies and further away from just rewarding transactions and supplying services, whether of measureable value or with proven results. Cheesecake Factory has built its success on large-scale production-line processes that produce consistent results across hundreds of locations and millions of meals. It may now be time for healthcare, especially hospital care, to come into the 21st century, too.
How did Cheesecake Factory get to where they are? They studied what the best people were doing, figured out a way to standardize it, then looked for ways to bring it to everyone. Although we could look at research as medicine’s way of bringing new concepts forward, where we have fallen down as an industry and culture is our ability to deliver on this at the bedside. Why aren’t most myocardial infarction patients on beta-blockers? Why isn’t DVT prophylaxis universal? Why can’t we all wash our hands on a regular basis?
Medical care, especially the physician portion, has always placed an overwhelming bias on autonomy. We all know that even at the same hospital or within the same physician group of cardiologists or orthopedists (or even hospitalists) that there can be multiple ways to treat chest pain, replace a joint, or manage pneumonia. Dr. Gawande postulates that “customization should be 5%, not 95%, of what we do.” He is not suggesting cookbook medicine—rather, that we bring all of the current proven and consensus medical knowledge together and allow local professionals to agree to narrow their choices down to a consistent and reproducible process for managing care.
Hoag, a health network near my home in Orange County, Calif., has brought this approach to orthopedic care. Hoag purchased a smaller hospital near its main campus and is emphasizing state-of-the-art orthopedic care at the new facility. They aligned the incentives—clinically and financially—with a large but select group of orthopedists, and they have chosen just a few prosthetic choices for hip and knee replacements. They have narrowed their protocols for pre- and post-op care, and now do same-day joint replacements with lower complication rates and better return-to-activity results at lower costs. And trust me, the orthopedists at Hoag were as independent as any physicians you might run into. The demands of the new payor models and competition to provide consumers (i.e. patients) with a 21st-century experience pushed, pulled, and prodded these orthopedists, and an enlightened hospital leadership, to rise to the challenges.
HM Takeaway
So where do hospitalists fit into this emerging world of customer service, standardization, accountability for results, and payment change? As you might imagine, we are right in the middle of all of this. High-functioning HM groups have understood that we must help shape a better system for us to work in. We cannot perpetuate the old paradigm in which the hospital was simply a swap meet where each physician had a booth and performed a procedure with little regard to how efficient or effective the entire enterprise might be.
Hospitalists have always performed in a group setting and worked across the professional disciplines of medicine, surgery, and subspecialties, and with nurses, pharmacists, and therapists. In the best of breed, hospitalists are enculturated to think systemwide yet deliver to an individual patient.
As hospital chains look to standardize and deliver the best results and the most efficient use of resources, hospitalists can be positioned in a variety of ways. You can be an innovative partner, working with other professionals and the administration to seek new ways of doing things. You can be the manager or coordinator of other professionals and the rest of the team. But you also could evolve to be line workers and cogs in a larger machine, replaceable and commoditized. In the end, hospitalists will not only need to create value, but also position themselves to be professionally rewarded and respected for the value they create.
Dr. Gawande considers the perspectives of healthcare providers and patients as he looks to the future. “Patients won’t just look for the best specialist anymore; they’ll look for the best system,” he says. “Nurses and doctors will have to get used to delivering care in which our own convenience counts for less and the patients’ experience counts for more.”
The changes ahead will be rapid and disruptive; some hospitals will be driven out of business, while some will be consolidated. Physicians will aggregate and become employees (although many will still think they are free agents). Standardization will be pushed, and customization and one-offs will be tolerated less and less.
In this new world, hospitalists have the opportunity to be at the leading edge, not just for other physicians but the entire healthcare team. We need to prepare for this challenge, not just with clinical skills, but with a culture and a mindset to adapt and evolve. We need to decide if we will be cogs in a machine or the innovators and managers of change. The time is now; the choice is ours.
Dr. Wellikson is CEO of SHM.
Reference
Navigating Rapid Changes in Healthcare Made Easy

This is a tumultuous time in healthcare: regulatory burdens, payment reductions, public scrutiny. And the rapidity of change is mind-boggling. All of this would probably be fine, except that people generally resist change, especially rapid change. Here today, gone tomorrow. That usually does not go over very well.
But given that this is the state of affairs for the foreseeable future, the question is, why is change so hard, and what can we do make it easier?
I thought about this at church the other day. My family and I attend church weekly (except when we don’t) at a small, old, quaint Catholic church built in 1789. My husband and I were raised Catholic, but as you may know, not every Catholic is really a Catholic. Based on my childhood churchgoing routine, my family would best be described as “Creasters,” which are “Catholics” (in quotations on purpose) who dedicate most of their religious energy to showing up only on Christmas and Easter. We are also known as “diet Catholics” or “lite Catholics.” Although I can plow through the “Our Father” with ease and grace, the Lord’s Prayer usually results in some mumbling, hushed tones and ceiling-staring.
My husband, on the other hand, was raised a real Catholic. He went to Catholic grade school, received communion six days a week, routinely served as an altar boy, and only missed Sunday Mass for a fever of more than 101 degrees (and even that was a stretch). For years, I have looked to him for cues on when to sit, stand, kneel, talk, sing, and be silent. When Sunday school questions come to the dinner table by way of our 8-year-old, I generally feign a choking episode and defer to my husband.
So this has been our routine for more than a decade: he the leader and I the limper. But then something shocking happened several months ago. In the middle of Mass, I realized my husband had no idea what was going on. He fumbled awkwardly through the service, lowered his speech volume with each passing misstep, and was almost completely silent by the end of the service.
As it ends up, every couple of hundred years, the Catholic Church decides to shake things up and change the Mass around. During key repeatings, the words are now different. What used to be “and also with you” is now “and with your spirit.” These changes were not monumental and went relatively unnoticed by current or former Creasters, but they were mind-boggling for the real Catholics.
The Church must have anticipated that these changes would be difficult to assimilate, as they placed countless numbers of laminated cue cards all over the church, in every pew, the confessional stand, and at all entry and exit points. Undoubtedly, they were hoping (assuming) we would take them home and learn the changes on our own, outside of Mass. So some months passed by, and after a few weeks with a cue card, I was in pretty good shape. My brain rewired the sayings, and I was able to shed my cue-card crutch.
My husband, on the other hand, is still reaching for the cue cards, with a long-standing dependence that now resembles that of an addict. Occasionally feeling confident, he will lay the card down, and will start spewing out the old sayings from a short circuit in the amygdala, programmed in fifth grade and hard-wired for accuracy. Then he will regain consciousness and realize everyone is staring at him.
As hospitalists, we know how hard it is to change, but we also know we have to routinely change to keep pace with the industry. So how do we reconcile the differences?
I recently read the book “Switch,” which describes some techniques on how to change when change is hard.1 The authors write about a rider, an elephant, and a path. If all three are aligned toward a change, it will most likely succeed; without all three, change will be very difficult or unsuccessful altogether.
The rider is the intellectual portion, which will find the rational, statistical, logical solution to get from point A to point B. But the rider is steering an elephant, which is bulky, unruly, and emotional. The rider has to figure out how to motivate and direct the elephant; the two of them then have to get down a common path, which could be winding, confusing, and full of roadblocks. So to overcome all of these, the book gives innumerable, tangible examples of how to maneuver all three of these to facilitate change. In the case of my husband’s Mass issue, a few things could have facilitated the change for many:
Direct the rider:
- Find the bright spots. Find a success story of how others quickly relearned Mass within weeks and see how they accomplished it.
- Script the critical moves. Be very precise about what needs to be done differently; don’t just tell people to “learn the Mass,” but instead tell them to “repeat three new lines every day in the shower” until they have an error-free Mass.
- Point to the destination. Be very specific about the future goal, such as “You will be cue-card-free by October.”
Motivate the elephant:
- Find the feeling. Find a “heavy” emotion that will motivate the change. Shame, embarrassment, or anger from being stared at by a 10-year-old after missing so many lines should be pretty effective.
- Shrink the change. Make it seem like all the lines are easy to learn, if learned only one at a time.
- Grow the person. Motivate the Catholic to learn it as quickly and seamlessly as they did in fifth grade; if you already did it once, you just have do it again!
Shape the path:
- Tweak the environment. Have cue cards all over the place, laminate them, make them easy to fit in a pocket or purse.
- Build habits. Have the Catholic go to church every week until they have an “error-free” Mass.
- Rally the herd. Have them watch others for cues on behavior; this has worked for me for decades!
You can see that many of these techniques should be easier in healthcare than in other industries, especially motivating the elephant and shaping the path. To facilitate change, hospitalists should find ways to direct the rider, motivate the elephant, and shape the path, and we may find that change is not as daunting and overwhelming as it might at first seem.
And when you finally do make a positive change happen, give yourself a high-five—and send a “Hail Mary” to the Creasters.
Dr. Scheurer is physician editor of The Hospitalist.
Reference
The New Doctor's Office
The doctor’s office, at least my office, has changed over the last few decades with an increase in personnel added to make my life easier. Much of it has occurred as a response to the increased billing and authentication process that is required for reimbursement.
After all, when doctors were paid in cash or with a dozen eggs, there was little need for all the paperwork. Health insurance, both private and federal, has been the cause of much of this. At the same time, medical assistants, registered nurses, and a variety of ancillary staff have been added to make the patient’s visit smoother and to acquire the requisite information to satiate the vast network of communications that are generated with each office visit. All of these personnel are now an undisputable requirement for the function of today’s medical office.
In the process, the distance between the physician and the patient has increased. In many offices today, the patient may never see the doctor during the visit. To an increasing extent, the office contact with the patient is solely by an RN or physician assistant. In most cases, patients are satisfied with the service and are delighted not to spend a long time waiting to see the "doctor." Many of the visits are check-ups or annual or semiannual visits without any associated symptoms that can often be dealt with by a sympathetic and knowledgeable nurse. The patient is the winner to a great extent in this process by acquiring a sensitive ear and an expeditious visit. What is lost is the continued relationship of the patients and their physician. The biggest loss, I would suggest, is the doctor’s satisfaction of providing medical care that comes with every patient encounter, which keeps many of us energized to keep practicing medicine.
Now we have a new vision of how the primary care office of the future will function as a medical home (N. Engl. J. Med. 2012;367:891-3). In this vision, the physicians will be energized by a global payment system that will create an environment in which the doctor’s role is to pass real responsibility to their ancillary staff for which they would be held accountable. According to the authors, the physician’s office will be committed to promoting a healthy environment rather than merely treating disease. Why bother with the simple issue of treating sick patients when you can take on the entire environment of your community to prevent disease?
The authors go on to state that the physician would not waste time focusing on the "10% premature mortality that is influenced by medical treatment." In this work environment, the physician would be the team manager of a host of ancillary personnel, including medical assistants, RNs, social workers, nutritionists, and pharmacists, to name but a few. The physician would be energized by his or her role as a team leader. The physician, the authors explain, would see fewer patients and would not be caught running from room to room to see patients. Instead, he or she will become involved with care of the "community and understanding the upstream determinants of downstream sickness" and would spend there time in the community "advocating for the local farmer’s market to accept food stamps, organizing walking clubs for physical exercise, and lobbying ... to reduce emissions to improve air quality."
This, of course, is a far cry from the doctors who negotiated the care for their patient for a dozen eggs. It is clearly a role that is foreign to my generation. To some extent, though, patients may well gain in this futuristic environment. They will acquire an empathetic nurse who will be sensitive to their needs and who may be as good as a crotchety overworked doctor. All of the ancillary medical staff will gain a larger and more responsible role in the medical home. The physicians will morph into a new role that is more characteristic of an administrator and less as a practitioner. The doctors, however, will be the biggest losers as they disengage from the patient contact and care that is so crucial to the satisfaction of being a doctor.
Dr. Goldstein, medical editor of Cardiology News, is a professor of medicine at Wayne State University and division head emeritus of cardiovascular medicine at Henry Ford Hospital, both in Detroit. He is on data safety monitoring committees for the National Institutes of Health and several pharmaceutical companies.
Lip Rejuvenation Using Dermal Fillers
Dr. Rossi discusses dermal fillers for a natural approach to lip augmentation. For more information, read Dr. Rossi's article in the June 2012 issue, "Soft Tissue Augmentation With Dermal Fillers, Part 1: Lips and Lower Face."

Dr. Rossi discusses dermal fillers for a natural approach to lip augmentation. For more information, read Dr. Rossi's article in the June 2012 issue, "Soft Tissue Augmentation With Dermal Fillers, Part 1: Lips and Lower Face."
Dr. Rossi discusses dermal fillers for a natural approach to lip augmentation. For more information, read Dr. Rossi's article in the June 2012 issue, "Soft Tissue Augmentation With Dermal Fillers, Part 1: Lips and Lower Face."

Hypertensive chronic kidney disease in African Americans: Strategies for improving care
“Healthy citizens are the greatest asset any country can have.”
—Winston Churchill
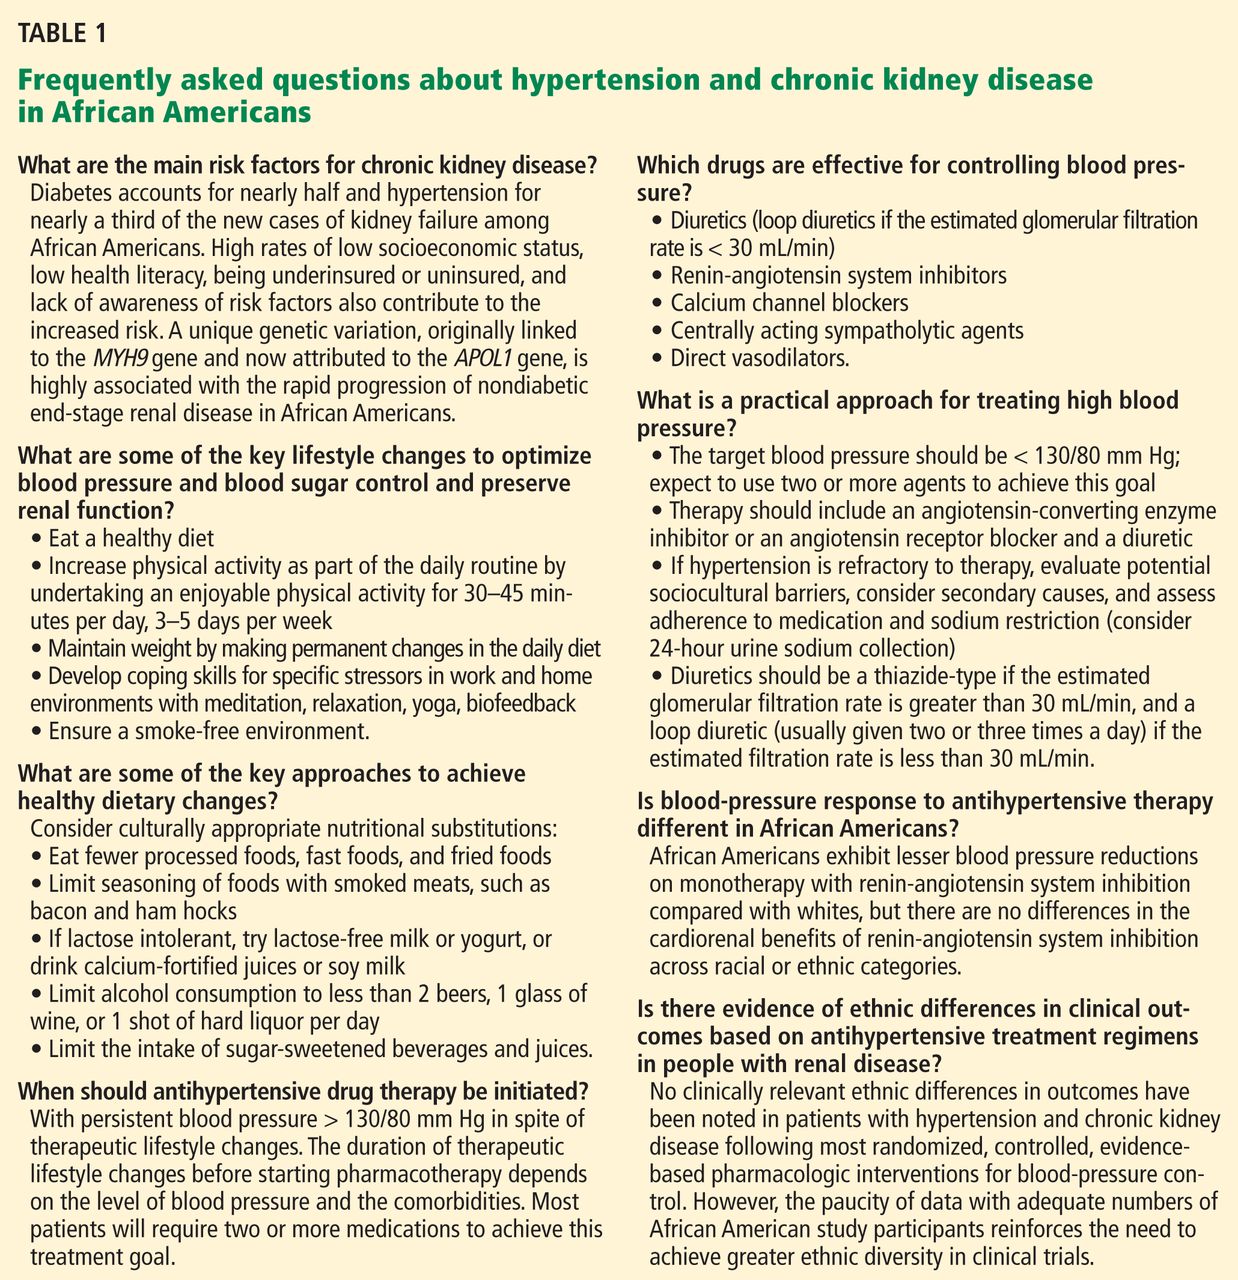
Diabetes and high blood pressure take a toll on the kidneys, especially in African Americans. To prevent chronic kidney disease (CKD) and to slow or stop its progression, the same principles apply in African Americans as in other patients—ie, vigilance for the onset of proteinuria, aggressive control of blood pressure, drug treatment to block the renin-angiotensin system, and attention to lifestyle factors (Table 1). However, we need to try to do better in the care of African Americans.
The purpose of this article is to review recent evidence- and consensus-based recommendations and to present a practical approach for the evaluation and treatment of CKD in African Americans.
CKD DEFINED
In 2002, the National Kidney Foundation1 defined CKD as either:
- Kidney damage for 3 or more months, as defined by structural or functional abnormalities of the kidney, with or without a decreased glomerular filtration rate (GFR), manifested either by pathologic abnormalities or by markers of kidney damage, including abnormalities in the composition of the blood or urine (eg, proteinuria), or abnormalities in imaging tests; or
- A GFR less than 60 mL/min/1.73 m2 for 3 or more months, with or without kidney damage.
The definition divides CKD into five progressive stages according to the GFR:
- Stage 1 (kidney damage with normal or increased GFR): GFR ≥ 90 mL/min/1.73m2
- Stage 2 (kidney damage with mildly decreased GFR): GFR 60–89
- Stage 3 (moderately decreased GFR): GFR 30–59
- Stage 4 (severely decreased GFR): GFR 15–29
- Stage 5 (kidney failure): GFR < 15 or dialysis.
Because the definition includes markers of kidney damage such as albuminuria, it allows CKD to be detected in its earliest stages, when the estimated GFR might still be well within normal limits.
CKD APPEARS EARLIER, PROGRESSES FASTER IN AFRICAN AMERICANS
“Not everything that counts can be counted, and not everything that can be counted counts.”
—Albert Einstein
CKD with or without a sustained reduction in the estimated GFR affects about one in every nine American adults.2 Its course varies depending on the cause and also from patient to patient, even in those with the same cause of CKD.
In general, the prevalence of early CKD is comparable across racial and ethnic groups in the United States, but CKD progresses to end-stage renal disease far more rapidly in minority populations, with rates nearly four times higher in black Americans than in white Americans.3 Also, the onset of CKD is earlier in African Americans.
HYPERTENSION AND DIABETES AS REASONS FOR THE DISPARITIES
Part of the reason for these differences is that minority populations have higher rates of diabetes and hypertension, and these diseases tend to be more severe in these groups. Poverty, less access to health care, exposure to environmental toxins, and genetic variation may also contribute.4–7
Compared with whites, blacks have higher rates of diabetes and hypertension and earlier onset of these diseases, poorer control, and higher rates of complications such as CKD, stroke, and heart disease.8,9 The higher rate of hypertension and the lower rate of blood pressure control in African Americans with CKD may contribute to the more rapid progression of CKD to end-stage renal disease.
In the Chronic Renal Insufficiency Cohort, 10 a racially and ethnically diverse group of 3,612 adults with a broad spectrum of renal disease severity, 93% of African Americans had hypertension at baseline compared with 80% of whites. In addition, African Americans were 18% less likely to have their blood pressure controlled to 140/90 mm Hg (the rates of control were 76% vs 60%), and 28% were less likely to have it controlled to 130/80 mm Hg (56% vs 38%).10 These factors may partially explain the faster progression to end-stage renal disease in African Americans with CKD.
Despite the potential efficacy of strict control of serum glucose levels and blood pressure,11 the high rate of poor blood pressure control has contributed to the epidemic of diabetic nephropathy, especially among African Americans. Fortunately, hypertension control in the general population, while still not ideal, has improved from 27% in 1988–1994 to 50% in 2007–2008 and is now similar across racial and ethnic groups.12 This, hopefully, is a preface for improved hypertension-related outcomes for all Americans over the next decade.
OTHER REASONS FOR THE DISPARITIES
“There are no unnatural or supernatural phenomena, only a very large gap in our knowledge of what is natural.”
—Edgar Mitchell, Apollo 14 astronaut
Proteinuria
Proteinuria is another key cardiorenal risk factor prevalent in African Americans.
Knight et al,13 analyzing data from the Third National Health and Nutrition Examination Survey, found that people with high-normal blood pressure (systolic pressure 130–139 mm Hg or diastolic pressure 85–89 mm Hg) were twice as likely to have microalbuminuria (odds ratio 2.13, 95% confidence interval [CI] 1.51–3.01) compared with people with optimal blood pressure (systolic pressure < 120 mm Hg and diastolic pressure < 80 mm Hg). Compared with whites as the reference group, Mexican Americans had slightly but not statistically significantly higher odds of microalbuminuria (odds ratio 1.16; 95% CI 0.90–1.51), and African Americans had significantly higher odds (odds ratio 1.30; 95% CI 1.04–1.64).
The incidence of hypertension-related end-stage renal disease is nearly five times higher in African Americans than in whites, and the rate of hypertension-related end-stage renal disease is 15 times higher in African American men ages 24 to 44 than in whites of the same ages.3 The greater risk of proteinuria in African Americans at any given level of higher blood pressure is thought to contribute in part to these disparate rates.
The renin-angiotensin system
The renin-angiotensin system plays a role in modulating hypertension and mediating hypertension-related complications. Hypertensive African Americans are more likely than hypertensive whites to have low-renin, salt-sensitive hypertension. Therein lies a paradox.
Since the renin-angiotensin system promotes the progression of CKD, we would expect patients with low-renin hypertension to have a lower risk of hypertension-related endorgan damage than patients with high-renin hypertension. However, many African Americans (who as a group have high rates of sodium sensitivity and low plasma renin levels) experience more severe hypertension-related end-organ complications such as proteinuria and cardiorenal disease.14
A reason for this paradox may be that the circulating renin-angiotensin system is separate from the intrarenal one. Supporting this theory is the observation that up-regulation of the intrarenal renin-angiotensin system accompanies renal interstitial inflammation and oxidative stress in the kidneys and cardiovascular tissues of salt-sensitive rats fed a high-salt diet.15 In other experiments in salt-sensitive rats, renin-angiotensin system blockade reversed endothelial dysfunction, attenuated proteinuria, and reduced renal injury independent of blood pressure changes even though the animals had low circulating renin levels.16
These findings imply that drugs that block the renin-angiotensin system, ie, angiotensin-converting enzyme inhibitors and angiotensin receptor blockers, could still be a rational therapy for CKD patients with low-renin hypertension, particularly African Americans, in whom local up-regulation of the renin-angiotensin system in the kidney could exacerbate both diabetic and hypertensive CKD.17 Although these drugs may not lower blood pressure as much in low-renin hypertension as in high-renin hypertension, they may still afford the same cardiorenal protection.
Genetic factors
Variations in the MYH9 and APOL1 genes on chromosome 22 have recently been found in genome-wide admixture mapping studies and may explain as much as 70% of the differences in the rates of nondiabetic end-stage renal disease between white and black Americans.7,18,19 In addition, genetic variations may modulate differences in blood-pressure response to antihypertensive medications across racial and ethnic groups,20 complicating treatment recommendations and clinical outcomes in our increasingly diverse nation.
Comment. The pathophysiologic basis for the variability in the course of CKD is probably multifactorial and is still poorly understood. Nevertheless, we may be able to delay the progression of CKD and prevent its complications with specific therapeutic and life-style interventions.
Race and ethnicity are associated with sociocultural and biologic variations that influence the risk and progression of CKD. Understanding these factors for minority populations can help in targeting interventions to attenuate the disproportionately high rates of CKD progression and complications.
The pathophysiologic reason African Americans have a greater prevalence of end-stage renal disease and a more rapid progression of CKD is complex and probably involves the interplay of biological, behavioral, and environmental factors such as salt intake, stress levels, and exposure to heavy metals.21
TRIALS OF ANTIHYPERTENSIVE THERAPY IN AFRICAN AMERICANS WITH CKD
“If we knew what we were doing, it wouldn’t be called research.”
—Albert Einstein
Until recently, trials of antihypertensive therapy in patients with CKD did not include adequate numbers of African American participants, but the following clinical trials have added to our knowledge (Table 2).22–26
African American Study of Kidney Disease and Hypertension (AASK)
The African American Study of Kidney Disease and Hypertension (AASK),22,23 with 1,094 patients, was the largest prospective study of CKD to date designed to focus on African Americans.
AASK examined the effects of two levels of blood-pressure control:
- Standard, with a goal blood pressure of 135–140/85–90 mm Hg (mean arterial pressure 102–107 mm Hg)
- Intensive, with a goal of 120/80 mm Hg or less (mean arterial pressure ≤ 92 mm Hg).
In a two-by two factorial design, patients were also randomized to receive one of three antihypertensive drugs as initial therapy:
- The ACE inhibitor ramipril (Altace)
- The sustained-release beta-blocker metoprolol succinate (Toprol XL)
- The calcium channel blocker amlodipine (Norvasc).
To enter the study, patients had to be African American, have at least one diastolic pressure reading of 95 mm Hg or greater during the screening period, and have a measured GFR between 20 and 65 mL/min/1.83 m2. They could not have diabetes, substantial proteinuria (> 2.5 g/day), or other causes of CKD.22
AASK was distinct from many of the larger hypertension trials in which secondary analyses of outcomes in patients with CKD were performed in that it was implicit in the design that most, if not all, study participants had substantial GFR reduction and would need diuretic therapy.
At baseline, after blood pressure medications had been tapered to define eligibility and then reintroduced before randomization, 20.0% of the patients in the intensive blood pressure goal group had pressure lower than 140/90 mm Hg, and this increased to 78.9% by 14 months after randomization. In the standard goal group, the numbers were 21.5% at baseline but only 41.8% at 14 months.23 In spite of this difference, the rate of decline in GFR (the main clinical outcome measure) was the same in both groups.
However, the class of drug did make a difference. Secondary clinical outcomes, including the composite end point of development of end-stage renal disease, doubling of serum creatinine, or death, were less frequent in the ACE inhibitor group than in the beta-blocker and calcium channel blocker groups. As anticipated and consistent with real world practice, nearly 90% of all participants received concomitant diuretic therapy to achieve target blood pressure levels.
Comments. AASK showed that blood pressure can be controlled in African Americans who have CKD and that clinical cardiorenal outcomes can be improved by using an ACE inhibitor as initial therapy rather than a beta-blocker or calcium channel blocker, with diuretics and other agents added as needed.
AASK cohort phase
After completing the trial phase, patients were invited to enroll in a cohort phase in which the blood pressure target was less than 130/80 mm Hg. The combined follow-up period was 8.8 to 12.2 years.24
During the trial phase, the mean blood pressure was 130/78 mm Hg in the intensive group and 141/86 mm Hg in the standard group. During the cohort phase, the mean blood pressures were 131/78 mm Hg and 134/78 mm Hg, respectively, in these groups.
In both phases, there was no significant difference between groups in clinical outcomes (hazard ratio in the intensive-control group 0.91, P = .27). However, the groups differed when stratified by baseline level of proteinuria (P = .02 for the interaction), with a potential benefit of a blood pressure target lower than 130/80 mm Hg in patients with a protein-to-creatinine ratio of more than 0.22 (hazard ratio 0.73, P = .01).24
Comment. Given that many African Americans with hypertension and CKD have a protein-to-creatinine ratio of more than 0.22, these findings support a practical approach in clinical practice for a target blood pressure less than 130/80 mm Hg, using a first-line combination of a renin-angiotensin system inhibitor and a diuretic.
RENAAL study
The Reduction of Endpoints in NIDDM With the Angiotensin II Antagonist Losartan (RENAAL) study25 included 1,513 patients, of whom 15% were African American and 18% were Hispanic; all had type 2 diabetes mellitus and nephropathy. They were randomized to receive the angiotensin II receptor antagonist losartan (Cozaar) or placebo in addition to other antihypertensive drugs.
At 3.4 years, the blood pressure was about 141/74 mm Hg in both groups. A post hoc analysis found lower rates of albuminuria and end-stage renal disease in the group treated with losartan,25 with no racial or ethnic differences in its renoprotective effect.
Comments. While these findings support the recommendation of inhibiting the renin-angiotensin system for improving clinical outcomes in diabetic nephropathy in racial and ethnic minorities, the AASK study also proved a second important point. These patients required intense blood pressure management for several years in a clinical trial environment, which may be difficult to do in many clinical practice models.
To be cost-effective in today’s health care environment, such care will likely be limited to larger group practices or health care plans with large comprehensive covered populations. Payers and providers need to be willing to invest in intense early care in such high-risk subgroups with the understanding that they could recognize downstream gains from long-term improved outcomes. However, even in these settings, the ability to provide effective care to high-risk subgroups without generating significant financial losses remains a concern.
ALLHAT
The Antihypertensive and Lipid-Lowering Treatment to Prevent Heart Attack Trial (ALLHAT)26 enrolled more than 33,000 hypertensive patients at high risk, of whom 32% were black, 16% were Hispanic, and 36% had diabetes. Their mean serum creatinine level was 1 mg/dL. Follow-up was for up to 8 years. At year 5, the mean blood pressure was 135/75 mm Hg.
In a secondary analysis, patients were stratified by GFR:
- Normal (> 90 mL/min/1.73 m2; n = 8,126)
- Mild reduction (60–89 mL/min/1.73 m2; n = 18,109)
- Moderate-severe reduction (< 60 mL/min/1.73 m2; n = 5,662).
In all three groups, amlodipine, lisinopril (Zestril), and chlorthalidone were equivalent as initial monotherapy in reducing the rate of the composite end point of end-stage renal disease or 50% or greater decrement in GFR.
Comments. The combined AASK, RENAAL, and ALLHAT findings are consistent with the practical recommendation of a diuretic, renin-angiotensin system inhibitor, or both, as initial therapy for blood pressure control in African American patients who have CKD, with a target blood pressure of less than 130/80 mm Hg.
A COMPREHENSIVE APPROACH TO CHRONIC KIDNEY DISEASE CARE
“It is much more important to know what sort of a patient has a disease, than what sort of disease a patient has.”
—William Osler
Many of the risk factors for cardiovascular disease in African Americans are behavioral and modifiable. These include too much salt and fat in the diet, too little physical activity, excessive alcohol intake, and smoking.
Education is key, to identify and communicate the risk attributable to health beliefs and behaviors, particularly in patients with known cardiovascular disease, and to encourage the patient to be proactive in risk-reduction strategies (Table 1). However, effective communication depends on compassion and concern by the health care provider to engender a sense of trust.27 Other health care professionals such as dietitians, pharmacists, and social workers as well as family members can reinforce messages and improve communication with the patient to optimize outcomes.
The International Society on Hypertension in Blacks recommends a blood pressure target of less than 130/80 mm Hg in blacks with elevated blood pressure and target-organ damage. The authors suggest monotherapy with a diuretic or calcium channel blocker if the blood pressure is 10 mm Hg or less above target levels. When blood pressure is more than 15/10 mm Hg above target, two-drug therapy is recommended, either with a calcium channel blocker plus a renin-angiotensin system blocker or, alternatively, in edematous or volume-overload states, with a thiazide diuretic plus a renin-angiotensin system blocker.28,29
The Clinical Practice Guidelines on Hypertension and Antihypertensive Agents in Chronic Kidney Disease of the National Kidney Foundation’s Kidney Disease Outcomes Quality Initiative recommend starting anti-hypertensive therapy with an ACE inhibitor or an angiotensin receptor blocker for most patients with CKD, regardless of ethnicity, recognizing that many will require combination therapy.30 Evaluation of the response to therapy should include not only checking that the blood pressure is at or below the recommended target of 130/80 mm Hg, but also assessing for complications and monitoring the change in the level of proteinuria, which is a powerful predictor of progression of hypertensive kidney disease in all patients at any given GFR.31
OUR RECOMMENDATIONS
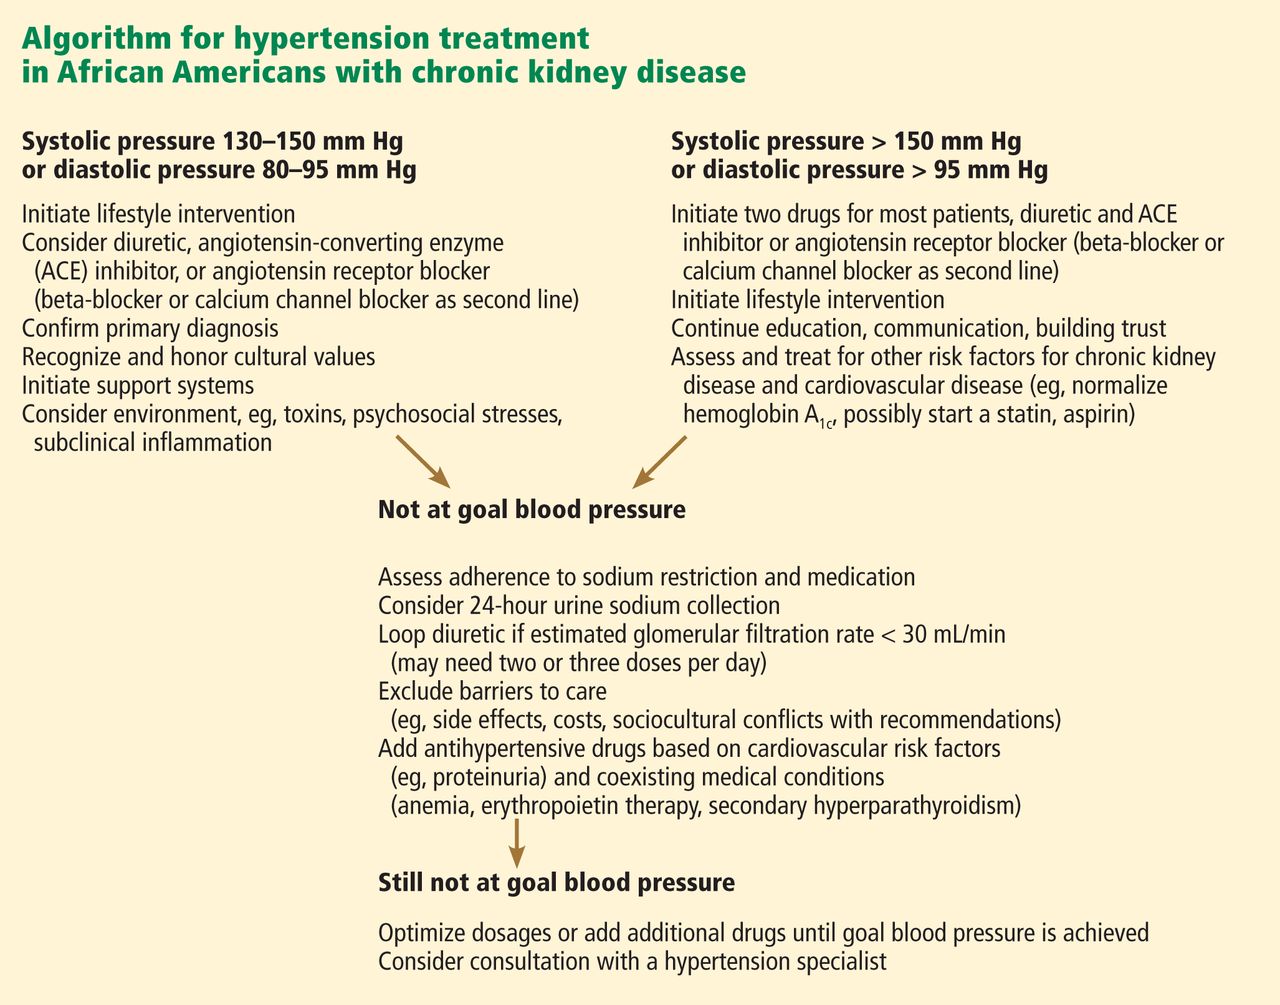
African Americans with hypertension and kidney disease require an aggressive and comprehensive approach to slow the progression of kidney disease and its complications, often necessitating aggressive care of the primary cause and the use of two or more antihypertensive agents to control blood pressure, proteinuria, or both (Figure 1).32
We recommend that the initial evaluation of patients with hypertension include a screening for albuminuria and that the initial therapy for hypertension or proteinuria in all patients with CKD include renin-angiotensin system inhibition with a diuretic, because this combination appears most effective to achieve blood pressure control and to confer additional cardiorenal protection beyond that offered by blood-pressure control alone. Although some studies have reported that African Americans have lower blood-pressure response rates than whites to renin-angiotensin system inhibition, 18 it is nevertheless beneficial for clinical outcomes in this group, especially in the presence of proteinuria, a hallmark of hypertension-related CKD in African Americans. Thus, until more data are available, ethnicity should not be the primary criterion for selecting a given class of antihypertensive therapy, especially in patients with hypertensive nephropathy.
The overall treatment decision should be guided by individual response, coexisting risk factors, and potential cultural and socioeconomic considerations such as cost of medications and insurance coverage, which affect adherence to both pharmacologic and nonpharmacologic interventions.33
Future studies should strive for adequate representation of racial and ethnic minority populations in order to enhance the evidence base for CKD treatment as we move toward using personalized medicine approaches in an increasingly diverse society.34
Acknowledgment: Support for this paper was provided in part by NIH grants RR026138 and MD000182.
- National Kidney Foundation. K/DOQI clinical practice guidelines for chronic kidney disease: evaluation, classification, and stratification. Am J Kidney Dis 2002; 39(suppl 1):S1–S266.
- Coresh J, Selvin E, Stevens LA, et al. Prevalence of chronic kidney disease in the United States. JAMA 2007; 298:2038–2047.
- US Renal Data System. USRDS 2010 Annual Data Report: Atlas of Chronic Kidney Disease and End-Stage Renal Disease in the United States. Bethesda, MD; National Institutes of Health, National Institute of Diabetes and Digestive and Kidney Diseases, 2010.
- Norris K, Nissenson AR. Race, gender, and socioeconomic disparities in CKD in the United States. J Am Soc Nephrol 2008; 19:1261–1270.
- Norris KC, Agodoa LY. Unraveling the racial disparities associated with kidney disease. Kidney Int 2005; 68:914–924.
- Powe NR. To have and have not: health and health care disparities in chronic kidney disease. Kidney Int 2003; 64:763–772.
- Genovese G, Friedman DJ, Ross MD, et al. Association of trypanolytic ApoL1 variants with kidney disease in African Americans. Science 2010; 329:841–845.
- Rosamond W, Flegal K, Furie K, et al; American Heart Association Statistics Committee and Stroke Statistics Subcommittee. Heart disease and stroke statistics—2008 update: a report from the American Heart Association Statistics Committee and Stroke Statistics Subcommittee. Circulation 2008; 117:e25–e146.
- Chobanian AV, Bakris GL, Black HR, et al; National Heart, Lung, and Blood Institute Joint National Committee on Prevention, Detection, Evaluation, and Treatment of High Blood Pressure. The Seventh Report of the Joint National Committee on Prevention, Detection, Evaluation, and Treatment of High Blood Pressure: the JNC 7 report. JAMA 2003; 289:2560–2572.
- Muntner P, Anderson A, Charleston J, et al; Chronic Renal Insufficiency Cohort (CRIC) Study Investigators. Hypertension awareness, treatment, and control in adults with CKD: results from the Chronic Renal Insufficiency Cohort (CRIC) Study. Am J Kidney Dis 2010; 55:441–451.
- Tight blood pressure control and risk of macrovascular and microvascular complications in type 2 diabetes: UKPDS 38. UK Prospective Diabetes Study Group. BMJ 1998; 317:703–713.
- Egan BM, Zhao Y, Axon RN. US trends in prevalence, awareness, treatment, and control of hypertension, 1988–2008. JAMA 2010; 303:2043–2050.
- Knight EL, Kramer HM, Curhan GC. High-normal blood pressure and microalbuminuria. Am J Kidney Dis 2003; 41:588–595.
- Luft FC, Grim CE, Fineberg N, Weinberger MC. Effects of volume expansion and contraction in normotensive whites, blacks, and subjects of different ages. Circulation 1979; 59:643–650.
- Chandramohan G, Bai Y, Norris K, Rodriguez-Iturbe B, Vaziri ND. Effects of dietary salt on intrarenal angiotensin system, NAD(P)H oxidase, COX-2, MCP-1 and PAI-1 expressions and NF-kappaB activity in salt-sensitive and -resistant rat kidneys. Am J Nephrol 2008; 28:158–167.
- Hayakawa H, Coffee K, Raij L. Endothelial dysfunction and cardiorenal injury in experimental salt-sensitive hypertension: effects of antihypertensive therapy. Circulation 1997; 96:2407–2413.
- Norris KC, Tareen N, Martins D, Vaziri ND. Implications of ethnicity for the treatment of hypertensive kidney disease, with an emphasis on African Americans. Nat Clin Pract Nephrol 2008; 4:538–549.
- Kao WH, Klag MJ, Meoni LA, et al; Family Investigation of Nephropathy and Diabetes Research Group. MYH9 is associated with nondiabetic end-stage renal disease in African Americans. Nat Genet 2008; 40:1185–1192.
- Freedman BI, Kopp JB, Langefeld CD, et al. The apolipoprotein L1 (APOL1) gene and nondiabetic nephropathy in African Americans. J Am Soc Nephrol 2010; 21:1422–1426.
- Materson BJ, Reda DJ, Cushman WC, et al. Single-drug therapy for hypertension in men. A comparison of six antihypertensive agents with placebo. The Department of Veterans Affairs Cooperative Study Group on Antihypertensive Agents. N Engl J Med 1993; 328:914–921. Erratum in N Engl J Med 1994; 330:1689.
- Norris KC, Francis CK. Gender and ethnic differences and considerations in cardiovascular risk assessment and prevention in African Americans. In:Wong N, Gardin JM, Black HR, editors. Practical Strategies in Preventing Heart Disease. New York, NY: McGraw-Hill; 2004:415–440.
- Wright JT, Bakris G, Greene T, et al; African American Study of Kidney Disease and Hypertension Study Group. Effect of blood pressure lowering and antihypertensive drug class on progression of hypertensive kidney disease: results from the AASK trial. JAMA 2002; 288:2421–2431. Erratum in JAMA 2006; 295:2726.
- Wright JT, Agodoa L, Contreras G, et al; African American Study of Kidney Disease and Hypertension Study Group. Successful blood pressure control in the African American Study of Kidney Disease and Hypertension. Arch Intern Med 2002; 162:1636–1643.
- Appel LJ, Wright JT, Greene T, et al; AASK Collaborative Research Group. Intensive blood-pressure control in hypertensive chronic kidney disease. N Engl J Med 2010; 363:918–929.
- de Zeeuw D, Ramjit D, Zhang Z, et al. Renal risk and renoprotection among ethnic groups with type 2 diabetic nephropathy: a post hoc analysis of RENAAL. Kidney Int 2006; 69:1675–1682.
- Rahman M, Pressel S, Davis BR, et al. Renal outcomes in high-risk hypertensive patients treated with an angiotensin-converting enzyme inhibitor or a calcium channel blocker vs a diuretic: a report from the Antihypertensive and Lipid-Lowering Treatment to Prevent Heart Attack Trial (ALLHAT). Arch Intern Med 2005; 165:936–946.
- Barrier PA, Li JT, Jensen NM. Two words to improve physician-patient communication: what else? Mayo Clin Proc 2003; 78:211–214.
- Flack JM, Sica DA, Bakris G, et al; International Society on Hypertension in Blacks. Management of high blood pressure in blacks: an update of the International Society on Hypertension in Blacks consensus statement. Hypertension 2010; 56:780–800.
- Wright JT, Agodoa LY, Appel L, et al. New recommendations for treating hypertension in black patients: evidence and/or consensus? Hypertension 2010; 56:801–803.
- National Kidney Foundation. K/DOQI Clinical Practice Guidelines on Hypertension and Antihypertensive Agents in Chronic Kidney Disease: executive summary. Am J Kid Dis 2004; 43(suppl 1):S16–S33.
- Lea J, Greene T, Hebert L, et al. The relationship between magnitude of proteinuria reduction and risk of end-stage renal disease: results of the African American study of kidney disease and hypertension. Arch Intern Med 2005; 165:947–953.
- Bakris GL, Williams M, Dworkin L, et al. Preserving renal function in adults with hypertension and diabetes: a consensus approach. National Kidney Foundation Hypertension and Diabetes Executive Committees Working Group. Am J Kidney Dis 2000; 36:646–661.
- Martins D, Norris K. Hypertension treatment in African Americans: physiology is less important than sociology. Cleve Clin J Med 2004; 71:735–743.
- Cooper RS, Psaty BM. Should ethnicity serve as the basis for clinical trial design? Diversity and inclusiveness should remain the guiding principles for clinical trials. Circulation 2005; 112:3660–3665.
“Healthy citizens are the greatest asset any country can have.”
—Winston Churchill
Diabetes and high blood pressure take a toll on the kidneys, especially in African Americans. To prevent chronic kidney disease (CKD) and to slow or stop its progression, the same principles apply in African Americans as in other patients—ie, vigilance for the onset of proteinuria, aggressive control of blood pressure, drug treatment to block the renin-angiotensin system, and attention to lifestyle factors (Table 1). However, we need to try to do better in the care of African Americans.
The purpose of this article is to review recent evidence- and consensus-based recommendations and to present a practical approach for the evaluation and treatment of CKD in African Americans.
CKD DEFINED
In 2002, the National Kidney Foundation1 defined CKD as either:
- Kidney damage for 3 or more months, as defined by structural or functional abnormalities of the kidney, with or without a decreased glomerular filtration rate (GFR), manifested either by pathologic abnormalities or by markers of kidney damage, including abnormalities in the composition of the blood or urine (eg, proteinuria), or abnormalities in imaging tests; or
- A GFR less than 60 mL/min/1.73 m2 for 3 or more months, with or without kidney damage.
The definition divides CKD into five progressive stages according to the GFR:
- Stage 1 (kidney damage with normal or increased GFR): GFR ≥ 90 mL/min/1.73m2
- Stage 2 (kidney damage with mildly decreased GFR): GFR 60–89
- Stage 3 (moderately decreased GFR): GFR 30–59
- Stage 4 (severely decreased GFR): GFR 15–29
- Stage 5 (kidney failure): GFR < 15 or dialysis.
Because the definition includes markers of kidney damage such as albuminuria, it allows CKD to be detected in its earliest stages, when the estimated GFR might still be well within normal limits.
CKD APPEARS EARLIER, PROGRESSES FASTER IN AFRICAN AMERICANS
“Not everything that counts can be counted, and not everything that can be counted counts.”
—Albert Einstein
CKD with or without a sustained reduction in the estimated GFR affects about one in every nine American adults.2 Its course varies depending on the cause and also from patient to patient, even in those with the same cause of CKD.
In general, the prevalence of early CKD is comparable across racial and ethnic groups in the United States, but CKD progresses to end-stage renal disease far more rapidly in minority populations, with rates nearly four times higher in black Americans than in white Americans.3 Also, the onset of CKD is earlier in African Americans.
HYPERTENSION AND DIABETES AS REASONS FOR THE DISPARITIES
Part of the reason for these differences is that minority populations have higher rates of diabetes and hypertension, and these diseases tend to be more severe in these groups. Poverty, less access to health care, exposure to environmental toxins, and genetic variation may also contribute.4–7
Compared with whites, blacks have higher rates of diabetes and hypertension and earlier onset of these diseases, poorer control, and higher rates of complications such as CKD, stroke, and heart disease.8,9 The higher rate of hypertension and the lower rate of blood pressure control in African Americans with CKD may contribute to the more rapid progression of CKD to end-stage renal disease.
In the Chronic Renal Insufficiency Cohort, 10 a racially and ethnically diverse group of 3,612 adults with a broad spectrum of renal disease severity, 93% of African Americans had hypertension at baseline compared with 80% of whites. In addition, African Americans were 18% less likely to have their blood pressure controlled to 140/90 mm Hg (the rates of control were 76% vs 60%), and 28% were less likely to have it controlled to 130/80 mm Hg (56% vs 38%).10 These factors may partially explain the faster progression to end-stage renal disease in African Americans with CKD.
Despite the potential efficacy of strict control of serum glucose levels and blood pressure,11 the high rate of poor blood pressure control has contributed to the epidemic of diabetic nephropathy, especially among African Americans. Fortunately, hypertension control in the general population, while still not ideal, has improved from 27% in 1988–1994 to 50% in 2007–2008 and is now similar across racial and ethnic groups.12 This, hopefully, is a preface for improved hypertension-related outcomes for all Americans over the next decade.
OTHER REASONS FOR THE DISPARITIES
“There are no unnatural or supernatural phenomena, only a very large gap in our knowledge of what is natural.”
—Edgar Mitchell, Apollo 14 astronaut
Proteinuria
Proteinuria is another key cardiorenal risk factor prevalent in African Americans.
Knight et al,13 analyzing data from the Third National Health and Nutrition Examination Survey, found that people with high-normal blood pressure (systolic pressure 130–139 mm Hg or diastolic pressure 85–89 mm Hg) were twice as likely to have microalbuminuria (odds ratio 2.13, 95% confidence interval [CI] 1.51–3.01) compared with people with optimal blood pressure (systolic pressure < 120 mm Hg and diastolic pressure < 80 mm Hg). Compared with whites as the reference group, Mexican Americans had slightly but not statistically significantly higher odds of microalbuminuria (odds ratio 1.16; 95% CI 0.90–1.51), and African Americans had significantly higher odds (odds ratio 1.30; 95% CI 1.04–1.64).
The incidence of hypertension-related end-stage renal disease is nearly five times higher in African Americans than in whites, and the rate of hypertension-related end-stage renal disease is 15 times higher in African American men ages 24 to 44 than in whites of the same ages.3 The greater risk of proteinuria in African Americans at any given level of higher blood pressure is thought to contribute in part to these disparate rates.
The renin-angiotensin system
The renin-angiotensin system plays a role in modulating hypertension and mediating hypertension-related complications. Hypertensive African Americans are more likely than hypertensive whites to have low-renin, salt-sensitive hypertension. Therein lies a paradox.
Since the renin-angiotensin system promotes the progression of CKD, we would expect patients with low-renin hypertension to have a lower risk of hypertension-related endorgan damage than patients with high-renin hypertension. However, many African Americans (who as a group have high rates of sodium sensitivity and low plasma renin levels) experience more severe hypertension-related end-organ complications such as proteinuria and cardiorenal disease.14
A reason for this paradox may be that the circulating renin-angiotensin system is separate from the intrarenal one. Supporting this theory is the observation that up-regulation of the intrarenal renin-angiotensin system accompanies renal interstitial inflammation and oxidative stress in the kidneys and cardiovascular tissues of salt-sensitive rats fed a high-salt diet.15 In other experiments in salt-sensitive rats, renin-angiotensin system blockade reversed endothelial dysfunction, attenuated proteinuria, and reduced renal injury independent of blood pressure changes even though the animals had low circulating renin levels.16
These findings imply that drugs that block the renin-angiotensin system, ie, angiotensin-converting enzyme inhibitors and angiotensin receptor blockers, could still be a rational therapy for CKD patients with low-renin hypertension, particularly African Americans, in whom local up-regulation of the renin-angiotensin system in the kidney could exacerbate both diabetic and hypertensive CKD.17 Although these drugs may not lower blood pressure as much in low-renin hypertension as in high-renin hypertension, they may still afford the same cardiorenal protection.
Genetic factors
Variations in the MYH9 and APOL1 genes on chromosome 22 have recently been found in genome-wide admixture mapping studies and may explain as much as 70% of the differences in the rates of nondiabetic end-stage renal disease between white and black Americans.7,18,19 In addition, genetic variations may modulate differences in blood-pressure response to antihypertensive medications across racial and ethnic groups,20 complicating treatment recommendations and clinical outcomes in our increasingly diverse nation.
Comment. The pathophysiologic basis for the variability in the course of CKD is probably multifactorial and is still poorly understood. Nevertheless, we may be able to delay the progression of CKD and prevent its complications with specific therapeutic and life-style interventions.
Race and ethnicity are associated with sociocultural and biologic variations that influence the risk and progression of CKD. Understanding these factors for minority populations can help in targeting interventions to attenuate the disproportionately high rates of CKD progression and complications.
The pathophysiologic reason African Americans have a greater prevalence of end-stage renal disease and a more rapid progression of CKD is complex and probably involves the interplay of biological, behavioral, and environmental factors such as salt intake, stress levels, and exposure to heavy metals.21
TRIALS OF ANTIHYPERTENSIVE THERAPY IN AFRICAN AMERICANS WITH CKD
“If we knew what we were doing, it wouldn’t be called research.”
—Albert Einstein
Until recently, trials of antihypertensive therapy in patients with CKD did not include adequate numbers of African American participants, but the following clinical trials have added to our knowledge (Table 2).22–26
African American Study of Kidney Disease and Hypertension (AASK)
The African American Study of Kidney Disease and Hypertension (AASK),22,23 with 1,094 patients, was the largest prospective study of CKD to date designed to focus on African Americans.
AASK examined the effects of two levels of blood-pressure control:
- Standard, with a goal blood pressure of 135–140/85–90 mm Hg (mean arterial pressure 102–107 mm Hg)
- Intensive, with a goal of 120/80 mm Hg or less (mean arterial pressure ≤ 92 mm Hg).
In a two-by two factorial design, patients were also randomized to receive one of three antihypertensive drugs as initial therapy:
- The ACE inhibitor ramipril (Altace)
- The sustained-release beta-blocker metoprolol succinate (Toprol XL)
- The calcium channel blocker amlodipine (Norvasc).
To enter the study, patients had to be African American, have at least one diastolic pressure reading of 95 mm Hg or greater during the screening period, and have a measured GFR between 20 and 65 mL/min/1.83 m2. They could not have diabetes, substantial proteinuria (> 2.5 g/day), or other causes of CKD.22
AASK was distinct from many of the larger hypertension trials in which secondary analyses of outcomes in patients with CKD were performed in that it was implicit in the design that most, if not all, study participants had substantial GFR reduction and would need diuretic therapy.
At baseline, after blood pressure medications had been tapered to define eligibility and then reintroduced before randomization, 20.0% of the patients in the intensive blood pressure goal group had pressure lower than 140/90 mm Hg, and this increased to 78.9% by 14 months after randomization. In the standard goal group, the numbers were 21.5% at baseline but only 41.8% at 14 months.23 In spite of this difference, the rate of decline in GFR (the main clinical outcome measure) was the same in both groups.
However, the class of drug did make a difference. Secondary clinical outcomes, including the composite end point of development of end-stage renal disease, doubling of serum creatinine, or death, were less frequent in the ACE inhibitor group than in the beta-blocker and calcium channel blocker groups. As anticipated and consistent with real world practice, nearly 90% of all participants received concomitant diuretic therapy to achieve target blood pressure levels.
Comments. AASK showed that blood pressure can be controlled in African Americans who have CKD and that clinical cardiorenal outcomes can be improved by using an ACE inhibitor as initial therapy rather than a beta-blocker or calcium channel blocker, with diuretics and other agents added as needed.
AASK cohort phase
After completing the trial phase, patients were invited to enroll in a cohort phase in which the blood pressure target was less than 130/80 mm Hg. The combined follow-up period was 8.8 to 12.2 years.24
During the trial phase, the mean blood pressure was 130/78 mm Hg in the intensive group and 141/86 mm Hg in the standard group. During the cohort phase, the mean blood pressures were 131/78 mm Hg and 134/78 mm Hg, respectively, in these groups.
In both phases, there was no significant difference between groups in clinical outcomes (hazard ratio in the intensive-control group 0.91, P = .27). However, the groups differed when stratified by baseline level of proteinuria (P = .02 for the interaction), with a potential benefit of a blood pressure target lower than 130/80 mm Hg in patients with a protein-to-creatinine ratio of more than 0.22 (hazard ratio 0.73, P = .01).24
Comment. Given that many African Americans with hypertension and CKD have a protein-to-creatinine ratio of more than 0.22, these findings support a practical approach in clinical practice for a target blood pressure less than 130/80 mm Hg, using a first-line combination of a renin-angiotensin system inhibitor and a diuretic.
RENAAL study
The Reduction of Endpoints in NIDDM With the Angiotensin II Antagonist Losartan (RENAAL) study25 included 1,513 patients, of whom 15% were African American and 18% were Hispanic; all had type 2 diabetes mellitus and nephropathy. They were randomized to receive the angiotensin II receptor antagonist losartan (Cozaar) or placebo in addition to other antihypertensive drugs.
At 3.4 years, the blood pressure was about 141/74 mm Hg in both groups. A post hoc analysis found lower rates of albuminuria and end-stage renal disease in the group treated with losartan,25 with no racial or ethnic differences in its renoprotective effect.
Comments. While these findings support the recommendation of inhibiting the renin-angiotensin system for improving clinical outcomes in diabetic nephropathy in racial and ethnic minorities, the AASK study also proved a second important point. These patients required intense blood pressure management for several years in a clinical trial environment, which may be difficult to do in many clinical practice models.
To be cost-effective in today’s health care environment, such care will likely be limited to larger group practices or health care plans with large comprehensive covered populations. Payers and providers need to be willing to invest in intense early care in such high-risk subgroups with the understanding that they could recognize downstream gains from long-term improved outcomes. However, even in these settings, the ability to provide effective care to high-risk subgroups without generating significant financial losses remains a concern.
ALLHAT
The Antihypertensive and Lipid-Lowering Treatment to Prevent Heart Attack Trial (ALLHAT)26 enrolled more than 33,000 hypertensive patients at high risk, of whom 32% were black, 16% were Hispanic, and 36% had diabetes. Their mean serum creatinine level was 1 mg/dL. Follow-up was for up to 8 years. At year 5, the mean blood pressure was 135/75 mm Hg.
In a secondary analysis, patients were stratified by GFR:
- Normal (> 90 mL/min/1.73 m2; n = 8,126)
- Mild reduction (60–89 mL/min/1.73 m2; n = 18,109)
- Moderate-severe reduction (< 60 mL/min/1.73 m2; n = 5,662).
In all three groups, amlodipine, lisinopril (Zestril), and chlorthalidone were equivalent as initial monotherapy in reducing the rate of the composite end point of end-stage renal disease or 50% or greater decrement in GFR.
Comments. The combined AASK, RENAAL, and ALLHAT findings are consistent with the practical recommendation of a diuretic, renin-angiotensin system inhibitor, or both, as initial therapy for blood pressure control in African American patients who have CKD, with a target blood pressure of less than 130/80 mm Hg.
A COMPREHENSIVE APPROACH TO CHRONIC KIDNEY DISEASE CARE
“It is much more important to know what sort of a patient has a disease, than what sort of disease a patient has.”
—William Osler
Many of the risk factors for cardiovascular disease in African Americans are behavioral and modifiable. These include too much salt and fat in the diet, too little physical activity, excessive alcohol intake, and smoking.
Education is key, to identify and communicate the risk attributable to health beliefs and behaviors, particularly in patients with known cardiovascular disease, and to encourage the patient to be proactive in risk-reduction strategies (Table 1). However, effective communication depends on compassion and concern by the health care provider to engender a sense of trust.27 Other health care professionals such as dietitians, pharmacists, and social workers as well as family members can reinforce messages and improve communication with the patient to optimize outcomes.
The International Society on Hypertension in Blacks recommends a blood pressure target of less than 130/80 mm Hg in blacks with elevated blood pressure and target-organ damage. The authors suggest monotherapy with a diuretic or calcium channel blocker if the blood pressure is 10 mm Hg or less above target levels. When blood pressure is more than 15/10 mm Hg above target, two-drug therapy is recommended, either with a calcium channel blocker plus a renin-angiotensin system blocker or, alternatively, in edematous or volume-overload states, with a thiazide diuretic plus a renin-angiotensin system blocker.28,29
The Clinical Practice Guidelines on Hypertension and Antihypertensive Agents in Chronic Kidney Disease of the National Kidney Foundation’s Kidney Disease Outcomes Quality Initiative recommend starting anti-hypertensive therapy with an ACE inhibitor or an angiotensin receptor blocker for most patients with CKD, regardless of ethnicity, recognizing that many will require combination therapy.30 Evaluation of the response to therapy should include not only checking that the blood pressure is at or below the recommended target of 130/80 mm Hg, but also assessing for complications and monitoring the change in the level of proteinuria, which is a powerful predictor of progression of hypertensive kidney disease in all patients at any given GFR.31
OUR RECOMMENDATIONS
African Americans with hypertension and kidney disease require an aggressive and comprehensive approach to slow the progression of kidney disease and its complications, often necessitating aggressive care of the primary cause and the use of two or more antihypertensive agents to control blood pressure, proteinuria, or both (Figure 1).32
We recommend that the initial evaluation of patients with hypertension include a screening for albuminuria and that the initial therapy for hypertension or proteinuria in all patients with CKD include renin-angiotensin system inhibition with a diuretic, because this combination appears most effective to achieve blood pressure control and to confer additional cardiorenal protection beyond that offered by blood-pressure control alone. Although some studies have reported that African Americans have lower blood-pressure response rates than whites to renin-angiotensin system inhibition, 18 it is nevertheless beneficial for clinical outcomes in this group, especially in the presence of proteinuria, a hallmark of hypertension-related CKD in African Americans. Thus, until more data are available, ethnicity should not be the primary criterion for selecting a given class of antihypertensive therapy, especially in patients with hypertensive nephropathy.
The overall treatment decision should be guided by individual response, coexisting risk factors, and potential cultural and socioeconomic considerations such as cost of medications and insurance coverage, which affect adherence to both pharmacologic and nonpharmacologic interventions.33
Future studies should strive for adequate representation of racial and ethnic minority populations in order to enhance the evidence base for CKD treatment as we move toward using personalized medicine approaches in an increasingly diverse society.34
Acknowledgment: Support for this paper was provided in part by NIH grants RR026138 and MD000182.
- National Kidney Foundation. K/DOQI clinical practice guidelines for chronic kidney disease: evaluation, classification, and stratification. Am J Kidney Dis 2002; 39(suppl 1):S1–S266.
- Coresh J, Selvin E, Stevens LA, et al. Prevalence of chronic kidney disease in the United States. JAMA 2007; 298:2038–2047.
- US Renal Data System. USRDS 2010 Annual Data Report: Atlas of Chronic Kidney Disease and End-Stage Renal Disease in the United States. Bethesda, MD; National Institutes of Health, National Institute of Diabetes and Digestive and Kidney Diseases, 2010.
- Norris K, Nissenson AR. Race, gender, and socioeconomic disparities in CKD in the United States. J Am Soc Nephrol 2008; 19:1261–1270.
- Norris KC, Agodoa LY. Unraveling the racial disparities associated with kidney disease. Kidney Int 2005; 68:914–924.
- Powe NR. To have and have not: health and health care disparities in chronic kidney disease. Kidney Int 2003; 64:763–772.
- Genovese G, Friedman DJ, Ross MD, et al. Association of trypanolytic ApoL1 variants with kidney disease in African Americans. Science 2010; 329:841–845.
- Rosamond W, Flegal K, Furie K, et al; American Heart Association Statistics Committee and Stroke Statistics Subcommittee. Heart disease and stroke statistics—2008 update: a report from the American Heart Association Statistics Committee and Stroke Statistics Subcommittee. Circulation 2008; 117:e25–e146.
- Chobanian AV, Bakris GL, Black HR, et al; National Heart, Lung, and Blood Institute Joint National Committee on Prevention, Detection, Evaluation, and Treatment of High Blood Pressure. The Seventh Report of the Joint National Committee on Prevention, Detection, Evaluation, and Treatment of High Blood Pressure: the JNC 7 report. JAMA 2003; 289:2560–2572.
- Muntner P, Anderson A, Charleston J, et al; Chronic Renal Insufficiency Cohort (CRIC) Study Investigators. Hypertension awareness, treatment, and control in adults with CKD: results from the Chronic Renal Insufficiency Cohort (CRIC) Study. Am J Kidney Dis 2010; 55:441–451.
- Tight blood pressure control and risk of macrovascular and microvascular complications in type 2 diabetes: UKPDS 38. UK Prospective Diabetes Study Group. BMJ 1998; 317:703–713.
- Egan BM, Zhao Y, Axon RN. US trends in prevalence, awareness, treatment, and control of hypertension, 1988–2008. JAMA 2010; 303:2043–2050.
- Knight EL, Kramer HM, Curhan GC. High-normal blood pressure and microalbuminuria. Am J Kidney Dis 2003; 41:588–595.
- Luft FC, Grim CE, Fineberg N, Weinberger MC. Effects of volume expansion and contraction in normotensive whites, blacks, and subjects of different ages. Circulation 1979; 59:643–650.
- Chandramohan G, Bai Y, Norris K, Rodriguez-Iturbe B, Vaziri ND. Effects of dietary salt on intrarenal angiotensin system, NAD(P)H oxidase, COX-2, MCP-1 and PAI-1 expressions and NF-kappaB activity in salt-sensitive and -resistant rat kidneys. Am J Nephrol 2008; 28:158–167.
- Hayakawa H, Coffee K, Raij L. Endothelial dysfunction and cardiorenal injury in experimental salt-sensitive hypertension: effects of antihypertensive therapy. Circulation 1997; 96:2407–2413.
- Norris KC, Tareen N, Martins D, Vaziri ND. Implications of ethnicity for the treatment of hypertensive kidney disease, with an emphasis on African Americans. Nat Clin Pract Nephrol 2008; 4:538–549.
- Kao WH, Klag MJ, Meoni LA, et al; Family Investigation of Nephropathy and Diabetes Research Group. MYH9 is associated with nondiabetic end-stage renal disease in African Americans. Nat Genet 2008; 40:1185–1192.
- Freedman BI, Kopp JB, Langefeld CD, et al. The apolipoprotein L1 (APOL1) gene and nondiabetic nephropathy in African Americans. J Am Soc Nephrol 2010; 21:1422–1426.
- Materson BJ, Reda DJ, Cushman WC, et al. Single-drug therapy for hypertension in men. A comparison of six antihypertensive agents with placebo. The Department of Veterans Affairs Cooperative Study Group on Antihypertensive Agents. N Engl J Med 1993; 328:914–921. Erratum in N Engl J Med 1994; 330:1689.
- Norris KC, Francis CK. Gender and ethnic differences and considerations in cardiovascular risk assessment and prevention in African Americans. In:Wong N, Gardin JM, Black HR, editors. Practical Strategies in Preventing Heart Disease. New York, NY: McGraw-Hill; 2004:415–440.
- Wright JT, Bakris G, Greene T, et al; African American Study of Kidney Disease and Hypertension Study Group. Effect of blood pressure lowering and antihypertensive drug class on progression of hypertensive kidney disease: results from the AASK trial. JAMA 2002; 288:2421–2431. Erratum in JAMA 2006; 295:2726.
- Wright JT, Agodoa L, Contreras G, et al; African American Study of Kidney Disease and Hypertension Study Group. Successful blood pressure control in the African American Study of Kidney Disease and Hypertension. Arch Intern Med 2002; 162:1636–1643.
- Appel LJ, Wright JT, Greene T, et al; AASK Collaborative Research Group. Intensive blood-pressure control in hypertensive chronic kidney disease. N Engl J Med 2010; 363:918–929.
- de Zeeuw D, Ramjit D, Zhang Z, et al. Renal risk and renoprotection among ethnic groups with type 2 diabetic nephropathy: a post hoc analysis of RENAAL. Kidney Int 2006; 69:1675–1682.
- Rahman M, Pressel S, Davis BR, et al. Renal outcomes in high-risk hypertensive patients treated with an angiotensin-converting enzyme inhibitor or a calcium channel blocker vs a diuretic: a report from the Antihypertensive and Lipid-Lowering Treatment to Prevent Heart Attack Trial (ALLHAT). Arch Intern Med 2005; 165:936–946.
- Barrier PA, Li JT, Jensen NM. Two words to improve physician-patient communication: what else? Mayo Clin Proc 2003; 78:211–214.
- Flack JM, Sica DA, Bakris G, et al; International Society on Hypertension in Blacks. Management of high blood pressure in blacks: an update of the International Society on Hypertension in Blacks consensus statement. Hypertension 2010; 56:780–800.
- Wright JT, Agodoa LY, Appel L, et al. New recommendations for treating hypertension in black patients: evidence and/or consensus? Hypertension 2010; 56:801–803.
- National Kidney Foundation. K/DOQI Clinical Practice Guidelines on Hypertension and Antihypertensive Agents in Chronic Kidney Disease: executive summary. Am J Kid Dis 2004; 43(suppl 1):S16–S33.
- Lea J, Greene T, Hebert L, et al. The relationship between magnitude of proteinuria reduction and risk of end-stage renal disease: results of the African American study of kidney disease and hypertension. Arch Intern Med 2005; 165:947–953.
- Bakris GL, Williams M, Dworkin L, et al. Preserving renal function in adults with hypertension and diabetes: a consensus approach. National Kidney Foundation Hypertension and Diabetes Executive Committees Working Group. Am J Kidney Dis 2000; 36:646–661.
- Martins D, Norris K. Hypertension treatment in African Americans: physiology is less important than sociology. Cleve Clin J Med 2004; 71:735–743.
- Cooper RS, Psaty BM. Should ethnicity serve as the basis for clinical trial design? Diversity and inclusiveness should remain the guiding principles for clinical trials. Circulation 2005; 112:3660–3665.
KEY POINTS
- To provide optimal care for African Americans, we need to be sensitive to factors that may pose barriers to care, such as poverty, unemployment, lack of insurance, low education level, lack of family support, inaccurate health beliefs, and unhealthy behaviors.
- If we detect CKD earlier, we can better implement strategies to prevent its progression, refer the patient to specialists, and possibly arrange for preemptive kidney transplantation if needed.
- Progression of CKD can be prevented or slowed by controlling blood pressure, proteinuria, and blood glucose. However, CKD progresses in a subset of patients despite evidence-based therapy to target goals.
- African Americans with hypertensive CKD and proteinuria should receive a diuretic, a renin-angiotensin system inhibitor, or both as initial therapy, with a target blood pressure of less than 130/80 mm Hg.
Male hypogonadism: More than just a low testosterone
Editor’s note: This article on the differential diagnosis of hypogonadism in men is the first of two articles. The second, to be published next month, focuses on the appropriate use of testosterone therapy.
A 54-year-old man is referred for evaluation of low testosterone. He had seen his primary care physician for complaints of diminished libido and erectile dysfunction for the past year and worsening fatigue over the past few years. He has not been formally diagnosed with any medical condition. His serum testosterone level is 180 ng/dL (reference range 249–836 ng/dL).
On physical examination, he is obese (body mass index 31 kg/m2) with a normal-appearing male body habitus, no gynecomastia, and normal testicles and prostate gland.
How should this patient be evaluated?
LOW TESTOSTERONE HAS MANY CAUSES
Male hypogonadism, ie, failure of the testes to produce adequate amounts of androgen or sperm, has become a common clinical finding, particularly in the older population. This is more likely the result of an increase in awareness and detection of the disorder by physicians rather than a true increase in prevalence.
The finding of a low serum testosterone value needs to be confirmed and thoroughly evaluated before starting treatment. It is important to determine whether the cause is a primary (hypergonadotropic) testicular disorder or secondary to a hypothalamic-pituitary process (hypogonadotropic or normogonadotropic).
THE HYPOTHALAMIC-PITUITARY-GONADAL AXIS
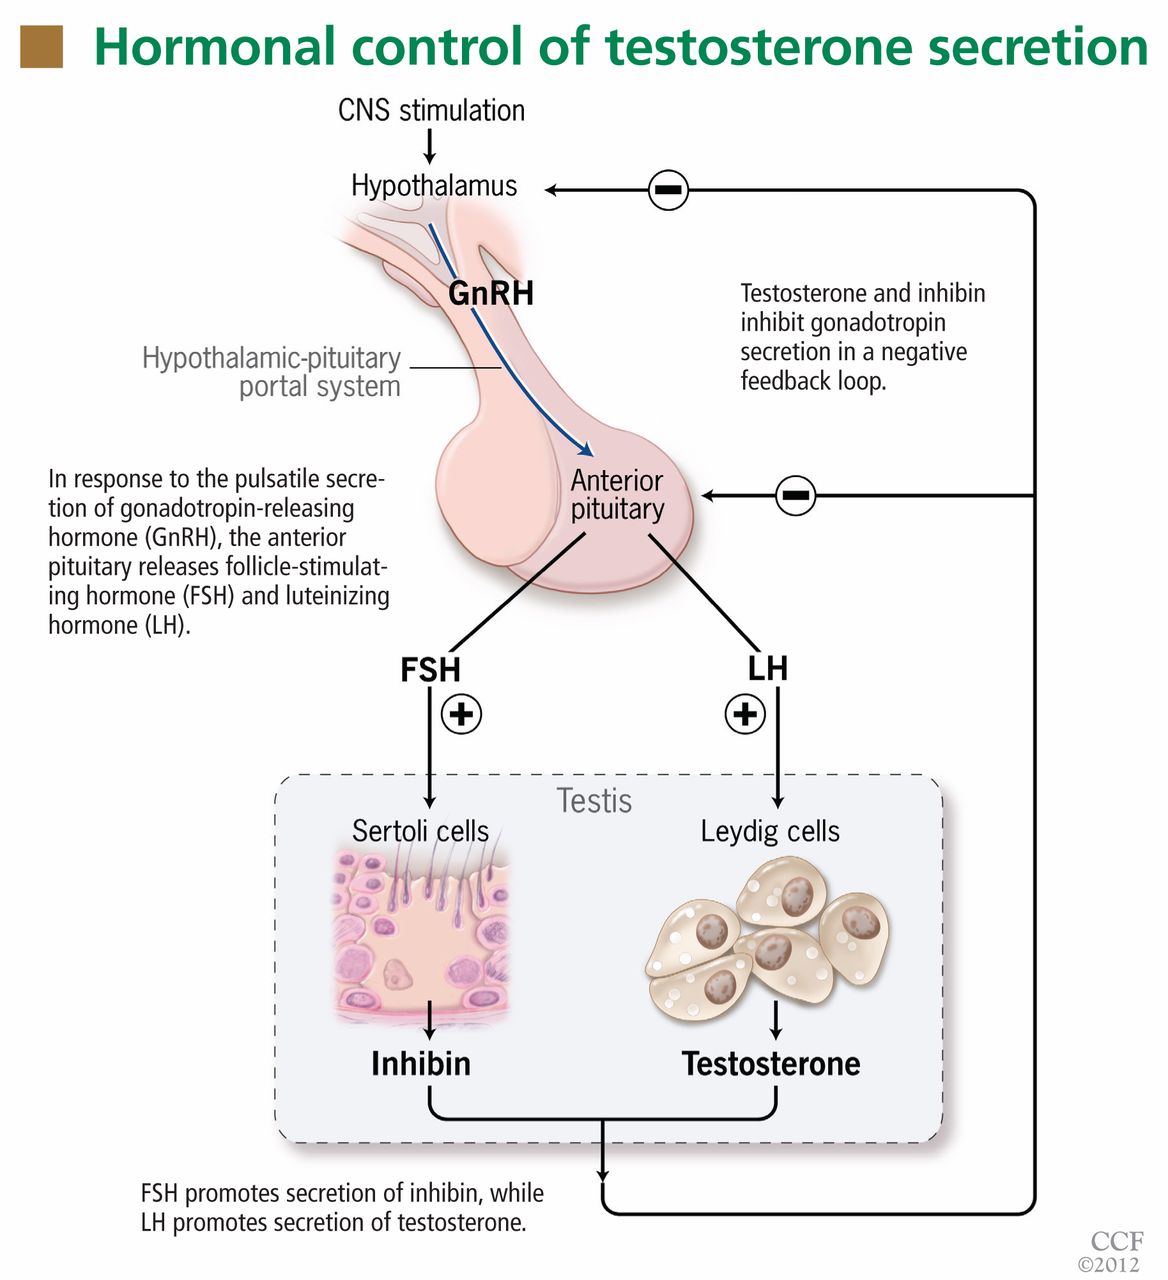
Testosterone production is under the control of luteinizing hormone (LH), whereas sperm production is under the control of follicle-stimulating hormone (FSH) (Figure 1). Both of these pituitary hormones are regulated by the pulsatile secretion of hypothalamic gonadotropin-releasing hormone (GnRH).
Testosterone (produced by Leydig cells) and inhibin B (produced by Sertoli cells within the seminiferous tubules) result in negative feedback inhibition of gonadotropin (LH and FSH) secretion. Testosterone and estradiol (produced by aromatization of testosterone) act at both pituitary and hypothalamic sites and are the principal regulators of LH secretion.1,2 Inhibin B is the major regulator of FSH secretion in men,3 but steroid feedback also occurs.2,4
TO FOLLOW UP A LOW TESTOSTERONE, CONFIRM THE VALUE NEAR 8 am
If a testosterone value is found to be low, it is important to determine the time that the sample was obtained. Serum testosterone levels follow a diurnal rhythm, at least in younger men, with values near 8 am being, on average, 30% higher than the trough levels later in the day.5–7 The timing of the diurnal variation may be different in night-shift workers, who may require assessment at a more appropriate time of the day (ie, upon awakening).
Another factor affecting testosterone levels is the patient’s health status at the time of testing. Values obtained in the hospital during an acute illness should be repeated once the event has resolved, as testosterone values decrease considerably in this setting.8 Even in outpatients, particularly in men over age 60, one must be sure that the low testosterone level was not obtained during a period of decompensation of one of the many comorbidities seen in these patients, such as coronary artery disease, congestive heart failure, or uncontrolled diabetes.
If an 8 am testosterone value is low, it is reasonable to obtain at least one confirmatory testosterone level on another day, near 8 am, in the next few weeks, when the patient is in good health. Confirming the testosterone level is important, particularly since commercially available testosterone assays are not well standardized and some are frankly unreliable.9,10 A repeat confirmatory level should always be performed by a reliable reference laboratory. If the testosterone level is still low, further evaluation is warranted.
TOTAL TESTOSTERONE VS BIOAVAILABLE TESTOSTERONE VS FREE TESTOSTERONE
Of the total circulating testosterone, 60% is bound to sex hormone-binding globulin (SHBG), 38% is bound to albumin, and only 2% is free. All of these fractions can be measured to assess for testosterone deficiency.
Free testosterone is the biologically active form of this hormone and, thus, the free testosterone level is considered to be a better representation of the true testosterone status. However, some clinicians believe that bioavailable testosterone (testosterone loosely bound to albumin + free testosterone) is a better reflection of the true level of the active hormone than the level of free testosterone alone.
There are situations in which the total testosterone level is low but bioavailable or free testosterone levels are normal. The level of total testosterone is affected by alterations in the levels of SHBG and albumin. A reduction in the level of SHBG can result in low total serum testosterone levels in patients with obesity or type 2 diabetes (states of insulin resistance), and also in cachexia, malnutrition, advanced cirrhosis, acromegaly, hypothyroidism, and nephrotic syndrome. SHBG can also be low in patients taking glucocorticoids, progestins, or androgenic steroids.11 In these settings, checking the level of free testosterone (the active hormone), bioavailable testosterone, or both, by a reliable reference laboratory, may be more appropriate.9,10
But regardless of which measurement is chosen, all testosterone levels—especially bioavailable and free testosterone values—should be interpreted with caution if they are not measured at a reliable reference laboratory.9,10 Interested readers may wish to see the US Centers for Disease Control and Prevention (CDC) Hormone Standardization Program Web site (www.cdc.gov/labstandards/hs.html) for more details, including a list of CDC-certified laboratories.
CLINICAL FEATURES OF LOW TESTOSTERONE
A history of erectile dysfunction, decreased libido, and fatigue may be seen in patients with low testosterone. However, one must realize that these symptoms—as well as others reported by men with low testosterone, such as depression, difficulty concentrating, irritability, and insomnia—are nonspecific and may be related to other medical conditions.12
Likewise, physical findings such as muscle weakness, reduced body hair, and altered fat distribution (abdominal obesity) are seen in men with low testosterone, but also in those with a number of other medical conditions.
Additional features suggest specific disorders, eg, anosmia in Kallmann syndrome; eunuchoid body habitus, gynecomastia, and small testes in Klinefelter syndrome.
Men with low testosterone may have low bone mineral density or anemia, or both.
Careful examination of the breasts for gynecomastia and the testes for size, consistency, and masses (testicular tumors) helps in formulating a differential diagnosis and in appropriately directing subsequent laboratory evaluation and diagnostic imaging.
LOW TESTOSTERONE: PRIMARY VS SECONDARY
A history of testicular trauma, systemic chemotherapy, or mumps orchitis should direct the physician’s attention to a testicular etiology. On the other hand, darkened or tanned skin (suggesting hemochromatosis), galactorrhea (suggesting hyperprolactinemia), or visual field deficits (suggesting a sellar mass) should direct the physician’s attention toward a pituitary-hypothalamic process.
Once the low testosterone value has been confirmed at least one time near 8 am, one should obtain LH and FSH values to help direct further evaluation in deciphering the etiology (Figure 2). Elevated (hypergonadotropic) values indicate a testicular disorder (primary hypogonadism), whereas low (hypogonadotropic) or normal (normogonadotropic) values point to a pituitary-hypothalamic process (secondary hypogonadism). It should be emphasized that, in the setting of a low testosterone level, LH and FSH values within the normal range are “inappropriately normal” so that further investigation is required.
This evaluation should also include serum prolactin, thyroid-stimulating hormone (TSH, also known as thyrotropin), free thyroxine (T4), and ferritin levels, the latter because hemochromatosis (iron overload) can cause both primary and secondary hypogonadism. If at any time in the evaluation the laboratory results suggest secondary hypogonadism, a full assessment of pituitary function should be undertaken.
Semen analysis is usually reserved for patients presenting with the primary complaint of infertility.
PRIMARY HYPOGONADISM
The patient should be carefully questioned about the age at which his problems began, about pubertal development, and about fertility. Causes of primary hypogonadism include:
- Karyotype abnormalities—Klinefelter syndrome (47, XXY syndrome) is the most common
- Toxin exposure, chemotherapy
- Congenital defects—anorchia, cryptorchidism13
- Orchitis (mumps, autoimmune)
- Testicular trauma or infarction
- Hemochromatosis
- Medications that inhibit androgen biosynthesis, eg, ketoconazole (Nizoral)14
- Increase in temperature of the testicular environment (due to varicocele or a large panniculus).
SECONDARY HYPOGONADISM
Causes of secondary hypogonadism include the following:
Congenital disorders
These disorders are usually diagnosed in childhood or adolescence, often after the patient is brought to the physician because of short stature or pubertal delay.
- Kallmann syndrome (anosmia and GnRH deficiency)15
- GnRH receptor mutation and deficiency16
- Genetic mutations associated with pituitary hormone deficiencies, eg, PROP-1 mutation.17
Acquired disorders that suppress gonadotrophs
Drugs. Long-term therapy with common medications such as opioids or corticosteroids can result in secondary hypogonadism.18–20 Others are GnRH analogues such as leuprolide (Lupron), which are used in treating advanced prostate cancer. The hypogonadism is usually transient and resolves after stopping the offending agent.
Obesity and related conditions such as obstructive sleep apnea, insulin resistance, and type 2 diabetes mellitus are associated with low testosterone levels.21 Treatment should be directed at these underlying conditions and should include lifestyle measures such as weight loss and exercise, rather than simple prescribing of testosterone supplementation, as these efforts may provide multiple health benefits in addition to raising testosterone levels.22
Insulin resistance. In the setting of obesity, the total testosterone level may be low but the bioavailable and free testosterone (active hormone) levels may be normal. This is due to the effect of hyperinsulinemia on the liver, which results in a reduction in SHBG production.23 Low levels of both total and free testosterone can be seen in morbid obesity,24 but the cause remains unclear.
Type 2 diabetes mellitus. Testosterone levels have been reported to be lower in obese men who have diabetes than in those with obesity alone.24 This decrement, comparable in magnitude to that seen with other chronic diseases, suggests that low testosterone may simply be a marker of poor health.22,25,26
Sleep apnea. Disturbances in the sleep cycle, regardless of the underlying cause, can result in decreases in serum testosterone levels. Often, correcting the underlying sleep disturbance can result in a normalization of serum testosterone levels.27,28 A caveat about testosterone therapy: a thorough evaluation for sleep apnea should be undertaken in patients at high risk, since testosterone replacement therapy can adversely affect ventilatory drive and induce or worsen obstructive sleep apnea.29
Aging. Most reports have shown an agerelated decline in both total and free serum testosterone levels (commonly referred to as “andropause”), particularly in men over 60 years of age. There also appears to be a loss of circadian rhythm,30 although not all reports agree.6 It appears that factors such as functional status and overall health may play a more important role in the pathophysiology of hypogonadism in men of advanced age than age alone.
Hemochromatosis. Iron overload, regardless of the cause, can result in hypogonadism via deposition of iron in the hypothalamus, pituitary, or testes. Hereditary hemochromatosis is a common autosomal recessive disease characterized by increased iron absorption. Although both primary and secondary hypogonadism can occur with long-standing iron overload, the latter is much more common.31 Some cases of hypogonadism have been reported to reverse with iron depletion therapy.32
Hyperprolactinemia. Recognized causes of hyperprolactinemia in men include medications (dopamine antagonists, antipsychotics, metoclopramide [Reglan]), pituitary adenomas (microadenomas < 10 mm, macroadenomas ≥ 10 mm), lactotroph hyperfunction (stalk compression interrupting or reducing the tonic suppression of prolactin secretion by dopamine), hypothyroidism, stress, chronic renal failure, cirrhosis, chest wall injury (trauma), and active herpes zoster. The ensuing hypogonadism may be due to the compressive effect of a sellar mass or the direct effect of the prolactin elevation alone, since prolactin disrupts the pulsatile release of GnRH from the hypothalamus,33 required for normal LH and FSH secretion.
Estrogen excess can be either exogenous (from exposure to estrogen-containing contraceptives and creams) or endogenous (from testicular34,35 or very rare adrenal36 estrogen-secreting tumors). Of note, some cases of testicular neoplasms may be detectable only with ultrasonography. Computed tomography may be performed if an adrenal lesion is suspected.
Anabolic steroid abuse. Exposure to anabolic steroids, deliberately or inadvertently, can result in secondary hypogonadism and testicular atrophy, both of which may persist for years after stopping the anabolic agents. If you suspect anabolic steroid abuse, a urine anabolic steroid screen can be obtained.
Anorexia nervosa is far less common in men than in women.37,38 Elements in the history that suggest this disorder include excessive exercise and a low body mass index. Chronic malnutrition (cachexia), regardless of the cause, can result in secondary hypogonadism.
Acute illness (gonadotroph sick syndrome). Hypogonadism is a relatively common finding in any critical illness (analogous to euthyroid sick syndrome with respect to the hypothalamic-pituitary-thyroid axis).8 Testosterone levels are invariably low, so that assessment of testosterone status is not recommended in this setting. The low testosterone phase is usually transient and resolves with resolution or improvement of the underlying medical condition, such as sepsis or myocardial infarction.
HIV. Human immunodeficiency virus (HIV) infection can result in primary or secondary hypogonadism. It can occur with active HIV infection, in patients in whom control of viral replication has been achieved with highly active antiretroviral therapy, and even in patients who have normalized CD4+ cell counts.39 Hypogonadism in HIV patients is multifactorial and may be related to weight loss, opportunistic infections of the pituitary-hypothalamus or testes, or medications such as opioids (licit or illicit), ganciclovir (Cytovene), ketoconazole, the appetite stimulant megestrol (Megace), or cyclophosphamide (Cytoxan). Testosterone replacement therapy does not adversely affect the HIV disease process and in fact may help to avoid complications.
Chronic medical conditions such as cirrhosis, renal failure, and rheumatoid arthritis commonly result in hypogonadism, the pathogenesis of which may involve dysfunction at all levels of the hypothalamic-pituitary-go-nadal axis.40–45 Hypogonadism in the setting of chronic disease is multifactorial, being due not only to the metabolic disturbances seen with these illnesses (uremia in renal failure, elevated circulating estrogens in liver cirrhosis), but also to recurrent acute illness and hospitalization for infection in these immuno-compromised hosts, either from the underlying medical condition or as a result of medications (corticosteroids).
Alcohol abuse. Alcohol can have adverse effects at all levels of the hypothalamic-pituitary-gonadal axis, resulting in low serum testosterone and reduced spermatogenesis.46
Severe chronic primary hypothyroidism, manifested by an extreme elevation of serum thyroid-stimulating hormone (TSH), can result in hypopituitarism. Pituitary function usually recovers with restoration of euthyroidism.47,48
Pubertal delay. Depending on the age of presentation, differentiating pubertal delay from permanent hypogonadotropic hypogonadism can be challenging.
Acquired disorders that damage gonadotrophs
- Sellar mass or cyst—pituitary adenoma, craniopharyngioma, Rathke cleft cyst, meningioma
- Infiltrative lesion—lymphocytic hypophysitis, Langerhans cell histiocytosis, hemochromatosis, sarcoidosis, infection
- Metastatic lesion
- Trauma (head injury)
- Radiation exposure
- Surgery
- Stalk severance
- Pituitary apoplexy.
See Table 1 for a summary of the causes of male hypogonadism.
WHEN IS MRI INDICATED IN EVALUATING SECONDARY HYPOGONADISM?
The yield of pituitary-hypothalamic imaging in older men with secondary hypogonadism is fairly low in the absence of other pituitary hormone abnormalities and deficiencies. There are limited data regarding appropriate criteria for performing hypothalamic-pituitary imaging studies. However, a patient who has multiple anterior pituitary abnormalities on laboratory evaluation should undergo dedicated hypothalamic-pituitary magnetic resonance imaging (MRI).
The Endocrine Society Clinical Practice Guidelines11 recommend that MRI be performed to exclude a pituitary or hypothalamic tumor or infiltrative disease if the patient has severe secondary hypogonadism (serum testosterone < 150 ng/dL), panhypopituitarism, persistent hyperprolactinemia, or symptoms or signs of tumor mass effect such as headache, visual impairment, or a visual field defect.
WHO SHOULD UNDERGO ASSESSMENT OF TESTOSTERONE STATUS?
Screening for androgen deficiency in the asymptomatic general population is not recommended.11 The nonspecific nature of many of the signs and symptoms of androgen deficiency makes it difficult to give concrete recommendations as to who should have testosterone levels measured. Clinicians should consider testing if there is evidence of certain clinical disorders that are associated with low testosterone levels (see earlier discussion on the specific causes of primary and secondary hypogonadism).
When a male patient complains of erectile dysfunction, the investigation should include an assessment of serum testosterone. However, if a man who has a constellation of nonspecific symptoms asks for his testosterone level to be assessed (which is common, given the aggressive marketing of testosterone replacement by the pharmaceutical industry), we would recommend a basic evaluation that includes a comprehensive metabolic panel, complete blood count, and TSH level. Further testing should be determined by the history and physical examination. If no obvious explanation has been found for the patient’s symptoms at that point, assessment of serum testosterone may be warranted. More often than not the patient’s weight and limited physical activity are the driving forces behind the nonspecific symptoms, and counseling a patient on a life-style change can provide much benefit if the patient follows through with the physician’s recommendations.
Men whom we believe should not undergo assessment for testosterone deficiency are those who are acutely ill and hospitalized and those who are severely obese and are complaining of fatigue. Testosterone levels should be assessed only after the acute illness has resolved and, in a severely obese patient with fatigue, only after a thorough evaluation for sleep apnea has been undertaken.
TREAT THE UNDERLYING CAUSE, IF ONE CAN BE FOUND
If the evaluation of low testosterone leads to the diagnosis of a clear underlying condition that is amenable to treatment, such as prolactin elevation or sleep apnea, then treatment should be directed at the underlying cause, with subsequent monitoring of the patient’s symptoms and response in serum testosterone levels. In general, the use of dopamine agonist therapy in the management of hyperprolactinemia and, in cases of panhypopituitarism, of replacement therapy with levothyroxine (Synthroid), hydrocortisone, and possibly growth hormone and desmopressin (DDAVP), fall best under the purview of an endocrinologist. A caveat: serum TSH cannot be used to monitor levothyroxine replacement therapy in cases of secondary hypothyroidism. The clinical picture and serum free T4 and free T3 levels are used instead.
In the absence of a correctable (or immediately correctable) cause, testosterone supplementation can be initiated on an individualized basis in select patients who have clinical signs and symptoms of androgen deficiency if the benefits of treatment appear to outweigh the potential risks, and only after a thorough discussion with the patient.11 The Endocrine Society recommends against offering testosterone therapy to all older men with low testosterone.11
INFERTILITY
In men presenting with low serum testosterone, semen analysis is not routine. It is usually reserved for patients presenting with the primary complaint of infertility.
If an endocrine disorder such as prolactin elevation or hypothyroidism is the suspected cause of infertility, the patient should be referred to an endocrinologist for further evaluation and management. Treatment of male infertility should be directed at the underlying cause, but often requires exogenous human chorionic gonadotropin, FSH, GnRH (via a pulsatile pump), and possibly sperm harvesting from the testis with subsequent in vitro fertilization with intracytoplasmic sperm injection. It is critical that the partner be included in the evaluation of infertility.
These patients should be referred to a urologic or fertility center specializing in the diagnosis and treatment of infertility. For further information regarding male infertility, patients can be directed to www.fertilitylifelines.com.
CASE CONCLUDED
The patient’s low serum testosterone was confirmed on subsequent measurements at 8 am, with levels of 128 and 182 ng/dL (reference range 249–836). Other laboratory values:
- LH 1.4 mIU/mL (reference range 1.2–8.6)
- FSH 2.7 mIU/mL (1.3–9.9 mIU/mL)
(Both of these values are inappropriately normal in the setting of the low testosterone.)
- TSH 248 μIU/mL (0.4–5.5)
- Prolactin 24.6 ng/mL (1.6–18.8).
The patient was started on levothyroxine replacement therapy and after 3 months was noted to be euthyroid (TSH 1.8 μIU/mL) and to have a normal serum prolactin level. Testosterone levels (8 am) at this time were 350 ng/dL and 420 ng/dL.
Therefore, the cause of this patient’s hypogonadism was severe hypothyroidism and associated mild hyperprolactinemia. This case shows that a thorough evaluation is warranted before initiating testosterone therapy.
- Pitteloud N, Dwyer AA, DeCruz S, et al. Inhibition of luteinizing hormone secretion by testosterone in men requires aromatization for its pituitary but not its hypo-thalamic effects: evidence from the tandem study of normal and gonadotropin-releasing hormone-deficient men. J Clin Endocrinol Metab 2008; 93:784–791.
- Hayes FJ, DeCruz S, Seminara SB, Boepple PA, Crowley WF. Differential regulation of gonadotropin secretion by testosterone in the human male: absence of a negative feedback effect of testosterone on follicle-stimulating hormone secretion. J Clin Endocrinol Metab 2001; 86:53–58.
- Hayes FJ, Pitteloud N, DeCruz S, Crowley WF, Boepple PA. Importance of inhibin B in the regulation of FSH secretion in the human male. J Clin Endocrinol Metab 2001; 86:5541–5546.
- Pitteloud N, Dwyer AA, DeCruz S, et al. The relative role of gonadal sex steroids and gonadotropin-releasing hormone pulse frequency in the regulation of follicle-stimulating hormone secretion in men. J Clin Endocrinol Metab 2008; 93:2686–2692.
- Cooke RR, McIntosh JE, McIntosh RP. Circadian variation in serum free and non-SHBG-bound testosterone in normal men: measurements, and simulation using a mass action model. Clin Endocrinol (Oxf) 1993; 39:163–171.
- Diver MJ, Imtiaz KE, Ahmad AM, Vora JP, Fraser WD. Diurnal rhythms of serum total, free and bioavailable testosterone and of SHBG in middle-aged men compared with those in young men. Clin Endocrinol (Oxf) 2003; 58:710–717.
- Clair P, Claustrat B, Jordan D, Dechaud H, Sassolas G. Daily variations of plasma sex hormone-binding globulin binding capacity, testosterone and luteinizing hormone concentrations in healthy rested adult males. Horm Res 1985; 21:220–223.
- Woolf PD, Hamill RW, McDonald JV, Lee LA, Kelly M. Transient hypogonadotropic hypogonadism caused by critical illness. J Clin Endocrinol Metab 1985; 60:444–450.
- Rosner W, Auchus RJ, Azziz R, Sluss PM, Raff H. Position statement: utility, limitations, and pitfalls in measuring testosterone: an Endocrine Society position statement. J Clin Endocrinol Metab 2007; 92:405–413.
- Rosner W, Vesper H, et al; Endocrine Society; American Association for Clinical Chemistry; American Association of Clinical Endocrinologists; et al. Toward excellence in testosterone testing: a consensus statement. J Clin Endocrinol Metab 2010; 95:4542–4548.
- Bhasin S, Cunningham GR, Hayes FJ, et al; Task Force, Endocrine Society. Testosterone therapy in men with androgen deficiency syndromes: an Endocrine Society clinical practice guideline. J Clin Endocrinol Metab 2010; 95:2536–2559.
- Wu FC, Tajar A, Beynon JM, et al; EMAS Group. Identification of late-onset hypogonadism in middle-aged and elderly men. N Engl J Med 2010; 363:123–135.
- Farrer JH, Sikka SC, Xie HW, Constantinide D, Rajfer J. Impaired testosterone biosynthesis in cryptorchidism. Fertil Steril 1985; 44:125–132.
- Sikka SC, Swerdloff RS, Rajfer J. In vitro inhibition of testosterone biosynthesis by ketoconazole. Endocrinology 1985; 116:1920–1925.
- Pallais JC, Au M, Pitteloud N, Seminara S, Crowley WF Jr. Kallmann syndrome. In:Pagon RA, Bird TD, Dolan CR, Stephens K, Adam MP, eds. GeneReviews™ (Internet). Seattle, WA: University of Washington; 1993.
- Chevrier L, Guimiot F, de Roux N. GnRH receptor mutations in isolated gonadotropic deficiency. Mol Cell Endocrinol 2011; 346:21–28.
- Romero CJ, Pine-Twaddell E, Radovick S. Novel mutations associated with combined pituitary hormone deficiency. J Mol Endocrinol 2011; 46:R93–R102.
- Colameco S, Coren JS, Ciervo CA. Continuous opioid treatment for chronic noncancer pain: a time for moderation in prescribing. Postgrad Med 2009; 121:61–66.
- Fraser LA, Morrison D, Morley-Forster P, et al. Oral opioids for chronic non-cancer pain: higher prevalence of hypogonadism in men than in women. Exp Clin Endocrinol Diabetes 2009; 117:38–43.
- Morrison D, Capewell S, Reynolds SP, et al. Testosterone levels during systemic and inhaled corticosteroid therapy. Respir Med 1994; 88:659–663.
- Mah PM, Wittert GA. Obesity and testicular function. Mol Cell Endocrinol 2010; 316:180–186.
- Grossmann M. Low testosterone in men with type 2 diabetes: significance and treatment. J Clin Endocrinol Metab 2011; 96:2341–2353.
- Gascón F, Valle M, Martos R, et al. Sex hormone-binding globulin as a marker for hyperinsulinemia and/or insulin resistance in obese children. Eur J Endocrinol 2000; 143:85–89.
- Dhindsa S, Miller MG, McWhirter CL, et al. Testosterone concentrations in diabetic and nondiabetic obese men. Diabetes Care 2010; 33:1186–1192.
- Grossmann M, Gianatti EJ, Zajac JD. Testosterone and type 2 diabetes. Curr Opin Endocrinol Diabetes Obes 2010; 17:247–256.
- Andersson B, Mårin P, Lissner L, Vermeulen A, Björntorp P. Testosterone concentrations in women and men with NIDDM. Diabetes Care 1994; 17:405–411.
- Santamaria JD, Prior JC, Fleetham JA. Reversible reproductive dysfunction in men with obstructive sleep apnoea. Clin Endocrinol (Oxf) 1988; 28:461–470.
- Grunstein RR, Handelsman DJ, Lawrence SJ, Blackwell C, Caterson ID, Sullivan CE. Neuroendocrine dysfunction in sleep apnea: reversal by continuous positive airways pressure therapy. J Clin Endocrinol Metab 1989; 68:352–358.
- Matsumoto AM, Sandblom RE, Schoene RB, et al. Testosterone replacement in hypogonadal men: effects on obstructive sleep apnoea, respiratory drives, and sleep. Clin Endocrinol (Oxf) 1985; 22:713–721.
- Bremner WJ, Vitiello MV, Prinz PN. Loss of circadian rhythmicity in blood testosterone levels with aging in normal men. J Clin Endocrinol Metab 1983; 56:1278–1281.
- McDermott JH, Walsh CH. Hypogonadism in hereditary hemochromatosis. J Clin Endocrinol Metab 2005; 90:2451–2455.
- Kelly TM, Edwards CQ, Meikle AW, Kushner JP. Hypogonadism in hemochromatosis: reversal with iron depletion. Ann Intern Med 1984; 101:629–632.
- Milenkovic L, D’Angelo G, Kelly PA, Weiner RI. Inhibition of gonadotropin hormone-releasing hormone release by prolactin from GT1 neuronal cell lines through prolactin receptors. Proc Natl Acad Sci U S A 1994; 91:1244–1247.
- Valensi P, Coussieu C, Kemeny JL, Attali JR, Amouroux J, Sebaoun J. Endocrine investigations in two cases of feminizing Leydig cell tumour. Acta Endocrinol (Copenh) 1987; 115:365–372.
- Young S, Gooneratne S, Straus FH, Zeller WP, Bulun SE, Rosenthal IM. Feminizing Sertoli cell tumors in boys with Peutz-Jeghers syndrome. Am J Surg Pathol 1995; 19:50–58.
- Zayed A, Stock JL, Liepman MK, Wollin M, Longcope C. Feminization as a result of both peripheral conversion of androgens and direct estrogen production from an adrenocortical carcinoma. J Endocrinol Invest 1994; 17:275–278.
- Russ MJ, Ackerman SH, Barakat R, Levy B. Hypogonadotropic hypogonadism and delayed puberty in a man with anorexia nervosa. Psychosomatics 1986; 27:737–739.
- Rigotti NA, Neer RM, Jameson L. Osteopenia and bone fractures in a man with anorexia nervosa and hypogonadism. JAMA 1986; 256:385–388.
- Cohan GR. HIV-associated hypogonadism. AIDS Read 2006; 16:341–345,348,352–354.
- Handelsman DJ, Strasser S, McDonald JA, Conway AJ, McCaughan GW. Hypothalamic-pituitary-testicular function in end-stage nonalcoholic liver disease before and after liver transplantation. Clin Endocrinol (Oxf) 1995; 43:331–337.
- Lim VS, Fang VS. Gonadal dysfunction in uremic men. A study of the hypothalamo-pituitary-testicular axis before and after renal transplantation. Am J Med 1975; 58:655–662.
- Handelsman DJ, Dong Q. Hypothalamo-pituitary gonadal axis in chronic renal failure. Endocrinol Metab Clin North Am 1993; 22:145–161.
- Handelsman DJ, Spaliviero JA, Turtle JR. Hypothalamic-pituitary function in experimental uremic hypogonadism. Endocrinology 1985; 117:1984–1995.
- Tengstrand B, Carlström K, Hafström I. Bioavailable testosterone in men with rheumatoid arthritis-high frequency of hypogonadism. Rheumatology (Oxford) 2002; 41:285–289.
- Tengstrand B, Carlström K, Hafström I. Gonadal hormones in men with rheumatoid arthritis--from onset through 2 years. J Rheumatol 2009; 36:887–892.
- Emanuele MA, Emanuele NV. Alcohol’s effects on male reproduction. Alcohol Health Res World 1998; 22:195–201.
- Meikle AW. The interrelationships between thyroid dysfunction and hypogonadism in men and boys. Thyroid 2004; 14( suppl 1):S17–S25.
- Vagenakis AG, Dole K, Braverman LE. Pituitary enlargement, pituitary failure, and primary hypothyroidism. Ann Intern Med 1976; 85:195–198.
Editor’s note: This article on the differential diagnosis of hypogonadism in men is the first of two articles. The second, to be published next month, focuses on the appropriate use of testosterone therapy.
A 54-year-old man is referred for evaluation of low testosterone. He had seen his primary care physician for complaints of diminished libido and erectile dysfunction for the past year and worsening fatigue over the past few years. He has not been formally diagnosed with any medical condition. His serum testosterone level is 180 ng/dL (reference range 249–836 ng/dL).
On physical examination, he is obese (body mass index 31 kg/m2) with a normal-appearing male body habitus, no gynecomastia, and normal testicles and prostate gland.
How should this patient be evaluated?
LOW TESTOSTERONE HAS MANY CAUSES
Male hypogonadism, ie, failure of the testes to produce adequate amounts of androgen or sperm, has become a common clinical finding, particularly in the older population. This is more likely the result of an increase in awareness and detection of the disorder by physicians rather than a true increase in prevalence.
The finding of a low serum testosterone value needs to be confirmed and thoroughly evaluated before starting treatment. It is important to determine whether the cause is a primary (hypergonadotropic) testicular disorder or secondary to a hypothalamic-pituitary process (hypogonadotropic or normogonadotropic).
THE HYPOTHALAMIC-PITUITARY-GONADAL AXIS
Testosterone production is under the control of luteinizing hormone (LH), whereas sperm production is under the control of follicle-stimulating hormone (FSH) (Figure 1). Both of these pituitary hormones are regulated by the pulsatile secretion of hypothalamic gonadotropin-releasing hormone (GnRH).
Testosterone (produced by Leydig cells) and inhibin B (produced by Sertoli cells within the seminiferous tubules) result in negative feedback inhibition of gonadotropin (LH and FSH) secretion. Testosterone and estradiol (produced by aromatization of testosterone) act at both pituitary and hypothalamic sites and are the principal regulators of LH secretion.1,2 Inhibin B is the major regulator of FSH secretion in men,3 but steroid feedback also occurs.2,4
TO FOLLOW UP A LOW TESTOSTERONE, CONFIRM THE VALUE NEAR 8 am
If a testosterone value is found to be low, it is important to determine the time that the sample was obtained. Serum testosterone levels follow a diurnal rhythm, at least in younger men, with values near 8 am being, on average, 30% higher than the trough levels later in the day.5–7 The timing of the diurnal variation may be different in night-shift workers, who may require assessment at a more appropriate time of the day (ie, upon awakening).
Another factor affecting testosterone levels is the patient’s health status at the time of testing. Values obtained in the hospital during an acute illness should be repeated once the event has resolved, as testosterone values decrease considerably in this setting.8 Even in outpatients, particularly in men over age 60, one must be sure that the low testosterone level was not obtained during a period of decompensation of one of the many comorbidities seen in these patients, such as coronary artery disease, congestive heart failure, or uncontrolled diabetes.
If an 8 am testosterone value is low, it is reasonable to obtain at least one confirmatory testosterone level on another day, near 8 am, in the next few weeks, when the patient is in good health. Confirming the testosterone level is important, particularly since commercially available testosterone assays are not well standardized and some are frankly unreliable.9,10 A repeat confirmatory level should always be performed by a reliable reference laboratory. If the testosterone level is still low, further evaluation is warranted.
TOTAL TESTOSTERONE VS BIOAVAILABLE TESTOSTERONE VS FREE TESTOSTERONE
Of the total circulating testosterone, 60% is bound to sex hormone-binding globulin (SHBG), 38% is bound to albumin, and only 2% is free. All of these fractions can be measured to assess for testosterone deficiency.
Free testosterone is the biologically active form of this hormone and, thus, the free testosterone level is considered to be a better representation of the true testosterone status. However, some clinicians believe that bioavailable testosterone (testosterone loosely bound to albumin + free testosterone) is a better reflection of the true level of the active hormone than the level of free testosterone alone.
There are situations in which the total testosterone level is low but bioavailable or free testosterone levels are normal. The level of total testosterone is affected by alterations in the levels of SHBG and albumin. A reduction in the level of SHBG can result in low total serum testosterone levels in patients with obesity or type 2 diabetes (states of insulin resistance), and also in cachexia, malnutrition, advanced cirrhosis, acromegaly, hypothyroidism, and nephrotic syndrome. SHBG can also be low in patients taking glucocorticoids, progestins, or androgenic steroids.11 In these settings, checking the level of free testosterone (the active hormone), bioavailable testosterone, or both, by a reliable reference laboratory, may be more appropriate.9,10
But regardless of which measurement is chosen, all testosterone levels—especially bioavailable and free testosterone values—should be interpreted with caution if they are not measured at a reliable reference laboratory.9,10 Interested readers may wish to see the US Centers for Disease Control and Prevention (CDC) Hormone Standardization Program Web site (www.cdc.gov/labstandards/hs.html) for more details, including a list of CDC-certified laboratories.
CLINICAL FEATURES OF LOW TESTOSTERONE
A history of erectile dysfunction, decreased libido, and fatigue may be seen in patients with low testosterone. However, one must realize that these symptoms—as well as others reported by men with low testosterone, such as depression, difficulty concentrating, irritability, and insomnia—are nonspecific and may be related to other medical conditions.12
Likewise, physical findings such as muscle weakness, reduced body hair, and altered fat distribution (abdominal obesity) are seen in men with low testosterone, but also in those with a number of other medical conditions.
Additional features suggest specific disorders, eg, anosmia in Kallmann syndrome; eunuchoid body habitus, gynecomastia, and small testes in Klinefelter syndrome.
Men with low testosterone may have low bone mineral density or anemia, or both.
Careful examination of the breasts for gynecomastia and the testes for size, consistency, and masses (testicular tumors) helps in formulating a differential diagnosis and in appropriately directing subsequent laboratory evaluation and diagnostic imaging.
LOW TESTOSTERONE: PRIMARY VS SECONDARY
A history of testicular trauma, systemic chemotherapy, or mumps orchitis should direct the physician’s attention to a testicular etiology. On the other hand, darkened or tanned skin (suggesting hemochromatosis), galactorrhea (suggesting hyperprolactinemia), or visual field deficits (suggesting a sellar mass) should direct the physician’s attention toward a pituitary-hypothalamic process.
Once the low testosterone value has been confirmed at least one time near 8 am, one should obtain LH and FSH values to help direct further evaluation in deciphering the etiology (Figure 2). Elevated (hypergonadotropic) values indicate a testicular disorder (primary hypogonadism), whereas low (hypogonadotropic) or normal (normogonadotropic) values point to a pituitary-hypothalamic process (secondary hypogonadism). It should be emphasized that, in the setting of a low testosterone level, LH and FSH values within the normal range are “inappropriately normal” so that further investigation is required.
This evaluation should also include serum prolactin, thyroid-stimulating hormone (TSH, also known as thyrotropin), free thyroxine (T4), and ferritin levels, the latter because hemochromatosis (iron overload) can cause both primary and secondary hypogonadism. If at any time in the evaluation the laboratory results suggest secondary hypogonadism, a full assessment of pituitary function should be undertaken.
Semen analysis is usually reserved for patients presenting with the primary complaint of infertility.
PRIMARY HYPOGONADISM
The patient should be carefully questioned about the age at which his problems began, about pubertal development, and about fertility. Causes of primary hypogonadism include:
- Karyotype abnormalities—Klinefelter syndrome (47, XXY syndrome) is the most common
- Toxin exposure, chemotherapy
- Congenital defects—anorchia, cryptorchidism13
- Orchitis (mumps, autoimmune)
- Testicular trauma or infarction
- Hemochromatosis
- Medications that inhibit androgen biosynthesis, eg, ketoconazole (Nizoral)14
- Increase in temperature of the testicular environment (due to varicocele or a large panniculus).
SECONDARY HYPOGONADISM
Causes of secondary hypogonadism include the following:
Congenital disorders
These disorders are usually diagnosed in childhood or adolescence, often after the patient is brought to the physician because of short stature or pubertal delay.
- Kallmann syndrome (anosmia and GnRH deficiency)15
- GnRH receptor mutation and deficiency16
- Genetic mutations associated with pituitary hormone deficiencies, eg, PROP-1 mutation.17
Acquired disorders that suppress gonadotrophs
Drugs. Long-term therapy with common medications such as opioids or corticosteroids can result in secondary hypogonadism.18–20 Others are GnRH analogues such as leuprolide (Lupron), which are used in treating advanced prostate cancer. The hypogonadism is usually transient and resolves after stopping the offending agent.
Obesity and related conditions such as obstructive sleep apnea, insulin resistance, and type 2 diabetes mellitus are associated with low testosterone levels.21 Treatment should be directed at these underlying conditions and should include lifestyle measures such as weight loss and exercise, rather than simple prescribing of testosterone supplementation, as these efforts may provide multiple health benefits in addition to raising testosterone levels.22
Insulin resistance. In the setting of obesity, the total testosterone level may be low but the bioavailable and free testosterone (active hormone) levels may be normal. This is due to the effect of hyperinsulinemia on the liver, which results in a reduction in SHBG production.23 Low levels of both total and free testosterone can be seen in morbid obesity,24 but the cause remains unclear.
Type 2 diabetes mellitus. Testosterone levels have been reported to be lower in obese men who have diabetes than in those with obesity alone.24 This decrement, comparable in magnitude to that seen with other chronic diseases, suggests that low testosterone may simply be a marker of poor health.22,25,26
Sleep apnea. Disturbances in the sleep cycle, regardless of the underlying cause, can result in decreases in serum testosterone levels. Often, correcting the underlying sleep disturbance can result in a normalization of serum testosterone levels.27,28 A caveat about testosterone therapy: a thorough evaluation for sleep apnea should be undertaken in patients at high risk, since testosterone replacement therapy can adversely affect ventilatory drive and induce or worsen obstructive sleep apnea.29
Aging. Most reports have shown an agerelated decline in both total and free serum testosterone levels (commonly referred to as “andropause”), particularly in men over 60 years of age. There also appears to be a loss of circadian rhythm,30 although not all reports agree.6 It appears that factors such as functional status and overall health may play a more important role in the pathophysiology of hypogonadism in men of advanced age than age alone.
Hemochromatosis. Iron overload, regardless of the cause, can result in hypogonadism via deposition of iron in the hypothalamus, pituitary, or testes. Hereditary hemochromatosis is a common autosomal recessive disease characterized by increased iron absorption. Although both primary and secondary hypogonadism can occur with long-standing iron overload, the latter is much more common.31 Some cases of hypogonadism have been reported to reverse with iron depletion therapy.32
Hyperprolactinemia. Recognized causes of hyperprolactinemia in men include medications (dopamine antagonists, antipsychotics, metoclopramide [Reglan]), pituitary adenomas (microadenomas < 10 mm, macroadenomas ≥ 10 mm), lactotroph hyperfunction (stalk compression interrupting or reducing the tonic suppression of prolactin secretion by dopamine), hypothyroidism, stress, chronic renal failure, cirrhosis, chest wall injury (trauma), and active herpes zoster. The ensuing hypogonadism may be due to the compressive effect of a sellar mass or the direct effect of the prolactin elevation alone, since prolactin disrupts the pulsatile release of GnRH from the hypothalamus,33 required for normal LH and FSH secretion.
Estrogen excess can be either exogenous (from exposure to estrogen-containing contraceptives and creams) or endogenous (from testicular34,35 or very rare adrenal36 estrogen-secreting tumors). Of note, some cases of testicular neoplasms may be detectable only with ultrasonography. Computed tomography may be performed if an adrenal lesion is suspected.
Anabolic steroid abuse. Exposure to anabolic steroids, deliberately or inadvertently, can result in secondary hypogonadism and testicular atrophy, both of which may persist for years after stopping the anabolic agents. If you suspect anabolic steroid abuse, a urine anabolic steroid screen can be obtained.
Anorexia nervosa is far less common in men than in women.37,38 Elements in the history that suggest this disorder include excessive exercise and a low body mass index. Chronic malnutrition (cachexia), regardless of the cause, can result in secondary hypogonadism.
Acute illness (gonadotroph sick syndrome). Hypogonadism is a relatively common finding in any critical illness (analogous to euthyroid sick syndrome with respect to the hypothalamic-pituitary-thyroid axis).8 Testosterone levels are invariably low, so that assessment of testosterone status is not recommended in this setting. The low testosterone phase is usually transient and resolves with resolution or improvement of the underlying medical condition, such as sepsis or myocardial infarction.
HIV. Human immunodeficiency virus (HIV) infection can result in primary or secondary hypogonadism. It can occur with active HIV infection, in patients in whom control of viral replication has been achieved with highly active antiretroviral therapy, and even in patients who have normalized CD4+ cell counts.39 Hypogonadism in HIV patients is multifactorial and may be related to weight loss, opportunistic infections of the pituitary-hypothalamus or testes, or medications such as opioids (licit or illicit), ganciclovir (Cytovene), ketoconazole, the appetite stimulant megestrol (Megace), or cyclophosphamide (Cytoxan). Testosterone replacement therapy does not adversely affect the HIV disease process and in fact may help to avoid complications.
Chronic medical conditions such as cirrhosis, renal failure, and rheumatoid arthritis commonly result in hypogonadism, the pathogenesis of which may involve dysfunction at all levels of the hypothalamic-pituitary-go-nadal axis.40–45 Hypogonadism in the setting of chronic disease is multifactorial, being due not only to the metabolic disturbances seen with these illnesses (uremia in renal failure, elevated circulating estrogens in liver cirrhosis), but also to recurrent acute illness and hospitalization for infection in these immuno-compromised hosts, either from the underlying medical condition or as a result of medications (corticosteroids).
Alcohol abuse. Alcohol can have adverse effects at all levels of the hypothalamic-pituitary-gonadal axis, resulting in low serum testosterone and reduced spermatogenesis.46
Severe chronic primary hypothyroidism, manifested by an extreme elevation of serum thyroid-stimulating hormone (TSH), can result in hypopituitarism. Pituitary function usually recovers with restoration of euthyroidism.47,48
Pubertal delay. Depending on the age of presentation, differentiating pubertal delay from permanent hypogonadotropic hypogonadism can be challenging.
Acquired disorders that damage gonadotrophs
- Sellar mass or cyst—pituitary adenoma, craniopharyngioma, Rathke cleft cyst, meningioma
- Infiltrative lesion—lymphocytic hypophysitis, Langerhans cell histiocytosis, hemochromatosis, sarcoidosis, infection
- Metastatic lesion
- Trauma (head injury)
- Radiation exposure
- Surgery
- Stalk severance
- Pituitary apoplexy.
See Table 1 for a summary of the causes of male hypogonadism.
WHEN IS MRI INDICATED IN EVALUATING SECONDARY HYPOGONADISM?
The yield of pituitary-hypothalamic imaging in older men with secondary hypogonadism is fairly low in the absence of other pituitary hormone abnormalities and deficiencies. There are limited data regarding appropriate criteria for performing hypothalamic-pituitary imaging studies. However, a patient who has multiple anterior pituitary abnormalities on laboratory evaluation should undergo dedicated hypothalamic-pituitary magnetic resonance imaging (MRI).
The Endocrine Society Clinical Practice Guidelines11 recommend that MRI be performed to exclude a pituitary or hypothalamic tumor or infiltrative disease if the patient has severe secondary hypogonadism (serum testosterone < 150 ng/dL), panhypopituitarism, persistent hyperprolactinemia, or symptoms or signs of tumor mass effect such as headache, visual impairment, or a visual field defect.
WHO SHOULD UNDERGO ASSESSMENT OF TESTOSTERONE STATUS?
Screening for androgen deficiency in the asymptomatic general population is not recommended.11 The nonspecific nature of many of the signs and symptoms of androgen deficiency makes it difficult to give concrete recommendations as to who should have testosterone levels measured. Clinicians should consider testing if there is evidence of certain clinical disorders that are associated with low testosterone levels (see earlier discussion on the specific causes of primary and secondary hypogonadism).
When a male patient complains of erectile dysfunction, the investigation should include an assessment of serum testosterone. However, if a man who has a constellation of nonspecific symptoms asks for his testosterone level to be assessed (which is common, given the aggressive marketing of testosterone replacement by the pharmaceutical industry), we would recommend a basic evaluation that includes a comprehensive metabolic panel, complete blood count, and TSH level. Further testing should be determined by the history and physical examination. If no obvious explanation has been found for the patient’s symptoms at that point, assessment of serum testosterone may be warranted. More often than not the patient’s weight and limited physical activity are the driving forces behind the nonspecific symptoms, and counseling a patient on a life-style change can provide much benefit if the patient follows through with the physician’s recommendations.
Men whom we believe should not undergo assessment for testosterone deficiency are those who are acutely ill and hospitalized and those who are severely obese and are complaining of fatigue. Testosterone levels should be assessed only after the acute illness has resolved and, in a severely obese patient with fatigue, only after a thorough evaluation for sleep apnea has been undertaken.
TREAT THE UNDERLYING CAUSE, IF ONE CAN BE FOUND
If the evaluation of low testosterone leads to the diagnosis of a clear underlying condition that is amenable to treatment, such as prolactin elevation or sleep apnea, then treatment should be directed at the underlying cause, with subsequent monitoring of the patient’s symptoms and response in serum testosterone levels. In general, the use of dopamine agonist therapy in the management of hyperprolactinemia and, in cases of panhypopituitarism, of replacement therapy with levothyroxine (Synthroid), hydrocortisone, and possibly growth hormone and desmopressin (DDAVP), fall best under the purview of an endocrinologist. A caveat: serum TSH cannot be used to monitor levothyroxine replacement therapy in cases of secondary hypothyroidism. The clinical picture and serum free T4 and free T3 levels are used instead.
In the absence of a correctable (or immediately correctable) cause, testosterone supplementation can be initiated on an individualized basis in select patients who have clinical signs and symptoms of androgen deficiency if the benefits of treatment appear to outweigh the potential risks, and only after a thorough discussion with the patient.11 The Endocrine Society recommends against offering testosterone therapy to all older men with low testosterone.11
INFERTILITY
In men presenting with low serum testosterone, semen analysis is not routine. It is usually reserved for patients presenting with the primary complaint of infertility.
If an endocrine disorder such as prolactin elevation or hypothyroidism is the suspected cause of infertility, the patient should be referred to an endocrinologist for further evaluation and management. Treatment of male infertility should be directed at the underlying cause, but often requires exogenous human chorionic gonadotropin, FSH, GnRH (via a pulsatile pump), and possibly sperm harvesting from the testis with subsequent in vitro fertilization with intracytoplasmic sperm injection. It is critical that the partner be included in the evaluation of infertility.
These patients should be referred to a urologic or fertility center specializing in the diagnosis and treatment of infertility. For further information regarding male infertility, patients can be directed to www.fertilitylifelines.com.
CASE CONCLUDED
The patient’s low serum testosterone was confirmed on subsequent measurements at 8 am, with levels of 128 and 182 ng/dL (reference range 249–836). Other laboratory values:
- LH 1.4 mIU/mL (reference range 1.2–8.6)
- FSH 2.7 mIU/mL (1.3–9.9 mIU/mL)
(Both of these values are inappropriately normal in the setting of the low testosterone.)
- TSH 248 μIU/mL (0.4–5.5)
- Prolactin 24.6 ng/mL (1.6–18.8).
The patient was started on levothyroxine replacement therapy and after 3 months was noted to be euthyroid (TSH 1.8 μIU/mL) and to have a normal serum prolactin level. Testosterone levels (8 am) at this time were 350 ng/dL and 420 ng/dL.
Therefore, the cause of this patient’s hypogonadism was severe hypothyroidism and associated mild hyperprolactinemia. This case shows that a thorough evaluation is warranted before initiating testosterone therapy.
- Pitteloud N, Dwyer AA, DeCruz S, et al. Inhibition of luteinizing hormone secretion by testosterone in men requires aromatization for its pituitary but not its hypo-thalamic effects: evidence from the tandem study of normal and gonadotropin-releasing hormone-deficient men. J Clin Endocrinol Metab 2008; 93:784–791.
- Hayes FJ, DeCruz S, Seminara SB, Boepple PA, Crowley WF. Differential regulation of gonadotropin secretion by testosterone in the human male: absence of a negative feedback effect of testosterone on follicle-stimulating hormone secretion. J Clin Endocrinol Metab 2001; 86:53–58.
- Hayes FJ, Pitteloud N, DeCruz S, Crowley WF, Boepple PA. Importance of inhibin B in the regulation of FSH secretion in the human male. J Clin Endocrinol Metab 2001; 86:5541–5546.
- Pitteloud N, Dwyer AA, DeCruz S, et al. The relative role of gonadal sex steroids and gonadotropin-releasing hormone pulse frequency in the regulation of follicle-stimulating hormone secretion in men. J Clin Endocrinol Metab 2008; 93:2686–2692.
- Cooke RR, McIntosh JE, McIntosh RP. Circadian variation in serum free and non-SHBG-bound testosterone in normal men: measurements, and simulation using a mass action model. Clin Endocrinol (Oxf) 1993; 39:163–171.
- Diver MJ, Imtiaz KE, Ahmad AM, Vora JP, Fraser WD. Diurnal rhythms of serum total, free and bioavailable testosterone and of SHBG in middle-aged men compared with those in young men. Clin Endocrinol (Oxf) 2003; 58:710–717.
- Clair P, Claustrat B, Jordan D, Dechaud H, Sassolas G. Daily variations of plasma sex hormone-binding globulin binding capacity, testosterone and luteinizing hormone concentrations in healthy rested adult males. Horm Res 1985; 21:220–223.
- Woolf PD, Hamill RW, McDonald JV, Lee LA, Kelly M. Transient hypogonadotropic hypogonadism caused by critical illness. J Clin Endocrinol Metab 1985; 60:444–450.
- Rosner W, Auchus RJ, Azziz R, Sluss PM, Raff H. Position statement: utility, limitations, and pitfalls in measuring testosterone: an Endocrine Society position statement. J Clin Endocrinol Metab 2007; 92:405–413.
- Rosner W, Vesper H, et al; Endocrine Society; American Association for Clinical Chemistry; American Association of Clinical Endocrinologists; et al. Toward excellence in testosterone testing: a consensus statement. J Clin Endocrinol Metab 2010; 95:4542–4548.
- Bhasin S, Cunningham GR, Hayes FJ, et al; Task Force, Endocrine Society. Testosterone therapy in men with androgen deficiency syndromes: an Endocrine Society clinical practice guideline. J Clin Endocrinol Metab 2010; 95:2536–2559.
- Wu FC, Tajar A, Beynon JM, et al; EMAS Group. Identification of late-onset hypogonadism in middle-aged and elderly men. N Engl J Med 2010; 363:123–135.
- Farrer JH, Sikka SC, Xie HW, Constantinide D, Rajfer J. Impaired testosterone biosynthesis in cryptorchidism. Fertil Steril 1985; 44:125–132.
- Sikka SC, Swerdloff RS, Rajfer J. In vitro inhibition of testosterone biosynthesis by ketoconazole. Endocrinology 1985; 116:1920–1925.
- Pallais JC, Au M, Pitteloud N, Seminara S, Crowley WF Jr. Kallmann syndrome. In:Pagon RA, Bird TD, Dolan CR, Stephens K, Adam MP, eds. GeneReviews™ (Internet). Seattle, WA: University of Washington; 1993.
- Chevrier L, Guimiot F, de Roux N. GnRH receptor mutations in isolated gonadotropic deficiency. Mol Cell Endocrinol 2011; 346:21–28.
- Romero CJ, Pine-Twaddell E, Radovick S. Novel mutations associated with combined pituitary hormone deficiency. J Mol Endocrinol 2011; 46:R93–R102.
- Colameco S, Coren JS, Ciervo CA. Continuous opioid treatment for chronic noncancer pain: a time for moderation in prescribing. Postgrad Med 2009; 121:61–66.
- Fraser LA, Morrison D, Morley-Forster P, et al. Oral opioids for chronic non-cancer pain: higher prevalence of hypogonadism in men than in women. Exp Clin Endocrinol Diabetes 2009; 117:38–43.
- Morrison D, Capewell S, Reynolds SP, et al. Testosterone levels during systemic and inhaled corticosteroid therapy. Respir Med 1994; 88:659–663.
- Mah PM, Wittert GA. Obesity and testicular function. Mol Cell Endocrinol 2010; 316:180–186.
- Grossmann M. Low testosterone in men with type 2 diabetes: significance and treatment. J Clin Endocrinol Metab 2011; 96:2341–2353.
- Gascón F, Valle M, Martos R, et al. Sex hormone-binding globulin as a marker for hyperinsulinemia and/or insulin resistance in obese children. Eur J Endocrinol 2000; 143:85–89.
- Dhindsa S, Miller MG, McWhirter CL, et al. Testosterone concentrations in diabetic and nondiabetic obese men. Diabetes Care 2010; 33:1186–1192.
- Grossmann M, Gianatti EJ, Zajac JD. Testosterone and type 2 diabetes. Curr Opin Endocrinol Diabetes Obes 2010; 17:247–256.
- Andersson B, Mårin P, Lissner L, Vermeulen A, Björntorp P. Testosterone concentrations in women and men with NIDDM. Diabetes Care 1994; 17:405–411.
- Santamaria JD, Prior JC, Fleetham JA. Reversible reproductive dysfunction in men with obstructive sleep apnoea. Clin Endocrinol (Oxf) 1988; 28:461–470.
- Grunstein RR, Handelsman DJ, Lawrence SJ, Blackwell C, Caterson ID, Sullivan CE. Neuroendocrine dysfunction in sleep apnea: reversal by continuous positive airways pressure therapy. J Clin Endocrinol Metab 1989; 68:352–358.
- Matsumoto AM, Sandblom RE, Schoene RB, et al. Testosterone replacement in hypogonadal men: effects on obstructive sleep apnoea, respiratory drives, and sleep. Clin Endocrinol (Oxf) 1985; 22:713–721.
- Bremner WJ, Vitiello MV, Prinz PN. Loss of circadian rhythmicity in blood testosterone levels with aging in normal men. J Clin Endocrinol Metab 1983; 56:1278–1281.
- McDermott JH, Walsh CH. Hypogonadism in hereditary hemochromatosis. J Clin Endocrinol Metab 2005; 90:2451–2455.
- Kelly TM, Edwards CQ, Meikle AW, Kushner JP. Hypogonadism in hemochromatosis: reversal with iron depletion. Ann Intern Med 1984; 101:629–632.
- Milenkovic L, D’Angelo G, Kelly PA, Weiner RI. Inhibition of gonadotropin hormone-releasing hormone release by prolactin from GT1 neuronal cell lines through prolactin receptors. Proc Natl Acad Sci U S A 1994; 91:1244–1247.
- Valensi P, Coussieu C, Kemeny JL, Attali JR, Amouroux J, Sebaoun J. Endocrine investigations in two cases of feminizing Leydig cell tumour. Acta Endocrinol (Copenh) 1987; 115:365–372.
- Young S, Gooneratne S, Straus FH, Zeller WP, Bulun SE, Rosenthal IM. Feminizing Sertoli cell tumors in boys with Peutz-Jeghers syndrome. Am J Surg Pathol 1995; 19:50–58.
- Zayed A, Stock JL, Liepman MK, Wollin M, Longcope C. Feminization as a result of both peripheral conversion of androgens and direct estrogen production from an adrenocortical carcinoma. J Endocrinol Invest 1994; 17:275–278.
- Russ MJ, Ackerman SH, Barakat R, Levy B. Hypogonadotropic hypogonadism and delayed puberty in a man with anorexia nervosa. Psychosomatics 1986; 27:737–739.
- Rigotti NA, Neer RM, Jameson L. Osteopenia and bone fractures in a man with anorexia nervosa and hypogonadism. JAMA 1986; 256:385–388.
- Cohan GR. HIV-associated hypogonadism. AIDS Read 2006; 16:341–345,348,352–354.
- Handelsman DJ, Strasser S, McDonald JA, Conway AJ, McCaughan GW. Hypothalamic-pituitary-testicular function in end-stage nonalcoholic liver disease before and after liver transplantation. Clin Endocrinol (Oxf) 1995; 43:331–337.
- Lim VS, Fang VS. Gonadal dysfunction in uremic men. A study of the hypothalamo-pituitary-testicular axis before and after renal transplantation. Am J Med 1975; 58:655–662.
- Handelsman DJ, Dong Q. Hypothalamo-pituitary gonadal axis in chronic renal failure. Endocrinol Metab Clin North Am 1993; 22:145–161.
- Handelsman DJ, Spaliviero JA, Turtle JR. Hypothalamic-pituitary function in experimental uremic hypogonadism. Endocrinology 1985; 117:1984–1995.
- Tengstrand B, Carlström K, Hafström I. Bioavailable testosterone in men with rheumatoid arthritis-high frequency of hypogonadism. Rheumatology (Oxford) 2002; 41:285–289.
- Tengstrand B, Carlström K, Hafström I. Gonadal hormones in men with rheumatoid arthritis--from onset through 2 years. J Rheumatol 2009; 36:887–892.
- Emanuele MA, Emanuele NV. Alcohol’s effects on male reproduction. Alcohol Health Res World 1998; 22:195–201.
- Meikle AW. The interrelationships between thyroid dysfunction and hypogonadism in men and boys. Thyroid 2004; 14( suppl 1):S17–S25.
- Vagenakis AG, Dole K, Braverman LE. Pituitary enlargement, pituitary failure, and primary hypothyroidism. Ann Intern Med 1976; 85:195–198.
KEY POINTS
- Blood samples for testosterone measurements should be drawn near 8 am.
- A low serum testosterone value should always be confirmed by a reliable reference laboratory.
- The definition of a low testosterone level varies from laboratory to laboratory. In general, values less than 200 or 250 ng/dL are considered low, and values between 250 and 350 ng/dL may be considered borderline low.
- If testosterone is low, determine if the cause is primary (testicular) or secondary (hypothalamic-pituitary).
- Acute illness and treatment with opioids, anabolic steroids, or corticosteroids can result in transient hypogonadism.
Cognitive impairment in ICU survivors: Assessment and therapy
Intensive care medicine has dramatically evolved over the last 15 years, after reports from many landmark trials.1 Updated strategies for mechanical ventilation2 and “bundles” of strategies to optimize hemodynamic therapy3 have reduced the rates of morbidity and death from deadly critical conditions such as the adult respiratory distress syndrome (ARDS) and sepsis.
Despite these important improvements in short-term outcomes, it is increasingly recognized that intensive care unit (ICU) survivors suffer considerable long-term complications that affect their usual functioning.4 Recently, the Society of Critical Care Medicine convened a conference in which these long-term complications were named the “post-intensive care syndrome.”5
Quality of life, particularly its physical component, is considerably lower after a stay in the medical or surgical ICU.6–8 Posttraumatic stress disorder, depression, and sexual dysfunction are consistently reported years after ICU discharge.9–13
Perhaps the most frequently unrecognized complication in ICU survivors is cognitive impairment. Current data suggest that neurocognitive impairment after an ICU stay is common and that it persists 6 years or more after hospital discharge.
Hopkins et al14,15 analyzed 10 cohort studies of long-term cognitive impairment after an ICU stay; 5 of them focused on patients with ARDS. The prevalence of cognitive impairment was as high as 78% at hospital discharge, 46% at 1 year, and 25% 6 years after discharge.15,16 Of the cognitive domains compromised, memory was the most often affected, followed by executive function and attention.14,17
Interestingly, data suggest that cognition may improve somewhat in the first 6 to 12 months after ICU discharge.15 Therefore, if we can detect it early on and promptly refer patients for cognitive therapy, we may eventually improve the prognosis of this disabling complication.
This review will focus on how to evaluate, prevent, and treat cognitive impairment in patients who survive an ICU stay.
COGNITIVE IMPAIRMENT AFTER A STAY IN THE ICU
The association between ICU stay and neurocognitive dysfunction is poorly understood. Potential causes include hypoxemia,18 hypotension, 19 hyperglycemia,14 and—an area of growing interest and evolving research—sedation and delirium.20
Patients on mechanical ventilation are commonly given sedatives and analgesics to prevent anxiety and pain.21 However, these medications are strongly associated with delirium.22 In fact, recent studies found that benzodiazepines have an independent, dose-related, temporal association with delirium, with some reports describing a 20% increase in delirium per milligram of benzodiazepine.23 In another study, which included medical and surgical ICU patients, use of morphine was the strongest predictor of delirium, with a sixfold increase in odds over a period of 5 months.24
Delirium is important to prevent, diagnose, and treat, since it has a direct association with the development of long-term cognitive impairment.22,25 A review of studies that included 1,885 medical and surgical patients found that those who developed delirium during an ICU stay were three times more likely to have cognitive dysfunction when assessed 3 years later.20
Whether delirium is a primary disorder associated with cognitive impairment or if it only represents an underlying process leading to poor cognitive outcomes is unknown. As delirious patients are more likely to be older, to be mechanically ventilated, to require more sedation, and, in particular, to be sicker, the association between delirium and cognitive impairment may reflect the relationship between these risk factors and poor cognitive outcomes.26
Glucose and its relationship with cognitive function is another topic of investigation. A secondary analysis of a study that included ARDS survivors revealed that blood glucose values higher than 153 mg/dL, higher glucose variability, and duration of mechanical ventilation were associated with cognitive sequelae.27,28
Other studies focused on mechanical ventilation. In one study,29 one-third of patients who had been mechanically ventilated showed signs of neurocognitive impairment when they were evaluated 6 months after hospital discharge.
Mild cognitive impairment differs from cognitive impairment after an ICU stay
Cognitive impairment after ICU discharge does not follow the same pattern as mild cognitive impairment, and some authors consider these two types of cognitive impairment to be unrelated.
While mild cognitive impairment is progressive and associated with aging, cognitive impairment in ICU survivors develops rapidly after acute illness and is usually related to numerous pathologic and neurochemical pathways.
For example, the neurotransmitter acetylcholine is thought to be involved in cognitive function as well as neuroplasticity of the motor cortex. In a model of cognitive impairment after stroke, activity of the cholinergic system was reduced.30,31 Further, in a study in rats, Baskerville et al32 showed that experience-dependent plasticity could be completely blocked by damaging the cholinergic neurons in the nucleus basalis of Meynert, thereby affecting memory and other functions supported by this pathway.
Another implicated pathway involves dopamine. Of interest, dopamine augmentation has been shown to enhance simple motor memories and to improve procedural learning. Understanding of these neurochemical alterations opens opportunities for investigation of drug therapies.
ASSESSMENT TOOLS
Cognitive impairment is important to detect in ICU survivors because it predicts poor outcomes from rehabilitation. A study of stroke patients found that those with cognitive alterations immediately after the stroke were less likely to be discharged home or to be living at home 6 months after discharge.33
A possible explanation may be that affected patients cannot fully participate in rehabilitation activities, owing to impairment in executive function, inability to remember therapy instructions, or disruption of implicit and explicit learning. Indeed, some authors consider cognitive impairment after acquired brain injury to be the most relevant surrogate marker of rehabilitation potential. Consequently, manipulation or enhancement of cognition may directly affect rehabilitation outcomes.34
Disagreement about terminology and diagnostic criteria creates a problem for health care providers working with patients with potential cognitive impairment. Numerous systems have been proposed to define this condition; in fact, Stephan et al35 reviewed the literature and found no fewer than 17. None of them is specific for cognitive impairment after an ICU stay.
Petersen et al36 in 1999 proposed initial criteria for mild cognitive impairment that included the following:
- A memory complaint
- Normal general cognitive functioning
- Normal activities of daily living
- Memory impairment in relation to age and education
- No dementia.
Later, other areas of impairment besides memory were recognized, such as language, attention, perception, reasoning, and motor planning.37 Therefore, mild cognitive impairment is currently classified into subtypes, which include amnestic (affecting single or multiple domains) and nonamnestic (also affecting single or multiple domains).38
In clinical practice, impairment of specific cognitive domains may be challenging to detect, and neuropsychological testing is often needed. Cognitive screening tests can detect impairment across a restricted range of cognitive abilities, while more comprehensive assessments address each of the primary domains of cognition.39 Formal testing provides normative and validated data on cognition performance and severity.
The Montreal Cognitive Assessment40 is popular, comprehensive, used in a variety of professions in diverse types of facilities (acute care, rehabilitation, and skilled care facilities), and brief (taking 11 minutes to administer). It evaluates orientation, memory, language, attention, reasoning, and visual-constructional abilities. The maximum score is 30; cognitive impairment is defined as a score of less than 26. It has a sensitivity of 90% and a specificity of 87%.
The Folstein Mini-Mental State Examination (MMSE) is the most commonly used of the noncomprehensive tests in clinical practice.41 It assesses orientation, memory, language, attention, and praxis. It has a maximum score of 30 points; the cutoff score for cognitive impairment is 24 points or less.
A limitation of the MMSE is that its sensitivity is very low, ranging from 1% to 49%.42,43 The MMSE scores of patients with cognitive impairment overlap considerably with those of age-matched healthy controls.39 Conversely, the MMSE’s specificity is usually high, ranging from 85% to 100%.42
Moreover, the MMSE poses copyright issues, an important consideration when selecting a test. In 2001, the authors of the MMSE transferred all intellectual property rights to Psychological Assessment Resources, which has exclusive rights to publish, license, and manage all intellectual property rights in all media and languages. Photocopying and using the MMSE without applying for permission from and paying this company ($1.23 per use) constitutes copyright infringement. Therefore, health care providers and researchers have been using other tests to evaluate cognition.
Other tests of cognition assess individual domains. Interestingly, studies of long-term cognitive impairment after ICU admission used these tests to define outcomes.25 Specific tests include:
- The Digit Span and the Trailmaking Test A (used to assess attention and orientation)25
- The Rey Auditory Verbal Learning Test (used to evaluate verbal memory)
- The Complex Figure Test (helpful in defining visual-spatial construction and delayed visual memory)
- The Trailmaking Test B (also included in the Montreal Cognitive Assessment; assesses executive functioning).
Besides formal testing, an informal battery is often recommended to provide additional information. An informal evaluation includes word definition, reading and verbal fluency, reading comprehension, and performance of instrumental activities of daily living. Observing as patients perform tasks of daily living provides therapists with a vast amount of information, as these tasks require using multiple cognitive processes. Therefore, if a functional breakdown occurs during this assessment, the clinician needs to identify the domain or specific level of cognitive dysfunction involved in that deficit.44
PREVENTIVE STRATEGIES
Strategies for minimizing the long-term effects of cognitive impairment have mostly focused on preventing it.
During the ICU stay, optimizing hemodynamic, glucose, and oxygenation levels may prevent future long-term complications.18
Also, the association between sedation, delirium, and consequent cognitive impairment (see above) has led many investigators to apply the “ABCDE” bundle of strategies.25,45,46 Specifically, ABCDE stands for awakening and breathing, choice of sedatives with fewer adverse effects, daily delirium monitoring, and early mobility exercise. These strategies have been shown in randomized controlled trials to prevent delirium; however, they have not been proved to prevent cognitive impairment.
Awakening and breathing
In the Awakening and Breathing Controlled Trial,47 patients in the intervention group (ie, those who had their sedatives interrupted every morning to see if they would awaken, and if so, if they could breathe on their own) were extubated 3 days sooner than those in the control group (who underwent daily trials of spontaneous breathing, if deemed safe). Also, ICU and hospital length of stay were shorter by 4 days. Best of all, over 1 year, the mortality rate was lower by 14 absolute percentage points.
Choice of sedatives
Often, mechanically ventilated patients are given benzodiazepines, opiates, and propofol (Diprivan).21 Dexmedetomidine (Precedex), a newer agent, is an alpha-2 agonist and may offer advantages over the others.
To date, three randomized controlled trials have assessed the effect of dexmedetomidine in terms of outcomes associated with delirium, and one trial evaluated its association with intellectual capacity in ICU patients.
The Maximizing Efficacy of Targeted Sedation and Reducing Neurological Dysfunction (MENDS) trial randomized patients on mechanical ventilation to receive either dexmedetomidine or lorazepam (Ativan).48 Dexmedetomidine-treated patients had 4 more days alive without delirium or coma (7 vs 3 days, P = .01).
Subsequently, the Safety and Efficacy of Dexmedetomidine Compared With Midazolam (SEDCOM) trial compared dexmedetomidine and midazolam (Versed) in mechanically ventilated patients. Those who received dexmedetomidine had a lower incidence of delirium (54% vs 76%, P < .001), and 2 fewer days on mechanical ventilation.49
Reade et al50 evaluated time to extubation in already delirious patients randomized to receive either dexmedetomidine or haloperidol (Haldol). Those receiving dexmedetomidine had a shorter time to extubation as well as a shorter ICU length of stay.
The Acute Neuroscience Intensive Care Sedation Trial51 evaluated intellectual capacity in neurological ICU patients sedated with either dexmedetomidine or propofol. This randomized, double-blind trial included 18 brain-injured and 12 non-brain-injured intubated patients. In a crossover protocol, each received the combination of fentanyl (Sublimaze) and propofol and the combination of fentanyl and dexmedetomidine.
Cognition was evaluated using the Adapted Cognitive Exam (ACE), which assesses intellectual capacity through orientation, language, registration, attention, calculation, and recall. This 10-minute examination does not require verbal communication, as it relies on the ability to respond to yes-or-no questions and perform simple motor tasks. The maximum possible score is 100 points.
Interestingly, while on propofol, the patients’ adjusted ACE scores went down by a mean of 12.4 points, whereas they went up by 6.8 points while on dexmedetomidine. Even though brain-injured patients required less sedation than non-brain-injured patients, the effect of dexmedetomidine and propofol did not change.51
In summary, these studies suggest that all sedatives are not the same in their short-term and intermediate-term outcomes.
In our practice, we use dexmedetomidine as our first-line sedation therapy. In patients with hemodynamic instability, we use benzodiazepines. We reserve propofol for very short periods of intubation or for hemodynamically stable patients who cannot be sedated with dexmedetomidine.
Daily delirium monitoring
As mentioned above, delirium affects many patients on mechanical ventilation, and it is highly underrecognized if valid tests are not used.52 Therefore, it is critically important to be familiar with the tests for assessing delirium. Of these, the Confusion Assessment Method for the ICU is probably the one with the best performance, with a sensitivity of 93% to 100% and a specificity of 98% to 100%.53,54
Early mobilization
A landmark study paired the awakening and breathing strategy with early mobilization through physical and occupational therapy in the ICU.55 Patients in the intervention group had a higher rate of return to independent functional status upon hospital discharge and a shorter duration of mechanical ventilation and delirium.
In conclusion, even though direct prevention of cognitive dysfunction is a challenging task, the ABCDE approach targets individual risk factors for delirium, which is an important contributor to cognitive impairment. Whether the ABCDE bundle directly affects the development of cognitive impairment requires further investigation.
COGNITIVE THERAPIES
The cognition-focused intervention most often described is cognitive training. Cognitive training is delivered in individual or group sessions in which the patient practices tasks targeting different domains, such as memory, language, and attention. Outcomes are often assessed in terms of improvement in test scores or effects on everyday functioning. Unfortunately, because of heterogeneity among cognitive training interventions and studied populations, we cannot yet make strong evidence-based recommendations for clinical practice.
Martin et al56 in 2011 reviewed cognition-based interventions for healthy older people and people with mild cognitive impairment and found 36 relevant studies. Of these, only 3 were in patients with mild cognitive impairment, while the rest were in healthy older people.56–58 Overall, the only available data were related to the memory domain, and outcomes were mostly associated with immediate recall of words, paragraphs, and stories. Based on this, cognitive therapy is currently considered justified, as most patients with cognitive impairment after an ICU stay have memory problems.
Zelinski et al59 conducted a randomized, controlled, double-blind study comparing outcomes in an intervention group that underwent a computerized cognitive training program with those in a control group that viewed videos on a variety of topics such as literature, art, and history. The intervention, based on brain plasticity, aimed to improve the speed and accuracy of auditory information processing and to engage neuromodulatory systems. Some of the secondary outcomes favored the intervention group. These outcomes were related mostly to measures of overall memory, such as immediate and delayed recall, but also to a composite outcome that included letter-number sequencing and the digit span backwards test.
Despite these encouraging results, it is worth mentioning that these studies were not performed in patients with cognitive impairment associated with ICU admission. Therefore, the applicability and effectiveness of such therapies in post-ICU patients remains unknown.
Patients with posttraumatic brain injury and stroke have also been extensively studied in regard to the development of cognitive impairment.34 These patients probably represent a better standard for comparison, as their cognitive impairment does not necessarily progress.
The effect of cognitive rehabilitation on the recovery in these patients depends on adaptation and remediation. Adaptation describes a patient’s ability to compensate for functional impairment.34 This can be divided into internal and external adaptation. Internal adaptation requires the patient to recognize his or her cognitive limitation in order to adapt the to the environment accordingly. External adaptation entails getting help from devices or relatives (eg, phone calls) to achieve desired goals (eg, taking medication at scheduled times). Again, to adapt, the patient needs to be able to recognize his or her affected cognitive domain. Unfortunately, this is not always the case.
Remediation refers to the actual regaining of a lost ability. To stimulate neural plasticity, the patient is required to experience and repeat targeted skill-building activities.38 There is evidence that patients are more likely to regain lost ability by repeating the practice frequently during a short period of time.60
From the physician’s perspective, evaluating and identifying deficits in particular cognitive domains may help in designing a remediation plan in partnership with a cognitive therapist.
Cognitive rehabilitation in ICU survivors
The Returning to Everyday Tasks Utilizing Rehabilitation Networks (RETURN) study focused on cognitive and physical rehabilitation in post-ICU patients.61 This pilot study included 21 ICU survivors with cognitive or functional impairment at hospital discharge. Eight patients received usual care and 13 received a combination of in-home cognitive, physical, and functional rehabilitation over a 3-month period with a social worker or a master’s-level psychology technician.
Interventions included six in-person visits for cognitive rehabilitation and six televisits for physical and functional rehabilitation. Cognitive training was based on the goal-management training (GMT) protocol.62 This strategy attempts to improve executive function by increasing goal-directed behavior and by helping patients learn to be reflective before making decisions and executing tasks. The GMT model consists of sessions that build on one another to increase the rehabilitation intensity. During each session, goals are explained and participants perform increasingly challenging cognitive tasks.
Cognitive outcomes were evaluated using the Delis-Kaplan Tower Test to evaluate executive function by assessing the ability to plan and strategize efficiently. The patient is required to move disks across three pegs until a tower is built. The object is to use the fewest moves possible while adhering to two rules: larger disks cannot be placed on top of smaller ones, and disks must be moved one at a time, using only one hand.
At 3 months there was a significant difference between groups, with the intervention group earning higher tower test scores than controls did (median of 13 vs 7.5).
The Activity and Cognitive Therapy in the Intensive Care Unit (ACT-ICU) trial is another pilot study that will attempt to assess the feasibility of early cognitive rehabilitation in ICU survivors. This study will combine early mobilization with a cognitive intervention, and its primary outcome is executive function (with the tower test) at 3 months after discharge.63
DRUG THERAPY
Some medications have been tested to assess whether they reduce the risk of progression from adult traumatic brain injury to cognitive impairment. These drugs augment dopamine and acetylcholine activity.
Methylphenidate (Ritalin), a dopaminergic drug, was studied in two trials. The first was a double-blind trial in 18 patients with posttraumatic brain injury. Memory was found to improve, based on the Working Memory Task Test. However, due to the small number of participants, no further conclusions were obtained.64
The second trial, in 19 patients with posttraumatic brain injury, had a double-blind crossover design. Attention, evaluated by the Distraction Task Test, improved with the use of methylphenidate.65 Again, the small number of patients precludes generalization of these results.
Donepezil (Aricept), a cholinergic drug, was evaluated in four clinical trials in posttraumatic brain injury patients66–69; each trial included 21 to 180 patients. The trials evaluated the drug’s effect on memory and attention through a variety of tools (Paced Auditory Serial Addition Test; Wechsler Memory Scale; Boston Naming Test; Rey Auditory Verbal Learning Test; Complex Figure Test; and Reaction Time–Dual Task). Interestingly, donepezil was associated with large improvements in objective assessments of attention and memory. Despite methodologic flaws, such as a lack of blinding in one of these studies69 and an open-label design in two of them,66,68 of the drugs available, donepezil presents the strongest evidence for use in cognitive impairment after traumatic brain injury.70
- Diaz-Guzman E, Sanchez J, Arroliga AC. Update in intensive care medicine: studies that challenged our practice in the last 5 years. Cleve Clin J Med 2011; 78:665–674.
- Acute Respiratory Distress Syndrome Network. Ventilation with lower tidal volumes as compared with traditional tidal volumes for acute lung injury and the acute respiratory distress syndrome. N Engl J Med 2000; 342:1301–1308.
- Rivers E, Nguyen B, Havstad S, et al. Early goal-directed therapy in the treatment of severe sepsis and septic shock. N Engl J Med 2001; 345:1368–1377.
- Oeyen SG, Vandijck DM, Benoit DD, Annemans L, Decruyenaere JM. Quality of life after intensive care: a systematic review of the literature. Crit Care Med 2010; 38:2386–2400.
- Needham DM, Davidson J, Cohen H, et al. Improving long-term outcomes after discharge from intensive care unit: report from a stakeholders’ conference. Crit Care Med 2012; 40:502–509.
- Herridge MS, Cheung AM, Tansey CM, et al. One-year outcomes in survivors of the acute respiratory distress syndrome. N Engl J Med 2003; 348:683–693.
- Herridge MS, Tansey CM, Matte A, et al. Functional disability 5 years after acute respiratory distress syndrome. N Engl J Med 2011; 364:1293–1304.
- Timmers TK, Verhofstad MH, Moons KG, van Beeck EF, Leenen LP. Long-term quality of life after surgical intensive care admission. Arch Surg 2011; 146:412–418.
- Michaels AJ, Michaels CE, Moon CH, et al. Posttraumatic stress disorder after injury: impact on general health outcome and early risk assessment. J Trauma 1999; 47:460–466; discussion466–467.
- Stoll C, Schelling G, Goetz AE, et al. Health-related quality of life and post-traumatic stress disorder in patients after cardiac surgery and intensive care treatment. J Thorac Cardiovasc Surg 2000; 120:505–512.
- Jones C, Skirrow P, Griffiths RD, et al Post-traumatic stress disorder-related symptoms in relatives of patients following intensive care. Intensive Care Med 2004; 30:456–460.
- Griffiths J, Gager M, Alder N, Fawcett D, Waldmann C, Quinlan J. A self-report-based study of the incidence and associations of sexual dysfunction in survivors of intensive care treatment. Intensive Care Med 2006; 32:445–451.
- Griffiths J, Waldmann C, Quinlan J. Sexual dysfunction in intensive care survivors. Br J Hosp Med (Lond) 2007; 68:470–473.
- Hopkins RO, Jackson JC. Long-term neurocognitive function after critical illness. Chest 2006; 130:869–878.
- Hopkins RO, Weaver LK, Collingridge D, Parkinson RB, Chan KJ, Orme JF. Two-year cognitive, emotional, and quality-of-life outcomes in acute respiratory distress syndrome. Am J Respir Crit Care Med 2005; 171:340–347.
- Rothenhausler HB, Ehrentraut S, Stoll C, Schelling G, Kapfhammer HP. The relationship between cognitive performance and employment and health status in long-term survivors of the acute respiratory distress syndrome: results of an exploratory study. Gen Hosp Psychiatry 2001; 23:90–96.
- Sukantarat KT, Burgess PW, Williamson RC, Brett SJ. Prolonged cognitive dysfunction in survivors of critical illness. Anaesthesia 2005; 60:847–853.
- Hopkins RO, Weaver LK, Pope D, Orme JF, Bigler ED, Larson LV. Neuropsychological sequelae and impaired health status in survivors of severe acute respiratory distress syndrome. Am J Respir Crit Care Med 1999; 160:50–56.
- Hopkins RO, Weaver LK, Chan KJ, Orme JF. Quality of life, emotional, and cognitive function following acute respiratory distress syndrome. J Int Neuropsychol Soc 2004; 10:1005–1017.
- Jackson JC, Gordon SM, Hart RP, Hopkins RO, Ely EW. The association between delirium and cognitive decline: a review of the empirical literature. Neuropsychol Rev 2004; 14:87–98.
- Arroliga AC, Thompson BT, Ancukiewicz M, et al. Use of sedatives, opioids, and neuromuscular blocking agents in patients with acute lung injury and acute respiratory distress syndrome. Crit Care Med 2008; 36:1083–1088.
- Miller RR, Ely EW. Delirium and cognitive dysfunction in the intensive care unit. Semin Respir Crit Care Med 2006; 27:210–220.
- Pandharipande P, Shintani A, Peterson J, et al. Lorazepam is an independent risk factor for transitioning to delirium in intensive care unit patients. Anesthesiology 2006; 104:21–26.
- Dubois MJ, Bergeron N, Dumont M, Dial S, Skrobik Y. Delirium in an intensive care unit: a study of risk factors. Intensive Care Med 2001; 27:1297–1304.
- Girard TD, Jackson JC, Pandharipande PP, et al. Delirium as a predictor of long-term cognitive impairment in survivors of critical illness. Crit Care Med 2010; 38:1513–1520.
- Miller RR, Ely EW. Delirium and cognitive dysfunction in the intensive care unit. Curr Psychiatry Rep 2007; 9:26–34.
- Hopkins RO, Suchyta MR, Snow GL, Jephson A, Weaver LK, Orme JF. Blood glucose dysregulation and cognitive outcome in ARDS survivors. Brain Inj 2010; 24:1478–1484.
- Hough CL, Herridge MS. Long-term outcome after acute lung injury. Curr Opin Crit Care 2012; 18:8–15.
- Jackson JC, Hart RP, Gordon SM, et al. Six-month neuropsychological outcome of medical intensive care unit patients. Crit Care Med 2003; 31:1226–1234.
- Court JA, Perry EK. Neurotransmitter abnormalities in vascular dementia. Int Psychogeriatr 2003; 15(suppl 1):81–87.
- Gottfries CG, Blennow K, Karlsson I, Wallin A. The neurochemistry of vascular dementia. Dementia 1994; 5:163–167.
- Baskerville KA, Schweitzer JB, Herron P. Effects of cholinergic depletion on experience-dependent plasticity in the cortex of the rat. Neuroscience 1997; 80:1159–1169.
- Henon H, Lebert F, Durieu I, et al. Confusional state in stroke: relation to preexisting dementia, patient characteristics, and outcome. Stroke 1999; 30:773–779.
- Whyte E, Skidmore E, Aizenstein H, Ricker J, Butters M. Cognitive impairment in acquired brain injury: a predictor of rehabilitation outcomes and an opportunity for novel interventions. PMR 2011; 3(suppl 1):S45–S51.
- Stephan BC, Matthews FE, McKeith IG, Bond J, Brayne C. Early cognitive change in the general population: how do different definitions work? J Am Geriatr Soc 2007; 55:1534–1540.
- Petersen RC, Smith GE, Waring SC, Ivnik RJ, Tangalos EG, Kokmen E. Mild cognitive impairment: clinical characterization and outcome. Arch Neurol 1999; 56:303–308.
- Palmer K, Fratiglioni L, Winblad B. What is mild cognitive impairment? Variations in definitions and evolution of nondemented persons with cognitive impairment. Acta Neurol Scand Suppl 2003; 179:14–20.
- Petersen RC. Mild cognitive impairment as a diagnostic entity. J Intern Med 2004; 256:183–194.
- Lonie JA, Tierney KM, Ebmeier KP. Screening for mild cognitive impairment: a systematic review. Int J Geriatr Psychiatry 2009; 24:902–915.
- Nasreddine ZS, Phillips NA, Bedirian V, et al. The Montreal Cognitive Assessment, MoCA: a brief screening tool for mild cognitive impairment. J Am Geriatr Soc 2005; 53:695–699.
- Folstein MF, Folstein SE, McHugh PR. “Mini-mental state.” A practical method for grading the cognitive state of patients for the clinician. J Psychiatr Res 1975; 12:189–198.
- Sager MA, Hermann BP, La Rue A, Woodard JL. Screening for dementia in community-based memory clinics. WMJ 2006; 105:25–29.
- Ravaglia G, Forti P, Maioli F, et al. Screening for mild cognitive impairment in elderly ambulatory patients with cognitive complaints. Aging Clin Exp Res 2005; 17:374–379.
- Vogenthaler DR. An overview of head injury: its consequences and rehabilitation. Brain Inj 1987; 1:113–127.
- van den Boogaard M, Schoonhoven L, Evers AW, van der Hoeven JG, van Achterberg T, Pickkers P. Delirium in critically ill patients: impact on long-term health-related quality of life and cognitive functioning. Crit Care Med 2012; 40:112–118.
- Morandi A, Brummel NE, Ely EW. Sedation, delirium and mechanical ventilation: the ‘ABCDE’ approach. Curr Opin Crit Care 2011; 17:43–49.
- Girard TD, Kress JP, Fuchs BD, et al. Efficacy and safety of a paired sedation and ventilator weaning protocol for mechanically ventilated patients in intensive care (Awakening and Breathing Controlled trial): a randomised controlled trial. Lancet 2008; 371:126–134.
- Pandharipande PP, Pun BT, Herr DL, et al. Effect of sedation with dexmedetomidine vs lorazepam on acute brain dysfunction in mechanically ventilated patients: the MENDS randomized controlled trial. JAMA 2007; 298:2644–2653.
- Riker RR, Shehabi Y, Bokesch PM, et al. Dexmedetomidine vs midazolam for sedation of critically ill patients: a randomized trial. JAMA 2009; 301:489–499.
- Reade MC, O’Sullivan K, Bates S, Goldsmith D, Ainslie WR, Bellomo R. Dexmedetomidine vs. haloperidol in delirious, agitated, intubated patients: a randomised open-label trial. Crit Care 2009; 13:R75.
- Mirski MA, Lewin JJ, Ledroux S, et al. Cognitive improvement during continuous sedation in critically ill, awake and responsive patients: the Acute Neurological ICU Sedation Trial (ANIST). Intensive Care Med 2010; 36:1505–1513.
- Spronk PE, Riekerk B, Hofhuis J, Rommes JH. Occurrence of delirium is severely underestimated in the ICU during daily care. Intensive Care Med 2009; 35:1276–1280.
- Ely EW, Inouye SK, Bernard GR, et al. Delirium in mechanically ventilated patients: validity and reliability of the confusion assessment method for the intensive care unit (CAM-ICU). JAMA 2001; 286:2703–2710.
- Luetz A, Heymann A, Radtke FM, et al. Different assessment tools for intensive care unit delirium: which score to use? Crit Care Med 2010; 38:409–418.
- Schweickert WD, Pohlman MC, Pohlman AS, et al. Early physical and occupational therapy in mechanically ventilated, critically ill patients: a randomised controlled trial. Lancet 2009; 373:1874–1882.
- Martin M, Clare L, Altgassen AM, Cameron MH, Zehnder F. Cognition-based interventions for healthy older people and people with mild cognitive impairment. Cochrane Database Syst Rev 2011(1):CD006220.
- Rozzini L, Costardi D, Chilovi BV, Franzoni S, Trabucchi M, Padovani A. Efficacy of cognitive rehabilitation in patients with mild cognitive impairment treated with cholinesterase inhibitors. Int J Geriatr Psychiatry 2007; 22:356–360.
- Jean L, Bergeron ME, Thivierge S, Simard M. Cognitive intervention programs for individuals with mild cognitive impairment: systematic review of the literature. Am J Geriatr Psychiatry 2010; 18:281–296.
- Zelinski EM, Spina LM, Yaffe K, et al. Improvement in memory with plasticity-based adaptive cognitive training: results of the 3-month follow-up. J Am Geriatr Soc 2011; 59:258–265.
- Cicerone KD, Dahlberg C, Malec JF, et al. Evidence-based cognitive rehabilitation: updated review of the literature from 1998 through 2002. Arch Phys Med Rehabil 2005; 86:1681–1692.
- Jackson JC, Ely EW, Morey MC, et al. Cognitive and physical rehabilitation of intensive care unit survivors: results of the RETURN randomized controlled pilot investigation. Crit Care Med 2012; 40:1088–1097.
- Levine B, Stuss DT, Winocur G, et al. Cognitive rehabilitation in the elderly: effects on strategic behavior in relation to goal management. J Int Neuropsychol Soc 2007; 13:143–152.
- ACT-ICU Study: Activity and Cognitive Therapy in the Intensive Care Unit. http://clinicaltrials.gov/ct2/show/NCT01270269. Accessed August 9, 2012.
- Kim YH, Ko MH, Na SY, Park SH, Kim KW. Effects of single-dose methylphenidate on cognitive performance in patients with traumatic brain injury: a double-blind placebo-controlled study. Clin Rehabil 2006; 20:24–30.
- Whyte J, Hart T, Schuster K, Fleming M, Polansky M, Coslett HB. Effects of methylphenidate on attentional function after traumatic brain injury. A randomized, placebo-controlled trial. Am J Phys Med Rehabil 1997; 76:440–450.
- Masanic CA, Bayley MT, VanReekum R, Simard M. Open-label study of donepezil in traumatic brain injury. Arch Phys Med Rehabil 2001; 82:896–901.
- Zhang L, Plotkin RC, Wang G, Sandel ME, Lee S. Cholinergic augmentation with donepezil enhances recovery in short-term memory and sustained attention after traumatic brain injury. Arch Phys Med Rehabil 2004; 85:1050–1055.
- Khateb A, Ammann J, Annoni JM, Diserens K. Cognition-enhancing effects of donepezil in traumatic brain injury. Eur Neurol 2005; 54:39–45.
- Kim YW, Kim DY, Shin JC, Park CI, Lee JD. The changes of cortical metabolism associated with the clinical response to donepezil therapy in traumatic brain injury. Clin Neuropharmacol 2009; 32:63–68.
- Wheaton P, Mathias JL, Vink R. Impact of pharmacological treatments on cognitive and behavioral outcome in the postacute stages of adult traumatic brain injury: a meta-analysis. J Clin Psychopharmacol 2011; 31:745–757.
Intensive care medicine has dramatically evolved over the last 15 years, after reports from many landmark trials.1 Updated strategies for mechanical ventilation2 and “bundles” of strategies to optimize hemodynamic therapy3 have reduced the rates of morbidity and death from deadly critical conditions such as the adult respiratory distress syndrome (ARDS) and sepsis.
Despite these important improvements in short-term outcomes, it is increasingly recognized that intensive care unit (ICU) survivors suffer considerable long-term complications that affect their usual functioning.4 Recently, the Society of Critical Care Medicine convened a conference in which these long-term complications were named the “post-intensive care syndrome.”5
Quality of life, particularly its physical component, is considerably lower after a stay in the medical or surgical ICU.6–8 Posttraumatic stress disorder, depression, and sexual dysfunction are consistently reported years after ICU discharge.9–13
Perhaps the most frequently unrecognized complication in ICU survivors is cognitive impairment. Current data suggest that neurocognitive impairment after an ICU stay is common and that it persists 6 years or more after hospital discharge.
Hopkins et al14,15 analyzed 10 cohort studies of long-term cognitive impairment after an ICU stay; 5 of them focused on patients with ARDS. The prevalence of cognitive impairment was as high as 78% at hospital discharge, 46% at 1 year, and 25% 6 years after discharge.15,16 Of the cognitive domains compromised, memory was the most often affected, followed by executive function and attention.14,17
Interestingly, data suggest that cognition may improve somewhat in the first 6 to 12 months after ICU discharge.15 Therefore, if we can detect it early on and promptly refer patients for cognitive therapy, we may eventually improve the prognosis of this disabling complication.
This review will focus on how to evaluate, prevent, and treat cognitive impairment in patients who survive an ICU stay.
COGNITIVE IMPAIRMENT AFTER A STAY IN THE ICU
The association between ICU stay and neurocognitive dysfunction is poorly understood. Potential causes include hypoxemia,18 hypotension, 19 hyperglycemia,14 and—an area of growing interest and evolving research—sedation and delirium.20
Patients on mechanical ventilation are commonly given sedatives and analgesics to prevent anxiety and pain.21 However, these medications are strongly associated with delirium.22 In fact, recent studies found that benzodiazepines have an independent, dose-related, temporal association with delirium, with some reports describing a 20% increase in delirium per milligram of benzodiazepine.23 In another study, which included medical and surgical ICU patients, use of morphine was the strongest predictor of delirium, with a sixfold increase in odds over a period of 5 months.24
Delirium is important to prevent, diagnose, and treat, since it has a direct association with the development of long-term cognitive impairment.22,25 A review of studies that included 1,885 medical and surgical patients found that those who developed delirium during an ICU stay were three times more likely to have cognitive dysfunction when assessed 3 years later.20
Whether delirium is a primary disorder associated with cognitive impairment or if it only represents an underlying process leading to poor cognitive outcomes is unknown. As delirious patients are more likely to be older, to be mechanically ventilated, to require more sedation, and, in particular, to be sicker, the association between delirium and cognitive impairment may reflect the relationship between these risk factors and poor cognitive outcomes.26
Glucose and its relationship with cognitive function is another topic of investigation. A secondary analysis of a study that included ARDS survivors revealed that blood glucose values higher than 153 mg/dL, higher glucose variability, and duration of mechanical ventilation were associated with cognitive sequelae.27,28
Other studies focused on mechanical ventilation. In one study,29 one-third of patients who had been mechanically ventilated showed signs of neurocognitive impairment when they were evaluated 6 months after hospital discharge.
Mild cognitive impairment differs from cognitive impairment after an ICU stay
Cognitive impairment after ICU discharge does not follow the same pattern as mild cognitive impairment, and some authors consider these two types of cognitive impairment to be unrelated.
While mild cognitive impairment is progressive and associated with aging, cognitive impairment in ICU survivors develops rapidly after acute illness and is usually related to numerous pathologic and neurochemical pathways.
For example, the neurotransmitter acetylcholine is thought to be involved in cognitive function as well as neuroplasticity of the motor cortex. In a model of cognitive impairment after stroke, activity of the cholinergic system was reduced.30,31 Further, in a study in rats, Baskerville et al32 showed that experience-dependent plasticity could be completely blocked by damaging the cholinergic neurons in the nucleus basalis of Meynert, thereby affecting memory and other functions supported by this pathway.
Another implicated pathway involves dopamine. Of interest, dopamine augmentation has been shown to enhance simple motor memories and to improve procedural learning. Understanding of these neurochemical alterations opens opportunities for investigation of drug therapies.
ASSESSMENT TOOLS
Cognitive impairment is important to detect in ICU survivors because it predicts poor outcomes from rehabilitation. A study of stroke patients found that those with cognitive alterations immediately after the stroke were less likely to be discharged home or to be living at home 6 months after discharge.33
A possible explanation may be that affected patients cannot fully participate in rehabilitation activities, owing to impairment in executive function, inability to remember therapy instructions, or disruption of implicit and explicit learning. Indeed, some authors consider cognitive impairment after acquired brain injury to be the most relevant surrogate marker of rehabilitation potential. Consequently, manipulation or enhancement of cognition may directly affect rehabilitation outcomes.34
Disagreement about terminology and diagnostic criteria creates a problem for health care providers working with patients with potential cognitive impairment. Numerous systems have been proposed to define this condition; in fact, Stephan et al35 reviewed the literature and found no fewer than 17. None of them is specific for cognitive impairment after an ICU stay.
Petersen et al36 in 1999 proposed initial criteria for mild cognitive impairment that included the following:
- A memory complaint
- Normal general cognitive functioning
- Normal activities of daily living
- Memory impairment in relation to age and education
- No dementia.
Later, other areas of impairment besides memory were recognized, such as language, attention, perception, reasoning, and motor planning.37 Therefore, mild cognitive impairment is currently classified into subtypes, which include amnestic (affecting single or multiple domains) and nonamnestic (also affecting single or multiple domains).38
In clinical practice, impairment of specific cognitive domains may be challenging to detect, and neuropsychological testing is often needed. Cognitive screening tests can detect impairment across a restricted range of cognitive abilities, while more comprehensive assessments address each of the primary domains of cognition.39 Formal testing provides normative and validated data on cognition performance and severity.
The Montreal Cognitive Assessment40 is popular, comprehensive, used in a variety of professions in diverse types of facilities (acute care, rehabilitation, and skilled care facilities), and brief (taking 11 minutes to administer). It evaluates orientation, memory, language, attention, reasoning, and visual-constructional abilities. The maximum score is 30; cognitive impairment is defined as a score of less than 26. It has a sensitivity of 90% and a specificity of 87%.
The Folstein Mini-Mental State Examination (MMSE) is the most commonly used of the noncomprehensive tests in clinical practice.41 It assesses orientation, memory, language, attention, and praxis. It has a maximum score of 30 points; the cutoff score for cognitive impairment is 24 points or less.
A limitation of the MMSE is that its sensitivity is very low, ranging from 1% to 49%.42,43 The MMSE scores of patients with cognitive impairment overlap considerably with those of age-matched healthy controls.39 Conversely, the MMSE’s specificity is usually high, ranging from 85% to 100%.42
Moreover, the MMSE poses copyright issues, an important consideration when selecting a test. In 2001, the authors of the MMSE transferred all intellectual property rights to Psychological Assessment Resources, which has exclusive rights to publish, license, and manage all intellectual property rights in all media and languages. Photocopying and using the MMSE without applying for permission from and paying this company ($1.23 per use) constitutes copyright infringement. Therefore, health care providers and researchers have been using other tests to evaluate cognition.
Other tests of cognition assess individual domains. Interestingly, studies of long-term cognitive impairment after ICU admission used these tests to define outcomes.25 Specific tests include:
- The Digit Span and the Trailmaking Test A (used to assess attention and orientation)25
- The Rey Auditory Verbal Learning Test (used to evaluate verbal memory)
- The Complex Figure Test (helpful in defining visual-spatial construction and delayed visual memory)
- The Trailmaking Test B (also included in the Montreal Cognitive Assessment; assesses executive functioning).
Besides formal testing, an informal battery is often recommended to provide additional information. An informal evaluation includes word definition, reading and verbal fluency, reading comprehension, and performance of instrumental activities of daily living. Observing as patients perform tasks of daily living provides therapists with a vast amount of information, as these tasks require using multiple cognitive processes. Therefore, if a functional breakdown occurs during this assessment, the clinician needs to identify the domain or specific level of cognitive dysfunction involved in that deficit.44
PREVENTIVE STRATEGIES
Strategies for minimizing the long-term effects of cognitive impairment have mostly focused on preventing it.
During the ICU stay, optimizing hemodynamic, glucose, and oxygenation levels may prevent future long-term complications.18
Also, the association between sedation, delirium, and consequent cognitive impairment (see above) has led many investigators to apply the “ABCDE” bundle of strategies.25,45,46 Specifically, ABCDE stands for awakening and breathing, choice of sedatives with fewer adverse effects, daily delirium monitoring, and early mobility exercise. These strategies have been shown in randomized controlled trials to prevent delirium; however, they have not been proved to prevent cognitive impairment.
Awakening and breathing
In the Awakening and Breathing Controlled Trial,47 patients in the intervention group (ie, those who had their sedatives interrupted every morning to see if they would awaken, and if so, if they could breathe on their own) were extubated 3 days sooner than those in the control group (who underwent daily trials of spontaneous breathing, if deemed safe). Also, ICU and hospital length of stay were shorter by 4 days. Best of all, over 1 year, the mortality rate was lower by 14 absolute percentage points.
Choice of sedatives
Often, mechanically ventilated patients are given benzodiazepines, opiates, and propofol (Diprivan).21 Dexmedetomidine (Precedex), a newer agent, is an alpha-2 agonist and may offer advantages over the others.
To date, three randomized controlled trials have assessed the effect of dexmedetomidine in terms of outcomes associated with delirium, and one trial evaluated its association with intellectual capacity in ICU patients.
The Maximizing Efficacy of Targeted Sedation and Reducing Neurological Dysfunction (MENDS) trial randomized patients on mechanical ventilation to receive either dexmedetomidine or lorazepam (Ativan).48 Dexmedetomidine-treated patients had 4 more days alive without delirium or coma (7 vs 3 days, P = .01).
Subsequently, the Safety and Efficacy of Dexmedetomidine Compared With Midazolam (SEDCOM) trial compared dexmedetomidine and midazolam (Versed) in mechanically ventilated patients. Those who received dexmedetomidine had a lower incidence of delirium (54% vs 76%, P < .001), and 2 fewer days on mechanical ventilation.49
Reade et al50 evaluated time to extubation in already delirious patients randomized to receive either dexmedetomidine or haloperidol (Haldol). Those receiving dexmedetomidine had a shorter time to extubation as well as a shorter ICU length of stay.
The Acute Neuroscience Intensive Care Sedation Trial51 evaluated intellectual capacity in neurological ICU patients sedated with either dexmedetomidine or propofol. This randomized, double-blind trial included 18 brain-injured and 12 non-brain-injured intubated patients. In a crossover protocol, each received the combination of fentanyl (Sublimaze) and propofol and the combination of fentanyl and dexmedetomidine.
Cognition was evaluated using the Adapted Cognitive Exam (ACE), which assesses intellectual capacity through orientation, language, registration, attention, calculation, and recall. This 10-minute examination does not require verbal communication, as it relies on the ability to respond to yes-or-no questions and perform simple motor tasks. The maximum possible score is 100 points.
Interestingly, while on propofol, the patients’ adjusted ACE scores went down by a mean of 12.4 points, whereas they went up by 6.8 points while on dexmedetomidine. Even though brain-injured patients required less sedation than non-brain-injured patients, the effect of dexmedetomidine and propofol did not change.51
In summary, these studies suggest that all sedatives are not the same in their short-term and intermediate-term outcomes.
In our practice, we use dexmedetomidine as our first-line sedation therapy. In patients with hemodynamic instability, we use benzodiazepines. We reserve propofol for very short periods of intubation or for hemodynamically stable patients who cannot be sedated with dexmedetomidine.
Daily delirium monitoring
As mentioned above, delirium affects many patients on mechanical ventilation, and it is highly underrecognized if valid tests are not used.52 Therefore, it is critically important to be familiar with the tests for assessing delirium. Of these, the Confusion Assessment Method for the ICU is probably the one with the best performance, with a sensitivity of 93% to 100% and a specificity of 98% to 100%.53,54
Early mobilization
A landmark study paired the awakening and breathing strategy with early mobilization through physical and occupational therapy in the ICU.55 Patients in the intervention group had a higher rate of return to independent functional status upon hospital discharge and a shorter duration of mechanical ventilation and delirium.
In conclusion, even though direct prevention of cognitive dysfunction is a challenging task, the ABCDE approach targets individual risk factors for delirium, which is an important contributor to cognitive impairment. Whether the ABCDE bundle directly affects the development of cognitive impairment requires further investigation.
COGNITIVE THERAPIES
The cognition-focused intervention most often described is cognitive training. Cognitive training is delivered in individual or group sessions in which the patient practices tasks targeting different domains, such as memory, language, and attention. Outcomes are often assessed in terms of improvement in test scores or effects on everyday functioning. Unfortunately, because of heterogeneity among cognitive training interventions and studied populations, we cannot yet make strong evidence-based recommendations for clinical practice.
Martin et al56 in 2011 reviewed cognition-based interventions for healthy older people and people with mild cognitive impairment and found 36 relevant studies. Of these, only 3 were in patients with mild cognitive impairment, while the rest were in healthy older people.56–58 Overall, the only available data were related to the memory domain, and outcomes were mostly associated with immediate recall of words, paragraphs, and stories. Based on this, cognitive therapy is currently considered justified, as most patients with cognitive impairment after an ICU stay have memory problems.
Zelinski et al59 conducted a randomized, controlled, double-blind study comparing outcomes in an intervention group that underwent a computerized cognitive training program with those in a control group that viewed videos on a variety of topics such as literature, art, and history. The intervention, based on brain plasticity, aimed to improve the speed and accuracy of auditory information processing and to engage neuromodulatory systems. Some of the secondary outcomes favored the intervention group. These outcomes were related mostly to measures of overall memory, such as immediate and delayed recall, but also to a composite outcome that included letter-number sequencing and the digit span backwards test.
Despite these encouraging results, it is worth mentioning that these studies were not performed in patients with cognitive impairment associated with ICU admission. Therefore, the applicability and effectiveness of such therapies in post-ICU patients remains unknown.
Patients with posttraumatic brain injury and stroke have also been extensively studied in regard to the development of cognitive impairment.34 These patients probably represent a better standard for comparison, as their cognitive impairment does not necessarily progress.
The effect of cognitive rehabilitation on the recovery in these patients depends on adaptation and remediation. Adaptation describes a patient’s ability to compensate for functional impairment.34 This can be divided into internal and external adaptation. Internal adaptation requires the patient to recognize his or her cognitive limitation in order to adapt the to the environment accordingly. External adaptation entails getting help from devices or relatives (eg, phone calls) to achieve desired goals (eg, taking medication at scheduled times). Again, to adapt, the patient needs to be able to recognize his or her affected cognitive domain. Unfortunately, this is not always the case.
Remediation refers to the actual regaining of a lost ability. To stimulate neural plasticity, the patient is required to experience and repeat targeted skill-building activities.38 There is evidence that patients are more likely to regain lost ability by repeating the practice frequently during a short period of time.60
From the physician’s perspective, evaluating and identifying deficits in particular cognitive domains may help in designing a remediation plan in partnership with a cognitive therapist.
Cognitive rehabilitation in ICU survivors
The Returning to Everyday Tasks Utilizing Rehabilitation Networks (RETURN) study focused on cognitive and physical rehabilitation in post-ICU patients.61 This pilot study included 21 ICU survivors with cognitive or functional impairment at hospital discharge. Eight patients received usual care and 13 received a combination of in-home cognitive, physical, and functional rehabilitation over a 3-month period with a social worker or a master’s-level psychology technician.
Interventions included six in-person visits for cognitive rehabilitation and six televisits for physical and functional rehabilitation. Cognitive training was based on the goal-management training (GMT) protocol.62 This strategy attempts to improve executive function by increasing goal-directed behavior and by helping patients learn to be reflective before making decisions and executing tasks. The GMT model consists of sessions that build on one another to increase the rehabilitation intensity. During each session, goals are explained and participants perform increasingly challenging cognitive tasks.
Cognitive outcomes were evaluated using the Delis-Kaplan Tower Test to evaluate executive function by assessing the ability to plan and strategize efficiently. The patient is required to move disks across three pegs until a tower is built. The object is to use the fewest moves possible while adhering to two rules: larger disks cannot be placed on top of smaller ones, and disks must be moved one at a time, using only one hand.
At 3 months there was a significant difference between groups, with the intervention group earning higher tower test scores than controls did (median of 13 vs 7.5).
The Activity and Cognitive Therapy in the Intensive Care Unit (ACT-ICU) trial is another pilot study that will attempt to assess the feasibility of early cognitive rehabilitation in ICU survivors. This study will combine early mobilization with a cognitive intervention, and its primary outcome is executive function (with the tower test) at 3 months after discharge.63
DRUG THERAPY
Some medications have been tested to assess whether they reduce the risk of progression from adult traumatic brain injury to cognitive impairment. These drugs augment dopamine and acetylcholine activity.
Methylphenidate (Ritalin), a dopaminergic drug, was studied in two trials. The first was a double-blind trial in 18 patients with posttraumatic brain injury. Memory was found to improve, based on the Working Memory Task Test. However, due to the small number of participants, no further conclusions were obtained.64
The second trial, in 19 patients with posttraumatic brain injury, had a double-blind crossover design. Attention, evaluated by the Distraction Task Test, improved with the use of methylphenidate.65 Again, the small number of patients precludes generalization of these results.
Donepezil (Aricept), a cholinergic drug, was evaluated in four clinical trials in posttraumatic brain injury patients66–69; each trial included 21 to 180 patients. The trials evaluated the drug’s effect on memory and attention through a variety of tools (Paced Auditory Serial Addition Test; Wechsler Memory Scale; Boston Naming Test; Rey Auditory Verbal Learning Test; Complex Figure Test; and Reaction Time–Dual Task). Interestingly, donepezil was associated with large improvements in objective assessments of attention and memory. Despite methodologic flaws, such as a lack of blinding in one of these studies69 and an open-label design in two of them,66,68 of the drugs available, donepezil presents the strongest evidence for use in cognitive impairment after traumatic brain injury.70
- Diaz-Guzman E, Sanchez J, Arroliga AC. Update in intensive care medicine: studies that challenged our practice in the last 5 years. Cleve Clin J Med 2011; 78:665–674.
- Acute Respiratory Distress Syndrome Network. Ventilation with lower tidal volumes as compared with traditional tidal volumes for acute lung injury and the acute respiratory distress syndrome. N Engl J Med 2000; 342:1301–1308.
- Rivers E, Nguyen B, Havstad S, et al. Early goal-directed therapy in the treatment of severe sepsis and septic shock. N Engl J Med 2001; 345:1368–1377.
- Oeyen SG, Vandijck DM, Benoit DD, Annemans L, Decruyenaere JM. Quality of life after intensive care: a systematic review of the literature. Crit Care Med 2010; 38:2386–2400.
- Needham DM, Davidson J, Cohen H, et al. Improving long-term outcomes after discharge from intensive care unit: report from a stakeholders’ conference. Crit Care Med 2012; 40:502–509.
- Herridge MS, Cheung AM, Tansey CM, et al. One-year outcomes in survivors of the acute respiratory distress syndrome. N Engl J Med 2003; 348:683–693.
- Herridge MS, Tansey CM, Matte A, et al. Functional disability 5 years after acute respiratory distress syndrome. N Engl J Med 2011; 364:1293–1304.
- Timmers TK, Verhofstad MH, Moons KG, van Beeck EF, Leenen LP. Long-term quality of life after surgical intensive care admission. Arch Surg 2011; 146:412–418.
- Michaels AJ, Michaels CE, Moon CH, et al. Posttraumatic stress disorder after injury: impact on general health outcome and early risk assessment. J Trauma 1999; 47:460–466; discussion466–467.
- Stoll C, Schelling G, Goetz AE, et al. Health-related quality of life and post-traumatic stress disorder in patients after cardiac surgery and intensive care treatment. J Thorac Cardiovasc Surg 2000; 120:505–512.
- Jones C, Skirrow P, Griffiths RD, et al Post-traumatic stress disorder-related symptoms in relatives of patients following intensive care. Intensive Care Med 2004; 30:456–460.
- Griffiths J, Gager M, Alder N, Fawcett D, Waldmann C, Quinlan J. A self-report-based study of the incidence and associations of sexual dysfunction in survivors of intensive care treatment. Intensive Care Med 2006; 32:445–451.
- Griffiths J, Waldmann C, Quinlan J. Sexual dysfunction in intensive care survivors. Br J Hosp Med (Lond) 2007; 68:470–473.
- Hopkins RO, Jackson JC. Long-term neurocognitive function after critical illness. Chest 2006; 130:869–878.
- Hopkins RO, Weaver LK, Collingridge D, Parkinson RB, Chan KJ, Orme JF. Two-year cognitive, emotional, and quality-of-life outcomes in acute respiratory distress syndrome. Am J Respir Crit Care Med 2005; 171:340–347.
- Rothenhausler HB, Ehrentraut S, Stoll C, Schelling G, Kapfhammer HP. The relationship between cognitive performance and employment and health status in long-term survivors of the acute respiratory distress syndrome: results of an exploratory study. Gen Hosp Psychiatry 2001; 23:90–96.
- Sukantarat KT, Burgess PW, Williamson RC, Brett SJ. Prolonged cognitive dysfunction in survivors of critical illness. Anaesthesia 2005; 60:847–853.
- Hopkins RO, Weaver LK, Pope D, Orme JF, Bigler ED, Larson LV. Neuropsychological sequelae and impaired health status in survivors of severe acute respiratory distress syndrome. Am J Respir Crit Care Med 1999; 160:50–56.
- Hopkins RO, Weaver LK, Chan KJ, Orme JF. Quality of life, emotional, and cognitive function following acute respiratory distress syndrome. J Int Neuropsychol Soc 2004; 10:1005–1017.
- Jackson JC, Gordon SM, Hart RP, Hopkins RO, Ely EW. The association between delirium and cognitive decline: a review of the empirical literature. Neuropsychol Rev 2004; 14:87–98.
- Arroliga AC, Thompson BT, Ancukiewicz M, et al. Use of sedatives, opioids, and neuromuscular blocking agents in patients with acute lung injury and acute respiratory distress syndrome. Crit Care Med 2008; 36:1083–1088.
- Miller RR, Ely EW. Delirium and cognitive dysfunction in the intensive care unit. Semin Respir Crit Care Med 2006; 27:210–220.
- Pandharipande P, Shintani A, Peterson J, et al. Lorazepam is an independent risk factor for transitioning to delirium in intensive care unit patients. Anesthesiology 2006; 104:21–26.
- Dubois MJ, Bergeron N, Dumont M, Dial S, Skrobik Y. Delirium in an intensive care unit: a study of risk factors. Intensive Care Med 2001; 27:1297–1304.
- Girard TD, Jackson JC, Pandharipande PP, et al. Delirium as a predictor of long-term cognitive impairment in survivors of critical illness. Crit Care Med 2010; 38:1513–1520.
- Miller RR, Ely EW. Delirium and cognitive dysfunction in the intensive care unit. Curr Psychiatry Rep 2007; 9:26–34.
- Hopkins RO, Suchyta MR, Snow GL, Jephson A, Weaver LK, Orme JF. Blood glucose dysregulation and cognitive outcome in ARDS survivors. Brain Inj 2010; 24:1478–1484.
- Hough CL, Herridge MS. Long-term outcome after acute lung injury. Curr Opin Crit Care 2012; 18:8–15.
- Jackson JC, Hart RP, Gordon SM, et al. Six-month neuropsychological outcome of medical intensive care unit patients. Crit Care Med 2003; 31:1226–1234.
- Court JA, Perry EK. Neurotransmitter abnormalities in vascular dementia. Int Psychogeriatr 2003; 15(suppl 1):81–87.
- Gottfries CG, Blennow K, Karlsson I, Wallin A. The neurochemistry of vascular dementia. Dementia 1994; 5:163–167.
- Baskerville KA, Schweitzer JB, Herron P. Effects of cholinergic depletion on experience-dependent plasticity in the cortex of the rat. Neuroscience 1997; 80:1159–1169.
- Henon H, Lebert F, Durieu I, et al. Confusional state in stroke: relation to preexisting dementia, patient characteristics, and outcome. Stroke 1999; 30:773–779.
- Whyte E, Skidmore E, Aizenstein H, Ricker J, Butters M. Cognitive impairment in acquired brain injury: a predictor of rehabilitation outcomes and an opportunity for novel interventions. PMR 2011; 3(suppl 1):S45–S51.
- Stephan BC, Matthews FE, McKeith IG, Bond J, Brayne C. Early cognitive change in the general population: how do different definitions work? J Am Geriatr Soc 2007; 55:1534–1540.
- Petersen RC, Smith GE, Waring SC, Ivnik RJ, Tangalos EG, Kokmen E. Mild cognitive impairment: clinical characterization and outcome. Arch Neurol 1999; 56:303–308.
- Palmer K, Fratiglioni L, Winblad B. What is mild cognitive impairment? Variations in definitions and evolution of nondemented persons with cognitive impairment. Acta Neurol Scand Suppl 2003; 179:14–20.
- Petersen RC. Mild cognitive impairment as a diagnostic entity. J Intern Med 2004; 256:183–194.
- Lonie JA, Tierney KM, Ebmeier KP. Screening for mild cognitive impairment: a systematic review. Int J Geriatr Psychiatry 2009; 24:902–915.
- Nasreddine ZS, Phillips NA, Bedirian V, et al. The Montreal Cognitive Assessment, MoCA: a brief screening tool for mild cognitive impairment. J Am Geriatr Soc 2005; 53:695–699.
- Folstein MF, Folstein SE, McHugh PR. “Mini-mental state.” A practical method for grading the cognitive state of patients for the clinician. J Psychiatr Res 1975; 12:189–198.
- Sager MA, Hermann BP, La Rue A, Woodard JL. Screening for dementia in community-based memory clinics. WMJ 2006; 105:25–29.
- Ravaglia G, Forti P, Maioli F, et al. Screening for mild cognitive impairment in elderly ambulatory patients with cognitive complaints. Aging Clin Exp Res 2005; 17:374–379.
- Vogenthaler DR. An overview of head injury: its consequences and rehabilitation. Brain Inj 1987; 1:113–127.
- van den Boogaard M, Schoonhoven L, Evers AW, van der Hoeven JG, van Achterberg T, Pickkers P. Delirium in critically ill patients: impact on long-term health-related quality of life and cognitive functioning. Crit Care Med 2012; 40:112–118.
- Morandi A, Brummel NE, Ely EW. Sedation, delirium and mechanical ventilation: the ‘ABCDE’ approach. Curr Opin Crit Care 2011; 17:43–49.
- Girard TD, Kress JP, Fuchs BD, et al. Efficacy and safety of a paired sedation and ventilator weaning protocol for mechanically ventilated patients in intensive care (Awakening and Breathing Controlled trial): a randomised controlled trial. Lancet 2008; 371:126–134.
- Pandharipande PP, Pun BT, Herr DL, et al. Effect of sedation with dexmedetomidine vs lorazepam on acute brain dysfunction in mechanically ventilated patients: the MENDS randomized controlled trial. JAMA 2007; 298:2644–2653.
- Riker RR, Shehabi Y, Bokesch PM, et al. Dexmedetomidine vs midazolam for sedation of critically ill patients: a randomized trial. JAMA 2009; 301:489–499.
- Reade MC, O’Sullivan K, Bates S, Goldsmith D, Ainslie WR, Bellomo R. Dexmedetomidine vs. haloperidol in delirious, agitated, intubated patients: a randomised open-label trial. Crit Care 2009; 13:R75.
- Mirski MA, Lewin JJ, Ledroux S, et al. Cognitive improvement during continuous sedation in critically ill, awake and responsive patients: the Acute Neurological ICU Sedation Trial (ANIST). Intensive Care Med 2010; 36:1505–1513.
- Spronk PE, Riekerk B, Hofhuis J, Rommes JH. Occurrence of delirium is severely underestimated in the ICU during daily care. Intensive Care Med 2009; 35:1276–1280.
- Ely EW, Inouye SK, Bernard GR, et al. Delirium in mechanically ventilated patients: validity and reliability of the confusion assessment method for the intensive care unit (CAM-ICU). JAMA 2001; 286:2703–2710.
- Luetz A, Heymann A, Radtke FM, et al. Different assessment tools for intensive care unit delirium: which score to use? Crit Care Med 2010; 38:409–418.
- Schweickert WD, Pohlman MC, Pohlman AS, et al. Early physical and occupational therapy in mechanically ventilated, critically ill patients: a randomised controlled trial. Lancet 2009; 373:1874–1882.
- Martin M, Clare L, Altgassen AM, Cameron MH, Zehnder F. Cognition-based interventions for healthy older people and people with mild cognitive impairment. Cochrane Database Syst Rev 2011(1):CD006220.
- Rozzini L, Costardi D, Chilovi BV, Franzoni S, Trabucchi M, Padovani A. Efficacy of cognitive rehabilitation in patients with mild cognitive impairment treated with cholinesterase inhibitors. Int J Geriatr Psychiatry 2007; 22:356–360.
- Jean L, Bergeron ME, Thivierge S, Simard M. Cognitive intervention programs for individuals with mild cognitive impairment: systematic review of the literature. Am J Geriatr Psychiatry 2010; 18:281–296.
- Zelinski EM, Spina LM, Yaffe K, et al. Improvement in memory with plasticity-based adaptive cognitive training: results of the 3-month follow-up. J Am Geriatr Soc 2011; 59:258–265.
- Cicerone KD, Dahlberg C, Malec JF, et al. Evidence-based cognitive rehabilitation: updated review of the literature from 1998 through 2002. Arch Phys Med Rehabil 2005; 86:1681–1692.
- Jackson JC, Ely EW, Morey MC, et al. Cognitive and physical rehabilitation of intensive care unit survivors: results of the RETURN randomized controlled pilot investigation. Crit Care Med 2012; 40:1088–1097.
- Levine B, Stuss DT, Winocur G, et al. Cognitive rehabilitation in the elderly: effects on strategic behavior in relation to goal management. J Int Neuropsychol Soc 2007; 13:143–152.
- ACT-ICU Study: Activity and Cognitive Therapy in the Intensive Care Unit. http://clinicaltrials.gov/ct2/show/NCT01270269. Accessed August 9, 2012.
- Kim YH, Ko MH, Na SY, Park SH, Kim KW. Effects of single-dose methylphenidate on cognitive performance in patients with traumatic brain injury: a double-blind placebo-controlled study. Clin Rehabil 2006; 20:24–30.
- Whyte J, Hart T, Schuster K, Fleming M, Polansky M, Coslett HB. Effects of methylphenidate on attentional function after traumatic brain injury. A randomized, placebo-controlled trial. Am J Phys Med Rehabil 1997; 76:440–450.
- Masanic CA, Bayley MT, VanReekum R, Simard M. Open-label study of donepezil in traumatic brain injury. Arch Phys Med Rehabil 2001; 82:896–901.
- Zhang L, Plotkin RC, Wang G, Sandel ME, Lee S. Cholinergic augmentation with donepezil enhances recovery in short-term memory and sustained attention after traumatic brain injury. Arch Phys Med Rehabil 2004; 85:1050–1055.
- Khateb A, Ammann J, Annoni JM, Diserens K. Cognition-enhancing effects of donepezil in traumatic brain injury. Eur Neurol 2005; 54:39–45.
- Kim YW, Kim DY, Shin JC, Park CI, Lee JD. The changes of cortical metabolism associated with the clinical response to donepezil therapy in traumatic brain injury. Clin Neuropharmacol 2009; 32:63–68.
- Wheaton P, Mathias JL, Vink R. Impact of pharmacological treatments on cognitive and behavioral outcome in the postacute stages of adult traumatic brain injury: a meta-analysis. J Clin Psychopharmacol 2011; 31:745–757.
KEY POINTS
- The development of cognitive impairment during hospitalization has been associated with complications such as hypotension, hyperglycemia, hypoxemia, and delirium.
- The “ABCDE” strategy is used to prevent delirium, although its effect on cognitive impairment has not been proven. ABCD stands for awakening and early spontaneous breathing, choice of sedatives with fewer adverse effects (ie, avoidance of benzodiazepines and opioids), daily delirium monitoring, and early mobility exercise.
- Cognitive impairment is usually diagnosed using restrictive or comprehensive evaluation tools. The Montreal Cognitive Assessment is probably the one most often used since it is readily available, simple, and reliable.
- Most of the evidence on treating cognitive impairment after an ICU stay is extrapolated from studies in patients with mild cognitive impairment or traumatic brain injury. Cognitive training has shown positive results, mostly in improvement of memory, particularly immediate recall.
Hypertension in the elderly: Some practical considerations
The management of hypertension has advanced significantly in the last few decades. But the race for more effective means to control this epidemic and its associated complications is far from won. A high percentage of patients in the United States have hypertension that is uncontrolled. Most of these belong to the most rapidly growing demographic group in the United States, ie, the elderly.
It is estimated that more than 70% of medical practice will be directed to geriatric needs in the coming years. It is therefore very important for clinicians to be comfortable with managing hypertension in the elderly.
A GROWING PROBLEM IN AN AGING POPULATION
Between 1980 and 2009, the US population age 65 and older increased from 25.6 million to 39.6 million, of which 42% are men and 58% women.1 This number is expected to reach 75 million by the year 2040. People over 85 years of age are the fastest growing subset of the US population.2 As many as 50% of people who were born recently in countries such as the United States, the United Kingdom, France, Denmark, and Japan will live to celebrate their 100th birthday.3
According to the Framingham Heart Study, by age 60 approximately 60% of the population develops hypertension, and by 70 years about 65% of men and about 75% of women have the disease. In the same study, 90% of those who were normotensive at age 55 went on to develop hypertension. The elderly also are more likely to suffer from the complications of hypertension and are more likely to have uncontrolled disease.
Compared with younger patients with similar blood pressure, elderly hypertensive patients have lower cardiac output, higher peripheral resistance, wider pulse pressure, lower intravascular volume, and lower renal blood flow.4 These age-related pathophysiologic differences must be considered when treating antihypertension in the elderly.
IS TREATING THE ELDERLY BENEFICIAL?
Most elderly hypertensive patients have multiple comorbidities, which tremendously affect the management of their hypertension. They are also more likely than younger patients to have resistant hypertension and to need multiple drugs to control their blood pressure. In the process, these frail patients are exposed to a host of drug-related adverse effects. Thus, it is relevant to question the net benefit of treatment in this age group.
Many studies have indeed shown that treating hypertension reduces the risk of stroke and other adverse cardiovascular events. A decade ago, Staessen et al,5 in a meta-analysis of more than 15,000 patients between ages 62 and 76, showed that treating isolated systolic hypertension substantially reduced morbidity and mortality rates. Moreover, a 2011 meta-analysis of randomized controlled trials in hypertensive patients age 75 and over also concluded that treatment reduced cardiovascular morbidity and mortality rates and the incidence of heart failure, even though the total mortality rate was not affected.6
Opinion on treating the very elderly (≥ 80 years of age) was divided until the results of the Hypertension in the Very Elderly trial (HYVET)7 came out in 2008. This study documented major benefits of treatment in the very elderly age group as well.
The consensus, therefore, is that it is appropriate, even imperative, to treat elderly hypertensive patients (with some cautions—see the sections that follow).
GOAL OF TREATMENT IN THE ELDERLY
Targets for blood pressure management have been based primarily on observational data in middle-aged patients. There is no such thing as an ideal blood pressure that has been derived from randomized controlled trials for any population, let alone the elderly. The generally recommended blood pressure goal of 140/90 mm Hg for elderly hypertensive patients is based on expert opinion.
Moreover, it is unclear if the same target should apply to octogenarians. According to a 2011 American College of Cardiology/American Heart Association (ACC/AHA) expert consensus report,8 an achieved systolic blood pressure of 140 to 145 mm Hg, if tolerated, can be acceptable in this age group.
An orthostatic decline in blood pressure accompanies advanced age and is an inevitable adverse effect of some antihypertensive drugs. Accordingly, systolic blood pressure lower than 130 and diastolic blood pressure lower than 70 mm Hg are best avoided in octogenarians.8 Therefore, when hypertension is complicated by coexisting conditions that require a specific blood pressure goal, it would seem reasonable to not pursue the lower target as aggressively in octogenarians as in elderly patients under age 80.
Having stated the limitations in the quality of data at hand—largely observational—it is relevant to mention the Systolic Blood Pressure Intervention trial (SPRINT).9 This ongoing randomized, multicenter trial, launched by the National Institutes of Health, is assessing whether maintaining blood pressure levels lower than current recommendations further reduces the risk of cardiovascular and kidney diseases or, in the SPRINT-MIND substudy, of age-related cognitive decline, regardless of the type of antihypertensive drug taken. Initially planning to enroll close to 10,000 participants over the age of 55 without specifying any agegroup ranges, the investigators later decided to conduct a substudy called SPRINT Senior that will enroll about 1,750 participants over the age of 75 to determine whether a lower blood pressure range will have the same beneficial effects in older adults.
Given the limitations in the quality and applicability of published data (coming from small, nonrandomized studies with no long-term follow-up), SPRINT is expected to provide the evidence needed to support standard vs aggressive hypertension control among the elderly. The trial is projected to run until late 2018.
MANAGEMENT APPROACH IN THE ELDERLY
Blood pressure should be recorded in both arms before a diagnosis is made. In a number of patients, particularly the elderly, there are significant differences in blood pressure readings between the two arms. The higher reading should be relied on and the corresponding arm used for subsequent measurements.
Lifestyle interventions
Similar to the approach in younger patients with hypertension, lifestyle interventions are the first step to managing high blood pressure in the elderly. The diet and exercise interventions in the Dietary Approaches to Stop Hypertension (DASH) trial have both been shown to lower blood pressure.10,11
Restricting sodium intake has been shown to lower blood pressure more in older adults than in younger adults. In the DASH trial,12 systolic blood pressure decreased by 8.1 mm Hg with sodium restriction in hypertensive patients age 55 to 76 years, compared with 4.8 mm Hg for adults aged 23 to 41 years. In the Trial of Nonpharmacologic Interventions in the Elderly (TONE),13 in people ages 60 to 80 who were randomized to reduce their salt intake, urinary sodium excretion was 40 mmol/day lower and blood pressure was 4.3/2.0 mm Hg lower than in a group that received usual care. Accordingly, reducing salt intake is particularly valuable for blood pressure management in the salt-sensitive elderly.14
Drug therapy
The hypertension pandemic has driven extensive pharmaceutical research, and new drugs continue to be introduced. The major classes of drugs commonly used for treating hypertension are diuretics, calcium channel blockers, and renin-angiotensin system blockers. Each class has specific benefits and adverse-effect profiles.
It is appropriate to start antihypertensive drug therapy with the lowest dose and to monitor for adverse effects, including orthostatic hypotension. The choice of drug should be guided by the patient’s comorbid conditions (Table 1) and the other drugs the patient is taking.15 If the blood pressure response is inadequate, a second drug from a different class should be added. In the same manner, a third drug from a different class should be added if the blood pressure remains outside the optimal range on two drugs.
The average elderly American is on more than six medications.16 Some of these are for high blood pressure, but others interact with antihypertensive drugs (Table 2), and some, including nonsteroidal anti-inflammatory drugs (NSAIDs) and steroids, directly affect blood pressure. Therefore, the drug regimen of an elderly hypertensive patient should be reviewed carefully at every visit. The Screening Tool of Older Person’s Prescriptions (STOPP), a list of 65 rules relating to the most common and most potentially dangerous instances of inappropriate prescribing and overprescribing in the elderly,17 has been found to be a reliable tool in this regard, with a kappa-coefficient of 0.75. Together with the Screening Tool to Alert Doctors to Right [ie, Appropriate, Indicated] Treatment (START),17 which lists 22 evidence-based prescribing indicators for common conditions in the elderly, these criteria provide clinicians with an easy screening tool to combat polypharmacy.
Given the multitude of factors that go into deciding on a specific management strategy in the elderly, it is not possible to discuss individualized care in all patients in the scope of one paper. Below, we present several case scenarios that internists commonly encounter, and suggest ways to approach each.
CASE 1: SECONDARY HYPERTENSION
A 69-year-old obese man who has hypertension of recent onset, long-standing gastroesophageal reflux disease, and benign prostatic hypertrophy comes to your office, accompanied by his wife. He has never had hypertension before. His body mass index is 34 kg/m2. On physical examination, his blood pressure is 180/112 mm Hg.
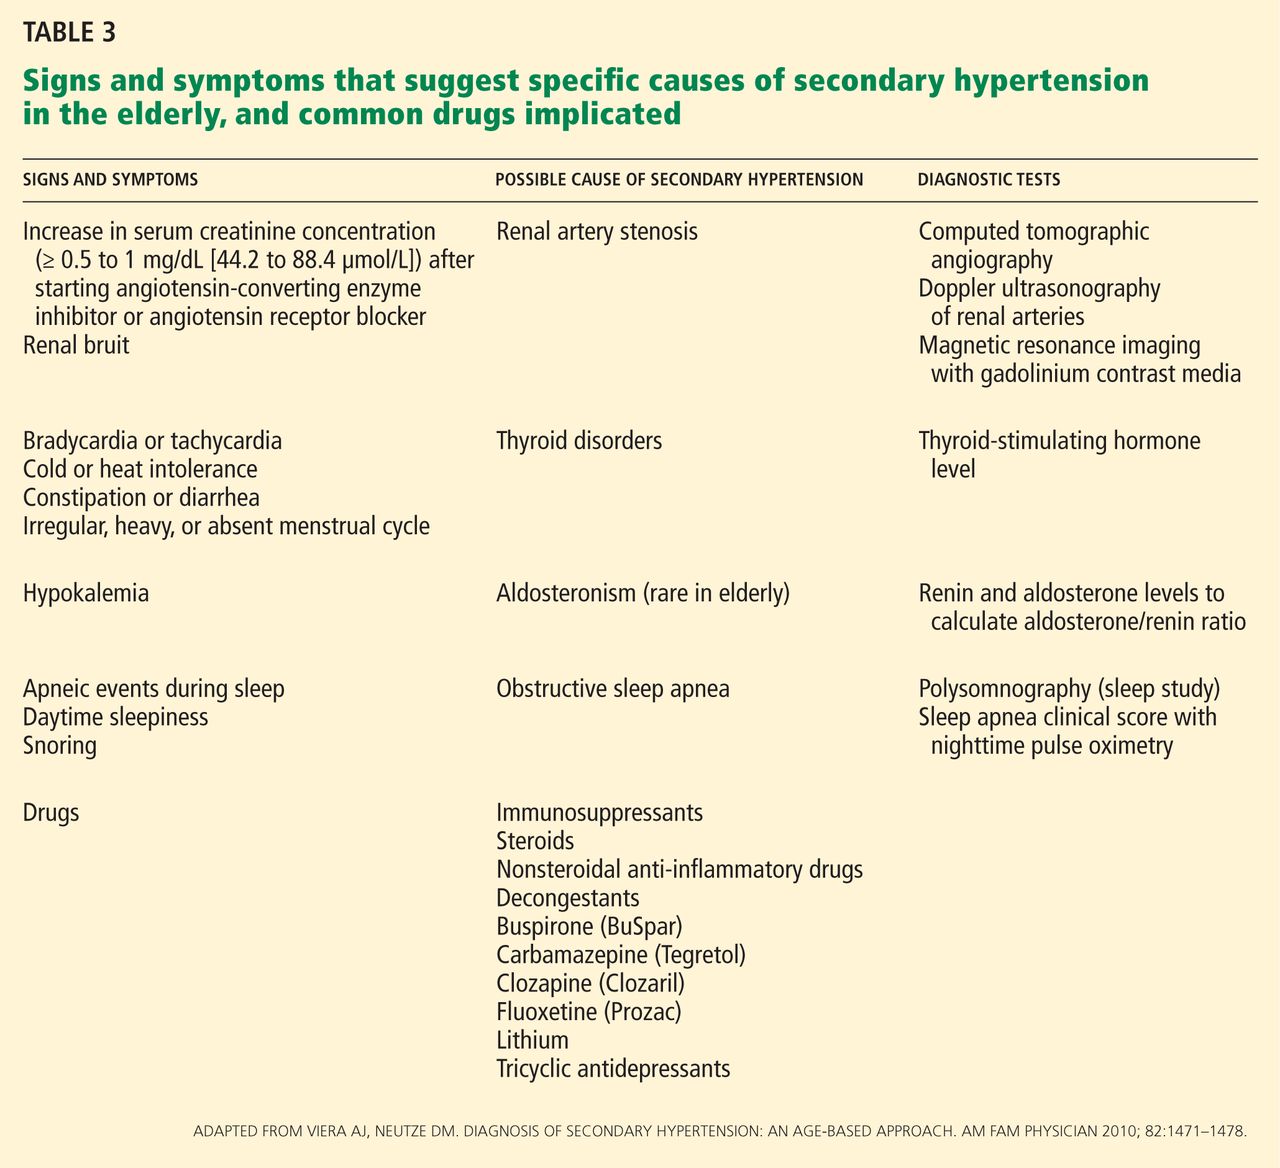
We start with this case to emphasize the importance of considering causes of secondary hypertension in all patients with the disease (Table 3).18 Further workup should be pursued in those who appear to have “inappropriate” hypertension. This could present as refractory hypertension, abrupt-onset hypertension, hypertension that is first diagnosed before age 20 or after age 60, or loss of control over previously well-controlled blood pressure. Secondary hypertension must always be considered when the history or physical examination suggests a possible cause.
Renal artery stenosis increases in incidence with age. Its prevalence is reported to be as high as 50% in elderly patients with other signs of atherosclerosis such as widespread peripheral artery disease.19
Obstructive sleep apnea also commonly coexists with hypertension and its prevalence also increases with age. In addition, elderly patients with obstructive sleep apnea have a higher incidence of cardiovascular complications, including hypertension, than middle-aged people.20 Numerous studies have found that the severity of obstructive sleep apnea corresponds with the likelihood of systemic hypertension.21–23 Randomized trials and meta-analyses have also concluded that effective treatment with continuous positive airway pressure reduces systemic blood pressure,24–27 although by less than antihypertensive medications do.
A causal relationship between obstructive sleep apnea and hypertension has not been established with certainty. It is recommended, however, that patients with resistant hypertension be screened for obstructive sleep apnea as a possible cause of their disease.
Other causes of secondary hypertension to keep in mind when evaluating patients who have inappropriate hypertension include thyroid disorders, alcohol and tobacco use, and chronic steroid or NSAID use. Pheochromocytoma and adrenal adenoma, though possible, are less prevalent in the elderly.
Case continued
Physical examination in the above patient revealed an epigastric systolic-diastolic bruit, a sign that, although not sensitive, is highly specific for renal artery stenosis, raising the suspicion of this condition. Duplex ultrasonography of the renal arteries confirmed this suspicion. The patient underwent angiography and revascularization, resulting in a distinct fall in, but not normalization of, his blood pressure.
Detecting and treating renal artery stenosis
Though we do not intend to detail the diagnostic approaches and treatments for the various causes of secondary hypertension, we need to briefly mention those for renal artery stenosis.
According to the 2006 ACC/AHA guidelines on peripheral artery disease,28 testing for renal artery stenosis is indicated only if a subsequent corrective procedure is a viable option.
Renal arteriography remains the gold standard for diagnosing renal artery stenosis. However, noninvasive imaging has largely replaced it.
Duplex Doppler ultrasonography, compared with angiography, has a sensitivity of 84% to 98% depending on operator experience, and a specificity of 62% to 99% for detecting renal artery stenosis.29 Some of its limiting factors are the time needed to do the study, its steep learning curve and operator-dependence, and interference with the results by body fat and intestinal gas.
Computed tomographic angiography has a sensitivity of over 90% for detecting renal artery stenosis, and its specificity has been shown to be as high as 99% in certain studies.29 Use of contrast can be a limiting factor in some clinical settings.
Magnetic resonance angiography also offers a sensitivity of 90% to 100% and specificities of 76% to 94% for detecting renal artery stenosis.29 On the other hand, it is costly, and the gadolinium contrast solution used is nephrotoxic, though not as toxic as the contrast used in computed tomographic angiography.
As previously stated, these imaging studies should be used only if corrective measures will be undertaken if clinically significant renal artery stenosis is found. Even in such cases, revascularization may not be curative in all cases. Its effectiveness has been compared with that of medical management alone in a number of studies.30,31 A meta-analysis32 of six key trials involving more than 1,200 patients showed no difference in systolic and diastolic blood pressures and other clinical outcomes, including all-cause mortality, between the two treatment groups over a 29-month follow-up period.
Hence, although we advise that causes of secondary hypertension be considered in cases of inappropriate hypertension, aggressive management must be pursued on a case-by-case basis.
CASE 2: DRUG ADVERSE EFFECTS
A 75-year-old Hispanic woman with a history of treated breast cancer was recently diagnosed with hypertension. Her blood pressure is controlled on amlodipine (Norvasc) 10 mg daily, and her blood pressure today is 128/80 mm Hg. Her only complaint during this office visit is some swelling of her ankles.
Edema and dihydropyridine calcium channel blockers
Like all drugs, antihypertensive medications come with their own set of adverse effects. These are more common as people age—hence the importance of identifying and effectively managing them in the elderly population.
Calcium channel blockers, especially the dihydropyridines—ie, nifedipine (Adalat), amlodipine, felodipine (Plendil), and isradipine (DynaCirc)—are known to cause peripheral vasodilation. Peripheral edema is a common dose-related effect in people on these drugs. In one study, median leg weight increased by 80 g after amlodipine 5 mg was given for 4 weeks, and by another 68 g on a 10-mg dose.33
Ankle swelling, encountered more in women, can be very bothersome. The swelling is related to hyperfiltration of fluid into the interstitial space secondary to intracapillary hypertension. Calcium channel blockers predominantly cause arteriolar dilation by paralyzing the precapillary sphincter, thereby elevating intracapillary pressure.
Traditionally, physicians have lowered the dose of the calcium channel blocker, switched to another drug, or added a diuretic to alleviate the swelling. However, giving a diuretic for edema induced by a calcium channel blocker may not relieve the edema.34
Peripheral edema is much less encountered when a calcium channel blocker is given with an inhibitor of the renin-angiotensin system.35 A meta-analysis concluded that the incidence of peripheral edema was lowered by 38% with such a combination. The same study found angiotensin-converting enzyme (ACE) inhibitors significantly more efficacious for this effect than angiotensin receptor blockers (ARBs).35
ACE inhibitors and ARBs are known to cause venodilation, thereby lowering intra-capillary pressure. It is probable that this effect helps remove the extra fluid sequestered in the capillary bed by the arteriolar dilation from the calcium channel blocker.
Pedal edema associated with use of a calcium channel blocker occurs much more commonly in the elderly than in the young. It is clearly dose-dependent, and the incidence peaks after 6 months of therapy. In the patient described above, adding a low dose of an ACE inhibitor or an ARB (if the patient is ACE inhibitor-intolerant) should relieve the swelling.
Hyponatremia and diuretics
Electrolyte imbalances are another common problem encountered in the elderly. Even though for years attention has been directed to the potassium level, hyponatremia has been equally associated with adverse effects in the elderly, such as an increased risk of fractures as shown in the Rotterdam study.36
In 180 hypertensive inpatients, mean age 76.4, Sharabi et al37 found the incidence of hyponatremia to be three times higher in women than in men (odds ratio 3.10, 95% confidence interval 2.07 to 4.67). Patients were 10 times more likely to be affected after age 65 and 14 times more likely after age 75. Most of the patients affected (74.5%) used a thiazide-type diuretic. Even though in many of the patients diuretics were used for more than 1 year before hyponatremia developed, susceptible patients—such as the frail elderly—can develop severe hyponatremia within days of starting to use a thiazide.38
Severe hyponatremia is potentially life-threatening. Most cases are caused by thiazide rather than loop diuretics.38 Thiazides inhibit electrolyte transport at the cortical diluting sites. As they decrease the glomerular filtration rate acutely, they increase proximal water reabsorption (making the plasma hypotonic), reducing water delivery distally. Loop diuretics, on the other hand, have their main effect at the thick ascending limb, reducing the osmolality at the medullary interstitium and not affecting proximal water reabsorption. Additionally, loop diuretics have a shorter half-life than thiazides, which makes hyponatremia more likely to happen with thiazides.
In patients who develop hyponatremia secondary to diuretic use, appropriate treatment includes stopping the medication, restricting water intake, and repleting electrolyte stores.38 As with any cause of chronic hyponatremia, correction must be cautiously monitored and not hastily done.
Therefore, we advise adding a thiazide diuric with caution in the elderly, and we advise avoiding thiazides in patients with high water or alcohol intake.
CASE 3: DEMENTIA AND HYPERTENSION
A 74-year-old man with long-standing hypertension, gout, and chronic obstructive pulmonary disease was recently diagnosed with Alzheimer dementia. He takes enalapril (Vasotec) 10 mg daily for his blood pressure. His blood pressure is 130/78 mm Hg.
Dementia is one of the most important and common neurologic disorders in the elderly. With the rise in average life expectancy, its magnitude has grown to cause a substantial emotional and economic burden on society and health care.
Midlife hypertension has been demonstrated to be an important modifiable risk factor for late-life cognitive decline,39 mild cognitive impairment,40 and dementia of all causes.41 It has been suggested that hypertension might be part of the pathogenesis of dementia, and targeting high blood pressure might prevent its onset.
Moreover, a significant reduction in both Alzheimer and vascular dementia was demonstrated (risk reduction 55%) with the use of a long-acting dihydropyridine calcium channel blocker (nitrendipine) in the Syst-Eur study.42 However, data from studies such as Systolic Hypertension in the Elderly Program (SHEP) and the HYVET substudy of cognitive function assessement43 showed no difference in dementia between placebo and active therapy with chlorthalidone (Hygroton) (in SHEP) or indapamide (Lozol) (in the HYVET substudy).
Disorders of calcium homeostasis are associated with the brain’s aging process. Probably, the neuroprotective effect of nitrendipine seen in Syst-Eur was due to its ability to affect this process, independent of its blood pressure-lowering effect.
In another prospective study, people over 60 years of age who complained of subjective memory loss showed a significant and positive association between memory scores and the use of calcium channel blockers (+0.14 ± 0.09 in users vs −0.12 ± 0.06 in nonusers; P = .016) independently of age, sex, white matter hyperintensities, and carotid wall cross-sectional area, all of which were associated with worse memory scores.44
Drugs that block the renin-angiotensin system have also been proposed to delay the onset and slow the progression of dementia.45 A small randomized, controlled trial suggested that centrally active ACE inhibitors—those that cross the blood-brain barrier, such as captopril (Capoten), lisinopril (Prinivil), ramipril (Altace), and fosinopril (Monopril)—slow cognitive decline in Alzheimer dementia more than non-centrally active ACE inhibitors or calcium channel blockers.46
Sink et al47 examined data from participants in the Cognition Substudy of the Cardiovascular Health Study48 on the effect of ACE inhibitors on cognitive decline. ACE inhibitors, as a class, showed no benefit in reducing the risk of dementia compared with other antihypertensive drug classes. However, centrally active ACE inhibitors, compared with other medications, were associated with a 65% reduction in cognitive decline per year of drug exposure (P = .01). Non-centrally active ACE inhibitors worsened cognitive decline.
It appears that the brain’s renin-angiotensin system plays a role in the pathogenesis of dementia. Indeed, ACE has been shown to degrade amyloid-beta protein, and its level was increased in brain tissue of Alzheimer patients postmortem.49
The relationship between blood pressure and cognitive function appears to be curvilinear, so that low blood pressure in late life is also associated with dementia and Alzheimer dementia.50 In 5,816 patients age 65 and older, Morris et al51 calculated the percentile scores of four cognitive tests according to the level of blood pressure. Patients with systolic blood pressures of 100 mm Hg, 120 mm Hg, and 180 mm Hg scored lower on the Mini Mental State Examination than those in the 140 to 160 mm Hg range. Patients with diastolic blood pressures between 80 and 90 mm Hg appeared to have the best cognitive function. This further emphasizes that blood pressure control must be pursued in the very elderly, albeit less aggressively. The MIND substudy of the SPRINT trial9 is likely to shed more light on this relationship.
When needed for optimal blood pressure control in a hypertensive patient at risk of dementia, a calcium channel blocker of the dihydropyridine type or a centrally active ACE inhibitor, or both, is preferable.
CASE 4: LABILE HYPERTENSION
A 74-year-old man with hypertension and diabetes mellitus comes to see you in the office. On physical examination, his blood pressure is 175/110 mm Hg. His blood pressure during his last visit 3 months ago was 120/75. He brings a log with him that shows random fluctuations in his blood pressure readings. He takes hydrochlorothiazide 25 mg daily for his blood pressure.
Hypertension in some patients continuously fluctuates between low and high levels. A study in Canada found that up to 15% of all adult hypertensive patients might have labile hypertension.52 In the presence of a normal average blood pressure, visit-to-visit blood pressure variability is usually considered a trivial matter. However, some but not all studies have shown that such visit-to-visit variability in blood pressure is an independent predictor of future cardiovascular events in hypertensive patients, independent of the mean systolic blood pressure.52–54
Blood pressure fluctuates from heartbeat to heartbeat, from morning to night, from winter to summer, and from sitting to standing, and it is prone to increase with exertion, stress, and other factors. But excessive fluctuations in the elderly are most likely the result of excessive stiffness of the arterial tree and a decrease in the windkessel (cushioning) function of the aorta. As a consequence, even small-volume changes in the intravascular system can trigger large blood pressure fluctuations.
There is some evidence that antihypertensive drug classes may differ in their effects on visit-to-visit blood pressure variability. In a 2010 study comparing the effects of different antihypertensive drugs on blood pressure variation, calcium channel blockers and non-loop diuretics were associated with less variation in systolic blood pressure, and calcium channel blockers reduced it the most.55
In the patient described above, switching to a low-dose calcium channel blocker with a thorough follow-up is a reasonable plan.
CASE 5: ORTHOSTATIC HYPOTENSION
A 73-year-old woman with long-standing hypertension complains of some dizziness, especially when getting out of bed in the morning. On physical examination, her blood pressure is 134/100 mm Hg sitting and 115/90 standing. She takes amlodipine 10 mg daily, enalapril 10 mg daily, and chlorthalidone 25 mg daily. Chlorthalidone had been added on her last visit 1 month before.
As a result of the increase in the number of elderly patients with hypertension and guidelines recommending better control in this age group, the number of elderly patients on anti-hypertensive drugs has risen significantly. At the same time, the elderly have increasingly presented with adverse effects of treatment.
Orthostatic hypotension is a drop in systolic pressure of 20 mm Hg or more or a drop in diastolic pressure of 10 mm Hg or more on standing, with or without symptoms. These are caused by cerebral hypoperfusion and include dizziness, lightheadedness, generalized weakness, visual blurring, and, in severe cases, syncope.
Alpha-blockers and nitrates have been most commonly implicated in causing orthostatic hypotension, due to venous pooling. Clearly, not all antihypertensive drugs are equal with regard to their venodilatory effects. Thiazide diuretics, by causing fluid volume depletion, and beta-blockers, by interfering with compensatory cardioacceleration with upright posture, are also commonly involved in causing an excessive blood pressure drop with standing.
Systolic orthostatic hypotension has been shown to be a significant and independent predictor of cardiovascular morbidity and death.56 Moreover, syncope and subsequent falls are an important cause of injury and death in the elderly.57 The clinical combination of hypertension and orthostatic hypotension is, therefore, especially challenging. A compromise between accepting a higher cardiovascular risk at either end of the spectrum with an added higher risk for fall at the lower end has to be made.
To prevent orthostatic hypotension in the elderly, it is important to avoid prescribing high-risk drugs. When starting antihypertensive therapy, a low dose should be used, and the dose should be titrated upward very slowly and cautiously. If orthostatic hypotension is suggested by the history or by the orthostatic test, which is warranted in all elderly hypertensive patients before starting or significantly altering therapy, the potential culprit drug should be withdrawn and the patient reassessed. Improved hydration, elevating the head of the bed, and taking the antihypertensive drug at night are ways to improve symptoms, but these remain largely unproven.
In this patient, the newly added chlorthalidone was stopped, and her symptoms improved.
PSEUDOHYPERTENSION
Since hypertension is defined by a numerical value, it is prudent that this value be accurate. Treating a falsely high reading or leaving a falsely low reading untreated will predispose the elderly patient to increased risk either way. One rare condition in the elderly that can give a falsely high blood pressure reading is pseudohypertension.
Pseudohypertension is a condition in which indirect blood pressure measured by the cuff method overestimates the true intra-arterial blood pressure due to marked underlying arteriosclerosis. The Osler maneuver can be used to differentiate true hypertension from pseudohypertension.58 This is performed by palpating the pulseless radial or brachial artery distal to the inflated cuff. If the artery is palpable despite being pulseless, the patient is said to be “Osler-positive” and likely has pseudohypertension.58
Pseudohypertension should be suspected if the patient has orthostatic hypotension despite normal blood pressure sitting and standing. Also, elevated blood pressure without appropriate target organ disease should raise the suspicion of pseudohypertension. Apart from the Osler maneuver, measuring the intraarterial pressure can confirm this diagnosis.
- US Census Bureau. The 2011 statistical abstract. The national data book. http://www.census.gov/compendia/statab/2011/2011edition.html. Accessed July 24, 2012.
- He W, Sengupta M, Velkoff VA, DeBarros KA. US Census Bureau. Current Population Reports, P23-209. 65+ in the United States: 2005. http://www.census.gov/prod/2006pubs/p23-209.pdf. Accessed July 24, 2012.
- Christensen K, Doblhammer G, Rau R, Vaupel JW. Ageing populations: the challenges ahead. Lancet 2009; 374:1196–1208.
- Messerli FH, Sundgaard-Riise K, Ventura HO, Dunn FG, Glade LB, Frohlich ED. Essential hypertension in the elderly: haemodynamics, intravascular volume, plasma renin activity, and circulating catecholamine levels. Lancet 1983; 2:983–986.
- Staessen JA, Gasowski J, Wang JG, et al. Risks of untreated and treated isolated systolic hypertension in the elderly: meta-analysis of outcome trials. Lancet 2000; 355:865–872.
- Schall P, Wehling M. Treatment of arterial hypertension in the very elderly: a meta-analysis of clinical trials. Arzneimittelforschung 2011; 61:221–228.
- Beckett NS, Peters R, Fletcher AE, et al; HYVET Study Group. Treatment of hypertension in patients 80 years of age or older. N Engl J Med 2008; 358:1887–1898.
- Aronow WS, Fleg JL, Pepine CJ, et al. ACCF/AHA 2011 expert consensus document on hypertension in the elderly: a report of the American College of Cardiology Foundation Task Force on Clinical Expert Consensus Documents developed in collaboration with the American Academy of Neurology, American Geriatrics Society, American Society for Preventive Cardiology, American Society of Hypertension, American Society of Nephrology, Association of Black Cardiologists, and European Society of Hypertension. J Am Soc Hypertens 2011; 5:259–352.
- Wake Forest University, Winston-Salem NC. SPRINT: Systolic Blood Pressure Intervention Trial. http://www.sprinttrial.org/public/dspHome.cfm. Accessed July 24, 2012.
- Sacks FM, Svetkey LP, Vollmer WM, et al; DASH-Sodium Collaborative Research Group. Effects on blood pressure of reduced dietary sodium and the Dietary Approaches to Stop Hypertension (DASH) diet. DASH-Sodium Collaborative Research Group. N Engl J Med 2001; 344:3–10.
- Whelton SP, Chin A, Xin X, He J. Effect of aerobic exercise on blood pressure: a meta-analysis of randomized, controlled trials. Ann Intern Med 2002; 136:493–503.
- Bray GA, Vollmer WM, Sacks FM, Obarzanek E, Svetkey LP, Appel LJ; DASH Collaborative Research Group. A further subgroup analysis of the effects of the DASH diet and three dietary sodium levels on blood pressure: results of the DASH-Sodium Trial. Am J Cardiol 2004; 94:222–227.
- Appel LJ, Espeland MA, Easter L, Wilson AC, Folmar S, Lacy CR. Effects of reduced sodium intake on hypertension control in older individuals: results from the Trial of Nonpharmacologic Interventions in the Elderly (TONE). Arch Intern Med 2001; 161:685–693.
- Frisoli TM, Schmieder RE, Grodzicki T, Messerli FH. Salt and hypertension: is salt dietary reduction worth the effort? Am J Med 2012; 125:433–439.
- National High Blood Pressure Education Program. The Seventh Report of the Joint National Committee on Prevention, Detection, Evaluation, and Treatment of High Blood Pressure. Bethesda, MD: National Heart, Lung, and Blood Institute; 2004. http://www.ncbi.nlm.nih.gov/books/NBK9630/Accessed July 30, 2012.
- Mitka M. New guidance covers ways to prevent and treat hypertension in elderly patients. JAMA 2011; 305:2394,2398.
- Gallagher P, Ryan C, Byrne S, Kennedy J, O’Mahony D. STOPP (Screening Tool of Older Person’s Prescriptions) and START (Screening Tool to Alert doctors to Right Treatment). Consensus validation. Int J Clin Pharmacol Ther 2008; 46:72–83.
- Viera AJ, Neutze DM. Diagnosis of secondary hypertension: an age-based approach. Am Fam Physician 2010; 82:1471–1478.
- Rihal CS, Textor SC, Breen JF, et al. Incidental renal artery stenosis among a prospective cohort of hypertensive patients undergoing coronary angiography. Mayo Clin Proc 2002; 77:309–316.
- Wang Y, Li Y. [Clinical and polysomnographic characteristics in elderly patients with obstructive sleep apnea hypopnea syndrome]. [In Chinese] Lin Chung Er Bi Yan Hou Tou Jing Wai Ke Za Zhi. 2008; 22:222–225.
- Lavie P, Herer P, Hoffstein V. Obstructive sleep apnoea syndrome as a risk factor for hypertension: population study. BMJ 2000; 320:479–482.
- Nieto FJ, Young TB, Lind BK, et al. Association of sleep-disordered breathing, sleep apnea, and hypertension in a large community-based study. Sleep Heart Health Study. JAMA 2000; 283:1829–1836.
- Bixler EO, Vgontzas AN, Lin HM, et al. Association of hypertension and sleep-disordered breathing. Arch Intern Med 2000; 160:2289–2295.
- Pepperell JC, Ramdassingh-Dow S, Crosthwaite N, et al. Ambulatory blood pressure after therapeutic and subtherapeutic nasal continuous positive airway pressure for obstructive sleep apnoea: a randomised parallel trial. Lancet 2002; 359:204–210.
- Becker HF, Jerrentrup A, Ploch T, et al. Effect of nasal continuous positive airway pressure treatment on blood pressure in patients with obstructive sleep apnea. Circulation 2003; 107:68–73.
- Dimsdale JE, Loredo JS, Profant J. Effect of continuous positive air-way pressure on blood pressure: a placebo trial. Hypertension 2000; 35:144–147.
- Sharma SK, Agrawal S, Damodaran D, et al. CPAP for the metabolic syndrome in patients with obstructive sleep apnea. N Engl J Med 2011; 365:2277–2286.
- White CJ, Jaff MR, Haskal ZJ, et al; American Heart Association Committee on Diagnostic and Interventional Cardiac Catheterization, Council on Clinical Cardiology. Indications for renal arteriography at the time of coronary arteriography: a science advisory from the American Heart Association Committee on Diagnostic and Interventional Cardiac Catheterization, Council on Clinical Cardiology, and the Councils on Cardiovascular Radiology and Intervention and on Kidney in Cardiovascular Disease. Circulation 2006; 114:1892–1895.
- Hirsch AT, Haskal ZJ, Hertzer NR, et al; American Association for Vascular Surgery. ACC/AHA 2005 guidelines for the management of patients with peripheral arterial disease (lower extremity, renal, mesenteric, and abdominal aortic): executive summary a collaborative report from the American Association for Vascular Surgery/Society for Vascular Surgery, Society for Cardiovascular Angiography and Interventions, Society for Vascular Medicine and Biology, Society of Interventional Radiology, and the ACC/AHA Task Force on Practice Guidelines (Writing Committee to Develop Guidelines for the Management of Patients With Peripheral Arterial Disease) endorsed by the American Association of Cardiovascular and Pulmonary Rehabilitation; National Heart, Lung, and Blood Institute; Society for Vascular Nursing; TransAtlantic Inter-Society Consensus; and Vascular Disease Foundation. J Am Coll Cardiol 2006; 47:1239–1312.
- Bax L, Woittiez AJ, Kouwenberg HJ, et al. Stent placement in patients with atherosclerotic renal artery stenosis and impaired renal function: a randomized trial. Ann Intern Med 2009; 150:840–848,W150–W151.
- ASTRAL Investigators; Wheatley K, Ives N, Gray R, et al. Revascularization versus medical therapy for renal-artery stenosis. N Engl J Med 2009; 361:1953–1962.
- Kumbhani DJ, Bavry AA, Harvey JE, et al. Clinical outcomes after percutaneous revascularization versus medical management in patients with significant renal artery stenosis: a meta-analysis of randomized controlled trials. Am Heart J 2011; 161:622.e1–630.e1.
- Pedrinelli R, Dell’Omo G, Melillo E, Mariani M. Amlodipine, enalapril, and dependent leg edema in essential hypertension. Hypertension 2000; 35:621–625.
- van Hamersvelt HW, Kloke HJ, de Jong DJ, Koene RA, Huysmans FT. Oedema formation with the vasodilators nifedipine and diazoxide: direct local effect or sodium retention? J Hypertens 1996; 14:1041–1045.
- Makani H, Bangalore S, Romero J, Wever-Pinzon O, Messerli FH. Effect of renin-angiotensin system blockade on calcium channel blocker-associated peripheral edema. Am J Med 2011; 124:128–135.
- Hoorn EJ, Rivadeneira F, van Meurs JB, et al. Mild hyponatremia as a risk factor for fractures: the Rotterdam Study. J Bone Miner Res 2011; 26:1822–1828.
- Sharabi Y, Illan R, Kamari Y, et al. Diuretic induced hyponatraemia in elderly hypertensive women. J Hum Hypertens 2002; 16:631–635.
- Spital A. Diuretic-induced hyponatremia. Am J Nephrol 1999; 19:447–452.
- Knopman D, Boland LL, Mosley T, et al; Atherosclerosis Risk in Communities (ARIC) Study Investigators. Cardiovascular risk factors and cognitive decline in middle-aged adults. Neurology 2001; 56:42–48.
- Reitz C, Tang MX, Manly J, Mayeux R, Luchsinger JA. Hypertension and the risk of mild cognitive impairment. Arch Neurol 2007; 64:1734–1740.
- Launer LJ, Ross GW, Petrovitch H, et al. Midlife blood pressure and dementia: the Honolulu-Asia aging study. Neurobiol Aging 2000; 21:49–55.
- Forette F, Seux ML, Staessen JA, et al Prevention of dementia in randomised double-blind placebo-controlled Systolic Hypertension in Europe (Syst-Eur) trial. Lancet 1998; 352:1347–1351.
- Peters R, Beckett N, Forette F, et al. Incident dementia and blood pressure lowering in the Hypertension in the Very Elderly Trial cognitive function assessment (HYVET-COG): a double-blind, placebo controlled trial. Lancet Neurol 2008. www.thelancet.com/journals/laneur/article/PIIS1474-4422(08)70143-1/fulltext. Accessed August 23, 2012.
- Watfa G, Rossignol P, Kearney-Schwartz A, et al. Use of calcium channel blockers is associated with better cognitive performance in older hypertensive patients with subjective memory complaints. J Hypertens 2010; 28:2485–2493.
- Tzourio C, Anderson C, Chapman N, et al; PROGRESS Collaborative Group. Effects of blood pressure lowering with perindopril and indapamide therapy on dementia and cognitive decline in patients with cerebrovascular disease. Arch Intern Med 2003; 163:1069–1075.
- Ohrui T, Tomita N, Sato-Nakagawa T, et al. Effects of brain-penetrating ACE inhibitors on Alzheimer disease progression. Neurology 2004; 63:1324–1325.
- Sink KM, Leng X, Williamson J, et al. Angiotensin-converting enzyme inhibitors and cognitive decline in older adults with hypertension: results from the Cardiovascular Health Study. Arch Intern Med 2009; 169:1195–1202.
- Lopez OL, Kuller LH, Fitzpatrick A, Ives D, Becker JT, Beauchamp N. Evaluation of dementia in the cardiovascular health cognition study. Neuroepidemiology 2003; 22:1–12.
- Hemming ML, Selkoe DJ. Amyloid beta-protein is degraded by cellular angiotensin-converting enzyme (ACE) and elevated by an ACE inhibitor. J Biol Chem 2005; 280:37644–37650.
- Nilsson SE, Read S, Berg S, Johansson B, Melander A, Lindblad U. Low systolic blood pressure is associated with impaired cognitive function in the oldest old: longitudinal observations in a population-based sample 80 years and older. Aging Clin Exp Res 2007; 19:41–47.
- Morris MC, Scherr PA, Hebert LE, et al. Association between blood pressure and cognitive function in a biracial community population of older persons. Neuroepidemiology 2002; 21:123–130.
- Joffres MR, Hamet P, Rabkin SW, Gelskey D, Hogan K, Fodor G. Prevalence, control and awareness of high blood pressure among Canadian adults. Canadian Heart Health Surveys Research Group. CMAJ 1992; 146:1997–2005.
- Schillaci G, Pucci G. The importance of instability and visit-to-visit variability of blood pressure. Expert Rev Cardiovasc Ther 2010; 8:1095–1097.
- Mancia G, Facchetti R, Parati G, Zanchetti A. Visit-to-visit blood pressure variability, carotid atherosclerosis, and cardiovascular events in the European Lacidipine Study on Atherosclerosis. Circulation 2012; 126:569–578.
- Webb AJ, Fischer U, Mehta Z, Rothwell PM. Effects of antihypertensive-drug class on interindividual variation in blood pressure and risk of stroke: a systematic review and meta-analysis. Lancet 2010; 375:906–915.
- Fagard RH, De Cort P. Orthostatic hypotension is a more robust predictor of cardiovascular events than nighttime reverse dipping in elderly. Hypertension 2010; 56:56–61.
- Kearney F, Moore A. Treatment of combined hypertension and orthostatic hypotension in older adults: more questions than answers still remain. Expert Rev Cardiovasc Ther 2009; 7:557–560.
- Messerli FH, Ventura HO, Amodeo C. Osler’s maneuver and pseudohypertension. N Engl J Med 1985; 312:1548–1551.
The management of hypertension has advanced significantly in the last few decades. But the race for more effective means to control this epidemic and its associated complications is far from won. A high percentage of patients in the United States have hypertension that is uncontrolled. Most of these belong to the most rapidly growing demographic group in the United States, ie, the elderly.
It is estimated that more than 70% of medical practice will be directed to geriatric needs in the coming years. It is therefore very important for clinicians to be comfortable with managing hypertension in the elderly.
A GROWING PROBLEM IN AN AGING POPULATION
Between 1980 and 2009, the US population age 65 and older increased from 25.6 million to 39.6 million, of which 42% are men and 58% women.1 This number is expected to reach 75 million by the year 2040. People over 85 years of age are the fastest growing subset of the US population.2 As many as 50% of people who were born recently in countries such as the United States, the United Kingdom, France, Denmark, and Japan will live to celebrate their 100th birthday.3
According to the Framingham Heart Study, by age 60 approximately 60% of the population develops hypertension, and by 70 years about 65% of men and about 75% of women have the disease. In the same study, 90% of those who were normotensive at age 55 went on to develop hypertension. The elderly also are more likely to suffer from the complications of hypertension and are more likely to have uncontrolled disease.
Compared with younger patients with similar blood pressure, elderly hypertensive patients have lower cardiac output, higher peripheral resistance, wider pulse pressure, lower intravascular volume, and lower renal blood flow.4 These age-related pathophysiologic differences must be considered when treating antihypertension in the elderly.
IS TREATING THE ELDERLY BENEFICIAL?
Most elderly hypertensive patients have multiple comorbidities, which tremendously affect the management of their hypertension. They are also more likely than younger patients to have resistant hypertension and to need multiple drugs to control their blood pressure. In the process, these frail patients are exposed to a host of drug-related adverse effects. Thus, it is relevant to question the net benefit of treatment in this age group.
Many studies have indeed shown that treating hypertension reduces the risk of stroke and other adverse cardiovascular events. A decade ago, Staessen et al,5 in a meta-analysis of more than 15,000 patients between ages 62 and 76, showed that treating isolated systolic hypertension substantially reduced morbidity and mortality rates. Moreover, a 2011 meta-analysis of randomized controlled trials in hypertensive patients age 75 and over also concluded that treatment reduced cardiovascular morbidity and mortality rates and the incidence of heart failure, even though the total mortality rate was not affected.6
Opinion on treating the very elderly (≥ 80 years of age) was divided until the results of the Hypertension in the Very Elderly trial (HYVET)7 came out in 2008. This study documented major benefits of treatment in the very elderly age group as well.
The consensus, therefore, is that it is appropriate, even imperative, to treat elderly hypertensive patients (with some cautions—see the sections that follow).
GOAL OF TREATMENT IN THE ELDERLY
Targets for blood pressure management have been based primarily on observational data in middle-aged patients. There is no such thing as an ideal blood pressure that has been derived from randomized controlled trials for any population, let alone the elderly. The generally recommended blood pressure goal of 140/90 mm Hg for elderly hypertensive patients is based on expert opinion.
Moreover, it is unclear if the same target should apply to octogenarians. According to a 2011 American College of Cardiology/American Heart Association (ACC/AHA) expert consensus report,8 an achieved systolic blood pressure of 140 to 145 mm Hg, if tolerated, can be acceptable in this age group.
An orthostatic decline in blood pressure accompanies advanced age and is an inevitable adverse effect of some antihypertensive drugs. Accordingly, systolic blood pressure lower than 130 and diastolic blood pressure lower than 70 mm Hg are best avoided in octogenarians.8 Therefore, when hypertension is complicated by coexisting conditions that require a specific blood pressure goal, it would seem reasonable to not pursue the lower target as aggressively in octogenarians as in elderly patients under age 80.
Having stated the limitations in the quality of data at hand—largely observational—it is relevant to mention the Systolic Blood Pressure Intervention trial (SPRINT).9 This ongoing randomized, multicenter trial, launched by the National Institutes of Health, is assessing whether maintaining blood pressure levels lower than current recommendations further reduces the risk of cardiovascular and kidney diseases or, in the SPRINT-MIND substudy, of age-related cognitive decline, regardless of the type of antihypertensive drug taken. Initially planning to enroll close to 10,000 participants over the age of 55 without specifying any agegroup ranges, the investigators later decided to conduct a substudy called SPRINT Senior that will enroll about 1,750 participants over the age of 75 to determine whether a lower blood pressure range will have the same beneficial effects in older adults.
Given the limitations in the quality and applicability of published data (coming from small, nonrandomized studies with no long-term follow-up), SPRINT is expected to provide the evidence needed to support standard vs aggressive hypertension control among the elderly. The trial is projected to run until late 2018.
MANAGEMENT APPROACH IN THE ELDERLY
Blood pressure should be recorded in both arms before a diagnosis is made. In a number of patients, particularly the elderly, there are significant differences in blood pressure readings between the two arms. The higher reading should be relied on and the corresponding arm used for subsequent measurements.
Lifestyle interventions
Similar to the approach in younger patients with hypertension, lifestyle interventions are the first step to managing high blood pressure in the elderly. The diet and exercise interventions in the Dietary Approaches to Stop Hypertension (DASH) trial have both been shown to lower blood pressure.10,11
Restricting sodium intake has been shown to lower blood pressure more in older adults than in younger adults. In the DASH trial,12 systolic blood pressure decreased by 8.1 mm Hg with sodium restriction in hypertensive patients age 55 to 76 years, compared with 4.8 mm Hg for adults aged 23 to 41 years. In the Trial of Nonpharmacologic Interventions in the Elderly (TONE),13 in people ages 60 to 80 who were randomized to reduce their salt intake, urinary sodium excretion was 40 mmol/day lower and blood pressure was 4.3/2.0 mm Hg lower than in a group that received usual care. Accordingly, reducing salt intake is particularly valuable for blood pressure management in the salt-sensitive elderly.14
Drug therapy
The hypertension pandemic has driven extensive pharmaceutical research, and new drugs continue to be introduced. The major classes of drugs commonly used for treating hypertension are diuretics, calcium channel blockers, and renin-angiotensin system blockers. Each class has specific benefits and adverse-effect profiles.
It is appropriate to start antihypertensive drug therapy with the lowest dose and to monitor for adverse effects, including orthostatic hypotension. The choice of drug should be guided by the patient’s comorbid conditions (Table 1) and the other drugs the patient is taking.15 If the blood pressure response is inadequate, a second drug from a different class should be added. In the same manner, a third drug from a different class should be added if the blood pressure remains outside the optimal range on two drugs.
The average elderly American is on more than six medications.16 Some of these are for high blood pressure, but others interact with antihypertensive drugs (Table 2), and some, including nonsteroidal anti-inflammatory drugs (NSAIDs) and steroids, directly affect blood pressure. Therefore, the drug regimen of an elderly hypertensive patient should be reviewed carefully at every visit. The Screening Tool of Older Person’s Prescriptions (STOPP), a list of 65 rules relating to the most common and most potentially dangerous instances of inappropriate prescribing and overprescribing in the elderly,17 has been found to be a reliable tool in this regard, with a kappa-coefficient of 0.75. Together with the Screening Tool to Alert Doctors to Right [ie, Appropriate, Indicated] Treatment (START),17 which lists 22 evidence-based prescribing indicators for common conditions in the elderly, these criteria provide clinicians with an easy screening tool to combat polypharmacy.
Given the multitude of factors that go into deciding on a specific management strategy in the elderly, it is not possible to discuss individualized care in all patients in the scope of one paper. Below, we present several case scenarios that internists commonly encounter, and suggest ways to approach each.
CASE 1: SECONDARY HYPERTENSION
A 69-year-old obese man who has hypertension of recent onset, long-standing gastroesophageal reflux disease, and benign prostatic hypertrophy comes to your office, accompanied by his wife. He has never had hypertension before. His body mass index is 34 kg/m2. On physical examination, his blood pressure is 180/112 mm Hg.
We start with this case to emphasize the importance of considering causes of secondary hypertension in all patients with the disease (Table 3).18 Further workup should be pursued in those who appear to have “inappropriate” hypertension. This could present as refractory hypertension, abrupt-onset hypertension, hypertension that is first diagnosed before age 20 or after age 60, or loss of control over previously well-controlled blood pressure. Secondary hypertension must always be considered when the history or physical examination suggests a possible cause.
Renal artery stenosis increases in incidence with age. Its prevalence is reported to be as high as 50% in elderly patients with other signs of atherosclerosis such as widespread peripheral artery disease.19
Obstructive sleep apnea also commonly coexists with hypertension and its prevalence also increases with age. In addition, elderly patients with obstructive sleep apnea have a higher incidence of cardiovascular complications, including hypertension, than middle-aged people.20 Numerous studies have found that the severity of obstructive sleep apnea corresponds with the likelihood of systemic hypertension.21–23 Randomized trials and meta-analyses have also concluded that effective treatment with continuous positive airway pressure reduces systemic blood pressure,24–27 although by less than antihypertensive medications do.
A causal relationship between obstructive sleep apnea and hypertension has not been established with certainty. It is recommended, however, that patients with resistant hypertension be screened for obstructive sleep apnea as a possible cause of their disease.
Other causes of secondary hypertension to keep in mind when evaluating patients who have inappropriate hypertension include thyroid disorders, alcohol and tobacco use, and chronic steroid or NSAID use. Pheochromocytoma and adrenal adenoma, though possible, are less prevalent in the elderly.
Case continued
Physical examination in the above patient revealed an epigastric systolic-diastolic bruit, a sign that, although not sensitive, is highly specific for renal artery stenosis, raising the suspicion of this condition. Duplex ultrasonography of the renal arteries confirmed this suspicion. The patient underwent angiography and revascularization, resulting in a distinct fall in, but not normalization of, his blood pressure.
Detecting and treating renal artery stenosis
Though we do not intend to detail the diagnostic approaches and treatments for the various causes of secondary hypertension, we need to briefly mention those for renal artery stenosis.
According to the 2006 ACC/AHA guidelines on peripheral artery disease,28 testing for renal artery stenosis is indicated only if a subsequent corrective procedure is a viable option.
Renal arteriography remains the gold standard for diagnosing renal artery stenosis. However, noninvasive imaging has largely replaced it.
Duplex Doppler ultrasonography, compared with angiography, has a sensitivity of 84% to 98% depending on operator experience, and a specificity of 62% to 99% for detecting renal artery stenosis.29 Some of its limiting factors are the time needed to do the study, its steep learning curve and operator-dependence, and interference with the results by body fat and intestinal gas.
Computed tomographic angiography has a sensitivity of over 90% for detecting renal artery stenosis, and its specificity has been shown to be as high as 99% in certain studies.29 Use of contrast can be a limiting factor in some clinical settings.
Magnetic resonance angiography also offers a sensitivity of 90% to 100% and specificities of 76% to 94% for detecting renal artery stenosis.29 On the other hand, it is costly, and the gadolinium contrast solution used is nephrotoxic, though not as toxic as the contrast used in computed tomographic angiography.
As previously stated, these imaging studies should be used only if corrective measures will be undertaken if clinically significant renal artery stenosis is found. Even in such cases, revascularization may not be curative in all cases. Its effectiveness has been compared with that of medical management alone in a number of studies.30,31 A meta-analysis32 of six key trials involving more than 1,200 patients showed no difference in systolic and diastolic blood pressures and other clinical outcomes, including all-cause mortality, between the two treatment groups over a 29-month follow-up period.
Hence, although we advise that causes of secondary hypertension be considered in cases of inappropriate hypertension, aggressive management must be pursued on a case-by-case basis.
CASE 2: DRUG ADVERSE EFFECTS
A 75-year-old Hispanic woman with a history of treated breast cancer was recently diagnosed with hypertension. Her blood pressure is controlled on amlodipine (Norvasc) 10 mg daily, and her blood pressure today is 128/80 mm Hg. Her only complaint during this office visit is some swelling of her ankles.
Edema and dihydropyridine calcium channel blockers
Like all drugs, antihypertensive medications come with their own set of adverse effects. These are more common as people age—hence the importance of identifying and effectively managing them in the elderly population.
Calcium channel blockers, especially the dihydropyridines—ie, nifedipine (Adalat), amlodipine, felodipine (Plendil), and isradipine (DynaCirc)—are known to cause peripheral vasodilation. Peripheral edema is a common dose-related effect in people on these drugs. In one study, median leg weight increased by 80 g after amlodipine 5 mg was given for 4 weeks, and by another 68 g on a 10-mg dose.33
Ankle swelling, encountered more in women, can be very bothersome. The swelling is related to hyperfiltration of fluid into the interstitial space secondary to intracapillary hypertension. Calcium channel blockers predominantly cause arteriolar dilation by paralyzing the precapillary sphincter, thereby elevating intracapillary pressure.
Traditionally, physicians have lowered the dose of the calcium channel blocker, switched to another drug, or added a diuretic to alleviate the swelling. However, giving a diuretic for edema induced by a calcium channel blocker may not relieve the edema.34
Peripheral edema is much less encountered when a calcium channel blocker is given with an inhibitor of the renin-angiotensin system.35 A meta-analysis concluded that the incidence of peripheral edema was lowered by 38% with such a combination. The same study found angiotensin-converting enzyme (ACE) inhibitors significantly more efficacious for this effect than angiotensin receptor blockers (ARBs).35
ACE inhibitors and ARBs are known to cause venodilation, thereby lowering intra-capillary pressure. It is probable that this effect helps remove the extra fluid sequestered in the capillary bed by the arteriolar dilation from the calcium channel blocker.
Pedal edema associated with use of a calcium channel blocker occurs much more commonly in the elderly than in the young. It is clearly dose-dependent, and the incidence peaks after 6 months of therapy. In the patient described above, adding a low dose of an ACE inhibitor or an ARB (if the patient is ACE inhibitor-intolerant) should relieve the swelling.
Hyponatremia and diuretics
Electrolyte imbalances are another common problem encountered in the elderly. Even though for years attention has been directed to the potassium level, hyponatremia has been equally associated with adverse effects in the elderly, such as an increased risk of fractures as shown in the Rotterdam study.36
In 180 hypertensive inpatients, mean age 76.4, Sharabi et al37 found the incidence of hyponatremia to be three times higher in women than in men (odds ratio 3.10, 95% confidence interval 2.07 to 4.67). Patients were 10 times more likely to be affected after age 65 and 14 times more likely after age 75. Most of the patients affected (74.5%) used a thiazide-type diuretic. Even though in many of the patients diuretics were used for more than 1 year before hyponatremia developed, susceptible patients—such as the frail elderly—can develop severe hyponatremia within days of starting to use a thiazide.38
Severe hyponatremia is potentially life-threatening. Most cases are caused by thiazide rather than loop diuretics.38 Thiazides inhibit electrolyte transport at the cortical diluting sites. As they decrease the glomerular filtration rate acutely, they increase proximal water reabsorption (making the plasma hypotonic), reducing water delivery distally. Loop diuretics, on the other hand, have their main effect at the thick ascending limb, reducing the osmolality at the medullary interstitium and not affecting proximal water reabsorption. Additionally, loop diuretics have a shorter half-life than thiazides, which makes hyponatremia more likely to happen with thiazides.
In patients who develop hyponatremia secondary to diuretic use, appropriate treatment includes stopping the medication, restricting water intake, and repleting electrolyte stores.38 As with any cause of chronic hyponatremia, correction must be cautiously monitored and not hastily done.
Therefore, we advise adding a thiazide diuric with caution in the elderly, and we advise avoiding thiazides in patients with high water or alcohol intake.
CASE 3: DEMENTIA AND HYPERTENSION
A 74-year-old man with long-standing hypertension, gout, and chronic obstructive pulmonary disease was recently diagnosed with Alzheimer dementia. He takes enalapril (Vasotec) 10 mg daily for his blood pressure. His blood pressure is 130/78 mm Hg.
Dementia is one of the most important and common neurologic disorders in the elderly. With the rise in average life expectancy, its magnitude has grown to cause a substantial emotional and economic burden on society and health care.
Midlife hypertension has been demonstrated to be an important modifiable risk factor for late-life cognitive decline,39 mild cognitive impairment,40 and dementia of all causes.41 It has been suggested that hypertension might be part of the pathogenesis of dementia, and targeting high blood pressure might prevent its onset.
Moreover, a significant reduction in both Alzheimer and vascular dementia was demonstrated (risk reduction 55%) with the use of a long-acting dihydropyridine calcium channel blocker (nitrendipine) in the Syst-Eur study.42 However, data from studies such as Systolic Hypertension in the Elderly Program (SHEP) and the HYVET substudy of cognitive function assessement43 showed no difference in dementia between placebo and active therapy with chlorthalidone (Hygroton) (in SHEP) or indapamide (Lozol) (in the HYVET substudy).
Disorders of calcium homeostasis are associated with the brain’s aging process. Probably, the neuroprotective effect of nitrendipine seen in Syst-Eur was due to its ability to affect this process, independent of its blood pressure-lowering effect.
In another prospective study, people over 60 years of age who complained of subjective memory loss showed a significant and positive association between memory scores and the use of calcium channel blockers (+0.14 ± 0.09 in users vs −0.12 ± 0.06 in nonusers; P = .016) independently of age, sex, white matter hyperintensities, and carotid wall cross-sectional area, all of which were associated with worse memory scores.44
Drugs that block the renin-angiotensin system have also been proposed to delay the onset and slow the progression of dementia.45 A small randomized, controlled trial suggested that centrally active ACE inhibitors—those that cross the blood-brain barrier, such as captopril (Capoten), lisinopril (Prinivil), ramipril (Altace), and fosinopril (Monopril)—slow cognitive decline in Alzheimer dementia more than non-centrally active ACE inhibitors or calcium channel blockers.46
Sink et al47 examined data from participants in the Cognition Substudy of the Cardiovascular Health Study48 on the effect of ACE inhibitors on cognitive decline. ACE inhibitors, as a class, showed no benefit in reducing the risk of dementia compared with other antihypertensive drug classes. However, centrally active ACE inhibitors, compared with other medications, were associated with a 65% reduction in cognitive decline per year of drug exposure (P = .01). Non-centrally active ACE inhibitors worsened cognitive decline.
It appears that the brain’s renin-angiotensin system plays a role in the pathogenesis of dementia. Indeed, ACE has been shown to degrade amyloid-beta protein, and its level was increased in brain tissue of Alzheimer patients postmortem.49
The relationship between blood pressure and cognitive function appears to be curvilinear, so that low blood pressure in late life is also associated with dementia and Alzheimer dementia.50 In 5,816 patients age 65 and older, Morris et al51 calculated the percentile scores of four cognitive tests according to the level of blood pressure. Patients with systolic blood pressures of 100 mm Hg, 120 mm Hg, and 180 mm Hg scored lower on the Mini Mental State Examination than those in the 140 to 160 mm Hg range. Patients with diastolic blood pressures between 80 and 90 mm Hg appeared to have the best cognitive function. This further emphasizes that blood pressure control must be pursued in the very elderly, albeit less aggressively. The MIND substudy of the SPRINT trial9 is likely to shed more light on this relationship.
When needed for optimal blood pressure control in a hypertensive patient at risk of dementia, a calcium channel blocker of the dihydropyridine type or a centrally active ACE inhibitor, or both, is preferable.
CASE 4: LABILE HYPERTENSION
A 74-year-old man with hypertension and diabetes mellitus comes to see you in the office. On physical examination, his blood pressure is 175/110 mm Hg. His blood pressure during his last visit 3 months ago was 120/75. He brings a log with him that shows random fluctuations in his blood pressure readings. He takes hydrochlorothiazide 25 mg daily for his blood pressure.
Hypertension in some patients continuously fluctuates between low and high levels. A study in Canada found that up to 15% of all adult hypertensive patients might have labile hypertension.52 In the presence of a normal average blood pressure, visit-to-visit blood pressure variability is usually considered a trivial matter. However, some but not all studies have shown that such visit-to-visit variability in blood pressure is an independent predictor of future cardiovascular events in hypertensive patients, independent of the mean systolic blood pressure.52–54
Blood pressure fluctuates from heartbeat to heartbeat, from morning to night, from winter to summer, and from sitting to standing, and it is prone to increase with exertion, stress, and other factors. But excessive fluctuations in the elderly are most likely the result of excessive stiffness of the arterial tree and a decrease in the windkessel (cushioning) function of the aorta. As a consequence, even small-volume changes in the intravascular system can trigger large blood pressure fluctuations.
There is some evidence that antihypertensive drug classes may differ in their effects on visit-to-visit blood pressure variability. In a 2010 study comparing the effects of different antihypertensive drugs on blood pressure variation, calcium channel blockers and non-loop diuretics were associated with less variation in systolic blood pressure, and calcium channel blockers reduced it the most.55
In the patient described above, switching to a low-dose calcium channel blocker with a thorough follow-up is a reasonable plan.
CASE 5: ORTHOSTATIC HYPOTENSION
A 73-year-old woman with long-standing hypertension complains of some dizziness, especially when getting out of bed in the morning. On physical examination, her blood pressure is 134/100 mm Hg sitting and 115/90 standing. She takes amlodipine 10 mg daily, enalapril 10 mg daily, and chlorthalidone 25 mg daily. Chlorthalidone had been added on her last visit 1 month before.
As a result of the increase in the number of elderly patients with hypertension and guidelines recommending better control in this age group, the number of elderly patients on anti-hypertensive drugs has risen significantly. At the same time, the elderly have increasingly presented with adverse effects of treatment.
Orthostatic hypotension is a drop in systolic pressure of 20 mm Hg or more or a drop in diastolic pressure of 10 mm Hg or more on standing, with or without symptoms. These are caused by cerebral hypoperfusion and include dizziness, lightheadedness, generalized weakness, visual blurring, and, in severe cases, syncope.
Alpha-blockers and nitrates have been most commonly implicated in causing orthostatic hypotension, due to venous pooling. Clearly, not all antihypertensive drugs are equal with regard to their venodilatory effects. Thiazide diuretics, by causing fluid volume depletion, and beta-blockers, by interfering with compensatory cardioacceleration with upright posture, are also commonly involved in causing an excessive blood pressure drop with standing.
Systolic orthostatic hypotension has been shown to be a significant and independent predictor of cardiovascular morbidity and death.56 Moreover, syncope and subsequent falls are an important cause of injury and death in the elderly.57 The clinical combination of hypertension and orthostatic hypotension is, therefore, especially challenging. A compromise between accepting a higher cardiovascular risk at either end of the spectrum with an added higher risk for fall at the lower end has to be made.
To prevent orthostatic hypotension in the elderly, it is important to avoid prescribing high-risk drugs. When starting antihypertensive therapy, a low dose should be used, and the dose should be titrated upward very slowly and cautiously. If orthostatic hypotension is suggested by the history or by the orthostatic test, which is warranted in all elderly hypertensive patients before starting or significantly altering therapy, the potential culprit drug should be withdrawn and the patient reassessed. Improved hydration, elevating the head of the bed, and taking the antihypertensive drug at night are ways to improve symptoms, but these remain largely unproven.
In this patient, the newly added chlorthalidone was stopped, and her symptoms improved.
PSEUDOHYPERTENSION
Since hypertension is defined by a numerical value, it is prudent that this value be accurate. Treating a falsely high reading or leaving a falsely low reading untreated will predispose the elderly patient to increased risk either way. One rare condition in the elderly that can give a falsely high blood pressure reading is pseudohypertension.
Pseudohypertension is a condition in which indirect blood pressure measured by the cuff method overestimates the true intra-arterial blood pressure due to marked underlying arteriosclerosis. The Osler maneuver can be used to differentiate true hypertension from pseudohypertension.58 This is performed by palpating the pulseless radial or brachial artery distal to the inflated cuff. If the artery is palpable despite being pulseless, the patient is said to be “Osler-positive” and likely has pseudohypertension.58
Pseudohypertension should be suspected if the patient has orthostatic hypotension despite normal blood pressure sitting and standing. Also, elevated blood pressure without appropriate target organ disease should raise the suspicion of pseudohypertension. Apart from the Osler maneuver, measuring the intraarterial pressure can confirm this diagnosis.
- US Census Bureau. The 2011 statistical abstract. The national data book. http://www.census.gov/compendia/statab/2011/2011edition.html. Accessed July 24, 2012.
- He W, Sengupta M, Velkoff VA, DeBarros KA. US Census Bureau. Current Population Reports, P23-209. 65+ in the United States: 2005. http://www.census.gov/prod/2006pubs/p23-209.pdf. Accessed July 24, 2012.
- Christensen K, Doblhammer G, Rau R, Vaupel JW. Ageing populations: the challenges ahead. Lancet 2009; 374:1196–1208.
- Messerli FH, Sundgaard-Riise K, Ventura HO, Dunn FG, Glade LB, Frohlich ED. Essential hypertension in the elderly: haemodynamics, intravascular volume, plasma renin activity, and circulating catecholamine levels. Lancet 1983; 2:983–986.
- Staessen JA, Gasowski J, Wang JG, et al. Risks of untreated and treated isolated systolic hypertension in the elderly: meta-analysis of outcome trials. Lancet 2000; 355:865–872.
- Schall P, Wehling M. Treatment of arterial hypertension in the very elderly: a meta-analysis of clinical trials. Arzneimittelforschung 2011; 61:221–228.
- Beckett NS, Peters R, Fletcher AE, et al; HYVET Study Group. Treatment of hypertension in patients 80 years of age or older. N Engl J Med 2008; 358:1887–1898.
- Aronow WS, Fleg JL, Pepine CJ, et al. ACCF/AHA 2011 expert consensus document on hypertension in the elderly: a report of the American College of Cardiology Foundation Task Force on Clinical Expert Consensus Documents developed in collaboration with the American Academy of Neurology, American Geriatrics Society, American Society for Preventive Cardiology, American Society of Hypertension, American Society of Nephrology, Association of Black Cardiologists, and European Society of Hypertension. J Am Soc Hypertens 2011; 5:259–352.
- Wake Forest University, Winston-Salem NC. SPRINT: Systolic Blood Pressure Intervention Trial. http://www.sprinttrial.org/public/dspHome.cfm. Accessed July 24, 2012.
- Sacks FM, Svetkey LP, Vollmer WM, et al; DASH-Sodium Collaborative Research Group. Effects on blood pressure of reduced dietary sodium and the Dietary Approaches to Stop Hypertension (DASH) diet. DASH-Sodium Collaborative Research Group. N Engl J Med 2001; 344:3–10.
- Whelton SP, Chin A, Xin X, He J. Effect of aerobic exercise on blood pressure: a meta-analysis of randomized, controlled trials. Ann Intern Med 2002; 136:493–503.
- Bray GA, Vollmer WM, Sacks FM, Obarzanek E, Svetkey LP, Appel LJ; DASH Collaborative Research Group. A further subgroup analysis of the effects of the DASH diet and three dietary sodium levels on blood pressure: results of the DASH-Sodium Trial. Am J Cardiol 2004; 94:222–227.
- Appel LJ, Espeland MA, Easter L, Wilson AC, Folmar S, Lacy CR. Effects of reduced sodium intake on hypertension control in older individuals: results from the Trial of Nonpharmacologic Interventions in the Elderly (TONE). Arch Intern Med 2001; 161:685–693.
- Frisoli TM, Schmieder RE, Grodzicki T, Messerli FH. Salt and hypertension: is salt dietary reduction worth the effort? Am J Med 2012; 125:433–439.
- National High Blood Pressure Education Program. The Seventh Report of the Joint National Committee on Prevention, Detection, Evaluation, and Treatment of High Blood Pressure. Bethesda, MD: National Heart, Lung, and Blood Institute; 2004. http://www.ncbi.nlm.nih.gov/books/NBK9630/Accessed July 30, 2012.
- Mitka M. New guidance covers ways to prevent and treat hypertension in elderly patients. JAMA 2011; 305:2394,2398.
- Gallagher P, Ryan C, Byrne S, Kennedy J, O’Mahony D. STOPP (Screening Tool of Older Person’s Prescriptions) and START (Screening Tool to Alert doctors to Right Treatment). Consensus validation. Int J Clin Pharmacol Ther 2008; 46:72–83.
- Viera AJ, Neutze DM. Diagnosis of secondary hypertension: an age-based approach. Am Fam Physician 2010; 82:1471–1478.
- Rihal CS, Textor SC, Breen JF, et al. Incidental renal artery stenosis among a prospective cohort of hypertensive patients undergoing coronary angiography. Mayo Clin Proc 2002; 77:309–316.
- Wang Y, Li Y. [Clinical and polysomnographic characteristics in elderly patients with obstructive sleep apnea hypopnea syndrome]. [In Chinese] Lin Chung Er Bi Yan Hou Tou Jing Wai Ke Za Zhi. 2008; 22:222–225.
- Lavie P, Herer P, Hoffstein V. Obstructive sleep apnoea syndrome as a risk factor for hypertension: population study. BMJ 2000; 320:479–482.
- Nieto FJ, Young TB, Lind BK, et al. Association of sleep-disordered breathing, sleep apnea, and hypertension in a large community-based study. Sleep Heart Health Study. JAMA 2000; 283:1829–1836.
- Bixler EO, Vgontzas AN, Lin HM, et al. Association of hypertension and sleep-disordered breathing. Arch Intern Med 2000; 160:2289–2295.
- Pepperell JC, Ramdassingh-Dow S, Crosthwaite N, et al. Ambulatory blood pressure after therapeutic and subtherapeutic nasal continuous positive airway pressure for obstructive sleep apnoea: a randomised parallel trial. Lancet 2002; 359:204–210.
- Becker HF, Jerrentrup A, Ploch T, et al. Effect of nasal continuous positive airway pressure treatment on blood pressure in patients with obstructive sleep apnea. Circulation 2003; 107:68–73.
- Dimsdale JE, Loredo JS, Profant J. Effect of continuous positive air-way pressure on blood pressure: a placebo trial. Hypertension 2000; 35:144–147.
- Sharma SK, Agrawal S, Damodaran D, et al. CPAP for the metabolic syndrome in patients with obstructive sleep apnea. N Engl J Med 2011; 365:2277–2286.
- White CJ, Jaff MR, Haskal ZJ, et al; American Heart Association Committee on Diagnostic and Interventional Cardiac Catheterization, Council on Clinical Cardiology. Indications for renal arteriography at the time of coronary arteriography: a science advisory from the American Heart Association Committee on Diagnostic and Interventional Cardiac Catheterization, Council on Clinical Cardiology, and the Councils on Cardiovascular Radiology and Intervention and on Kidney in Cardiovascular Disease. Circulation 2006; 114:1892–1895.
- Hirsch AT, Haskal ZJ, Hertzer NR, et al; American Association for Vascular Surgery. ACC/AHA 2005 guidelines for the management of patients with peripheral arterial disease (lower extremity, renal, mesenteric, and abdominal aortic): executive summary a collaborative report from the American Association for Vascular Surgery/Society for Vascular Surgery, Society for Cardiovascular Angiography and Interventions, Society for Vascular Medicine and Biology, Society of Interventional Radiology, and the ACC/AHA Task Force on Practice Guidelines (Writing Committee to Develop Guidelines for the Management of Patients With Peripheral Arterial Disease) endorsed by the American Association of Cardiovascular and Pulmonary Rehabilitation; National Heart, Lung, and Blood Institute; Society for Vascular Nursing; TransAtlantic Inter-Society Consensus; and Vascular Disease Foundation. J Am Coll Cardiol 2006; 47:1239–1312.
- Bax L, Woittiez AJ, Kouwenberg HJ, et al. Stent placement in patients with atherosclerotic renal artery stenosis and impaired renal function: a randomized trial. Ann Intern Med 2009; 150:840–848,W150–W151.
- ASTRAL Investigators; Wheatley K, Ives N, Gray R, et al. Revascularization versus medical therapy for renal-artery stenosis. N Engl J Med 2009; 361:1953–1962.
- Kumbhani DJ, Bavry AA, Harvey JE, et al. Clinical outcomes after percutaneous revascularization versus medical management in patients with significant renal artery stenosis: a meta-analysis of randomized controlled trials. Am Heart J 2011; 161:622.e1–630.e1.
- Pedrinelli R, Dell’Omo G, Melillo E, Mariani M. Amlodipine, enalapril, and dependent leg edema in essential hypertension. Hypertension 2000; 35:621–625.
- van Hamersvelt HW, Kloke HJ, de Jong DJ, Koene RA, Huysmans FT. Oedema formation with the vasodilators nifedipine and diazoxide: direct local effect or sodium retention? J Hypertens 1996; 14:1041–1045.
- Makani H, Bangalore S, Romero J, Wever-Pinzon O, Messerli FH. Effect of renin-angiotensin system blockade on calcium channel blocker-associated peripheral edema. Am J Med 2011; 124:128–135.
- Hoorn EJ, Rivadeneira F, van Meurs JB, et al. Mild hyponatremia as a risk factor for fractures: the Rotterdam Study. J Bone Miner Res 2011; 26:1822–1828.
- Sharabi Y, Illan R, Kamari Y, et al. Diuretic induced hyponatraemia in elderly hypertensive women. J Hum Hypertens 2002; 16:631–635.
- Spital A. Diuretic-induced hyponatremia. Am J Nephrol 1999; 19:447–452.
- Knopman D, Boland LL, Mosley T, et al; Atherosclerosis Risk in Communities (ARIC) Study Investigators. Cardiovascular risk factors and cognitive decline in middle-aged adults. Neurology 2001; 56:42–48.
- Reitz C, Tang MX, Manly J, Mayeux R, Luchsinger JA. Hypertension and the risk of mild cognitive impairment. Arch Neurol 2007; 64:1734–1740.
- Launer LJ, Ross GW, Petrovitch H, et al. Midlife blood pressure and dementia: the Honolulu-Asia aging study. Neurobiol Aging 2000; 21:49–55.
- Forette F, Seux ML, Staessen JA, et al Prevention of dementia in randomised double-blind placebo-controlled Systolic Hypertension in Europe (Syst-Eur) trial. Lancet 1998; 352:1347–1351.
- Peters R, Beckett N, Forette F, et al. Incident dementia and blood pressure lowering in the Hypertension in the Very Elderly Trial cognitive function assessment (HYVET-COG): a double-blind, placebo controlled trial. Lancet Neurol 2008. www.thelancet.com/journals/laneur/article/PIIS1474-4422(08)70143-1/fulltext. Accessed August 23, 2012.
- Watfa G, Rossignol P, Kearney-Schwartz A, et al. Use of calcium channel blockers is associated with better cognitive performance in older hypertensive patients with subjective memory complaints. J Hypertens 2010; 28:2485–2493.
- Tzourio C, Anderson C, Chapman N, et al; PROGRESS Collaborative Group. Effects of blood pressure lowering with perindopril and indapamide therapy on dementia and cognitive decline in patients with cerebrovascular disease. Arch Intern Med 2003; 163:1069–1075.
- Ohrui T, Tomita N, Sato-Nakagawa T, et al. Effects of brain-penetrating ACE inhibitors on Alzheimer disease progression. Neurology 2004; 63:1324–1325.
- Sink KM, Leng X, Williamson J, et al. Angiotensin-converting enzyme inhibitors and cognitive decline in older adults with hypertension: results from the Cardiovascular Health Study. Arch Intern Med 2009; 169:1195–1202.
- Lopez OL, Kuller LH, Fitzpatrick A, Ives D, Becker JT, Beauchamp N. Evaluation of dementia in the cardiovascular health cognition study. Neuroepidemiology 2003; 22:1–12.
- Hemming ML, Selkoe DJ. Amyloid beta-protein is degraded by cellular angiotensin-converting enzyme (ACE) and elevated by an ACE inhibitor. J Biol Chem 2005; 280:37644–37650.
- Nilsson SE, Read S, Berg S, Johansson B, Melander A, Lindblad U. Low systolic blood pressure is associated with impaired cognitive function in the oldest old: longitudinal observations in a population-based sample 80 years and older. Aging Clin Exp Res 2007; 19:41–47.
- Morris MC, Scherr PA, Hebert LE, et al. Association between blood pressure and cognitive function in a biracial community population of older persons. Neuroepidemiology 2002; 21:123–130.
- Joffres MR, Hamet P, Rabkin SW, Gelskey D, Hogan K, Fodor G. Prevalence, control and awareness of high blood pressure among Canadian adults. Canadian Heart Health Surveys Research Group. CMAJ 1992; 146:1997–2005.
- Schillaci G, Pucci G. The importance of instability and visit-to-visit variability of blood pressure. Expert Rev Cardiovasc Ther 2010; 8:1095–1097.
- Mancia G, Facchetti R, Parati G, Zanchetti A. Visit-to-visit blood pressure variability, carotid atherosclerosis, and cardiovascular events in the European Lacidipine Study on Atherosclerosis. Circulation 2012; 126:569–578.
- Webb AJ, Fischer U, Mehta Z, Rothwell PM. Effects of antihypertensive-drug class on interindividual variation in blood pressure and risk of stroke: a systematic review and meta-analysis. Lancet 2010; 375:906–915.
- Fagard RH, De Cort P. Orthostatic hypotension is a more robust predictor of cardiovascular events than nighttime reverse dipping in elderly. Hypertension 2010; 56:56–61.
- Kearney F, Moore A. Treatment of combined hypertension and orthostatic hypotension in older adults: more questions than answers still remain. Expert Rev Cardiovasc Ther 2009; 7:557–560.
- Messerli FH, Ventura HO, Amodeo C. Osler’s maneuver and pseudohypertension. N Engl J Med 1985; 312:1548–1551.
KEY POINTS
- Therapy should be considered in all aging hypertensive patients, even the very elderly (> 80 years old).
- Most antihypertensive drugs can be used as first-line treatment in the absence of a compelling indication for a specific class, with the possible exception of alpha-blockers and beta-blockers.
- An initial goal of less than 140/90 mm Hg is reasonable in elderly patients, and an achieved systolic blood pressure of 140 to 145 mm Hg is acceptable in octogenarians.
- Start with low doses; titrate upward slowly; and monitor closely for adverse effects.
- Thiazide diuretics should be used with caution in the elderly because of the risk of hyponatremia.
Chronic lymphocytic leukemia and apparent hyperkalemia
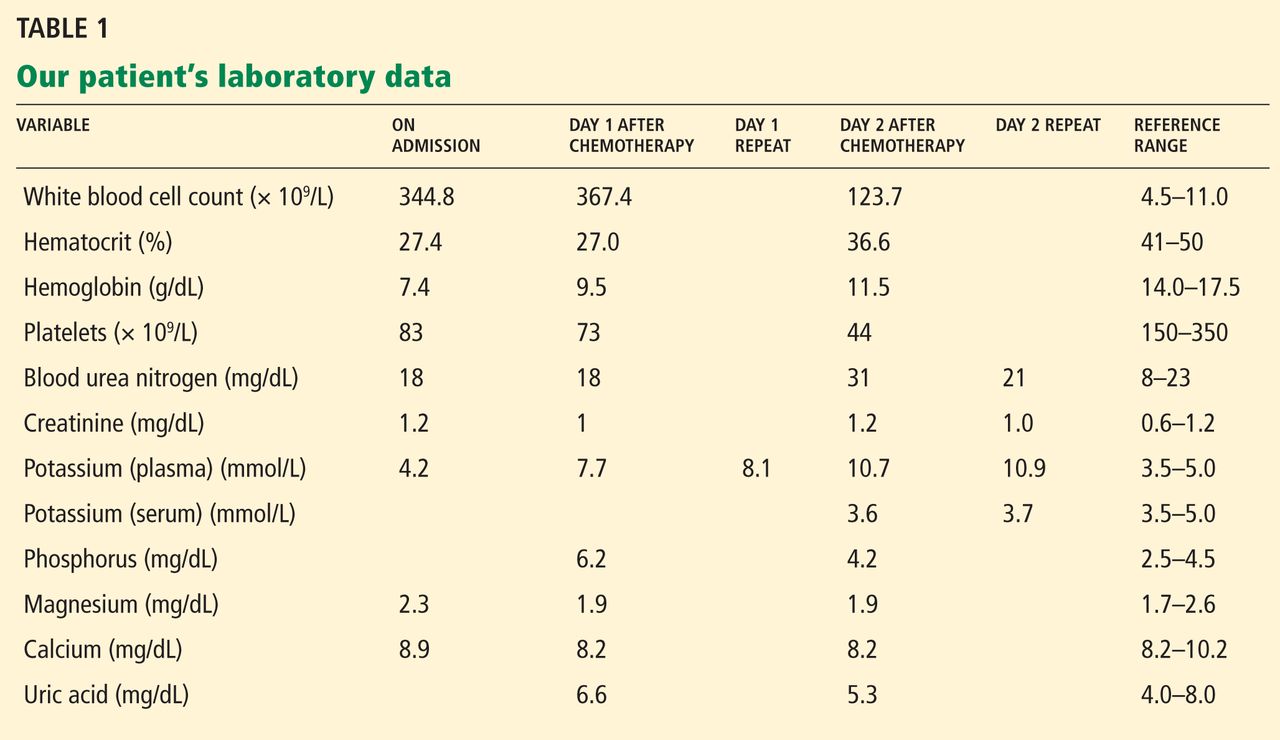
A 64-year-old man with chronic lymphocytic leukemia (CLL), Rai stage IV, was admitted to the hospital to undergo his first cycle of chemotherapy with fludarabine, cyclophosphamide, and rituximab. The physical examination at this time was normal except for splenomegaly and painless bilateral inguinal lymphadenopathy. His laboratory results on admission are shown in Table 1.
On the first day after chemotherapy, laboratory testing revealed an elevated plasma potassium level of 7.7 mmol/L. The specimen was drawn into a BD Vacutainer plasma separator tube with lithium-heparin additive (Becton, Dickinson, and Company, Franklin Lake, NJ) and analyzed on a Unicel DXC 800 chemistry analyzer (Beckman Coulter, Inc, Brea, CA).
1. Which electrocardiographic feature is not associated with hyperkalemia?
- Peaked P waves
- Prolonged PR interval
- Shortened QT interval
- Widened QRS
- Asystole
EVALUATING CARDIAC TOXICITY FROM HYPERKALEMIA
Hyperkalemia is not associated with peaked P waves, but rather with a reduction in the size of the P waves.
Hyperkalemia, defined as a plasma potassium concentration above 5.5 mmol/L, occurs as a result either of a release or a shift of intracellular potassium into the intravascular space or of decreased renal excretion. The earliest changes noted on electrocardiography are peaking and narrowing of T waves, followed by shortening of the QT interval. As hyperkalemia progresses, electrocardiography may show bradycardia, absent P waves, and PR interval prolongation, including second- or third-degree atrioventricular block.
At a plasma potassium concentration greater than 7 mmol/L, there may be a junctional escape rhythm, a sine wave pattern with widening of the QRS complex merging with T waves, ventricular fibrillation, or asystole. However, even with high potassium levels, electrocardiographic changes may be absent.1
The patient denied fatigue, muscle weakness, or palpitations. Electrocardiography did not show peaked T waves, shortened QT intervals, decreased P waves, prolonged PR interval, or widening of the QRS interval.
2. Which is an appropriate intervention for hyperkalemia with cardiac toxicity?
- Membrane stabilization with calcium gluconate
- Shifting potassium into the cells with a beta-adrenergic agonist given by nebulization
- Shifting potassium into the cells with insulin and dextrose
- Removal of potassium with sodium polystyrene sulfonate (Kayexalate)
- Removal of potassium with dialysis
In the setting of cardiac toxicity, the management of hyperkalemia involves stabilizing the cardiac muscle membrane, shifting potassium into the cells, and removing potassium from the body. It is important to do all three interventions when cardiac toxicity is present to provide sustained therapeutic benefit.2
MANAGING HYPERKALEMIA
General principles
When potassium levels are above 6 mmol/L, electrocardiography should always be done. Immediately stop potassium supplementation and any drugs that can cause hyperkalemia, such as potassium-sparing diuretics, angiotensin-converting enzyme inhibitors, angiotensin receptor blockers, nonsteroidal anti-inflammatory drugs, and trimethoprim-sulfamethoxazole (Bactrim). If the potassium level is greater than 6.5 mmol/L, the patient should be placed on telemetric monitoring, and the potassium level should be measured often.
Hyperkalemia with cardiac toxicity
Membrane stabilization involves intravenous infusion of 10 mL of 10% calcium gluconate. The onset of action is 1 to 3 minutes, and the duration of action is 30 to 60 minutes.
Shifting of potassium is done either with insulin or with a beta-adrenergic agonist nebulizer. With insulin, 10 U of regular insulin is given intravenously along with 50 mL of 50% dextrose; the onset of action is 20 minutes, and the duration is 4 to 6 hours. The dose of beta-adrenergic agonist depends on the type used; the onset of action is 20 minutes, with a duration of 2 to 4 hours.
Removal of potassium is achieved either by drug therapy or by dialysis. Sodium or calcium polystyrene sulfonate is given by mouth, 15 g every 6 hours, or 30 to 60 g by retention enema; the onset of action is 1 to 2 hours, with a duration of 4 to 6 hours. If dialysis is used, 2 to 3 hours is recommended; the onset of action is immediate and lasts for the duration of the dialysis session.
CASE CONTINUED
The patient was moved to a telemetry unit. A repeat plasma potassium measurement after 30 minutes confirmed hyperkalemia (Table 1). The specimen was transported to the laboratory via a pneumatic tube system, centrifuged at 3,300 rpm for 10 minutes, and analyzed on a Beckman Unicel DXC 800 chemistry analyzer. The time from specimen collection to analysis was approximately 60 minutes.
He was treated with oral sodium polystyrene sulfonate because no electrocardiographic changes were observed. Subsequent plasma potassium levels drawn, collected, and analyzed with the same technique described above were persistently high. Repeated electrocardiography continued to show no changes related to hyperkalemia.
DIAGNOSING THE CAUSE OF THE APPARENT HYPERKALEMIA
3. Which is the most likely cause of hyperkalemia in this patient?
- Acute renal failure
- Tumor lysis syndrome
- Hemolysis
- Reverse pseudohyperkalemia
- Pseudohyperkalemia
DIFFERENTIAL DIAGNOSIS
The patient had normal levels of blood urea nitrogen and creatinine and adequate urine output, thus ruling out acute renal failure. Hyperuricemia, hyperphosphatemia, and hypocalcemia were not found, thus ruling out tumor lysis syndrome.
In vitro hemolysis is assessed by visual inspection showing a pink or red hue to serum or plasma, or by hemolysis index calculation using spectrophotometric measurements. Factors associated with in vitro hemolysis include vein fragility, the phlebotomist’s skill and technique, and transportation of the specimen, including duration, mode, and temperature. The plasma potassium level was repeatedly measured from a lithium-heparin tube, thus minimizing the possibility of laboratory error. No evidence of hemolysis was observed during the phlebotomy, transportation, or specimen analysis.
Serum and plasma potassium levels were simultaneously measured to test for pseudohyperkalemia, a falsely elevated serum potassium concentration caused by the release of platelet potassium during clot formation or after venipuncture. Contributing factors include the prolonged use of a tourniquet, hemolysis, and marked leukocytosis or thrombocytosis. A serum-to-plasma potassium gradient greater than 0.4 mmol/L is diagnostic of pseudohyperkalemia.
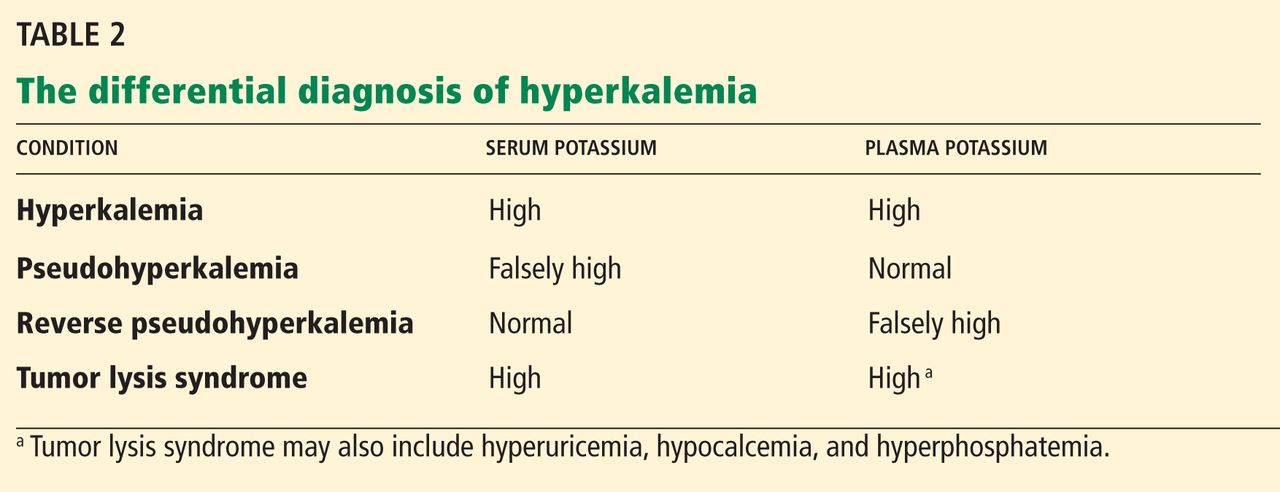
Reverse pseudohyperkalemia, a falsely high potassium level in plasma samples, is defined as a serum-to-plasma potassium gradient less than 0.4 mmol/L (Table 2). This was the most likely cause of the hyperkalemia in our patient.
On the second day after chemotherapy, two blood samples were collected simultaneously—one into a lithium heparin BD Vacutainer plasma separator tube, and the other into a plain, red-top BD Vacutainer serum collection tube without heparin. The specimens were transported to the laboratory by pneumatic tube and were centrifuged at 3,300 rpm for 10 minutes. The specimens were analyzed simultaneously 20 minutes after collection on a Unicel DXC 800 chemistry analyzer. The analysis revealed a serum-to-plasma potassium gradient of −7.1 mmol/L (serum potassium 3.6 mmol/L and plasma potassium 10.7 mmol/L).3 Repeated potassium measurements drawn in similar fashion after 1 hour continued to show a markedly elevated potassium concentration compared with the serum concentration (Table 1).
Serum and plasma samples were again measured simultaneously 24 hours after detecting hyperkalemia to evaluate for pseudohyperkalemia in this patient. In another published report, serum and plasma measurements were obtained 1 week after observing hyperkalemia.4 Blood gas analysis was done the same day in two other reported cases.4,5
Of note, further review of our patient’s medical history noted hyperkalemia at the time he was diagnosed with CLL. At that time, his plasma potassium level was 7.5 mmol/L, a repeated plasma potassium level was 6.9 mmol/L, and a subsequent blood gas analysis—done 30 minutes after the repeated plasma potassium measurement using a Rapidlab analyzer (Siemens Healthcare Diagnostics, Washington, DC)—showed a potassium level of 3.4 mmol/L. The phenomenon of reverse pseudohyperkalemia was not recognized at that time.
The true mechanism of reverse pseudohyperkalemia has not yet been established. Even minor leakage of intracellular potassium from leukemic cells can have a major effect on the extracellular potassium level. Mechanical stressors in the form of pneumatic tube transport and specimen sampling into vacuum tubes have been implicated as causes of this artifact.5,6 Another possible mechanism is heparin-induced lysis of leukocytes in the setting of hematologic malignancy during laboratory processing.4,7,8
LESSONS LEARNED
In patients with hematologic proliferative disorders who develop hyperkalemia in the absence of electrocardiographic changes and an obvious cause of increased potassium levels (eg, acute renal failure, tumor lysis syndrome), we should entertain the possibility of hemolysis, laboratory error, pseudohyperkalemia, and reverse pseudohyperkalemia. The potassium level should be remeasured to rule out laboratory error and hemolysis. In patients with marked leukocytosis or thrombocytosis, simultaneous measurement of serum and plasma potassium levels helps diagnose pseudohyperkalemia and reverse pseudohyperkalemia. Also, prompt blood gas analysis can help identify spurious hyperkalemia.
- Mirvis DM, Goldberger AL. Electrocardiography. In:Bonow RO, Mann DL, Zipes DP, Libby P, editors. Braunwald's Heart Disease—A Textbook of Cardiovascular Medicine. 9th ed. Boston, MA: Elsevier Saunders; 2011:126–167.
- Rastergar A, Soleimani M. Hypokalaemia and hyperkalaemia. Postgrad Med J 2001; 77:759–764.
- Sevastos N, Theodossiades G, Archimandritis AJ. Pseudohyperkalemia in serum: a new insight into an old phenomenon. Clin Med Res 2008; 6:30–32.
- Meng QH, Krahn J. Reverse pseudohyperkalemia in heparin plasma samples from a patient with chronic lymphocytic leukemia. Clin Biochem 2011; 44:728–730.
- Garwicz D, Karlman M, Øra I. Reverse pseudohyperkalemia in heparin plasma samples from a child with T cell acute lymphoblastic leukemia with hyperleukocytosis [Letter]. Clin Chim Acta 2011; 412:396–397.
- Kellerman PS, Thornbery JM. Pseudohyperkalemia due to pneumatic tube transport in a leukemic patient. Am J Kidney Dis 2005; 46:746–748.
- Abraham B, Fakhar I, Tikaria A, et al. Reverse pseudohyperkalemia in a leukemic patient. Clin Chem 2008; 54:449–551.
- Singh PJ, Zawada ET, Santella RN. A case of ‘reverse’ pseudohyperkalemia. Miner Electrolyte Metab 1997; 23:58–61.
A 64-year-old man with chronic lymphocytic leukemia (CLL), Rai stage IV, was admitted to the hospital to undergo his first cycle of chemotherapy with fludarabine, cyclophosphamide, and rituximab. The physical examination at this time was normal except for splenomegaly and painless bilateral inguinal lymphadenopathy. His laboratory results on admission are shown in Table 1.
On the first day after chemotherapy, laboratory testing revealed an elevated plasma potassium level of 7.7 mmol/L. The specimen was drawn into a BD Vacutainer plasma separator tube with lithium-heparin additive (Becton, Dickinson, and Company, Franklin Lake, NJ) and analyzed on a Unicel DXC 800 chemistry analyzer (Beckman Coulter, Inc, Brea, CA).
1. Which electrocardiographic feature is not associated with hyperkalemia?
- Peaked P waves
- Prolonged PR interval
- Shortened QT interval
- Widened QRS
- Asystole
EVALUATING CARDIAC TOXICITY FROM HYPERKALEMIA
Hyperkalemia is not associated with peaked P waves, but rather with a reduction in the size of the P waves.
Hyperkalemia, defined as a plasma potassium concentration above 5.5 mmol/L, occurs as a result either of a release or a shift of intracellular potassium into the intravascular space or of decreased renal excretion. The earliest changes noted on electrocardiography are peaking and narrowing of T waves, followed by shortening of the QT interval. As hyperkalemia progresses, electrocardiography may show bradycardia, absent P waves, and PR interval prolongation, including second- or third-degree atrioventricular block.
At a plasma potassium concentration greater than 7 mmol/L, there may be a junctional escape rhythm, a sine wave pattern with widening of the QRS complex merging with T waves, ventricular fibrillation, or asystole. However, even with high potassium levels, electrocardiographic changes may be absent.1
The patient denied fatigue, muscle weakness, or palpitations. Electrocardiography did not show peaked T waves, shortened QT intervals, decreased P waves, prolonged PR interval, or widening of the QRS interval.
2. Which is an appropriate intervention for hyperkalemia with cardiac toxicity?
- Membrane stabilization with calcium gluconate
- Shifting potassium into the cells with a beta-adrenergic agonist given by nebulization
- Shifting potassium into the cells with insulin and dextrose
- Removal of potassium with sodium polystyrene sulfonate (Kayexalate)
- Removal of potassium with dialysis
In the setting of cardiac toxicity, the management of hyperkalemia involves stabilizing the cardiac muscle membrane, shifting potassium into the cells, and removing potassium from the body. It is important to do all three interventions when cardiac toxicity is present to provide sustained therapeutic benefit.2
MANAGING HYPERKALEMIA
General principles
When potassium levels are above 6 mmol/L, electrocardiography should always be done. Immediately stop potassium supplementation and any drugs that can cause hyperkalemia, such as potassium-sparing diuretics, angiotensin-converting enzyme inhibitors, angiotensin receptor blockers, nonsteroidal anti-inflammatory drugs, and trimethoprim-sulfamethoxazole (Bactrim). If the potassium level is greater than 6.5 mmol/L, the patient should be placed on telemetric monitoring, and the potassium level should be measured often.
Hyperkalemia with cardiac toxicity
Membrane stabilization involves intravenous infusion of 10 mL of 10% calcium gluconate. The onset of action is 1 to 3 minutes, and the duration of action is 30 to 60 minutes.
Shifting of potassium is done either with insulin or with a beta-adrenergic agonist nebulizer. With insulin, 10 U of regular insulin is given intravenously along with 50 mL of 50% dextrose; the onset of action is 20 minutes, and the duration is 4 to 6 hours. The dose of beta-adrenergic agonist depends on the type used; the onset of action is 20 minutes, with a duration of 2 to 4 hours.
Removal of potassium is achieved either by drug therapy or by dialysis. Sodium or calcium polystyrene sulfonate is given by mouth, 15 g every 6 hours, or 30 to 60 g by retention enema; the onset of action is 1 to 2 hours, with a duration of 4 to 6 hours. If dialysis is used, 2 to 3 hours is recommended; the onset of action is immediate and lasts for the duration of the dialysis session.
CASE CONTINUED
The patient was moved to a telemetry unit. A repeat plasma potassium measurement after 30 minutes confirmed hyperkalemia (Table 1). The specimen was transported to the laboratory via a pneumatic tube system, centrifuged at 3,300 rpm for 10 minutes, and analyzed on a Beckman Unicel DXC 800 chemistry analyzer. The time from specimen collection to analysis was approximately 60 minutes.
He was treated with oral sodium polystyrene sulfonate because no electrocardiographic changes were observed. Subsequent plasma potassium levels drawn, collected, and analyzed with the same technique described above were persistently high. Repeated electrocardiography continued to show no changes related to hyperkalemia.
DIAGNOSING THE CAUSE OF THE APPARENT HYPERKALEMIA
3. Which is the most likely cause of hyperkalemia in this patient?
- Acute renal failure
- Tumor lysis syndrome
- Hemolysis
- Reverse pseudohyperkalemia
- Pseudohyperkalemia
DIFFERENTIAL DIAGNOSIS
The patient had normal levels of blood urea nitrogen and creatinine and adequate urine output, thus ruling out acute renal failure. Hyperuricemia, hyperphosphatemia, and hypocalcemia were not found, thus ruling out tumor lysis syndrome.
In vitro hemolysis is assessed by visual inspection showing a pink or red hue to serum or plasma, or by hemolysis index calculation using spectrophotometric measurements. Factors associated with in vitro hemolysis include vein fragility, the phlebotomist’s skill and technique, and transportation of the specimen, including duration, mode, and temperature. The plasma potassium level was repeatedly measured from a lithium-heparin tube, thus minimizing the possibility of laboratory error. No evidence of hemolysis was observed during the phlebotomy, transportation, or specimen analysis.
Serum and plasma potassium levels were simultaneously measured to test for pseudohyperkalemia, a falsely elevated serum potassium concentration caused by the release of platelet potassium during clot formation or after venipuncture. Contributing factors include the prolonged use of a tourniquet, hemolysis, and marked leukocytosis or thrombocytosis. A serum-to-plasma potassium gradient greater than 0.4 mmol/L is diagnostic of pseudohyperkalemia.
Reverse pseudohyperkalemia, a falsely high potassium level in plasma samples, is defined as a serum-to-plasma potassium gradient less than 0.4 mmol/L (Table 2). This was the most likely cause of the hyperkalemia in our patient.
On the second day after chemotherapy, two blood samples were collected simultaneously—one into a lithium heparin BD Vacutainer plasma separator tube, and the other into a plain, red-top BD Vacutainer serum collection tube without heparin. The specimens were transported to the laboratory by pneumatic tube and were centrifuged at 3,300 rpm for 10 minutes. The specimens were analyzed simultaneously 20 minutes after collection on a Unicel DXC 800 chemistry analyzer. The analysis revealed a serum-to-plasma potassium gradient of −7.1 mmol/L (serum potassium 3.6 mmol/L and plasma potassium 10.7 mmol/L).3 Repeated potassium measurements drawn in similar fashion after 1 hour continued to show a markedly elevated potassium concentration compared with the serum concentration (Table 1).
Serum and plasma samples were again measured simultaneously 24 hours after detecting hyperkalemia to evaluate for pseudohyperkalemia in this patient. In another published report, serum and plasma measurements were obtained 1 week after observing hyperkalemia.4 Blood gas analysis was done the same day in two other reported cases.4,5
Of note, further review of our patient’s medical history noted hyperkalemia at the time he was diagnosed with CLL. At that time, his plasma potassium level was 7.5 mmol/L, a repeated plasma potassium level was 6.9 mmol/L, and a subsequent blood gas analysis—done 30 minutes after the repeated plasma potassium measurement using a Rapidlab analyzer (Siemens Healthcare Diagnostics, Washington, DC)—showed a potassium level of 3.4 mmol/L. The phenomenon of reverse pseudohyperkalemia was not recognized at that time.
The true mechanism of reverse pseudohyperkalemia has not yet been established. Even minor leakage of intracellular potassium from leukemic cells can have a major effect on the extracellular potassium level. Mechanical stressors in the form of pneumatic tube transport and specimen sampling into vacuum tubes have been implicated as causes of this artifact.5,6 Another possible mechanism is heparin-induced lysis of leukocytes in the setting of hematologic malignancy during laboratory processing.4,7,8
LESSONS LEARNED
In patients with hematologic proliferative disorders who develop hyperkalemia in the absence of electrocardiographic changes and an obvious cause of increased potassium levels (eg, acute renal failure, tumor lysis syndrome), we should entertain the possibility of hemolysis, laboratory error, pseudohyperkalemia, and reverse pseudohyperkalemia. The potassium level should be remeasured to rule out laboratory error and hemolysis. In patients with marked leukocytosis or thrombocytosis, simultaneous measurement of serum and plasma potassium levels helps diagnose pseudohyperkalemia and reverse pseudohyperkalemia. Also, prompt blood gas analysis can help identify spurious hyperkalemia.
- Mirvis DM, Goldberger AL. Electrocardiography. In:Bonow RO, Mann DL, Zipes DP, Libby P, editors. Braunwald's Heart Disease—A Textbook of Cardiovascular Medicine. 9th ed. Boston, MA: Elsevier Saunders; 2011:126–167.
- Rastergar A, Soleimani M. Hypokalaemia and hyperkalaemia. Postgrad Med J 2001; 77:759–764.
- Sevastos N, Theodossiades G, Archimandritis AJ. Pseudohyperkalemia in serum: a new insight into an old phenomenon. Clin Med Res 2008; 6:30–32.
- Meng QH, Krahn J. Reverse pseudohyperkalemia in heparin plasma samples from a patient with chronic lymphocytic leukemia. Clin Biochem 2011; 44:728–730.
- Garwicz D, Karlman M, Øra I. Reverse pseudohyperkalemia in heparin plasma samples from a child with T cell acute lymphoblastic leukemia with hyperleukocytosis [Letter]. Clin Chim Acta 2011; 412:396–397.
- Kellerman PS, Thornbery JM. Pseudohyperkalemia due to pneumatic tube transport in a leukemic patient. Am J Kidney Dis 2005; 46:746–748.
- Abraham B, Fakhar I, Tikaria A, et al. Reverse pseudohyperkalemia in a leukemic patient. Clin Chem 2008; 54:449–551.
- Singh PJ, Zawada ET, Santella RN. A case of ‘reverse’ pseudohyperkalemia. Miner Electrolyte Metab 1997; 23:58–61.