User login
Managing Dyspepsia
› Review the medications taken by patients who suffer from dyspepsia, as many drugs—bisphosphonates, antibiotics, steroids, and nonsteroidal anti-inflammatory drugs, among others—are associated with this condition. B
› Order an esophagogastroduodenoscopy for patients ages 55 years or older with new-onset dyspepsia and those who have red flags for more serious conditions, eg, a history of upper gastrointestinal (GI) cancer, unintended weight loss, GI bleeding, dysphagia, or a palpable mass. C
› Prescribe acid suppression therapy as first-line treatment for patients who have dyspepsia but are at low risk or have tested negative for Helicobacter pylori infection. A
Strength of recommendation (SOR)
A Good-quality patient-oriented evidence
B Inconsistent or limited-quality patient-oriented evidence
C Consensus, usual practice, opinion, disease-oriented evidence, case series
Each year, an estimated 25% to 30% of the US population suffers from dyspepsia.1 Most self-treat with home remedies and over-the-counter products, but others seek medical care. Dyspepsia accounts for an estimated 2% to 5% of primary care visits annually,2 mostly by patients who are found to have no organic, or structural, cause for their symptoms.1,3
Such patients are said to have functional dyspepsia (FD), a category that applies to about two-thirds of those with dyspepsia.1 A small number of cases are categorized as organic dyspepsia, indicating the presence of a clear structural or anatomic cause, such as an ulcer or mass. The remainder are said to have undifferentiated dyspepsia, which simply means that their signs and symptoms do not rise to the level for which further investigation is warranted and thus it is not known whether it is functional or organic.
There are many possible causes of FD, ranging from medications3,4 to abnormal gastroduodenal motility5,6 to Helicobacter pylori infection,7 and a comprehensive differential diagnosis. The first step in an investigation is to rule out red flags suggestive of gastrointestinal (GI) cancer or other serious disorders.
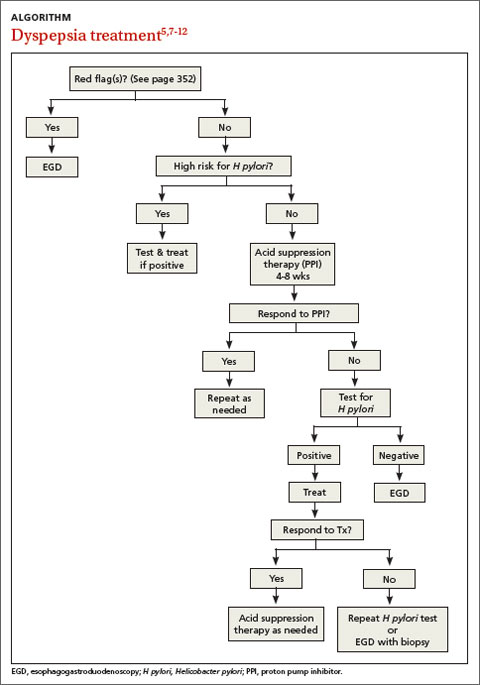
Patients with FD, like the vast majority of those you’ll treat in a primary care setting, suffer significant morbidity. Most have chronic symptoms, with intermittent flare-ups interspersed with periods of remission.8 In the text and dyspepsia treatment ALGORITHM5,7-12 that follow, you’ll find an evidence-based patient management approach.
Symptoms and causes: What to look for
The primary symptoms of dyspepsia include bothersome postprandial fullness, early satiety, and epigastric pain and burning. To meet the Rome criteria for dyspepsia, these symptoms must have been present for the last 3 months and have had an onset ≥6 months prior to diagnosis.2 Recurrent belching and nausea are also common, but are not included in the Rome diagnostic criteria.
Symptom severity is a poor predictor of the seriousness of the condition, however, and more intense symptoms are no more likely than milder cases to have an organic cause.13,14 Indeed, anxiety is a common comorbidity in patients with FD and a risk factor for the diagnosis. Compared with the general public, patients with FD have been found to have higher levels of anxiety, chronic tension, hostility, and hypochondriasis, and a tendency to be more pessimistic.15
Possible causes of FD
While the etiology of organic dyspepsia is clear, the cause of FD is often far more difficult to determine.
Medication use should always be considered, as many types of drugs—including bisphosphonates, antibiotics, narcotics, steroids, iron, metformin, and nonsteroidal anti-inflammatory drugs (NSAIDs)—are associated with dyspepsia.3,4
Gastroduodenal motility and accommodation, which has been found in numerous studies of patients with FD, is a proposed etiology.5,6
Visceral hypersensitivity also appears to play a role. In one study of patients with severe dyspepsia, 87% of those with FD had a reduced or altered GI pain threshold, compared with 20% of those with organic dyspepsia.16
H pylori, commonly linked to peptic ulcer disease (PUD), is also associated with both organic dyspepsia and FD.17,18 The gram-negative rod-shaped bacterium is present in approximately half of the population worldwide, but is more common in developing nations.7H pylori immunoglobulin G (IgG) is more prevalent in patients with dyspepsia, particularly in those younger than 30 years of age. The exact mechanism by which H pylori causes non-ulcerative dyspepsia is not clear, but inflammation, dysmotility, visceral hypersensitivity, and alteration of acid secretion have all been proposed.17
Dysfunctional intestinal epithelium is increasingly being considered in the pathophysiology of dyspepsia, among other conditions. Researchers theorize that certain foods, toxins, infections, and/or other stressors lead to changes in the structure and function of tight junctions, resulting in increased intestinal permeability.19 This in turn is thought to allow the outflow of antigens through the leaky epithelium and to stimulate an immune response—a process that may play a role in the increased GI inflammation or hypersensitivity associated with dyspepsia. The “leaky gut” theory may eventually lead to new ways to treat dyspepsia, but thus far, highquality evidence of the efficacy of treatments aimed at this mechanism is lacking.
A range of disorders included in the differential
The primary differential diagnosis for dyspepsia includes gastroesophageal reflux disease (GERD), esophagitis, chronic PUD (including both gastric and duodenal ulcers), and malignancy. The differential may also include biliary disorder, pancreatitis, hepatitis, or other liver disease; chronic abdominal wall pain, irritable bowel syndrome, motility disorders, or infiltrative diseases of the stomach (eosinophilic gastritis, Crohn’s disease, sarcoidosis); celiac disease and food sensitivities/allergies, including gluten, lactose, and other intolerances; cardiac disease, including acute coronary syndrome, myocardial infarction, and arrhythmias; intestinal angina; small intestine bacterial overgrowth; heavy metal toxicity; and hypercalcemia.8
Ulcers are found in approximately 10% of patients undergoing evaluation for dyspepsia.8 Previously, PUD was almost exclusively due to H pylori infection. In developed countries, however, chronic use of NSAIDs, including aspirin, has increased, and is now responsible for most ulcer diseases.20,21 The combination of H pylori infection and NSAID usage appears to be synergistic, with the risk of uncomplicated PUD estimated to be 17.5 times higher among those who test positive for H pylori and take NSAIDs vs a 3- to 4-fold increase in ulcer incidence among those with either of these risk factors alone.22
The work-up starts with a search for red flags
Symptom severity is a poor predictor of the seriousness of dyspepsia; more intense symptoms are no more likely than milder cases to have an organic cause.
Evaluation of a patient with dyspepsia begins with a thorough history. Start by determining whether the patient has any red flags, or alarm features, that may be associated with a more serious condition—particularly an underlying malignancy. One or more of the following is an indication for an esophagogastroduodenoscopy (EGD):5,8,12
• family and/or personal history of upper GI cancer
• unintended weight loss
• GI bleeding
• progressive dysphagia
• unexplained iron-deficiency anemia
• persistent vomiting
• palpable mass or lymphadenopathy
• jaundice.
While it is important to rule out these red flags, they are poor predictors of malignancy.23,24 With the exception of a single study, their positive predictive value was a mere 1%.8 Their usefulness lies in their ability to exclude malignancy, however; when none of these features is present, the negative predictive value for malignancy is >97%.8
Age is also a risk factor. In addition to red flags, EGD is recommended by the American Gastroenterological Association (AGA) for patients with new-onset dyspepsia who are 55 years or older—an age at which upper GI malignancy becomes more common. A repeat EGD is rarely indicated, unless Barrett’s esophagus or severe erosive esophagitis is found on the initial EGD.25
Physical exam, H pylori evaluation follow
A physical examination of all patients presenting with symptoms suggestive of dyspepsia is crucial. While the exam is usually normal, it may reveal epigastric tenderness on abdominal palpation. Rebound tenderness, guarding, or evidence of other abnormalities should raise the prospect of alternative diagnoses. GERD, for example, has many symptoms in common with dyspepsia, but is a more likely diagnosis in a patient who has retrosternal burning discomfort and regurgitation and reports that symptoms worsen at night and when lying down.

Lab work has limited value. Although laboratory work is not specifically addressed in the AGA guidelines (except for H pylori testing), a complete blood count is a reasonable part of an initial evaluation of dyspepsia to check for anemia. Other routine blood work is not needed, but further lab testing may be warranted based on the history, exam, and differential diagnosis.
H pylori risk. Because of the association between dyspepsia and H pylori, evaluating the patient’s risk for infection with this bacterium, based primarily on his or her current and previous living conditions (TABLE 1),9 is the next step. Although a test for H pylori could be included in the initial work-up of all patients with dyspepsia, a better—and more cost-effective—strategy is to initially test only those at high risk. (More on testing and treating H pylori in a bit.)
Initiate acid suppression therapy for low-risk patients
First-line treatment for patients with dyspepsia who have no red flags for malignancy or other serious conditions and either are not at high risk for H pylori or are at high risk but have been tested for it and had negative results is a 4- to 8-week course of acid suppression therapy. Patients at low risk for H pylori should be tested for the bacterium only if therapy fails to alleviate their symptoms.9
H2RAs or PPIs? A look at the evidence
In a Cochrane review, both H2 receptor antagonists (H2RAs) and proton pump inhibitors (PPIs) were significantly more effective than placebo for treating FD.26 However, H2RAs can lead to tachyphylaxis—an acute decrease in response to a drug—within 2 to 6 weeks, thus limiting their long-term efficacy.27
PPIs appear to be more effective than H2RAs, and are the AGA’s acid suppression drug of choice.11 The CADET study, a randomized controlled trial comparing PPIs (omeprazole 20 mg/d) with an H2RA (ranitidine 150 mg BID) and a prokinetic agent (cisapride 20 mg BID) as well as placebo for dyspepsia, found the PPI to be superior to the H2RA at 6 months.28 In a systematic review, the number needed to treat with PPI therapy for improvement of dyspepsia symptoms was 9.29
There is no specified time limit for the use of PPIs. AGA guidelines recommend that patients who respond to initial therapy stop treatment after 4 to 8 weeks.11 If symptoms recur, another course of the same treatment is justified; if necessary, therapy can continue long term. However, patients should be made aware of the risk for vitamin deficiency, osteoporosis, and fracture, as well as arrhythmias, Clostridium difficile infection, and rebound upon abrupt discontinuation of PPIs.
When to test for H pylori ...
Empiric treatment for H pylori is not recommended. Thus, testing is indicated for patients who have risk factors for the bacterium or who fail to respond to acid suppression therapy. There are various ways to test for the presence of H pylori. Which test you choose depends, in part, on patient-specific factors.
Serology. IgG serology testing is extremely useful in patients who have never been diagnosed with H pylori. It is best suited for those who are currently taking proton pump inhibitors (PPIs) or who recently completed a course of antibiotics, since neither medication affects the results of the serology test.
Serology testing should not be used, however, for any patient who was previously diagnosed with or treated for H pylori, because this type of test cannot distinguish between an active or past infection. The IgG serology test has a sensitivity of 87% and a specificity of 67%.30
Stool antigen. Stool tests using monoclonal antibodies to detect the presence of H pylori have a sensitivity of 87% to 92% and a specificity of 70%. Stool antigen is also an excellent post-treatment test to confirm that H pylori has been eradicated.31
Stool testing has some drawbacks, however. PPIs can decrease the sensitivity and should be discontinued at least 2 weeks prior to stool testing.32 In addition, a stool test for H pylori is not accurate if the patient has an acute GI bleed.
Urea breath testing. This is the most sensitive and specific test for active H pylori infection (90%-96% sensitivity and 88%-96% specificity).33 PPIs can lower the sensitivity of the test, however, and are typically discontinued at least 2 weeks prior to testing. Urea breath testing, like stool testing, is an excellent way to confirm that H pylori has been eradicated after treatment. However, it is more expensive than other tests for H pylori and often inconvenient to obtain.13
An EGD is indicated for a patient who has failed to respond to acid suppression therapy and has a negative serology, stool antigen, or urea breath test for H pylori.
Biopsy-based testing for H pylori is performed with EGD and is therefore reserved for patients who have red flags or other indications of a need for invasive testing. There are 3 types of biopsy-based tests: urease (sensitivity, 70%-90%; specificity, 95%); histology (87%-92% and 70%, respectively); and culture (85%-88% and 69%, respectively). Overall, the specificity is slightly better than that of noninvasive testing, but the sensitivity can be lowered by recent use of PPIs, bismuth, or antibiotics.12,34
... and how to treat it
H pylori infection is associated with an increased risk of noncardiac gastric adenocarcinoma, but a decreased risk of cardiac gastric adenocarcinoma and esophageal adenocarcinoma.35,36 Thus, the potential to reduce the risk of gastric cancer is not considered an indication for H pylori treatment. The possibility of improving dyspepsia symptoms is a reason to treat H pylori infection, although eradicating it does not always do so.
In a 2006 Cochrane Review, treating H pylori had a small but statistically significant benefit for patients with FD (NNT=14).37 A 2011 study on the effects of H pylori eradication on symptoms and quality of life in primary care patients with FD revealed a 12.5% improvement in quality of life and a 10.6% improvement in symptoms.38
The triple therapy regimen (a PPI + amoxicillin + clarithromycin) is the most common first-line H pylori treatment in the United States, and a good initial choice in regions in which clarithromycin resistance is low (TABLE 2).39-44 The standard duration is 7 days. A 2013 Cochrane Review showed that a longer duration (14 days) increased the rate of eradication (82% vs 73%), but this remains controversial.39 The addition of bismuth subsalicylate to the triple therapy regimen has been shown to increase the eradication rate of H pylori by approximately 10%.45 Adding probiotics (saccharomyces or lactobacillus) appears to increase eradication rates, as well.40
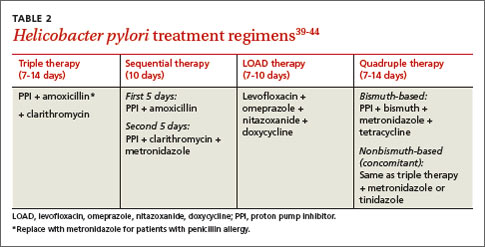
Sequential therapy consists of a 5-day course of treatment in which a PPI and amoxicillin are taken twice a day, followed by another 5-day course of a PPI, clarithromycin, and metronidazole. A recent meta-analysis of sequential therapy showed that it is superior to 7-day triple therapy but equivalent to 14-day triple therapy.40
LOAD (levofloxacin, omeprazole, nitazoxanide, and doxycycline) therapy for 7 to 10 days can be used in place of triple therapy in areas of high resistance or for persistent H pylori. In one study, the H pylori eradication rate for a 7-day course of LOAD therapy—levofloxacin and doxycycline taken once a day, omeprazole before breakfast, and nitazoxanide twice daily—was 90% vs 73.3% for a 7-day course of triple therapy.41
Quadruple therapy has 2 variations: bismuth-based and non-bismuth (concomitant) therapy. The latter uses the base triple therapy and adds either metronidazole or tinidazole for 7 to 14 days. In a multicenter randomized trial, this concomitant therapy was found to have similar efficacy to sequential therapy.42
Bismuth-based quad therapy includes a PPI, bismuth, metronidazole, and tetracycline. A meta-analysis found it to have a higher rate of eradication than triple therapy for patients with antibiotic resistance.43,44
For persistent H pylori, a PPI, levofloxacin, and amoxicillin for 10 days has been shown to be more effective and better tolerated than quadruple therapy.12
Confirmation is indicated when symptoms persist
If dyspepsia symptoms persist after H pylori treatment, it is reasonable to retest to confirm that the infection has in fact been eradicated. Confirmation is also indicated if the patient has an H pylori-associated ulcer or a prior history of gastric cancer.
Retesting should be performed at least 4 to 6 weeks after treatment is completed. If H pylori has not been eradicated, you can try another regimen. If retesting confirms eradication and symptoms persist, EGD with biopsy is indicated. Although EGD typically has a very low yield, even for patients with red flags, this invasive test often provides reassurance and increased satisfaction for patients with persistent symptoms.46

More options for challenging cases
Managing FD is challenging when both initial acid suppression therapy and H pylori eradication fail. Unproven but low-risk treatments include modification of eating habits (eg, eating slower, not gulping food), reducing stress, discontinuing medications that may be related to symptoms, avoiding foods that seem to exacerbate symptoms, and cutting down or eliminating tobacco, caffeine, alcohol, and carbonated beverages.8 Bismuth salts have been shown to be superior to placebo for the treatment of dyspepsia.25 Small studies have also demonstrated a favorable risk–benefit ratio for peppermint oil and caraway oil for the treatment of FD.47 Prokinetics have shown efficacy compared with placebo, although a Cochrane review questioned their efficacy based on publication bias.26
There is no good evidence of efficacy for over-the-counter antacids, such as TUMS, or for GI “cocktails” (antacid, antispasmotic, and lidocaine), sucralfate, psychological interventions (eg, cognitive behavioral therapy, relaxation therapy, or hypnosis), or antidepressants.48,49 Several recent randomized controlled trials have shown the efficacy of acupuncture for the treatment of dyspepsia.49,50 Ginger may also be helpful; it has been found to help with nausea in other GI conditions, but it’s uncertain whether it can help patients with dyspepsia.51
CORRESPONDENCE
Michael Malone, MD, 845 Fishburn Road, Hershey, PA 17053; [email protected]
1. Shaib Y, El-Serag HB. The prevalence and risk factors of functional dyspepsia in a multiethnic population in the United States. Am J Gastroenterol. 2004;99:2210-2216.
2. Talley NJ. Dyspepsia: management guidelines for the millennium. Gut. 2002;50(suppl 4):iv72–iv78.
3. Harmon RC, Peura DA. Evaluation and management of dyspepsia. Therap Adv Gastroenterol. 2010;3:87–98.
4. Bazaldua OV, Schneider FD. Evaluation and management of dyspepsia. Am Fam Physician. 1999;60:1773-1784.
5. Tack J, Talley NJ, Camilleri M, et al. Functional gastroduodenal disorders. Gastroenterology. 2006;130:1466-1479.
6. Haag S, Talley NJ, Holtmann G. Symptom patterns in functional dyspepsia and irritable bowel syndrome: relationship to disturbances in gastric emptying and response to a nutrient challenge in consulters and non-consulters. Gut. 2004;53:1445-1451.
7. Malfertheiner P, Megraud F, O’Morain CA, et al; European Helicobacter Study Group. Management of Helicobacter pylori infection—the Maastricht IV/Florence Consensus Report. Gut. 2012;61:646-664.
8. Talley NJ, Vakil NB, Moayyedi P. American Gastroenterological Association technical review on the evaluation of dyspepsia. Gastroenterology. 2005;129:1756-1780.
9. Moayyedi P, Axon AT. The usefulness of the likelihood ratio in the diagnosis of dyspepsia and gastroesophageal reflux disease. Am J Gastroenterol. 1999;94:3122-3125.
10. McColl KE. Clinical practice. Helicobacter pylori infection. N Engl J Med. 2010;362:1597-1604.
11. Kahrilas PJ, Shaheen NJ, Vaezi MF, et al; American Gastroenterological Association. American Gastroenterological Association Medical Position Statement on the management of gastroesophageal reflux disease. Gastroenterology. 2008;135:1383-1391.
12. Chey WD, Wong BC; Practice Parameters Committee of the American College of Gastroenterology. American College of Gastroenterology guideline on the management of Helicobacter pylori Infection. Am J Gastroenterol. 2007;102:1808-1825.
13. Moayyedi P, Talley NJ, Fennerty MB, et al. Can the clinical history distinguish between organic and functional dyspepsia? JAMA. 2006;295:1566-1576.
14. Eslick GD, Howell SC, Hammer J, et al. Empirically derived symptom sub-groups correspond poorly with diagnostic criteria for functional dyspepsia and irritable bowel syndrome. A factor and cluster analysis of a patient sample. Aliment Pharmacol Ther. 2004;19:133-140.
15. Aro P, Talley NJ, Ronkainen J, et al. Anxiety is associated with uninvestigated and functional dyspepsia (Rome III criteria) in a Swedish population-based study. Gastroenterology. 2009;137:94-100.
16. Mertz H, Fullerton S, Naliboff B, et al. Symptoms and visceral perception in severe functional and organic dyspepsia. Gut. 1998;42:814-822.
17. O’Morain C. Role of Helicobacter pylori in functional dyspepsia. World J Gastroenterol. 2006;12:2677-2680.
18. Shmuely H, Obure S, Passaro DJ, et al. Dyspepsia symptoms and Helicobacter pylori infection, Nakuru, Kenya. Emerg Infect Dis. 2003;9:1103-1107.
19. Barbara G, Zecchi L, Barbaro R, et al. Mucosal permeability and immune activation as potential therapeutic targets of probiotics in irritable bowel syndrome. J Clin Gastroenterol. 2012;46(suppl):S52-S55.
20. Liu NJ, Lee CS, Tang JH, et al. Outcomes of bleeding peptic ulcers: a prospective study. J Gastroenterol Hepatol. 2008;23:e340-e347.
21. Ramsoekh D, van Leerdam ME, Rauws EA, et al. Outcome of peptic ulcer bleeding, nonsteroidal anti-inflammatory drug use, and Helicobacter pylori infection. Clin Gastroenterol Hepatol. 2005;3:859-864.
22. Papatheodoridis GV, Sougioultzis S, Archimandritis AJ. Effects of Helicobacter pylori and nonsteroidal anti-inflammatory drugs on peptic ulcer disease: a systematic review. Clin Gastroenterol Hepatol. 2006;4:130-142.
23. Bai Y, Li ZS, Zou DW, et al. Alarm features and age for predicting upper gastrointestinal malignancy in Chinese patients with dyspepsia with high background prevalence of Helicobacter pylori infection and upper gastrointestinal malignancy: an endoscopic database review of 102,665 patients from 1996 to 2006. Gut. 2010;59:722-728.
24. Vakil N. Dyspepsia, peptic ulcer, and H. pylori: a remembrance of things past. Am J Gastroenterol. 2010;105:572-574.
25. Shaheen NJ, Weinberg DS, Denberg TD, et al; Clinical Guidelines Committee of the American College of Physicians. Upper endoscopy for gastroesophageal reflux disease: best practice advice from the clinical guidelines committee of the American College of Physicians. Ann Intern Med. 2012;157:808-816.
26. Moayyedi P, Soo S, Deeks J, et al. Pharmacological interventions for non-ulcer dyspepsia. Cochrane Database Syst Rev. 2006;(4):CD001960.
27. Chiu CT, Hsu CM, Wang CC, et al. Randomised clinical trial: sodium alginate oral suspension is non-inferior to omeprazole in the treatment of patients with non-erosive gastroesophageal disease. Aliment Pharmacol Ther. 2013;38:1054-1064.
28. Veldhuyzen van Zanten SJ, Chiba N, Armstrong D, et al. A randomized trial comparing omeprazole, ranitidine, cisapride, or placebo in helicobacter pylori negative, primary care patients with dyspepsia: the CADET-HN Study. Am J Gastroenterol. 2005;100:1477-1488.
29. Moayyedi P, Delaney BC, Vakil N, et al. The efficacy of proton pump inhibitors in nonulcer dyspepsia: a systematic review and economic analysis. Gastroenterology. 2004;127:1329-1337.
30. Garza-González E, Bosques-Padilla FJ, Tijerina-Menchaca R, et al. Comparison of endoscopy-based and serum-based methods for the diagnosis of Helicobacter pylori. Can J Gastroenterol. 2003;17:101-106.
31. Kodama M, Murakami K, Okimoto T, et al. Influence of proton pump inhibitor treatment on Helicobacter pylori stool antigen test. World J Gastroenterol. 2012;18:44-48.
32. Shimoyama T. Stool antigen tests for the management of Helicobacter pylori infection. World J Gastroenterol. 2013;19:8188-8191.
33. Howden CW, Hunt RH. Guidelines for the management of Helicobacter pylori infection. Ad Hoc Committee on Practice Parameters of the American College of Gastroenterology. Am J Gastroenterol. 1998;93:2330-2338.
34. Gisbert J, Abraira V. Accuracy of Helicobacter pylori diagnostic tests in patients with bleeding peptic ulcer: a systematic review and meta-analysis. Am J Gastroenterol. 2006;101:848-863.
35. Kamangar F, Dawsey SM, Blaser MJ, et al. Opposing risks of gastric cardiac and noncardia gastric adenocarcinomas associated with Helicobacter pylori seropositivity. J Natl Cancer Inst. 2006;98:1445-1452.
36. Islami F, Kamangar F. Helicobacter pylori and esophageal cancer risk: a meta-analysis. Cancer Prevent Res (Phila). 2008;1:329-338.
37. Moayyedi P, Soo S, Deeks J, et al. Eradication of Helicobacter pylori for non-ulcer dyspepsia. Cochrane Database Syst Rev. 2006;(2):CD002096.
38. Mazzoleni LE, Sander GB, Francesconi CF, et al. Helicobacter pylori eradication in functional dyspepsia: HEROES trial. Arch Intern Med. 2011;171:1929-1936.
39. Yuan Y, Ford AC, Khan KJ, et al. Optimum duration of regimens for Helicobacter pylori eradication. Cochrane Database Syst Rev. 2013;(12):CD008337.
40. Zou J, Dong J, Yu X. Meta-analysis: Lactobacillus containing quadruple therapy versus standard triple first-line therapy for Helicobacter pylori eradication. Helicobacter. 2009;14:97-107.
41. Basu PP, Rayapudi K, Pacana T, et al. A randomized study comparing levofloxacin, omeprazole, nitazoxanide, and doxycycline versus triple therapy for the eradication of Helicobacter pylori. Am J Gastroenterol. 2011;106:1970-1975.
42. Wu DC, Hsu PI, Wu JY, et al. Sequential and concomitant therapy with 4 drugs are equally effective for eradication of H. pylori infection. Clin Gastroenterol Hepatol. 2010;8:36–41.
43. Osato R, Reddy R, Reddy SG, et al. Pattern of primary resistance of Helicobacter pylori to metronidazole or clarithromycin in the United States. Arch Intern Med. 2001;161:1217-1220.
44. Fischbach L, Evans EL. Meta-analysis: the effect of antibiotic resistance status on the efficacy of triple and quadruple firstline therapies for Helicobacter pylori. Aliment Pharmacol Ther. 2007;26:343-357.
45. Hinostroza Morales D, Díaz Ferrer J. Addition of bismuth subsalicylate to triple eradication therapy for Helicobacter pylori infection: efficiency and adverse events. Rev Gastroenterol Peru. 2014;34:315-320.
46. Rabeneck L, Wristers K, Souchek J, et al. Impact of upper endoscopy on satisfaction in patients with previously uninvestigated dyspepsia. Gastrointest Endosc. 2003;57:295-299.
47. Hojo M, Miwa H, Yokoyama T, et al. Treatment of functional dyspepsia with antianxiety or antidepressive agents: systematic review. J Gastroenterol. 2005;40:1036-1042.
48. Soo S, Moayyedi P, Deeks J, et al. Psychological interventions for non-ulcer dyspepsia. Cochrane Database Syst Rev. 2005;(2):CD002301.
49. Lima FA, Ferreira LE, Pace FH. Acupuncture effectiveness as a complementary therapy in functional dyspepsia patients. Arq Gastroenterol. 2013;50:202-207.
50. Ma TT, Yu SY, Li Y, et al. Randomised clinical trial: an assessment of acupuncture on specific meridian or specific acupoint vs. sham acupuncture for treating functional dyspepsia. Aliment Pharmacol Ther. 2012;35:552-561.
51. Koretz RL, Rotblatt M. Complementary and alternative medicine in gastroenterology: the good, the bad, and the ugly. Clin Gastroenterol Hepatol. 2004;2:957-967.
› Review the medications taken by patients who suffer from dyspepsia, as many drugs—bisphosphonates, antibiotics, steroids, and nonsteroidal anti-inflammatory drugs, among others—are associated with this condition. B
› Order an esophagogastroduodenoscopy for patients ages 55 years or older with new-onset dyspepsia and those who have red flags for more serious conditions, eg, a history of upper gastrointestinal (GI) cancer, unintended weight loss, GI bleeding, dysphagia, or a palpable mass. C
› Prescribe acid suppression therapy as first-line treatment for patients who have dyspepsia but are at low risk or have tested negative for Helicobacter pylori infection. A
Strength of recommendation (SOR)
A Good-quality patient-oriented evidence
B Inconsistent or limited-quality patient-oriented evidence
C Consensus, usual practice, opinion, disease-oriented evidence, case series
Each year, an estimated 25% to 30% of the US population suffers from dyspepsia.1 Most self-treat with home remedies and over-the-counter products, but others seek medical care. Dyspepsia accounts for an estimated 2% to 5% of primary care visits annually,2 mostly by patients who are found to have no organic, or structural, cause for their symptoms.1,3
Such patients are said to have functional dyspepsia (FD), a category that applies to about two-thirds of those with dyspepsia.1 A small number of cases are categorized as organic dyspepsia, indicating the presence of a clear structural or anatomic cause, such as an ulcer or mass. The remainder are said to have undifferentiated dyspepsia, which simply means that their signs and symptoms do not rise to the level for which further investigation is warranted and thus it is not known whether it is functional or organic.
There are many possible causes of FD, ranging from medications3,4 to abnormal gastroduodenal motility5,6 to Helicobacter pylori infection,7 and a comprehensive differential diagnosis. The first step in an investigation is to rule out red flags suggestive of gastrointestinal (GI) cancer or other serious disorders.
Patients with FD, like the vast majority of those you’ll treat in a primary care setting, suffer significant morbidity. Most have chronic symptoms, with intermittent flare-ups interspersed with periods of remission.8 In the text and dyspepsia treatment ALGORITHM5,7-12 that follow, you’ll find an evidence-based patient management approach.
Symptoms and causes: What to look for
The primary symptoms of dyspepsia include bothersome postprandial fullness, early satiety, and epigastric pain and burning. To meet the Rome criteria for dyspepsia, these symptoms must have been present for the last 3 months and have had an onset ≥6 months prior to diagnosis.2 Recurrent belching and nausea are also common, but are not included in the Rome diagnostic criteria.
Symptom severity is a poor predictor of the seriousness of the condition, however, and more intense symptoms are no more likely than milder cases to have an organic cause.13,14 Indeed, anxiety is a common comorbidity in patients with FD and a risk factor for the diagnosis. Compared with the general public, patients with FD have been found to have higher levels of anxiety, chronic tension, hostility, and hypochondriasis, and a tendency to be more pessimistic.15
Possible causes of FD
While the etiology of organic dyspepsia is clear, the cause of FD is often far more difficult to determine.
Medication use should always be considered, as many types of drugs—including bisphosphonates, antibiotics, narcotics, steroids, iron, metformin, and nonsteroidal anti-inflammatory drugs (NSAIDs)—are associated with dyspepsia.3,4
Gastroduodenal motility and accommodation, which has been found in numerous studies of patients with FD, is a proposed etiology.5,6
Visceral hypersensitivity also appears to play a role. In one study of patients with severe dyspepsia, 87% of those with FD had a reduced or altered GI pain threshold, compared with 20% of those with organic dyspepsia.16
H pylori, commonly linked to peptic ulcer disease (PUD), is also associated with both organic dyspepsia and FD.17,18 The gram-negative rod-shaped bacterium is present in approximately half of the population worldwide, but is more common in developing nations.7H pylori immunoglobulin G (IgG) is more prevalent in patients with dyspepsia, particularly in those younger than 30 years of age. The exact mechanism by which H pylori causes non-ulcerative dyspepsia is not clear, but inflammation, dysmotility, visceral hypersensitivity, and alteration of acid secretion have all been proposed.17
Dysfunctional intestinal epithelium is increasingly being considered in the pathophysiology of dyspepsia, among other conditions. Researchers theorize that certain foods, toxins, infections, and/or other stressors lead to changes in the structure and function of tight junctions, resulting in increased intestinal permeability.19 This in turn is thought to allow the outflow of antigens through the leaky epithelium and to stimulate an immune response—a process that may play a role in the increased GI inflammation or hypersensitivity associated with dyspepsia. The “leaky gut” theory may eventually lead to new ways to treat dyspepsia, but thus far, highquality evidence of the efficacy of treatments aimed at this mechanism is lacking.
A range of disorders included in the differential
The primary differential diagnosis for dyspepsia includes gastroesophageal reflux disease (GERD), esophagitis, chronic PUD (including both gastric and duodenal ulcers), and malignancy. The differential may also include biliary disorder, pancreatitis, hepatitis, or other liver disease; chronic abdominal wall pain, irritable bowel syndrome, motility disorders, or infiltrative diseases of the stomach (eosinophilic gastritis, Crohn’s disease, sarcoidosis); celiac disease and food sensitivities/allergies, including gluten, lactose, and other intolerances; cardiac disease, including acute coronary syndrome, myocardial infarction, and arrhythmias; intestinal angina; small intestine bacterial overgrowth; heavy metal toxicity; and hypercalcemia.8
Ulcers are found in approximately 10% of patients undergoing evaluation for dyspepsia.8 Previously, PUD was almost exclusively due to H pylori infection. In developed countries, however, chronic use of NSAIDs, including aspirin, has increased, and is now responsible for most ulcer diseases.20,21 The combination of H pylori infection and NSAID usage appears to be synergistic, with the risk of uncomplicated PUD estimated to be 17.5 times higher among those who test positive for H pylori and take NSAIDs vs a 3- to 4-fold increase in ulcer incidence among those with either of these risk factors alone.22
The work-up starts with a search for red flags
Symptom severity is a poor predictor of the seriousness of dyspepsia; more intense symptoms are no more likely than milder cases to have an organic cause.
Evaluation of a patient with dyspepsia begins with a thorough history. Start by determining whether the patient has any red flags, or alarm features, that may be associated with a more serious condition—particularly an underlying malignancy. One or more of the following is an indication for an esophagogastroduodenoscopy (EGD):5,8,12
• family and/or personal history of upper GI cancer
• unintended weight loss
• GI bleeding
• progressive dysphagia
• unexplained iron-deficiency anemia
• persistent vomiting
• palpable mass or lymphadenopathy
• jaundice.
While it is important to rule out these red flags, they are poor predictors of malignancy.23,24 With the exception of a single study, their positive predictive value was a mere 1%.8 Their usefulness lies in their ability to exclude malignancy, however; when none of these features is present, the negative predictive value for malignancy is >97%.8
Age is also a risk factor. In addition to red flags, EGD is recommended by the American Gastroenterological Association (AGA) for patients with new-onset dyspepsia who are 55 years or older—an age at which upper GI malignancy becomes more common. A repeat EGD is rarely indicated, unless Barrett’s esophagus or severe erosive esophagitis is found on the initial EGD.25
Physical exam, H pylori evaluation follow
A physical examination of all patients presenting with symptoms suggestive of dyspepsia is crucial. While the exam is usually normal, it may reveal epigastric tenderness on abdominal palpation. Rebound tenderness, guarding, or evidence of other abnormalities should raise the prospect of alternative diagnoses. GERD, for example, has many symptoms in common with dyspepsia, but is a more likely diagnosis in a patient who has retrosternal burning discomfort and regurgitation and reports that symptoms worsen at night and when lying down.
Lab work has limited value. Although laboratory work is not specifically addressed in the AGA guidelines (except for H pylori testing), a complete blood count is a reasonable part of an initial evaluation of dyspepsia to check for anemia. Other routine blood work is not needed, but further lab testing may be warranted based on the history, exam, and differential diagnosis.
H pylori risk. Because of the association between dyspepsia and H pylori, evaluating the patient’s risk for infection with this bacterium, based primarily on his or her current and previous living conditions (TABLE 1),9 is the next step. Although a test for H pylori could be included in the initial work-up of all patients with dyspepsia, a better—and more cost-effective—strategy is to initially test only those at high risk. (More on testing and treating H pylori in a bit.)
Initiate acid suppression therapy for low-risk patients
First-line treatment for patients with dyspepsia who have no red flags for malignancy or other serious conditions and either are not at high risk for H pylori or are at high risk but have been tested for it and had negative results is a 4- to 8-week course of acid suppression therapy. Patients at low risk for H pylori should be tested for the bacterium only if therapy fails to alleviate their symptoms.9
H2RAs or PPIs? A look at the evidence
In a Cochrane review, both H2 receptor antagonists (H2RAs) and proton pump inhibitors (PPIs) were significantly more effective than placebo for treating FD.26 However, H2RAs can lead to tachyphylaxis—an acute decrease in response to a drug—within 2 to 6 weeks, thus limiting their long-term efficacy.27
PPIs appear to be more effective than H2RAs, and are the AGA’s acid suppression drug of choice.11 The CADET study, a randomized controlled trial comparing PPIs (omeprazole 20 mg/d) with an H2RA (ranitidine 150 mg BID) and a prokinetic agent (cisapride 20 mg BID) as well as placebo for dyspepsia, found the PPI to be superior to the H2RA at 6 months.28 In a systematic review, the number needed to treat with PPI therapy for improvement of dyspepsia symptoms was 9.29
There is no specified time limit for the use of PPIs. AGA guidelines recommend that patients who respond to initial therapy stop treatment after 4 to 8 weeks.11 If symptoms recur, another course of the same treatment is justified; if necessary, therapy can continue long term. However, patients should be made aware of the risk for vitamin deficiency, osteoporosis, and fracture, as well as arrhythmias, Clostridium difficile infection, and rebound upon abrupt discontinuation of PPIs.
When to test for H pylori ...
Empiric treatment for H pylori is not recommended. Thus, testing is indicated for patients who have risk factors for the bacterium or who fail to respond to acid suppression therapy. There are various ways to test for the presence of H pylori. Which test you choose depends, in part, on patient-specific factors.
Serology. IgG serology testing is extremely useful in patients who have never been diagnosed with H pylori. It is best suited for those who are currently taking proton pump inhibitors (PPIs) or who recently completed a course of antibiotics, since neither medication affects the results of the serology test.
Serology testing should not be used, however, for any patient who was previously diagnosed with or treated for H pylori, because this type of test cannot distinguish between an active or past infection. The IgG serology test has a sensitivity of 87% and a specificity of 67%.30
Stool antigen. Stool tests using monoclonal antibodies to detect the presence of H pylori have a sensitivity of 87% to 92% and a specificity of 70%. Stool antigen is also an excellent post-treatment test to confirm that H pylori has been eradicated.31
Stool testing has some drawbacks, however. PPIs can decrease the sensitivity and should be discontinued at least 2 weeks prior to stool testing.32 In addition, a stool test for H pylori is not accurate if the patient has an acute GI bleed.
Urea breath testing. This is the most sensitive and specific test for active H pylori infection (90%-96% sensitivity and 88%-96% specificity).33 PPIs can lower the sensitivity of the test, however, and are typically discontinued at least 2 weeks prior to testing. Urea breath testing, like stool testing, is an excellent way to confirm that H pylori has been eradicated after treatment. However, it is more expensive than other tests for H pylori and often inconvenient to obtain.13
An EGD is indicated for a patient who has failed to respond to acid suppression therapy and has a negative serology, stool antigen, or urea breath test for H pylori.
Biopsy-based testing for H pylori is performed with EGD and is therefore reserved for patients who have red flags or other indications of a need for invasive testing. There are 3 types of biopsy-based tests: urease (sensitivity, 70%-90%; specificity, 95%); histology (87%-92% and 70%, respectively); and culture (85%-88% and 69%, respectively). Overall, the specificity is slightly better than that of noninvasive testing, but the sensitivity can be lowered by recent use of PPIs, bismuth, or antibiotics.12,34
... and how to treat it
H pylori infection is associated with an increased risk of noncardiac gastric adenocarcinoma, but a decreased risk of cardiac gastric adenocarcinoma and esophageal adenocarcinoma.35,36 Thus, the potential to reduce the risk of gastric cancer is not considered an indication for H pylori treatment. The possibility of improving dyspepsia symptoms is a reason to treat H pylori infection, although eradicating it does not always do so.
In a 2006 Cochrane Review, treating H pylori had a small but statistically significant benefit for patients with FD (NNT=14).37 A 2011 study on the effects of H pylori eradication on symptoms and quality of life in primary care patients with FD revealed a 12.5% improvement in quality of life and a 10.6% improvement in symptoms.38
The triple therapy regimen (a PPI + amoxicillin + clarithromycin) is the most common first-line H pylori treatment in the United States, and a good initial choice in regions in which clarithromycin resistance is low (TABLE 2).39-44 The standard duration is 7 days. A 2013 Cochrane Review showed that a longer duration (14 days) increased the rate of eradication (82% vs 73%), but this remains controversial.39 The addition of bismuth subsalicylate to the triple therapy regimen has been shown to increase the eradication rate of H pylori by approximately 10%.45 Adding probiotics (saccharomyces or lactobacillus) appears to increase eradication rates, as well.40
Sequential therapy consists of a 5-day course of treatment in which a PPI and amoxicillin are taken twice a day, followed by another 5-day course of a PPI, clarithromycin, and metronidazole. A recent meta-analysis of sequential therapy showed that it is superior to 7-day triple therapy but equivalent to 14-day triple therapy.40
LOAD (levofloxacin, omeprazole, nitazoxanide, and doxycycline) therapy for 7 to 10 days can be used in place of triple therapy in areas of high resistance or for persistent H pylori. In one study, the H pylori eradication rate for a 7-day course of LOAD therapy—levofloxacin and doxycycline taken once a day, omeprazole before breakfast, and nitazoxanide twice daily—was 90% vs 73.3% for a 7-day course of triple therapy.41
Quadruple therapy has 2 variations: bismuth-based and non-bismuth (concomitant) therapy. The latter uses the base triple therapy and adds either metronidazole or tinidazole for 7 to 14 days. In a multicenter randomized trial, this concomitant therapy was found to have similar efficacy to sequential therapy.42
Bismuth-based quad therapy includes a PPI, bismuth, metronidazole, and tetracycline. A meta-analysis found it to have a higher rate of eradication than triple therapy for patients with antibiotic resistance.43,44
For persistent H pylori, a PPI, levofloxacin, and amoxicillin for 10 days has been shown to be more effective and better tolerated than quadruple therapy.12
Confirmation is indicated when symptoms persist
If dyspepsia symptoms persist after H pylori treatment, it is reasonable to retest to confirm that the infection has in fact been eradicated. Confirmation is also indicated if the patient has an H pylori-associated ulcer or a prior history of gastric cancer.
Retesting should be performed at least 4 to 6 weeks after treatment is completed. If H pylori has not been eradicated, you can try another regimen. If retesting confirms eradication and symptoms persist, EGD with biopsy is indicated. Although EGD typically has a very low yield, even for patients with red flags, this invasive test often provides reassurance and increased satisfaction for patients with persistent symptoms.46
More options for challenging cases
Managing FD is challenging when both initial acid suppression therapy and H pylori eradication fail. Unproven but low-risk treatments include modification of eating habits (eg, eating slower, not gulping food), reducing stress, discontinuing medications that may be related to symptoms, avoiding foods that seem to exacerbate symptoms, and cutting down or eliminating tobacco, caffeine, alcohol, and carbonated beverages.8 Bismuth salts have been shown to be superior to placebo for the treatment of dyspepsia.25 Small studies have also demonstrated a favorable risk–benefit ratio for peppermint oil and caraway oil for the treatment of FD.47 Prokinetics have shown efficacy compared with placebo, although a Cochrane review questioned their efficacy based on publication bias.26
There is no good evidence of efficacy for over-the-counter antacids, such as TUMS, or for GI “cocktails” (antacid, antispasmotic, and lidocaine), sucralfate, psychological interventions (eg, cognitive behavioral therapy, relaxation therapy, or hypnosis), or antidepressants.48,49 Several recent randomized controlled trials have shown the efficacy of acupuncture for the treatment of dyspepsia.49,50 Ginger may also be helpful; it has been found to help with nausea in other GI conditions, but it’s uncertain whether it can help patients with dyspepsia.51
CORRESPONDENCE
Michael Malone, MD, 845 Fishburn Road, Hershey, PA 17053; [email protected]
1. Shaib Y, El-Serag HB. The prevalence and risk factors of functional dyspepsia in a multiethnic population in the United States. Am J Gastroenterol. 2004;99:2210-2216.
2. Talley NJ. Dyspepsia: management guidelines for the millennium. Gut. 2002;50(suppl 4):iv72–iv78.
3. Harmon RC, Peura DA. Evaluation and management of dyspepsia. Therap Adv Gastroenterol. 2010;3:87–98.
4. Bazaldua OV, Schneider FD. Evaluation and management of dyspepsia. Am Fam Physician. 1999;60:1773-1784.
5. Tack J, Talley NJ, Camilleri M, et al. Functional gastroduodenal disorders. Gastroenterology. 2006;130:1466-1479.
6. Haag S, Talley NJ, Holtmann G. Symptom patterns in functional dyspepsia and irritable bowel syndrome: relationship to disturbances in gastric emptying and response to a nutrient challenge in consulters and non-consulters. Gut. 2004;53:1445-1451.
7. Malfertheiner P, Megraud F, O’Morain CA, et al; European Helicobacter Study Group. Management of Helicobacter pylori infection—the Maastricht IV/Florence Consensus Report. Gut. 2012;61:646-664.
8. Talley NJ, Vakil NB, Moayyedi P. American Gastroenterological Association technical review on the evaluation of dyspepsia. Gastroenterology. 2005;129:1756-1780.
9. Moayyedi P, Axon AT. The usefulness of the likelihood ratio in the diagnosis of dyspepsia and gastroesophageal reflux disease. Am J Gastroenterol. 1999;94:3122-3125.
10. McColl KE. Clinical practice. Helicobacter pylori infection. N Engl J Med. 2010;362:1597-1604.
11. Kahrilas PJ, Shaheen NJ, Vaezi MF, et al; American Gastroenterological Association. American Gastroenterological Association Medical Position Statement on the management of gastroesophageal reflux disease. Gastroenterology. 2008;135:1383-1391.
12. Chey WD, Wong BC; Practice Parameters Committee of the American College of Gastroenterology. American College of Gastroenterology guideline on the management of Helicobacter pylori Infection. Am J Gastroenterol. 2007;102:1808-1825.
13. Moayyedi P, Talley NJ, Fennerty MB, et al. Can the clinical history distinguish between organic and functional dyspepsia? JAMA. 2006;295:1566-1576.
14. Eslick GD, Howell SC, Hammer J, et al. Empirically derived symptom sub-groups correspond poorly with diagnostic criteria for functional dyspepsia and irritable bowel syndrome. A factor and cluster analysis of a patient sample. Aliment Pharmacol Ther. 2004;19:133-140.
15. Aro P, Talley NJ, Ronkainen J, et al. Anxiety is associated with uninvestigated and functional dyspepsia (Rome III criteria) in a Swedish population-based study. Gastroenterology. 2009;137:94-100.
16. Mertz H, Fullerton S, Naliboff B, et al. Symptoms and visceral perception in severe functional and organic dyspepsia. Gut. 1998;42:814-822.
17. O’Morain C. Role of Helicobacter pylori in functional dyspepsia. World J Gastroenterol. 2006;12:2677-2680.
18. Shmuely H, Obure S, Passaro DJ, et al. Dyspepsia symptoms and Helicobacter pylori infection, Nakuru, Kenya. Emerg Infect Dis. 2003;9:1103-1107.
19. Barbara G, Zecchi L, Barbaro R, et al. Mucosal permeability and immune activation as potential therapeutic targets of probiotics in irritable bowel syndrome. J Clin Gastroenterol. 2012;46(suppl):S52-S55.
20. Liu NJ, Lee CS, Tang JH, et al. Outcomes of bleeding peptic ulcers: a prospective study. J Gastroenterol Hepatol. 2008;23:e340-e347.
21. Ramsoekh D, van Leerdam ME, Rauws EA, et al. Outcome of peptic ulcer bleeding, nonsteroidal anti-inflammatory drug use, and Helicobacter pylori infection. Clin Gastroenterol Hepatol. 2005;3:859-864.
22. Papatheodoridis GV, Sougioultzis S, Archimandritis AJ. Effects of Helicobacter pylori and nonsteroidal anti-inflammatory drugs on peptic ulcer disease: a systematic review. Clin Gastroenterol Hepatol. 2006;4:130-142.
23. Bai Y, Li ZS, Zou DW, et al. Alarm features and age for predicting upper gastrointestinal malignancy in Chinese patients with dyspepsia with high background prevalence of Helicobacter pylori infection and upper gastrointestinal malignancy: an endoscopic database review of 102,665 patients from 1996 to 2006. Gut. 2010;59:722-728.
24. Vakil N. Dyspepsia, peptic ulcer, and H. pylori: a remembrance of things past. Am J Gastroenterol. 2010;105:572-574.
25. Shaheen NJ, Weinberg DS, Denberg TD, et al; Clinical Guidelines Committee of the American College of Physicians. Upper endoscopy for gastroesophageal reflux disease: best practice advice from the clinical guidelines committee of the American College of Physicians. Ann Intern Med. 2012;157:808-816.
26. Moayyedi P, Soo S, Deeks J, et al. Pharmacological interventions for non-ulcer dyspepsia. Cochrane Database Syst Rev. 2006;(4):CD001960.
27. Chiu CT, Hsu CM, Wang CC, et al. Randomised clinical trial: sodium alginate oral suspension is non-inferior to omeprazole in the treatment of patients with non-erosive gastroesophageal disease. Aliment Pharmacol Ther. 2013;38:1054-1064.
28. Veldhuyzen van Zanten SJ, Chiba N, Armstrong D, et al. A randomized trial comparing omeprazole, ranitidine, cisapride, or placebo in helicobacter pylori negative, primary care patients with dyspepsia: the CADET-HN Study. Am J Gastroenterol. 2005;100:1477-1488.
29. Moayyedi P, Delaney BC, Vakil N, et al. The efficacy of proton pump inhibitors in nonulcer dyspepsia: a systematic review and economic analysis. Gastroenterology. 2004;127:1329-1337.
30. Garza-González E, Bosques-Padilla FJ, Tijerina-Menchaca R, et al. Comparison of endoscopy-based and serum-based methods for the diagnosis of Helicobacter pylori. Can J Gastroenterol. 2003;17:101-106.
31. Kodama M, Murakami K, Okimoto T, et al. Influence of proton pump inhibitor treatment on Helicobacter pylori stool antigen test. World J Gastroenterol. 2012;18:44-48.
32. Shimoyama T. Stool antigen tests for the management of Helicobacter pylori infection. World J Gastroenterol. 2013;19:8188-8191.
33. Howden CW, Hunt RH. Guidelines for the management of Helicobacter pylori infection. Ad Hoc Committee on Practice Parameters of the American College of Gastroenterology. Am J Gastroenterol. 1998;93:2330-2338.
34. Gisbert J, Abraira V. Accuracy of Helicobacter pylori diagnostic tests in patients with bleeding peptic ulcer: a systematic review and meta-analysis. Am J Gastroenterol. 2006;101:848-863.
35. Kamangar F, Dawsey SM, Blaser MJ, et al. Opposing risks of gastric cardiac and noncardia gastric adenocarcinomas associated with Helicobacter pylori seropositivity. J Natl Cancer Inst. 2006;98:1445-1452.
36. Islami F, Kamangar F. Helicobacter pylori and esophageal cancer risk: a meta-analysis. Cancer Prevent Res (Phila). 2008;1:329-338.
37. Moayyedi P, Soo S, Deeks J, et al. Eradication of Helicobacter pylori for non-ulcer dyspepsia. Cochrane Database Syst Rev. 2006;(2):CD002096.
38. Mazzoleni LE, Sander GB, Francesconi CF, et al. Helicobacter pylori eradication in functional dyspepsia: HEROES trial. Arch Intern Med. 2011;171:1929-1936.
39. Yuan Y, Ford AC, Khan KJ, et al. Optimum duration of regimens for Helicobacter pylori eradication. Cochrane Database Syst Rev. 2013;(12):CD008337.
40. Zou J, Dong J, Yu X. Meta-analysis: Lactobacillus containing quadruple therapy versus standard triple first-line therapy for Helicobacter pylori eradication. Helicobacter. 2009;14:97-107.
41. Basu PP, Rayapudi K, Pacana T, et al. A randomized study comparing levofloxacin, omeprazole, nitazoxanide, and doxycycline versus triple therapy for the eradication of Helicobacter pylori. Am J Gastroenterol. 2011;106:1970-1975.
42. Wu DC, Hsu PI, Wu JY, et al. Sequential and concomitant therapy with 4 drugs are equally effective for eradication of H. pylori infection. Clin Gastroenterol Hepatol. 2010;8:36–41.
43. Osato R, Reddy R, Reddy SG, et al. Pattern of primary resistance of Helicobacter pylori to metronidazole or clarithromycin in the United States. Arch Intern Med. 2001;161:1217-1220.
44. Fischbach L, Evans EL. Meta-analysis: the effect of antibiotic resistance status on the efficacy of triple and quadruple firstline therapies for Helicobacter pylori. Aliment Pharmacol Ther. 2007;26:343-357.
45. Hinostroza Morales D, Díaz Ferrer J. Addition of bismuth subsalicylate to triple eradication therapy for Helicobacter pylori infection: efficiency and adverse events. Rev Gastroenterol Peru. 2014;34:315-320.
46. Rabeneck L, Wristers K, Souchek J, et al. Impact of upper endoscopy on satisfaction in patients with previously uninvestigated dyspepsia. Gastrointest Endosc. 2003;57:295-299.
47. Hojo M, Miwa H, Yokoyama T, et al. Treatment of functional dyspepsia with antianxiety or antidepressive agents: systematic review. J Gastroenterol. 2005;40:1036-1042.
48. Soo S, Moayyedi P, Deeks J, et al. Psychological interventions for non-ulcer dyspepsia. Cochrane Database Syst Rev. 2005;(2):CD002301.
49. Lima FA, Ferreira LE, Pace FH. Acupuncture effectiveness as a complementary therapy in functional dyspepsia patients. Arq Gastroenterol. 2013;50:202-207.
50. Ma TT, Yu SY, Li Y, et al. Randomised clinical trial: an assessment of acupuncture on specific meridian or specific acupoint vs. sham acupuncture for treating functional dyspepsia. Aliment Pharmacol Ther. 2012;35:552-561.
51. Koretz RL, Rotblatt M. Complementary and alternative medicine in gastroenterology: the good, the bad, and the ugly. Clin Gastroenterol Hepatol. 2004;2:957-967.

Cirrhosis Complications: Keeping Them Under Control
› Prescribe low-dose diuretics and recommend sodium restriction for patients with cirrhosis who have grade 2 (moderate) ascites. C
› Initiate treatment with beta-blockers to prevent variceal bleeding in all patients with medium or large varices, as well as in those with small varices who also have red wale signs and/or Child-Pugh Class B or C cirrhosis. A
› Consider evaluation for liver transplantation for a patient with cirrhosis who has experienced a major complication (eg, ascites, hepatic encephalopathy, or variceal hemorrhage) or one who has a model for end-stage liver disease (MELD) score ≥15. B
Strength of recommendation (SOR)
A Good-quality patient-oriented evidence
B Inconsistent or limited-quality patient-oriented evidence
C Consensus, usual practice, opinion, disease-oriented evidence, case series
CASE › Joe M, age 59, seeks care at the local emergency department (ED) for shortness of breath. He also complains that his abdomen has been getting “bigger and bigger.” The ED physician recognizes that he is suffering from cirrhosis with secondary ascites and admits him. A paracentesis is performed and 7 L of fluid are removed. The patient is started on furosemide 40 mg/d and the health care team educates him about the relationship between his alcohol consumption and his enlarging abdomen. At discharge, he is told to follow up with his primary care physician.
Two weeks later, the patient arrives at your clinic for followup. What is the next step in managing this patient?
Cirrhosis—the end stage of chronic liver disease characterized by inflammation and fibrosis—is a relatively common and often fatal diagnosis. In the United States, an estimated 633,000 adults have cirrhosis,1 and each year approximately 32,000 people die from the condition.2 The most common causes of cirrhosis are heavy alcohol use, chronic hepatitis B or C infection, nonalcoholic fatty liver disease, and nonalcoholic steatohepatitis.3 Cirrhosis typically involves degeneration and necrosis of hepatocytes, which are replaced by fibrotic tissues and regenerative nodules, leading to loss of liver function.4
Patients with cirrhosis can be treated as outpatients—that is, until they decompensate. Obviously, treatment specific to the underlying causes of cirrhosis, such as interferon for a patient with hepatitis and abstinence for a patient with alcohol-related liver disease, should be the first concern. However, this article focuses on the family physician’s role in identifying and treating several of the most common complications of cirrhosis, including ascites, variceal bleeding, hepatic encephalopathy, and hepatorenal syndrome. We will also cover which patients should be referred for evaluation for liver transplantation. (For a guide to providing patient education for individuals with cirrhosis, see “Dx cirrhosis: What to teach your patient”.3,5-10)
Sodium restriction, diuretics are first steps for ascites
The goals of ascites treatment are to prevent or relieve dyspnea and abdominal pain and to prevent life-threatening complications, such as spontaneous bacterial peritonitis (SBP) and hepatorenal syndrome.11 Patient education is key regarding weight gain; that’s why it’s important to instruct patients to contact you if they gain more than 2 lbs/d for 3 consecutive days or more than 10 lbs.12
Approximately 10% of patients with ascites respond well to sodium restriction alone (1500-2000 mg/d).11 In addition to sodium restriction, patients with grade 2 ascites (moderate ascites with proportionate abdominal distension) should receive a low-dose diuretic, such as spironolactone (initial dose, 50-100 mg/d; increase up to 200-300 mg/d)13 or amiloride (5-10 mg/d).5
Painful gynecomastia and hyperkalemia are the most common adverse effects of spironolactone.13 Amiloride has fewer adverse effects than spironolactone, but is less effective.11 Low-dose furosemide (20-40 mg/d) may be added, although weight loss should be monitored to watch for excessive diuresis, which can lead to renal failure, hyponatremia, or encephalopathy.5,13 Also monitor electrolytes to watch for hypokalemia or hyponatremia.13
Recommended weight loss to prevent renal failure is 300 to 500 g/d (.66-1.1 lbs/d) for patients without peripheral edema, and 800 to 1000 g/d (1.7-2.2 lbs/d) for patients with peripheral edema.5,13
Patients with grade 3 (tense) or refractory ascites should have large-volume paracentesis (LVP) plus an albumin infusion.5 LVP (removal of >5 L of fluid) is more effective, faster, and has less risk of adverse effects than increasing the dosage of the patient’s diuretic.5,13 LVP can be done in an outpatient setting and is considered safe—even for patients with a prolonged prothrombin time.13,14 Rare complications of LVP include significant bleeding at the puncture site, infection, and intestinal perforation.5
Diuretics should be prescribed after LVP to prevent ascites recurrence.5 Plasma expanders can prevent hepatorenal syndrome, ascites recurrence, and dilutional hyponatremia.5,11 Albumin is the most efficacious of these agents;5,14 it is administered intravenously at a dose of 8 to 10 g/L of fluid removed.13,15
Take steps to prevent variceal bleeding
Soon after a patient is diagnosed with cirrhosis, he or she should undergo esophagogastroduodenoscopy to screen for the presence and size of varices.16 Although they can’t prevent esophagogastric varices, nonselective beta-blockers (NSBBs) are the gold standard for preventing first variceal hemorrhage in patients with small varices with red wale signs on the varices and/or Child-Pugh Class B or C cirrhosis (TABLE17), and in all patients with medium or large varices.18 Propranolol is usually started at 20 mg BID, or nadolol is started at 20 to 40 mg/d.16 The NSBB dose is adjusted to the maximum tolerated dose, which occurs when the patient's heart rate is reduced to 55 to 60 beats/min.
NSBBs are associated with poor survival in patients with refractory ascites and thus are contraindicated in these patients.19 NSBBs also should not be taken by patients with SBP because use of these medications is associated with worse outcomes compared to those not receiving NSBBs.20
Endoscopic variceal ligation is an alternative to NSBBs for the primary prophylaxis of variceal hemorrhage in patients with medium to large varices.18 In particular, ligation should be considered for patients with high-risk varices in whom beta-blockers are contraindicated or must be discontinued because of adverse effects.21
Avoid nitrates in patients with varices because these agents do not prevent first variceal hemorrhage and have been associated with higher mortality rates in patients older than 50.16 There is no significant additional benefit or mortality reduction associated with adding a nitrate to an NSBB.22 Transjugular intrahepatic portosystemic shunt (TIPS) or surgically created shunts are reserved for patients for whom medical therapy fails.18
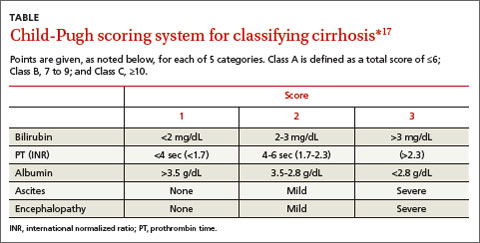
Mental status changes suggest hepatic encephalopathy
Hepatic encephalopathy is a reversible impairment of neuropsychiatric function that is associated with impaired hepatic function. Because a patient with encephalopathy presents with an altered mental status, he or she may need to be admitted to the hospital for evaluation, diagnosis, and treatment.
The goals of hepatic encephalopathy treatment are to identify and correct precipitating causes and lower serum ammonia concentrations to improve mental status.15 Nutritional support should be provided without protein restriction unless the patient is severely proteinintolerant.23 The recommended initial therapy is lactulose 30 to 45 mL 2 to 4 times per day, to decrease absorption of ammonia in the gut. The dose should be titrated until patients have 2 to 3 soft stools daily.24
For patients who can’t tolerate lactulose or whose mental status doesn’t improve within 48 hours, rifaximin 400 mg orally 3 times daily or 550 mg 2 times daily is recommended.25 Neomycin 500 mg orally 3 times a day or 1 g twice daily is a second-line agent reserved for patients who are unable to take rifaximin; however, its efficacy is not well established, and neomycin has been associated with ototoxicity and nephrotoxicity.24
Watch for signs of kidney failure
Hepatorenal syndrome is renal failure induced by severe hepatic injury and characterized by azotemia and decreased renal blood flow and glomerular filtration rate.15 It is a diagnosis of exclusion. Hepatorenal syndrome is typically caused by arterial vasodilation in the splanchnic circulation in patients with portal hypertension.15,26,27 Type 1 hepatorenal syndrome is characterized by at least a 2-fold increase in serum creatinine to a level of >2.5 mg/dL over more than 2 weeks. Patients typically have urine output <400 to 500 mL/d. Type 2 hepatorenal syndrome is characterized by less severe renal impairment; it is associated with ascites that does not improve with diuretics.28
Patients with hepatorenal syndrome should not use any nephrotoxic agents, such as nonsteroidal anti-inflammatory drugs. Inpatient treatment is usually required and may include norepinephrine with albumin, terlipressin with midodrine, or octreotide and albumin. Patients who fail to respond to medical therapy may benefit from TIPS as a bridge until they can undergo liver transplantation.29
When to consider liver transplantation
The appropriateness and timing of liver transplantation should be determined on a case-by-case basis. For some patients with cirrhosis, transplantation may be the definitive treatment. For example, in some patients with hepatocellular carcinoma (HCC), liver transplantation is an option because transplantation can cure the tumor and underlying cirrhosis. However, while transplantation is a suitable option for early HCC in patients with cirrhosis, it has been shown to have limited efficacy in patients with advanced disease who are not selected using specific criteria.30
Referral for evaluation for transplantation should be considered once a patient with cirrhosis experiences a major complication (eg, ascites, variceal hemorrhage, or hepatic encephalopathy).31 Another criterion for timing and allocation of liver transplantation is based on the statistical model for end-stage liver disease (MELD), which is used to predict 3-month survival in patients with cirrhosis based on the relationships between serum bilirubin, serum creatinine, and international normalized ratio values.15 Liver transplantation should be considered for patients with a MELD score ≥15.15,31 Such patients should be promptly referred to a liver transplantation specialist to allow sufficient time for the appropriate psychosocial assessments and medical evaluations, and for patients and their families to receive appropriate education on things like the risks and benefits of transplantation.15
Patients with cirrhosis should be educated about complications of their condition, including ascites, esophageal varices, hepatic encephalopathy, hepatorenal syndrome, spontaneous bacterial peritonitis, and hepatocellular carcinoma (HCC).5 It’s important to explain that they will need to be evaluated every 6 months with serology and ultrasound to assess disease changes.6 Annual screening for HCC should be done with ultrasound or computed tomography scanning with or without alpha-fetoprotein.6
Ensure that your patient knows that he needs to receive the recommended immunizations. The Centers for Disease Control and Prevention recommends that patients with cirrhosis should receive annual influenza, pneumococcal 23, and hepatitis A and B series vaccinations.7
Advise patients with cirrhosis to be cautious when taking any medications. Patients with cirrhosis should avoid nonsteroidal anti-inflammatory drugs because these medications encourage sodium retention, which can exacerbate ascites.6 Acetaminophen use is discouraged, but should not be harmful unless the patient takes >2 g/d.8
Emphasize the importance of eating a healthy diet. Malnutrition is common in patients with cirrhosis3 and correlates with more severe disease and poorer outcomes, including mortality.9 Nutritional recommendations for patients with alcohol-related liver disease include thiamine 50 mg orally or intramuscularly, and riboflavin and pyridoxine in the recommended daily doses.10 Advise patients to take other vitamins, as needed, to treat any deficiencies.9
CASE › After evaluating Mr. M, you prescribe spironolactone 100 mg/d and furosemide 40 mg twice a day to address ascites, and propranolol—which you titrate to 80 mg twice a day—to prevent variceal hemorrhage. Mr. M is maintained on these medications and returns with his daughter, as he has been doing every 2 to 3 months. He is excited that he breathes easily as long as he avoids salt and takes his medications. He continues to see his hepatologist regularly, and his last paracentesis was 4 months ago. He has not used any alcohol since he was taught about the relationship between alcohol and his breathing.
CORRESPONDENCE
Suzanne Minor, MD, FAAF P, Assistant Professor of Family Medicine, Department of Humanities, Health, & Society, Florida International University, Herbert Wertheim College of Medicine, 11200 SW 8th Street, AHC II, 554A, Miami, FL 33199; [email protected]
1. Scaglion S, Kliethermes S, Cao G, et al. The epidemiology of cirrhosis in the United States: A population-based study. J Clin Gastroenterol. 2014. October 8. [Epub ahead of print.]
2. Murphy SL, Xu JQ, Kochanek KD. Deaths: Final data for 2010. National Vital Statistics Reports. National Center for Health Statistics Web site. Available at: http://www.cdc.gov/nchs/data/nvsr/nvsr61/nvsr61_04.pdf. Accessed April 30, 2015.
3. National Institute of Diabetes and Digestive and Kidney Diseases. Cirrhosis. National Institute of Diabetes and Digestive and Kidney Diseases Web site. Available at: http://www.niddk.nih.gov/health-information/health-topics/liver-disease/cirrhosis/Pages/facts.aspx. Accessed April 30, 2015.
4. Zhou WC, Zhang QB, Qiao L. Pathogenesis of liver cirrhosis. World J Gastroenterol. 2014;20:7312-7324.
5. Ginès P, Cárdenas A, Arroyo V, et al. Management of cirrhosis and ascites. N Eng J Med. 2004;350:1646-1654.
6. Grattagliano I, Ubaldi E, Bonfrate L, et al. Management of liver cirrhosis between primary care and specialists. World J Gastroenterol. 2011;17:2273-2282.
7. Centers for Disease Control and Prevention. 2015 recommended immunizations for adults: By age. Centers for Disease Control and Prevention Web site. Available from: http://www.cdc.gov/vaccines/schedules/downloads/adult/adult-schedule-easyread.pdf. Accessed April 28, 2015.
8. Bacon BR. Cirrhosis and its complications. In: Fauci AS, Braunwald E, Kasper DL, et al, eds. Harrison’s Principles of Internal Medicine. 18th ed. New York, NY: McGraw-Hill; 2012. Available from: http://accessmedicine.mhmedical.com/content.aspx?bookid=1130§ionid=79748841. Accessed April 28, 2015.
9. O’Shea RS, Dasarathy S, McCullough AJ. Alcoholic liver disease. Am J Gastroenterol. 2010;105:14-32.
10. National Institute on Alcohol Abuse and Alcoholism. Alcohol Alert. Alcoholic liver disease. U.S. Department of Health & Human Services. 2005. National Institute on Alcohol Abuse and Alcoholism Web site. Available at: http://pubs.niaaa.nih.gov/publications/aa64/aa64.htm. Accessed April 18, 2015.
11. Kashani A, Landaverde C, Medici V, et al. Fluid retention in cirrhosis: pathophysiology and management. QJM. 2008;101:71-85.
12. Chalasani NP, Vuppalanchi RK. Ascites: A common problem in people with cirrhosis. July 2013. American College of Gastroenterology Web site. Available at: http://patients.gi.org/topics/ascites/. Accessed April 28, 2015.
13. Kuiper JJ, van Buuren HR, de Man RA. Ascites in cirrhosis: a review of management and complications. Neth J Med. 2007;65:283-288.
14. Biecker E. Diagnosis and therapy of ascites in liver cirrhosis. World J Gastroentol. 2011;17:1237-1248.
15. Heidelbaugh JJ, Sherbondy M. Cirrhosis and chronic liver failure: Part II. Complications and treatment. Am Fam Physician. 2006;74:767-776.
16. Garcia-Tsao G, Lim JK; Members of Veterans Affairs Hepatitis C Resource Center Program. Management and treatment of patients with cirrhosis and portal hypertension: recommendations from the Department of Veterans Affairs Hepatitis C Resource Center Program and the National Hepatitis C Program. Am J Gastroenterol. 2009;104:1802-1829.
17. Infante-Rivard C, Esnaola S, Villeneuve JP. Clinical and statistical validity of conventional prognostic factors in predicting shortterm survival among cirrhotics. Hepatology. 1987;7:660-664.
18. Garcia-Tsao G, Sanyal AJ, Grace ND, et al; Practice Guidelines Committee of the American Association for the Study of Liver Diseases; Practice Parameters Committee of the American College of Gastroenterology. Prevention and management of gastroesophageal varices and variceal hemorrhage in cirrhosis. Hepatology. 2007;46:922-938.
19. Serste T, Melot C, Francoz C, et al. Deleterious effects of betablockers on survival in patients with cirrhosis and refractory ascites. Hepatology. 2010;52:1017-1022.
20. Mandorfer M, Bota S, Schwabl P, et al. Nonselective b blockers increase risk for hepatorenal syndrome and death in patients with cirrhosis and spontaneous bacterial peritonitis. Gastroenterology. 2014;146:1680–1690.e1.
21. Sarin SK, Lamba GS, Kumar M, et al. Comparison of endoscopic ligation and propranolol for the primary prevention of variceal bleeding. N Engl J Med. 1999;340:988-993.
22. Garcia-Pagan JC, Feu F, Bosch J, et al. Propranolol compared with propranolol plus isosorbide-5-mononitrate for portal hypertension in cirrhosis. A randomized controlled study. Ann Intern Med. 1991;114:869-873.
23. Amodio P, Bemeur C, Butterworth R, et al. The nutritional management of hepatic encephalopathy in patients with cirrhosis: International Society for Hepatic Encephalopathy and Nitrogen Metabolism Consensus. Hepatology. 2013;58:325-336.
24. Sharma P, Sharma BC. Disaccharides in the treatment of hepatic encephalopathy. Metab Brain Dis. 2013;28:313-320.
25. Jiang Q, Jiang XH, Zheng MH, et al. Rifaximin versus nonabsorbable disaccharides in the management of hepatic encephalopathy: a meta-analysis. Eur J Gastroenterol Hepatol. 2008;20:1064-1070.
26. Ginès P, Schrier RW. Renal failure in cirrhosis. N Engl J Med. 2009;361:1279-1290.
27. Iwakiri Y. The molecules: mechanisms of arterial vasodilatation observed in the splanchnic and systemic circulation in portal hypertension. J Clin Gastroenterol. 2007;41(Suppl 3):S288-S294.
28. Epstein M, Berk DP, Hollenberg NK, et al. Renal failure in the patient with cirrhosis. The role of active vasoconstriction. Am J Med. 1970;49:175-185.
29. Singh V, Ghosh S, Singh B, et al. Noradrenaline vs. terlipressin in the treatment of hepatorenal syndrome: a randomized study. J Hepatol. 2012;56:1293-1298.
30. Chua TC, Saxena A, Chu F, et al. Hepatic resection for transplantable hepatocellular carcinoma for patients within Milan and UCSF criteria. Am J Clin Oncol. 2012;35:141-145.
31. Martin P, DiMartini A, Feng S, et al. Evaluation for liver transplantation in adults: 2013 practice guideline by the American Association for the Study of Liver Diseases and the American Society of Transplantation. Hepatology. 2014;59:1144-1165.
› Prescribe low-dose diuretics and recommend sodium restriction for patients with cirrhosis who have grade 2 (moderate) ascites. C
› Initiate treatment with beta-blockers to prevent variceal bleeding in all patients with medium or large varices, as well as in those with small varices who also have red wale signs and/or Child-Pugh Class B or C cirrhosis. A
› Consider evaluation for liver transplantation for a patient with cirrhosis who has experienced a major complication (eg, ascites, hepatic encephalopathy, or variceal hemorrhage) or one who has a model for end-stage liver disease (MELD) score ≥15. B
Strength of recommendation (SOR)
A Good-quality patient-oriented evidence
B Inconsistent or limited-quality patient-oriented evidence
C Consensus, usual practice, opinion, disease-oriented evidence, case series
CASE › Joe M, age 59, seeks care at the local emergency department (ED) for shortness of breath. He also complains that his abdomen has been getting “bigger and bigger.” The ED physician recognizes that he is suffering from cirrhosis with secondary ascites and admits him. A paracentesis is performed and 7 L of fluid are removed. The patient is started on furosemide 40 mg/d and the health care team educates him about the relationship between his alcohol consumption and his enlarging abdomen. At discharge, he is told to follow up with his primary care physician.
Two weeks later, the patient arrives at your clinic for followup. What is the next step in managing this patient?
Cirrhosis—the end stage of chronic liver disease characterized by inflammation and fibrosis—is a relatively common and often fatal diagnosis. In the United States, an estimated 633,000 adults have cirrhosis,1 and each year approximately 32,000 people die from the condition.2 The most common causes of cirrhosis are heavy alcohol use, chronic hepatitis B or C infection, nonalcoholic fatty liver disease, and nonalcoholic steatohepatitis.3 Cirrhosis typically involves degeneration and necrosis of hepatocytes, which are replaced by fibrotic tissues and regenerative nodules, leading to loss of liver function.4
Patients with cirrhosis can be treated as outpatients—that is, until they decompensate. Obviously, treatment specific to the underlying causes of cirrhosis, such as interferon for a patient with hepatitis and abstinence for a patient with alcohol-related liver disease, should be the first concern. However, this article focuses on the family physician’s role in identifying and treating several of the most common complications of cirrhosis, including ascites, variceal bleeding, hepatic encephalopathy, and hepatorenal syndrome. We will also cover which patients should be referred for evaluation for liver transplantation. (For a guide to providing patient education for individuals with cirrhosis, see “Dx cirrhosis: What to teach your patient”.3,5-10)
Sodium restriction, diuretics are first steps for ascites
The goals of ascites treatment are to prevent or relieve dyspnea and abdominal pain and to prevent life-threatening complications, such as spontaneous bacterial peritonitis (SBP) and hepatorenal syndrome.11 Patient education is key regarding weight gain; that’s why it’s important to instruct patients to contact you if they gain more than 2 lbs/d for 3 consecutive days or more than 10 lbs.12
Approximately 10% of patients with ascites respond well to sodium restriction alone (1500-2000 mg/d).11 In addition to sodium restriction, patients with grade 2 ascites (moderate ascites with proportionate abdominal distension) should receive a low-dose diuretic, such as spironolactone (initial dose, 50-100 mg/d; increase up to 200-300 mg/d)13 or amiloride (5-10 mg/d).5
Painful gynecomastia and hyperkalemia are the most common adverse effects of spironolactone.13 Amiloride has fewer adverse effects than spironolactone, but is less effective.11 Low-dose furosemide (20-40 mg/d) may be added, although weight loss should be monitored to watch for excessive diuresis, which can lead to renal failure, hyponatremia, or encephalopathy.5,13 Also monitor electrolytes to watch for hypokalemia or hyponatremia.13
Recommended weight loss to prevent renal failure is 300 to 500 g/d (.66-1.1 lbs/d) for patients without peripheral edema, and 800 to 1000 g/d (1.7-2.2 lbs/d) for patients with peripheral edema.5,13
Patients with grade 3 (tense) or refractory ascites should have large-volume paracentesis (LVP) plus an albumin infusion.5 LVP (removal of >5 L of fluid) is more effective, faster, and has less risk of adverse effects than increasing the dosage of the patient’s diuretic.5,13 LVP can be done in an outpatient setting and is considered safe—even for patients with a prolonged prothrombin time.13,14 Rare complications of LVP include significant bleeding at the puncture site, infection, and intestinal perforation.5
Diuretics should be prescribed after LVP to prevent ascites recurrence.5 Plasma expanders can prevent hepatorenal syndrome, ascites recurrence, and dilutional hyponatremia.5,11 Albumin is the most efficacious of these agents;5,14 it is administered intravenously at a dose of 8 to 10 g/L of fluid removed.13,15
Take steps to prevent variceal bleeding
Soon after a patient is diagnosed with cirrhosis, he or she should undergo esophagogastroduodenoscopy to screen for the presence and size of varices.16 Although they can’t prevent esophagogastric varices, nonselective beta-blockers (NSBBs) are the gold standard for preventing first variceal hemorrhage in patients with small varices with red wale signs on the varices and/or Child-Pugh Class B or C cirrhosis (TABLE17), and in all patients with medium or large varices.18 Propranolol is usually started at 20 mg BID, or nadolol is started at 20 to 40 mg/d.16 The NSBB dose is adjusted to the maximum tolerated dose, which occurs when the patient's heart rate is reduced to 55 to 60 beats/min.
NSBBs are associated with poor survival in patients with refractory ascites and thus are contraindicated in these patients.19 NSBBs also should not be taken by patients with SBP because use of these medications is associated with worse outcomes compared to those not receiving NSBBs.20
Endoscopic variceal ligation is an alternative to NSBBs for the primary prophylaxis of variceal hemorrhage in patients with medium to large varices.18 In particular, ligation should be considered for patients with high-risk varices in whom beta-blockers are contraindicated or must be discontinued because of adverse effects.21
Avoid nitrates in patients with varices because these agents do not prevent first variceal hemorrhage and have been associated with higher mortality rates in patients older than 50.16 There is no significant additional benefit or mortality reduction associated with adding a nitrate to an NSBB.22 Transjugular intrahepatic portosystemic shunt (TIPS) or surgically created shunts are reserved for patients for whom medical therapy fails.18
Mental status changes suggest hepatic encephalopathy
Hepatic encephalopathy is a reversible impairment of neuropsychiatric function that is associated with impaired hepatic function. Because a patient with encephalopathy presents with an altered mental status, he or she may need to be admitted to the hospital for evaluation, diagnosis, and treatment.
The goals of hepatic encephalopathy treatment are to identify and correct precipitating causes and lower serum ammonia concentrations to improve mental status.15 Nutritional support should be provided without protein restriction unless the patient is severely proteinintolerant.23 The recommended initial therapy is lactulose 30 to 45 mL 2 to 4 times per day, to decrease absorption of ammonia in the gut. The dose should be titrated until patients have 2 to 3 soft stools daily.24
For patients who can’t tolerate lactulose or whose mental status doesn’t improve within 48 hours, rifaximin 400 mg orally 3 times daily or 550 mg 2 times daily is recommended.25 Neomycin 500 mg orally 3 times a day or 1 g twice daily is a second-line agent reserved for patients who are unable to take rifaximin; however, its efficacy is not well established, and neomycin has been associated with ototoxicity and nephrotoxicity.24
Watch for signs of kidney failure
Hepatorenal syndrome is renal failure induced by severe hepatic injury and characterized by azotemia and decreased renal blood flow and glomerular filtration rate.15 It is a diagnosis of exclusion. Hepatorenal syndrome is typically caused by arterial vasodilation in the splanchnic circulation in patients with portal hypertension.15,26,27 Type 1 hepatorenal syndrome is characterized by at least a 2-fold increase in serum creatinine to a level of >2.5 mg/dL over more than 2 weeks. Patients typically have urine output <400 to 500 mL/d. Type 2 hepatorenal syndrome is characterized by less severe renal impairment; it is associated with ascites that does not improve with diuretics.28
Patients with hepatorenal syndrome should not use any nephrotoxic agents, such as nonsteroidal anti-inflammatory drugs. Inpatient treatment is usually required and may include norepinephrine with albumin, terlipressin with midodrine, or octreotide and albumin. Patients who fail to respond to medical therapy may benefit from TIPS as a bridge until they can undergo liver transplantation.29
When to consider liver transplantation
The appropriateness and timing of liver transplantation should be determined on a case-by-case basis. For some patients with cirrhosis, transplantation may be the definitive treatment. For example, in some patients with hepatocellular carcinoma (HCC), liver transplantation is an option because transplantation can cure the tumor and underlying cirrhosis. However, while transplantation is a suitable option for early HCC in patients with cirrhosis, it has been shown to have limited efficacy in patients with advanced disease who are not selected using specific criteria.30
Referral for evaluation for transplantation should be considered once a patient with cirrhosis experiences a major complication (eg, ascites, variceal hemorrhage, or hepatic encephalopathy).31 Another criterion for timing and allocation of liver transplantation is based on the statistical model for end-stage liver disease (MELD), which is used to predict 3-month survival in patients with cirrhosis based on the relationships between serum bilirubin, serum creatinine, and international normalized ratio values.15 Liver transplantation should be considered for patients with a MELD score ≥15.15,31 Such patients should be promptly referred to a liver transplantation specialist to allow sufficient time for the appropriate psychosocial assessments and medical evaluations, and for patients and their families to receive appropriate education on things like the risks and benefits of transplantation.15
Patients with cirrhosis should be educated about complications of their condition, including ascites, esophageal varices, hepatic encephalopathy, hepatorenal syndrome, spontaneous bacterial peritonitis, and hepatocellular carcinoma (HCC).5 It’s important to explain that they will need to be evaluated every 6 months with serology and ultrasound to assess disease changes.6 Annual screening for HCC should be done with ultrasound or computed tomography scanning with or without alpha-fetoprotein.6
Ensure that your patient knows that he needs to receive the recommended immunizations. The Centers for Disease Control and Prevention recommends that patients with cirrhosis should receive annual influenza, pneumococcal 23, and hepatitis A and B series vaccinations.7
Advise patients with cirrhosis to be cautious when taking any medications. Patients with cirrhosis should avoid nonsteroidal anti-inflammatory drugs because these medications encourage sodium retention, which can exacerbate ascites.6 Acetaminophen use is discouraged, but should not be harmful unless the patient takes >2 g/d.8
Emphasize the importance of eating a healthy diet. Malnutrition is common in patients with cirrhosis3 and correlates with more severe disease and poorer outcomes, including mortality.9 Nutritional recommendations for patients with alcohol-related liver disease include thiamine 50 mg orally or intramuscularly, and riboflavin and pyridoxine in the recommended daily doses.10 Advise patients to take other vitamins, as needed, to treat any deficiencies.9
CASE › After evaluating Mr. M, you prescribe spironolactone 100 mg/d and furosemide 40 mg twice a day to address ascites, and propranolol—which you titrate to 80 mg twice a day—to prevent variceal hemorrhage. Mr. M is maintained on these medications and returns with his daughter, as he has been doing every 2 to 3 months. He is excited that he breathes easily as long as he avoids salt and takes his medications. He continues to see his hepatologist regularly, and his last paracentesis was 4 months ago. He has not used any alcohol since he was taught about the relationship between alcohol and his breathing.
CORRESPONDENCE
Suzanne Minor, MD, FAAF P, Assistant Professor of Family Medicine, Department of Humanities, Health, & Society, Florida International University, Herbert Wertheim College of Medicine, 11200 SW 8th Street, AHC II, 554A, Miami, FL 33199; [email protected]
1. Scaglion S, Kliethermes S, Cao G, et al. The epidemiology of cirrhosis in the United States: A population-based study. J Clin Gastroenterol. 2014. October 8. [Epub ahead of print.]
2. Murphy SL, Xu JQ, Kochanek KD. Deaths: Final data for 2010. National Vital Statistics Reports. National Center for Health Statistics Web site. Available at: http://www.cdc.gov/nchs/data/nvsr/nvsr61/nvsr61_04.pdf. Accessed April 30, 2015.
3. National Institute of Diabetes and Digestive and Kidney Diseases. Cirrhosis. National Institute of Diabetes and Digestive and Kidney Diseases Web site. Available at: http://www.niddk.nih.gov/health-information/health-topics/liver-disease/cirrhosis/Pages/facts.aspx. Accessed April 30, 2015.
4. Zhou WC, Zhang QB, Qiao L. Pathogenesis of liver cirrhosis. World J Gastroenterol. 2014;20:7312-7324.
5. Ginès P, Cárdenas A, Arroyo V, et al. Management of cirrhosis and ascites. N Eng J Med. 2004;350:1646-1654.
6. Grattagliano I, Ubaldi E, Bonfrate L, et al. Management of liver cirrhosis between primary care and specialists. World J Gastroenterol. 2011;17:2273-2282.
7. Centers for Disease Control and Prevention. 2015 recommended immunizations for adults: By age. Centers for Disease Control and Prevention Web site. Available from: http://www.cdc.gov/vaccines/schedules/downloads/adult/adult-schedule-easyread.pdf. Accessed April 28, 2015.
8. Bacon BR. Cirrhosis and its complications. In: Fauci AS, Braunwald E, Kasper DL, et al, eds. Harrison’s Principles of Internal Medicine. 18th ed. New York, NY: McGraw-Hill; 2012. Available from: http://accessmedicine.mhmedical.com/content.aspx?bookid=1130§ionid=79748841. Accessed April 28, 2015.
9. O’Shea RS, Dasarathy S, McCullough AJ. Alcoholic liver disease. Am J Gastroenterol. 2010;105:14-32.
10. National Institute on Alcohol Abuse and Alcoholism. Alcohol Alert. Alcoholic liver disease. U.S. Department of Health & Human Services. 2005. National Institute on Alcohol Abuse and Alcoholism Web site. Available at: http://pubs.niaaa.nih.gov/publications/aa64/aa64.htm. Accessed April 18, 2015.
11. Kashani A, Landaverde C, Medici V, et al. Fluid retention in cirrhosis: pathophysiology and management. QJM. 2008;101:71-85.
12. Chalasani NP, Vuppalanchi RK. Ascites: A common problem in people with cirrhosis. July 2013. American College of Gastroenterology Web site. Available at: http://patients.gi.org/topics/ascites/. Accessed April 28, 2015.
13. Kuiper JJ, van Buuren HR, de Man RA. Ascites in cirrhosis: a review of management and complications. Neth J Med. 2007;65:283-288.
14. Biecker E. Diagnosis and therapy of ascites in liver cirrhosis. World J Gastroentol. 2011;17:1237-1248.
15. Heidelbaugh JJ, Sherbondy M. Cirrhosis and chronic liver failure: Part II. Complications and treatment. Am Fam Physician. 2006;74:767-776.
16. Garcia-Tsao G, Lim JK; Members of Veterans Affairs Hepatitis C Resource Center Program. Management and treatment of patients with cirrhosis and portal hypertension: recommendations from the Department of Veterans Affairs Hepatitis C Resource Center Program and the National Hepatitis C Program. Am J Gastroenterol. 2009;104:1802-1829.
17. Infante-Rivard C, Esnaola S, Villeneuve JP. Clinical and statistical validity of conventional prognostic factors in predicting shortterm survival among cirrhotics. Hepatology. 1987;7:660-664.
18. Garcia-Tsao G, Sanyal AJ, Grace ND, et al; Practice Guidelines Committee of the American Association for the Study of Liver Diseases; Practice Parameters Committee of the American College of Gastroenterology. Prevention and management of gastroesophageal varices and variceal hemorrhage in cirrhosis. Hepatology. 2007;46:922-938.
19. Serste T, Melot C, Francoz C, et al. Deleterious effects of betablockers on survival in patients with cirrhosis and refractory ascites. Hepatology. 2010;52:1017-1022.
20. Mandorfer M, Bota S, Schwabl P, et al. Nonselective b blockers increase risk for hepatorenal syndrome and death in patients with cirrhosis and spontaneous bacterial peritonitis. Gastroenterology. 2014;146:1680–1690.e1.
21. Sarin SK, Lamba GS, Kumar M, et al. Comparison of endoscopic ligation and propranolol for the primary prevention of variceal bleeding. N Engl J Med. 1999;340:988-993.
22. Garcia-Pagan JC, Feu F, Bosch J, et al. Propranolol compared with propranolol plus isosorbide-5-mononitrate for portal hypertension in cirrhosis. A randomized controlled study. Ann Intern Med. 1991;114:869-873.
23. Amodio P, Bemeur C, Butterworth R, et al. The nutritional management of hepatic encephalopathy in patients with cirrhosis: International Society for Hepatic Encephalopathy and Nitrogen Metabolism Consensus. Hepatology. 2013;58:325-336.
24. Sharma P, Sharma BC. Disaccharides in the treatment of hepatic encephalopathy. Metab Brain Dis. 2013;28:313-320.
25. Jiang Q, Jiang XH, Zheng MH, et al. Rifaximin versus nonabsorbable disaccharides in the management of hepatic encephalopathy: a meta-analysis. Eur J Gastroenterol Hepatol. 2008;20:1064-1070.
26. Ginès P, Schrier RW. Renal failure in cirrhosis. N Engl J Med. 2009;361:1279-1290.
27. Iwakiri Y. The molecules: mechanisms of arterial vasodilatation observed in the splanchnic and systemic circulation in portal hypertension. J Clin Gastroenterol. 2007;41(Suppl 3):S288-S294.
28. Epstein M, Berk DP, Hollenberg NK, et al. Renal failure in the patient with cirrhosis. The role of active vasoconstriction. Am J Med. 1970;49:175-185.
29. Singh V, Ghosh S, Singh B, et al. Noradrenaline vs. terlipressin in the treatment of hepatorenal syndrome: a randomized study. J Hepatol. 2012;56:1293-1298.
30. Chua TC, Saxena A, Chu F, et al. Hepatic resection for transplantable hepatocellular carcinoma for patients within Milan and UCSF criteria. Am J Clin Oncol. 2012;35:141-145.
31. Martin P, DiMartini A, Feng S, et al. Evaluation for liver transplantation in adults: 2013 practice guideline by the American Association for the Study of Liver Diseases and the American Society of Transplantation. Hepatology. 2014;59:1144-1165.
Girl, 5, With Fever and Hip Pain
A 5-year-old Filipino girl was brought to a pediatric clinic for follow up of an unresolved fever and for new-onset right hip pain, which occurred intermittently for the past week and was associated with a right-sided limp. She had been experiencing nightly fevers ranging from 101°F to 105°F for the past two weeks, for which her parents had been giving ibuprofen with mixed results; she remained afebrile during daytime hours.
Using the Wong-Baker FACES pain scale, the patient rated the pain as a 4/10 in severity (“Hurts a Little More” face).1 Standing and walking aggravated the pain but did not limit activity. Although ibuprofen decreased the fever, it did not alleviate the hip pain. Other symptoms included vomiting one to two times daily, without hematemesis, and four to five episodes of diarrhea daily, without abdominal pain, hematochezia, or melena. She also experienced decreased appetite, but her parents reported no change in her dietary or fluid intake. The patient and her parents denied additional symptoms.
Further investigation revealed that the patient had been seen a week earlier by two other clinicians in the office for complaints of fever, rash, nausea, hematemesis, and diarrhea. She had been diagnosed with a herpes simplex viral (HSV) lesion of the nose, epistaxis, and viral gastroenteritis. Her treatment plan consisted of acyclovir ointment for the HSV lesion and symptomatic support for the gastroenteritis associated diarrhea. The complaint of hematemesis was attributed to postnasal drip from the epistaxis, and reassurance was provided to the patient and family. In addition, six weeks earlier, the patient had been treated for otitis media with a full course of amoxicillin.
Medical history was negative for surgeries, trauma, injuries, and chronic medical conditions. She took no medications or supplements on a regular basis. Her parents denied any known drug allergies and stated that her immunizations were up to date.
The patient lived at home with her biological parents and two brothers, all of whom were healthy, without any recent infections or illnesses. Of significance, the family had travelled to the Philippines for vacation about four months earlier. Results of a tuberculin skin test done six weeks earlier (because the patient presented with respiratory symptoms shortly after traveling to the Philippines) were negative.
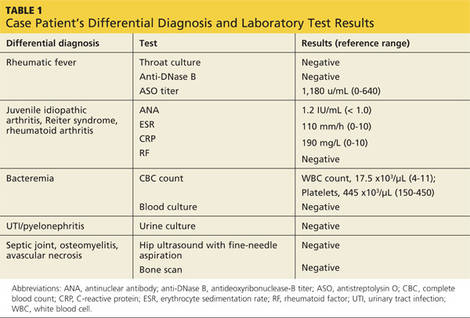
Physical examination revealed a well-developed, well-nourished 40-lb girl, in no acute distress, who was active and playful with her brother while in the exam room. Vital signs were significant for a fever of 101.9°F (last dose of ibuprofen was approximately six hours earlier) but were otherwise stable. Skin exam revealed that the prior HSV lesion of the nose had resolved. HEENT, cardiovascular, and pulmonary exam findings were noncontributory. Urine dipstick was negative.
Abdominal exam revealed normoactive bowel sounds in all four quadrants, and on palpation, the abdomen was soft, nontender, and without organomegaly. Specialized abdominal exams to assess for peritonitis, including those to elicit Rovsing, rebound tenderness, obturator, and psoas signs, were all negative. Bilateral extremity exams of the hips, knees, and ankles revealed full range of motion (active and passive), with normal muscle strength throughout. The only significant finding on the physical exam was mild pain of the right anterior hip at 15° of flexion, appreciated while the patient was supine on the exam table. The patient was also observed pushing off her right lower extremity when climbing onto the exam table, and she skipped down the hall when leaving the exam.
With fever of unknown origin (FUO) and a largely negative history and physical, the working list of differential diagnoses included
• Avascular necrosis
• Bacteremia
• Juvenile idiopathic arthritis
• Osteomyelitis
• Pyelonephritis
• Reiter syndrome
• Rheumatic fever
• Rheumatoid arthritis
• Septic joint
• Urinary tract infection
To begin the diagnostic process, a number of laboratory tests and imaging procedures were ordered. Table 1 presents the results of these studies. A tuberculin skin test was not repeated. While awaiting test results, the patient was started on naproxen oral suspension (125 mg/5 mL; 4 mL bid) for fever and pain control.
Based on findings consistent with an inflammatory pattern, the history of otitis media (of possible streptococcal origin) six weeks prior to this visit, and the elevated ASO titer, the patient was started on penicillin V (250 mg bid) and instructed to return for follow up in two days.
At the follow-up visit, no improvement was noted; the patient continued to experience nightly fevers and hip pain. Rovsing, rebound tenderness, obturator, and psoas signs continued to be negative. Physical examination did, however, reveal a mild abdominal tenderness in the right lower quadrant.
Due to this new finding, an abdominal ultrasound was ordered to screen for appendicitis. Despite the parents’ appropriate concern for the child, misunderstanding about the urgent need to obtain the abdominal ultrasound led to a two-day delay in scheduling the exam. Results of ultrasonography revealed psoas abscess, and the patient was promptly admitted to the pediatric floor of the local hospital.
Continue for discussion >>
DISCUSSION
Psoas abscess is a collection of pus in the iliopsoas compartment, an extraperitoneal space containing the psoas and iliacus muscles.2 It can be life-threatening if the infection progresses to septic shock. Historically, psoas abscesses were a frequent complication of tuberculosis (TB) of the spine; but with modern TB treatment, these abscesses have become rare.2 Paradoxically, increased utilization of CT to evaluate sepsis of unknown etiology has led to a recent increase in the frequency of psoas abscess diagnosis.3
Psoas abscesses are categorized as either primary or secondary, with primary infections originating in the psoas muscle and secondary infections spreading from adjacent organs.2 In 42% to 88% of cases (depending on the study), primary psoas abscesses are caused by the hematogenous spread of Staphylococcus aureus from distant infection sites.2,4,5 The psoas muscle is particularly susceptible to this mode of infection because of its rich vascular supply.6 Children, immunosuppressed adults (ie, patients with diabetes, HIV/AIDS, or renal failure), IV drug users, and patients with a history of trauma to the muscle are most susceptible to developing a primary psoas abscess.2,5
Secondary psoas abscesses are caused by infections involving adjacent structures of the gastrointestinal, urinary, and skeletal systems. They are most frequently associated with intra-abdominal inflammatory processes, with the most common etiology being Crohn disease.5 Secondary psoas abscesses, though more diverse in their bacterial flora, tend to follow certain microbiologic patterns based on the inoculating source; Escherichia coli is the most common pathogen in secondary abscesses caused by gastrointestinal (42%) and urinary (61%) sources, and S aureus the most common (35%) from skeletal origins (ie, osteomyelitis).4,5Mycobacterium tuberculosis is the more frequently found cause in developing countries but should be considered if the patient has recently travelled outside the United States.
Review of the literature suggests that the incidence of methicillin-resistant S aureus (MRSA) as the causative agent of psoas abscesses may be increasing. However, there is a wide variance in the incidence reported, ranging from 1.1% to 12% of confirmed microbial infections.5,7,8
The classic historical presentation of psoas abscess has been described as the triad of back pain, fever, and limp5,6; however, this triad has only been described in approximately 30% of cases.5 The typical presentation consists of flank or lower limb pain (91%), fever (75%), anorexia (46%), and/or weakness (43%).4 Laboratory abnormalities include leukocytosis (67%) and elevated markers of inflammation (eg, erythrocyte sedimentation rate, seen in 73% of cases).4
Imaging via abdominal ultrasound may be helpful to screen for psoas abscess; however, its utility is limited by a low diagnostic yield of 60% or less.2,4 Direct visualization of the retroperitoneal structures, for example, can be problematic due to the presence of bowel gas.9 Abdominal CT is considered the gold standard for the definitive diagnosis of psoas abscess due to its high sensitivity (100%) and specificity (77%); it can also be used simultaneously to guide percutaneous drainage to treat the abscess if needed.7 However, some clinicians prefer abdominal MRI because of its ability to enhance soft-tissue visualization without requiring use of IV contrast.2,4
The approach to treating psoas abscess varies from a strictly antibiotic regimen to percutaneous drainage, and in rare circumstances, open surgical drainage. Antibiotic therapy without drainage or surgical intervention is a sufficient starting point for treatment of abscesses less than 3 cm in size.3
The antibiotic regimen choice depends on the suspected pathogen. In cases of suspected S aureus, empiric antistaphylococcal antibiotics should be initiated while culture results are pending.2,4 Secondary psoas abscesses thought to be derived from a urinary or gastrointestinal source should prompt use of a broader spectrum antibiotic due to the higher probability of gram-negative, anaerobic, or polymicrobial involvement.2,4
Once final culture and sensitivity results are obtained, antibiotic therapy should be modified to target the isolated pathogen(s). Treatment duration is typically six weeks but may vary, depending on serial culture results and the inoculating source.4 Review of the literature reveals that abscesses resulting from skeletal sources have traditionally been treated longer, usually with antibiotics alone, than those from urinary or gastrointestinal sources, which are often treated with the combination of antibiotics and percutaneous drainage.4
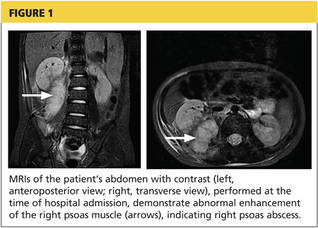
In cases of psoas abscesses larger than 3 cm, management should include both appropriate antibiotics and percutaneous drainage of the abscess.2 Percutaneous drainage is preferred to open surgical drainage because outcomes are similar, it is less invasive, and there is less risk of spreading abscess contents.2-4 In a retrospective analysis by Dietrich et al, 50% of patients treated with antibiotics and percutaneous drainage responded after one drainage, but the success rate increased to 100% after a second drainage.7 In addition, percutaneous drainage was associated with a lower mortality rate and a shorter hospital stay when compared to open surgical drainage.7
Open surgical drainage is rarely performed and usually only considered if the patient is not responding to a combination of focused antibiotic treatment and percutaneous drainage or has associated comorbidities, such as Crohn ileocolitis.2-4 In a retrospective analysis by Tabrizian et al, percutaneous drainage served as a bridge to open surgical drainage in nearly all patients with a gastrointestinal origin, such as Crohn disease, diverticulitis, appendicitis, and/or pancreatitis.6
Treatment of psoas abscesses has an overall failure rate of 15.8%, with an associated mortality rate of less than 7%.4 Overall prognosis is good, but outcomes can be negatively affected by such factors as advanced age, delay in diagnosis, bacteremia, and other comorbidities.4
Next page: Outcome for the case patient >>
OUTCOME FOR THE CASE PATIENT
The patient required an 11-day hospitalization; her day-by-day course is described briefly below.
Day 1. Upon admission, abdominal MRI was ordered (see Figure 1) and empiric piperacillin/tazobactam IV was initiated. C-reactive protein (CRP) level and white blood cell (WBC) counts were elevated (see Table 2). Infectious disease, surgery, and urology consults were obtained.
Day 2. Fine-needle aspiration of the abscess was performed for cultures, and 40 mL of purulent fluid was drained. Piperacillin/tazobactam administration was continued, but the patient experienced ongoing fever and vomiting.
Day 3. Preliminary aspirate culture results revealed S aureus infection. Piperacillin/tazobactam was discontinued, and vancomycin IV was started. CRP levels and WBC counts decreased, as did fever and vomiting.
Day 4. Final aspirate culture results identified MRSA infection, sensitive to clindamycin. Vancomycin was discontinued, and clindamycin IV was started. Although the patient’s condition improved somewhat, fever and vomiting persisted.
Day 5. Both CRP levels and WBC counts increased from day 3. A surgical consult was sought.
Day 6. Repeat abdominal MRI revealed a decrease in the size of the abscess (see Figure 2, page 30. CRP levels and WBC counts remained high, with persistent fever and vomiting.
Day 7. The clinical team, in consultation with the parents, determined that placement of a peripherally inserted central catheter (PICC) line for drainage of the abscess was necessary.
Day 8. A 10-French pigtail catheter was inserted into the abscess, 20 mL of purulent fluid was drained, and a PICC line was inserted. Clindamycin IV was continued and, eight hours after the catheter was placed, fever and vomiting resolved.
Day 9. Both CRP levels and WBC counts dropped by half (WBC count was normal), while 10 mL of clear fluid drained from the catheter. The patient remained afebrile, without nausea or vomiting, on clindamycin IV.
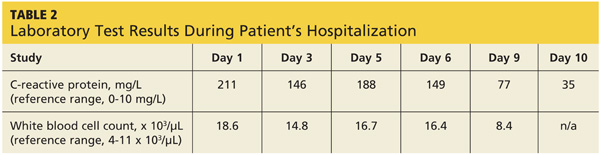
Day 10. After 36 hours of clear drainage, the catheter was removed. CRP level further decreased. Clindamycin IV was discontinued, and the patient, now asymptomatic, was started on oral clindamycin.
Day 11. The patient was discharged on a regimen of oral clindamycin for six weeks, with weekly abdominal ultrasounds. She completed her entire course of antibiotics and fully recovered from the infection.
Next page: Conclusion >>
CONCLUSION
Since children generally compensate well during times of increased stress on the body, it is vital that persistent FUOs continue to be evaluated until a definitive source is identified, especially in this population. Early diagnosis and treatment of psoas abscess is essential for better outcomes, since delay is associated with a greater risk for sepsis.
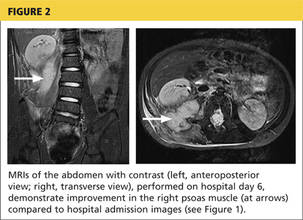
While the likelihood of developing psoas abscess is low, it is worth keeping the diagnosis in mind for cases of unexplained lower abdominal pain, flank pain, or hip pain when more common etiologies have been excluded. This is especially important in the setting of recent travel to a developing country due to the fact that a psoas abscess can be a complication of TB of the spine.
The authors would like to thank Jeff Brand, MD, for his assistance in the preparation of this manuscript.
REFERENCES
1. Wong-Baker Faces Corporation. Wong-Baker FACES Pain Rating Scale. www.wongbakerfaces.org. Accessed May 19, 2015.
2. Mallick IH, Thoufreeq MH, Rajendren TP. Iliopsoas abscesses. Postgrad Med J. 2004;80(946):459-462.
3. Yacoub WN, Sohn HJ, Chan S, et al. Psoas abscess rarely requires surgical intervention. Am J Surg. 2008;196(2):223-227.
4. Lopez VN, Ramos JM, Meseguer V, et al; The Infectious Diseases Study Group of the Spanish Society of Internal Medicine. Microbiology and outcome of iliopsoas abscess in 124 patients. Medicine. 2009;88(2):120-130.
5. Shields D, Robinson P, Crowley TP. Iliopsoas abscess—a review and update on the literature. Int J Surg. 2012;10(9):466-469.
6. Tabrizian P, Nguyen SQ, Greenstein A, et al. Management and treatment of iliopsoas abscess. Arch Surg. 2009;144(10):946-949.
7. Dietrich A, Vaccarezza H, Vaccaro CA. Iliopsoas abscess: presentation, management, and outcomes. Surg Laparosc Endosc Percutan Tech. 2013;23(1):45-48.
8. Wong OF, Ho PL, Lam SK. Retrospective review of clinical presentations, microbiology, and outcomes of patients with psoas abscess. Hong Kong Med J. 2013;19(5):416-423.
9. Woo MY. Psoas abscess. J Emerg Med. 2014;47(5):e129-e130.
A 5-year-old Filipino girl was brought to a pediatric clinic for follow up of an unresolved fever and for new-onset right hip pain, which occurred intermittently for the past week and was associated with a right-sided limp. She had been experiencing nightly fevers ranging from 101°F to 105°F for the past two weeks, for which her parents had been giving ibuprofen with mixed results; she remained afebrile during daytime hours.
Using the Wong-Baker FACES pain scale, the patient rated the pain as a 4/10 in severity (“Hurts a Little More” face).1 Standing and walking aggravated the pain but did not limit activity. Although ibuprofen decreased the fever, it did not alleviate the hip pain. Other symptoms included vomiting one to two times daily, without hematemesis, and four to five episodes of diarrhea daily, without abdominal pain, hematochezia, or melena. She also experienced decreased appetite, but her parents reported no change in her dietary or fluid intake. The patient and her parents denied additional symptoms.
Further investigation revealed that the patient had been seen a week earlier by two other clinicians in the office for complaints of fever, rash, nausea, hematemesis, and diarrhea. She had been diagnosed with a herpes simplex viral (HSV) lesion of the nose, epistaxis, and viral gastroenteritis. Her treatment plan consisted of acyclovir ointment for the HSV lesion and symptomatic support for the gastroenteritis associated diarrhea. The complaint of hematemesis was attributed to postnasal drip from the epistaxis, and reassurance was provided to the patient and family. In addition, six weeks earlier, the patient had been treated for otitis media with a full course of amoxicillin.
Medical history was negative for surgeries, trauma, injuries, and chronic medical conditions. She took no medications or supplements on a regular basis. Her parents denied any known drug allergies and stated that her immunizations were up to date.
The patient lived at home with her biological parents and two brothers, all of whom were healthy, without any recent infections or illnesses. Of significance, the family had travelled to the Philippines for vacation about four months earlier. Results of a tuberculin skin test done six weeks earlier (because the patient presented with respiratory symptoms shortly after traveling to the Philippines) were negative.
Physical examination revealed a well-developed, well-nourished 40-lb girl, in no acute distress, who was active and playful with her brother while in the exam room. Vital signs were significant for a fever of 101.9°F (last dose of ibuprofen was approximately six hours earlier) but were otherwise stable. Skin exam revealed that the prior HSV lesion of the nose had resolved. HEENT, cardiovascular, and pulmonary exam findings were noncontributory. Urine dipstick was negative.
Abdominal exam revealed normoactive bowel sounds in all four quadrants, and on palpation, the abdomen was soft, nontender, and without organomegaly. Specialized abdominal exams to assess for peritonitis, including those to elicit Rovsing, rebound tenderness, obturator, and psoas signs, were all negative. Bilateral extremity exams of the hips, knees, and ankles revealed full range of motion (active and passive), with normal muscle strength throughout. The only significant finding on the physical exam was mild pain of the right anterior hip at 15° of flexion, appreciated while the patient was supine on the exam table. The patient was also observed pushing off her right lower extremity when climbing onto the exam table, and she skipped down the hall when leaving the exam.
With fever of unknown origin (FUO) and a largely negative history and physical, the working list of differential diagnoses included
• Avascular necrosis
• Bacteremia
• Juvenile idiopathic arthritis
• Osteomyelitis
• Pyelonephritis
• Reiter syndrome
• Rheumatic fever
• Rheumatoid arthritis
• Septic joint
• Urinary tract infection
To begin the diagnostic process, a number of laboratory tests and imaging procedures were ordered. Table 1 presents the results of these studies. A tuberculin skin test was not repeated. While awaiting test results, the patient was started on naproxen oral suspension (125 mg/5 mL; 4 mL bid) for fever and pain control.
Based on findings consistent with an inflammatory pattern, the history of otitis media (of possible streptococcal origin) six weeks prior to this visit, and the elevated ASO titer, the patient was started on penicillin V (250 mg bid) and instructed to return for follow up in two days.
At the follow-up visit, no improvement was noted; the patient continued to experience nightly fevers and hip pain. Rovsing, rebound tenderness, obturator, and psoas signs continued to be negative. Physical examination did, however, reveal a mild abdominal tenderness in the right lower quadrant.
Due to this new finding, an abdominal ultrasound was ordered to screen for appendicitis. Despite the parents’ appropriate concern for the child, misunderstanding about the urgent need to obtain the abdominal ultrasound led to a two-day delay in scheduling the exam. Results of ultrasonography revealed psoas abscess, and the patient was promptly admitted to the pediatric floor of the local hospital.
Continue for discussion >>
DISCUSSION
Psoas abscess is a collection of pus in the iliopsoas compartment, an extraperitoneal space containing the psoas and iliacus muscles.2 It can be life-threatening if the infection progresses to septic shock. Historically, psoas abscesses were a frequent complication of tuberculosis (TB) of the spine; but with modern TB treatment, these abscesses have become rare.2 Paradoxically, increased utilization of CT to evaluate sepsis of unknown etiology has led to a recent increase in the frequency of psoas abscess diagnosis.3
Psoas abscesses are categorized as either primary or secondary, with primary infections originating in the psoas muscle and secondary infections spreading from adjacent organs.2 In 42% to 88% of cases (depending on the study), primary psoas abscesses are caused by the hematogenous spread of Staphylococcus aureus from distant infection sites.2,4,5 The psoas muscle is particularly susceptible to this mode of infection because of its rich vascular supply.6 Children, immunosuppressed adults (ie, patients with diabetes, HIV/AIDS, or renal failure), IV drug users, and patients with a history of trauma to the muscle are most susceptible to developing a primary psoas abscess.2,5
Secondary psoas abscesses are caused by infections involving adjacent structures of the gastrointestinal, urinary, and skeletal systems. They are most frequently associated with intra-abdominal inflammatory processes, with the most common etiology being Crohn disease.5 Secondary psoas abscesses, though more diverse in their bacterial flora, tend to follow certain microbiologic patterns based on the inoculating source; Escherichia coli is the most common pathogen in secondary abscesses caused by gastrointestinal (42%) and urinary (61%) sources, and S aureus the most common (35%) from skeletal origins (ie, osteomyelitis).4,5Mycobacterium tuberculosis is the more frequently found cause in developing countries but should be considered if the patient has recently travelled outside the United States.
Review of the literature suggests that the incidence of methicillin-resistant S aureus (MRSA) as the causative agent of psoas abscesses may be increasing. However, there is a wide variance in the incidence reported, ranging from 1.1% to 12% of confirmed microbial infections.5,7,8
The classic historical presentation of psoas abscess has been described as the triad of back pain, fever, and limp5,6; however, this triad has only been described in approximately 30% of cases.5 The typical presentation consists of flank or lower limb pain (91%), fever (75%), anorexia (46%), and/or weakness (43%).4 Laboratory abnormalities include leukocytosis (67%) and elevated markers of inflammation (eg, erythrocyte sedimentation rate, seen in 73% of cases).4
Imaging via abdominal ultrasound may be helpful to screen for psoas abscess; however, its utility is limited by a low diagnostic yield of 60% or less.2,4 Direct visualization of the retroperitoneal structures, for example, can be problematic due to the presence of bowel gas.9 Abdominal CT is considered the gold standard for the definitive diagnosis of psoas abscess due to its high sensitivity (100%) and specificity (77%); it can also be used simultaneously to guide percutaneous drainage to treat the abscess if needed.7 However, some clinicians prefer abdominal MRI because of its ability to enhance soft-tissue visualization without requiring use of IV contrast.2,4
The approach to treating psoas abscess varies from a strictly antibiotic regimen to percutaneous drainage, and in rare circumstances, open surgical drainage. Antibiotic therapy without drainage or surgical intervention is a sufficient starting point for treatment of abscesses less than 3 cm in size.3
The antibiotic regimen choice depends on the suspected pathogen. In cases of suspected S aureus, empiric antistaphylococcal antibiotics should be initiated while culture results are pending.2,4 Secondary psoas abscesses thought to be derived from a urinary or gastrointestinal source should prompt use of a broader spectrum antibiotic due to the higher probability of gram-negative, anaerobic, or polymicrobial involvement.2,4
Once final culture and sensitivity results are obtained, antibiotic therapy should be modified to target the isolated pathogen(s). Treatment duration is typically six weeks but may vary, depending on serial culture results and the inoculating source.4 Review of the literature reveals that abscesses resulting from skeletal sources have traditionally been treated longer, usually with antibiotics alone, than those from urinary or gastrointestinal sources, which are often treated with the combination of antibiotics and percutaneous drainage.4
In cases of psoas abscesses larger than 3 cm, management should include both appropriate antibiotics and percutaneous drainage of the abscess.2 Percutaneous drainage is preferred to open surgical drainage because outcomes are similar, it is less invasive, and there is less risk of spreading abscess contents.2-4 In a retrospective analysis by Dietrich et al, 50% of patients treated with antibiotics and percutaneous drainage responded after one drainage, but the success rate increased to 100% after a second drainage.7 In addition, percutaneous drainage was associated with a lower mortality rate and a shorter hospital stay when compared to open surgical drainage.7
Open surgical drainage is rarely performed and usually only considered if the patient is not responding to a combination of focused antibiotic treatment and percutaneous drainage or has associated comorbidities, such as Crohn ileocolitis.2-4 In a retrospective analysis by Tabrizian et al, percutaneous drainage served as a bridge to open surgical drainage in nearly all patients with a gastrointestinal origin, such as Crohn disease, diverticulitis, appendicitis, and/or pancreatitis.6
Treatment of psoas abscesses has an overall failure rate of 15.8%, with an associated mortality rate of less than 7%.4 Overall prognosis is good, but outcomes can be negatively affected by such factors as advanced age, delay in diagnosis, bacteremia, and other comorbidities.4
Next page: Outcome for the case patient >>
OUTCOME FOR THE CASE PATIENT
The patient required an 11-day hospitalization; her day-by-day course is described briefly below.
Day 1. Upon admission, abdominal MRI was ordered (see Figure 1) and empiric piperacillin/tazobactam IV was initiated. C-reactive protein (CRP) level and white blood cell (WBC) counts were elevated (see Table 2). Infectious disease, surgery, and urology consults were obtained.
Day 2. Fine-needle aspiration of the abscess was performed for cultures, and 40 mL of purulent fluid was drained. Piperacillin/tazobactam administration was continued, but the patient experienced ongoing fever and vomiting.
Day 3. Preliminary aspirate culture results revealed S aureus infection. Piperacillin/tazobactam was discontinued, and vancomycin IV was started. CRP levels and WBC counts decreased, as did fever and vomiting.
Day 4. Final aspirate culture results identified MRSA infection, sensitive to clindamycin. Vancomycin was discontinued, and clindamycin IV was started. Although the patient’s condition improved somewhat, fever and vomiting persisted.
Day 5. Both CRP levels and WBC counts increased from day 3. A surgical consult was sought.
Day 6. Repeat abdominal MRI revealed a decrease in the size of the abscess (see Figure 2, page 30. CRP levels and WBC counts remained high, with persistent fever and vomiting.
Day 7. The clinical team, in consultation with the parents, determined that placement of a peripherally inserted central catheter (PICC) line for drainage of the abscess was necessary.
Day 8. A 10-French pigtail catheter was inserted into the abscess, 20 mL of purulent fluid was drained, and a PICC line was inserted. Clindamycin IV was continued and, eight hours after the catheter was placed, fever and vomiting resolved.
Day 9. Both CRP levels and WBC counts dropped by half (WBC count was normal), while 10 mL of clear fluid drained from the catheter. The patient remained afebrile, without nausea or vomiting, on clindamycin IV.
Day 10. After 36 hours of clear drainage, the catheter was removed. CRP level further decreased. Clindamycin IV was discontinued, and the patient, now asymptomatic, was started on oral clindamycin.
Day 11. The patient was discharged on a regimen of oral clindamycin for six weeks, with weekly abdominal ultrasounds. She completed her entire course of antibiotics and fully recovered from the infection.
Next page: Conclusion >>
CONCLUSION
Since children generally compensate well during times of increased stress on the body, it is vital that persistent FUOs continue to be evaluated until a definitive source is identified, especially in this population. Early diagnosis and treatment of psoas abscess is essential for better outcomes, since delay is associated with a greater risk for sepsis.
While the likelihood of developing psoas abscess is low, it is worth keeping the diagnosis in mind for cases of unexplained lower abdominal pain, flank pain, or hip pain when more common etiologies have been excluded. This is especially important in the setting of recent travel to a developing country due to the fact that a psoas abscess can be a complication of TB of the spine.
The authors would like to thank Jeff Brand, MD, for his assistance in the preparation of this manuscript.
REFERENCES
1. Wong-Baker Faces Corporation. Wong-Baker FACES Pain Rating Scale. www.wongbakerfaces.org. Accessed May 19, 2015.
2. Mallick IH, Thoufreeq MH, Rajendren TP. Iliopsoas abscesses. Postgrad Med J. 2004;80(946):459-462.
3. Yacoub WN, Sohn HJ, Chan S, et al. Psoas abscess rarely requires surgical intervention. Am J Surg. 2008;196(2):223-227.
4. Lopez VN, Ramos JM, Meseguer V, et al; The Infectious Diseases Study Group of the Spanish Society of Internal Medicine. Microbiology and outcome of iliopsoas abscess in 124 patients. Medicine. 2009;88(2):120-130.
5. Shields D, Robinson P, Crowley TP. Iliopsoas abscess—a review and update on the literature. Int J Surg. 2012;10(9):466-469.
6. Tabrizian P, Nguyen SQ, Greenstein A, et al. Management and treatment of iliopsoas abscess. Arch Surg. 2009;144(10):946-949.
7. Dietrich A, Vaccarezza H, Vaccaro CA. Iliopsoas abscess: presentation, management, and outcomes. Surg Laparosc Endosc Percutan Tech. 2013;23(1):45-48.
8. Wong OF, Ho PL, Lam SK. Retrospective review of clinical presentations, microbiology, and outcomes of patients with psoas abscess. Hong Kong Med J. 2013;19(5):416-423.
9. Woo MY. Psoas abscess. J Emerg Med. 2014;47(5):e129-e130.
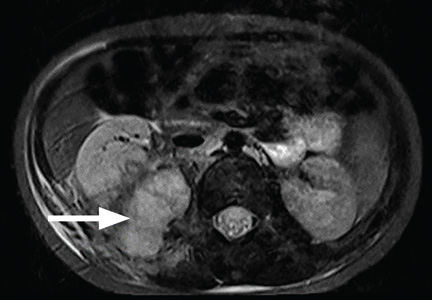
Considering Probiotics? What You Must Know First

Probiotics—live microorganisms that are consumed as supplements or food for purported health benefits—are a popular OTC remedy for various gastrointestinal (GI) ailments and other conditions, but the evidence supporting their use is mixed. Probiotics interact with the normal flora of the human body. They are believed to act by multiple mechanisms to deliver beneficial effects, including providing a protective barrier, altering intestinal pH to favor the growth of nonpathogenic bacteria, enhancing the host’s immunologic response, producing antimicrobial substances, and directly competing with pathogenic bacteria for receptors in the GI tract1 (see “The normal human intestinal flora,”).
In the United States, Lactobacillus and Bifidobacterium are the probiotic genera that are most commonly used. (For a list of the specific probiotic species found in five popular products, see Table 1.2-6) The review that follows examines the evidence for using probiotics for select GI ailments, including several types of diarrheal illness, inflammatory bowel disease (Crohn disease and ulcerative colitis), and irritable bowel syndrome (IBS). These findings are summarized in Table 2.1,7-21
Continue for probiotics may help with some types of diarrhea >>
PROBIOTICS MAY HELP WITH SOME TYPES OF DIARRHEA
Acute infectious diarrhea. Viruses, bacteria, and parasites cause acute infectious diarrhea, and probiotics are thought to act against these pathogens by competing for available nutrients and pattern-recognition receptors in the GI endothelium, acidifying the local environment, and increasing immune responses within the GI tract. In a meta-analysis of 63 studies (N = 8,014) that used multiple strains and dosages of probiotics, investigators found probiotics shortened the duration of acute infectious diarrhea by approximately 24 h.7 Probiotics also reduced both the risk for diarrhea lasting longer than four days (relative risk [RR], 0.41) and stool frequency on day 2 of illness (mean difference of 0.80 stools).
Traveler’s diarrhea. The incidence of traveler’s diarrhea is > 50% for travel to high-risk areas such as the Middle East, North Africa, Latin America, and Southeast Asia, and 5% to 10% when traveling to areas such as North America, Northern Europe, the United Kingdom, Australia, and New Zealand.8 Traveler’s diarrhea may be caused by ingesting food and liquids contaminated with fecal material. Symptoms include diarrhea, cramps, and nausea that, if untreated, typically last from two to six days but can last for as long as a month.8
In a meta-analysis of 12 studies (N = 5,171) that evaluated various probiotic strains, researchers found probiotics effectively prevented traveler’s diarrhea in US and European travelers who visited a variety of vacation spots (pooled RR, 0.85).8 No serious adverse events were reported.
Radiation-induced diarrhea. Radiation treatments to the abdomen and pelvis can damage the lower GI tract and cause diarrhea. The pooled results from a meta-analysis that included six studies (N = 1,449) significantly favored the use of probiotics over placebo for decreasing the incidence of radiation-induced diarrhea (odds ratio [OR], 0.44).9 Probiotic use also was associated with decreased loperamide use (OR, 0.29) and decreased incidence of watery stools (OR, 0.36), but these outcomes did not reach statistical significance.
Antibiotic-associated diarrhea. Antibiotic use has long been associated with the development of diarrheal illness, sometimes due to the acceleration of GI motility (eg, erythromycin) or by causing osmotic diarrhea by decreasing GI bacteria that assist in carbohydrate breakdown.11 A meta-analysis that evaluated 63 randomized controlled trials (RCTs) (N = 11,811) showed that probiotics are effective for treating and preventing antibiotic-associated diarrhea (AAD).1 There was a statistically significant reduction in AAD among patients who received probiotics (RR, 0.58; number needed to treat [NNT], 13). Most of the studies in this meta-analysis used a Lactobacillus probiotic alone or in combination with another probiotic. Researchers did not analyze whether the efficacy varied by patient population, probiotic used, causative antibiotic, or duration of treatment.1 Another meta-analysis of 34 studies (N = 4,138) also found probiotic therapy can prevent AAD.10 The pooled RR for AAD was 0.53 for patients treated with probiotics compared to placebo, with an NNT of 8. The effects remained significant when results were grouped by probiotic species, patient age, and duration of antibiotic treatment. Among a subgroup of patients in this meta-analysis who were being treated for Helicobacter pylori, the pooled RR of AAD was 0.37 and the NNT was 5.10 However, the 2013 PLACIDE trial (N = 17,420) found no significant decrease in AAD rates in hospitalized patients older than 65 being treated with antibiotics who received probiotics (RR, 1.04).22

Clostridium difficile–associated diarrhea. As we know, antibiotics can disrupt the normal GI flora and permit overgrowth of Clostridium difficile, which can result in C difficile–associated diarrhea (CDAD).12 This can occur with oral, parenteral, and even topical antibiotics.11 Researchers have investigated whether probiotics can prevent this opportunistic C difficile overgrowth.
A 2012 meta-analysis of 20 trials (N = 38,180) found probiotic prophylaxis prevented CDAD in both inpatients and outpatients while not increasing the incidence of significant adverse effects.12 Probiotics decreased the incidence of CDAD by 66% (pooled RR, 0.34).12 Adverse events occurred in 9.3% of patients taking probiotics, compared with 12.6% of controls (RR, 0.82).12
Conversely, a 2008 review of four studies (N = 336) concluded there is insufficient evidence for using probiotics to treat CDAD, either as monotherapy or adjunct therapy.11 One trial in this meta-analysis (N = 124) found patients who received the probiotic Saccharomyces boulardii in addition to antibiotic therapy were significantly less likely to experience CDAD recurrence than those who received placebo (RR, 0.59).11 However, this benefit was not found in the other trials in this meta-analysis.11
The PLACIDE trial found probiotics did not prevent CDAD in hospitalized patients older than 65; 0.8% of patients who received probiotics developed CDAD, compared to 1.2% in the placebo group (RR, 0.71).22
Helicobacter pylori infection. The triple-therapy regimen of a proton pump inhibitor plus the antibiotics clarithromycin and amoxicillin is the recommended treatment for H pylori infection.13 Associated adverse effects include diarrhea and decreased eradication rates, in part due to antibiotic resistance. Certain Lactobacillus species have been shown to inhibit or kill H pylori in vitro,13 and evidence from several meta-analyses suggests probiotics should be an adjunct therapy for the treatment of H pylori.
In a meta-analysis of 10 RCTs (N = 963), fermented milk-based probiotics improved H pylori eradication rates by 5% to 15%.14 In another meta-analysis that evaluated five RCTs (N = 1,307), S boulardii significantly increased the H pylori eradication rate when used as an adjunct to triple therapy (RR, 1.13) and reduced the rate of treatment related adverse effects (RR, 0.46).13 In a third meta-analysis of 10 trials (N = 1,469), Lactobacillus supplementation increased H pylori eradication rates (OR, 2.1) while decreasing the overall incidence of adverse effects (OR, 0.3).15
Next: For inflammatory bowel disease, probiotics are unlikely to help >>

FOR INFLAMMATORY BOWEL DISEASE, PROBIOTICS ARE UNLIKELY TO HELP
Current therapies for Crohn disease and ulcerative colitis, such as corticosteroids and other immunosuppressive agents, are effective but have significant adverse events.18 Researchers explored whether probiotics might help treat these diseases by improving immune response, the balance of microbes in the GI tract, and the intestinal barrier.18
Crohn disease. In a meta-analysis that was able to identify only one small RCT (N = 11), 80% of patients receiving probiotic treatment went into remission, compared to 83% in the placebo group (OR, 0.80).16 Researchers concluded there was insufficient evidence for the use of probiotics for inducing remission in Crohn disease.
Another meta-analysis of seven small studies (N = 160) found no significant evidence supporting probiotic use for maintaining remission in Crohn disease compared with aminosalicylates or azathioprine.17 One small study in this review found there was a benefit to combining S boulardii with a reduced level of standard maintenance therapy when compared to standard therapy alone, but this difference was not statistically significant.17
Ulcerative colitis. A systematic review of four RCTs (N = 244) that compared conventional treatment alone to conventional treatment plus probiotics for remission or clinical improvement in patients with active ulcerative colitis found no significant differences between groups.18 Another meta-analysis of four studies (N = 587) found that compared to placebo or treatment with mesalazine, probiotics had no benefit for maintaining remission in ulcerative colitis.19 The rate of relapse was 40.1% in the probiotics group, compared to 34.1% in the mesalazine group. The number of adverse effects was similar in both groups.
Continue for most evidence suggests probiotics are useful for IBS >>
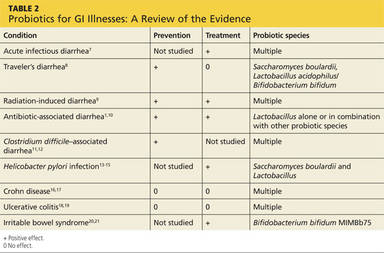
MOST EVIDENCE SUGGESTS PROBIOTICS ARE USEFUL FOR IBS
In RCTs, probiotic supplements—but not yogurt containing probiotics—reduced IBS symptoms. Research suggests that imbalances in GI flora, along with subsequent dysfunction in intestinal barriers and translocation of intestinal flora, may play a role in symptoms associated with IBS, such as abdominal pain, bloating, and diarrhea/constipation.20 There are few effective therapeutic options for patients with IBS.
In a systematic review of 19 RCTs (N = 1,650), probiotics were significantly more effective than placebo for patients with IBS, with an NNT of 4.21 This review did not evaluate the difference between various probiotic species and strains.
In an RCT (N = 122), the probiotic strain Bifidobacterium bifidum MIMBb75 was found to be safe and beneficial for treating IBS symptoms and improving patients’ quality of life.20 On a 7-point scale of global assessment of IBS symptoms, the score was reduced by 0.88 points in the group that received B bifidum MIMBb75 and 0.16 points in the placebo group (P < .0001). Almost half (47%) of the patients who received B bifidum MIMBb75 reported adequate relief, compared to 11% in the placebo group (P < .0001).
An RCT (N = 179) that compared yogurt containing probiotics to nonprobiotic yogurt found that the former had no benefits for treating IBS symptoms.23 After four weeks, 57% of patients who ate the probiotic yogurt reported adequate relief, compared to 53% of those who ate nonprobiotic yogurt (P = .71). After eight weeks, those numbers were 47% and 68%, respectively.23
REFERENCES
1. Hempel S, Newberry SJ, Maher AR, et al. Probiotics for the prevention and treatment of antibiotic-associated diarrhea: a systematic review and meta-analysis. JAMA. 2012;307:1959-1969.
2. Procter & Gamble. Align product information. www.aligngi.com/information-on-Align-probiotic-supplement. Accessed May 19, 2015.
3. Bayer HealthCare. Phillip’s Colon Health product information. http://phillipspro.com/en/home/product-information/index.php. Accessed May 19, 2015.
4. Nature’s Bounty. Nature’s Bounty Acidophilus Probiotic product label. http://images.vitaminimages.com/cdn/sd/pdf/L002610-NB.PDF. Accessed May 19, 2015.
5. Dannon. Activia. http://activia.us.com/probiotic-yogurt/activia. Accessed May 19, 2015.
6. Lifeway. Lifeway Kefir frequently asked questions. http://lifewaykefir.com/faq/. Accessed May 19, 2015.
7. Allen SJ, Martinez EG, Gregorio GV, et al. Probiotics for treating acute infectious diarrhoea. Cochrane Database Syst Rev. 2010;(11):CD003048.
8. McFarland LV. Meta-analysis of probiotics for the prevention of traveler’s diarrhea. Travel Med Infect Dis. 2007;5:97-105.
9. Hamad A, Fragkos KC, Forbes A. A systemic review and meta-analysis of probiotics for the management of radiation induced bowel disease. Clin Nutr. 2013;32:353-360.
10. Videlock EJ, Cremonini F. Meta-analysis: probiotics in antibiotic-associated diarrhoea. Aliment Pharmacol Ther. 2012;35:1355-1369.
11. Pillai A, Nelson RL. Probiotics for treatment of Clostridium difficile–associated colitis in adults. Cochrane Database Syst Rev. 2008;(1):CD004611.
12. Johnston BC, Ma SY, Goldenberg JZ, et al. Probiotics for the prevention of Clostridium difficile–associated diarrhea: a systematic review and meta-analysis. Ann Intern Med. 2012;157:878-888.
13. Szajewska H, Horvath A, Piwowarczyk A. Meta-analysis: the effects of Saccharomyces boulardii supplementation on Helicobacter pylori eradication rates and side effects during treatment. Aliment Pharmacol Ther. 2010;32:1069-1079.
14. Sachdeva A, Nagpal J. Effect of fermented milk-based probiotic preparations on Helicobacter pylori eradication: a systematic review and meta-analysis of randomized controlled trials. Eur J Gastroenterol Hepatol. 2009;21:45-53.
15. Wang ZH, Gao QY, Fang JY. Meta-analysis of the efficacy and safety of Lactobacillus-containing and Bifidobacterium-containing probiotic compound preparation in Helicobacter pylori eradication therapy. J Clin Gastroenterol. 2013;47:25-32.
16. Butterworth AD, Thomas AG, Akobeng AK. Probiotics for induction of remission in Crohn’s disease. Cochrane Database Syst Rev. 2008; 16:CD006634.
17. Rolfe VE, Fortun PJ, Hawkey CJ, et al. Probiotics for maintenance of remission in Crohn’s disease. Cochrane Database Syst Rev. 2006;(4):CD004826.
18. Mallon P, McKay D, Kirk SJ, et al. Probiotics for induction of remission in ulcerative colitis. Cochrane Database Syst Rev. 2007;(4):CD005573.
19. Naidoo K, Gordon M, Fagbemi AO, et al. Probiotics for maintenance of remission in ulcerative colitis. Cochrane Database Syst Rev. 2011;(12):CD007443.
20. Guglielmetti S, Mora D, Gschwender M, et al. Randomised clinical trial: Bifidobacterium bifidum MIMBb75 significantly alleviates irritable bowel syndrome and improves quality of life—a double-blind, placebo-controlled study. Aliment Pharmacol Ther. 2011;33:1123-1132.
21. Moayyedi P, Ford AC, Talley NJ, et al. The efficacy of probiotics in the treatment of irritable bowel syndrome: a systematic review. Gut. 2010; 59:325-332.
22. Allen SJ, Wareham K, Wang D, et al. Lactobacilli and bifidobacteria in the prevention of antibiotic-associated diarrhoea and Clostridium difficile diarrhoea in older inpatients (PLACIDE): a randomised, double-blind, placebo-controlled, multicentre trial. Lancet. 2013;382:1249-1257.
23. Roberts LM, McCahon D, Holder R, et al. A randomised controlled trial of a probiotic ‘functional food’ in the management of irritable bowel syndrome. BMC Gastroenterol. 2013;13:45.
Probiotics—live microorganisms that are consumed as supplements or food for purported health benefits—are a popular OTC remedy for various gastrointestinal (GI) ailments and other conditions, but the evidence supporting their use is mixed. Probiotics interact with the normal flora of the human body. They are believed to act by multiple mechanisms to deliver beneficial effects, including providing a protective barrier, altering intestinal pH to favor the growth of nonpathogenic bacteria, enhancing the host’s immunologic response, producing antimicrobial substances, and directly competing with pathogenic bacteria for receptors in the GI tract1 (see “The normal human intestinal flora,”).
In the United States, Lactobacillus and Bifidobacterium are the probiotic genera that are most commonly used. (For a list of the specific probiotic species found in five popular products, see Table 1.2-6) The review that follows examines the evidence for using probiotics for select GI ailments, including several types of diarrheal illness, inflammatory bowel disease (Crohn disease and ulcerative colitis), and irritable bowel syndrome (IBS). These findings are summarized in Table 2.1,7-21
Continue for probiotics may help with some types of diarrhea >>
PROBIOTICS MAY HELP WITH SOME TYPES OF DIARRHEA
Acute infectious diarrhea. Viruses, bacteria, and parasites cause acute infectious diarrhea, and probiotics are thought to act against these pathogens by competing for available nutrients and pattern-recognition receptors in the GI endothelium, acidifying the local environment, and increasing immune responses within the GI tract. In a meta-analysis of 63 studies (N = 8,014) that used multiple strains and dosages of probiotics, investigators found probiotics shortened the duration of acute infectious diarrhea by approximately 24 h.7 Probiotics also reduced both the risk for diarrhea lasting longer than four days (relative risk [RR], 0.41) and stool frequency on day 2 of illness (mean difference of 0.80 stools).
Traveler’s diarrhea. The incidence of traveler’s diarrhea is > 50% for travel to high-risk areas such as the Middle East, North Africa, Latin America, and Southeast Asia, and 5% to 10% when traveling to areas such as North America, Northern Europe, the United Kingdom, Australia, and New Zealand.8 Traveler’s diarrhea may be caused by ingesting food and liquids contaminated with fecal material. Symptoms include diarrhea, cramps, and nausea that, if untreated, typically last from two to six days but can last for as long as a month.8
In a meta-analysis of 12 studies (N = 5,171) that evaluated various probiotic strains, researchers found probiotics effectively prevented traveler’s diarrhea in US and European travelers who visited a variety of vacation spots (pooled RR, 0.85).8 No serious adverse events were reported.
Radiation-induced diarrhea. Radiation treatments to the abdomen and pelvis can damage the lower GI tract and cause diarrhea. The pooled results from a meta-analysis that included six studies (N = 1,449) significantly favored the use of probiotics over placebo for decreasing the incidence of radiation-induced diarrhea (odds ratio [OR], 0.44).9 Probiotic use also was associated with decreased loperamide use (OR, 0.29) and decreased incidence of watery stools (OR, 0.36), but these outcomes did not reach statistical significance.
Antibiotic-associated diarrhea. Antibiotic use has long been associated with the development of diarrheal illness, sometimes due to the acceleration of GI motility (eg, erythromycin) or by causing osmotic diarrhea by decreasing GI bacteria that assist in carbohydrate breakdown.11 A meta-analysis that evaluated 63 randomized controlled trials (RCTs) (N = 11,811) showed that probiotics are effective for treating and preventing antibiotic-associated diarrhea (AAD).1 There was a statistically significant reduction in AAD among patients who received probiotics (RR, 0.58; number needed to treat [NNT], 13). Most of the studies in this meta-analysis used a Lactobacillus probiotic alone or in combination with another probiotic. Researchers did not analyze whether the efficacy varied by patient population, probiotic used, causative antibiotic, or duration of treatment.1 Another meta-analysis of 34 studies (N = 4,138) also found probiotic therapy can prevent AAD.10 The pooled RR for AAD was 0.53 for patients treated with probiotics compared to placebo, with an NNT of 8. The effects remained significant when results were grouped by probiotic species, patient age, and duration of antibiotic treatment. Among a subgroup of patients in this meta-analysis who were being treated for Helicobacter pylori, the pooled RR of AAD was 0.37 and the NNT was 5.10 However, the 2013 PLACIDE trial (N = 17,420) found no significant decrease in AAD rates in hospitalized patients older than 65 being treated with antibiotics who received probiotics (RR, 1.04).22
Clostridium difficile–associated diarrhea. As we know, antibiotics can disrupt the normal GI flora and permit overgrowth of Clostridium difficile, which can result in C difficile–associated diarrhea (CDAD).12 This can occur with oral, parenteral, and even topical antibiotics.11 Researchers have investigated whether probiotics can prevent this opportunistic C difficile overgrowth.
A 2012 meta-analysis of 20 trials (N = 38,180) found probiotic prophylaxis prevented CDAD in both inpatients and outpatients while not increasing the incidence of significant adverse effects.12 Probiotics decreased the incidence of CDAD by 66% (pooled RR, 0.34).12 Adverse events occurred in 9.3% of patients taking probiotics, compared with 12.6% of controls (RR, 0.82).12
Conversely, a 2008 review of four studies (N = 336) concluded there is insufficient evidence for using probiotics to treat CDAD, either as monotherapy or adjunct therapy.11 One trial in this meta-analysis (N = 124) found patients who received the probiotic Saccharomyces boulardii in addition to antibiotic therapy were significantly less likely to experience CDAD recurrence than those who received placebo (RR, 0.59).11 However, this benefit was not found in the other trials in this meta-analysis.11
The PLACIDE trial found probiotics did not prevent CDAD in hospitalized patients older than 65; 0.8% of patients who received probiotics developed CDAD, compared to 1.2% in the placebo group (RR, 0.71).22
Helicobacter pylori infection. The triple-therapy regimen of a proton pump inhibitor plus the antibiotics clarithromycin and amoxicillin is the recommended treatment for H pylori infection.13 Associated adverse effects include diarrhea and decreased eradication rates, in part due to antibiotic resistance. Certain Lactobacillus species have been shown to inhibit or kill H pylori in vitro,13 and evidence from several meta-analyses suggests probiotics should be an adjunct therapy for the treatment of H pylori.
In a meta-analysis of 10 RCTs (N = 963), fermented milk-based probiotics improved H pylori eradication rates by 5% to 15%.14 In another meta-analysis that evaluated five RCTs (N = 1,307), S boulardii significantly increased the H pylori eradication rate when used as an adjunct to triple therapy (RR, 1.13) and reduced the rate of treatment related adverse effects (RR, 0.46).13 In a third meta-analysis of 10 trials (N = 1,469), Lactobacillus supplementation increased H pylori eradication rates (OR, 2.1) while decreasing the overall incidence of adverse effects (OR, 0.3).15
Next: For inflammatory bowel disease, probiotics are unlikely to help >>
FOR INFLAMMATORY BOWEL DISEASE, PROBIOTICS ARE UNLIKELY TO HELP
Current therapies for Crohn disease and ulcerative colitis, such as corticosteroids and other immunosuppressive agents, are effective but have significant adverse events.18 Researchers explored whether probiotics might help treat these diseases by improving immune response, the balance of microbes in the GI tract, and the intestinal barrier.18
Crohn disease. In a meta-analysis that was able to identify only one small RCT (N = 11), 80% of patients receiving probiotic treatment went into remission, compared to 83% in the placebo group (OR, 0.80).16 Researchers concluded there was insufficient evidence for the use of probiotics for inducing remission in Crohn disease.
Another meta-analysis of seven small studies (N = 160) found no significant evidence supporting probiotic use for maintaining remission in Crohn disease compared with aminosalicylates or azathioprine.17 One small study in this review found there was a benefit to combining S boulardii with a reduced level of standard maintenance therapy when compared to standard therapy alone, but this difference was not statistically significant.17
Ulcerative colitis. A systematic review of four RCTs (N = 244) that compared conventional treatment alone to conventional treatment plus probiotics for remission or clinical improvement in patients with active ulcerative colitis found no significant differences between groups.18 Another meta-analysis of four studies (N = 587) found that compared to placebo or treatment with mesalazine, probiotics had no benefit for maintaining remission in ulcerative colitis.19 The rate of relapse was 40.1% in the probiotics group, compared to 34.1% in the mesalazine group. The number of adverse effects was similar in both groups.
Continue for most evidence suggests probiotics are useful for IBS >>
MOST EVIDENCE SUGGESTS PROBIOTICS ARE USEFUL FOR IBS
In RCTs, probiotic supplements—but not yogurt containing probiotics—reduced IBS symptoms. Research suggests that imbalances in GI flora, along with subsequent dysfunction in intestinal barriers and translocation of intestinal flora, may play a role in symptoms associated with IBS, such as abdominal pain, bloating, and diarrhea/constipation.20 There are few effective therapeutic options for patients with IBS.
In a systematic review of 19 RCTs (N = 1,650), probiotics were significantly more effective than placebo for patients with IBS, with an NNT of 4.21 This review did not evaluate the difference between various probiotic species and strains.
In an RCT (N = 122), the probiotic strain Bifidobacterium bifidum MIMBb75 was found to be safe and beneficial for treating IBS symptoms and improving patients’ quality of life.20 On a 7-point scale of global assessment of IBS symptoms, the score was reduced by 0.88 points in the group that received B bifidum MIMBb75 and 0.16 points in the placebo group (P < .0001). Almost half (47%) of the patients who received B bifidum MIMBb75 reported adequate relief, compared to 11% in the placebo group (P < .0001).
An RCT (N = 179) that compared yogurt containing probiotics to nonprobiotic yogurt found that the former had no benefits for treating IBS symptoms.23 After four weeks, 57% of patients who ate the probiotic yogurt reported adequate relief, compared to 53% of those who ate nonprobiotic yogurt (P = .71). After eight weeks, those numbers were 47% and 68%, respectively.23
REFERENCES
1. Hempel S, Newberry SJ, Maher AR, et al. Probiotics for the prevention and treatment of antibiotic-associated diarrhea: a systematic review and meta-analysis. JAMA. 2012;307:1959-1969.
2. Procter & Gamble. Align product information. www.aligngi.com/information-on-Align-probiotic-supplement. Accessed May 19, 2015.
3. Bayer HealthCare. Phillip’s Colon Health product information. http://phillipspro.com/en/home/product-information/index.php. Accessed May 19, 2015.
4. Nature’s Bounty. Nature’s Bounty Acidophilus Probiotic product label. http://images.vitaminimages.com/cdn/sd/pdf/L002610-NB.PDF. Accessed May 19, 2015.
5. Dannon. Activia. http://activia.us.com/probiotic-yogurt/activia. Accessed May 19, 2015.
6. Lifeway. Lifeway Kefir frequently asked questions. http://lifewaykefir.com/faq/. Accessed May 19, 2015.
7. Allen SJ, Martinez EG, Gregorio GV, et al. Probiotics for treating acute infectious diarrhoea. Cochrane Database Syst Rev. 2010;(11):CD003048.
8. McFarland LV. Meta-analysis of probiotics for the prevention of traveler’s diarrhea. Travel Med Infect Dis. 2007;5:97-105.
9. Hamad A, Fragkos KC, Forbes A. A systemic review and meta-analysis of probiotics for the management of radiation induced bowel disease. Clin Nutr. 2013;32:353-360.
10. Videlock EJ, Cremonini F. Meta-analysis: probiotics in antibiotic-associated diarrhoea. Aliment Pharmacol Ther. 2012;35:1355-1369.
11. Pillai A, Nelson RL. Probiotics for treatment of Clostridium difficile–associated colitis in adults. Cochrane Database Syst Rev. 2008;(1):CD004611.
12. Johnston BC, Ma SY, Goldenberg JZ, et al. Probiotics for the prevention of Clostridium difficile–associated diarrhea: a systematic review and meta-analysis. Ann Intern Med. 2012;157:878-888.
13. Szajewska H, Horvath A, Piwowarczyk A. Meta-analysis: the effects of Saccharomyces boulardii supplementation on Helicobacter pylori eradication rates and side effects during treatment. Aliment Pharmacol Ther. 2010;32:1069-1079.
14. Sachdeva A, Nagpal J. Effect of fermented milk-based probiotic preparations on Helicobacter pylori eradication: a systematic review and meta-analysis of randomized controlled trials. Eur J Gastroenterol Hepatol. 2009;21:45-53.
15. Wang ZH, Gao QY, Fang JY. Meta-analysis of the efficacy and safety of Lactobacillus-containing and Bifidobacterium-containing probiotic compound preparation in Helicobacter pylori eradication therapy. J Clin Gastroenterol. 2013;47:25-32.
16. Butterworth AD, Thomas AG, Akobeng AK. Probiotics for induction of remission in Crohn’s disease. Cochrane Database Syst Rev. 2008; 16:CD006634.
17. Rolfe VE, Fortun PJ, Hawkey CJ, et al. Probiotics for maintenance of remission in Crohn’s disease. Cochrane Database Syst Rev. 2006;(4):CD004826.
18. Mallon P, McKay D, Kirk SJ, et al. Probiotics for induction of remission in ulcerative colitis. Cochrane Database Syst Rev. 2007;(4):CD005573.
19. Naidoo K, Gordon M, Fagbemi AO, et al. Probiotics for maintenance of remission in ulcerative colitis. Cochrane Database Syst Rev. 2011;(12):CD007443.
20. Guglielmetti S, Mora D, Gschwender M, et al. Randomised clinical trial: Bifidobacterium bifidum MIMBb75 significantly alleviates irritable bowel syndrome and improves quality of life—a double-blind, placebo-controlled study. Aliment Pharmacol Ther. 2011;33:1123-1132.
21. Moayyedi P, Ford AC, Talley NJ, et al. The efficacy of probiotics in the treatment of irritable bowel syndrome: a systematic review. Gut. 2010; 59:325-332.
22. Allen SJ, Wareham K, Wang D, et al. Lactobacilli and bifidobacteria in the prevention of antibiotic-associated diarrhoea and Clostridium difficile diarrhoea in older inpatients (PLACIDE): a randomised, double-blind, placebo-controlled, multicentre trial. Lancet. 2013;382:1249-1257.
23. Roberts LM, McCahon D, Holder R, et al. A randomised controlled trial of a probiotic ‘functional food’ in the management of irritable bowel syndrome. BMC Gastroenterol. 2013;13:45.
Tech Tools— Innovative Devices for the ED
Emergency physicians (EPs) are always interested in what are the “tried-and-true” as well as the “latest-and-greatest” devices that will provide the best results for their patients. This article, while not a comprehensive list of every such device introduced over the past few years, does provide an overview of the most notable ones applicable for use in the ED.
Tonometry

The standard iCare tonometer device (TA01i; iCare Finland Oy, Vantaa, Finland),1 began to gain acceptance in the United States in 2007 (Figure 1). Early studies2 have shown its measurement accuracy of intraocular pressure (IOP) to be equivalent to traditional tonometers such as the Tono-Pen XL Applanation Tonometer (Reichert Techonologies, Depew, New York).3
The iCare tonometer is easy to calibrate and use. Consisting of a pin inserted into a magnetic housing, the magnet quickly pushes the blunt end of the pin out to make contact with the cornea. Six quick measurements provide the clinician with an average IOP. The device can be used without anesthesia and is also applicable for at-home use.
Airway Devices
C-MAC Tip System
While direct laryngoscopy will always have a role in clinical practice, there has been a revolution in airway management over the past few years, with video laryngoscopy rapidly replacing direct laryngoscopy. The C-MAC Tip system (Karl Storz Endoscopy-America, Inc, El Segundo, California) is one of the devices currently available.4,5 While this device is not at the lower end of the cost spectrum in airway devices, it is, in this author’s opinion, among the highest quality video laryngoscopes on the market. The hub of C-MAC Tip system is a video screen that accepts input from multiple devices. The most common is the video MacIntosh blade, which is shaped like a traditional MacIntosh but with a slightly thicker handle—allowing both direct and indirect intubation.
The C-MAC Tip system is a great teaching tool, allowing learners to perform direct laryngoscopy while providing reassuring visualization to the instructor of the intubation on the screen. (No longer does the instructor need to repeatedly ask the learner what he or she is viewing!) Moreover, when required, the clinician performing the intubation can look at the screen to benefit from the superior visualization of indirect laryngoscopy.
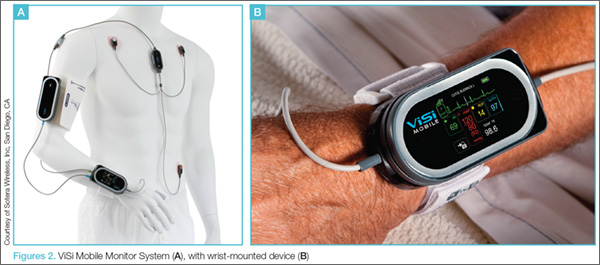
The C-MAC can also accept input from the D-Blade, which facilitates indirect intubation of anterior airways; however, it does not allow direct intubation when secretions or blood obscure the camera, though there is a suction channel that assists in clearing secretions. The clinician can also add a nasal pharyngeal scope as well as an adult or pediatric bronchoscope. The modularity of the C-MAC system is therefore a flexible addition to any airway armamentarium.
Regarding its use in emergency medicine, in addition to cost considerations, a potential concern is the ability of the plastic adapters to hold up to frequent, repetitive use in a setting such as a busy ED.
Wireless Vital Signs Monitoring Systems
Patient vital signs monitoring systems can currently double as four-point restraints. One new device, the ViSi Mobile Monitor System (Sotera Wireless, Inc, San Diego, CA), however, may make this a thing of the past.6 This system allows for inpatient monitoring of respiratory rate (RR), pulse oximetry, continuous blood pressure (BP), and temperature, as well as a multilead electrocardiogram. The entire system attaches to a small wrist-mounted device, which connects to a hospital monitoring system through a WiFi network (Figures 2a and 2b).ViSi Mobile Monitor
Another example of a wireless monitoring device is the EarlySense Chair Sensor system (EarlySense, Ltd, Ramat Gan, Israel) (Figure 3).7 This device assesses heart rate (HR) and RR simply by seating the patient in a chair. In the near future, this device will likely have the ability to take full vital signs. While not quite ready for prime-time in the ED, systems such as the EarlySense Chair Sensor offer a glimpse of the future in vital sign monitoring technology.
Vascular Access
Traditional intravenous (IV) line placement continues to be the standard of care for vascular access, but is not always feasible. Intraosseous needles, which have been around for decades, are seeing a new renaissance of use thanks to devices such as the Arrow EZ-IO Intraosseous Vascular Access System (Teleflex, Shavano Park, Texas).8 With these standards in mind, some new considerations are on the market, including the AV400 vein visualization system (AccuVein, Inc, Huntington, New York).
Arrow EZ-IO Intraosseous Vascular Access System
Teleflex, the maker of the EZ-IO, has recently made a push for humeral placement in order to achieve faster flow rates. Teleflex recommends using the longer needles (normally reserved for obese patients) with specific placement suggestions to facilitate retention of the needle. The Teleflex Web site8 and mobile application provide succinct, easy-to-understand instructions on placement.
AV400 Vein Visualization System
In addition to the Intraosseous Vascular Access System, the placement of an IV line may also be facilitated by laser devices such as AccuVein’s AV400 vein visualization technology. While earlier versions of both of these systems were comparable to that of a skilled technician in obtaining line placement, the latest generations of these devices have improved depth and visualization of truly difficult vascular access.
Internet-Connected Smart Glasses
In addition to the above-mentioned evolutionary changes in facilitating venous access, revolutionary technological advancements have been in development and are forthcoming. One such technology is network-connected smart glasses.
Eyes-On Glasses
Among the first in network-connected eyewear is Eyes-On Glasses (Evena Medical Inc, Los Altos, California).9 This system functions in a similar manner as other laser systems, except that the screen is a display mounted on eyeglasses, making venous placement much more intuitive (This is especially helpful for those who have difficulty translating the three-dimensional world to a two-dimensional screen).
Another variation on head-mounted technology is General Electric’s (GE) beta software for Google Glass (Google Inc, Mountain View, California) (Figure 4). This prototype links a GE ultrasound machine to Google Glass via WiFi, again simultaneously facilitating visualization of the field and the screen.10 While Google Glass is not currently available for the general public, there is still a place for it in the clinical setting.
Both the Eyes-On Glasses and Google Glass devices share a common thread: to improve patient comfort and facilitate time-consuming procedures.
Wound Care
Aquacel Ag
The EP sees a fair share of burn victims, the standard of care for which has been silver sulfadiazine and daily dressing changes. Care for burn wounds is beginning to change with the introduction of antimicrobial impregnated dressings such as Aquacel Ag (ConvaTec Inc, Greensboro, North Carolina).11 Aquacel Ag comes packaged in various forms and sizes ranging from large sheets for torsos to custom formed gloves for hands. This product is safe to use on the face and can be applied to partial thickness burns where the dermal layer is gone. The fluid from the wound moistens the bandage and helps it adhere to the skin. The dressings are then left in place until they slough-off on their own (approximately 7 to 10 days after placement). Consequently, no dressing changes are required, with cosmesis matching that of classic treatment.
While EPs may find Aquacel Ag useful in treating burns that do not require inpatient hospital admission, they also will find its use highly beneficial in treating patients with “road rash,” the abrasions that occur when one wipes-out at high speeds on asphalt (eg, motorcycle accidents). As with burn wounds, only a single application of Aquacel Ag is required on a debrided abrasion.
With respect to price, a single application of Aquacel Ag costs roughly the same as multiple dressing changes with other wound-care products.12 One concern relating to the use of advanced silver-impregnated dressings is the cost of care since silver-impregnated dressings are relatively expensive compared to traditional dressings. The higher cost, however, is partially offset by the reduced use of secondary gauze, and retention dressings, as well as improved wound healing together with the reduced costs of other care. Cost-effectiveness calculations comparing Aquacel Ag to standard of care in patients with acute and chronic wounds showed favorable results using Aquacel Ag.12-18
When using these dressings, the EP should make sure the follow-up clinic is familiar with their application so that they are not inadvertently removed at the patient’s first visit.
Medication Event Monitoring Systems
There have been a couple of recent changes in medication monitoring that are beginning to make manual pill-counting a thing of the past. Earlier generations of smart pill bottles came with a timer and an alarm that chimed and lit up to alert the patient when it was time to take his or her medication. Once the bottle was opened, the system reset itself. Unfortunately, the basic nature of these systems was not able to account for the number of pills a patient ingested at each scheduled dosing.

An example of newer and more technologically advanced pill-monitoring systems is AdhereTech’s smart wireless pill bottle (AdhereTech, New York, New York). In this system, the pill bottle can be connected to a WiFi network, allowing medication information to be shared (Figure 5).19 For example, a user could have the bottle connected to his or her provider, home healthcare worker, and family member. If a patient misses a dose of medication, the appropriate person receives notification and can make contact with the patient or family member to intervene. As with earlier generation products, these systems cannot account for or prevent a patient from either overdosing or underdosing on a medication.
The patch and sensor-enabled pill system, the Ingestible Event Marker, (Proteus Digital Health, Redwood City, California), which became available this past year, provides more advanced medication monitoring.20 This system allows tracking of individual pills through small chips imbedded in the tablet (Figure 6). The chip is then monitored through a patch worn on the patient’s body. Once connected, the physician is able to not only track when a pill bottle is opened, but also when and how many tablets the patient is ingesting. Moreover, the system has the ability to perform physiologic tracking to monitor patient response to the medication.21
Each of the above systems is a huge benefit to elderly patients and their geographically-separated families. Through these devices, children and other family members can stay apprised of a parent or other loved one’s health through these at-home monitoring systems—in a similar manner as some parents track a new teenaged driver through his or her cell phone!
Other Smart Devices
Connected devices are moving past pill bottles and smart glasses. In the same manner that many people employ fitness trackers to monitor the number of steps taken and calories burned, multiple glucometers are available that sync with a patient’s smart phone, allowing upload of the data to his or her healthcare provider. This field is also growing into commercially available HR monitors that allow easy monitoring for arrhythmias in low-risk patients.
While these devices are a boon for primary care physicians and can greatly assist in determining medication noncompliance, some potential systems issues may result in a false emergency notification akin to patients presenting to the ED for evaluation after receiving an inaccurate high BP reading on a grocery-store or home monitoring device. For instance, HR monitors with a faulty lead may cause an alert from the monitoring system noting atrial fibrillation and recommending the patient seek immediate evaluation. Similarly, a smart phone-connected glucometer may note hyperglycemia in a patient after he or she has consumed a high-sugar meal.

While there has been a reemergence in the use of traditional tourniquets, they are not effective in controlling hemorrhage at junctional sites such as the groin or axilla as there is inadequate space to accommodate the tourniquet. Two recent solutions are the Combat Ready Clamp (CRoC) and SAM Junctional Tourniquet, which are specially designed to control bleeding in an improvised explosive device or blast-type injury. As with intraosseous access devices, the use of tourniquets is also making a comeback. Both owe their new-found popularity—at least in some part—to the involvement of the United States in the recent wars in Iraq and Afghanistan. High casualty rates from improvised explosive devices countered by significant improvements in body armor have resulted in preservation of the torso at the expense of extremities. Life-threatening hemorrhage from a distal extremity can easily be controlled by a tourniquet—something this author never used as an infantryman during Desert Storm, but which is now carried on the person of every soldier in the field.

The Combat Ready Clamp (Combat Medical Systems, Harrisburg, North Carolina)22 compresses the aorta and vena cava though intra-abdominal pressure (Figure 7). While some may find this device a bit cumbersome for field use, it is definitely feasible and applicable for hospital use. A similar option, the SAM Junctional Tourniquet (SAM Medical Products, Wilsonville, Oregon),23 (Figure 8) functions in a similar manner as the CROC but uses pneumatic instead of mechanical pressure. The SAM device is definitely more “rucksack friendly,” but both products are good alternatives for controlling hemorrhages in the ED.
Hemostatic agents such as QuickClot (Z-Medica, Wallingford, Connecticut)24 have been in popular use for about a decade now, and the next generation of this family of treatment options has become available. The XStat-30 (RevMedx, Wilsonville, Oregon)25 (Figure 9) is one such product. Its large syringe applicator (like a large Toomey syringe) is filled with tablets of chitin. The injector is designed to be inserted into a penetrating injury and its contents injected into the wound. Upon contact with blood, the chitin tablets expand in a similar manner as children’s “hatch-and-grow” toy eggs and capsules when immersed in water. The XStat-30 provides not only hemostasis, but also some level of tamponade.
Resuscitative Endovascular Balloon Occlusion of the Aorta
The final addition to the hemostasis comeback tour is the Resuscitative Endovascular Balloon Occlusion of the Aorta (REBOA) device (Pryor Medical, San Antonio, Texas).26 Like many of the products discussed in this article, REBOA has been around for some time, but its use had fallen out of practice. A recent reemergence has shown that REBOA benefits patients with lower abdominal, pelvic, and extremity injuries.
The principal of its use is simple: An occlusive balloon is inserted into the femoral artery and advanced to roughly the level of the midabdomen. Once inflated, the balloon stops blood flow distally. While more research needs to be done on indications and outcomes, REBOA has been successfully used in England in many hospitals and even in the field.27
Summary
Some of the most notable recent evolutionary and revolutionary technological advancements to have a significant and beneficial impact on patient care have been seen in new noninvasive tonographic devices to measure IOP; video laryngoscopic devices for airway management; wireless patient vital signs monitoring systems; alternatives to traditional vascular access such as intraosseous vascular systems, laser-assisted vein visualization technology, and Internet-connected smart glasses; advances in wound-care dressings; medication monitoring systems; clamps and tourniquets to control junctional hemorrhage; and wireless, smart-phone connected glucometer devices and HR monitors. Many of these devices and systems are applicable and appropriate for use in the ED, the implementation of which will further facilitate and improve the quality of patient care.
Dr Wagner is an assistant professor of emergency medicine; program director for the emergency medicine residency program; and director of augmented learning at Barnes-Jewish Hospital, Saint Louis, Missouri.
The author invites readers to contact him via Twitter @TheTechDoc with suggestions for future devices.
The views expressed in this article are those of the author and do not represent the views or opinions of the editorial staff, the editorial board or the publisher.
- iCare Tonometer. iCare Finland. http://www.icaretonometer.com/products/icare-ta01/. Accessed June 2, 2015.
- García-Resúa C, González-Meijome JM, Gilino J, Yebra-Pimentel E. Accuracy of the new ICare rebound tonometer vs. other portable tonometers in healthy eyes. Optom Vis Sci. 2006;83(2):102-107.
- Reichert Technologies. Tono-Pen & Ocu-Film +. http://www.reichert.com/products.cfm?pcId=474. Accessed June 2, 2015.
- Karl Storz-Endoskope. From Laryngoscopy to Video Laryngoscopy. The history of endotracheal intubation. https://www.karlstorz.com/cps/rde/xbcr/karlstorz_assets/ASSETS/2133990.pdf. Accessed May 5, 2015.
- Lipe DN, Lindstrom R, Tauferner D, Mitchell C, Moffett P. Evaluation of Karl Storz C-MAC Tip Device Versus Traditional Airway Suction in a Cadaver Model. West J Emerg Med. 2014;15(4):548-553.
- ViSi Mobile. Sotera Wireless. http://www.visimobile.com/. Accessed May 6, 2015.
- EarlySense Chair Sensor Receives FDA Clearance [press release]. Waltham, MA:Early Sense; July 2, 2014. http://www.earlysense.com/news-and-events/news/jul-2-2014/. Accessed May 6, 2015.
- Arrow EZ-10. Teleflex. http://www.arrowezio.com/. Accessed May 6, 2015.
- Evena Medical Eyes-On Glass 1.0. http://evenamed.com/~even5672/~even5672/products/glasses. Accessed May 6, 2015.
- Wu TS, Dameff CJ, Tully JL. Ultrasound-guided central venous access using google glass. J Emerg Med. 2014;47(6):668-675.
- Aquacel Ag Dressing. ConvaTec. http://www.convatec.com/wound-skin/aquacel-ag-dressing. Accessed May 6, 2015.
- A review of the applications of the hydrofiber dressing with silver (Aquacel Ag) in wound care. Ther Clin Risk Manag. 2010;6:21-27.
- Caruso DM, Foster KN, Blome-Eberwein SA, et al. Randomized clinical study of Hydrofiber dressing with silver or silver sulfadiazine in the management of partial-thickness burns. J Burn Care Res. 2006;27(3):298–309.
- Kaźmierski M, Mańkowski P, Jankowski A, Harasymczuk J. Comparison of the results of operative and conservative treatment of deep dermal partial-thickness scalds in children. Eur J Pediatr Surg. 2007;17(5):354–361.
- Lohana P, Potokar TS. Aquacel Ag in paediatric burns: a prospective audit. Ann Burns Fire Disasters. 2006;19(3):144-147.
- Paddock HN, Fabia R, Giles S, et al. A silver-impregnated antimicrobial dressing reduces hospital costs for pediatric burn patients. J Pediatr Surg. 2007;42(1):211–213.
- Saba SC, Tsai R, Glat P. Clinical evaluation comparing the efficacy of aquacel ag hydrofiber dressing versus petrolatum gauze with antibiotic ointment in partial-thickness burns in a pediatric burn center. J Burn Care Res. 2009;30(3):380–385.
- Scanlon E, Karlsmark T, Leaper DJ, et al. Cost-effective faster wound healing with a sustained silver-releasing foam dressing in delayed healing leg ulcers-a health-economic analysis. Int Wound J. 2005;2(2):150-160.
- Smart Wireless Pill Bottles. AdhereTech. http://adheretech.com/. Accessed May 6, 2015.
- Proteus Digital Health. http://www.proteus.com/. Accessed May 6, 2015.
- Kim E. ‘Digital pill’ with chip inside gets FDA green light. CNN Money. http://money.cnn.com/2012/08/03/technology/startups/ingestible-sensor-proteus/. Accessed May 6, 2015.
- CROC Combat Ready Clamp (CRoC). Combat Medical. http://combatmedicalsystems.com/products/prod_massivehem_croc/ Accessed May 6, 2015.
- SAM Junctional Tourniquet. SAM Medical Products. http://www.sammedical.com/products/the-sam-junctional-tourniquet/. Accessed May 6, 2015.
- QuikClot hemostatic devices help patients survive traumatic blood loss. QuikClot. http://www.quikclot.com/. Accessed May 6, 2015.
- Revmedx. Revolutionary Medical Technologies. http://www.revmedx.com/#!xstat-dressing/c2500. Accessed May 6, 2015.
- Stannard A, Eliason JL, Rasmussen TE. Resuscitative Endovascular Balloon Occlusion of the Aorta (REBOA) as an adjunct for hemorrhagic shock J Trauma. 2011;71(6):1869-1872.
- London’s Air Ambulance Performs World’s First Prehospital REBOA. EMSWORLD – Patient Care. http://www.emsworld.com/news/11545597/londons-air-ambulance-performs-worlds-first-prehospital-reboa. Published July 2, 2014. Accessed May 6, 2015.
Emergency physicians (EPs) are always interested in what are the “tried-and-true” as well as the “latest-and-greatest” devices that will provide the best results for their patients. This article, while not a comprehensive list of every such device introduced over the past few years, does provide an overview of the most notable ones applicable for use in the ED.
Tonometry
The standard iCare tonometer device (TA01i; iCare Finland Oy, Vantaa, Finland),1 began to gain acceptance in the United States in 2007 (Figure 1). Early studies2 have shown its measurement accuracy of intraocular pressure (IOP) to be equivalent to traditional tonometers such as the Tono-Pen XL Applanation Tonometer (Reichert Techonologies, Depew, New York).3
The iCare tonometer is easy to calibrate and use. Consisting of a pin inserted into a magnetic housing, the magnet quickly pushes the blunt end of the pin out to make contact with the cornea. Six quick measurements provide the clinician with an average IOP. The device can be used without anesthesia and is also applicable for at-home use.
Airway Devices
C-MAC Tip System
While direct laryngoscopy will always have a role in clinical practice, there has been a revolution in airway management over the past few years, with video laryngoscopy rapidly replacing direct laryngoscopy. The C-MAC Tip system (Karl Storz Endoscopy-America, Inc, El Segundo, California) is one of the devices currently available.4,5 While this device is not at the lower end of the cost spectrum in airway devices, it is, in this author’s opinion, among the highest quality video laryngoscopes on the market. The hub of C-MAC Tip system is a video screen that accepts input from multiple devices. The most common is the video MacIntosh blade, which is shaped like a traditional MacIntosh but with a slightly thicker handle—allowing both direct and indirect intubation.
The C-MAC Tip system is a great teaching tool, allowing learners to perform direct laryngoscopy while providing reassuring visualization to the instructor of the intubation on the screen. (No longer does the instructor need to repeatedly ask the learner what he or she is viewing!) Moreover, when required, the clinician performing the intubation can look at the screen to benefit from the superior visualization of indirect laryngoscopy.
The C-MAC can also accept input from the D-Blade, which facilitates indirect intubation of anterior airways; however, it does not allow direct intubation when secretions or blood obscure the camera, though there is a suction channel that assists in clearing secretions. The clinician can also add a nasal pharyngeal scope as well as an adult or pediatric bronchoscope. The modularity of the C-MAC system is therefore a flexible addition to any airway armamentarium.
Regarding its use in emergency medicine, in addition to cost considerations, a potential concern is the ability of the plastic adapters to hold up to frequent, repetitive use in a setting such as a busy ED.
Wireless Vital Signs Monitoring Systems
Patient vital signs monitoring systems can currently double as four-point restraints. One new device, the ViSi Mobile Monitor System (Sotera Wireless, Inc, San Diego, CA), however, may make this a thing of the past.6 This system allows for inpatient monitoring of respiratory rate (RR), pulse oximetry, continuous blood pressure (BP), and temperature, as well as a multilead electrocardiogram. The entire system attaches to a small wrist-mounted device, which connects to a hospital monitoring system through a WiFi network (Figures 2a and 2b).ViSi Mobile Monitor
Another example of a wireless monitoring device is the EarlySense Chair Sensor system (EarlySense, Ltd, Ramat Gan, Israel) (Figure 3).7 This device assesses heart rate (HR) and RR simply by seating the patient in a chair. In the near future, this device will likely have the ability to take full vital signs. While not quite ready for prime-time in the ED, systems such as the EarlySense Chair Sensor offer a glimpse of the future in vital sign monitoring technology.
Vascular Access
Traditional intravenous (IV) line placement continues to be the standard of care for vascular access, but is not always feasible. Intraosseous needles, which have been around for decades, are seeing a new renaissance of use thanks to devices such as the Arrow EZ-IO Intraosseous Vascular Access System (Teleflex, Shavano Park, Texas).8 With these standards in mind, some new considerations are on the market, including the AV400 vein visualization system (AccuVein, Inc, Huntington, New York).
Arrow EZ-IO Intraosseous Vascular Access System
Teleflex, the maker of the EZ-IO, has recently made a push for humeral placement in order to achieve faster flow rates. Teleflex recommends using the longer needles (normally reserved for obese patients) with specific placement suggestions to facilitate retention of the needle. The Teleflex Web site8 and mobile application provide succinct, easy-to-understand instructions on placement.
AV400 Vein Visualization System
In addition to the Intraosseous Vascular Access System, the placement of an IV line may also be facilitated by laser devices such as AccuVein’s AV400 vein visualization technology. While earlier versions of both of these systems were comparable to that of a skilled technician in obtaining line placement, the latest generations of these devices have improved depth and visualization of truly difficult vascular access.
Internet-Connected Smart Glasses
In addition to the above-mentioned evolutionary changes in facilitating venous access, revolutionary technological advancements have been in development and are forthcoming. One such technology is network-connected smart glasses.
Eyes-On Glasses
Among the first in network-connected eyewear is Eyes-On Glasses (Evena Medical Inc, Los Altos, California).9 This system functions in a similar manner as other laser systems, except that the screen is a display mounted on eyeglasses, making venous placement much more intuitive (This is especially helpful for those who have difficulty translating the three-dimensional world to a two-dimensional screen).
Another variation on head-mounted technology is General Electric’s (GE) beta software for Google Glass (Google Inc, Mountain View, California) (Figure 4). This prototype links a GE ultrasound machine to Google Glass via WiFi, again simultaneously facilitating visualization of the field and the screen.10 While Google Glass is not currently available for the general public, there is still a place for it in the clinical setting.
Both the Eyes-On Glasses and Google Glass devices share a common thread: to improve patient comfort and facilitate time-consuming procedures.
Wound Care
Aquacel Ag
The EP sees a fair share of burn victims, the standard of care for which has been silver sulfadiazine and daily dressing changes. Care for burn wounds is beginning to change with the introduction of antimicrobial impregnated dressings such as Aquacel Ag (ConvaTec Inc, Greensboro, North Carolina).11 Aquacel Ag comes packaged in various forms and sizes ranging from large sheets for torsos to custom formed gloves for hands. This product is safe to use on the face and can be applied to partial thickness burns where the dermal layer is gone. The fluid from the wound moistens the bandage and helps it adhere to the skin. The dressings are then left in place until they slough-off on their own (approximately 7 to 10 days after placement). Consequently, no dressing changes are required, with cosmesis matching that of classic treatment.
While EPs may find Aquacel Ag useful in treating burns that do not require inpatient hospital admission, they also will find its use highly beneficial in treating patients with “road rash,” the abrasions that occur when one wipes-out at high speeds on asphalt (eg, motorcycle accidents). As with burn wounds, only a single application of Aquacel Ag is required on a debrided abrasion.
With respect to price, a single application of Aquacel Ag costs roughly the same as multiple dressing changes with other wound-care products.12 One concern relating to the use of advanced silver-impregnated dressings is the cost of care since silver-impregnated dressings are relatively expensive compared to traditional dressings. The higher cost, however, is partially offset by the reduced use of secondary gauze, and retention dressings, as well as improved wound healing together with the reduced costs of other care. Cost-effectiveness calculations comparing Aquacel Ag to standard of care in patients with acute and chronic wounds showed favorable results using Aquacel Ag.12-18
When using these dressings, the EP should make sure the follow-up clinic is familiar with their application so that they are not inadvertently removed at the patient’s first visit.
Medication Event Monitoring Systems
There have been a couple of recent changes in medication monitoring that are beginning to make manual pill-counting a thing of the past. Earlier generations of smart pill bottles came with a timer and an alarm that chimed and lit up to alert the patient when it was time to take his or her medication. Once the bottle was opened, the system reset itself. Unfortunately, the basic nature of these systems was not able to account for the number of pills a patient ingested at each scheduled dosing.
An example of newer and more technologically advanced pill-monitoring systems is AdhereTech’s smart wireless pill bottle (AdhereTech, New York, New York). In this system, the pill bottle can be connected to a WiFi network, allowing medication information to be shared (Figure 5).19 For example, a user could have the bottle connected to his or her provider, home healthcare worker, and family member. If a patient misses a dose of medication, the appropriate person receives notification and can make contact with the patient or family member to intervene. As with earlier generation products, these systems cannot account for or prevent a patient from either overdosing or underdosing on a medication.
The patch and sensor-enabled pill system, the Ingestible Event Marker, (Proteus Digital Health, Redwood City, California), which became available this past year, provides more advanced medication monitoring.20 This system allows tracking of individual pills through small chips imbedded in the tablet (Figure 6). The chip is then monitored through a patch worn on the patient’s body. Once connected, the physician is able to not only track when a pill bottle is opened, but also when and how many tablets the patient is ingesting. Moreover, the system has the ability to perform physiologic tracking to monitor patient response to the medication.21
Each of the above systems is a huge benefit to elderly patients and their geographically-separated families. Through these devices, children and other family members can stay apprised of a parent or other loved one’s health through these at-home monitoring systems—in a similar manner as some parents track a new teenaged driver through his or her cell phone!
Other Smart Devices
Connected devices are moving past pill bottles and smart glasses. In the same manner that many people employ fitness trackers to monitor the number of steps taken and calories burned, multiple glucometers are available that sync with a patient’s smart phone, allowing upload of the data to his or her healthcare provider. This field is also growing into commercially available HR monitors that allow easy monitoring for arrhythmias in low-risk patients.
While these devices are a boon for primary care physicians and can greatly assist in determining medication noncompliance, some potential systems issues may result in a false emergency notification akin to patients presenting to the ED for evaluation after receiving an inaccurate high BP reading on a grocery-store or home monitoring device. For instance, HR monitors with a faulty lead may cause an alert from the monitoring system noting atrial fibrillation and recommending the patient seek immediate evaluation. Similarly, a smart phone-connected glucometer may note hyperglycemia in a patient after he or she has consumed a high-sugar meal.
While there has been a reemergence in the use of traditional tourniquets, they are not effective in controlling hemorrhage at junctional sites such as the groin or axilla as there is inadequate space to accommodate the tourniquet. Two recent solutions are the Combat Ready Clamp (CRoC) and SAM Junctional Tourniquet, which are specially designed to control bleeding in an improvised explosive device or blast-type injury. As with intraosseous access devices, the use of tourniquets is also making a comeback. Both owe their new-found popularity—at least in some part—to the involvement of the United States in the recent wars in Iraq and Afghanistan. High casualty rates from improvised explosive devices countered by significant improvements in body armor have resulted in preservation of the torso at the expense of extremities. Life-threatening hemorrhage from a distal extremity can easily be controlled by a tourniquet—something this author never used as an infantryman during Desert Storm, but which is now carried on the person of every soldier in the field.
The Combat Ready Clamp (Combat Medical Systems, Harrisburg, North Carolina)22 compresses the aorta and vena cava though intra-abdominal pressure (Figure 7). While some may find this device a bit cumbersome for field use, it is definitely feasible and applicable for hospital use. A similar option, the SAM Junctional Tourniquet (SAM Medical Products, Wilsonville, Oregon),23 (Figure 8) functions in a similar manner as the CROC but uses pneumatic instead of mechanical pressure. The SAM device is definitely more “rucksack friendly,” but both products are good alternatives for controlling hemorrhages in the ED.
Hemostatic agents such as QuickClot (Z-Medica, Wallingford, Connecticut)24 have been in popular use for about a decade now, and the next generation of this family of treatment options has become available. The XStat-30 (RevMedx, Wilsonville, Oregon)25 (Figure 9) is one such product. Its large syringe applicator (like a large Toomey syringe) is filled with tablets of chitin. The injector is designed to be inserted into a penetrating injury and its contents injected into the wound. Upon contact with blood, the chitin tablets expand in a similar manner as children’s “hatch-and-grow” toy eggs and capsules when immersed in water. The XStat-30 provides not only hemostasis, but also some level of tamponade.
Resuscitative Endovascular Balloon Occlusion of the Aorta
The final addition to the hemostasis comeback tour is the Resuscitative Endovascular Balloon Occlusion of the Aorta (REBOA) device (Pryor Medical, San Antonio, Texas).26 Like many of the products discussed in this article, REBOA has been around for some time, but its use had fallen out of practice. A recent reemergence has shown that REBOA benefits patients with lower abdominal, pelvic, and extremity injuries.
The principal of its use is simple: An occlusive balloon is inserted into the femoral artery and advanced to roughly the level of the midabdomen. Once inflated, the balloon stops blood flow distally. While more research needs to be done on indications and outcomes, REBOA has been successfully used in England in many hospitals and even in the field.27
Summary
Some of the most notable recent evolutionary and revolutionary technological advancements to have a significant and beneficial impact on patient care have been seen in new noninvasive tonographic devices to measure IOP; video laryngoscopic devices for airway management; wireless patient vital signs monitoring systems; alternatives to traditional vascular access such as intraosseous vascular systems, laser-assisted vein visualization technology, and Internet-connected smart glasses; advances in wound-care dressings; medication monitoring systems; clamps and tourniquets to control junctional hemorrhage; and wireless, smart-phone connected glucometer devices and HR monitors. Many of these devices and systems are applicable and appropriate for use in the ED, the implementation of which will further facilitate and improve the quality of patient care.
Dr Wagner is an assistant professor of emergency medicine; program director for the emergency medicine residency program; and director of augmented learning at Barnes-Jewish Hospital, Saint Louis, Missouri.
The author invites readers to contact him via Twitter @TheTechDoc with suggestions for future devices.
The views expressed in this article are those of the author and do not represent the views or opinions of the editorial staff, the editorial board or the publisher.
- iCare Tonometer. iCare Finland. http://www.icaretonometer.com/products/icare-ta01/. Accessed June 2, 2015.
- García-Resúa C, González-Meijome JM, Gilino J, Yebra-Pimentel E. Accuracy of the new ICare rebound tonometer vs. other portable tonometers in healthy eyes. Optom Vis Sci. 2006;83(2):102-107.
- Reichert Technologies. Tono-Pen & Ocu-Film +. http://www.reichert.com/products.cfm?pcId=474. Accessed June 2, 2015.
- Karl Storz-Endoskope. From Laryngoscopy to Video Laryngoscopy. The history of endotracheal intubation. https://www.karlstorz.com/cps/rde/xbcr/karlstorz_assets/ASSETS/2133990.pdf. Accessed May 5, 2015.
- Lipe DN, Lindstrom R, Tauferner D, Mitchell C, Moffett P. Evaluation of Karl Storz C-MAC Tip Device Versus Traditional Airway Suction in a Cadaver Model. West J Emerg Med. 2014;15(4):548-553.
- ViSi Mobile. Sotera Wireless. http://www.visimobile.com/. Accessed May 6, 2015.
- EarlySense Chair Sensor Receives FDA Clearance [press release]. Waltham, MA:Early Sense; July 2, 2014. http://www.earlysense.com/news-and-events/news/jul-2-2014/. Accessed May 6, 2015.
- Arrow EZ-10. Teleflex. http://www.arrowezio.com/. Accessed May 6, 2015.
- Evena Medical Eyes-On Glass 1.0. http://evenamed.com/~even5672/~even5672/products/glasses. Accessed May 6, 2015.
- Wu TS, Dameff CJ, Tully JL. Ultrasound-guided central venous access using google glass. J Emerg Med. 2014;47(6):668-675.
- Aquacel Ag Dressing. ConvaTec. http://www.convatec.com/wound-skin/aquacel-ag-dressing. Accessed May 6, 2015.
- A review of the applications of the hydrofiber dressing with silver (Aquacel Ag) in wound care. Ther Clin Risk Manag. 2010;6:21-27.
- Caruso DM, Foster KN, Blome-Eberwein SA, et al. Randomized clinical study of Hydrofiber dressing with silver or silver sulfadiazine in the management of partial-thickness burns. J Burn Care Res. 2006;27(3):298–309.
- Kaźmierski M, Mańkowski P, Jankowski A, Harasymczuk J. Comparison of the results of operative and conservative treatment of deep dermal partial-thickness scalds in children. Eur J Pediatr Surg. 2007;17(5):354–361.
- Lohana P, Potokar TS. Aquacel Ag in paediatric burns: a prospective audit. Ann Burns Fire Disasters. 2006;19(3):144-147.
- Paddock HN, Fabia R, Giles S, et al. A silver-impregnated antimicrobial dressing reduces hospital costs for pediatric burn patients. J Pediatr Surg. 2007;42(1):211–213.
- Saba SC, Tsai R, Glat P. Clinical evaluation comparing the efficacy of aquacel ag hydrofiber dressing versus petrolatum gauze with antibiotic ointment in partial-thickness burns in a pediatric burn center. J Burn Care Res. 2009;30(3):380–385.
- Scanlon E, Karlsmark T, Leaper DJ, et al. Cost-effective faster wound healing with a sustained silver-releasing foam dressing in delayed healing leg ulcers-a health-economic analysis. Int Wound J. 2005;2(2):150-160.
- Smart Wireless Pill Bottles. AdhereTech. http://adheretech.com/. Accessed May 6, 2015.
- Proteus Digital Health. http://www.proteus.com/. Accessed May 6, 2015.
- Kim E. ‘Digital pill’ with chip inside gets FDA green light. CNN Money. http://money.cnn.com/2012/08/03/technology/startups/ingestible-sensor-proteus/. Accessed May 6, 2015.
- CROC Combat Ready Clamp (CRoC). Combat Medical. http://combatmedicalsystems.com/products/prod_massivehem_croc/ Accessed May 6, 2015.
- SAM Junctional Tourniquet. SAM Medical Products. http://www.sammedical.com/products/the-sam-junctional-tourniquet/. Accessed May 6, 2015.
- QuikClot hemostatic devices help patients survive traumatic blood loss. QuikClot. http://www.quikclot.com/. Accessed May 6, 2015.
- Revmedx. Revolutionary Medical Technologies. http://www.revmedx.com/#!xstat-dressing/c2500. Accessed May 6, 2015.
- Stannard A, Eliason JL, Rasmussen TE. Resuscitative Endovascular Balloon Occlusion of the Aorta (REBOA) as an adjunct for hemorrhagic shock J Trauma. 2011;71(6):1869-1872.
- London’s Air Ambulance Performs World’s First Prehospital REBOA. EMSWORLD – Patient Care. http://www.emsworld.com/news/11545597/londons-air-ambulance-performs-worlds-first-prehospital-reboa. Published July 2, 2014. Accessed May 6, 2015.

2015 Update on menopause
As new options for managing menopausal symptoms emerge, so do data on their efficacy and safety. In this article, I highlight the following publications:
- long-term follow-up data from the Women’s Health Initiative (WHI) on the benefits and risks of hormone therapy (HT)
- a randomized trial of testosterone enanthate to improve sexual function among hysterectomized women
- guidance from the American College of Obstetricians and Gynecologists (ACOG) on the management of menopausal symptoms, including advice on individualization of therapy for older women
- a Swedish study on concomitant use of HT and statins.
After long-term follow-up of WHI participants, a “critical window” of HT timing is revealed
Manson JE, Chlebowski RT, Stefanick ML, et al. Menopausal hormone therapy and health outcomes during the intervention and extended poststopping phases of the Women’s Health Initiative randomized trials. JAMA. 2013;310(13):1353–1368.
After the initial 2002 publication of findings from the WHI trial of women with an intact uterus who were randomized to conjugated equine estrogens and medroxyprogesterone acetate or placebo, prominent news headlines claimed that HT causes myocardial infarction (MI) and breast cancer. As a result, millions of women worldwide stopped taking HT. A second impact of the report: Many clinicians became reluctant to prescribe HT.

Although it generated far less media attention, an October 2013 publication from the Journal of the American Medical Association, which details 13-year follow-up of WHI HT clinical trial participants, better informs clinicians and our patients about HT’s safety profile.
During the WHI intervention phase, absolute risks were modest
Although HT was associated with a multifaceted pattern of benefits and risks in both the estrogen-progestin therapy (EPT) and estrogen-only therapy (ET) arms of the WHI, absolute risks, as reflected in an increase or decrease in the number of cases per 10,000 women treated per year, were modest.
For example, the hazard ratio (HR) for coronary heart disease (CHD) during the intervention phase, during which participants were given HT or placebo (mean 5.2 years for EPT and 6.8 years for ET) was 1.18 in the EPT arm (95% confidence interval [CI], 0.95–1.45) and 0.94 in the ET arm (95% CI, 0.78–1.14). In both arms, women given HT had reduced risks of vasomotor symptoms, hip fractures, and diabetes, and increased risks of stroke, venous thromboembolism (VTE), and gallbladder disease, compared with women receiving placebo.
The results for breast cancer differed markedly between arms. During the intervention period, an elevated risk was observed with EPT while a borderline reduced risk was observed with ET.
Among participants older than 65 years at baseline, the risk of cognitive decline was increased in the EPT arm but not in the ET arm.
Post intervention, most risks and benefits attenuated
An elevation in the risk of breast cancer persisted in the EPT arm (cumulative HR over 13 years, 1.28; 95% CI, 1.11–1.48). In contrast, in the ET arm, a significantly reduced risk of breast cancer materialized (HR, 0.79; 95% CI, 0.65–0.97) (TABLE).
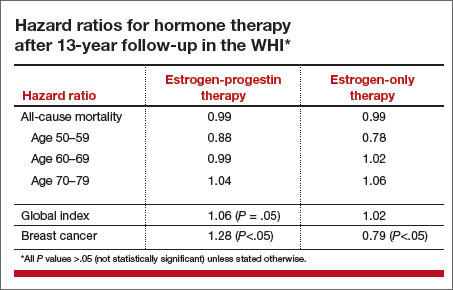
To put into perspective the elevated risk of breast cancer observed among women randomly allocated to EPT, the attributable risk is less than 1 additional case of breast cancer diagnosed per 1,000 EPT users annually. Another way to frame this elevated risk: An HR of 1.28 is slightly higher than the HR conferred by consuming 1 glass of wine daily and lower than the HR noted with 2 glasses daily.1 Overall, results tended to be more favorable for ET than for EPT. Neither type of HT affected overall mortality rates.
Age differences come to the fore
The WHI findings demonstrate a lower absolute risk of adverse events with HT in younger versus older participants. In addition, age and time since menopause appeared to affect many of the HRs observed in the trial. In the ET arm, more favorable results for all-cause mortality, MI, colorectal cancer, and the global index (CHD, invasive breast cancer, pulmonary embolism, colorectal cancer, and endometrial cancer) were observed in women aged 50 to 59 years at baseline. In the EPT arm, the risk of MI was elevated only in women more than 10 years past the onset of menopause at baseline. Both HT regimens, however, were associated with increased risks of stroke, VTE, and gallbladder disease.
EPT increased the risk of breast cancer in all age groups. However, the lower absolute risks of adverse events in younger women, together with the generally more favorable HRs for many outcomes in the younger women, resulted in substantially lower rates of adverse events attributable to HT in the younger age group, compared with older women.
As far as CHD is concerned, the impact of age (or time since menopause) on the vascular response to HT in women and in nonhuman models has generated support for a “critical window” or timing hypothesis, which postulates that estrogen reduces the development of early stages of atherosclerosis while causing plaque destabilization and other adverse effects when advanced atherosclerotic lesions are present. Recent studies from Scandinavia provide additional support for this hypothesis (see the sidebar below).
What this EVIDENCE means for practice
Long-term follow-up of women who participated in the WHI clarifies the benefit-risk profile of systemic HT, underscoring that the benefit-risk ratio is greatest in younger menopausal women.
Because the safety of HT is greater in women nearer the onset of menopause, as well as in those at lower baseline risk of cardiovascular disease (CVD), individualized risk assessment may improve the benefit-risk profile and safety of HT. One approach to decision-making for women with bothersome menopausal symptoms is the MenoPro app, a free mobile app from the North American Menopause Society, with modes for both clinicians and patients.
Further evidence that HT is safe when initiated soon after menopause
Tuomikoski P, Lyytinen H, Korhonen P, et al. Coronary heart disease mortality and hormone therapy before and after the Women’s Health Initiative. Obstet Gynecol. 2014;124(5):947–953.
In Finland, all deaths are recorded in a national register, in which particular attention is paid to accurately classifying those thought to result from coronary heart disease (CHD). In addition, since 1994, all HT users have been included in a national health insurance database, enabling detailed assessment of HT use and coronary artery disease. Investigators assessed CHD mortality from 1995 to 2009 in more than 290,000 HT users, comparing them with the background population matched for year and age.
Use of HT was associated with reductions in the CHD mortality rate of 18% to 29% (for ≤1 year of use) and 43% to 54% (for 1–8 years of use). Similar trends were noted for EPT and ET. The HT-associated protection against CHD mortality was more pronounced in users younger than 60.
Tuomikoski and colleagues concluded, and I concur, that the observational nature of their data does not allow us to recommend HT specifically to prevent CHD. Nonetheless, these findings, along with long-term follow-up data from the WHI, make the case that, for menopausal women who are younger than 60 or within 10 years of the onset of menopause, clinicians may consider initiating HT to treat bothersome vasomotor symptoms, a safe strategy with respect to CHD.
—Andrew M. Kaunitz, MD
In hysterectomized women, supraphysiologic doses of testosterone improve parameters of sexual function
Huang G, Basaria S, Travison TG, et al. Testosterone dose-response relationships in hysterectomized women with or without oophorectomy: effects on sexual function, body composition, muscle performance, and physical function in a randomized trial. Menopause. 2014;21(6):612–623.
No formulation of testosterone is approved by the US Food and Drug Administration (FDA) for use in women. Nonetheless, in the United States, many menopausal women hoping to boost their sexual desire are prescribed, off-label, testosterone formulations indicated for use in men, as well as compounded formulations.2
Investigators randomly allocated women who had undergone hysterectomy to 12 weeks of transdermal estradiol followed by 24 weekly intramuscular injections of placebo or testosterone enanthate at doses of 3.0 mg, 6.0 mg, 12.5 mg, or 25.0 mg while continuing estrogen. At the outset of the trial, all women had serum free testosterone levels below the range for healthy premenopausal women.
Among the 62 women who received testosterone, serum testosterone levels increased in a dose-related fashion. Among those allocated to the highest dose, serum total testosterone levels at 24 weeks were 5 to 6 times higher than values in healthy premenopausal women. Compared with women who received placebo, those who received the highest testosterone dose had better measures of sexual desire, arousal, and frequency of sexual activity. Excess hair growth was significantly more common in women who received the 2 highest doses of testosterone.
What this EVIDENCE means for practice
Although this well-executed study was small and short-term, it confirms that, in menopausal women receiving estrogen, testosterone can enhance parameters of sexuality. It is unfortunate that the dose needed to achieve this benefit results in markedly supraphysiologic serum testosterone levels.
One important caveat raised by this trial: It did not specifically recruit participants with low sexual desire. Therefore, it remains unknown whether lower doses of testosterone might provide benefits in women with low baseline libido. Regrettably, no randomized trials have addressed the long-term benefits and risks of use of testosterone among menopausal women.
ACOG offers valuable guidance on management of menopausal symptoms
ACOG Practice Bulletin No. 141: management of menopausal symptoms. American College of Obstetricians and Gynecologists. Obstet Gynecol. 2014;123(1):202–216.
Despite findings from new studies, optimal management of menopausal symptoms remains controversial. In January 2014, ACOG issued guidance regarding conventional systemic and vaginal HT, recently approved treatments, and compounded HT.
For the management of vasomotor symptoms, ACOG indicated that systemic HT (including oral and transdermal routes), alone or combined with a progestin, is the most effective treatment for bothersome menopausal vasomotor symptoms. The ACOG Practice Bulletin also pointed out that systemic EPT increases the risk for VTE and breast cancer and that, compared with oral estrogen, transdermal estrogen may carry a lower risk for VTE.
Some insurers deny coverage of HT for women older than 65 years
A classification of medications from the American Geriatrics Society known as “the Beers List” [the Beers Criteria for Potentially Inappropriate Medication Use in Older Adults] includes oral and transdermal estrogen, with or without a progestin.3 Along with many of the clinicians reading this Update, I routinely receive notices from insurance companies that, based on the Beers List, they will no longer provide reimbursement for systemic HT in patients who are older than 65 years. In this regard, I believe that one of the most important components of ACOG’s Practice Bulletin is the following text:
Three new options for menopausal HT
The ACOG Practice Bulletin describes 3 formulations for the treatment of menopausal symptoms that have recently become available:
- In women with a uterus and with bothersome vasomotor symptoms, an alternative to EPT is oral tablets combining conjugated equine estrogen (0.45 mg) with 20 mg of the selective estrogen receptor modulator (SERM) bazedoxifene.
- The oral SERM ospemifene (60 mg) is effective for relief of dyspareunia associated with vulvovaginal atrophy (also known as genitourinary syndrome of menopause).
- Paroxetine mesylate (7.5 mg) is the only FDA-approved nonhormonal formulation for management of vasomotor symptoms and is dosed lower than regimens used to treat psychiatric conditions.
Steer patients clear of compounded formulations
Every week I encounter patients who have recently visited physicians who prescribe and sell compounded bioidentical hormones. In addressing this issue, ACOG provides a useful service to women and their clinicians:
What this EVIDENCE means for practice
ACOG’s Practice Bulletin provides useful guidance for clinicians regarding treatment of menopausal symptoms. Besides clarifying that systemic HT should not be arbitrarily discontinued at age 65 and that FDA-approved HT is preferable to compounded HT, this publication details newer (including nonhormonal) formulations for treating menopausal symptoms as well as traditional HT formulations, including useful dosing information.
Is menopausal HT safe in statin users?
Berglind IA, Andersen M, Citarella A, Linder M, Sundström A, Kieler H. Hormone therapy and risk of cardiovascular outcomes and mortality in women treated with statins. Menopause. 2015;22(4):369–376.
Hodis HN, Mack WJ. Hormone therapy and risk of all-cause mortality in women treated with statins [comment]. Menopause. 2015;22(4):363–364.
Since the initial publications of findings from the WHI, clinicians have been cautioned not to prescribe menopausal HT in women at elevated risk for CVD. In this study from Sweden, investigators enrolled women 40 to 74 years old who initiated statin use between 2006 and 2007 due to known CVD (secondary prevention) or in the absence of known CVD (primary prevention). Women were followed for a mean of 4 years after beginning statins until the end of 2011.
Of 40,958 statin users, 7% used HT (mean age of HT users and nonusers was 61 and 62 years, respectively). Overall, 70% of statin use was for primary prevention. Deaths from CVD occurred in 5 and 18 patients per 10,000 person-years among HT users and nonusers, respectively (HR, 0.38). All-cause mortality occurred in 33 and 87 patients per 10,000 person-years among HT users and nonusers, respectively (HR, 0.53). These reduced risks of mortality noted in women who used concomitant statins achieved statistical significance. Whether statins were used for primary or secondary prevention, the incidence of cardiovascular events was similar in HT users and nonusers.
Why these findings diverge from those of the WHI
The findings of this large prospective cohort study are consistent with findings from other large observational studies—though they diverge from WHI findings. As Berglind and colleagues note, few WHI participants used statins at baseline. Also in contrast with the WHI, in which all HT was based on conjugated estrogen, all HT users in this Swedish study used oral or transdermal estradiol, as conjugated estrogen is not available in Sweden (and appears to be associated with an elevated risk of CVD, compared with other estrogens4).
What this EVIDENCE means for practice
This important study provides strong evidence that, for menopausal women with bothersome vasomotor symptoms or an elevated risk for osteoporosis, concomitant use of statins should not be considered a contraindication to HT.
Share your thoughts on this article! Send your Letter to the Editor to [email protected]. Please include your name and the city and state in which you practice.
1. Chen WY, Rosner B, Hankinson SE, Colditz GA, Willett WC. Moderate alcohol consumption during adult life, drinking patterns, and breast cancer risk. JAMA. 2011;306(17):1884–1190.
2. Kingsberg SA, Woodard T. Female sexual dysfunction: focus on low desire. Obstet Gynecol. 2015;125(2):477–486.
3. Geriatrics Care Online: Beers Pocket Card. http://www.americangeriatrics.org/files/documents/beers/PrintableBeersPocketCard.pdf. Accessed May 16, 2015.
4. Smith NL, Blondon M, Wiggins KL, et al. Lower risk of cardiovascular events in postmenopausal women taking oral estradiol compared with oral conjugated equine estrogens. JAMA Intern Med. 2014;174(1):25–31.

Andrew M. Kaunitz, MD
Dr. Kaunitz is University of Florida Research Foundation Professor and Associate Chairman, Department of Obstetrics and Gynecology, at the University of Florida College of Medicine–Jacksonville. Dr. Kaunitz serves on the OBG Management Board of Editors.
Dr. Kaunitz reports that he receives grant or research support from Bayer and Therapeutics MD and is a consultant to Actavis and Bayer.
As new options for managing menopausal symptoms emerge, so do data on their efficacy and safety. In this article, I highlight the following publications:
- long-term follow-up data from the Women’s Health Initiative (WHI) on the benefits and risks of hormone therapy (HT)
- a randomized trial of testosterone enanthate to improve sexual function among hysterectomized women
- guidance from the American College of Obstetricians and Gynecologists (ACOG) on the management of menopausal symptoms, including advice on individualization of therapy for older women
- a Swedish study on concomitant use of HT and statins.
After long-term follow-up of WHI participants, a “critical window” of HT timing is revealed
Manson JE, Chlebowski RT, Stefanick ML, et al. Menopausal hormone therapy and health outcomes during the intervention and extended poststopping phases of the Women’s Health Initiative randomized trials. JAMA. 2013;310(13):1353–1368.
After the initial 2002 publication of findings from the WHI trial of women with an intact uterus who were randomized to conjugated equine estrogens and medroxyprogesterone acetate or placebo, prominent news headlines claimed that HT causes myocardial infarction (MI) and breast cancer. As a result, millions of women worldwide stopped taking HT. A second impact of the report: Many clinicians became reluctant to prescribe HT.
Although it generated far less media attention, an October 2013 publication from the Journal of the American Medical Association, which details 13-year follow-up of WHI HT clinical trial participants, better informs clinicians and our patients about HT’s safety profile.
During the WHI intervention phase, absolute risks were modest
Although HT was associated with a multifaceted pattern of benefits and risks in both the estrogen-progestin therapy (EPT) and estrogen-only therapy (ET) arms of the WHI, absolute risks, as reflected in an increase or decrease in the number of cases per 10,000 women treated per year, were modest.
For example, the hazard ratio (HR) for coronary heart disease (CHD) during the intervention phase, during which participants were given HT or placebo (mean 5.2 years for EPT and 6.8 years for ET) was 1.18 in the EPT arm (95% confidence interval [CI], 0.95–1.45) and 0.94 in the ET arm (95% CI, 0.78–1.14). In both arms, women given HT had reduced risks of vasomotor symptoms, hip fractures, and diabetes, and increased risks of stroke, venous thromboembolism (VTE), and gallbladder disease, compared with women receiving placebo.
The results for breast cancer differed markedly between arms. During the intervention period, an elevated risk was observed with EPT while a borderline reduced risk was observed with ET.
Among participants older than 65 years at baseline, the risk of cognitive decline was increased in the EPT arm but not in the ET arm.
Post intervention, most risks and benefits attenuated
An elevation in the risk of breast cancer persisted in the EPT arm (cumulative HR over 13 years, 1.28; 95% CI, 1.11–1.48). In contrast, in the ET arm, a significantly reduced risk of breast cancer materialized (HR, 0.79; 95% CI, 0.65–0.97) (TABLE).
To put into perspective the elevated risk of breast cancer observed among women randomly allocated to EPT, the attributable risk is less than 1 additional case of breast cancer diagnosed per 1,000 EPT users annually. Another way to frame this elevated risk: An HR of 1.28 is slightly higher than the HR conferred by consuming 1 glass of wine daily and lower than the HR noted with 2 glasses daily.1 Overall, results tended to be more favorable for ET than for EPT. Neither type of HT affected overall mortality rates.
Age differences come to the fore
The WHI findings demonstrate a lower absolute risk of adverse events with HT in younger versus older participants. In addition, age and time since menopause appeared to affect many of the HRs observed in the trial. In the ET arm, more favorable results for all-cause mortality, MI, colorectal cancer, and the global index (CHD, invasive breast cancer, pulmonary embolism, colorectal cancer, and endometrial cancer) were observed in women aged 50 to 59 years at baseline. In the EPT arm, the risk of MI was elevated only in women more than 10 years past the onset of menopause at baseline. Both HT regimens, however, were associated with increased risks of stroke, VTE, and gallbladder disease.
EPT increased the risk of breast cancer in all age groups. However, the lower absolute risks of adverse events in younger women, together with the generally more favorable HRs for many outcomes in the younger women, resulted in substantially lower rates of adverse events attributable to HT in the younger age group, compared with older women.
As far as CHD is concerned, the impact of age (or time since menopause) on the vascular response to HT in women and in nonhuman models has generated support for a “critical window” or timing hypothesis, which postulates that estrogen reduces the development of early stages of atherosclerosis while causing plaque destabilization and other adverse effects when advanced atherosclerotic lesions are present. Recent studies from Scandinavia provide additional support for this hypothesis (see the sidebar below).
What this EVIDENCE means for practice
Long-term follow-up of women who participated in the WHI clarifies the benefit-risk profile of systemic HT, underscoring that the benefit-risk ratio is greatest in younger menopausal women.
Because the safety of HT is greater in women nearer the onset of menopause, as well as in those at lower baseline risk of cardiovascular disease (CVD), individualized risk assessment may improve the benefit-risk profile and safety of HT. One approach to decision-making for women with bothersome menopausal symptoms is the MenoPro app, a free mobile app from the North American Menopause Society, with modes for both clinicians and patients.
Further evidence that HT is safe when initiated soon after menopause
Tuomikoski P, Lyytinen H, Korhonen P, et al. Coronary heart disease mortality and hormone therapy before and after the Women’s Health Initiative. Obstet Gynecol. 2014;124(5):947–953.
In Finland, all deaths are recorded in a national register, in which particular attention is paid to accurately classifying those thought to result from coronary heart disease (CHD). In addition, since 1994, all HT users have been included in a national health insurance database, enabling detailed assessment of HT use and coronary artery disease. Investigators assessed CHD mortality from 1995 to 2009 in more than 290,000 HT users, comparing them with the background population matched for year and age.
Use of HT was associated with reductions in the CHD mortality rate of 18% to 29% (for ≤1 year of use) and 43% to 54% (for 1–8 years of use). Similar trends were noted for EPT and ET. The HT-associated protection against CHD mortality was more pronounced in users younger than 60.
Tuomikoski and colleagues concluded, and I concur, that the observational nature of their data does not allow us to recommend HT specifically to prevent CHD. Nonetheless, these findings, along with long-term follow-up data from the WHI, make the case that, for menopausal women who are younger than 60 or within 10 years of the onset of menopause, clinicians may consider initiating HT to treat bothersome vasomotor symptoms, a safe strategy with respect to CHD.
—Andrew M. Kaunitz, MD
In hysterectomized women, supraphysiologic doses of testosterone improve parameters of sexual function
Huang G, Basaria S, Travison TG, et al. Testosterone dose-response relationships in hysterectomized women with or without oophorectomy: effects on sexual function, body composition, muscle performance, and physical function in a randomized trial. Menopause. 2014;21(6):612–623.
No formulation of testosterone is approved by the US Food and Drug Administration (FDA) for use in women. Nonetheless, in the United States, many menopausal women hoping to boost their sexual desire are prescribed, off-label, testosterone formulations indicated for use in men, as well as compounded formulations.2
Investigators randomly allocated women who had undergone hysterectomy to 12 weeks of transdermal estradiol followed by 24 weekly intramuscular injections of placebo or testosterone enanthate at doses of 3.0 mg, 6.0 mg, 12.5 mg, or 25.0 mg while continuing estrogen. At the outset of the trial, all women had serum free testosterone levels below the range for healthy premenopausal women.
Among the 62 women who received testosterone, serum testosterone levels increased in a dose-related fashion. Among those allocated to the highest dose, serum total testosterone levels at 24 weeks were 5 to 6 times higher than values in healthy premenopausal women. Compared with women who received placebo, those who received the highest testosterone dose had better measures of sexual desire, arousal, and frequency of sexual activity. Excess hair growth was significantly more common in women who received the 2 highest doses of testosterone.
What this EVIDENCE means for practice
Although this well-executed study was small and short-term, it confirms that, in menopausal women receiving estrogen, testosterone can enhance parameters of sexuality. It is unfortunate that the dose needed to achieve this benefit results in markedly supraphysiologic serum testosterone levels.
One important caveat raised by this trial: It did not specifically recruit participants with low sexual desire. Therefore, it remains unknown whether lower doses of testosterone might provide benefits in women with low baseline libido. Regrettably, no randomized trials have addressed the long-term benefits and risks of use of testosterone among menopausal women.
ACOG offers valuable guidance on management of menopausal symptoms
ACOG Practice Bulletin No. 141: management of menopausal symptoms. American College of Obstetricians and Gynecologists. Obstet Gynecol. 2014;123(1):202–216.
Despite findings from new studies, optimal management of menopausal symptoms remains controversial. In January 2014, ACOG issued guidance regarding conventional systemic and vaginal HT, recently approved treatments, and compounded HT.
For the management of vasomotor symptoms, ACOG indicated that systemic HT (including oral and transdermal routes), alone or combined with a progestin, is the most effective treatment for bothersome menopausal vasomotor symptoms. The ACOG Practice Bulletin also pointed out that systemic EPT increases the risk for VTE and breast cancer and that, compared with oral estrogen, transdermal estrogen may carry a lower risk for VTE.
Some insurers deny coverage of HT for women older than 65 years
A classification of medications from the American Geriatrics Society known as “the Beers List” [the Beers Criteria for Potentially Inappropriate Medication Use in Older Adults] includes oral and transdermal estrogen, with or without a progestin.3 Along with many of the clinicians reading this Update, I routinely receive notices from insurance companies that, based on the Beers List, they will no longer provide reimbursement for systemic HT in patients who are older than 65 years. In this regard, I believe that one of the most important components of ACOG’s Practice Bulletin is the following text:
Three new options for menopausal HT
The ACOG Practice Bulletin describes 3 formulations for the treatment of menopausal symptoms that have recently become available:
- In women with a uterus and with bothersome vasomotor symptoms, an alternative to EPT is oral tablets combining conjugated equine estrogen (0.45 mg) with 20 mg of the selective estrogen receptor modulator (SERM) bazedoxifene.
- The oral SERM ospemifene (60 mg) is effective for relief of dyspareunia associated with vulvovaginal atrophy (also known as genitourinary syndrome of menopause).
- Paroxetine mesylate (7.5 mg) is the only FDA-approved nonhormonal formulation for management of vasomotor symptoms and is dosed lower than regimens used to treat psychiatric conditions.
Steer patients clear of compounded formulations
Every week I encounter patients who have recently visited physicians who prescribe and sell compounded bioidentical hormones. In addressing this issue, ACOG provides a useful service to women and their clinicians:
What this EVIDENCE means for practice
ACOG’s Practice Bulletin provides useful guidance for clinicians regarding treatment of menopausal symptoms. Besides clarifying that systemic HT should not be arbitrarily discontinued at age 65 and that FDA-approved HT is preferable to compounded HT, this publication details newer (including nonhormonal) formulations for treating menopausal symptoms as well as traditional HT formulations, including useful dosing information.
Is menopausal HT safe in statin users?
Berglind IA, Andersen M, Citarella A, Linder M, Sundström A, Kieler H. Hormone therapy and risk of cardiovascular outcomes and mortality in women treated with statins. Menopause. 2015;22(4):369–376.
Hodis HN, Mack WJ. Hormone therapy and risk of all-cause mortality in women treated with statins [comment]. Menopause. 2015;22(4):363–364.
Since the initial publications of findings from the WHI, clinicians have been cautioned not to prescribe menopausal HT in women at elevated risk for CVD. In this study from Sweden, investigators enrolled women 40 to 74 years old who initiated statin use between 2006 and 2007 due to known CVD (secondary prevention) or in the absence of known CVD (primary prevention). Women were followed for a mean of 4 years after beginning statins until the end of 2011.
Of 40,958 statin users, 7% used HT (mean age of HT users and nonusers was 61 and 62 years, respectively). Overall, 70% of statin use was for primary prevention. Deaths from CVD occurred in 5 and 18 patients per 10,000 person-years among HT users and nonusers, respectively (HR, 0.38). All-cause mortality occurred in 33 and 87 patients per 10,000 person-years among HT users and nonusers, respectively (HR, 0.53). These reduced risks of mortality noted in women who used concomitant statins achieved statistical significance. Whether statins were used for primary or secondary prevention, the incidence of cardiovascular events was similar in HT users and nonusers.
Why these findings diverge from those of the WHI
The findings of this large prospective cohort study are consistent with findings from other large observational studies—though they diverge from WHI findings. As Berglind and colleagues note, few WHI participants used statins at baseline. Also in contrast with the WHI, in which all HT was based on conjugated estrogen, all HT users in this Swedish study used oral or transdermal estradiol, as conjugated estrogen is not available in Sweden (and appears to be associated with an elevated risk of CVD, compared with other estrogens4).
What this EVIDENCE means for practice
This important study provides strong evidence that, for menopausal women with bothersome vasomotor symptoms or an elevated risk for osteoporosis, concomitant use of statins should not be considered a contraindication to HT.
Share your thoughts on this article! Send your Letter to the Editor to [email protected]. Please include your name and the city and state in which you practice.
1. Chen WY, Rosner B, Hankinson SE, Colditz GA, Willett WC. Moderate alcohol consumption during adult life, drinking patterns, and breast cancer risk. JAMA. 2011;306(17):1884–1190.
2. Kingsberg SA, Woodard T. Female sexual dysfunction: focus on low desire. Obstet Gynecol. 2015;125(2):477–486.
3. Geriatrics Care Online: Beers Pocket Card. http://www.americangeriatrics.org/files/documents/beers/PrintableBeersPocketCard.pdf. Accessed May 16, 2015.
4. Smith NL, Blondon M, Wiggins KL, et al. Lower risk of cardiovascular events in postmenopausal women taking oral estradiol compared with oral conjugated equine estrogens. JAMA Intern Med. 2014;174(1):25–31.
In This Article
- Testosterone for low desire?
- ACOG on the management of menopausal symptoms
- Is concomitant use of hormone therapy and statins a good idea?

Endometriosis and infertility: Expert answers to 6 questions to help pinpoint the best route to pregnancy
Although endometriosis and infertility are clearly linked—in life as well as the medical literature—no causal relationship has been established. Nevertheless, data suggest that 25% to 50% of infertile women have endometriosis, and that as many as 30% to 50% of women who have endometriosis are infertile.1
Among the mechanisms that have been proposed to explain this link are:
- distorted pelvic anatomy
- endocrine and ovulatory abnormalities
- impaired implantation
- impaired quality of the oocyte and embryo
- altered peritoneal function
- altered hormonal and cell-mediated function
- abnormal uterotubal transport.2

Recent studies by Kao and colleagues and Giudice and colleagues have led to new findings in regard to endometriosis and infertility, says Ceana Nezhat, MD.3,4 Dr. Nezhat is Director of the Nezhat Medical Center in Atlanta, Georgia, and Medical Director of Training and Education at Northside Hospital in Atlanta. “These researchers have discovered that endometriosis causes changes to the endometrium that contribute to infertility.”
“There are no studies that have specifically assessed whether one anatomic site is associated with increased infertility over another,” says Tommaso Falcone, MD. “However, it is assumed that disease that involves the tubes and ovaries would impede fertility the most. Adhesive disease and endometriomas around the tubes and ovaries are associated with a worsening prognosis. Although peritoneal disease probably influences fertility solely on the basis of inflammation, disease around the tubes and ovaries is thought to have a mechanical effect as well.” Dr. Falcone is Professor and Chair of Obstetrics and Gynecology at the Cleveland Clinic in Cleveland, Ohio.
“Endometriosis is a chronic and heterogeneous disease process,” says Stephanie J. Estes, MD, Director of Robotic Surgical Services and Associate Professor, Division of Reproductive Endocrinology and Infertility, Department of Obstetrics and Gynecology, at Penn State Hershey Medical Center in Hershey, Pennsylvania.
“It is likely that no single site is the causative factor,” Dr. Estes says. “Endometriosis alters prostaglandins, cytokines, and proteases that may adversely affect eggs, sperm, or embryo development. In addition, altered endometrial receptivity may play a role. It has been shown that, when donor oocytes from women with endometriosis are transferred to women without endometriosis, there are lower implantation rates and poorer embryo quality.”5
Does it follow, then, that eradication of endometriosis improves fertility?
The answer is not clear. Rather, it depends on a number of variables, including the stage of the disease, its location, the presence of symptoms, and more.
“The approach for endometiosis-associated infertility is completely different from the approach for pain,” says Dr. Nezhat. “In a patient with pain, complete eradication of endometriosis is necessary. However, when addressing infertility, a surgeon must be cautious in the vicinity of the reproductive organs, even if a multistage approach is required. Fertility preservation is the goal.6,7 However, thorough treatment of endometriosis improves fertility rates even in cases of failed in vitro fertilization” (IVF).8
In this article, the focus is on 6 critical questions concerning endometriosis and infertility, including the role of medical therapy, when surgery is indicated, and whether an endometrioma warrants removal or referral for IVF.
In Part 1 of this 3-part series, which appeared in the April 2015 issue of OBG Management, the subject was diagnosis of endometriosis. In Part 2, which appeared in May 2015, the focus was endometriosis and pain.
1. Is there a role for medical therapy?
In women who have endometriosis-related infertility, medical therapy does not appear to produce any benefit. In its committee opinion on the subject, the American Society for Reproductive Medicine (ASRM) states as much: “There is no evidence that medical treatment of endometriosis improves fertility.”2
In fact, observes Dr. Estes, trials of medical treatment, involving such medications as combined estrogen-progestin therapy, danazol, progestins, or gonadotropin-releasing hormone (GnRH) agonists, may cause an unnecessary “delay in the use of more effective treatments that could result in pregnancy.”
Dr. Nezhat believes that medical therapy is effective in patients who have adenomyosis in addition to endometriosis. “Three months of treatment with a GnRH agonist will improve fertility rates in these patients,” he says.
“Medical treatments inhibit ovulation,” notes Dr. Estes. “These therapies have no role in pretreatment of patients with endometriosis prior to infertility treatment. On the other hand, medical therapy with GnRH agonists for 3 to 6 months prior to an IVF cycle does result in increased pregnancy rates.”9
2. What is the role of clomiphene and intrauterine insemination?
Should women who have endometriosis, open fallopian tubes, and infertility be treated with clomiphene and intrauterine insemination (IUI) prior to a cycle of IVF?
“This is a complex question,” says Dr. Estes, “as clinical parameters such as age, symptoms, duration of infertility, and the ability to proceed with IVF are important, as well as stage of disease.”
“Overall, in patients younger than 35 years, clomiphene-IUI is an option and has an increased pregnancy rate over timed intercourse” (9% vs 3%), she says.10 “However, clearly IVF is much more successful and is the most effective treatment, with pregnancy rates of approximately 46% for women younger than 35 years (3% of whom have a ‘diagnosis’ of endometriosis, and 13% of whom have an ‘unknown’ infertility factor).11 Women who are older than 35 or who have additional infertility factors, such as male factor, should consider IVF first.”
3. When is surgery indicated?
“Patients who have significant pain associated with their infertility will benefit from surgery, which offers both pain relief and an improvement in the spontaneous pregnancy rate,” says Dr. Falcone. “Patients who are infertile and desire spontaneous pregnancy without pharmacologic intervention or assisted reproductive technology (ART) also benefit from surgery.”
The benefit of surgery in asymptomatic women with minimal to mild endometriosis is unclear. In a randomized controlled trial of 341 women (aged 20–39 years) with infertility and minimal to mild endometriosis, laparoscopic resection or ablation of visible lesions resulted in pregnancy in 30.7% of women, compared with 17.7% of women who underwent diagnostic laparoscopy only.12
Another randomized study of 96 women with minimal to mild endometriosis who underwent resection/ablation or diagnostic laparoscopy found no difference in the birth rate at 1 year.13
When the results of these 2 studies are combined, the number needed to treat is 12 laparoscopies in women with endometriosis, says Dr. Falcone. “So 1 additional pregnancy would be gained from performing endometriosis surgery in 12 patients. If we assume a prevalence of 30% in asymptomatic women with infertility, then you need to perform 40 diagnostic laparoscopies to achieve an extra pregnancy.”
For women with infertility and severe endometriosis, a nonrandomized study found cumulative pregnancy rates of 45% and 63% after laparoscopy and laparotomy, respectively, in 216 women followed for up to 2 years.14 The difference in rates was not statistically significant.
“Although surgery is indicated to diagnose endometriosis, multiple repeat procedures are not an effective treatment for infertility,” says Dr. Estes. “Plus, especially for stage I and II endometriosis [according to the ASRM classification system], approximately 12 patients will need surgery for 1 additional pregnancy—and many more will have needed the procedure to even get to those who have endometriosis. While patients often want us to ‘do something’—often a covered service such as surgery—we need to consider that surgery for early disease does not provide a significant or long-lasting enhancement to women’s ability to conceive.”
In the absence of male-factor infertility, surgical diagnosis with conservative and precise treatment of endometriosis at the same time is better than going directly to IVF, says Dr. Nezhat. Younger patients who undergo surgical treatment have a better chance of achieving more than 1 spontaneous pregnancy than they do with IVF. And older patients also will have an improved conception rate with ART when they are treated surgically, he says.8
Coding and reimbursement
For endometriosis, the correct diagnostic code helps establish the medical necessity of later treatments
Several diagnostic codes are available to describe the location of endometriotic implants, but the fact remains that these codes can be reported only after a definitive diagnosis is made, which generally comes after confirmatory surgery has been performed. When the patient is in the diagnostic phase, she may present with complaints of pelvic pain, dyspareunia, dysmenorrhea, or infertility. Knowing which codes to use at the time of evaluation goes a long way toward establishing medical necessity for any later surgery or medical treatment.
In the TABLE, you will find common diagnostic codes that can be reported during evaluation of endometriosis, including both International Classification of Diseases, Ninth Revision, Clinical Modification (ICD-9-CM) and ICD-10-CM equivalents. Note that, with ICD-10-CM, payers are looking for a more specific type of dysmenorrhea in the documentation. In the case of painful menstruation suspected to arise from endometriosis, the code for secondary dysmenorrhea should be reported.
Diagnostic coding in cases in which the patient first presents with a complaint of infertility in the absence of other symptoms can be problematic, as many insurers still do not cover the treatment of infertility. However, in the diagnostic stage, codes for fertility testing can be reported instead of codes that confirm infertility when no other symptoms are present. Once the clinician has verified that endometriosis is the source of the infertility and begins treatment, the primary code for the type of endometriosis would be reported, not a diagnosis of infertility.
The procedure performed to diagnose endometriosis would be diagnostic laparoscopy (Current Procedure Terminology [CPT] code 49320, Laparoscopy, abdomen, peritoneum, and omentum, diagnostic, with or without collection of specimen[s] by brushing or washing [separate procedure]) if medical treatment is being pursued. If the plan is to confirm and then immediately remove the implants, the CPT codes would be either 58662, Laparoscopy, surgical; with fulguration or excision of lesions of the ovary, pelvic viscera, or peritoneal surface by any method, or 49203–49205, Excision or destruction, open, intra-abdominal tumors, cysts or endometriomas, 1 or more peritoneal, mesenteric, or retroperitoneal primary or secondary tumors, based on the largest tumor diameter, if they are removed via an abdominal incision.
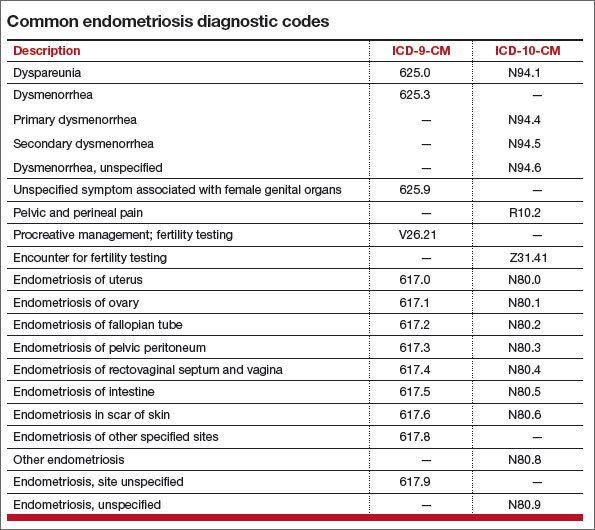
—Melanie Witt, RN, CPC, COBGC, MA
Ms. Witt is an independent coding and documentation consultant and former program manager, department of coding and nomenclature, American Congress of Obstetricians and Gynecologists.
4. Surgery or IVF for endometriomas?
When an endometrioma is present, should it be surgically treated or should the patient go straight to IVF? And does the optimal approach depend on the size of the endometrioma?
“The answer to this question ultimately depends on the skill and experience of the surgeon and the type of endometrioma,” says Dr. Nezhat, “because improper removal of an endometrioma may compromise the function of the ovary.”
“I recommend removal of the endometrioma by a skilled surgeon experienced in the management of ovarian cysts and preservation of ovarian function, especially in patients who have failed IVF,” he says.6,15
According to the ASRM committee opinion on endometriosis and infertility, laparoscopic cystectomy for endometriomas larger than 4 cm improves fertility, compared with cyst drainage and coagulation, which is associated with a high risk of cyst recurrence.2 However, no randomized trials have compared laparoscopic excision of an endometrioma to expectant management prior to IVF/intracytoplasmic sperm injection (ICSI). One case-control study found that laparoscopic cystectomy prior to IVF had no effect on fertility outcomes.16 At the same time, however, “conservative surgical treatment in symptomatic patients did not impair the success rates of IVF or ICSI,” notes the ASRM.2 Therefore, “evidence suggests that surgery does not benefit asymptomatic women with an endometrioma prior to scheduled IVF/ICSI,” the ASRM concludes.2
Dr. Nezhat cautions against the practice of indiscriminate IVF in the setting of ovarian endometriomas because he has seen patients who developed tubo-ovarian abscess and infected endometriomas after transvaginal egg retrieval. He notes that there are additional case reports of similar findings from other surgeons.
As far as excision versus ablation is concerned, all studies have shown some effect on ovarian function after excision, says Dr. Falcone. “The studies assessed this parameter using several endpoints, such as the number of oocytes retrieved at IVF. Recently, anti-Müllerian hormone has been used and has confirmed this observation. The decreased ovarian reserve is especially problematic with bilateral ovarian disease. The extent of the decreased ovarian function is dependent on several parameters, especially how much energy is used to achieve hemostasis. Several techniques have been proposed to reduce damage, including less traumatic ways of achieving hemostasis in the ovarian hilus.”
“The dilemma is that, if we excise the disease, the pregnancy rates are better than with ablation, but if we excise, there is more damage to the ovary. In my practice, I excise if there is minimal associated disease, such as adhesions, because the pregnancy rate after surgery is good. If, however, there are extensive adhesions with a low chance of spontaneous pregnancy, I minimize excision,” Dr. Falcone says.
As for going straight to IVF, “many patients cannot afford IVF; therefore, surgery is their only option. Furthermore, many patients have severe associated pain; therefore, surgery is required to improve quality of life. However, if the decision is made to proceed to IVF, there is no evidence that cystectomy prior to treatment with ART improves the pregnancy rate,” Dr. Falcone says.
“Basically, if a woman has no pain and no endometrioma, and infertility alone is the issue, I treat her in the same manner as I would a patient with idiopathic infertility—no surgery,” Dr. Falcone says. “If a patient has severe pain and infertility, I treat her surgically but conservatively, especially when an endometrioma is present. The patient will get pain relief but also derive fertility benefit. If a patient has had previous surgery for endometriosis-associated infertility, additional surgery is not the next step—as our study has shown that pregnancy rates are better with IVF than repeat surgery.”17
5. Is surgery ever effective after failed IVF?
To answer this question, Dr. Nezhat points to a retrospective case series by Littman and colleagues in which 29 women with a history of failed IVF underwent laparoscopic evaluation and treatment of endometriosis (by the same surgeon).8 Of 29 patients, 22 conceived after laparoscopic treatment of endometriosis, including 15 “non-IVF” pregnancies and 7 IVF pregnancies, the study results show.8
“It is not unusual for patients and health care providers to perceive IVF as the final treatment for infertility,” Littman and colleagues write. “When this definitive therapy fails repeatedly, clinicians and patients may be inclined to pursue oocyte donation or elect to forego further treatment altogether. This is especially true in women of advanced age and in patients with borderline embryo quality. Presently, as a result of our clinical observation in patients with failed IVF, before egg donation or adoption, we offer the option to have meticulous laparoscopic evaluation and treatment by a skilled surgeon. Furthermore, we would not classify an infertility condition as unexplained without confirming the absence of endometriosis by a thorough laparoscopy. In our experience, patients under 35 years old with unexplained infertility who are found to have endometriosis at the time of laparoscopy have an excellent chance of pregnancy following surgical treatment without ART.”8
6. Is repeat surgery ever helpful?
In the treatment of endometriosis-associated infertility, repeat surgery should be avoided if no symptoms are present, says Dr. Estes. “In women with continued symptoms, the benefits of repeat surgery are small, with known risks, including the potential for adhesive disease and the iatrogenic detrimental effect on ovarian function—often in a setting of already-present decreased ovarian reserve.”
Dr. Nezhat agrees that multiple surgeries carry the potential for harm. “However, there is one caveat,” he says. “What was done at the previous surgery and how? The skill and experience of the surgeon and proper technique are of paramount importance to the surgical outcome.”
Share your thoughts on this article! Send your Letter to the Editor to [email protected]. Please include your name and the city and state in which you practice.
1. Missmer SA, Hankinson SE, Spiegelman D, Barbieri RL, Marshall LM, Hunter DJ. Incidence of laparoscopically confirmed endometriosis by demographic, anthropometric, and lifestyle factors. Am J Epidemiol. 2004;160(8):784–796.
2. Practice Committee of the American Society for Reproductive Medicine. Endometriosis and infertility: a committee opinion. Fertil Steril. 2012;98(3):591–598.
3. Kao LC, Germeyer A, Tulac S, et al. Expression profiling of endometrium from women with endometriosis reveals candidate genes for disease-based implantation failure and infertility. Endocrinology. 2003;144(7):2870–2881.
4. Giudice LC, Telles TL, Lobo S, Kao L. The molecular basis for implantation failure in endometriosis: on the road to discovery. Ann N Y Acad Sci. 2002;955:252–264; discussion 293–295, 396–406.
5. Garrido N, Navarro J, Garcia-Velasco J, et al. The endometrium versus embryonic quality in endometriosis-related infertility. Hum Reprod Update. 2012;8(1):95-103.
6. Lewis M, Baker V, Nezhat C. The impact on ovarian reserve after laparoscopic ovarian cystectomy versus three-stage management in patients with endometriomas: a prospective randomized study. Fertil Steril. 2010;94(6):e81–83.
7. Tsolakidis D, Pados G, Vavilis D, et al. The impact on ovarian reserve after laparoscopic ovarian cystectomy versus three-stage management in patients with endometriomas: a prospective randomized study. Fertil Steril. 2010;94(1):71–77.
8. Littman E, Giudice L, Lathi R, Berker B, Milki A, Nezhat C. Role of laparoscopic treatment of endometriosis in patients with failed in vitro fertilization cycles. Fertil Steril. 2005;84(6):1574–1578.
9. Sallam HN, Garcia-Velasco JA, Dias S, Arici A. Long-term pituitary down-regulation before in vitro fertilization (IVF) for women with endometriosis. Cochrane Database Syst Rev. 2006;(1):CD004635.
10. Deaton JL, Gibson M, Blackmer KM, et al. A randomized, controlled trial of clomiphene citrate and intrauterine insemination in couples with unexplained infertility or surgically corrected endometriosis. Fertil Steril. 1990; 54:1083–1088.
11. Society for Assisted Reproductive Technology. Clinic Summary Report [all member clinics]: 2013. https://www.sartcorsonline.com/rptCSR_PublicMultYear.aspx?ClinicPKID=0. Accessed May 13, 2015.
12. Marcoux S, Maheux R, Bérubé S. Laparoscopic surgery in infertile women with minimal or mild endometriosis. Canadian Collaborative Group on Endometriosis. N Engl J Med. 1997;337(4):217–222.
13. Parazzini F. Ablation of lesions or no treatment in minimal-mild endometriosis in infertile women: a randomized trial. Gruppo Italiano per lo Studio dell’Endometriosi. Hum Reprod. 1999;14(5):1332–1334.
14. Crosignani PG, Vercellini P, Biffignandi F, Costantini W, Cortesi I, Imparato E. Laparoscopy versus laparotomy in conservative surgical treatment for severe endometriosis. Fertil Steril. 1996;66(5):706–711.
15. Nezhat F, Nezhat C, Allan CJ, Metzger DA, Sears DL. Clinical and histologic classification of endometriomas. Implications for a mechanism of pathogenesis. J Reprod Med. 1992;37(9):771–776.
16. Garcia-Velasco JA, Mahutte NG, Corona J, et al. Removal of endometriomas before in vitro fertilization does not improve fertility outcomes: a matched, case-control study. Fertil Steril. 2004;81(5):1194–1197.
17. Pagidas K, Falcone T, Hemmings R, Miron R. Comparison of surgical treatment of moderate (stage III) and severe (stage IV) endometriosis-related infertility with IVF–embryo transfer. Fertil Steril. 1996;65(4):791–795.
Janelle Yates, Senior Editor
Experts featured in this article

|
Stephanie J. Estes, MD, is Director of Robotic Surgical Services and Associate Professor, Division of Reproductive Endocrinology and Infertility, Department of Obstetrics and Gynecology, at Penn State Hershey Medical Center in Hershey, Pennsylvania. |
| Tommaso Falcone, MD, is Professor and Chair of Obstetrics and Gynecology at the Cleveland Clinic in Cleveland, Ohio. |

| Ceana Nezhat, MD, is Director of the Nezhat Medical Center in Atlanta, Georgia, and Medical Director of Training and Education at Northside Hospital in Atlanta. |

Dr. Nezhat reports that he is a consultant to Karl Storz Endoscopy, a scientific advisor to Plasma Surgical, and serves on the medical advisory board for SurgiQuest. Dr. Estes and Dr. Falcone report no financial relationships relevant to this article.
Janelle Yates, Senior Editor
Experts featured in this article
|
|
Stephanie J. Estes, MD, is Director of Robotic Surgical Services and Associate Professor, Division of Reproductive Endocrinology and Infertility, Department of Obstetrics and Gynecology, at Penn State Hershey Medical Center in Hershey, Pennsylvania. |
| Tommaso Falcone, MD, is Professor and Chair of Obstetrics and Gynecology at the Cleveland Clinic in Cleveland, Ohio. |
|
| Ceana Nezhat, MD, is Director of the Nezhat Medical Center in Atlanta, Georgia, and Medical Director of Training and Education at Northside Hospital in Atlanta. |
Dr. Nezhat reports that he is a consultant to Karl Storz Endoscopy, a scientific advisor to Plasma Surgical, and serves on the medical advisory board for SurgiQuest. Dr. Estes and Dr. Falcone report no financial relationships relevant to this article.
Although endometriosis and infertility are clearly linked—in life as well as the medical literature—no causal relationship has been established. Nevertheless, data suggest that 25% to 50% of infertile women have endometriosis, and that as many as 30% to 50% of women who have endometriosis are infertile.1
Among the mechanisms that have been proposed to explain this link are:
- distorted pelvic anatomy
- endocrine and ovulatory abnormalities
- impaired implantation
- impaired quality of the oocyte and embryo
- altered peritoneal function
- altered hormonal and cell-mediated function
- abnormal uterotubal transport.2
Recent studies by Kao and colleagues and Giudice and colleagues have led to new findings in regard to endometriosis and infertility, says Ceana Nezhat, MD.3,4 Dr. Nezhat is Director of the Nezhat Medical Center in Atlanta, Georgia, and Medical Director of Training and Education at Northside Hospital in Atlanta. “These researchers have discovered that endometriosis causes changes to the endometrium that contribute to infertility.”
“There are no studies that have specifically assessed whether one anatomic site is associated with increased infertility over another,” says Tommaso Falcone, MD. “However, it is assumed that disease that involves the tubes and ovaries would impede fertility the most. Adhesive disease and endometriomas around the tubes and ovaries are associated with a worsening prognosis. Although peritoneal disease probably influences fertility solely on the basis of inflammation, disease around the tubes and ovaries is thought to have a mechanical effect as well.” Dr. Falcone is Professor and Chair of Obstetrics and Gynecology at the Cleveland Clinic in Cleveland, Ohio.
“Endometriosis is a chronic and heterogeneous disease process,” says Stephanie J. Estes, MD, Director of Robotic Surgical Services and Associate Professor, Division of Reproductive Endocrinology and Infertility, Department of Obstetrics and Gynecology, at Penn State Hershey Medical Center in Hershey, Pennsylvania.
“It is likely that no single site is the causative factor,” Dr. Estes says. “Endometriosis alters prostaglandins, cytokines, and proteases that may adversely affect eggs, sperm, or embryo development. In addition, altered endometrial receptivity may play a role. It has been shown that, when donor oocytes from women with endometriosis are transferred to women without endometriosis, there are lower implantation rates and poorer embryo quality.”5
Does it follow, then, that eradication of endometriosis improves fertility?
The answer is not clear. Rather, it depends on a number of variables, including the stage of the disease, its location, the presence of symptoms, and more.
“The approach for endometiosis-associated infertility is completely different from the approach for pain,” says Dr. Nezhat. “In a patient with pain, complete eradication of endometriosis is necessary. However, when addressing infertility, a surgeon must be cautious in the vicinity of the reproductive organs, even if a multistage approach is required. Fertility preservation is the goal.6,7 However, thorough treatment of endometriosis improves fertility rates even in cases of failed in vitro fertilization” (IVF).8
In this article, the focus is on 6 critical questions concerning endometriosis and infertility, including the role of medical therapy, when surgery is indicated, and whether an endometrioma warrants removal or referral for IVF.
In Part 1 of this 3-part series, which appeared in the April 2015 issue of OBG Management, the subject was diagnosis of endometriosis. In Part 2, which appeared in May 2015, the focus was endometriosis and pain.
1. Is there a role for medical therapy?
In women who have endometriosis-related infertility, medical therapy does not appear to produce any benefit. In its committee opinion on the subject, the American Society for Reproductive Medicine (ASRM) states as much: “There is no evidence that medical treatment of endometriosis improves fertility.”2
In fact, observes Dr. Estes, trials of medical treatment, involving such medications as combined estrogen-progestin therapy, danazol, progestins, or gonadotropin-releasing hormone (GnRH) agonists, may cause an unnecessary “delay in the use of more effective treatments that could result in pregnancy.”
Dr. Nezhat believes that medical therapy is effective in patients who have adenomyosis in addition to endometriosis. “Three months of treatment with a GnRH agonist will improve fertility rates in these patients,” he says.
“Medical treatments inhibit ovulation,” notes Dr. Estes. “These therapies have no role in pretreatment of patients with endometriosis prior to infertility treatment. On the other hand, medical therapy with GnRH agonists for 3 to 6 months prior to an IVF cycle does result in increased pregnancy rates.”9
2. What is the role of clomiphene and intrauterine insemination?
Should women who have endometriosis, open fallopian tubes, and infertility be treated with clomiphene and intrauterine insemination (IUI) prior to a cycle of IVF?
“This is a complex question,” says Dr. Estes, “as clinical parameters such as age, symptoms, duration of infertility, and the ability to proceed with IVF are important, as well as stage of disease.”
“Overall, in patients younger than 35 years, clomiphene-IUI is an option and has an increased pregnancy rate over timed intercourse” (9% vs 3%), she says.10 “However, clearly IVF is much more successful and is the most effective treatment, with pregnancy rates of approximately 46% for women younger than 35 years (3% of whom have a ‘diagnosis’ of endometriosis, and 13% of whom have an ‘unknown’ infertility factor).11 Women who are older than 35 or who have additional infertility factors, such as male factor, should consider IVF first.”
3. When is surgery indicated?
“Patients who have significant pain associated with their infertility will benefit from surgery, which offers both pain relief and an improvement in the spontaneous pregnancy rate,” says Dr. Falcone. “Patients who are infertile and desire spontaneous pregnancy without pharmacologic intervention or assisted reproductive technology (ART) also benefit from surgery.”
The benefit of surgery in asymptomatic women with minimal to mild endometriosis is unclear. In a randomized controlled trial of 341 women (aged 20–39 years) with infertility and minimal to mild endometriosis, laparoscopic resection or ablation of visible lesions resulted in pregnancy in 30.7% of women, compared with 17.7% of women who underwent diagnostic laparoscopy only.12
Another randomized study of 96 women with minimal to mild endometriosis who underwent resection/ablation or diagnostic laparoscopy found no difference in the birth rate at 1 year.13
When the results of these 2 studies are combined, the number needed to treat is 12 laparoscopies in women with endometriosis, says Dr. Falcone. “So 1 additional pregnancy would be gained from performing endometriosis surgery in 12 patients. If we assume a prevalence of 30% in asymptomatic women with infertility, then you need to perform 40 diagnostic laparoscopies to achieve an extra pregnancy.”
For women with infertility and severe endometriosis, a nonrandomized study found cumulative pregnancy rates of 45% and 63% after laparoscopy and laparotomy, respectively, in 216 women followed for up to 2 years.14 The difference in rates was not statistically significant.
“Although surgery is indicated to diagnose endometriosis, multiple repeat procedures are not an effective treatment for infertility,” says Dr. Estes. “Plus, especially for stage I and II endometriosis [according to the ASRM classification system], approximately 12 patients will need surgery for 1 additional pregnancy—and many more will have needed the procedure to even get to those who have endometriosis. While patients often want us to ‘do something’—often a covered service such as surgery—we need to consider that surgery for early disease does not provide a significant or long-lasting enhancement to women’s ability to conceive.”
In the absence of male-factor infertility, surgical diagnosis with conservative and precise treatment of endometriosis at the same time is better than going directly to IVF, says Dr. Nezhat. Younger patients who undergo surgical treatment have a better chance of achieving more than 1 spontaneous pregnancy than they do with IVF. And older patients also will have an improved conception rate with ART when they are treated surgically, he says.8
Coding and reimbursement
For endometriosis, the correct diagnostic code helps establish the medical necessity of later treatments
Several diagnostic codes are available to describe the location of endometriotic implants, but the fact remains that these codes can be reported only after a definitive diagnosis is made, which generally comes after confirmatory surgery has been performed. When the patient is in the diagnostic phase, she may present with complaints of pelvic pain, dyspareunia, dysmenorrhea, or infertility. Knowing which codes to use at the time of evaluation goes a long way toward establishing medical necessity for any later surgery or medical treatment.
In the TABLE, you will find common diagnostic codes that can be reported during evaluation of endometriosis, including both International Classification of Diseases, Ninth Revision, Clinical Modification (ICD-9-CM) and ICD-10-CM equivalents. Note that, with ICD-10-CM, payers are looking for a more specific type of dysmenorrhea in the documentation. In the case of painful menstruation suspected to arise from endometriosis, the code for secondary dysmenorrhea should be reported.
Diagnostic coding in cases in which the patient first presents with a complaint of infertility in the absence of other symptoms can be problematic, as many insurers still do not cover the treatment of infertility. However, in the diagnostic stage, codes for fertility testing can be reported instead of codes that confirm infertility when no other symptoms are present. Once the clinician has verified that endometriosis is the source of the infertility and begins treatment, the primary code for the type of endometriosis would be reported, not a diagnosis of infertility.
The procedure performed to diagnose endometriosis would be diagnostic laparoscopy (Current Procedure Terminology [CPT] code 49320, Laparoscopy, abdomen, peritoneum, and omentum, diagnostic, with or without collection of specimen[s] by brushing or washing [separate procedure]) if medical treatment is being pursued. If the plan is to confirm and then immediately remove the implants, the CPT codes would be either 58662, Laparoscopy, surgical; with fulguration or excision of lesions of the ovary, pelvic viscera, or peritoneal surface by any method, or 49203–49205, Excision or destruction, open, intra-abdominal tumors, cysts or endometriomas, 1 or more peritoneal, mesenteric, or retroperitoneal primary or secondary tumors, based on the largest tumor diameter, if they are removed via an abdominal incision.
—Melanie Witt, RN, CPC, COBGC, MA
Ms. Witt is an independent coding and documentation consultant and former program manager, department of coding and nomenclature, American Congress of Obstetricians and Gynecologists.
4. Surgery or IVF for endometriomas?
When an endometrioma is present, should it be surgically treated or should the patient go straight to IVF? And does the optimal approach depend on the size of the endometrioma?
“The answer to this question ultimately depends on the skill and experience of the surgeon and the type of endometrioma,” says Dr. Nezhat, “because improper removal of an endometrioma may compromise the function of the ovary.”
“I recommend removal of the endometrioma by a skilled surgeon experienced in the management of ovarian cysts and preservation of ovarian function, especially in patients who have failed IVF,” he says.6,15
According to the ASRM committee opinion on endometriosis and infertility, laparoscopic cystectomy for endometriomas larger than 4 cm improves fertility, compared with cyst drainage and coagulation, which is associated with a high risk of cyst recurrence.2 However, no randomized trials have compared laparoscopic excision of an endometrioma to expectant management prior to IVF/intracytoplasmic sperm injection (ICSI). One case-control study found that laparoscopic cystectomy prior to IVF had no effect on fertility outcomes.16 At the same time, however, “conservative surgical treatment in symptomatic patients did not impair the success rates of IVF or ICSI,” notes the ASRM.2 Therefore, “evidence suggests that surgery does not benefit asymptomatic women with an endometrioma prior to scheduled IVF/ICSI,” the ASRM concludes.2
Dr. Nezhat cautions against the practice of indiscriminate IVF in the setting of ovarian endometriomas because he has seen patients who developed tubo-ovarian abscess and infected endometriomas after transvaginal egg retrieval. He notes that there are additional case reports of similar findings from other surgeons.
As far as excision versus ablation is concerned, all studies have shown some effect on ovarian function after excision, says Dr. Falcone. “The studies assessed this parameter using several endpoints, such as the number of oocytes retrieved at IVF. Recently, anti-Müllerian hormone has been used and has confirmed this observation. The decreased ovarian reserve is especially problematic with bilateral ovarian disease. The extent of the decreased ovarian function is dependent on several parameters, especially how much energy is used to achieve hemostasis. Several techniques have been proposed to reduce damage, including less traumatic ways of achieving hemostasis in the ovarian hilus.”
“The dilemma is that, if we excise the disease, the pregnancy rates are better than with ablation, but if we excise, there is more damage to the ovary. In my practice, I excise if there is minimal associated disease, such as adhesions, because the pregnancy rate after surgery is good. If, however, there are extensive adhesions with a low chance of spontaneous pregnancy, I minimize excision,” Dr. Falcone says.
As for going straight to IVF, “many patients cannot afford IVF; therefore, surgery is their only option. Furthermore, many patients have severe associated pain; therefore, surgery is required to improve quality of life. However, if the decision is made to proceed to IVF, there is no evidence that cystectomy prior to treatment with ART improves the pregnancy rate,” Dr. Falcone says.
“Basically, if a woman has no pain and no endometrioma, and infertility alone is the issue, I treat her in the same manner as I would a patient with idiopathic infertility—no surgery,” Dr. Falcone says. “If a patient has severe pain and infertility, I treat her surgically but conservatively, especially when an endometrioma is present. The patient will get pain relief but also derive fertility benefit. If a patient has had previous surgery for endometriosis-associated infertility, additional surgery is not the next step—as our study has shown that pregnancy rates are better with IVF than repeat surgery.”17
5. Is surgery ever effective after failed IVF?
To answer this question, Dr. Nezhat points to a retrospective case series by Littman and colleagues in which 29 women with a history of failed IVF underwent laparoscopic evaluation and treatment of endometriosis (by the same surgeon).8 Of 29 patients, 22 conceived after laparoscopic treatment of endometriosis, including 15 “non-IVF” pregnancies and 7 IVF pregnancies, the study results show.8
“It is not unusual for patients and health care providers to perceive IVF as the final treatment for infertility,” Littman and colleagues write. “When this definitive therapy fails repeatedly, clinicians and patients may be inclined to pursue oocyte donation or elect to forego further treatment altogether. This is especially true in women of advanced age and in patients with borderline embryo quality. Presently, as a result of our clinical observation in patients with failed IVF, before egg donation or adoption, we offer the option to have meticulous laparoscopic evaluation and treatment by a skilled surgeon. Furthermore, we would not classify an infertility condition as unexplained without confirming the absence of endometriosis by a thorough laparoscopy. In our experience, patients under 35 years old with unexplained infertility who are found to have endometriosis at the time of laparoscopy have an excellent chance of pregnancy following surgical treatment without ART.”8
6. Is repeat surgery ever helpful?
In the treatment of endometriosis-associated infertility, repeat surgery should be avoided if no symptoms are present, says Dr. Estes. “In women with continued symptoms, the benefits of repeat surgery are small, with known risks, including the potential for adhesive disease and the iatrogenic detrimental effect on ovarian function—often in a setting of already-present decreased ovarian reserve.”
Dr. Nezhat agrees that multiple surgeries carry the potential for harm. “However, there is one caveat,” he says. “What was done at the previous surgery and how? The skill and experience of the surgeon and proper technique are of paramount importance to the surgical outcome.”
Share your thoughts on this article! Send your Letter to the Editor to [email protected]. Please include your name and the city and state in which you practice.
1. Missmer SA, Hankinson SE, Spiegelman D, Barbieri RL, Marshall LM, Hunter DJ. Incidence of laparoscopically confirmed endometriosis by demographic, anthropometric, and lifestyle factors. Am J Epidemiol. 2004;160(8):784–796.
2. Practice Committee of the American Society for Reproductive Medicine. Endometriosis and infertility: a committee opinion. Fertil Steril. 2012;98(3):591–598.
3. Kao LC, Germeyer A, Tulac S, et al. Expression profiling of endometrium from women with endometriosis reveals candidate genes for disease-based implantation failure and infertility. Endocrinology. 2003;144(7):2870–2881.
4. Giudice LC, Telles TL, Lobo S, Kao L. The molecular basis for implantation failure in endometriosis: on the road to discovery. Ann N Y Acad Sci. 2002;955:252–264; discussion 293–295, 396–406.
5. Garrido N, Navarro J, Garcia-Velasco J, et al. The endometrium versus embryonic quality in endometriosis-related infertility. Hum Reprod Update. 2012;8(1):95-103.
6. Lewis M, Baker V, Nezhat C. The impact on ovarian reserve after laparoscopic ovarian cystectomy versus three-stage management in patients with endometriomas: a prospective randomized study. Fertil Steril. 2010;94(6):e81–83.
7. Tsolakidis D, Pados G, Vavilis D, et al. The impact on ovarian reserve after laparoscopic ovarian cystectomy versus three-stage management in patients with endometriomas: a prospective randomized study. Fertil Steril. 2010;94(1):71–77.
8. Littman E, Giudice L, Lathi R, Berker B, Milki A, Nezhat C. Role of laparoscopic treatment of endometriosis in patients with failed in vitro fertilization cycles. Fertil Steril. 2005;84(6):1574–1578.
9. Sallam HN, Garcia-Velasco JA, Dias S, Arici A. Long-term pituitary down-regulation before in vitro fertilization (IVF) for women with endometriosis. Cochrane Database Syst Rev. 2006;(1):CD004635.
10. Deaton JL, Gibson M, Blackmer KM, et al. A randomized, controlled trial of clomiphene citrate and intrauterine insemination in couples with unexplained infertility or surgically corrected endometriosis. Fertil Steril. 1990; 54:1083–1088.
11. Society for Assisted Reproductive Technology. Clinic Summary Report [all member clinics]: 2013. https://www.sartcorsonline.com/rptCSR_PublicMultYear.aspx?ClinicPKID=0. Accessed May 13, 2015.
12. Marcoux S, Maheux R, Bérubé S. Laparoscopic surgery in infertile women with minimal or mild endometriosis. Canadian Collaborative Group on Endometriosis. N Engl J Med. 1997;337(4):217–222.
13. Parazzini F. Ablation of lesions or no treatment in minimal-mild endometriosis in infertile women: a randomized trial. Gruppo Italiano per lo Studio dell’Endometriosi. Hum Reprod. 1999;14(5):1332–1334.
14. Crosignani PG, Vercellini P, Biffignandi F, Costantini W, Cortesi I, Imparato E. Laparoscopy versus laparotomy in conservative surgical treatment for severe endometriosis. Fertil Steril. 1996;66(5):706–711.
15. Nezhat F, Nezhat C, Allan CJ, Metzger DA, Sears DL. Clinical and histologic classification of endometriomas. Implications for a mechanism of pathogenesis. J Reprod Med. 1992;37(9):771–776.
16. Garcia-Velasco JA, Mahutte NG, Corona J, et al. Removal of endometriomas before in vitro fertilization does not improve fertility outcomes: a matched, case-control study. Fertil Steril. 2004;81(5):1194–1197.
17. Pagidas K, Falcone T, Hemmings R, Miron R. Comparison of surgical treatment of moderate (stage III) and severe (stage IV) endometriosis-related infertility with IVF–embryo transfer. Fertil Steril. 1996;65(4):791–795.
In This Article
- The role of medical therapy
- When is surgery indicated?
- Coding and reimbursement
- Is surgery ever effective after failed IVF?

Ebola in the United States: Management considerations during pregnancy
“[Pregnant patients infected with the Ebola virus in West Africa] aren’t given preferential treatment...They aren’t even given beds.…They are assumed to die. Priority is given to the patients whom the health-care workers believe they can save. In effect, pregnant women are being triaged last.”
—Joshua Lang1
Ebola is a rare and potentially deadly disease caused by infection with a strain of the Ebola virus. First described in 1967,2 the Ebola virus has caused significant morbidity and mortality in many parts of sub-Saharan Africa. Awareness about this disease has increased dramatically in the United States as a result of the largest Ebola epidemic in history, which broke out in West Africa in 2014. The 3 countries most widely affected include Sierra Leone, Liberia, and Guinea. As of May 15, 2015, there were 26,798 cases of Ebola in this epidemic (with 14,971 laboratory confirmed), of whom 11,089 have died.3 There have been a total of 868 confirmed health care worker infections reported in Guinea, Liberia, and Sierra Leone since the start of the outbreak, with 507 reported deaths.4
It is highly unlikely that an Ebola epidemic of similar proportion will break out in any developed nation. However, isolated cases of Ebola have been identified among high-risk individuals in the United States (such as those who had recently served as medical volunteers in West Africa), which has raised concern about Ebola infection prevention and management in this country.
Little is known about Ebola infection in pregnancy. The few reports available suggest that pregnant women who become infected are highly contagious, with a maternal and perinatal mortality rate near 100%.5 Significant efforts were put in place in hospitals around the United States, including in labor and delivery units, to care for potentially or actively infected individuals, to protect health care workers, and to contain the spread of any new infections. It is important that clinicians be aware of the efforts and the recommended protocols—especially for the unique circumstance of infection during pregnancy. We review these protocols, as well as provide details on viral transmission and treatment.
What is Ebola virus and why are humans affected?

Ebola virus is a single-stranded RNA filovirus (FIGURE) with 5 independently identified species named after the countries or regions in which they were identified. Four of these are known to cause disease in humans, including Zaire Ebola virus, Sudan virus, Tai Forest virus (isolated in Ivory Coast), and Bundibugyo virus.1 Zaire Ebola virus is the most virulent species and has been responsible for most of the outbreaks in sub-Saharan Africa, with an overall mortality rate of around 70%.2 Sudan virus was responsible for outbreaks in the 1970s, 2000, and 2004; Bundibugyo virus caused a single outbreak in 2007, which had a lower mortality rate of around 30%. The fifth virus, Reston virus, does not appear to cause infection in humans, but does infect pigs and nonhuman primates.1
The natural reservoir of the Ebola virus is not known. It is unlikely to be primates, since the virus typically kills its primate host within a matter of days. Recent studies suggest that the natural host may be bats.3 Initial infections in humans may result from preparing and eating infected bush meat or from exposure to infected bat droppings during such activities as mining and spelunking.
References
- Bray M. Filoviridae. In: Clinical Virology, 2nd ed. Richman DD, Whitley RJ, Hayden FG, eds. Washington, DC: ASM Press; 2002:875.
- WHO Ebola Response Team. Ebola virus disease in West Africa—the first 9 months of the epidemic and forward projections. N Engl J Med. 2014;371:1481–1495.
- Centers for Disease Control and Prevention. Epidemiologic risk factors to consider when evaluating a person for exposure to Ebola virus. http://www.cdc.gov/vhf/ebola/exposure/risk-factors-when-evaluating-person-for-exposure.html. Updated May 1, 2015. Accessed May 14, 2015.
Transmission and clinical presentation
Ebola is not spread through air, water supply, food, or by mosquitoes.6 The Ebola virus is spread from person to person through direct contact with blood or bodily fluids from an infected individual who has developed disease symptoms. It is generally accepted that asymptomatic individuals are not infectious, likely due to their low circulating viral load. The incubation period is between 2 and 21 days.6,7
Sexual transmission. The Centers for Disease Control and Prevention (CDC) now recommends that contact with semen from male Ebola survivors be avoided “until more information regarding the duration and infectiousness of viral shedding in body fluids is known.” They recommend a condom be used (correctly and consistently) when male survivors have oral, vaginal, or anal sex.8
Following the initial inoculation, the virus spreads rapidly throughout the body, infecting many cell types, although it primarily targets macrophages (including the Kupffer cells of the liver), dendritic cells, and endothelial cells. Infected cells die and release more viral particles as well as proinflammatory mediators (tumor-necrosis-factor−a, interleukins, nitric oxide) leading to a massive systemic inflammatory response. Impaired dendritic cells are unable to mount an effective immune response to fight the infection.9
Symptoms develop rapidly, starting with fever and malaise, and progressing within a few days to vomiting, diarrhea, loss of appetite, abdominal pain, and rash. Signs include hypotension (due to vasodilation and increased vascular permeability), shock, multisystem organ failure, and coagulopathy (which occurs in 20% of cases due to activation of tissue factor). Leukopenia, thrombocytopenia, transaminitis, coagulation abnormalities, proteinuria, renal failure, and electrolyte abnormalities are commonly seen on laboratory analysis.10,11 Interestingly, the Ebola virus gains entry into human cells using the Niemann-Pick C1 cholesterol transporter, and cells from patients with Niemann-Pick type C disease are immune to infection with the Ebola virus.12
Ebola in pregnancy
Information about the true incidence and complications of Ebola disease is limited. Most infected patients have been cared for in community-based health care facilities in Africa with little access to diagnostic testing and unreliable medical records. The data we do have about risks factors, disease transmission, and mortality rates come mainly from epidemiologic studies conducted in the midst of an Ebola epidemic or from studies in nonhuman primates. Data on Ebola infection in pregnancy are even more limited.
Pregnant women are more vulnerable to and may have more complications as a result of certain infections, including malaria, varicella, and seasonal influenza. While data are limited, pregnant women and their fetuses infected with the Ebola virus also appear to have worse outcomes, with a maternal and perinatal mortality rate that approaches 100%.5 Under normal conditions, pregnant women are given priority within the medical system. However, given the overall poor prognosis, their increased infectivity, and concerns about the well-being of health care providers, many pregnant women infected with the Ebola virus during the recent epidemic were set aside and denied basic health care needs, including hospital admission. Whether improved infection control and more intensive medical care would improve the survival rate of infected pregnant women is not clear.
Most of what we know about Ebola infection in pregnancy comes from the 1995 epidemic in the Kikwit area of the Democratic Republic of the Congo (Zaire). Of the 202 people infected during that epidemic, 105 were women and 15 were pregnant (4 in the first trimester, 6 in the second trimester, and 5 in the third trimester). Pregnant women presented with vaginal bleeding and occasionally bleeding from other sites, including gum bleeding, hematemesis, hematuria, and melena. Of note, the diagnosis of Ebola during the Kikwit epidemic was based on clinical examination alone.5 Fourteen of these 15 women died, giving a mortality rate of 93.3%, with death occurring within 10 days in all instances. One woman delivered a live-born child, but both she and the baby died within 3 days. The woman who did survivehad a miscarriage in the first trimester.5
In the 1976 epidemic centered in Yambuku, Zaire, pregnant women fared slightly better, with a mortality rate of 89% (73/82), which was similar to the mortality rate for the population as a whole of 88%.5 Nineteen women (23%) had a spontaneous abortion. Ten women (12%) delivered live-born babies, but all died within 19 days. It is assumed that these infants contracted the Ebola virus, but whether this was indeed the case and when and how they contracted the infection is not known. The combined perinatal and infant mortality rate in these 2 epidemics was 100%.
During the recent epidemic in Guinea, there were 2 pregnant patients, both of whom presented with fetal demise in the third trimester. Their labors were induced and both mothers survived.13 During the height of the recent Liberian epidemic (between August and October 2014), 700 infected patients were admitted to the largest treatment center. Four women were pregnant, all in the latter half of gestation. Of these, 3 died (75% mortality rate). The remaining woman survived, but her fetus died.9 Taken together, the prevailing evidence suggests that maternal and perinatal outcomes of pregnant women infected with the Ebola virus are dismal, with mortality rates approaching 100%.
Protecting health care workers
Transmission of the Ebola virus to health care workers has emerged as a major concern during the most recent outbreak in West Africa. Frontline health care workers are usually the first to see such patients and are at high risk of exposure to infected bodily fluids. This is especially true of health care professionals working on labor and delivery units, where exposure to blood and amniotic fluid is commonplace at the time of delivery.
Contaminated needles and syringes also may play a role in transmission.14,15 And, in Africa, a large number of transmissions have been attributed to ritual washing of the body at funerals, since viral load is maximal at the time of death, but this is unlikely to play a significant role in transmission of the virus in developed countries. Ebola virus has been isolated from breast milk.16 While direct transmission of the virus through breastfeeding has not been documented, breast milk from infected individuals should be disposed of carefully.
Prophylaxis
Is a vaccine on the way?
Development of an Ebola vaccine is under way. The most promising vaccine to date is cAd3-ZEBOV (GlaxoSmithKline, Brentford, London, United Kingdom). This vaccine is derived from a chimpanzee adenovirus, called Chimp Adenovirus type 3 (ChAd3), which has been genetically engineered to express proteins from both the Zaire and Sudan species of Ebola virus to provoke an immune response against them. Phase 1 trials of this vaccine began in September 2014.17
Appropriate precautions
Until an effective vaccine is available, a number of recommendations have been put in place in an effort to prevent Ebola infection:
- Avoid all nonessential travel to West Africa, especially to Sierre Leone, Guinea, and Liberia.7
- Avoid exposure to bodily fluids of patients who have been exposed to or are at high risk of having Ebola. This includes individuals who are febrile or feeling unwell and who have traveled to West Africa within the previous 21 days, especially if they visited 1 of the 3 countries with the highest Ebola infection rates (Sierre Leone, Guinea, and Liberia).
- Introduce universal screening of all patients, family members, and employees entering labor and delivery units.
Classifying risk and risk-associated protocols
If an at-risk patient is identified, she should be placed in isolation and consultation with an infectious disease specialist should occur. Using appropriate personal protective equipment (PPE), a detailed history and physical examination should be performed, and the patient should be classified according to risk14,15:
- No risk—defined as those who traveled to an Ebola-affected country more than 21 days previously, those in contact with an asymptomatic person prior to them being diagnosed with Ebola, and those in contact with an asymptomatic person who in turn had contact with an infected individual.
- Low risk—including those who traveled to an Ebola-affected country within 21 days but are asymptomatic, those with brief contact with asymptomatic infected individuals, those exposed to infected individuals in countries without widespread disease while wearing PPE, and those in brief proximity to a symptomatic individual, such as being in the same room or on the same airplane.
- Some (moderate) risk—including those in close contact (within 1 m) with a symptomatic individual or those exposed to an infected individual in a country with widespread disease while wearing PPE.
- High risk—defined as those exposed to the bodily fluids of an infected individual without PPE.
When should a patient be tested for Ebola, and what does that testing entail?
Patients found to be at no risk should not be tested or monitored, regardless of whether or not they are symptomatic. Asymptomatic patients with risk factors should not be tested for the Ebola virus. However, they do need to be followed for signs and symptoms of infection. At this time, the CDC has decided that it will take on the responsibility of monitoring all such patients until they are out of the 21-day window.14,15
Symptomatic patients with risk factors should be tested for the Ebola virus, regardless of whether they are designated as being at low, moderate, or high risk of infection. Strict infection control precautions should be followed for such patients, and local/state health departments should be notified. Laboratory testing includes RT-PCR or Ebola immunoassay. A negative RT-PCR test result obtained more than 72 hours after the onset of symptoms effectively rules out Ebola infection. In general, patients can be discharged from the hospital if they are asymptomatic and have 2 negative RT-PCR test results within 48 hours.14,15
Other diagnoses that should be considered in these patients include influenza, malaria, Lassa fever, meningococcal infection, and typhoid. If a patient is asymptomatic but at risk, all nonemergent medical care should be deferred until they are out of the 21-day window. Repeat testing may be warranted in certain clinical scenarios.
Management of infected patients in a maternity ward
While no pregnant patient has yet been diagnosed with Ebola infection in the United States, it remains a possibility, and clinicians should be aware of appropriate management actions. Once the diagnosis is confirmed, patients and their families should be placed in strict isolation. In some states, specific regional centers have been designated to care for these patients. They should be cared for by a small, dedicated team of clinicians dressed in state-of-the-art PPE and fully trained in the technique of donning and doffing the gear. Some institutions have mandated that no medical students or residents be involved directly in the care of these patients. Infectious disease specialists should be actively involved. All medical equipment (such as stethoscopes, blood pressure cuffs, thermometers, and fetal heart rate monitors) should be dedicated to the care of this patient alone and should remain in the room, as the virus can remain viable on surfaces for “a few hours or days.”18
Treatment itself is largely supportive, with significant intravascular expansion and treatment of fever, nausea, vomiting, and diarrhea. Patients typically require 5 to 10 L of fluid replacement each day, along with regular electrolyte repletion. The development of coagulopathy is a real concern and should be carefully monitored for and corrected as needed. Since blood is highly infectious, every effort should be made to perform only critical blood tests and to do so at the bedside, if possible. Mobile devices are available that can be stationed in the room and provide basic hematologic and electrolyte measurements, thereby avoiding the need to transport the blood and the risk of potentially contaminating laboratory equipment. Dedicated staff should be trained on the use of such equipment. In all likelihood, radiologic imaging will not be available and management decisions will need to be made on the basis of clinical examination alone.
Treatment of the virus and the conditions it can cause
A number of experimental treatments are under investigation. These include some antiviral agents (such as the CMV antiviral drug brincidofovir and the influenza antiviral favipiravir), immune sera from Ebola survivors, and RNA interference agents (such as TKM-Ebola). Zmapp, a cocktail of 3 anti-Ebola monoclonal antibodies, has been shown to be protective in macaque monkeys in the late stages of the disease and has been given to 4 infected patients in the United States, with variable results.19 All of these options should be considered on an individual basis.
Some patients may experience renal or respiratory failure requiring advanced life support measures such as dialysis, mechanical ventilation, or cardiorespiratory resuscitation (CPR). The decision of whether or not to proceed with such interventions should be left to the discretion of the attending physician staff. Given the extremely poor prognosis for the patient and the attendant risks to the health care staff and potentially to subsequent patients using these same pieces of medical equipment, it would seem reasonable to withhold such interventions.
Unique considerations during pregnancy. In pregnant patients with Ebola, it may be reasonable to withhold the option of cesarean and offer only vaginal delivery in the event of labor. This is not just a theoretic concern. In 1 case in Zaire in 1995, an entire surgical team was infected after operating on an infected patient, with the infection spreading to outside hospital staff and family members.20
Survival rates are dismal
Reported survival rates are extremely low, especially for pregnant women. Patients who are younger, have lower viral loads, and do not have diarrhea or severe dehydration have a higher likelihood of surviving. Whether survival rates are higher in developed countries with more health care resources has yet to be confirmed. If patients do survive, the recovery period is long, with prolonged weakness, fatigue, and weight loss. While sexual transmission of the Ebola virus has not been documented, the CDC has recommended sexual abstinence for at least 3 months after recovery.14,15 Ebola survivors are thought to be immune to subsequent infections.
Education is the most important factor for most of us
In November 2014, the American College of Obstetricians and Gynecologists (ACOG) published a practice advisory on the care of obstetric patients during an Ebola virus outbreak.21 While the number of Ebola cases in the United States has been, and likely will continue to be low, especially among pregnant women, we should continue to focus on education and screening. Only providers who have undergone Ebola training and have proper PPE should be involved in the care of potentially infected or confirmed cases. The greatest potential for harm is suboptimal obstetric care leading to an adverse event in a patient suspected of having Ebola who subsequently tests negative. Once an Ebola infection has been confirmed, patients—regardless of whether or not they are pregnant—should be hospitalized in institutions with the requisite resources, protocols, and expertise to deal with such highly infectious patients.
Share your thoughts on this article! Send your Letter to the Editor to [email protected]. Please include your name and the city and state in which you practice.
1. Lang J. Ebola in the maternity ward. http://www.newyorker.com/tech/elements/ebola-maternity-ward. Published October 29, 2014. Accessed May 16, 2015.
2. Martini GA. Marburg agent disease in man. Trans R Soc Trop Med Hyg. 1969;63(3):295–302.
3. Centers for Disease Control and Prevention. 2014 Ebola Outbreak in West Africa - Case Counts. http://www.cdc.gov/vhf/ebola/outbreaks/2014-west-africa/case-counts.html. Updated May 15, 2015. Accessed May 17, 2015.
4. Centers for Disease Control and Prevention. 2014 Ebola outbreak in West Africa. http://www.cdc.gov/vhf/ebola/outbreaks/2014-west-africa/index.html. Updated May 15, 2015. Accessed May 17, 2015.
5. Mupapa K, Mukundu W, Bwaka MA, et al. Ebola hemorrhagic fever and pregnancy. J Infect Dis. 1999;179(suppl 1):S11–S12.
6. Centers for Disease Control and Prevention. Epidemiologic risk factors to consider when evaluating a person for exposure to Ebola virus. http://www.cdc.gov/vhf/ebola/exposure/risk-factors-when-evaluating-person-for-exposure.html. Updated May 1, 2015. Accessed May 16, 2015.
7. Centers for Disease Control and Prevention. Ebola (Ebola virus disease). http://www.cdc.gov/vhf/ebola/. Updated May 15, 2015. Accessed May 16, 2015.
8. Christie A, Davies-Wayne GJ, Cordier-Lasalle T, et al. Possible sexual transmission of Ebola virus — Liberia, 2015. MMWR Morb Mortal Wkly Rep. 2015;64(17):479–481.
9. Chertow DS, Kleine C, Edwards JK, et al. Ebola virus disease in West Africa—clinical manifestations and management. N Engl J Med. 2014;371(22):2054–2057.
10. Mahanty S, Bray M. Pathogenesis of filoviral haemorrhagic fevers. Lancet Infect Dis. 2004;4(8):487–498.
11. Bray M. Pathogenesis of viral hemorrhagic fever. Curr Opin Immunol. 2005;17(4):399–403.
12. Carette JE, Raaben M, Wong AC, et al. Ebola virus entry requires the cholesterol transporter Niemann-Pick C1. Nature. 2011;477(7364):340–343.
13. Baggi FM, Taybi A, Kurth A, et al. Management of pregnant women infected with Ebola virus in a treatment centre in Guinea, June 2014. Euro Surveill. 2014;19(49). pii: 20983.
14. Centers for Disease Control and Prevention. Review of human-to-human transmission of Ebola virus. http://www.cdc.gov/vhf/ebola/transmission/human-transmission.html. Updated October 29, 2014. Accessed May 16, 2015.
15. Centers for Disease Control and Prevention. Ebola virus disease (EVD) information for clinicians in U.S. healthcare settings. http://www.cdc.gov/vhf/ebola/healthcare-us/preparing/clinicians.html. Updated April 1, 2015. Accessed May 16, 2015.
16. Bausch DG, Towner JS, Dowell SF, et al. Assessment of the risk of Ebola virus transmission from bodily fluids and fomites. J Infect Dis. 2007;196(suppl 2):S142–S147.
17. Ledgerwood JE, DeZure AD, Stanley DA, et al; VRC 207 Study Team. Chimpanzee adenovirus vector Ebola vaccine — preliminary report [published online ahead of print November 26, 2014]. N Engl J Med. http://www.nejm.org/doi/full/10.1056/NEJMoa1410863. Accessed May 17, 2015.
18. Centers for Disease Control and Prevention. Q&As on transmission. http://www.cdc.gov/vhf/ebola/transmission/qas.html. Updated April 24, 2015. Accessed May 17, 2015.
19. Lyon GM, Mehta AK, Varkey JB, et al; Emory Serious Communicable Diseases Unit. Clinical care of two patients with Ebola virus disease in the United States. N Engl J Med. 2014;371(25):2402–2409.
20. Khan AS, Tshioko FK, Heymann DL, et al. The reemergence of Ebola hemorrhagic fever, Democratic Republic of the Congo, 1995. Commission de Lutte contre les Epidémies à Kikwit. J Infect Dis. 1999;179(suppl 1):S76.
21. American College of Obstetricians and Gynecologists. Practice Advisory: Care of obstetric patients during an Ebola virus outbreak. http://www.acog.org/About-ACOG/News-Room/Practice-Advisories/ACOG-Practice-Advisory-Care-of-Obstetric-Patients-During-an-Ebola-Virus-Outbreak. Published November 3, 2014. Accessed May 17, 2015.

|
Stephanie L. Bakaysa, MD, MPH, is Fellow in Maternal-Fetal Medicine, Tufts University School of Medicine/Tufts Medical Center, Boston, Massachusetts. |
|
Jeannie C. Kelly, MD, is Fellow in Maternal-Fetal Medicine, Tufts University School of Medicine/Tufts Medical Center. |
| Errol R. Norwitz, MD, PhD, is Louis E. Phaneuf Professor and Chairman, Department of Obstetrics and Gynecology, Tufts University School of Medicine/Tufts Medical Center. He serves on the OBG Management Board of Editors. |


The authors report no financial relationships relevant to this article.
|
|
Stephanie L. Bakaysa, MD, MPH, is Fellow in Maternal-Fetal Medicine, Tufts University School of Medicine/Tufts Medical Center, Boston, Massachusetts. |
|
Jeannie C. Kelly, MD, is Fellow in Maternal-Fetal Medicine, Tufts University School of Medicine/Tufts Medical Center. |
| Errol R. Norwitz, MD, PhD, is Louis E. Phaneuf Professor and Chairman, Department of Obstetrics and Gynecology, Tufts University School of Medicine/Tufts Medical Center. He serves on the OBG Management Board of Editors. |
The authors report no financial relationships relevant to this article.
“[Pregnant patients infected with the Ebola virus in West Africa] aren’t given preferential treatment...They aren’t even given beds.…They are assumed to die. Priority is given to the patients whom the health-care workers believe they can save. In effect, pregnant women are being triaged last.”
—Joshua Lang1
Ebola is a rare and potentially deadly disease caused by infection with a strain of the Ebola virus. First described in 1967,2 the Ebola virus has caused significant morbidity and mortality in many parts of sub-Saharan Africa. Awareness about this disease has increased dramatically in the United States as a result of the largest Ebola epidemic in history, which broke out in West Africa in 2014. The 3 countries most widely affected include Sierra Leone, Liberia, and Guinea. As of May 15, 2015, there were 26,798 cases of Ebola in this epidemic (with 14,971 laboratory confirmed), of whom 11,089 have died.3 There have been a total of 868 confirmed health care worker infections reported in Guinea, Liberia, and Sierra Leone since the start of the outbreak, with 507 reported deaths.4
It is highly unlikely that an Ebola epidemic of similar proportion will break out in any developed nation. However, isolated cases of Ebola have been identified among high-risk individuals in the United States (such as those who had recently served as medical volunteers in West Africa), which has raised concern about Ebola infection prevention and management in this country.
Little is known about Ebola infection in pregnancy. The few reports available suggest that pregnant women who become infected are highly contagious, with a maternal and perinatal mortality rate near 100%.5 Significant efforts were put in place in hospitals around the United States, including in labor and delivery units, to care for potentially or actively infected individuals, to protect health care workers, and to contain the spread of any new infections. It is important that clinicians be aware of the efforts and the recommended protocols—especially for the unique circumstance of infection during pregnancy. We review these protocols, as well as provide details on viral transmission and treatment.
What is Ebola virus and why are humans affected?
Ebola virus is a single-stranded RNA filovirus (FIGURE) with 5 independently identified species named after the countries or regions in which they were identified. Four of these are known to cause disease in humans, including Zaire Ebola virus, Sudan virus, Tai Forest virus (isolated in Ivory Coast), and Bundibugyo virus.1 Zaire Ebola virus is the most virulent species and has been responsible for most of the outbreaks in sub-Saharan Africa, with an overall mortality rate of around 70%.2 Sudan virus was responsible for outbreaks in the 1970s, 2000, and 2004; Bundibugyo virus caused a single outbreak in 2007, which had a lower mortality rate of around 30%. The fifth virus, Reston virus, does not appear to cause infection in humans, but does infect pigs and nonhuman primates.1
The natural reservoir of the Ebola virus is not known. It is unlikely to be primates, since the virus typically kills its primate host within a matter of days. Recent studies suggest that the natural host may be bats.3 Initial infections in humans may result from preparing and eating infected bush meat or from exposure to infected bat droppings during such activities as mining and spelunking.
References
- Bray M. Filoviridae. In: Clinical Virology, 2nd ed. Richman DD, Whitley RJ, Hayden FG, eds. Washington, DC: ASM Press; 2002:875.
- WHO Ebola Response Team. Ebola virus disease in West Africa—the first 9 months of the epidemic and forward projections. N Engl J Med. 2014;371:1481–1495.
- Centers for Disease Control and Prevention. Epidemiologic risk factors to consider when evaluating a person for exposure to Ebola virus. http://www.cdc.gov/vhf/ebola/exposure/risk-factors-when-evaluating-person-for-exposure.html. Updated May 1, 2015. Accessed May 14, 2015.
Transmission and clinical presentation
Ebola is not spread through air, water supply, food, or by mosquitoes.6 The Ebola virus is spread from person to person through direct contact with blood or bodily fluids from an infected individual who has developed disease symptoms. It is generally accepted that asymptomatic individuals are not infectious, likely due to their low circulating viral load. The incubation period is between 2 and 21 days.6,7
Sexual transmission. The Centers for Disease Control and Prevention (CDC) now recommends that contact with semen from male Ebola survivors be avoided “until more information regarding the duration and infectiousness of viral shedding in body fluids is known.” They recommend a condom be used (correctly and consistently) when male survivors have oral, vaginal, or anal sex.8
Following the initial inoculation, the virus spreads rapidly throughout the body, infecting many cell types, although it primarily targets macrophages (including the Kupffer cells of the liver), dendritic cells, and endothelial cells. Infected cells die and release more viral particles as well as proinflammatory mediators (tumor-necrosis-factor−a, interleukins, nitric oxide) leading to a massive systemic inflammatory response. Impaired dendritic cells are unable to mount an effective immune response to fight the infection.9
Symptoms develop rapidly, starting with fever and malaise, and progressing within a few days to vomiting, diarrhea, loss of appetite, abdominal pain, and rash. Signs include hypotension (due to vasodilation and increased vascular permeability), shock, multisystem organ failure, and coagulopathy (which occurs in 20% of cases due to activation of tissue factor). Leukopenia, thrombocytopenia, transaminitis, coagulation abnormalities, proteinuria, renal failure, and electrolyte abnormalities are commonly seen on laboratory analysis.10,11 Interestingly, the Ebola virus gains entry into human cells using the Niemann-Pick C1 cholesterol transporter, and cells from patients with Niemann-Pick type C disease are immune to infection with the Ebola virus.12
Ebola in pregnancy
Information about the true incidence and complications of Ebola disease is limited. Most infected patients have been cared for in community-based health care facilities in Africa with little access to diagnostic testing and unreliable medical records. The data we do have about risks factors, disease transmission, and mortality rates come mainly from epidemiologic studies conducted in the midst of an Ebola epidemic or from studies in nonhuman primates. Data on Ebola infection in pregnancy are even more limited.
Pregnant women are more vulnerable to and may have more complications as a result of certain infections, including malaria, varicella, and seasonal influenza. While data are limited, pregnant women and their fetuses infected with the Ebola virus also appear to have worse outcomes, with a maternal and perinatal mortality rate that approaches 100%.5 Under normal conditions, pregnant women are given priority within the medical system. However, given the overall poor prognosis, their increased infectivity, and concerns about the well-being of health care providers, many pregnant women infected with the Ebola virus during the recent epidemic were set aside and denied basic health care needs, including hospital admission. Whether improved infection control and more intensive medical care would improve the survival rate of infected pregnant women is not clear.
Most of what we know about Ebola infection in pregnancy comes from the 1995 epidemic in the Kikwit area of the Democratic Republic of the Congo (Zaire). Of the 202 people infected during that epidemic, 105 were women and 15 were pregnant (4 in the first trimester, 6 in the second trimester, and 5 in the third trimester). Pregnant women presented with vaginal bleeding and occasionally bleeding from other sites, including gum bleeding, hematemesis, hematuria, and melena. Of note, the diagnosis of Ebola during the Kikwit epidemic was based on clinical examination alone.5 Fourteen of these 15 women died, giving a mortality rate of 93.3%, with death occurring within 10 days in all instances. One woman delivered a live-born child, but both she and the baby died within 3 days. The woman who did survivehad a miscarriage in the first trimester.5
In the 1976 epidemic centered in Yambuku, Zaire, pregnant women fared slightly better, with a mortality rate of 89% (73/82), which was similar to the mortality rate for the population as a whole of 88%.5 Nineteen women (23%) had a spontaneous abortion. Ten women (12%) delivered live-born babies, but all died within 19 days. It is assumed that these infants contracted the Ebola virus, but whether this was indeed the case and when and how they contracted the infection is not known. The combined perinatal and infant mortality rate in these 2 epidemics was 100%.
During the recent epidemic in Guinea, there were 2 pregnant patients, both of whom presented with fetal demise in the third trimester. Their labors were induced and both mothers survived.13 During the height of the recent Liberian epidemic (between August and October 2014), 700 infected patients were admitted to the largest treatment center. Four women were pregnant, all in the latter half of gestation. Of these, 3 died (75% mortality rate). The remaining woman survived, but her fetus died.9 Taken together, the prevailing evidence suggests that maternal and perinatal outcomes of pregnant women infected with the Ebola virus are dismal, with mortality rates approaching 100%.
Protecting health care workers
Transmission of the Ebola virus to health care workers has emerged as a major concern during the most recent outbreak in West Africa. Frontline health care workers are usually the first to see such patients and are at high risk of exposure to infected bodily fluids. This is especially true of health care professionals working on labor and delivery units, where exposure to blood and amniotic fluid is commonplace at the time of delivery.
Contaminated needles and syringes also may play a role in transmission.14,15 And, in Africa, a large number of transmissions have been attributed to ritual washing of the body at funerals, since viral load is maximal at the time of death, but this is unlikely to play a significant role in transmission of the virus in developed countries. Ebola virus has been isolated from breast milk.16 While direct transmission of the virus through breastfeeding has not been documented, breast milk from infected individuals should be disposed of carefully.
Prophylaxis
Is a vaccine on the way?
Development of an Ebola vaccine is under way. The most promising vaccine to date is cAd3-ZEBOV (GlaxoSmithKline, Brentford, London, United Kingdom). This vaccine is derived from a chimpanzee adenovirus, called Chimp Adenovirus type 3 (ChAd3), which has been genetically engineered to express proteins from both the Zaire and Sudan species of Ebola virus to provoke an immune response against them. Phase 1 trials of this vaccine began in September 2014.17
Appropriate precautions
Until an effective vaccine is available, a number of recommendations have been put in place in an effort to prevent Ebola infection:
- Avoid all nonessential travel to West Africa, especially to Sierre Leone, Guinea, and Liberia.7
- Avoid exposure to bodily fluids of patients who have been exposed to or are at high risk of having Ebola. This includes individuals who are febrile or feeling unwell and who have traveled to West Africa within the previous 21 days, especially if they visited 1 of the 3 countries with the highest Ebola infection rates (Sierre Leone, Guinea, and Liberia).
- Introduce universal screening of all patients, family members, and employees entering labor and delivery units.
Classifying risk and risk-associated protocols
If an at-risk patient is identified, she should be placed in isolation and consultation with an infectious disease specialist should occur. Using appropriate personal protective equipment (PPE), a detailed history and physical examination should be performed, and the patient should be classified according to risk14,15:
- No risk—defined as those who traveled to an Ebola-affected country more than 21 days previously, those in contact with an asymptomatic person prior to them being diagnosed with Ebola, and those in contact with an asymptomatic person who in turn had contact with an infected individual.
- Low risk—including those who traveled to an Ebola-affected country within 21 days but are asymptomatic, those with brief contact with asymptomatic infected individuals, those exposed to infected individuals in countries without widespread disease while wearing PPE, and those in brief proximity to a symptomatic individual, such as being in the same room or on the same airplane.
- Some (moderate) risk—including those in close contact (within 1 m) with a symptomatic individual or those exposed to an infected individual in a country with widespread disease while wearing PPE.
- High risk—defined as those exposed to the bodily fluids of an infected individual without PPE.
When should a patient be tested for Ebola, and what does that testing entail?
Patients found to be at no risk should not be tested or monitored, regardless of whether or not they are symptomatic. Asymptomatic patients with risk factors should not be tested for the Ebola virus. However, they do need to be followed for signs and symptoms of infection. At this time, the CDC has decided that it will take on the responsibility of monitoring all such patients until they are out of the 21-day window.14,15
Symptomatic patients with risk factors should be tested for the Ebola virus, regardless of whether they are designated as being at low, moderate, or high risk of infection. Strict infection control precautions should be followed for such patients, and local/state health departments should be notified. Laboratory testing includes RT-PCR or Ebola immunoassay. A negative RT-PCR test result obtained more than 72 hours after the onset of symptoms effectively rules out Ebola infection. In general, patients can be discharged from the hospital if they are asymptomatic and have 2 negative RT-PCR test results within 48 hours.14,15
Other diagnoses that should be considered in these patients include influenza, malaria, Lassa fever, meningococcal infection, and typhoid. If a patient is asymptomatic but at risk, all nonemergent medical care should be deferred until they are out of the 21-day window. Repeat testing may be warranted in certain clinical scenarios.
Management of infected patients in a maternity ward
While no pregnant patient has yet been diagnosed with Ebola infection in the United States, it remains a possibility, and clinicians should be aware of appropriate management actions. Once the diagnosis is confirmed, patients and their families should be placed in strict isolation. In some states, specific regional centers have been designated to care for these patients. They should be cared for by a small, dedicated team of clinicians dressed in state-of-the-art PPE and fully trained in the technique of donning and doffing the gear. Some institutions have mandated that no medical students or residents be involved directly in the care of these patients. Infectious disease specialists should be actively involved. All medical equipment (such as stethoscopes, blood pressure cuffs, thermometers, and fetal heart rate monitors) should be dedicated to the care of this patient alone and should remain in the room, as the virus can remain viable on surfaces for “a few hours or days.”18
Treatment itself is largely supportive, with significant intravascular expansion and treatment of fever, nausea, vomiting, and diarrhea. Patients typically require 5 to 10 L of fluid replacement each day, along with regular electrolyte repletion. The development of coagulopathy is a real concern and should be carefully monitored for and corrected as needed. Since blood is highly infectious, every effort should be made to perform only critical blood tests and to do so at the bedside, if possible. Mobile devices are available that can be stationed in the room and provide basic hematologic and electrolyte measurements, thereby avoiding the need to transport the blood and the risk of potentially contaminating laboratory equipment. Dedicated staff should be trained on the use of such equipment. In all likelihood, radiologic imaging will not be available and management decisions will need to be made on the basis of clinical examination alone.
Treatment of the virus and the conditions it can cause
A number of experimental treatments are under investigation. These include some antiviral agents (such as the CMV antiviral drug brincidofovir and the influenza antiviral favipiravir), immune sera from Ebola survivors, and RNA interference agents (such as TKM-Ebola). Zmapp, a cocktail of 3 anti-Ebola monoclonal antibodies, has been shown to be protective in macaque monkeys in the late stages of the disease and has been given to 4 infected patients in the United States, with variable results.19 All of these options should be considered on an individual basis.
Some patients may experience renal or respiratory failure requiring advanced life support measures such as dialysis, mechanical ventilation, or cardiorespiratory resuscitation (CPR). The decision of whether or not to proceed with such interventions should be left to the discretion of the attending physician staff. Given the extremely poor prognosis for the patient and the attendant risks to the health care staff and potentially to subsequent patients using these same pieces of medical equipment, it would seem reasonable to withhold such interventions.
Unique considerations during pregnancy. In pregnant patients with Ebola, it may be reasonable to withhold the option of cesarean and offer only vaginal delivery in the event of labor. This is not just a theoretic concern. In 1 case in Zaire in 1995, an entire surgical team was infected after operating on an infected patient, with the infection spreading to outside hospital staff and family members.20
Survival rates are dismal
Reported survival rates are extremely low, especially for pregnant women. Patients who are younger, have lower viral loads, and do not have diarrhea or severe dehydration have a higher likelihood of surviving. Whether survival rates are higher in developed countries with more health care resources has yet to be confirmed. If patients do survive, the recovery period is long, with prolonged weakness, fatigue, and weight loss. While sexual transmission of the Ebola virus has not been documented, the CDC has recommended sexual abstinence for at least 3 months after recovery.14,15 Ebola survivors are thought to be immune to subsequent infections.
Education is the most important factor for most of us
In November 2014, the American College of Obstetricians and Gynecologists (ACOG) published a practice advisory on the care of obstetric patients during an Ebola virus outbreak.21 While the number of Ebola cases in the United States has been, and likely will continue to be low, especially among pregnant women, we should continue to focus on education and screening. Only providers who have undergone Ebola training and have proper PPE should be involved in the care of potentially infected or confirmed cases. The greatest potential for harm is suboptimal obstetric care leading to an adverse event in a patient suspected of having Ebola who subsequently tests negative. Once an Ebola infection has been confirmed, patients—regardless of whether or not they are pregnant—should be hospitalized in institutions with the requisite resources, protocols, and expertise to deal with such highly infectious patients.
Share your thoughts on this article! Send your Letter to the Editor to [email protected]. Please include your name and the city and state in which you practice.
1. Lang J. Ebola in the maternity ward. http://www.newyorker.com/tech/elements/ebola-maternity-ward. Published October 29, 2014. Accessed May 16, 2015.
2. Martini GA. Marburg agent disease in man. Trans R Soc Trop Med Hyg. 1969;63(3):295–302.
3. Centers for Disease Control and Prevention. 2014 Ebola Outbreak in West Africa - Case Counts. http://www.cdc.gov/vhf/ebola/outbreaks/2014-west-africa/case-counts.html. Updated May 15, 2015. Accessed May 17, 2015.
4. Centers for Disease Control and Prevention. 2014 Ebola outbreak in West Africa. http://www.cdc.gov/vhf/ebola/outbreaks/2014-west-africa/index.html. Updated May 15, 2015. Accessed May 17, 2015.
5. Mupapa K, Mukundu W, Bwaka MA, et al. Ebola hemorrhagic fever and pregnancy. J Infect Dis. 1999;179(suppl 1):S11–S12.
6. Centers for Disease Control and Prevention. Epidemiologic risk factors to consider when evaluating a person for exposure to Ebola virus. http://www.cdc.gov/vhf/ebola/exposure/risk-factors-when-evaluating-person-for-exposure.html. Updated May 1, 2015. Accessed May 16, 2015.
7. Centers for Disease Control and Prevention. Ebola (Ebola virus disease). http://www.cdc.gov/vhf/ebola/. Updated May 15, 2015. Accessed May 16, 2015.
8. Christie A, Davies-Wayne GJ, Cordier-Lasalle T, et al. Possible sexual transmission of Ebola virus — Liberia, 2015. MMWR Morb Mortal Wkly Rep. 2015;64(17):479–481.
9. Chertow DS, Kleine C, Edwards JK, et al. Ebola virus disease in West Africa—clinical manifestations and management. N Engl J Med. 2014;371(22):2054–2057.
10. Mahanty S, Bray M. Pathogenesis of filoviral haemorrhagic fevers. Lancet Infect Dis. 2004;4(8):487–498.
11. Bray M. Pathogenesis of viral hemorrhagic fever. Curr Opin Immunol. 2005;17(4):399–403.
12. Carette JE, Raaben M, Wong AC, et al. Ebola virus entry requires the cholesterol transporter Niemann-Pick C1. Nature. 2011;477(7364):340–343.
13. Baggi FM, Taybi A, Kurth A, et al. Management of pregnant women infected with Ebola virus in a treatment centre in Guinea, June 2014. Euro Surveill. 2014;19(49). pii: 20983.
14. Centers for Disease Control and Prevention. Review of human-to-human transmission of Ebola virus. http://www.cdc.gov/vhf/ebola/transmission/human-transmission.html. Updated October 29, 2014. Accessed May 16, 2015.
15. Centers for Disease Control and Prevention. Ebola virus disease (EVD) information for clinicians in U.S. healthcare settings. http://www.cdc.gov/vhf/ebola/healthcare-us/preparing/clinicians.html. Updated April 1, 2015. Accessed May 16, 2015.
16. Bausch DG, Towner JS, Dowell SF, et al. Assessment of the risk of Ebola virus transmission from bodily fluids and fomites. J Infect Dis. 2007;196(suppl 2):S142–S147.
17. Ledgerwood JE, DeZure AD, Stanley DA, et al; VRC 207 Study Team. Chimpanzee adenovirus vector Ebola vaccine — preliminary report [published online ahead of print November 26, 2014]. N Engl J Med. http://www.nejm.org/doi/full/10.1056/NEJMoa1410863. Accessed May 17, 2015.
18. Centers for Disease Control and Prevention. Q&As on transmission. http://www.cdc.gov/vhf/ebola/transmission/qas.html. Updated April 24, 2015. Accessed May 17, 2015.
19. Lyon GM, Mehta AK, Varkey JB, et al; Emory Serious Communicable Diseases Unit. Clinical care of two patients with Ebola virus disease in the United States. N Engl J Med. 2014;371(25):2402–2409.
20. Khan AS, Tshioko FK, Heymann DL, et al. The reemergence of Ebola hemorrhagic fever, Democratic Republic of the Congo, 1995. Commission de Lutte contre les Epidémies à Kikwit. J Infect Dis. 1999;179(suppl 1):S76.
21. American College of Obstetricians and Gynecologists. Practice Advisory: Care of obstetric patients during an Ebola virus outbreak. http://www.acog.org/About-ACOG/News-Room/Practice-Advisories/ACOG-Practice-Advisory-Care-of-Obstetric-Patients-During-an-Ebola-Virus-Outbreak. Published November 3, 2014. Accessed May 17, 2015.
In this article
- What we know about Ebola in pregnancy
- Is a vaccine on the way?
- Unique treatment considerations in pregnancy
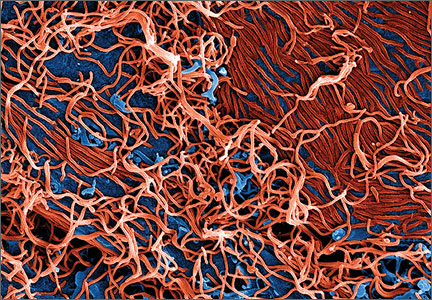
Co-Management Arrangements in Orthopedic Surgery
In the post–Affordable Care Act landscape of American health care, an explosion of alternative payment methods and other creative initiatives has occurred as patients, providers, and payers all seek higher-quality care at lower costs.1 These factors impact every level of the health care system, from large academic medical institutions in major cities to small single hospitals in rural community settings.2 Co-management arrangements are among the many innovative organizational structures that have arisen with the goals of efficiency and quality. For many reasons, a co-management arrangement has specific applicability and appeal in orthopedic surgery, and the popularity of this form of physician–hospital alignment is growing.3
Definition
In health care, and particularly even within orthopedic surgery, the term co-management can have multiple definitions. It can refer to shared responsibility for patient care across service lines—such as the “co-management” by both hospitalists and orthopedic surgeons of elderly patients with multiple chronic medical comorbidities as well as an acute hip fracture or a total knee replacement.4-7 In academic settings, it may refer to the delegation of duties from attending professors to residents in co-managing patients.
In the realm of health care business and finance, however, the term co-management arrangement (CMA) refers to the shared responsibility for a hospital service line by the hospital administration and the physicians involved in that service line. While the basic concept is not necessarily a new one, it is growing in popularity and expanding in scope, creative application, and effectiveness within the current post-reform environment.8 This model of clinical and financial integration has been implemented in multiple different medical subspecialties, from cardiology and oncology to gastroenterology and vision care.9,10 As applied to orthopedic surgery, CMAs create a situation in which orthopedic surgeons participate intimately in the management of the entire musculoskeletal service line, including inpatient and outpatient services. Orthopedics was identified as 1 of the top 3 specialties for clinical CMAs (after cardiology and imaging) in a recent survey of more than 258 hospital executives.11 Because orthopedic surgery represents an extremely profitable service line for most hospitals, it becomes an ideal target for optimization under a CMA because even relatively small percentage increases in efficiency or profitability can pay relatively large dividends for the hospital.12
Under a CMA, the physicians are compensated for their time and efforts, and they provide services across clinical and nonclinical areas. Because orthopedic surgeons are most familiar with the details of their specialty and the unique needs of their patients, they are the best suited to make decisions, both clinical and nonclinical, that impact the provision of that care. The details of individual CMAs will vary based on specific situational factors, but the common goal of improved patient care and greater economic efficiency drive the underlying theme of shared responsibility and physician–hospital alignment.13
A CMA is different from some other recent innovative forms of organizational or financial structure. A CMA is not the same as direct employment14,15 or “pay-for-performance,”16 because both of these methods of physician–hospital alignment lack the incentivized structure of a CMA. While a CMA is similar to a “gainsharing” arrangement because both hospitals and physicians benefit, it has a very different legal structure.17 A CMA also resembles a joint venture, but it differs in its goal of a focus on management roles.18 Bundled-pricing arrangements tend to focus on the end-price of an “episode of care” rather than the system that provides it.19 While CMAs may be more involved than many other forms of organizational structure, a CMA does not have the level of complexity and interaction required for a formal accountable care organization (ACO).20
Principles of Co-Management Arrangements
Because countless variances exist across the country within local and regional orthopedic markets, no single prescription for success exists to guide co-management arrangements for every potential situation.21,22 Several basic principles, however, should characterize any attempted CMA. Without a foundation in these principles, the CMA may risk suboptimal performance or overt failure.
Focus on the Patient
The most basic shared concern of the 2 parties of a CMA (surgeons and hospitals) is the patient. While each side may have different strengths and varying methods of reaching clinical and financial goals, they should be able to agree on the fundamental idea of patient-centered care. Indeed, the patient experience has become a popular buzzword in many areas of medicine,23 and it particularly applies as a foundational principle of CMAs. A focus on the patient does not directly guarantee success, because there are numerous other details and features of a productive CMA. Failure to focus on the patient, however, will lead to problems.
Evidence-Based Decision-Making
As the information age progresses, clinical, operational, and financial decisions are all best made based on data. Over the last 10 years, evidence-based medicine (EBM) has become the norm in orthopedic surgery for the evaluation of techniques, implants, medications, and other treatment options.24 This data-based clinical concept parallels the development of its cousin on the administrative side, evidence-based management.25 Both forms of “EBM” focus on using a synthesis of the best available data to inform decision-making to maximize outcomes. In a CMA, evidence-based decision-making should pervade all aspects of the endeavor.
Physician Leadership
Co-management arrangements cannot succeed with involvement and input exclusively from hospital officials. Physicians must not only participate in these arrangements, but they must take the key leadership roles.26 Physicians can learn relevant skills in business administration much quicker and easier than administrators can gain clinical skill and experience. Therefore, effective CMAs should have appropriately qualified physicians in essential leadership positions whenever possible.27,28
Appropriate Physician Compensation
While physicians may benefit from CMAs in many intangible economic ways, such as increased volume or increased time efficiency, the process of creating and operating a CMA does not inherently generate any revenue for the physicians involved. Indeed, the primary raw materials that an orthopedic surgeon possesses are time and expertise. Investment of an orthopedist’s time and expertise represents utilization of a considerably valuable resource that demands commensurate compensation.29 Hospitals can save exponentially more money through a robust CMA than they might spend for the surgeon’s time and efforts to create it,23 and they should expect returns commensurate with the amount invested.30 Stated simply, the CMA will not work unless physicians are compensated to make it work.
While appropriate compensation for time and effort may seem an obvious and basic element of success for any endeavor, the determination of such compensation for a CMA is fraught with difficulty and danger.3 The primary concern is the calculation of “fair market value” or “commercial reasonableness” of the management services provided by the orthopedic surgeon to the hospital.23,31-33 Any amount perceived as too low may discourage surgeon participation. On the other hand, amounts that exceed fair market value may constitute remuneration that can result in severe federal legal penalties. Any compensation agreement must comply with provisions of the Stark laws and the federal Anti-Kickback Statute, as well as the Civil Monetary Penalties Statute, the more recent Sunshine Act, and other laws.34-37
Consequently, creation of a well-designed compensation plan is thus one of the most critical principles of a CMA.38 Physician compensation for participation in a CMA should focus on 2 major areas—a base payment for time spent in design and management of the arrangement, and a bonus payment for reaching certain predefined quality and efficiency goals through the arrangement.3,22,27,32,34,39 As mentioned above, physicians must, at a minimum, receive fair compensation for their time and efforts. In addition, creation of incentives through a clearly defined, performance-based reward structure can further drive surgeons’ motivation for dedicated effort and creativity.9 It is critical to note that a CMA differs from a gainsharing arrangement because physicians usually do not share a percentage of actual hospital savings under a CMA.31 A gainsharing arrangement, however, usually involves physicians receiving a defined percentage of any real dollar savings created for the hospital through the relationship.17
Transparency
Transparency is a common feature of any business relationship in which 2 distinct entities must work together to achieve a mutual goal. Co-management arrangements are no exception to this rule; multiple experts have identified transparency and trust as foundational elements for success.30,40 To ensure transparency without compromising patient confidentiality, trade secrets, or other valuable restricted information from unnecessary or potentially dangerous exposure, participants in the CMA should develop a transparency plan in the early stages of the relationship. This plan should expressly state exactly what information is to be shared, when, with whom, and in what manner. By balancing information sharing with information security, CMA participants can more comfortably communicate and develop trust.
Reasonable and Modifiable Goals
While the overarching raison d’être of a CMA is to increase efficiency and improve quality, these worthy purposes must be broken down into specific, measurable goals that are unique to each arrangement. These goals should be aggressive enough to make an impact, but they should also be reasonably achievable within a designated period. In many cases, these goals will reflect or follow the regulatory stipulations of various governing bodies, such as the Centers for Medicare and Medicaid Services (CMS) or The Joint Commission.31 Because these entities may frequently change or update their rules (and even their own institutional names!), the CMA must also have a structure that can rapidly respond to alterations in the regulatory landscape.31 The goals should be modifiable and amendable on an as-needed basis with an appropriate vote of the CMA stakeholders, rather than renewable only when the arrangement’s term ends. Without such situational responsiveness, the rapidly undulating world of health care may render the CMA’s goals either laughably low or impossibly high.
Accountability
A CMA must incorporate the concept of accountability throughout its organizational structure. Although this principle will take many different forms and have different applications, it is critical to the effectiveness of a CMA. Traditional hospital management often focuses on financial goals rather than patient-care goals, and physicians must be able to hold management accountable when these goals conflict. A CMA’s legal structure must have elements of accountability and methods of resolving conflict, such as provisions for arbitration or mediation by a designated third party. When goals are not met or if they are exceeded, there must be ways of both disciplining and rewarding those responsible. Ultimately, accountability must be woven into the culture created under the CMA, and this process flows through every element of the agreement, from its contractual legal and leadership structure to its operational and financial logistics.
General Operational Elements of Co-Management Arrangements
While CMAs must be governed by basic principles, they must also involve several general operational elements. The specifics of these elements will vary by situation, but surgeons must consider each in the creation and operation of a CMA.
Legal Structure
Most CMAs involve the creation of a separate legal structural entity that will assume responsibility for management of the hospital’s service line.37,39 This entity often takes the form of a limited liability company (LLC).33 Its members may be all physicians, or it may be jointly owned by the hospital and the physicians.39 The legal structure of the company will depend on state laws and local precedent, and a lawyer with extensive experience in health care law should create it and its governing documents.37 Alternatively, some hospitals may consider directly employing physicians to co-manage a service line, but this simpler model may prove less effective than a true CMA because of the lack of independence for the physicians involved.30,36 Indeed, the maintenance of physician independence is one of the strongest features of a CMA, and it should be carefully protected in the entity’s legal structure.
Like any relationship, a CMA may end, and its creators need to “begin with the end in mind” when creating its formative documents. Physicians should engage expert legal assistance in the structuring of the parts of the contract that govern the unwinding of the agreement. If the CMA performs poorly, or if the hospital becomes insolvent in spite of the CMA, the involved physicians may face liability charges or other legal entanglements. Because the escape clause of the CMA contract may be the doctors’ only shield in such situations, this part of the agreement should be meticulously reviewed by the physicians and by knowledgeable legal counsel.
Legal Compliance
Ultimately, the CMA may implicate federal Stark laws, anti-kickback laws, antitrust laws, Civil Monetary Penalties Statute, the False Claims Act, 501(c)(3) tax exemption rules, and provider-based status rules. These may have severe penalties, including imprisonment, if violated.32,34,36,37 As such, the participants in any arrangement must make certain that the CMA complies with all applicable regulations in both its composition and function.38,41 Participants in CMAs should make all efforts to avoid such legal pitfalls through investigation of safe harbor provisions, special exemptions, and other key features of the relevant laws.37,42 While these regulations will remain in constant flux, governmental regulatory agencies have given guidelines about acceptable structure for CMAs.43,44
For CMAs, a critical feature is the level of participation of the LLC members in the defined activities of the CMA.42 Participation requirements, such as meeting attendance, changes in practice based on defined goals and metrics, and financial contributions, must be included in the operating agreement of the LLC.33 Compliance of all active members with these clearly defined requirements will both improve operations and morale and also decrease legal risk for both the CMA and its individual members.28 Furthermore, certain conduct that may run afoul of regulations should be very specifically prohibited in the member contracts. Such behavior may include pay-for-referral arrangements rather than pay-for-performance, asymmetric income distribution through the LLC, and other activities that limit patient choice.37 The salary and bonus structure must be very carefully designed and monitored, because they can have significant legal implications if not managed correctly. Independent audits should be part of the compliance plan for any CMA, and many authorities recommend limits on the total compensation to physicians as part of a CMA, as well as time limits on the agreement itself.44
Leadership and Reporting Structure
All CMAs should have a medical director who is responsible for the success of the operation. Beneath the medical director, the leadership and reporting structure will vary based on the size of the hospital and the number of surgeons. In some situations, single individuals may assume multiple roles; other situations may dictate the need for many more people. The structure may take the shape of multiple directors and even a committee for the principal areas in a large institution, but only 1 or 2 additional individuals may be required in a small hospital setting. In any case, the leadership and reporting structure should be established as part of the basic formative documents of the CMA, with all duties and responsibilities of each participant clearly defined.
Facilities Management
Management of the physical and operational aspects of the site of service is a core component of any CMA. While the hospital usually owns the facilities, it is the surgeons who must work within them. The specifics of the physical plant can impact issues such as infection rate, inventory availability, maximum volume levels, and patient perception or satisfaction. The manner in which the facilities management conducts operations is also important; large size and nice equipment do not necessarily translate into efficiency or quality. A CMA should, therefore, have a surgeon or committee whose primary role is to oversee the relevant details of the hospital’s physical and operational issues. These details will include topics such as assignment of operative suites, choices of implants, room turnover, supplies, antibiotic availability, and other matters. Because of their experience and knowledge of the operational effects of administrative decisions, orthopedic surgeons are uniquely positioned to maximize the value of existing facilities and to oversee updates or changes as needed.
Personnel Management
Even in disadvantaged or smaller facilities, maximization of human resources can often overcome challenges of inadequate physical plant or tight finances. Alternatively, poor management of staff can thwart the efforts of even the largest and best-endowed hospitals. Because practicing orthopedists are likely to know the talents and skills of key local personnel from having worked alongside them, surgeons are well suited to help direct placement and management of personnel as part of a CMA. Surgeons can effectively identify behaviors that deserve reward and can identify staff members that refuse to be team players or otherwise do not help meet larger goals. Involvement of surgeons in personnel management also helps speed the ability to have near real-time responsiveness to issues that may arise.
Clinical Data Management
Ultimately, quality metrics become the grading scale for the clinical aspects of the CMA. Selection of appropriate metrics constitutes a foundational element of the overall process and demands meticulous attention to detail.38 Multiple site-specific clinical scoring systems exist in orthopedic surgery, from the International Knee Documentation Committee (IKDC) score for knees to the American Shoulder and Elbow Surgeons (ASES) score for shoulders.45,46 Additional quality metrics exist for more generalized clinical success measurement, such as the Short Form–36 Health Survey (SF-36) score.47 Governmental agencies and other national organizations have also mandated certain clinical metrics through programs such as the Surgical Care Improvement Project (SCIP).48 Once the type and manner of desired clinical data are identified, they must be collected, processed, stored, and evaluated. Surgeon participation in and oversight of clinical data management is crucial, because orthopedists will be the best suited to interpret and apply the data and relevant trends and conclusions.
Financial Data Management
Financial concerns constitute perhaps the strongest driving force behind many of the current reform initiatives and alternative payment options in the health care landscape. For a CMA, financial success must be clearly and constantly measured and displayed for the endeavor to be successful. Since both sides have a large potential for financial gain and loss in a CMA, surgeons and hospitals must ensure that the best-qualified and most dedicated individuals oversee financial issues. Although transparency is important in all areas of a CMA, it is imperative and must be a dominating feature of the arrangement’s financial management. Financial goals, furthermore, must be clearly defined and realistic, with continuous reevaluation as the relationship moves forward. As part of the transparency plan, relevant financial data should be shared and discussed at regular intervals.
Quality and Effectiveness Reporting
An ideal co-management agreement not only reaches its goals of improved patient care and increased financial efficiency, but it can document and report achievement of these goals as well. Just as corporations must report their financial effectiveness to their shareholders, CMAs must report their own overall effectiveness to their respective stakeholders. Payers, patients, providers, and participant hospitals all have a stake in proving that the CMA has been successful—and that it will continue to be successful. Effectiveness reporting becomes the most important element of all, because the ultimate purpose is self-preservation of the CMA. Reporting should document successes and failures in all relevant elements of the arrangement, with a focus on clinical and financial data. Reports should employ both internal and external benchmarks as a means of evaluating results. Most CMAs will have a designated officer or committee tasked with the responsibility for measurement and reporting of quality and effectiveness.26 Clinical and financial data are combined into an overall big picture of the achievements of the CMA.
Conclusion
Co-management arrangements represent a popular current option for physicians and surgeons to increase alignment and achieve the mutually beneficial goals of increased quality and efficiency. In orthopedics, CMAs essentially consist of surgeons and hospital administrators working together to manage the musculoskeletal service line at a hospital. While the details of specific arrangements will vary according to individual situations, certain basic principles and important general operational elements characterize most successful CMAs. Since physician ownership of hospitals is now banned under the Affordable Care Act, CMAs can be seen as a physician-managed hospital within a hospital, with many of the benefits that have historically resulted from physician ownership and participation in management.27,49 As health care reform progresses, CMAs will likely become more widespread, more refined, more effective, and more profitable.
1. Payton B. Physician-hospital relationships: from historical failures to successful “new kids on the block.” J Med Pract Manage. 2012;27(6):359-364.
2. Kauk JR, Bray TJ. Orthopaedist-hospital alignment in a community setting. Clin Orthop. 2013;471(6):1837-1845.
3. Kaufman N. The co-management conundrum. Hosp Health Netw Daily. http://www.hhnmag.com/display/HHN-news-article.dhtml?dcrPath=/templatedata/HF_Common/NewsArticle/data/HHN/Daily/2012/Sep/kaufman092612-3960003111. Published September 26, 2012. Accessed April 22, 2015.
4. The Society of Hospital Medicine’s Co-Management Advisory Panel. A white paper on a guide to hospitalist/orthopedic surgery co-management. www.hospitalmedicine.org/AM/Template.cfm?Section=White_Papers&Template=/CM/ContentDisplay.cfm&ContentID=25864. Accessed April 22, 2015.
5. Bushnell BD, Horton JK, McDonald MF, Robertson PG. Perioperative medical comorbidities in the orthopaedic patient. J Am Acad Orthop Surg. 2008;16(4):216-227.
6. Huddleston JM, Long KH, Naessens JM, et al. Medical and surgical comanagement after elective hip and knee arthroplasty: a randomized, controlled trial. Ann Intern Med. 2004;141(1):26-38.
7. Friedman SM, Mendelson DA, Kates SL, McCann RM. Geriatric co-management of proximal femur fractures: total quality management and protocol-driven care result in better outcomes for a frail patient population. J Am Geriatrics Soc. 2008;56(7):1349-1356.
8. Steckler D, Epstein F, Riner RN. Getting ready for EHR, RHIOs and next-generation co-management agreements. Physician Exec. 2009;35(6):48, 50-42.
9. Danello PF. Clinical co-management: hospitals and oncologists working together. J Oncol Pract. 2006;2(1):21.
10. Schryer CF, Gladkova O, Spafford MM, Lingard L. Co-management in healthcare: negotiating professional boundaries. Discourse Commun. 2007;1(4):452-479.
11. Cantlupe J. Physican alignment in an era of change. HealthLeaders Media: Intell Reps. content.hcpro.com/pdf/content/256536.pdf. Published September 2010. Accessed April 22, 2015.
12. Olson SA, Mather RC 3rd. Understanding how orthopaedic surgery practices generate value for healthcare systems. Clin Orthop. 2013;471(6):1801-1808.
13. Page AE, Butler CA, Bozic KJ. Factors driving physician-hospital alignment in orthopaedic surgery. Clin Orthop. 2013;471(6):1809-1817.
14. Jackson DW. Understand the trend, considerations for hospital-based employment. Orthop Today. http://www.healio.com/orthopedics/business-of-orthopedics/news/print/orthopedics-today/%7Bf955b32f-9209-4f66-91f7-b26eb00d3cfa%7D/understand-the-trend-considerations-for-hospital-based-employment. Published March 2013. Accessed April 22, 2015.
15. Porucznik MA. What is the future of orthopaedics? AAOS Now. 2013;7(1). http://www.aaos.org/news/aaosnow/jan13/advocacy9.asp. Accssed April 22, 2015.
16. Marcus RE, Zenty TF 3rd, Adelman HG. Aligning incentives in orthopaedics: opportunities and challenges - the Case Medical Center experience. Clin Orthop. 2009;467(10):2525-2534.
17. Roche J. AAOS takes stance on bundled payments and gainsharing. AAOS Now. 2009;3(5). http://www.aaos.org/news/aaosnow/may09/reimbursement3.asp. Accessed April 28, 2015.
18. Grogan TJ. Tips for marketing your orthopedic practice. AAOS Now. 2007;1(8). http://www.aaos.org/news/bulletin/oct07/managing7.asp. Accessed April 28, 2015.
19. Bushnell BD. Developing a bundled pricing strategy. AAOS Now. 2014;8(3):16-17. http://www.aaos.org/news/aaosnow/mar14/advocacy1.asp. Accessed April 21, 2015.
20. Accountable care organizations (ACO). Centers for Medicare and Medicaid Services website. http://www.cms.gov/Medicare/Medicare-Fee-for-Service-Payment/ACO/index.html?redirect=/aco. Updated January 6, 2015. Accessed April 22, 2015.
21. Sowers KW, Newman PR, Langdon JC. Evolution of physician-hospital alignment models: a case study of comanagement. Clin Orthop. 2013;471(6):1818-1823.
22. Leahy M. Is a clinical comanagement agreement right for your practice? AAOS Now. 2013;7(7). http://www.aaos.org/news/aaosnow/jul13/managing6.asp. Accessed April 22, 2015.
23. Nahm S. Top 10 features and benefits of co-management arrangements. The Camden Group website. http://www.thecamdengroup.com/thought-leadership/top-ten/top-10-features-and-benefits-of-co-management-arrangements. Published May 2010. Accessed April 22, 2015.
24. Spindler KP, Kuhn JE, Dunn W, Matthews CE, Harrell FE Jr, Dittus RS. Reading and reviewing the orthopaedic literature: a systematic, evidence-based medicine approach. J Am Acad Orthop Surg. 2005;13(4):220-229.
25. Pfeffer J, Sutton RI. Evidence-based management. Harvard Business Rev website. https://hbr.org/2006/01/evidence-based-management/ar/1. Published January 2006. Accessed April 22, 2015.
26. Erickson JC III. What in the world is medical “co-management”? Physicians Pract. http://www.physicianspractice.com/blog/what-world-medical-%E2%80%98co-management%E2%80%99. Published October 14, 2011. Accessed April 22, 2015.
27. Steinmann J. Hospital co-management agreements and surgeon owned distribution: the two most important new models for the private practice orthopedic group. Talk presented at: California Orthopaedic Association Annual Meeting; May 20, 2011; Dana Point, CA. http://www.coa.org/docs/2011-Annual-Meeting/Friday/Steinmann.pdf. Accessed April 22, 2015.
28. Nagele RL. Hospital-physician relationships after national health reform: moving from competition to collaboration. Pa Bar Assoc Q. 2011;82(1):1-15. http://www.postschell.com/site/files/556.pdf. Accessed April 22, 2015.
29. Dyrda L. 5 Benefits and challenges of co-management agreements for orthopedic surgeons. Becker’s Spine Rev. http://www.beckersspine.com/orthopedic-spine-practices-improving-profits/item/2294-5-benefits-and-challenges-of-co-management-agreements-for-orthopedic-surgeons. Published October 21, 2010. Updated November 8, 2010. Accessed April 22, 2015.
30. Aston G. Are you ready for physician co-management? Association for Healthcare Resource & Materials Management website. http://www.ahrmm.org/ahrmm/news_and_issues/strategies_solutions_homepage/nov12_physician_comanagement.jsp. Accessed April 22, 2015.
31. Top 10 lessons learned from “mature” co-management arrangements. The Camden Group website. http://www.thecamdengroup.com/thought-leadership/blog/top-10-lessons-learned-from-mature-co-management-arrangements/. Accessed April 22, 2015.
32. Anderson GD, Brandt AS. Co-management arrangements and their continuing evolution. HealthCare Appraisers, Inc., website. http://www.healthcareappraisers.com/presentations/BVR_Webinar_Co-mgmt_AB_0611.pdf. Published 2011. Accessed April 22, 2015.
33. Colyvas N. Establishing a service line co-management agreement. AAOS Now. March 2013;7(3). http://www.aaos.org/news/aaosnow/mar13/managing1.asp. Accessed April 22, 2015.
34. Safriet SM, Werling K. The evolution of service line co-management relationships with physicians - Key observations on relationships and fair market value. Health Care Appraisers, Inc., website. http://www.healthcareappraisers.com/presentations/HAI-MGW_Co-Management_Presentation.pdf. Published 2014. Accessed April 22, 2015.
35. Bilazarian S. Sunshine act: the intersection of federal law, physicians, and corporate attorneys. Practitioner’s Corner with Dr. Seth Bilazarian. Medscape website. www.medscape.com/viewarticle/821855. Published March 24, 2014. Accessed April 22, 2015.
36. Del Negro PH. Service line co-management arrangements: models and practicalities. ABA Health eSource. 2012;9(2). http://www.americanbar.org/content/newsletter/publications/aba_health_esource_home/aba_health_law_esource_1012_delnegro.html. Published October 2012. Accessed April 22, 2015.
37. Blau ML, Romano DH, Safriet SM. Co-management arrangements in healthcare: complying with regulatory requirements in structuring hospital-physician arrangements. Health Care Appraisers, Inc., website. http://www.healthcareappraisers.com/presentations/Co-Mgmt_Arrangements_Webinar_12-1-09.pdf. Published 2009. Accessed April 22, 2015.
38. Johnson J. 5 things you should know about co-management arrangements. Healthcare Financial Manage. 2011;65(7):74-78, 80.
39. Mertz G. Co-management models can be profitable for physicians. Physicians Pract. http://www.physicianspractice.com/blog/co-management-models-can-be-profitable-physicians. Published May 5, 2013. Accessed April 22, 2015.
40. Gamble M. Co-management agreements 101: basic principles to know. Becker’s Hosp Rev. http://www.beckershospitalreview.com/hospital-transactions-and-valuation/co-management-agreements-101-basic-principles-to-know.html. Published November 28, 2011. Accessed April 22, 2015.
41. Werling K, Carnell H, Szabad M. Regulatory considerations for structuring physician/hospital co-management agreements. Health Care Law Mon. 2010;2010(9):2-6.
42. Punke H. Hospital-physician co-management agreements: how to avoid a major pitfall. Becker’s Hosp Rev. http://www.beckershospitalreview.com/hospital-physician-relationships/hospital-physician-co-management-agreements-how-to-avoid-a-major-pitfall.html. Published November 1, 2013. Accessed April 22, 2015.
43. Burack MR. OIG approves co-management arrangement. Akerman Health Law Rx website. http://www.healthlawrx.com/2013/02/oig-approves-co-management-arrangement-2/. Published February 1, 2013. Accessed April 22, 2015.
44. Greaves C. Five common sense strategies for structuring co-management agreements after advisory opinion 12-22. ABA Health eSource. 2013;9(7). http://www.americanbar.org/content/newsletter/publications/aba_health_esource_home/aba_health_law_esource_1303_greaves.html. Published March 2013. Accessed April 22, 2015.
45. Hefti F, Müller W, Jakob RP, Stäubli HU. Evaluation of knee ligament injuries with the IKDC form. Knee Surg Sports Traumatol Arthrosc. 1993;1(3-4):226-234.
46. Richards RR, An KN, Bigliani LU, et al. A standardized method for the assessment of shoulder function. J Shoulder Elbow Surg. 1994;3(6):347-352.
47. Patel AA, Donegan D, Albert T. The 36-item short form. J Am Acad Orthop Surg. 2007;15(2):126-134.
48. Surgical Care Improvement Project. The Joint Commission website. http://www.jointcommission.org/surgical_care_improvement_project/. Published October 16, 2014. Accessed April 22, 2015.
49. Pennington WT. Emulating a physician-owned hospital. Hosp Health Netw Daily. http://www.hhnmag.com/display/HHN-news-article.dhtml?dcrPath=/templatedata/HF_Common/NewsArticle/data/HHN/Daily/2013/Jul/blog072513-5840005536. Published July 25, 2013. Accessed April 22, 2015.
In the post–Affordable Care Act landscape of American health care, an explosion of alternative payment methods and other creative initiatives has occurred as patients, providers, and payers all seek higher-quality care at lower costs.1 These factors impact every level of the health care system, from large academic medical institutions in major cities to small single hospitals in rural community settings.2 Co-management arrangements are among the many innovative organizational structures that have arisen with the goals of efficiency and quality. For many reasons, a co-management arrangement has specific applicability and appeal in orthopedic surgery, and the popularity of this form of physician–hospital alignment is growing.3
Definition
In health care, and particularly even within orthopedic surgery, the term co-management can have multiple definitions. It can refer to shared responsibility for patient care across service lines—such as the “co-management” by both hospitalists and orthopedic surgeons of elderly patients with multiple chronic medical comorbidities as well as an acute hip fracture or a total knee replacement.4-7 In academic settings, it may refer to the delegation of duties from attending professors to residents in co-managing patients.
In the realm of health care business and finance, however, the term co-management arrangement (CMA) refers to the shared responsibility for a hospital service line by the hospital administration and the physicians involved in that service line. While the basic concept is not necessarily a new one, it is growing in popularity and expanding in scope, creative application, and effectiveness within the current post-reform environment.8 This model of clinical and financial integration has been implemented in multiple different medical subspecialties, from cardiology and oncology to gastroenterology and vision care.9,10 As applied to orthopedic surgery, CMAs create a situation in which orthopedic surgeons participate intimately in the management of the entire musculoskeletal service line, including inpatient and outpatient services. Orthopedics was identified as 1 of the top 3 specialties for clinical CMAs (after cardiology and imaging) in a recent survey of more than 258 hospital executives.11 Because orthopedic surgery represents an extremely profitable service line for most hospitals, it becomes an ideal target for optimization under a CMA because even relatively small percentage increases in efficiency or profitability can pay relatively large dividends for the hospital.12
Under a CMA, the physicians are compensated for their time and efforts, and they provide services across clinical and nonclinical areas. Because orthopedic surgeons are most familiar with the details of their specialty and the unique needs of their patients, they are the best suited to make decisions, both clinical and nonclinical, that impact the provision of that care. The details of individual CMAs will vary based on specific situational factors, but the common goal of improved patient care and greater economic efficiency drive the underlying theme of shared responsibility and physician–hospital alignment.13
A CMA is different from some other recent innovative forms of organizational or financial structure. A CMA is not the same as direct employment14,15 or “pay-for-performance,”16 because both of these methods of physician–hospital alignment lack the incentivized structure of a CMA. While a CMA is similar to a “gainsharing” arrangement because both hospitals and physicians benefit, it has a very different legal structure.17 A CMA also resembles a joint venture, but it differs in its goal of a focus on management roles.18 Bundled-pricing arrangements tend to focus on the end-price of an “episode of care” rather than the system that provides it.19 While CMAs may be more involved than many other forms of organizational structure, a CMA does not have the level of complexity and interaction required for a formal accountable care organization (ACO).20
Principles of Co-Management Arrangements
Because countless variances exist across the country within local and regional orthopedic markets, no single prescription for success exists to guide co-management arrangements for every potential situation.21,22 Several basic principles, however, should characterize any attempted CMA. Without a foundation in these principles, the CMA may risk suboptimal performance or overt failure.
Focus on the Patient
The most basic shared concern of the 2 parties of a CMA (surgeons and hospitals) is the patient. While each side may have different strengths and varying methods of reaching clinical and financial goals, they should be able to agree on the fundamental idea of patient-centered care. Indeed, the patient experience has become a popular buzzword in many areas of medicine,23 and it particularly applies as a foundational principle of CMAs. A focus on the patient does not directly guarantee success, because there are numerous other details and features of a productive CMA. Failure to focus on the patient, however, will lead to problems.
Evidence-Based Decision-Making
As the information age progresses, clinical, operational, and financial decisions are all best made based on data. Over the last 10 years, evidence-based medicine (EBM) has become the norm in orthopedic surgery for the evaluation of techniques, implants, medications, and other treatment options.24 This data-based clinical concept parallels the development of its cousin on the administrative side, evidence-based management.25 Both forms of “EBM” focus on using a synthesis of the best available data to inform decision-making to maximize outcomes. In a CMA, evidence-based decision-making should pervade all aspects of the endeavor.
Physician Leadership
Co-management arrangements cannot succeed with involvement and input exclusively from hospital officials. Physicians must not only participate in these arrangements, but they must take the key leadership roles.26 Physicians can learn relevant skills in business administration much quicker and easier than administrators can gain clinical skill and experience. Therefore, effective CMAs should have appropriately qualified physicians in essential leadership positions whenever possible.27,28
Appropriate Physician Compensation
While physicians may benefit from CMAs in many intangible economic ways, such as increased volume or increased time efficiency, the process of creating and operating a CMA does not inherently generate any revenue for the physicians involved. Indeed, the primary raw materials that an orthopedic surgeon possesses are time and expertise. Investment of an orthopedist’s time and expertise represents utilization of a considerably valuable resource that demands commensurate compensation.29 Hospitals can save exponentially more money through a robust CMA than they might spend for the surgeon’s time and efforts to create it,23 and they should expect returns commensurate with the amount invested.30 Stated simply, the CMA will not work unless physicians are compensated to make it work.
While appropriate compensation for time and effort may seem an obvious and basic element of success for any endeavor, the determination of such compensation for a CMA is fraught with difficulty and danger.3 The primary concern is the calculation of “fair market value” or “commercial reasonableness” of the management services provided by the orthopedic surgeon to the hospital.23,31-33 Any amount perceived as too low may discourage surgeon participation. On the other hand, amounts that exceed fair market value may constitute remuneration that can result in severe federal legal penalties. Any compensation agreement must comply with provisions of the Stark laws and the federal Anti-Kickback Statute, as well as the Civil Monetary Penalties Statute, the more recent Sunshine Act, and other laws.34-37
Consequently, creation of a well-designed compensation plan is thus one of the most critical principles of a CMA.38 Physician compensation for participation in a CMA should focus on 2 major areas—a base payment for time spent in design and management of the arrangement, and a bonus payment for reaching certain predefined quality and efficiency goals through the arrangement.3,22,27,32,34,39 As mentioned above, physicians must, at a minimum, receive fair compensation for their time and efforts. In addition, creation of incentives through a clearly defined, performance-based reward structure can further drive surgeons’ motivation for dedicated effort and creativity.9 It is critical to note that a CMA differs from a gainsharing arrangement because physicians usually do not share a percentage of actual hospital savings under a CMA.31 A gainsharing arrangement, however, usually involves physicians receiving a defined percentage of any real dollar savings created for the hospital through the relationship.17
Transparency
Transparency is a common feature of any business relationship in which 2 distinct entities must work together to achieve a mutual goal. Co-management arrangements are no exception to this rule; multiple experts have identified transparency and trust as foundational elements for success.30,40 To ensure transparency without compromising patient confidentiality, trade secrets, or other valuable restricted information from unnecessary or potentially dangerous exposure, participants in the CMA should develop a transparency plan in the early stages of the relationship. This plan should expressly state exactly what information is to be shared, when, with whom, and in what manner. By balancing information sharing with information security, CMA participants can more comfortably communicate and develop trust.
Reasonable and Modifiable Goals
While the overarching raison d’être of a CMA is to increase efficiency and improve quality, these worthy purposes must be broken down into specific, measurable goals that are unique to each arrangement. These goals should be aggressive enough to make an impact, but they should also be reasonably achievable within a designated period. In many cases, these goals will reflect or follow the regulatory stipulations of various governing bodies, such as the Centers for Medicare and Medicaid Services (CMS) or The Joint Commission.31 Because these entities may frequently change or update their rules (and even their own institutional names!), the CMA must also have a structure that can rapidly respond to alterations in the regulatory landscape.31 The goals should be modifiable and amendable on an as-needed basis with an appropriate vote of the CMA stakeholders, rather than renewable only when the arrangement’s term ends. Without such situational responsiveness, the rapidly undulating world of health care may render the CMA’s goals either laughably low or impossibly high.
Accountability
A CMA must incorporate the concept of accountability throughout its organizational structure. Although this principle will take many different forms and have different applications, it is critical to the effectiveness of a CMA. Traditional hospital management often focuses on financial goals rather than patient-care goals, and physicians must be able to hold management accountable when these goals conflict. A CMA’s legal structure must have elements of accountability and methods of resolving conflict, such as provisions for arbitration or mediation by a designated third party. When goals are not met or if they are exceeded, there must be ways of both disciplining and rewarding those responsible. Ultimately, accountability must be woven into the culture created under the CMA, and this process flows through every element of the agreement, from its contractual legal and leadership structure to its operational and financial logistics.
General Operational Elements of Co-Management Arrangements
While CMAs must be governed by basic principles, they must also involve several general operational elements. The specifics of these elements will vary by situation, but surgeons must consider each in the creation and operation of a CMA.
Legal Structure
Most CMAs involve the creation of a separate legal structural entity that will assume responsibility for management of the hospital’s service line.37,39 This entity often takes the form of a limited liability company (LLC).33 Its members may be all physicians, or it may be jointly owned by the hospital and the physicians.39 The legal structure of the company will depend on state laws and local precedent, and a lawyer with extensive experience in health care law should create it and its governing documents.37 Alternatively, some hospitals may consider directly employing physicians to co-manage a service line, but this simpler model may prove less effective than a true CMA because of the lack of independence for the physicians involved.30,36 Indeed, the maintenance of physician independence is one of the strongest features of a CMA, and it should be carefully protected in the entity’s legal structure.
Like any relationship, a CMA may end, and its creators need to “begin with the end in mind” when creating its formative documents. Physicians should engage expert legal assistance in the structuring of the parts of the contract that govern the unwinding of the agreement. If the CMA performs poorly, or if the hospital becomes insolvent in spite of the CMA, the involved physicians may face liability charges or other legal entanglements. Because the escape clause of the CMA contract may be the doctors’ only shield in such situations, this part of the agreement should be meticulously reviewed by the physicians and by knowledgeable legal counsel.
Legal Compliance
Ultimately, the CMA may implicate federal Stark laws, anti-kickback laws, antitrust laws, Civil Monetary Penalties Statute, the False Claims Act, 501(c)(3) tax exemption rules, and provider-based status rules. These may have severe penalties, including imprisonment, if violated.32,34,36,37 As such, the participants in any arrangement must make certain that the CMA complies with all applicable regulations in both its composition and function.38,41 Participants in CMAs should make all efforts to avoid such legal pitfalls through investigation of safe harbor provisions, special exemptions, and other key features of the relevant laws.37,42 While these regulations will remain in constant flux, governmental regulatory agencies have given guidelines about acceptable structure for CMAs.43,44
For CMAs, a critical feature is the level of participation of the LLC members in the defined activities of the CMA.42 Participation requirements, such as meeting attendance, changes in practice based on defined goals and metrics, and financial contributions, must be included in the operating agreement of the LLC.33 Compliance of all active members with these clearly defined requirements will both improve operations and morale and also decrease legal risk for both the CMA and its individual members.28 Furthermore, certain conduct that may run afoul of regulations should be very specifically prohibited in the member contracts. Such behavior may include pay-for-referral arrangements rather than pay-for-performance, asymmetric income distribution through the LLC, and other activities that limit patient choice.37 The salary and bonus structure must be very carefully designed and monitored, because they can have significant legal implications if not managed correctly. Independent audits should be part of the compliance plan for any CMA, and many authorities recommend limits on the total compensation to physicians as part of a CMA, as well as time limits on the agreement itself.44
Leadership and Reporting Structure
All CMAs should have a medical director who is responsible for the success of the operation. Beneath the medical director, the leadership and reporting structure will vary based on the size of the hospital and the number of surgeons. In some situations, single individuals may assume multiple roles; other situations may dictate the need for many more people. The structure may take the shape of multiple directors and even a committee for the principal areas in a large institution, but only 1 or 2 additional individuals may be required in a small hospital setting. In any case, the leadership and reporting structure should be established as part of the basic formative documents of the CMA, with all duties and responsibilities of each participant clearly defined.
Facilities Management
Management of the physical and operational aspects of the site of service is a core component of any CMA. While the hospital usually owns the facilities, it is the surgeons who must work within them. The specifics of the physical plant can impact issues such as infection rate, inventory availability, maximum volume levels, and patient perception or satisfaction. The manner in which the facilities management conducts operations is also important; large size and nice equipment do not necessarily translate into efficiency or quality. A CMA should, therefore, have a surgeon or committee whose primary role is to oversee the relevant details of the hospital’s physical and operational issues. These details will include topics such as assignment of operative suites, choices of implants, room turnover, supplies, antibiotic availability, and other matters. Because of their experience and knowledge of the operational effects of administrative decisions, orthopedic surgeons are uniquely positioned to maximize the value of existing facilities and to oversee updates or changes as needed.
Personnel Management
Even in disadvantaged or smaller facilities, maximization of human resources can often overcome challenges of inadequate physical plant or tight finances. Alternatively, poor management of staff can thwart the efforts of even the largest and best-endowed hospitals. Because practicing orthopedists are likely to know the talents and skills of key local personnel from having worked alongside them, surgeons are well suited to help direct placement and management of personnel as part of a CMA. Surgeons can effectively identify behaviors that deserve reward and can identify staff members that refuse to be team players or otherwise do not help meet larger goals. Involvement of surgeons in personnel management also helps speed the ability to have near real-time responsiveness to issues that may arise.
Clinical Data Management
Ultimately, quality metrics become the grading scale for the clinical aspects of the CMA. Selection of appropriate metrics constitutes a foundational element of the overall process and demands meticulous attention to detail.38 Multiple site-specific clinical scoring systems exist in orthopedic surgery, from the International Knee Documentation Committee (IKDC) score for knees to the American Shoulder and Elbow Surgeons (ASES) score for shoulders.45,46 Additional quality metrics exist for more generalized clinical success measurement, such as the Short Form–36 Health Survey (SF-36) score.47 Governmental agencies and other national organizations have also mandated certain clinical metrics through programs such as the Surgical Care Improvement Project (SCIP).48 Once the type and manner of desired clinical data are identified, they must be collected, processed, stored, and evaluated. Surgeon participation in and oversight of clinical data management is crucial, because orthopedists will be the best suited to interpret and apply the data and relevant trends and conclusions.
Financial Data Management
Financial concerns constitute perhaps the strongest driving force behind many of the current reform initiatives and alternative payment options in the health care landscape. For a CMA, financial success must be clearly and constantly measured and displayed for the endeavor to be successful. Since both sides have a large potential for financial gain and loss in a CMA, surgeons and hospitals must ensure that the best-qualified and most dedicated individuals oversee financial issues. Although transparency is important in all areas of a CMA, it is imperative and must be a dominating feature of the arrangement’s financial management. Financial goals, furthermore, must be clearly defined and realistic, with continuous reevaluation as the relationship moves forward. As part of the transparency plan, relevant financial data should be shared and discussed at regular intervals.
Quality and Effectiveness Reporting
An ideal co-management agreement not only reaches its goals of improved patient care and increased financial efficiency, but it can document and report achievement of these goals as well. Just as corporations must report their financial effectiveness to their shareholders, CMAs must report their own overall effectiveness to their respective stakeholders. Payers, patients, providers, and participant hospitals all have a stake in proving that the CMA has been successful—and that it will continue to be successful. Effectiveness reporting becomes the most important element of all, because the ultimate purpose is self-preservation of the CMA. Reporting should document successes and failures in all relevant elements of the arrangement, with a focus on clinical and financial data. Reports should employ both internal and external benchmarks as a means of evaluating results. Most CMAs will have a designated officer or committee tasked with the responsibility for measurement and reporting of quality and effectiveness.26 Clinical and financial data are combined into an overall big picture of the achievements of the CMA.
Conclusion
Co-management arrangements represent a popular current option for physicians and surgeons to increase alignment and achieve the mutually beneficial goals of increased quality and efficiency. In orthopedics, CMAs essentially consist of surgeons and hospital administrators working together to manage the musculoskeletal service line at a hospital. While the details of specific arrangements will vary according to individual situations, certain basic principles and important general operational elements characterize most successful CMAs. Since physician ownership of hospitals is now banned under the Affordable Care Act, CMAs can be seen as a physician-managed hospital within a hospital, with many of the benefits that have historically resulted from physician ownership and participation in management.27,49 As health care reform progresses, CMAs will likely become more widespread, more refined, more effective, and more profitable.
1. Payton B. Physician-hospital relationships: from historical failures to successful “new kids on the block.” J Med Pract Manage. 2012;27(6):359-364.
2. Kauk JR, Bray TJ. Orthopaedist-hospital alignment in a community setting. Clin Orthop. 2013;471(6):1837-1845.
3. Kaufman N. The co-management conundrum. Hosp Health Netw Daily. http://www.hhnmag.com/display/HHN-news-article.dhtml?dcrPath=/templatedata/HF_Common/NewsArticle/data/HHN/Daily/2012/Sep/kaufman092612-3960003111. Published September 26, 2012. Accessed April 22, 2015.
4. The Society of Hospital Medicine’s Co-Management Advisory Panel. A white paper on a guide to hospitalist/orthopedic surgery co-management. www.hospitalmedicine.org/AM/Template.cfm?Section=White_Papers&Template=/CM/ContentDisplay.cfm&ContentID=25864. Accessed April 22, 2015.
5. Bushnell BD, Horton JK, McDonald MF, Robertson PG. Perioperative medical comorbidities in the orthopaedic patient. J Am Acad Orthop Surg. 2008;16(4):216-227.
6. Huddleston JM, Long KH, Naessens JM, et al. Medical and surgical comanagement after elective hip and knee arthroplasty: a randomized, controlled trial. Ann Intern Med. 2004;141(1):26-38.
7. Friedman SM, Mendelson DA, Kates SL, McCann RM. Geriatric co-management of proximal femur fractures: total quality management and protocol-driven care result in better outcomes for a frail patient population. J Am Geriatrics Soc. 2008;56(7):1349-1356.
8. Steckler D, Epstein F, Riner RN. Getting ready for EHR, RHIOs and next-generation co-management agreements. Physician Exec. 2009;35(6):48, 50-42.
9. Danello PF. Clinical co-management: hospitals and oncologists working together. J Oncol Pract. 2006;2(1):21.
10. Schryer CF, Gladkova O, Spafford MM, Lingard L. Co-management in healthcare: negotiating professional boundaries. Discourse Commun. 2007;1(4):452-479.
11. Cantlupe J. Physican alignment in an era of change. HealthLeaders Media: Intell Reps. content.hcpro.com/pdf/content/256536.pdf. Published September 2010. Accessed April 22, 2015.
12. Olson SA, Mather RC 3rd. Understanding how orthopaedic surgery practices generate value for healthcare systems. Clin Orthop. 2013;471(6):1801-1808.
13. Page AE, Butler CA, Bozic KJ. Factors driving physician-hospital alignment in orthopaedic surgery. Clin Orthop. 2013;471(6):1809-1817.
14. Jackson DW. Understand the trend, considerations for hospital-based employment. Orthop Today. http://www.healio.com/orthopedics/business-of-orthopedics/news/print/orthopedics-today/%7Bf955b32f-9209-4f66-91f7-b26eb00d3cfa%7D/understand-the-trend-considerations-for-hospital-based-employment. Published March 2013. Accessed April 22, 2015.
15. Porucznik MA. What is the future of orthopaedics? AAOS Now. 2013;7(1). http://www.aaos.org/news/aaosnow/jan13/advocacy9.asp. Accssed April 22, 2015.
16. Marcus RE, Zenty TF 3rd, Adelman HG. Aligning incentives in orthopaedics: opportunities and challenges - the Case Medical Center experience. Clin Orthop. 2009;467(10):2525-2534.
17. Roche J. AAOS takes stance on bundled payments and gainsharing. AAOS Now. 2009;3(5). http://www.aaos.org/news/aaosnow/may09/reimbursement3.asp. Accessed April 28, 2015.
18. Grogan TJ. Tips for marketing your orthopedic practice. AAOS Now. 2007;1(8). http://www.aaos.org/news/bulletin/oct07/managing7.asp. Accessed April 28, 2015.
19. Bushnell BD. Developing a bundled pricing strategy. AAOS Now. 2014;8(3):16-17. http://www.aaos.org/news/aaosnow/mar14/advocacy1.asp. Accessed April 21, 2015.
20. Accountable care organizations (ACO). Centers for Medicare and Medicaid Services website. http://www.cms.gov/Medicare/Medicare-Fee-for-Service-Payment/ACO/index.html?redirect=/aco. Updated January 6, 2015. Accessed April 22, 2015.
21. Sowers KW, Newman PR, Langdon JC. Evolution of physician-hospital alignment models: a case study of comanagement. Clin Orthop. 2013;471(6):1818-1823.
22. Leahy M. Is a clinical comanagement agreement right for your practice? AAOS Now. 2013;7(7). http://www.aaos.org/news/aaosnow/jul13/managing6.asp. Accessed April 22, 2015.
23. Nahm S. Top 10 features and benefits of co-management arrangements. The Camden Group website. http://www.thecamdengroup.com/thought-leadership/top-ten/top-10-features-and-benefits-of-co-management-arrangements. Published May 2010. Accessed April 22, 2015.
24. Spindler KP, Kuhn JE, Dunn W, Matthews CE, Harrell FE Jr, Dittus RS. Reading and reviewing the orthopaedic literature: a systematic, evidence-based medicine approach. J Am Acad Orthop Surg. 2005;13(4):220-229.
25. Pfeffer J, Sutton RI. Evidence-based management. Harvard Business Rev website. https://hbr.org/2006/01/evidence-based-management/ar/1. Published January 2006. Accessed April 22, 2015.
26. Erickson JC III. What in the world is medical “co-management”? Physicians Pract. http://www.physicianspractice.com/blog/what-world-medical-%E2%80%98co-management%E2%80%99. Published October 14, 2011. Accessed April 22, 2015.
27. Steinmann J. Hospital co-management agreements and surgeon owned distribution: the two most important new models for the private practice orthopedic group. Talk presented at: California Orthopaedic Association Annual Meeting; May 20, 2011; Dana Point, CA. http://www.coa.org/docs/2011-Annual-Meeting/Friday/Steinmann.pdf. Accessed April 22, 2015.
28. Nagele RL. Hospital-physician relationships after national health reform: moving from competition to collaboration. Pa Bar Assoc Q. 2011;82(1):1-15. http://www.postschell.com/site/files/556.pdf. Accessed April 22, 2015.
29. Dyrda L. 5 Benefits and challenges of co-management agreements for orthopedic surgeons. Becker’s Spine Rev. http://www.beckersspine.com/orthopedic-spine-practices-improving-profits/item/2294-5-benefits-and-challenges-of-co-management-agreements-for-orthopedic-surgeons. Published October 21, 2010. Updated November 8, 2010. Accessed April 22, 2015.
30. Aston G. Are you ready for physician co-management? Association for Healthcare Resource & Materials Management website. http://www.ahrmm.org/ahrmm/news_and_issues/strategies_solutions_homepage/nov12_physician_comanagement.jsp. Accessed April 22, 2015.
31. Top 10 lessons learned from “mature” co-management arrangements. The Camden Group website. http://www.thecamdengroup.com/thought-leadership/blog/top-10-lessons-learned-from-mature-co-management-arrangements/. Accessed April 22, 2015.
32. Anderson GD, Brandt AS. Co-management arrangements and their continuing evolution. HealthCare Appraisers, Inc., website. http://www.healthcareappraisers.com/presentations/BVR_Webinar_Co-mgmt_AB_0611.pdf. Published 2011. Accessed April 22, 2015.
33. Colyvas N. Establishing a service line co-management agreement. AAOS Now. March 2013;7(3). http://www.aaos.org/news/aaosnow/mar13/managing1.asp. Accessed April 22, 2015.
34. Safriet SM, Werling K. The evolution of service line co-management relationships with physicians - Key observations on relationships and fair market value. Health Care Appraisers, Inc., website. http://www.healthcareappraisers.com/presentations/HAI-MGW_Co-Management_Presentation.pdf. Published 2014. Accessed April 22, 2015.
35. Bilazarian S. Sunshine act: the intersection of federal law, physicians, and corporate attorneys. Practitioner’s Corner with Dr. Seth Bilazarian. Medscape website. www.medscape.com/viewarticle/821855. Published March 24, 2014. Accessed April 22, 2015.
36. Del Negro PH. Service line co-management arrangements: models and practicalities. ABA Health eSource. 2012;9(2). http://www.americanbar.org/content/newsletter/publications/aba_health_esource_home/aba_health_law_esource_1012_delnegro.html. Published October 2012. Accessed April 22, 2015.
37. Blau ML, Romano DH, Safriet SM. Co-management arrangements in healthcare: complying with regulatory requirements in structuring hospital-physician arrangements. Health Care Appraisers, Inc., website. http://www.healthcareappraisers.com/presentations/Co-Mgmt_Arrangements_Webinar_12-1-09.pdf. Published 2009. Accessed April 22, 2015.
38. Johnson J. 5 things you should know about co-management arrangements. Healthcare Financial Manage. 2011;65(7):74-78, 80.
39. Mertz G. Co-management models can be profitable for physicians. Physicians Pract. http://www.physicianspractice.com/blog/co-management-models-can-be-profitable-physicians. Published May 5, 2013. Accessed April 22, 2015.
40. Gamble M. Co-management agreements 101: basic principles to know. Becker’s Hosp Rev. http://www.beckershospitalreview.com/hospital-transactions-and-valuation/co-management-agreements-101-basic-principles-to-know.html. Published November 28, 2011. Accessed April 22, 2015.
41. Werling K, Carnell H, Szabad M. Regulatory considerations for structuring physician/hospital co-management agreements. Health Care Law Mon. 2010;2010(9):2-6.
42. Punke H. Hospital-physician co-management agreements: how to avoid a major pitfall. Becker’s Hosp Rev. http://www.beckershospitalreview.com/hospital-physician-relationships/hospital-physician-co-management-agreements-how-to-avoid-a-major-pitfall.html. Published November 1, 2013. Accessed April 22, 2015.
43. Burack MR. OIG approves co-management arrangement. Akerman Health Law Rx website. http://www.healthlawrx.com/2013/02/oig-approves-co-management-arrangement-2/. Published February 1, 2013. Accessed April 22, 2015.
44. Greaves C. Five common sense strategies for structuring co-management agreements after advisory opinion 12-22. ABA Health eSource. 2013;9(7). http://www.americanbar.org/content/newsletter/publications/aba_health_esource_home/aba_health_law_esource_1303_greaves.html. Published March 2013. Accessed April 22, 2015.
45. Hefti F, Müller W, Jakob RP, Stäubli HU. Evaluation of knee ligament injuries with the IKDC form. Knee Surg Sports Traumatol Arthrosc. 1993;1(3-4):226-234.
46. Richards RR, An KN, Bigliani LU, et al. A standardized method for the assessment of shoulder function. J Shoulder Elbow Surg. 1994;3(6):347-352.
47. Patel AA, Donegan D, Albert T. The 36-item short form. J Am Acad Orthop Surg. 2007;15(2):126-134.
48. Surgical Care Improvement Project. The Joint Commission website. http://www.jointcommission.org/surgical_care_improvement_project/. Published October 16, 2014. Accessed April 22, 2015.
49. Pennington WT. Emulating a physician-owned hospital. Hosp Health Netw Daily. http://www.hhnmag.com/display/HHN-news-article.dhtml?dcrPath=/templatedata/HF_Common/NewsArticle/data/HHN/Daily/2013/Jul/blog072513-5840005536. Published July 25, 2013. Accessed April 22, 2015.
Rationale for Strategic Graft Placement in Anterior Cruciate Ligament Reconstruction: I.D.E.A.L. Femoral Tunnel Position
In the United States, surgeons perform an estimated 200,000 anterior cruciate ligament reconstructions (ACLRs) each year. Over the past decade, there has been a surge in interest in defining anterior cruciate ligament (ACL) anatomy to guide ACLR. With this renewed interest in the anatomical features of the ACL, particularly the insertion site, many authors have advocated an approach for complete or near-complete “footprint restoration” for anatomical ACLR.1,2 Some have recommended a double-bundle (DB) technique that completely “fills” the footprint, but it is seldom used. Others have proposed centralizing the femoral tunnel position within the ACL footprint in the hope of capturing the function of both the anteromedial (AM) and posterolateral (PL) bundles.1,3,4 Indeed, a primary surgical goal of most anatomical ACLR techniques is creation of a femoral tunnel based off the anatomical centrum (center point) of the ACL femoral footprint.3,5 With a single-bundle technique, the femoral socket is localized in the center of the entire footprint; with a DB technique, sockets are created in the centrums of both the AM and PL bundles.
Because of the complex shape of the native ACL, however, the strategy of restoring the femoral footprint with use of either a central tunnel or a DB approach has been challenged. The femoral footprint is 3.5 times larger than the midsubstance of the ACL.6 Detailed anatomical dissections have recently demonstrated that the femoral origin of the ACL has a stout anterior band of fibers with a fanlike extension posteriorly.7 As the ACL fibers extend off the bony footprint, they form a flat, ribbonlike structure 9 to 16 mm wide and only 2 to 4 mm thick.2,8 Within this structure, there is no clear separation of the AM and PL bundles. The presence of this structure makes sense given the anatomical constraints inherent in the notch. Indeed, the space for the native ACL is narrow, as the posterior cruciate ligament (PCL) occupies that largest portion of the notch with the knee in full extension, leaving only a thin, 5-mm slot through which the ACL must pass.9 Therefore, filling the femoral footprint with a tubular ACL graft probably does not reproduce the dynamic 3-dimensional morphology of the ACL.
In light of the discrepancy between the sizes of the femoral footprint and the midsubstance of the native ACL, it seems reasonable that optimizing the position of the ACL femoral tunnel may be more complex than simply centralizing the tunnel within the footprint or attempting to maximize footprint coverage. In this article, we amalgamate the lessons of 4 decades of ACL research into 5 points for strategic femoral tunnel positioning, based on anatomical, histologic, isometric, biomechanical, and clinical data. These points are summarized by the acronym I.D.E.A.L., which refers to placing a femoral tunnel in a position that reproduces the Isometry of the native ACL, that covers the fibers of the Direct insertion histologically, that is Eccentrically located in the anterior (high) and proximal (deep) region of the footprint, that is Anatomical (within the footprint), and that replicates the Low tension-flexion pattern of the native ACL throughout the range of flexion and extension.
1. Anatomy Considerations
In response to study results demonstrating that some transtibial ACLRs were associated with nonanatomical placement of the femoral tunnel—resulting in vertical graft placement, PCL impingement, and recurrent rotational instability10-16—investigators have reexamined both the anatomy of the femoral origin of the native ACL and the ACL graft. Specifically, a large body of research has been devoted to characterizing the osseous landmarks of the femoral origin of the ACL17 and the dimensions of the femoral footprint.3 In addition, authors have supported the concept that the ACL contains 2 functional bundles, AM and PL.5,17 Several osseous landmarks have been identified as defining the boundaries of the femoral footprint. The lateral intercondylar ridge is the most anterior aspect of the femoral footprint and was first defined by Clancy.18 More recently, the lateral bifurcate ridge, which separates the AM and PL bundle insertion sites, was described19 (Figure 1A).
These osseous ridges delineate the location of the femoral footprint. Studies have shown that ACL fibers attach from the lateral intercondylar ridge on the anterior border of the femoral footprint and extend posteriorly to the cartilage of the lateral femoral condyle (Figure 1B).
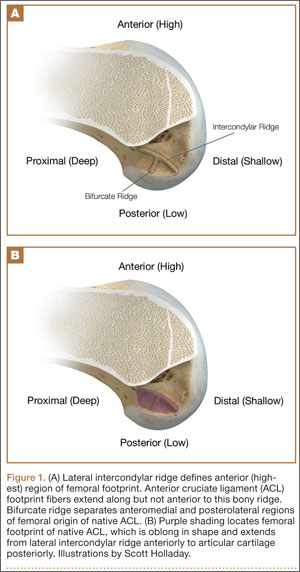
ACL fibers from this oblong footprint are organized such that the midsubstance of the ACL is narrower than the femoral footprint. Anatomical dissections have demonstrated that, though the femoral footprint is oval, the native ACL forms a flat, ribbonlike structure 9 to 16 mm wide and only 2 to 4 mm thick as it takes off from the bone.8,20 There is a resulting discrepancy between the femoral footprint size and shape and the morphology of the native ACL, and placing a tunnel in the center of the footprint or “filling the footprint” with ACL graft may not reproduce the morphology or function of the native ACL. Given this size mismatch, strategic decisions need to be made to place the femoral tunnel in a specific region of the femoral footprint to optimize its function.
2. Histologic Findings
Histologic analysis has further clarified the relationship between the femoral footprint and functional aspects of the native ACL. The femoral origin of the ACL has distinct direct and indirect insertions, as demonstrated by histology and 3-dimensional volume-rendered computed tomography.21 The direct insertion consists of dense collagen fibers anterior in the footprint that is attached to a bony depression immediately posterior to the lateral intercondylar ridge.19 Sasaki and colleagues22 found that these direct fibers extended a mean (SD) of 5.3 (1.1) mm posteriorly but did not continue to the posterior femoral articular cartilage. The indirect insertion consists of more posterior collagen fibers that extend to and blend into the articular cartilage of the posterior aspect of the lateral femoral condyle. Mean (SD) width of this membrane-like tissue, located between the direct insertion and the posterior femoral articular cartilage, was found by Sasaki and colleagues22 to be 4.4 (0.5) mm anteroposteriorly(Figure 2). This anterior band of ACL tissue with the direct insertion histologically corresponds to the fibers in the anterior, more isometric region of the femoral footprint. Conversely, the more posterior band of fibers with its indirect insertion histologically corresponds to the more anisometric region and is seen macroscopically as a fanlike projection extending to the posterior articular cartilage.7

The dense collagen fibers of the direct insertion and the more membrane-like indirect insertion regions of the femoral footprint of the native ACL suggest that these regions have different load-sharing characteristics. The direct fibers of the insertion form a firm, fixed attachment that allows for gradual load distribution into the subchondral bone. From a biomechanical point of view, this attachment is extremely important, a key ligament–bone link transmitting mechanical load to the joint.23 A recent kinematic analysis revealed that the indirect fibers in the posterior region of the footprint, adjacent to the posterior articular cartilage, contribute minimally to restraint of tibial translation and rotations during stability examination.24 This suggests it may be strategically wise to place a tunnel in the direct insertion region of the footprint—eccentrically anterior (high) in the footprint rather than in the centrum.
3. Isometric Considerations
Forty years ago, Artmann and Wirth25 reported that a nearly isometric region existed in the femur such that there is minimal elongation of the native ACL during knee motion. The biomechanical rationale for choosing an isometric region of an ACL graft is that it will maintain function throughout the range of flexion and extension. A nonisometric graft would be expected to slacken during a large portion of the flexion cycle and not restrain anterior translation of the tibia, or, if fixed at the wrong flexion angle, it could capture the knee and cause graft failure by excessive tension. These 2 theoretical undesirable effects from nonisometric graft placement are supported by many experimental and clinical studies demonstrating that nonisometric femoral tunnel placement at time of surgery can cause recurrent anterior laxity of the knee.26-28 Multiple studies have further clarified that the isometric characteristics of an ACL graft are largely determined by femoral positioning. The most isometric region of the femoral footprint is consistently shown to be localized eccentrically within the footprint, in a relatively narrow bandlike region that is proximal (deep) and anterior (along the lateral intercondylar ridge within the footprint)19,29,30 (Figure 3).
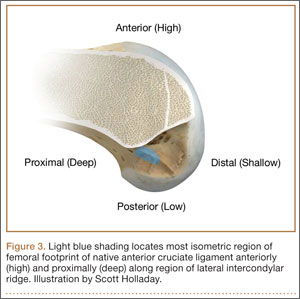
A large body of literature has demonstrated that a tunnel placed in the center of the femoral footprint is less isometric than a tunnel in the more anterior region.25,29,31,32 Indeed, the anterior position (high in the footprint) identified by Hefzy and colleagues29 demonstrated minimal anisometry with 1 to 4 mm of length change through the range of motion. In contrast, a central tunnel would be expected to demonstrate 5 to 7 mm of length change, whereas a lower graft (in the PL region of the footprint) would demonstrate about 1 cm of length change through the range of motion.31,32 As such, central grafts, or grafts placed in the PL portion of the femoral footprint, would be expected to see high tension or graft forces as the knee is flexed, or to lose tension completely if the graft is fixed at full extension.32
Importantly, Markolf and colleagues33 reported that the native ACL does not behave exactly in a so-called isometric fashion during the last 30° of extension. They showed that about 3 mm of retraction of a trial wire into the joint during the last 30° of extension (as measured with an isometer) is reasonable to achieve graft length changes approximating those of the intact ACL. Given this important caveat, a primary goal for ACLR is placement of the femoral tunnel within this isometric region so that the length change in the ACL graft is minimized to 3 mm from 30° to full flexion. In addition, results of a time-zero biomechanical study suggested better rotational control with anatomical femoral tunnel position than with an isometric femoral tunnel34 placed outside the femoral footprint. Therefore, maximizing isometry alone is not the goal; placing the graft in the most isometric region within the anatomical femoral footprint is desired. This isometric region in the footprint is in the histologic region that corresponds to the direct fibers. Again, this region is eccentrically located in the anterior (high) and proximal (deep) portion of the footprint.
4. Biomechanical Considerations
Multiple cadaveric studies have investigated the relationship between femoral tunnel positioning and time-zero stability. These studies often demonstrated superior time-zero control of knee stability, particularly in pivot type maneuvers, with a femoral tunnel placed more centrally in the femoral footprint than with a tunnel placed outside the footprint.34-37 However, an emerging body of literature is finding no significant difference in time-zero stability between an anteriorly placed femoral tunnel within the anatomical footprint (eccentrically located in the footprint) and a centrally placed graft.38,39 Returning to the more isometric tunnel position, still within the femoral footprint, would be expected to confer the benefits of an anatomically based graft position with the advantageous profile of improved isometry, as compared with a centrally placed or PL graft. Biomechanical studies40 have documented that ACL graft fibers placed posteriorly (low) in the footprint cause high graft forces in extension and, in some cases, graft rupture (Figure 4). Accordingly, the importance of reconstructing the posterior region of the footprint to better control time-zero stability is questioned.41
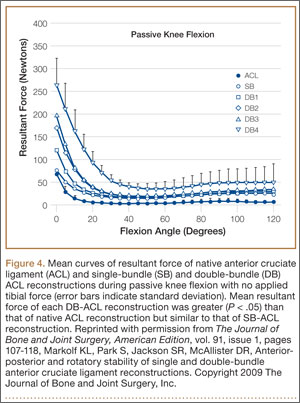
In addition to time-zero control of the stability examination, restoring the low tension-flexion pattern in the ACL graft to replicate the tension-flexion behavior of the native ACL is a fundamental biomechanical principle of ACLR.15,33,42,43 These studies have demonstrated that a femoral tunnel localized anterior (high) and proximal (deep) within the footprint better replicates the tension-flexion behavior of the native ACL, as compared with strategies that attempt to anatomically “fill the footprint.”40 Together, these studies have demonstrated that an eccentric position in the footprint, in the anterior (high) and proximal (deep) region, not only maximizes isometry and restores the direct fibers, but provides favorable time-zero stability and a low tension-flexion pattern biomechanically, particularly as compared with a tunnel in the more central or posterior region of the footprint.
5. Clinical Data
Clinical studies of the traditional transtibial ACLR have shown good results.44,45 However, when the tibial tunnel in the coronal plane was drilled vertical with respect to the medial joint line of the tibia, the transtibially placed femoral tunnel migrated anterior to the anatomical femoral footprint, often on the roof of the notch.10,14 This nonanatomical, vertical placement of the femoral tunnel led to failed normalization of knee kinematics.46-50 Indeed, a higher tension-flexion pattern was found in this nonanatomical “roof” position for the femoral tunnel as compared with the native ACL—a pattern that can result in either loss of flexion or recurrent instability.13,15,51
Clinical results of techniques used to create an anatomical ACLR centrally within the footprint have been mixed. Registry data showed that the revision rate at 4 years was higher with the AM portal technique (5.16%) than with transtibial drilling (3.20%).52 This higher rate may be associated with the more central placement of the femoral tunnel with the AM portal technique than with the transtibial technique, as shown in vivo with high-resolution magnetic resonance imaging.12 Recent reports have documented a higher rate of failure with DB or central ACLR approaches than with traditional transtibial techniques.53 As mentioned, in contrast to a more isometric position, a central femoral tunnel position would be expected to demonstrate 5 to 7 mm of length change, whereas moving the graft more posterior in the footprint (closer to the articular cartilage) would result in more than 1 cm of length change through the range of motion.31,32 As such, these more central grafts, or grafts placed even lower (more posterior) in the footprint, would be expected to see high tension in extension (if fixed in flexion), or to lose tension completely during flexion (if the graft is fixed at full extension).32 This may be a mechanistic cause of the high failure rate in the more posterior bundles of the DB approach.54
Together, these clinical data suggest that the femoral tunnel should be placed within the anatomical footprint of the ACL. However, within the footprint, a more eccentric femoral tunnel position capturing the isometric and direct region of the insertion may be preferable to a more central or posterior (low region) position.
Summary
Anatomical, histologic, isometric, biomechanical, and clinical data from more than 4 decades collectively point to an optimal position for the femoral tunnel within the femoral footprint. This position can be summarized by the acronym I.D.E.A.L., which refers to placing a femoral tunnel in a position that reproduces the Isometry of the native ACL, that covers the fibers of the Direct insertion histologically, that is Eccentrically located in the anterior (high) and proximal (deep) region of the footprint, that is Anatomical (within the footprint), and that replicates the Low tension-flexion pattern of the native ACL throughout the range of flexion and extension (Figure 5).
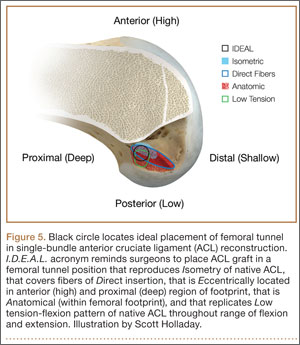
In vivo and in vitro studies as well as surgical experience suggest a need to avoid both (a) the nonanatomical vertical (roof) femoral tunnel placement that causes PCL impingement, high tension in the ACL graft in flexion, and ultimately graft stretch-out with instability and (b) the femoral tunnel placement in the posterior (lowest) region of the footprint that causes high tension in extension and can result in graft stretch-out with instability.13,15,39,40 The transtibial and AM portal techniques can both be effective in properly placing the femoral tunnel and restoring motion, stability, and function to the knee. Their effectiveness, however, depends on correct placement of the femoral tunnel. We think coming studies will focus on single-bundle ACLR and will be designed to improve the reliability of the transtibial and AM portal techniques for placing a femoral tunnel in keeping with the principles summarized by the I.D.E.A.L. acronym.
1. Siebold R. The concept of complete footprint restoration with guidelines for single- and double-bundle ACL reconstruction. Knee Surg Sports Traumatol Arthrosc. 2011;19(5):699-706.
2. Siebold R, Schuhmacher P. Restoration of the tibial ACL footprint area and geometry using the modified insertion site table. Knee Surg Sports Traumatol Arthrosc. 2012;20(9):1845-1849.
3. Piefer JW, Pflugner TR, Hwang MD, Lubowitz JH. Anterior cruciate ligament femoral footprint anatomy: systematic review of the 21st century literature. Arthroscopy. 2012;28(6):872-881.
4. Wilson AJ, Yasen SK, Nancoo T, Stannard R, Smith JO, Logan JS. Anatomic all-inside anterior cruciate ligament reconstruction using the translateral technique. Arthrosc Tech. 2013;2(2):e99-e104.
5. Colombet P, Robinson J, Christel P, et al. Morphology of anterior cruciate ligament attachments for anatomic reconstruction: a cadaveric dissection and radiographic study. Arthroscopy. 2006;22(9):984-992.
6. Harner CD, Baek GH, Vogrin TM, Carlin GJ, Kashiwaguchi S, Woo SL. Quantitative analysis of human cruciate ligament insertions. Arthroscopy. 1999;15(7):741-749.
7. Mochizuki T, Fujishiro H, Nimura A, et al. Anatomic and histologic analysis of the mid-substance and fan-like extension fibres of the anterior cruciate ligament during knee motion, with special reference to the femoral attachment. Knee Surg Sports Traumatol Arthrosc. 2014;22(2):336-344.
8. Siebold R, Schuhmacher P, Fernandez F, et al. Flat midsubstance of the anterior cruciate ligament with tibial “C”-shaped insertion site [published correction appears in Knee Surg Sports Traumatol Arthrosc. 2014 Aug 23. Epub ahead of print]. Knee Surg Sports Traumatol Arthrosc. 2014 May 20. [Epub ahead of print]
9. Triantafyllidi E, Paschos NK, Goussia A, et al. The shape and the thickness of the anterior cruciate ligament along its length in relation to the posterior cruciate ligament: a cadaveric study. Arthroscopy. 2013;29(12):1963-1973.
10. Arnold MP, Kooloos J, van Kampen A. Single-incision technique misses the anatomical femoral anterior cruciate ligament insertion: a cadaver study. Knee Surg Sports Traumatol Arthrosc. 2001;9(4):194-199.
11. Ayerza MA, Múscolo DL, Costa-Paz M, Makino A, Rondón L. Comparison of sagittal obliquity of the reconstructed anterior cruciate ligament with native anterior cruciate ligament using magnetic resonance imaging. Arthroscopy. 2003;19(3):257-261.
12. Bowers AL, Bedi A, Lipman JD, et al. Comparison of anterior cruciate ligament tunnel position and graft obliquity with transtibial and anteromedial portal femoral tunnel reaming techniques using high-resolution magnetic resonance imaging. Arthroscopy. 2011;27(11):1511-1522.
13. Howell SM, Gittins ME, Gottlieb JE, Traina SM, Zoellner TM. The relationship between the angle of the tibial tunnel in the coronal plane and loss of flexion and anterior laxity after anterior cruciate ligament reconstruction. Am J Sports Med. 2001;29(5):567-574.
14. Kopf S, Forsythe B, Wong AK, et al. Nonanatomic tunnel position in traditional transtibial single-bundle anterior cruciate ligament reconstruction evaluated by three-dimensional computed tomography. J Bone Joint Surg Am. 2010;92(6):1427-1431.
15. Simmons R, Howell SM, Hull ML. Effect of the angle of the femoral and tibial tunnels in the coronal plane and incremental excision of the posterior cruciate ligament on tension of an anterior cruciate ligament graft: an in vitro study. J Bone Joint Surg Am. 2003;85(6):1018-1029.
16. Stanford FC, Kendoff D, Warren RF, Pearle AD. Native anterior cruciate ligament obliquity versus anterior cruciate ligament graft obliquity: an observational study using navigated measurements. Am J Sports Med. 2009;37(1):114-119.
17. Ferretti M, Ekdahl M, Shen W, Fu FH. Osseous landmarks of the femoral attachment of the anterior cruciate ligament: an anatomic study. Arthroscopy. 2007;23(11):1218-1225.
18. Hutchinson MR, Ash SA. Resident’s ridge: assessing the cortical thickness of the lateral wall and roof of the intercondylar notch. Arthroscopy. 2003;19(9):931-935.
19. Fu FH, Jordan SS. The lateral intercondylar ridge—a key to anatomic anterior cruciate ligament reconstruction. J Bone Joint Surg Am. 2007;89(10):2103-2104.
20. Smigielski R, Zdanowicz U, Drwięga M, Ciszek B, Ciszkowska-Łysoń B, Siebold R. Ribbon like appearance of the midsubstance fibres of the anterior cruciate ligament close to its femoral insertion site: a cadaveric study including 111 knees. Knee Surg Sports Traumatol Arthrosc. 2014 Jun 28. [Epub ahead of print]
21. Iwahashi T, Shino K, Nakata K, et al. Direct anterior cruciate ligament insertion to the femur assessed by histology and 3-dimensional volume-rendered computed tomography. Arthroscopy. 2010;26(9 suppl):S13-S20.
22. Sasaki N, Ishibashi Y, Tsuda E, et al. The femoral insertion of the anterior cruciate ligament: discrepancy between macroscopic and histological observations. Arthroscopy. 2012;28(8):1135-1146.
23. Benjamin M, Moriggl B, Brenner E, Emery P, McGonagle D, Redman S. The “enthesis organ” concept: why enthesopathies may not present as focal insertional disorders. Arthritis Rheum. 2004;50(10):3306-3313.
24. Pathare NP, Nicholas SJ, Colbrunn R, McHugh MP. Kinematic analysis of the indirect femoral insertion of the anterior cruciate ligament: implications for anatomic femoral tunnel placement. Arthroscopy. 2014;30(11):1430-1438.
25. Artmann M, Wirth CJ. Investigation of the appropriate functional replacement of the anterior cruciate ligament (author’s transl) [in German]. Z Orthop Ihre Grenzgeb. 1974;112(1):160-165.
26. Amis AA, Jakob RP. Anterior cruciate ligament graft positioning, tensioning and twisting. Knee Surg Sports Traumatol Arthrosc. 1998;(6 suppl 1):S2-S12.
27. Beynnon BD, Uh BS, Johnson RJ, Fleming BC, Renström PA, Nichols CE. The elongation behavior of the anterior cruciate ligament graft in vivo. A long-term follow-up study. Am J Sports Med. 2001;29(2):161-166.
28. O’Meara PM, O’Brien WR, Henning CE. Anterior cruciate ligament reconstruction stability with continuous passive motion. The role of isometric graft placement. Clin Orthop. 1992;(277):201-209.
29. Hefzy MS, Grood ES, Noyes FR. Factors affecting the region of most isometric femoral attachments. Part II: the anterior cruciate ligament. Am J Sports Med. 1989;17(2):208-216.
30. Zavras TD, Race A, Bull AM, Amis AA. A comparative study of ‘isometric’ points for anterior cruciate ligament graft attachment. Knee Surg Sports Traumatol Arthrosc. 2001;9(1):28-33.
31. Pearle AD, Shannon FJ, Granchi C, Wickiewicz TL, Warren RF. Comparison of 3-dimensional obliquity and anisometric characteristics of anterior cruciate ligament graft positions using surgical navigation. Am J Sports Med. 2008;36(8):1534-1541.
32. Lubowitz JH. Anatomic ACL reconstruction produces greater graft length change during knee range-of-motion than transtibial technique. Knee Surg Sports Traumatol Arthrosc. 2014;22(5):1190-1195.
33. Markolf KL, Burchfield DM, Shapiro MM, Davis BR, Finerman GA, Slauterbeck JL. Biomechanical consequences of replacement of the anterior cruciate ligament with a patellar ligament allograft. Part I: insertion of the graft and anterior-posterior testing. J Bone Joint Surg Am. 1996;78(11):1720-1727.
34. Musahl V, Plakseychuk A, VanScyoc A, et al. Varying femoral tunnels between the anatomical footprint and isometric positions: effect on kinematics of the anterior cruciate ligament-reconstructed knee. Am J Sports Med. 2005;33(5):712-718.
35. Bedi A, Musahl V, Steuber V, et al. Transtibial versus anteromedial portal reaming in anterior cruciate ligament reconstruction: an anatomic and biomechanical evaluation of surgical technique. Arthroscopy. 2011;27(3):380-390.
36. Lim HC, Yoon YC, Wang JH, Bae JH. Anatomical versus non-anatomical single bundle anterior cruciate ligament reconstruction: a cadaveric study of comparison of knee stability. Clin Orthop Surg. 2012;4(4):249-255.
37. Loh JC, Fukuda Y, Tsuda E, Steadman RJ, Fu FH, Woo SL. Knee stability and graft function following anterior cruciate ligament reconstruction: comparison between 11 o’clock and 10 o’clock femoral tunnel placement. 2002 Richard O’Connor Award paper. Arthroscopy. 2003;19(3):297-304.
38. Cross MB, Musahl V, Bedi A, et al. Anteromedial versus central single-bundle graft position: which anatomic graft position to choose? Knee Surg Sports Traumatol Arthrosc. 2012;20(7):1276-1281.
39. Markolf KL, Jackson SR, McAllister DR. A comparison of 11 o’clock versus oblique femoral tunnels in the anterior cruciate ligament–reconstructed knee: knee kinematics during a simulated pivot test. Am J Sports Med. 2010;38(5):912-917.
40. Markolf KL, Park S, Jackson SR, McAllister DR. Anterior-posterior and rotatory stability of single and double-bundle anterior cruciate ligament reconstructions. J Bone Joint Surg Am. 2009;91(1):107-118.
41. Markolf KL, Park S, Jackson SR, McAllister DR. Contributions of the posterolateral bundle of the anterior cruciate ligament to anterior-posterior knee laxity and ligament forces. Arthroscopy. 2008;24(7):805-809.
42. Markolf KL, Burchfield DM, Shapiro MM, Cha CW, Finerman GA, Slauterbeck JL. Biomechanical consequences of replacement of the anterior cruciate ligament with a patellar ligament allograft. Part II: forces in the graft compared with forces in the intact ligament. J Bone Joint Surg Am. 1996;78(11):1728-1734.
43. Wallace MP, Howell SM, Hull ML. In vivo tensile behavior of a four-bundle hamstring graft as a replacement for the anterior cruciate ligament. J Orthop Res. 1997;15(4):539-545.
44. Harner CD, Marks PH, Fu FH, Irrgang JJ, Silby MB, Mengato R. Anterior cruciate ligament reconstruction: endoscopic versus two-incision technique. Arthroscopy. 1994;10(5):502-512.
45. Howell SM, Deutsch ML. Comparison of endoscopic and two-incision technique for reconstructing a torn anterior cruciate ligament using hamstring tendons. J Arthroscopy. 1999;15(6):594-606.
46. Chouliaras V, Ristanis S, Moraiti C, Stergiou N, Georgoulis AD. Effectiveness of reconstruction of the anterior cruciate ligament with quadrupled hamstrings and bone–patellar tendon–bone autografts: an in vivo study comparing tibial internal–external rotation. Am J Sports Med. 2007;35(2):189-196.
47. Logan MC, Williams A, Lavelle J, Gedroyc W, Freeman M. Tibiofemoral kinematics following successful anterior cruciate ligament reconstruction using dynamic multiple resonance imaging. Am J Sports Med. 2004;32(4):984-992.
48. Papannagari R, Gill TJ, Defrate LE, Moses JM, Petruska AJ, Li G. In vivo kinematics of the knee after anterior cruciate ligament reconstruction: a clinical and functional evaluation. Am J Sports Med. 2006;34(12):2006-2012.
49. Tashman S, Collon D, Anderson K, Kolowich P, Anderst W. Abnormal rotational knee motion during running after anterior cruciate ligament reconstruction. Am J Sports Med. 2004;32(4):975-983.
50. Tashman S, Kolowich P, Collon D, Anderson K, Anderst W. Dynamic function of the ACL-reconstructed knee during running. Clin Orthop. 2007;(454):66-73.
51. Wallace MP, Hull ML, Howell SM. Can an isometer predict the tensile behavior of a double-looped hamstring graft during anterior cruciate ligament reconstruction? J Orthop Res. 1998;16(3):386-393.
52. Rahr-Wagner L, Thillemann TM, Pedersen AB, Lind MC. Increased risk of revision after anteromedial compared with transtibial drilling of the femoral tunnel during primary anterior cruciate ligament reconstruction: results from the Danish Knee Ligament Reconstruction Register. Arthroscopy. 2013;29(1):98-105.
53. van Eck CF, Schkrohowsky JG, Working ZM, Irrgang JJ, Fu FH. Prospective analysis of failure rate and predictors of failure after anatomic anterior cruciate ligament reconstruction with allograft. Am J Sports Med. 2012;40(4):800-807.
54. Ahn JH, Choi SH, Wang JH, Yoo JC, Yim HS, Chang MJ. Outcomes and second-look arthroscopic evaluation after double-bundle anterior cruciate ligament reconstruction with use of a single tibial tunnel. J Bone Joint Surg Am. 2011;93(20):1865-1872.
In the United States, surgeons perform an estimated 200,000 anterior cruciate ligament reconstructions (ACLRs) each year. Over the past decade, there has been a surge in interest in defining anterior cruciate ligament (ACL) anatomy to guide ACLR. With this renewed interest in the anatomical features of the ACL, particularly the insertion site, many authors have advocated an approach for complete or near-complete “footprint restoration” for anatomical ACLR.1,2 Some have recommended a double-bundle (DB) technique that completely “fills” the footprint, but it is seldom used. Others have proposed centralizing the femoral tunnel position within the ACL footprint in the hope of capturing the function of both the anteromedial (AM) and posterolateral (PL) bundles.1,3,4 Indeed, a primary surgical goal of most anatomical ACLR techniques is creation of a femoral tunnel based off the anatomical centrum (center point) of the ACL femoral footprint.3,5 With a single-bundle technique, the femoral socket is localized in the center of the entire footprint; with a DB technique, sockets are created in the centrums of both the AM and PL bundles.
Because of the complex shape of the native ACL, however, the strategy of restoring the femoral footprint with use of either a central tunnel or a DB approach has been challenged. The femoral footprint is 3.5 times larger than the midsubstance of the ACL.6 Detailed anatomical dissections have recently demonstrated that the femoral origin of the ACL has a stout anterior band of fibers with a fanlike extension posteriorly.7 As the ACL fibers extend off the bony footprint, they form a flat, ribbonlike structure 9 to 16 mm wide and only 2 to 4 mm thick.2,8 Within this structure, there is no clear separation of the AM and PL bundles. The presence of this structure makes sense given the anatomical constraints inherent in the notch. Indeed, the space for the native ACL is narrow, as the posterior cruciate ligament (PCL) occupies that largest portion of the notch with the knee in full extension, leaving only a thin, 5-mm slot through which the ACL must pass.9 Therefore, filling the femoral footprint with a tubular ACL graft probably does not reproduce the dynamic 3-dimensional morphology of the ACL.
In light of the discrepancy between the sizes of the femoral footprint and the midsubstance of the native ACL, it seems reasonable that optimizing the position of the ACL femoral tunnel may be more complex than simply centralizing the tunnel within the footprint or attempting to maximize footprint coverage. In this article, we amalgamate the lessons of 4 decades of ACL research into 5 points for strategic femoral tunnel positioning, based on anatomical, histologic, isometric, biomechanical, and clinical data. These points are summarized by the acronym I.D.E.A.L., which refers to placing a femoral tunnel in a position that reproduces the Isometry of the native ACL, that covers the fibers of the Direct insertion histologically, that is Eccentrically located in the anterior (high) and proximal (deep) region of the footprint, that is Anatomical (within the footprint), and that replicates the Low tension-flexion pattern of the native ACL throughout the range of flexion and extension.
1. Anatomy Considerations
In response to study results demonstrating that some transtibial ACLRs were associated with nonanatomical placement of the femoral tunnel—resulting in vertical graft placement, PCL impingement, and recurrent rotational instability10-16—investigators have reexamined both the anatomy of the femoral origin of the native ACL and the ACL graft. Specifically, a large body of research has been devoted to characterizing the osseous landmarks of the femoral origin of the ACL17 and the dimensions of the femoral footprint.3 In addition, authors have supported the concept that the ACL contains 2 functional bundles, AM and PL.5,17 Several osseous landmarks have been identified as defining the boundaries of the femoral footprint. The lateral intercondylar ridge is the most anterior aspect of the femoral footprint and was first defined by Clancy.18 More recently, the lateral bifurcate ridge, which separates the AM and PL bundle insertion sites, was described19 (Figure 1A).
These osseous ridges delineate the location of the femoral footprint. Studies have shown that ACL fibers attach from the lateral intercondylar ridge on the anterior border of the femoral footprint and extend posteriorly to the cartilage of the lateral femoral condyle (Figure 1B).
ACL fibers from this oblong footprint are organized such that the midsubstance of the ACL is narrower than the femoral footprint. Anatomical dissections have demonstrated that, though the femoral footprint is oval, the native ACL forms a flat, ribbonlike structure 9 to 16 mm wide and only 2 to 4 mm thick as it takes off from the bone.8,20 There is a resulting discrepancy between the femoral footprint size and shape and the morphology of the native ACL, and placing a tunnel in the center of the footprint or “filling the footprint” with ACL graft may not reproduce the morphology or function of the native ACL. Given this size mismatch, strategic decisions need to be made to place the femoral tunnel in a specific region of the femoral footprint to optimize its function.
2. Histologic Findings
Histologic analysis has further clarified the relationship between the femoral footprint and functional aspects of the native ACL. The femoral origin of the ACL has distinct direct and indirect insertions, as demonstrated by histology and 3-dimensional volume-rendered computed tomography.21 The direct insertion consists of dense collagen fibers anterior in the footprint that is attached to a bony depression immediately posterior to the lateral intercondylar ridge.19 Sasaki and colleagues22 found that these direct fibers extended a mean (SD) of 5.3 (1.1) mm posteriorly but did not continue to the posterior femoral articular cartilage. The indirect insertion consists of more posterior collagen fibers that extend to and blend into the articular cartilage of the posterior aspect of the lateral femoral condyle. Mean (SD) width of this membrane-like tissue, located between the direct insertion and the posterior femoral articular cartilage, was found by Sasaki and colleagues22 to be 4.4 (0.5) mm anteroposteriorly(Figure 2). This anterior band of ACL tissue with the direct insertion histologically corresponds to the fibers in the anterior, more isometric region of the femoral footprint. Conversely, the more posterior band of fibers with its indirect insertion histologically corresponds to the more anisometric region and is seen macroscopically as a fanlike projection extending to the posterior articular cartilage.7
The dense collagen fibers of the direct insertion and the more membrane-like indirect insertion regions of the femoral footprint of the native ACL suggest that these regions have different load-sharing characteristics. The direct fibers of the insertion form a firm, fixed attachment that allows for gradual load distribution into the subchondral bone. From a biomechanical point of view, this attachment is extremely important, a key ligament–bone link transmitting mechanical load to the joint.23 A recent kinematic analysis revealed that the indirect fibers in the posterior region of the footprint, adjacent to the posterior articular cartilage, contribute minimally to restraint of tibial translation and rotations during stability examination.24 This suggests it may be strategically wise to place a tunnel in the direct insertion region of the footprint—eccentrically anterior (high) in the footprint rather than in the centrum.
3. Isometric Considerations
Forty years ago, Artmann and Wirth25 reported that a nearly isometric region existed in the femur such that there is minimal elongation of the native ACL during knee motion. The biomechanical rationale for choosing an isometric region of an ACL graft is that it will maintain function throughout the range of flexion and extension. A nonisometric graft would be expected to slacken during a large portion of the flexion cycle and not restrain anterior translation of the tibia, or, if fixed at the wrong flexion angle, it could capture the knee and cause graft failure by excessive tension. These 2 theoretical undesirable effects from nonisometric graft placement are supported by many experimental and clinical studies demonstrating that nonisometric femoral tunnel placement at time of surgery can cause recurrent anterior laxity of the knee.26-28 Multiple studies have further clarified that the isometric characteristics of an ACL graft are largely determined by femoral positioning. The most isometric region of the femoral footprint is consistently shown to be localized eccentrically within the footprint, in a relatively narrow bandlike region that is proximal (deep) and anterior (along the lateral intercondylar ridge within the footprint)19,29,30 (Figure 3).
A large body of literature has demonstrated that a tunnel placed in the center of the femoral footprint is less isometric than a tunnel in the more anterior region.25,29,31,32 Indeed, the anterior position (high in the footprint) identified by Hefzy and colleagues29 demonstrated minimal anisometry with 1 to 4 mm of length change through the range of motion. In contrast, a central tunnel would be expected to demonstrate 5 to 7 mm of length change, whereas a lower graft (in the PL region of the footprint) would demonstrate about 1 cm of length change through the range of motion.31,32 As such, central grafts, or grafts placed in the PL portion of the femoral footprint, would be expected to see high tension or graft forces as the knee is flexed, or to lose tension completely if the graft is fixed at full extension.32
Importantly, Markolf and colleagues33 reported that the native ACL does not behave exactly in a so-called isometric fashion during the last 30° of extension. They showed that about 3 mm of retraction of a trial wire into the joint during the last 30° of extension (as measured with an isometer) is reasonable to achieve graft length changes approximating those of the intact ACL. Given this important caveat, a primary goal for ACLR is placement of the femoral tunnel within this isometric region so that the length change in the ACL graft is minimized to 3 mm from 30° to full flexion. In addition, results of a time-zero biomechanical study suggested better rotational control with anatomical femoral tunnel position than with an isometric femoral tunnel34 placed outside the femoral footprint. Therefore, maximizing isometry alone is not the goal; placing the graft in the most isometric region within the anatomical femoral footprint is desired. This isometric region in the footprint is in the histologic region that corresponds to the direct fibers. Again, this region is eccentrically located in the anterior (high) and proximal (deep) portion of the footprint.
4. Biomechanical Considerations
Multiple cadaveric studies have investigated the relationship between femoral tunnel positioning and time-zero stability. These studies often demonstrated superior time-zero control of knee stability, particularly in pivot type maneuvers, with a femoral tunnel placed more centrally in the femoral footprint than with a tunnel placed outside the footprint.34-37 However, an emerging body of literature is finding no significant difference in time-zero stability between an anteriorly placed femoral tunnel within the anatomical footprint (eccentrically located in the footprint) and a centrally placed graft.38,39 Returning to the more isometric tunnel position, still within the femoral footprint, would be expected to confer the benefits of an anatomically based graft position with the advantageous profile of improved isometry, as compared with a centrally placed or PL graft. Biomechanical studies40 have documented that ACL graft fibers placed posteriorly (low) in the footprint cause high graft forces in extension and, in some cases, graft rupture (Figure 4). Accordingly, the importance of reconstructing the posterior region of the footprint to better control time-zero stability is questioned.41
In addition to time-zero control of the stability examination, restoring the low tension-flexion pattern in the ACL graft to replicate the tension-flexion behavior of the native ACL is a fundamental biomechanical principle of ACLR.15,33,42,43 These studies have demonstrated that a femoral tunnel localized anterior (high) and proximal (deep) within the footprint better replicates the tension-flexion behavior of the native ACL, as compared with strategies that attempt to anatomically “fill the footprint.”40 Together, these studies have demonstrated that an eccentric position in the footprint, in the anterior (high) and proximal (deep) region, not only maximizes isometry and restores the direct fibers, but provides favorable time-zero stability and a low tension-flexion pattern biomechanically, particularly as compared with a tunnel in the more central or posterior region of the footprint.
5. Clinical Data
Clinical studies of the traditional transtibial ACLR have shown good results.44,45 However, when the tibial tunnel in the coronal plane was drilled vertical with respect to the medial joint line of the tibia, the transtibially placed femoral tunnel migrated anterior to the anatomical femoral footprint, often on the roof of the notch.10,14 This nonanatomical, vertical placement of the femoral tunnel led to failed normalization of knee kinematics.46-50 Indeed, a higher tension-flexion pattern was found in this nonanatomical “roof” position for the femoral tunnel as compared with the native ACL—a pattern that can result in either loss of flexion or recurrent instability.13,15,51
Clinical results of techniques used to create an anatomical ACLR centrally within the footprint have been mixed. Registry data showed that the revision rate at 4 years was higher with the AM portal technique (5.16%) than with transtibial drilling (3.20%).52 This higher rate may be associated with the more central placement of the femoral tunnel with the AM portal technique than with the transtibial technique, as shown in vivo with high-resolution magnetic resonance imaging.12 Recent reports have documented a higher rate of failure with DB or central ACLR approaches than with traditional transtibial techniques.53 As mentioned, in contrast to a more isometric position, a central femoral tunnel position would be expected to demonstrate 5 to 7 mm of length change, whereas moving the graft more posterior in the footprint (closer to the articular cartilage) would result in more than 1 cm of length change through the range of motion.31,32 As such, these more central grafts, or grafts placed even lower (more posterior) in the footprint, would be expected to see high tension in extension (if fixed in flexion), or to lose tension completely during flexion (if the graft is fixed at full extension).32 This may be a mechanistic cause of the high failure rate in the more posterior bundles of the DB approach.54
Together, these clinical data suggest that the femoral tunnel should be placed within the anatomical footprint of the ACL. However, within the footprint, a more eccentric femoral tunnel position capturing the isometric and direct region of the insertion may be preferable to a more central or posterior (low region) position.
Summary
Anatomical, histologic, isometric, biomechanical, and clinical data from more than 4 decades collectively point to an optimal position for the femoral tunnel within the femoral footprint. This position can be summarized by the acronym I.D.E.A.L., which refers to placing a femoral tunnel in a position that reproduces the Isometry of the native ACL, that covers the fibers of the Direct insertion histologically, that is Eccentrically located in the anterior (high) and proximal (deep) region of the footprint, that is Anatomical (within the footprint), and that replicates the Low tension-flexion pattern of the native ACL throughout the range of flexion and extension (Figure 5).
In vivo and in vitro studies as well as surgical experience suggest a need to avoid both (a) the nonanatomical vertical (roof) femoral tunnel placement that causes PCL impingement, high tension in the ACL graft in flexion, and ultimately graft stretch-out with instability and (b) the femoral tunnel placement in the posterior (lowest) region of the footprint that causes high tension in extension and can result in graft stretch-out with instability.13,15,39,40 The transtibial and AM portal techniques can both be effective in properly placing the femoral tunnel and restoring motion, stability, and function to the knee. Their effectiveness, however, depends on correct placement of the femoral tunnel. We think coming studies will focus on single-bundle ACLR and will be designed to improve the reliability of the transtibial and AM portal techniques for placing a femoral tunnel in keeping with the principles summarized by the I.D.E.A.L. acronym.
1. Siebold R. The concept of complete footprint restoration with guidelines for single- and double-bundle ACL reconstruction. Knee Surg Sports Traumatol Arthrosc. 2011;19(5):699-706.
2. Siebold R, Schuhmacher P. Restoration of the tibial ACL footprint area and geometry using the modified insertion site table. Knee Surg Sports Traumatol Arthrosc. 2012;20(9):1845-1849.
3. Piefer JW, Pflugner TR, Hwang MD, Lubowitz JH. Anterior cruciate ligament femoral footprint anatomy: systematic review of the 21st century literature. Arthroscopy. 2012;28(6):872-881.
4. Wilson AJ, Yasen SK, Nancoo T, Stannard R, Smith JO, Logan JS. Anatomic all-inside anterior cruciate ligament reconstruction using the translateral technique. Arthrosc Tech. 2013;2(2):e99-e104.
5. Colombet P, Robinson J, Christel P, et al. Morphology of anterior cruciate ligament attachments for anatomic reconstruction: a cadaveric dissection and radiographic study. Arthroscopy. 2006;22(9):984-992.
6. Harner CD, Baek GH, Vogrin TM, Carlin GJ, Kashiwaguchi S, Woo SL. Quantitative analysis of human cruciate ligament insertions. Arthroscopy. 1999;15(7):741-749.
7. Mochizuki T, Fujishiro H, Nimura A, et al. Anatomic and histologic analysis of the mid-substance and fan-like extension fibres of the anterior cruciate ligament during knee motion, with special reference to the femoral attachment. Knee Surg Sports Traumatol Arthrosc. 2014;22(2):336-344.
8. Siebold R, Schuhmacher P, Fernandez F, et al. Flat midsubstance of the anterior cruciate ligament with tibial “C”-shaped insertion site [published correction appears in Knee Surg Sports Traumatol Arthrosc. 2014 Aug 23. Epub ahead of print]. Knee Surg Sports Traumatol Arthrosc. 2014 May 20. [Epub ahead of print]
9. Triantafyllidi E, Paschos NK, Goussia A, et al. The shape and the thickness of the anterior cruciate ligament along its length in relation to the posterior cruciate ligament: a cadaveric study. Arthroscopy. 2013;29(12):1963-1973.
10. Arnold MP, Kooloos J, van Kampen A. Single-incision technique misses the anatomical femoral anterior cruciate ligament insertion: a cadaver study. Knee Surg Sports Traumatol Arthrosc. 2001;9(4):194-199.
11. Ayerza MA, Múscolo DL, Costa-Paz M, Makino A, Rondón L. Comparison of sagittal obliquity of the reconstructed anterior cruciate ligament with native anterior cruciate ligament using magnetic resonance imaging. Arthroscopy. 2003;19(3):257-261.
12. Bowers AL, Bedi A, Lipman JD, et al. Comparison of anterior cruciate ligament tunnel position and graft obliquity with transtibial and anteromedial portal femoral tunnel reaming techniques using high-resolution magnetic resonance imaging. Arthroscopy. 2011;27(11):1511-1522.
13. Howell SM, Gittins ME, Gottlieb JE, Traina SM, Zoellner TM. The relationship between the angle of the tibial tunnel in the coronal plane and loss of flexion and anterior laxity after anterior cruciate ligament reconstruction. Am J Sports Med. 2001;29(5):567-574.
14. Kopf S, Forsythe B, Wong AK, et al. Nonanatomic tunnel position in traditional transtibial single-bundle anterior cruciate ligament reconstruction evaluated by three-dimensional computed tomography. J Bone Joint Surg Am. 2010;92(6):1427-1431.
15. Simmons R, Howell SM, Hull ML. Effect of the angle of the femoral and tibial tunnels in the coronal plane and incremental excision of the posterior cruciate ligament on tension of an anterior cruciate ligament graft: an in vitro study. J Bone Joint Surg Am. 2003;85(6):1018-1029.
16. Stanford FC, Kendoff D, Warren RF, Pearle AD. Native anterior cruciate ligament obliquity versus anterior cruciate ligament graft obliquity: an observational study using navigated measurements. Am J Sports Med. 2009;37(1):114-119.
17. Ferretti M, Ekdahl M, Shen W, Fu FH. Osseous landmarks of the femoral attachment of the anterior cruciate ligament: an anatomic study. Arthroscopy. 2007;23(11):1218-1225.
18. Hutchinson MR, Ash SA. Resident’s ridge: assessing the cortical thickness of the lateral wall and roof of the intercondylar notch. Arthroscopy. 2003;19(9):931-935.
19. Fu FH, Jordan SS. The lateral intercondylar ridge—a key to anatomic anterior cruciate ligament reconstruction. J Bone Joint Surg Am. 2007;89(10):2103-2104.
20. Smigielski R, Zdanowicz U, Drwięga M, Ciszek B, Ciszkowska-Łysoń B, Siebold R. Ribbon like appearance of the midsubstance fibres of the anterior cruciate ligament close to its femoral insertion site: a cadaveric study including 111 knees. Knee Surg Sports Traumatol Arthrosc. 2014 Jun 28. [Epub ahead of print]
21. Iwahashi T, Shino K, Nakata K, et al. Direct anterior cruciate ligament insertion to the femur assessed by histology and 3-dimensional volume-rendered computed tomography. Arthroscopy. 2010;26(9 suppl):S13-S20.
22. Sasaki N, Ishibashi Y, Tsuda E, et al. The femoral insertion of the anterior cruciate ligament: discrepancy between macroscopic and histological observations. Arthroscopy. 2012;28(8):1135-1146.
23. Benjamin M, Moriggl B, Brenner E, Emery P, McGonagle D, Redman S. The “enthesis organ” concept: why enthesopathies may not present as focal insertional disorders. Arthritis Rheum. 2004;50(10):3306-3313.
24. Pathare NP, Nicholas SJ, Colbrunn R, McHugh MP. Kinematic analysis of the indirect femoral insertion of the anterior cruciate ligament: implications for anatomic femoral tunnel placement. Arthroscopy. 2014;30(11):1430-1438.
25. Artmann M, Wirth CJ. Investigation of the appropriate functional replacement of the anterior cruciate ligament (author’s transl) [in German]. Z Orthop Ihre Grenzgeb. 1974;112(1):160-165.
26. Amis AA, Jakob RP. Anterior cruciate ligament graft positioning, tensioning and twisting. Knee Surg Sports Traumatol Arthrosc. 1998;(6 suppl 1):S2-S12.
27. Beynnon BD, Uh BS, Johnson RJ, Fleming BC, Renström PA, Nichols CE. The elongation behavior of the anterior cruciate ligament graft in vivo. A long-term follow-up study. Am J Sports Med. 2001;29(2):161-166.
28. O’Meara PM, O’Brien WR, Henning CE. Anterior cruciate ligament reconstruction stability with continuous passive motion. The role of isometric graft placement. Clin Orthop. 1992;(277):201-209.
29. Hefzy MS, Grood ES, Noyes FR. Factors affecting the region of most isometric femoral attachments. Part II: the anterior cruciate ligament. Am J Sports Med. 1989;17(2):208-216.
30. Zavras TD, Race A, Bull AM, Amis AA. A comparative study of ‘isometric’ points for anterior cruciate ligament graft attachment. Knee Surg Sports Traumatol Arthrosc. 2001;9(1):28-33.
31. Pearle AD, Shannon FJ, Granchi C, Wickiewicz TL, Warren RF. Comparison of 3-dimensional obliquity and anisometric characteristics of anterior cruciate ligament graft positions using surgical navigation. Am J Sports Med. 2008;36(8):1534-1541.
32. Lubowitz JH. Anatomic ACL reconstruction produces greater graft length change during knee range-of-motion than transtibial technique. Knee Surg Sports Traumatol Arthrosc. 2014;22(5):1190-1195.
33. Markolf KL, Burchfield DM, Shapiro MM, Davis BR, Finerman GA, Slauterbeck JL. Biomechanical consequences of replacement of the anterior cruciate ligament with a patellar ligament allograft. Part I: insertion of the graft and anterior-posterior testing. J Bone Joint Surg Am. 1996;78(11):1720-1727.
34. Musahl V, Plakseychuk A, VanScyoc A, et al. Varying femoral tunnels between the anatomical footprint and isometric positions: effect on kinematics of the anterior cruciate ligament-reconstructed knee. Am J Sports Med. 2005;33(5):712-718.
35. Bedi A, Musahl V, Steuber V, et al. Transtibial versus anteromedial portal reaming in anterior cruciate ligament reconstruction: an anatomic and biomechanical evaluation of surgical technique. Arthroscopy. 2011;27(3):380-390.
36. Lim HC, Yoon YC, Wang JH, Bae JH. Anatomical versus non-anatomical single bundle anterior cruciate ligament reconstruction: a cadaveric study of comparison of knee stability. Clin Orthop Surg. 2012;4(4):249-255.
37. Loh JC, Fukuda Y, Tsuda E, Steadman RJ, Fu FH, Woo SL. Knee stability and graft function following anterior cruciate ligament reconstruction: comparison between 11 o’clock and 10 o’clock femoral tunnel placement. 2002 Richard O’Connor Award paper. Arthroscopy. 2003;19(3):297-304.
38. Cross MB, Musahl V, Bedi A, et al. Anteromedial versus central single-bundle graft position: which anatomic graft position to choose? Knee Surg Sports Traumatol Arthrosc. 2012;20(7):1276-1281.
39. Markolf KL, Jackson SR, McAllister DR. A comparison of 11 o’clock versus oblique femoral tunnels in the anterior cruciate ligament–reconstructed knee: knee kinematics during a simulated pivot test. Am J Sports Med. 2010;38(5):912-917.
40. Markolf KL, Park S, Jackson SR, McAllister DR. Anterior-posterior and rotatory stability of single and double-bundle anterior cruciate ligament reconstructions. J Bone Joint Surg Am. 2009;91(1):107-118.
41. Markolf KL, Park S, Jackson SR, McAllister DR. Contributions of the posterolateral bundle of the anterior cruciate ligament to anterior-posterior knee laxity and ligament forces. Arthroscopy. 2008;24(7):805-809.
42. Markolf KL, Burchfield DM, Shapiro MM, Cha CW, Finerman GA, Slauterbeck JL. Biomechanical consequences of replacement of the anterior cruciate ligament with a patellar ligament allograft. Part II: forces in the graft compared with forces in the intact ligament. J Bone Joint Surg Am. 1996;78(11):1728-1734.
43. Wallace MP, Howell SM, Hull ML. In vivo tensile behavior of a four-bundle hamstring graft as a replacement for the anterior cruciate ligament. J Orthop Res. 1997;15(4):539-545.
44. Harner CD, Marks PH, Fu FH, Irrgang JJ, Silby MB, Mengato R. Anterior cruciate ligament reconstruction: endoscopic versus two-incision technique. Arthroscopy. 1994;10(5):502-512.
45. Howell SM, Deutsch ML. Comparison of endoscopic and two-incision technique for reconstructing a torn anterior cruciate ligament using hamstring tendons. J Arthroscopy. 1999;15(6):594-606.
46. Chouliaras V, Ristanis S, Moraiti C, Stergiou N, Georgoulis AD. Effectiveness of reconstruction of the anterior cruciate ligament with quadrupled hamstrings and bone–patellar tendon–bone autografts: an in vivo study comparing tibial internal–external rotation. Am J Sports Med. 2007;35(2):189-196.
47. Logan MC, Williams A, Lavelle J, Gedroyc W, Freeman M. Tibiofemoral kinematics following successful anterior cruciate ligament reconstruction using dynamic multiple resonance imaging. Am J Sports Med. 2004;32(4):984-992.
48. Papannagari R, Gill TJ, Defrate LE, Moses JM, Petruska AJ, Li G. In vivo kinematics of the knee after anterior cruciate ligament reconstruction: a clinical and functional evaluation. Am J Sports Med. 2006;34(12):2006-2012.
49. Tashman S, Collon D, Anderson K, Kolowich P, Anderst W. Abnormal rotational knee motion during running after anterior cruciate ligament reconstruction. Am J Sports Med. 2004;32(4):975-983.
50. Tashman S, Kolowich P, Collon D, Anderson K, Anderst W. Dynamic function of the ACL-reconstructed knee during running. Clin Orthop. 2007;(454):66-73.
51. Wallace MP, Hull ML, Howell SM. Can an isometer predict the tensile behavior of a double-looped hamstring graft during anterior cruciate ligament reconstruction? J Orthop Res. 1998;16(3):386-393.
52. Rahr-Wagner L, Thillemann TM, Pedersen AB, Lind MC. Increased risk of revision after anteromedial compared with transtibial drilling of the femoral tunnel during primary anterior cruciate ligament reconstruction: results from the Danish Knee Ligament Reconstruction Register. Arthroscopy. 2013;29(1):98-105.
53. van Eck CF, Schkrohowsky JG, Working ZM, Irrgang JJ, Fu FH. Prospective analysis of failure rate and predictors of failure after anatomic anterior cruciate ligament reconstruction with allograft. Am J Sports Med. 2012;40(4):800-807.
54. Ahn JH, Choi SH, Wang JH, Yoo JC, Yim HS, Chang MJ. Outcomes and second-look arthroscopic evaluation after double-bundle anterior cruciate ligament reconstruction with use of a single tibial tunnel. J Bone Joint Surg Am. 2011;93(20):1865-1872.