User login
Woman, 64, With Eye Pain, Swelling, and Tearing
A 64-year-old woman presented to the clinic with a two-to-three-week history of significant pain, swelling, and excessive tearing of the left eye. The patient had a persistent cough but denied wheezing or shortness of breath.
Medical history was remarkable for uveitis, severe recurrent sinusitis, and allergic rhinitis. The patient reported that she had been exposed to benzene and burning paint fumes about 10 years ago but had no known symptoms or problems at the time.
Vital signs included a temperature of 97.0°F; respiratory rate, 18 breaths/min; pulse, 100 beats/min; and blood pressure, 144/80 mm Hg. Her height was 65 in; weight, 122 lb; and O2 saturation, 100% on room air.
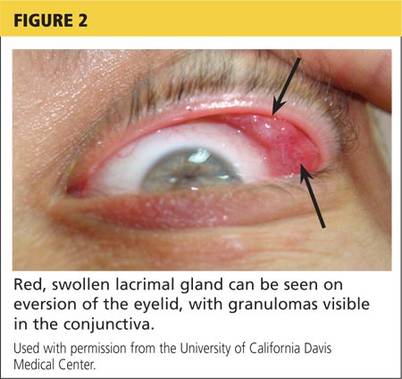
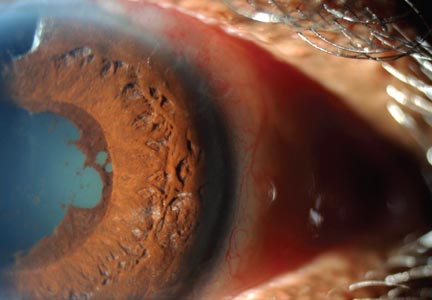
Physical examination revealed a left palpebral lacrimal mass with an enlarged lacrimal gland. The left lacrimal gland and conjunctiva were mildly erythematous, with a cobblestone appearance. The right eye was stable, with no significant inflammation. Pupils were equal, round, and reactive to light and accommodation. Extraocular movements were intact. Nasal turbinates were swollen and mildly erythematous. Oropharynx was stable and tonsils absent. Left parotid gland was slightly swollen and tender.
The neck was supple with no jugular venous distension. Palpable cervical and supraclavicular lymphadenopathy, measuring approximately 1.5 x 1.5 cm bilaterally, was present. The lungs were clear to auscultation and percussion. The heart rate and rhythm were regular, with normal S1 and S2 sounds. The abdomen was soft, nontender, and without hepatosplenomegaly. Extremities were stable, with no rashes, lesions, or cutaneous skin nodules.
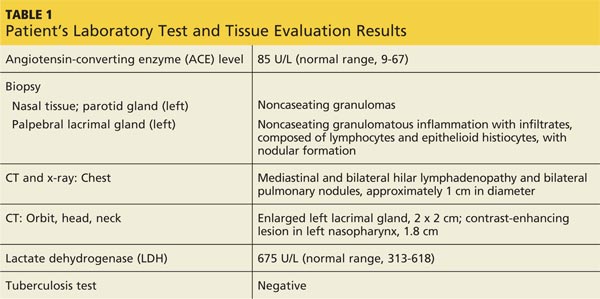
The patient was referred to a specialist for a complete ophthalmologic examination and further work-up. This included a complete blood count, comprehensive metabolic panel, tissue biopsies of the affected lacrimal gland and parotid gland, CT, and x-rays; results are shown in Table 1. In addition, the patient’s persistent nasosinus congestion was determined, by otolaryngologic consultation, to be the result of a deviated septum, for which she underwent endoscopic nasal septal repair with tissue biopsy.
The lacrimal gland biopsy led to a diagnosis of chronic noncaseating granulomatous dacryoadenitis, with an extensive area of necrosis. Significant findings included histiocytes and discrete nodules in the gland. Biopsies of the parotid gland and nasal tissue also identified noncaseating granulomas.
The patient’s test results suggested several possible diagnoses, including
• Granulomatosis with polyangiitis
• Tuberculosis (TB) or similar pulmonary infectious disease
• Sarcoidosis (ocular and/or pulmonary)
Continue for differential diagnosis >>
DISCUSSION
Differential diagnosis
Granulomatosis with polyangiitis. GPA, also known as Wegener granulomatosis, is characterized by necrotizing granulomatous inflammation with necrotizing vasculitis, usually of small and medium vessels; ocular involvement is frequent.1 Ocular granulomas of GPA can be mistaken for those caused by other diseases, such as mycobacterial or syphilitic infection or idiopathic uveitis.2
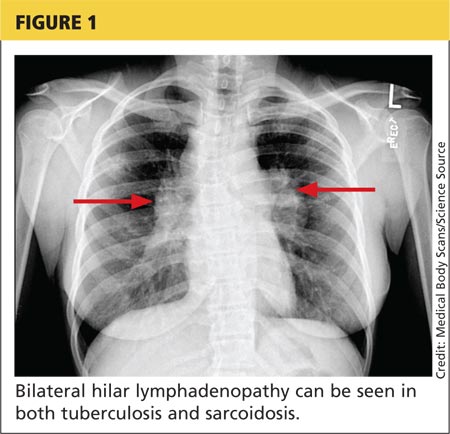
Tuberculosis. Common symptoms of TB include fever, cough, dyspnea, weight loss, malaise, and fatigue. Granulomas are typically necrotizing but are occasionally nonnecrotizing.3 TB can manifest with hilar and diffuse lymphadenopathy,4 which the patient’s chest imaging revealed (see Figure 1). Granulomas produced by Mycobacterium tuberculosis and atypical mycobacteria are similar histopathologically to sarcoidosis granulomas, complicating the diagnostic process.5
Next page: Sarcoidosis >>
Sarcoidosis. Sarcoidosis is a multisystem inflammatory disease characterized by noncaseating epithelioid granulomas in affected organs.6 More than 90% of patients with sarcoidosis present with pulmonary symptoms, including shortness of breath, cough, and pleuritic chest pain.6-8 Ocular manifestations, such as uveitis, iritis, or conjunctivitis, are less common, developing in 30% to 60% of patients.2,9,10 In addition, rashes, lesions, or cutaneous skin nodules, including erythema nodosum and lupus pernio, are seen in 25% to 35% of patients.2,6
In up to two-thirds of patients, sarcoidosis resolves spontaneously2; in others, it may become chronic and progressive.4 Patients may have few or no symptoms; some require no treatment, while others may be severely affected by the disease.
Ocular involvement in sarcoidosis generally manifests as uveitis, most commonly in the anterior chamber. Uveitis is a potentially vision-threatening inflammatory disease involving both the uveal tract and adjacent structures.11 In a review of records for 2,619 patients with uveitis, 59.9% had anterior disease, of whom 2.1% were diagnosed with sarcoidosis.11
While the etiology of sarcoidosis continues to be studied,7 the prevailing theory is that, in genetically predisposed individuals, sarcoidosis is a cell-mediated immune response to as-yet unknown antigen triggers that leads to granuloma formation.3,6,7
CD4+ activated T-cells stimulate the immune reaction against an antigen, producing cytokines that activate immune cells (eg, B cells, macrophages, monocytes, and neutrophils).2 Immune cells accumulate and aggregate at antigen sites in an exaggerated response, resulting in the formation of granulomas (see Figure 2).7,12,13
Infectious agents have long been investigated as possible causative agents in sarcoidosis, with Mycobacterium species most frequently identified.5 Additional possibilities include Propionibacterium acnes (found predominantly in skin lesions) and herpesviruses, although viruses are not known to cause epitheliod granulomas.14
Environmental triggers have also been explored. One large study found a possible association between exposure to insecticides, agricultural environments, and microbial bioaerosols and sarcoidosis.15
The difficulty of pinpointing a single etiology for sarcoidosis—with its varying clinical manifestations, severity, and disease course—suggests that sarcoidosis may be a spectrum of disorders caused by the interaction of genetic, immunologic, infectious, and environmental factors.14
Next page: Diagnosis of sarcoidosis >>
Diagnosis
The diagnosis of sarcoidosis is based on clinical and radiologic features, histologic evidence of noncaseating granulomas, and exclusion of other possible causes of granulomas.2,12 In addition, when ocular sarcoidosis is suspected, other possible causes of uveitis must be excluded.
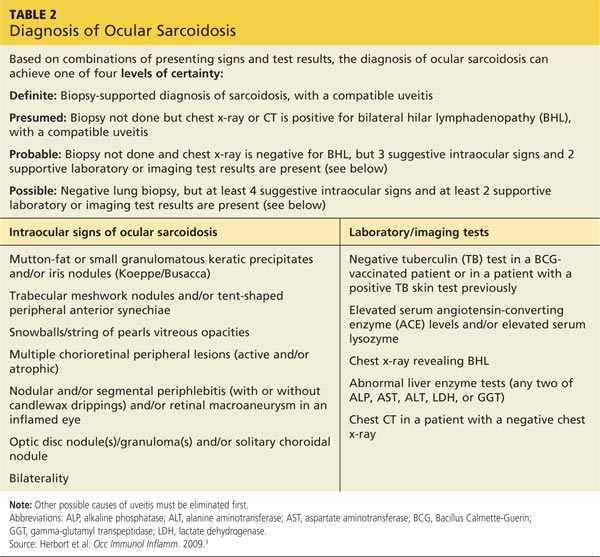
In an effort to address these challenges, the International Workshop on Ocular Sarcoidosis (IWOS) developed a standardized approach to diagnosis.9 The group first identified seven intraocular signs of ocular sarcoidosis and then five laboratory or imaging tests that are of value in making the diagnosis in patients with these signs. Last, they established four levels of certainty for the diagnosis of ocular sarcoidosis, based on these signs, tests, and biopsy results, if available (see Table 2).
Treatment
Anterior uveitis in sarcoidosis is usually treated initially with a topical corticosteroid (eg, prednisolone or difluprednate drops), particularly if the patient’s symptoms are mild. In more severe cases (eg, posterior or bilateral uveitis) or when topical corticosteroids are ineffective, systemic (oral) corticosteroids (eg, prednisone) may be initiated. Topical therapy can also be added to an oral regimen as a means of decreasing the oral dosage and thereby reducing the adverse effects of systemic corticosteroids. When the patient’s disease is refractory to corticosteroids or there are concerns about long-term adverse effects, chronic cases may be treated with immunosuppressive agents (eg, methotrexate, azathioprine, mycophenolate mofetil). Finally, refractory cases of ocular sarcoidosis may be treated with anti–tumor necrosis factor α (TNF-α) biologic agents such as infliximab and adalimumab.10,17
Continue for case patient outcome >>
OUTCOME FOR THE CASE PATIENT
Histologic evaluation of tissue from the lacrimal gland, parotid gland, and sinus cavity revealed inflammatory noncaseating granulomas, strongly suggestive of sarcoidosis. Diagnosis of ocular sarcoidosis was based on the noncaseating granulomas in the lacrimal gland.9,16 Pulmonary sarcoidosis was also diagnosed, based on the presence of hilar and mediastinal lymphadenopathy.7
The mass in the patient’s lacrimal gland was surgically removed. She was treated with a combination of topical and oral corticosteroids tapered over two weeks, which induced remission of her ocular disease. The patient will be seen annually by an ophthalmologic specialist and was advised to contact her clinician immediately if acute ocular symptoms recurred.10,17
The patient’s persistent cough was determined to be secondary to acute bronchitis, rather than to her pulmonary sarcoidosis, which required no treatment. She received a short course of antibiotics and antitussives for her bronchitis. Systemic corticosteroid treatment of her ocular sarcoidosis also had the benefit of decreasing the size of her pulmonary nodules. She will be followed with annual CT and chest x-rays to monitor the status of her hilar and mediastinal lymphadenopathy and the nodules.3 Periodic pulmonary function testing will also be performed.7
Continue for conclusion >>
CONCLUSION
The elusive nature of the diagnosis of sarcoidosis is well documented in the medical literature. In this case, histologic evaluation of biopsied tissue, correlated with clinical symptoms and radiographic findings, were essential in making the diagnosis.
Primary care providers may be the first to evaluate patients with ocular sarcoidosis and will oversee long-term management. Patients who present with symptoms of eye pain, visual disturbances, abnormal inflammatory ocular features, or swollen lacrimal glands should be referred to an ophthalmologic specialist for further evaluation.
REFERENCES
1. Jennette JC, Falk RJ, Bacon PA, et al. 2012 Revised International Chapel Hill Consensus Conference Nomenclature of Vasculitides. Arthritis Rheum. 2013;65(1):1-11.
2. Culver DA. Sarcoidosis. Immunol Allergy Clin North Am. 2012;32(4):487-511.
3. Spagnolo P, Luppi F, Roversi P, et al. Sarcoidosis: challenging diagnostic aspects of an old disease. Am J Med. 2012;125(2):118-125.
4. Dempsey OJ, Peterson EW, Kerr KM, Denison AR. Sarcoidosis. BMJ. 2009;339:620-625.
5. Brownell I, Ramirez-Valle F, Sanchez M, Prystowsky S. Evidence for mycobacteria in sarcoidosis. Am J Respir Cell Mol Biol. 2011;45(5):899-905.
6. Iannuzzi MC, Fontana JR. Sarcoidosis: clinical presentation, immunopathogenesis, and therapeutics. JAMA. 2011;305(4):391-399.
7. Baughman MD, Culver DA, Judson MA. A concise review of pulmonary sarcoidosis. Am J Respir Crit Care Med. 2011;183(5):573-581.
8. Koyama T, Ueda H, Togashi K, et al. Radiologic manifestations of sarcoidosis in various organs. Radiographics. 2004;24(1):87-104.
9. Herbort CP, Rao NA, Mochizuki M; for the Scientific Committee of First International Workshop on Ocular Sarcoidosis. International criteria for the diagnosis of ocular sarcoidosis: results of the first International Workshop on Ocular Sarcoidosis (IWOS). Ocul Immunol Inflamm. 2009; 17(3):160-169.
10. Jamilloux Y, Kodjikian L, Broussolle C, Seve P. Sarcoidosis and uveitis. Autoimmun Rev. 2014;13(8):840-849.
11. Barisani-Asenbauer T, Maca SM, Mejdoubi L, et al. Uveitis—a rare disease often associated with systemic diseases and infections—a systematic review of 2619 patients. Orphanet J Rare Dis. 2012;7:57.
12. Iannuzzi MC, Rybicki BA, Teirstein AS. Sarcoidosis. New Engl J Med. 2007;357(21):2153-2165.
13. Fontenot A, King T. Pathogenesis of sarcoidosis. www.uptodate.com/contents/pathogenesis-of-sarcoidosis?source=search_result&search=Pathogenesis+of+sarcoidosis&selectedTitle=1%7E150. Accessed February 17, 2015.
14. Saidha S, Sotirchos ES, Eckstein C. Etiology of sarcoidosis: does infection play a role? Yale J Biol Med. 2012;85(1):133-141.
15. Newman LS, Rose CS, Bresnitz EA, et al; for the ACCESS Research Group. A case control etiologic study of sarcoidosis. Environmental and occupational risk factors. Am J Respir Crit Care Med. 2004;170:1324-1330.
16. Kawaguchi T, Hanada A, Horie S, et al. Evaluation of characteristic ocular signs and systemic investigations in ocular sarcoidosis patients. Jpn J Opthalmol. 2007;51(2):121-126.
17. Bodaghi B, Touitou V, Fardeau C, et al. Ocular sarcoidosis. Presse Med. 2012;41(6 Pt 2):e349-e354.
A 64-year-old woman presented to the clinic with a two-to-three-week history of significant pain, swelling, and excessive tearing of the left eye. The patient had a persistent cough but denied wheezing or shortness of breath.
Medical history was remarkable for uveitis, severe recurrent sinusitis, and allergic rhinitis. The patient reported that she had been exposed to benzene and burning paint fumes about 10 years ago but had no known symptoms or problems at the time.
Vital signs included a temperature of 97.0°F; respiratory rate, 18 breaths/min; pulse, 100 beats/min; and blood pressure, 144/80 mm Hg. Her height was 65 in; weight, 122 lb; and O2 saturation, 100% on room air.
Physical examination revealed a left palpebral lacrimal mass with an enlarged lacrimal gland. The left lacrimal gland and conjunctiva were mildly erythematous, with a cobblestone appearance. The right eye was stable, with no significant inflammation. Pupils were equal, round, and reactive to light and accommodation. Extraocular movements were intact. Nasal turbinates were swollen and mildly erythematous. Oropharynx was stable and tonsils absent. Left parotid gland was slightly swollen and tender.
The neck was supple with no jugular venous distension. Palpable cervical and supraclavicular lymphadenopathy, measuring approximately 1.5 x 1.5 cm bilaterally, was present. The lungs were clear to auscultation and percussion. The heart rate and rhythm were regular, with normal S1 and S2 sounds. The abdomen was soft, nontender, and without hepatosplenomegaly. Extremities were stable, with no rashes, lesions, or cutaneous skin nodules.
The patient was referred to a specialist for a complete ophthalmologic examination and further work-up. This included a complete blood count, comprehensive metabolic panel, tissue biopsies of the affected lacrimal gland and parotid gland, CT, and x-rays; results are shown in Table 1. In addition, the patient’s persistent nasosinus congestion was determined, by otolaryngologic consultation, to be the result of a deviated septum, for which she underwent endoscopic nasal septal repair with tissue biopsy.
The lacrimal gland biopsy led to a diagnosis of chronic noncaseating granulomatous dacryoadenitis, with an extensive area of necrosis. Significant findings included histiocytes and discrete nodules in the gland. Biopsies of the parotid gland and nasal tissue also identified noncaseating granulomas.
The patient’s test results suggested several possible diagnoses, including
• Granulomatosis with polyangiitis
• Tuberculosis (TB) or similar pulmonary infectious disease
• Sarcoidosis (ocular and/or pulmonary)
Continue for differential diagnosis >>
DISCUSSION
Differential diagnosis
Granulomatosis with polyangiitis. GPA, also known as Wegener granulomatosis, is characterized by necrotizing granulomatous inflammation with necrotizing vasculitis, usually of small and medium vessels; ocular involvement is frequent.1 Ocular granulomas of GPA can be mistaken for those caused by other diseases, such as mycobacterial or syphilitic infection or idiopathic uveitis.2
Tuberculosis. Common symptoms of TB include fever, cough, dyspnea, weight loss, malaise, and fatigue. Granulomas are typically necrotizing but are occasionally nonnecrotizing.3 TB can manifest with hilar and diffuse lymphadenopathy,4 which the patient’s chest imaging revealed (see Figure 1). Granulomas produced by Mycobacterium tuberculosis and atypical mycobacteria are similar histopathologically to sarcoidosis granulomas, complicating the diagnostic process.5
Next page: Sarcoidosis >>
Sarcoidosis. Sarcoidosis is a multisystem inflammatory disease characterized by noncaseating epithelioid granulomas in affected organs.6 More than 90% of patients with sarcoidosis present with pulmonary symptoms, including shortness of breath, cough, and pleuritic chest pain.6-8 Ocular manifestations, such as uveitis, iritis, or conjunctivitis, are less common, developing in 30% to 60% of patients.2,9,10 In addition, rashes, lesions, or cutaneous skin nodules, including erythema nodosum and lupus pernio, are seen in 25% to 35% of patients.2,6
In up to two-thirds of patients, sarcoidosis resolves spontaneously2; in others, it may become chronic and progressive.4 Patients may have few or no symptoms; some require no treatment, while others may be severely affected by the disease.
Ocular involvement in sarcoidosis generally manifests as uveitis, most commonly in the anterior chamber. Uveitis is a potentially vision-threatening inflammatory disease involving both the uveal tract and adjacent structures.11 In a review of records for 2,619 patients with uveitis, 59.9% had anterior disease, of whom 2.1% were diagnosed with sarcoidosis.11
While the etiology of sarcoidosis continues to be studied,7 the prevailing theory is that, in genetically predisposed individuals, sarcoidosis is a cell-mediated immune response to as-yet unknown antigen triggers that leads to granuloma formation.3,6,7
CD4+ activated T-cells stimulate the immune reaction against an antigen, producing cytokines that activate immune cells (eg, B cells, macrophages, monocytes, and neutrophils).2 Immune cells accumulate and aggregate at antigen sites in an exaggerated response, resulting in the formation of granulomas (see Figure 2).7,12,13
Infectious agents have long been investigated as possible causative agents in sarcoidosis, with Mycobacterium species most frequently identified.5 Additional possibilities include Propionibacterium acnes (found predominantly in skin lesions) and herpesviruses, although viruses are not known to cause epitheliod granulomas.14
Environmental triggers have also been explored. One large study found a possible association between exposure to insecticides, agricultural environments, and microbial bioaerosols and sarcoidosis.15
The difficulty of pinpointing a single etiology for sarcoidosis—with its varying clinical manifestations, severity, and disease course—suggests that sarcoidosis may be a spectrum of disorders caused by the interaction of genetic, immunologic, infectious, and environmental factors.14
Next page: Diagnosis of sarcoidosis >>
Diagnosis
The diagnosis of sarcoidosis is based on clinical and radiologic features, histologic evidence of noncaseating granulomas, and exclusion of other possible causes of granulomas.2,12 In addition, when ocular sarcoidosis is suspected, other possible causes of uveitis must be excluded.
In an effort to address these challenges, the International Workshop on Ocular Sarcoidosis (IWOS) developed a standardized approach to diagnosis.9 The group first identified seven intraocular signs of ocular sarcoidosis and then five laboratory or imaging tests that are of value in making the diagnosis in patients with these signs. Last, they established four levels of certainty for the diagnosis of ocular sarcoidosis, based on these signs, tests, and biopsy results, if available (see Table 2).
Treatment
Anterior uveitis in sarcoidosis is usually treated initially with a topical corticosteroid (eg, prednisolone or difluprednate drops), particularly if the patient’s symptoms are mild. In more severe cases (eg, posterior or bilateral uveitis) or when topical corticosteroids are ineffective, systemic (oral) corticosteroids (eg, prednisone) may be initiated. Topical therapy can also be added to an oral regimen as a means of decreasing the oral dosage and thereby reducing the adverse effects of systemic corticosteroids. When the patient’s disease is refractory to corticosteroids or there are concerns about long-term adverse effects, chronic cases may be treated with immunosuppressive agents (eg, methotrexate, azathioprine, mycophenolate mofetil). Finally, refractory cases of ocular sarcoidosis may be treated with anti–tumor necrosis factor α (TNF-α) biologic agents such as infliximab and adalimumab.10,17
Continue for case patient outcome >>
OUTCOME FOR THE CASE PATIENT
Histologic evaluation of tissue from the lacrimal gland, parotid gland, and sinus cavity revealed inflammatory noncaseating granulomas, strongly suggestive of sarcoidosis. Diagnosis of ocular sarcoidosis was based on the noncaseating granulomas in the lacrimal gland.9,16 Pulmonary sarcoidosis was also diagnosed, based on the presence of hilar and mediastinal lymphadenopathy.7
The mass in the patient’s lacrimal gland was surgically removed. She was treated with a combination of topical and oral corticosteroids tapered over two weeks, which induced remission of her ocular disease. The patient will be seen annually by an ophthalmologic specialist and was advised to contact her clinician immediately if acute ocular symptoms recurred.10,17
The patient’s persistent cough was determined to be secondary to acute bronchitis, rather than to her pulmonary sarcoidosis, which required no treatment. She received a short course of antibiotics and antitussives for her bronchitis. Systemic corticosteroid treatment of her ocular sarcoidosis also had the benefit of decreasing the size of her pulmonary nodules. She will be followed with annual CT and chest x-rays to monitor the status of her hilar and mediastinal lymphadenopathy and the nodules.3 Periodic pulmonary function testing will also be performed.7
Continue for conclusion >>
CONCLUSION
The elusive nature of the diagnosis of sarcoidosis is well documented in the medical literature. In this case, histologic evaluation of biopsied tissue, correlated with clinical symptoms and radiographic findings, were essential in making the diagnosis.
Primary care providers may be the first to evaluate patients with ocular sarcoidosis and will oversee long-term management. Patients who present with symptoms of eye pain, visual disturbances, abnormal inflammatory ocular features, or swollen lacrimal glands should be referred to an ophthalmologic specialist for further evaluation.
REFERENCES
1. Jennette JC, Falk RJ, Bacon PA, et al. 2012 Revised International Chapel Hill Consensus Conference Nomenclature of Vasculitides. Arthritis Rheum. 2013;65(1):1-11.
2. Culver DA. Sarcoidosis. Immunol Allergy Clin North Am. 2012;32(4):487-511.
3. Spagnolo P, Luppi F, Roversi P, et al. Sarcoidosis: challenging diagnostic aspects of an old disease. Am J Med. 2012;125(2):118-125.
4. Dempsey OJ, Peterson EW, Kerr KM, Denison AR. Sarcoidosis. BMJ. 2009;339:620-625.
5. Brownell I, Ramirez-Valle F, Sanchez M, Prystowsky S. Evidence for mycobacteria in sarcoidosis. Am J Respir Cell Mol Biol. 2011;45(5):899-905.
6. Iannuzzi MC, Fontana JR. Sarcoidosis: clinical presentation, immunopathogenesis, and therapeutics. JAMA. 2011;305(4):391-399.
7. Baughman MD, Culver DA, Judson MA. A concise review of pulmonary sarcoidosis. Am J Respir Crit Care Med. 2011;183(5):573-581.
8. Koyama T, Ueda H, Togashi K, et al. Radiologic manifestations of sarcoidosis in various organs. Radiographics. 2004;24(1):87-104.
9. Herbort CP, Rao NA, Mochizuki M; for the Scientific Committee of First International Workshop on Ocular Sarcoidosis. International criteria for the diagnosis of ocular sarcoidosis: results of the first International Workshop on Ocular Sarcoidosis (IWOS). Ocul Immunol Inflamm. 2009; 17(3):160-169.
10. Jamilloux Y, Kodjikian L, Broussolle C, Seve P. Sarcoidosis and uveitis. Autoimmun Rev. 2014;13(8):840-849.
11. Barisani-Asenbauer T, Maca SM, Mejdoubi L, et al. Uveitis—a rare disease often associated with systemic diseases and infections—a systematic review of 2619 patients. Orphanet J Rare Dis. 2012;7:57.
12. Iannuzzi MC, Rybicki BA, Teirstein AS. Sarcoidosis. New Engl J Med. 2007;357(21):2153-2165.
13. Fontenot A, King T. Pathogenesis of sarcoidosis. www.uptodate.com/contents/pathogenesis-of-sarcoidosis?source=search_result&search=Pathogenesis+of+sarcoidosis&selectedTitle=1%7E150. Accessed February 17, 2015.
14. Saidha S, Sotirchos ES, Eckstein C. Etiology of sarcoidosis: does infection play a role? Yale J Biol Med. 2012;85(1):133-141.
15. Newman LS, Rose CS, Bresnitz EA, et al; for the ACCESS Research Group. A case control etiologic study of sarcoidosis. Environmental and occupational risk factors. Am J Respir Crit Care Med. 2004;170:1324-1330.
16. Kawaguchi T, Hanada A, Horie S, et al. Evaluation of characteristic ocular signs and systemic investigations in ocular sarcoidosis patients. Jpn J Opthalmol. 2007;51(2):121-126.
17. Bodaghi B, Touitou V, Fardeau C, et al. Ocular sarcoidosis. Presse Med. 2012;41(6 Pt 2):e349-e354.
Hyperthyroidism, Myalgia, Rapidly Progressing Paralysis
A 26-year-old Hispanic woman presented to the emergency department (ED) with myalgia and weakness. The work-up revealed profound hyperthyroidism, with a TSH < 0.01 mIU/mL (normal, 0.4-4.2 mIU/L), potassium 2.4 mEq/L (normal, 3.7-5.2 mEq/L), hypophosphatemia, and low urinary potassium. There were no prior symptoms, and family history was negative for endocrinopathies. She was admitted and started on methimazole (10 mg bid) for thyroid suppression and given propranolol (10 mg bid) for anticipated hyperadrenergic adverse effects. The remainder of her hospital stay was uneventful, and she was discharged six days after admission. Soon after, an outpatient thyroid scan ordered by her primary care provider confirmed that the patient had Graves disease.
Eight months later, the patient returned to the ED with myalgia and rapidly progressing paralysis from the neck down; she was immediately intubated. Her potassium level was 1.2 mEq/L. An ECG revealed conduction abnormalities consistent with hypokalemia.
THE DIAGNOSIS
Based on the patient’s paralysis, hyperthyroidism, and hypokalemia, she was diagnosed with thyrotoxic hypokalemic periodic paralysis (THPP). This rare endocrinopathy causes electrolyte disturbances that can result in paralysis and lethal tachyarrhythmias.1-6
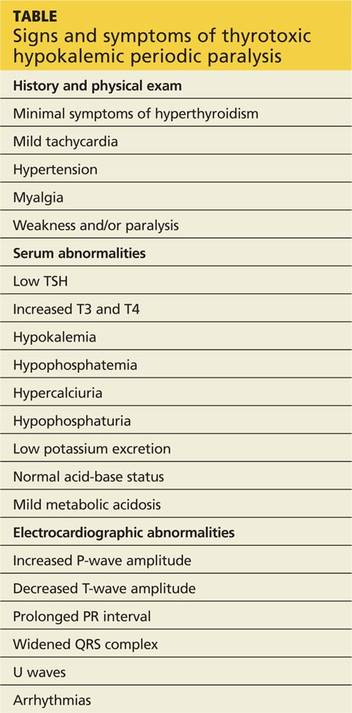
Patients with THPP typically have a history of myalgia, cramping, and stiffness followed by weakness or paralysis that tends to develop rapidly, most commonly in the late evening or early morning (see Table, below).1-9 Proximal muscles are predominantly affected symmetrically, and the attacks usually resolve over a period of hours to several days. Ocular, bulbar, and respiratory muscles are usually spared, but these can be affected by the hypokalemia.1
Continue for discussion of THPP >>
DISCUSSION
Traditionally, THPP has been seen primarily in Asia, with an incidence as high as 2%.1-6 The incidence in the United States is lower (0.1%-0.2%), and THPP occurs primarily in Asian, African, Hispanic, and Native American populations.1,4,6
Although thyrotoxicosis is more common in women, THPP has a predilection for men (20:1).1,3-6 THPP occurs in patients with hyperthyroidism, most commonly from Graves disease,1,6 who are exposed to certain precipitating factors, such as exercise, carbohydrate loading, high-salt diet, excessive alcohol consumption, trauma, cold exposure, infection, menstruation, or emotional stress.1,6 THPP can also occur in people taking medications such as corticosteroids, β2-adrenergic bronchodilators, epinephrine, acetazolamide, insulin, NSAIDs, thyroxine, amiodarone, and tiratricol.1,5,6 THPP is more common in the summer.1
A genetic basis for THPP. A Kir2.6 mutation results in a thyroid hormone-sensitive channelopathy involving the sodium-potassium-adenosine triphosphate (Na+,K+-ATPase) pump, which appears to be responsible for THPP.1-6,8,9 This mutation should not be confused with the pathogenesis of familial periodic paralysis (FPP)—a hereditary disorder resulting in abnormalities in calcium, sodium, and potassium channels on skeletal muscle cells that leads to multiple electrolyte derangements and paralysis identical to that observed in THPP.1
Hypokalemia may be exacerbated by catecholamine-induced potassium shifts.1,4,6 This is from the increased β2-adrenergic stimulation from the concurrent hyperadrenergic state caused by the underlying hyperthyroidism.1,4,6 Hyperinsulinemia from sympathetic stimulation of the insulin-releasing pancreatic beta cells also exacerbates hypokalemia.1,4,6
Continue for treatment options >>
Focus treatment on correcting electrolytes
Initial evaluation of a patient suspected of having THPP should include a complete blood count, TSH measurement, serum and urine electrolyte tests, and an ECG. Further work-up, including ultrasound and scan of the thyroid upon confirmation of thyrotoxicosis and hypokalemia, may be required. Physical examination may reveal thyromegaly. Exophthalmos and other hyperthyroidism symptoms often are absent.1
Diagnosis confirmed? Treat the hypokalemia first. Acute management of THPP centers on electrolyte correction. Total body stores of potassium in patients with THPP are usually normal, so the clinician must use care to avoid excessive potassium administration.1-5 Rebound hyperkalemia can occur in patients who receive > 90 mEq/L of potassium chloride within 24 hours.1
Definitive therapy may include antithyroid medication, radioactive iodine ablation (RIA), and/or thyroidectomy.1-5 All have the common goal of controlling the hyperthyroidism and preventing recurrent paralysis, which occurs in 62.2% of patients within the first three months following diagnosis.3 If antithyroid medications fail, then RIA is the next choice.1 Beta-blockers work by decreasing the Na+,K+-ATPase activity from the underlying hyperadrenergic state.1 Administration of acetazolamide—which is the primary treatment modality for FPP and idiopathic periodic paralysis—can precipitate THPP attacks and is contraindicated.1,5
If medical management is unsuccessful or the patient develops compression symptoms, then thyroidectomy should be considered.3 If the patient chooses thyroidectomy, medical optimization with antithyroid medications is indicated to mitigate the risks of anesthesia. When the thyroidectomy is performed by an experienced thyroid surgeon, the long-term results are excellent.
Case patient. Once this patient’s hypokalemia was corrected, she was successfully extubated. Despite appropriate medical therapy, her hyperthyroidism was poorly controlled. The endocrinologist believed that RIA was suboptimal for three reasons: 1) it might result in incomplete ablation, 2) it required a long treatment period to be effective, and 3) its prolonged course of treatment extended the time interval that the patient would be at risk for recurrent paralysis.
A surgeon was consulted for definitive treatment with thyroidectomy. The patient’s medications were changed to propylthiouracil (150 mg every 8 h) and propranolol (10 mg bid) until a euthyroid state was achieved and she could tolerate a general anesthetic without precipitating a thyroid storm. Two months later, she underwent total thyroidectomy without complication. Her postoperative course was normal.
THE TAKEAWAY
Thyrotoxic hypokalemic periodic paralysis is rare. Patients typically present with myalgia, cramping, and stiffness that progress to paralysis. Prompt electrolyte repletion is paramount for successful outcomes.1-5 Control of hyperthyroidism is the long-term goal.1-5 Definitive therapy can be achieved medically or surgically. Total thyroidectomy is a reasonable treatment option for medically refractory hyperthyroidism or when RIA is contraindicated. Long-term prognosis is excellent.
REFERENCES
1. Lin SH. Thyrotoxic periodic paralysis. Mayo Clin Proc. 2005;80:99-105.
2. Antonello IC, Antonello VS, de Los Santos CA, et al. Thyrotoxic hypokalemic periodic paralysis: a life-threatening syndrome. Eur J Emerg Med. 2009;16:43-44.
3. Lin YC, Wu CW, Chen HC, et al. Surgical treatment for thyrotoxic hypokalemic periodic paralysis: case report. World J Surg Oncol. 2012;10:21.
4. El-Hennawy AS, Nesa M, Mahmood AK. Thyrotoxic hypokalemic periodic paralysis triggered by high carbohydrate diet. Am J Ther. 2007;14: 499-501.
5. Chang CC, Cheng CJ, Sung CC, et al. A 10-year analysis of thyrotoxic periodic paralysis in 135 patients: focus on symptomatology and precipitants. Eur J Endocrinol. 2013;169:529-536.
6. Vijayakumar A, Ashwath G, Thimmappa D. Thyrotoxic periodic paralysis: clinical challenges. J Thyroid Res. 2014;2014:649502.
7. Ray S, Kundu S, Goswami M, et al. An unusual cause of muscle weakness: a diagnostic challenge for clinicians. BMJ Case Rep. 2012;2012.
8. Dassau L, Conti LR, Radeke CM, et al. Kir2.6 regulates the surface expression of Kir2.x inward rectifier potassium channels. J Biol Chem. 2011;286:9526-9541.
9. Ryan DP, da Silva MR, Soong TW, et al. Mutations in potassium channel Kir2.6 cause susceptibility to thyrotoxic hypokalemic periodic paralysis. Cell. 2010;140:88-98.
A 26-year-old Hispanic woman presented to the emergency department (ED) with myalgia and weakness. The work-up revealed profound hyperthyroidism, with a TSH < 0.01 mIU/mL (normal, 0.4-4.2 mIU/L), potassium 2.4 mEq/L (normal, 3.7-5.2 mEq/L), hypophosphatemia, and low urinary potassium. There were no prior symptoms, and family history was negative for endocrinopathies. She was admitted and started on methimazole (10 mg bid) for thyroid suppression and given propranolol (10 mg bid) for anticipated hyperadrenergic adverse effects. The remainder of her hospital stay was uneventful, and she was discharged six days after admission. Soon after, an outpatient thyroid scan ordered by her primary care provider confirmed that the patient had Graves disease.
Eight months later, the patient returned to the ED with myalgia and rapidly progressing paralysis from the neck down; she was immediately intubated. Her potassium level was 1.2 mEq/L. An ECG revealed conduction abnormalities consistent with hypokalemia.
THE DIAGNOSIS
Based on the patient’s paralysis, hyperthyroidism, and hypokalemia, she was diagnosed with thyrotoxic hypokalemic periodic paralysis (THPP). This rare endocrinopathy causes electrolyte disturbances that can result in paralysis and lethal tachyarrhythmias.1-6
Patients with THPP typically have a history of myalgia, cramping, and stiffness followed by weakness or paralysis that tends to develop rapidly, most commonly in the late evening or early morning (see Table, below).1-9 Proximal muscles are predominantly affected symmetrically, and the attacks usually resolve over a period of hours to several days. Ocular, bulbar, and respiratory muscles are usually spared, but these can be affected by the hypokalemia.1
Continue for discussion of THPP >>
DISCUSSION
Traditionally, THPP has been seen primarily in Asia, with an incidence as high as 2%.1-6 The incidence in the United States is lower (0.1%-0.2%), and THPP occurs primarily in Asian, African, Hispanic, and Native American populations.1,4,6
Although thyrotoxicosis is more common in women, THPP has a predilection for men (20:1).1,3-6 THPP occurs in patients with hyperthyroidism, most commonly from Graves disease,1,6 who are exposed to certain precipitating factors, such as exercise, carbohydrate loading, high-salt diet, excessive alcohol consumption, trauma, cold exposure, infection, menstruation, or emotional stress.1,6 THPP can also occur in people taking medications such as corticosteroids, β2-adrenergic bronchodilators, epinephrine, acetazolamide, insulin, NSAIDs, thyroxine, amiodarone, and tiratricol.1,5,6 THPP is more common in the summer.1
A genetic basis for THPP. A Kir2.6 mutation results in a thyroid hormone-sensitive channelopathy involving the sodium-potassium-adenosine triphosphate (Na+,K+-ATPase) pump, which appears to be responsible for THPP.1-6,8,9 This mutation should not be confused with the pathogenesis of familial periodic paralysis (FPP)—a hereditary disorder resulting in abnormalities in calcium, sodium, and potassium channels on skeletal muscle cells that leads to multiple electrolyte derangements and paralysis identical to that observed in THPP.1
Hypokalemia may be exacerbated by catecholamine-induced potassium shifts.1,4,6 This is from the increased β2-adrenergic stimulation from the concurrent hyperadrenergic state caused by the underlying hyperthyroidism.1,4,6 Hyperinsulinemia from sympathetic stimulation of the insulin-releasing pancreatic beta cells also exacerbates hypokalemia.1,4,6
Continue for treatment options >>
Focus treatment on correcting electrolytes
Initial evaluation of a patient suspected of having THPP should include a complete blood count, TSH measurement, serum and urine electrolyte tests, and an ECG. Further work-up, including ultrasound and scan of the thyroid upon confirmation of thyrotoxicosis and hypokalemia, may be required. Physical examination may reveal thyromegaly. Exophthalmos and other hyperthyroidism symptoms often are absent.1
Diagnosis confirmed? Treat the hypokalemia first. Acute management of THPP centers on electrolyte correction. Total body stores of potassium in patients with THPP are usually normal, so the clinician must use care to avoid excessive potassium administration.1-5 Rebound hyperkalemia can occur in patients who receive > 90 mEq/L of potassium chloride within 24 hours.1
Definitive therapy may include antithyroid medication, radioactive iodine ablation (RIA), and/or thyroidectomy.1-5 All have the common goal of controlling the hyperthyroidism and preventing recurrent paralysis, which occurs in 62.2% of patients within the first three months following diagnosis.3 If antithyroid medications fail, then RIA is the next choice.1 Beta-blockers work by decreasing the Na+,K+-ATPase activity from the underlying hyperadrenergic state.1 Administration of acetazolamide—which is the primary treatment modality for FPP and idiopathic periodic paralysis—can precipitate THPP attacks and is contraindicated.1,5
If medical management is unsuccessful or the patient develops compression symptoms, then thyroidectomy should be considered.3 If the patient chooses thyroidectomy, medical optimization with antithyroid medications is indicated to mitigate the risks of anesthesia. When the thyroidectomy is performed by an experienced thyroid surgeon, the long-term results are excellent.
Case patient. Once this patient’s hypokalemia was corrected, she was successfully extubated. Despite appropriate medical therapy, her hyperthyroidism was poorly controlled. The endocrinologist believed that RIA was suboptimal for three reasons: 1) it might result in incomplete ablation, 2) it required a long treatment period to be effective, and 3) its prolonged course of treatment extended the time interval that the patient would be at risk for recurrent paralysis.
A surgeon was consulted for definitive treatment with thyroidectomy. The patient’s medications were changed to propylthiouracil (150 mg every 8 h) and propranolol (10 mg bid) until a euthyroid state was achieved and she could tolerate a general anesthetic without precipitating a thyroid storm. Two months later, she underwent total thyroidectomy without complication. Her postoperative course was normal.
THE TAKEAWAY
Thyrotoxic hypokalemic periodic paralysis is rare. Patients typically present with myalgia, cramping, and stiffness that progress to paralysis. Prompt electrolyte repletion is paramount for successful outcomes.1-5 Control of hyperthyroidism is the long-term goal.1-5 Definitive therapy can be achieved medically or surgically. Total thyroidectomy is a reasonable treatment option for medically refractory hyperthyroidism or when RIA is contraindicated. Long-term prognosis is excellent.
REFERENCES
1. Lin SH. Thyrotoxic periodic paralysis. Mayo Clin Proc. 2005;80:99-105.
2. Antonello IC, Antonello VS, de Los Santos CA, et al. Thyrotoxic hypokalemic periodic paralysis: a life-threatening syndrome. Eur J Emerg Med. 2009;16:43-44.
3. Lin YC, Wu CW, Chen HC, et al. Surgical treatment for thyrotoxic hypokalemic periodic paralysis: case report. World J Surg Oncol. 2012;10:21.
4. El-Hennawy AS, Nesa M, Mahmood AK. Thyrotoxic hypokalemic periodic paralysis triggered by high carbohydrate diet. Am J Ther. 2007;14: 499-501.
5. Chang CC, Cheng CJ, Sung CC, et al. A 10-year analysis of thyrotoxic periodic paralysis in 135 patients: focus on symptomatology and precipitants. Eur J Endocrinol. 2013;169:529-536.
6. Vijayakumar A, Ashwath G, Thimmappa D. Thyrotoxic periodic paralysis: clinical challenges. J Thyroid Res. 2014;2014:649502.
7. Ray S, Kundu S, Goswami M, et al. An unusual cause of muscle weakness: a diagnostic challenge for clinicians. BMJ Case Rep. 2012;2012.
8. Dassau L, Conti LR, Radeke CM, et al. Kir2.6 regulates the surface expression of Kir2.x inward rectifier potassium channels. J Biol Chem. 2011;286:9526-9541.
9. Ryan DP, da Silva MR, Soong TW, et al. Mutations in potassium channel Kir2.6 cause susceptibility to thyrotoxic hypokalemic periodic paralysis. Cell. 2010;140:88-98.
Press Releases That Go Too Far
When patients read about scientific findings, it’s often news that is “exaggerated, sensationalistic, or alarmist,” charge researchers from Cardiff University and Swansea University, both in the United Kingdom, and University of New South Wales and University of Wollongong, both in Australia. But who is responsible for the information inflation? Journalists? Media outlets? Actually, most of the inflation does not originate with the media, the researchers discovered, but was “already present in the text of the press releases produced by academics and their establishments.”
The researchers evaluated 462 biomedical and health-related university press releases from 2011, looking for such things as advice to readers to change behavior, causal statements drawn from correlational results, and inference to humans from animal research.
They found that 33% to 40% of biomedical and health-related press releases contained exaggerated statements compared with the corresponding peer-reviewed journal articles.
Related: Searching for Information the Circadian Way
Moreover, when the press releases contained exaggeration, it was 6.5 times more likely that the resulting news items would be exaggerated as well, the researchers say (95% confidence interval [CI], 3.5-12.4). But when the releases did not contain exaggeration, the rates of exaggeration in the news went down significantly (95% CI, 28%-53%).
One reason for hyperbolic press releases might be the belief that they generate news interest. Contrary to that expectation, the researchers found, the proportion of press releases with ≥ 1 associated news story did not differ significantly between those with exaggeration and those without (odds ratio, 1.3).
Another fear is that including caveats and justifications—such as “The scientists who carried out the study emphasized that they could not say for certain…”—would reduce news uptake. But in fact, the researchers found caveats to causal statements were actually associated with higher uptake (69% vs 51%).
Related: Assessment of Health Literacy as a Predictor of Asthma Exacerbation
The researchers hasten to explain they are not arguing that accurate or even cautious press release claims are enough to help readers make well-informed health choices. And they also discourage the urge to blame journalists and the university press officers. The researchers point out that most of the press releases studied were drafted by press officers in dialogue with scientists who signed off on them before publication.
Source
Sumner P, Vivian-Griffiths S, Boivin J, et al. BMJ. 2014;349:g7015.
doi: 10.1136/bmj.g7015.
Timely Assessment of Cancer Symptoms
When monitoring the quality of cancer care, the severity of symptoms is an important factor to consider. But assessments often rely on what the symptoms are like at one time point, such as the baseline interview at diagnosis or hospice admission, even though symptom severity changes rapidly in cancer patients, especially as the patient approaches death, say researchers from University of Toronto in Canada. They suggest that using repeated assessments at varying time points could both help improve care and predict the risk of death more closely.
Related: Personal Counseling Helps Prevent Cancer-Related Malnutrition
They designed a longitudinal study of 66,112 outpatients, with > 310,000 assessments of symptoms. Using patient symptom reports from the Edmonton Symptom Assessment System (ESAS), the researchers compared a model using a time-varying covariate for each symptom with one that used only a time-fixed (baseline) covariate for each symptom. The median follow-up period was about 19 months, with a median of 3 assessments per patient and a median of 1.16 months between each assessment. Each assessment covered 9 symptom scores: fatigue, appetite, well-being, drowsiness, pain, shortness of breath, anxiety, depression, and nausea.
Related: Probiotics for Radiation-Caused Diarrhea
The repeated assessments improved predictions for risk of death. The strongest predictors were increased pain, fatigue, and reduced appetite. As symptoms became more severe, the hazard of death increased significantly. For example, at any given time, a patient with a severe pain score had about 2 times the risk of death compared with a patient with no pain. Similarly, among patients with breast cancer, a woman with the worst appetite score had 3.66 times the risk of death compared with a woman with the best appetite score.
Though shortness of breath was a predictor among women with breast cancer, the researchers found no associations between shortness of breath and risk of death in patients with lung cancer. (This could be because shortness of breath is well managed in these patients, the researchers note.) They also found no significant associations between depression and death, overall, or by any of the cancer types.
Related: Do Age and Gender Matter in Colorectal Cancer?
The researchers encourage recording measurements on symptom scores over time, at each visit, using paper-based visual scales or electronic surveys. The information about changing symptoms could prompt interventions such as exercise for fatigue and nutritional support for anorexia. On the other hand, worsening pain, fatigue, and appetite may be unavoidable, the researchers say, and a “flag for impending death”—in which case, a more timely assessment might sooner identify patients in need of palliative care.
Source
Sutradhar R, Atzema C, Seow H, Earle C, Porter J, Barbera L. J Pain Symptom Manage. 2014;48(6):1041-1049.
doi: 10.1016/j.jpainsymman.2014.02.012.
Attention-Deficit/Hyperactivity Disorder in a VA Polytrauma Clinic
Traumatic brain injury (TBI) and posttraumatic stress disorder (PTSD) are considered the signature injuries in veterans of the military operations in Iraq and Afghanistan.1 In 2007, the VA implemented the Polytrauma System of Care (PSC) to provide comprehensive screening, evaluation, and treatment of these multifaceted injuries.2,3 The VA defined polytrauma as “two or more injuries to physical regions or organ systems, one of which may be life threatening, resulting in physical, cognitive, psychological, or psychosocial impairments and functional disability.”3 The VA intended the PSC to provide a national system of integrated care to meet the unique needs of these combat service members.
In addition to the comprehensive evaluation and treatment of traumatic injuries, a critical mission of the PSC is to facilitate the reintegration of injured combat veterans into their home communities. Optimal community reintegration requires that the clinician also assess premorbid comorbidities, which may affect postdeployment adjustments. Attention-deficit/hyperactivity disorder (ADHD), with an estimated adult prevalence of 4.4% in the U.S. and 2.5% to 3.4% worldwide, is a common disorder in the general adult population that often is associated with chronic social and vocational adjustment difficulties.4-6 The increasing recognition that this disorder often persists into adulthood is of significance to veterans, largely young and male, who have left military service and are reintegrating into college and community job settings.7 Despite growing interest in adult ADHD, little is known about its prevalence and correlates in the veteran population.
The prevalence of ADHD in the Operation Enduring Freedom/Operation Iraqi Freedom/Operation New Dawn (OEF/OIF/OND) veteran polytrauma population has not been adequately studied. Studies have found that combat veterans with or without confirmed TBI diagnosis commonly have similar overlapping symptoms, such as memory problems, difficulty concentrating, poor attention, and sleep problems associated with other comorbidities such as pain, PTSD, ADHD, and other mental health diagnoses.8-14 Increased awareness of various clinical variables would enhance understanding of the population characteristics and specific needs for education and management.
Related: Preparing the Military Health System for the 21st Century
To begin to address the lack of information about ADHD in the VA polytrauma population, this study aimed to (1) identify the prevalence of ADHD in veterans referred to the Clement J. Zablocki (CJZ) VAMC Polytrauma Clinic (PC) in Milwaukee, Wisconsin; (2) describe demographic characteristics of polytrauma veterans with ADHD; (3) determine the comorbidity relationship between ADHD and TBI, PTSD, depression and anxiety disorders, and substance abuse; and (4) determine whether individuals with ADHD compared with those without ADHD report more physical and emotional symptomatic distress with particular attention given to reports of pain, headaches, and problems with attention and concentration, memory, and sleep.
Methods
The study population consisted of 690 OEF/OIF/OND soldiers and veterans who received a comprehensive TBI evaluation in the CJZVAMC PC from January 1, 2008, to December 31, 2012. Referrals to the PC were made by primary care physicians (PCPs) when OEF/OIF/OND veterans or service members enrolled at a VA facility for health care or transferred their care from another VA facility.
Either a prior diagnosis of TBI established by a qualified provider or positive responses to a 4-question screening tool for TBI prompted a referral to the PC. The 4 questions sought to establish (1) events that may increase risk of TBIs; (2) immediate symptoms following the event; (3) new or worsening symptoms following the event; and (4) current symptoms.1 Referrals to the clinic most commonly came from PCPs at the CJZVAMC and its associated community-based outpatient clinics but occasionally came from mental health service providers.
Study Design
The CJZVAMC Institutional Review Board approved this study. A population database was developed from a review of medical records, clinical interviews of patients, and completion of standard intake forms during the veterans’ initial evaluations in the CJZVAMC PC. The database aimed to abstract patient information relevant for understanding and treating the population seen in the clinic. The database contained information related to demographics, injury parameters, neurobehavioral and PTSD symptoms, past and current mental health disorders, substance abuse history, pain symptoms, and developmental history (eg, ADHD, learning disability).
Related: First Brain Wave Test to Diagnose ADHD
Prior to the PC intake interview, each veteran completed a packet of preclinic questionnaires that included information concerning deployment-related injury exposure and history; the 22-item Neurobehavioral Symptom Inventory (NSI), which assessed physical, cognitive, and emotional symptoms; current pain symptoms; and the Posttraumatic Stress Disorder Checklist-Civilian Version (PCLC).15,16 Intake interviews in the CJZVAMC PC were typically conducted with a minimum of 2 specialties present (physical medicine/rehabilitation and neuropsychology) and occasionally as many as 4 specialties present (also including health psychology and social work). Data collection and abstraction for the database were derived by all specialties present and assisted by the polytrauma program technician.
Diagnoses
The diagnosis of ADHD in a veteran was established through 1 of 2 methods: (1) report of a developmental history of behavioral adjustment difficulties consistent with ADHD that was coupled with formal psychiatric diagnosis and recommended treatment of ADHD in childhood; or (2) current diagnosis of ADHD as identified in the veteran’s active problem list. In most cases of report of developmental diagnosis, the veteran reported having been diagnosed and having received treatment with a stimulant medication for a period of time. In a few cases, the veteran reported having been diagnosed and stimulant medication was recommended, but the veteran’s parents declined the pharmacologic treatment in favor of behavioral treatment strategies.
In cases of current diagnosis, Diagnostic and Statistical Manual of Mental Disorders, Text Revision, 4th Edition (DSM-IV-TR), criteria were applied and supported by formal clinical examinations for ADHD conducted by psychologists, psychiatrists or neuropsychologists, or through VA disability (Compensation and Pension) evaluations where an issue related to ADHD diagnosis was raised.17 There was considerable overlap between these 2 diagnostic criteria (ie, through report of developmental history of diagnosis or formal adult evaluation) with 93% of cases being positive on both diagnostic methods.
Other comorbid psychiatric (eg, depression, anxiety, PTSD, substance abuse) and medical (eg, headache, pain) conditions also were abstracted from the veteran’s medical records at the time of the intake evaluation. Documentation of these conditions was derived from the veteran’s problem list and clinical notes that identified the condition as a diagnostic conclusion or focus of treatment. The comorbid conditions were not otherwise independently documented. Many veterans were taking psychotropic medications for mood, sleep, or chronic pain problems at the time of evaluation in the PC; however, use of medication and their effects were not systematically evaluated.
Statistical Analysis
In addition to documentation of the population prevalence for ADHD, analysis for disproportionate prevalence of comorbid conditions in individuals with ADHD compared with those without ADHD was done through the use of the chi-square test and/or Fisher exact test. For continuous variables, t tests were used to compare individuals with ADHD with individuals without ADHD. To control family-wise type I error to a P value of .05, a false discovery rate (FDR) was applied to studies of demographics, comorbidities, and ratings of symptomatic distress.
Results
The general population characteristics of the 690 veterans and soldiers are summarized in Table 1. The sample was predominantly male (96%), white (88%), and ranged in age from 22 to 55 years with a mean of 28 years. Active-duty service members and reservists from the U.S. Army, Marines, Navy, and Air Force were represented, but most were Army veterans (72%). Most (63%) had a high school education. About two-thirds of the veterans had a single deployment, and the remaining had multiple deployments.

The TBI clinic evaluations found that 58% of the patients had ≥ 1 TBI during their deployments, almost exclusively mild in severity. Seventy-three patients met study criteria for ADHD: 69 with an identified history of diagnosis in childhood and 68 with a current diagnosis, with 93% overlap of these groups. Table 2 provides a breakdown of demographic characteristics, comorbidities, and symptomatic distress in veterans with ADHD compared with those without the diagnosis.

Demographic Characteristics
Veterans with ADHD were found to be slightly younger (2.3 years younger, P = .003) and to have less education (greater frequency of less than high school and high school only, P = .003) compared with those who did not have the diagnosis. No significant group differences in sex, employment/school status, marital status, or number of deployments were identified in veterans with ADHD compared with non-ADHD veterans. Individuals with ADHD did not experience more physical, emotional, or sexual abuse as children than did their non-ADHD counterparts. The prevalence of TBI during deployment was similar in veterans with ADHD compared with that of non-ADHD veterans. There was a trend for veterans with ADHD to have more TBIs prior to military service than in non-ADHD veterans; however, this trend did not reach statistical significance (P = .188).
Comorbidities
After application of the FDR threshold, veterans with ADHD did not show a disproportionate prevalence of mental health diagnoses (eg, PTSD, depression and anxiety disorders, or substance abuse). There was a nonsignificant trend for more veterans with ADHD to report pain during the previous 30 days (P = .035) and more issues with substance abuse (P = .10) than for non-ADHD veterans, but these trends did not meet the FDR threshold of < .05.
Symptomatic Distress
Veterans with ADHD did not report significantly greater levels of distress on either the NSI or the PCLC survey compared with non-ADHD veterans.Not surprisingly, when select symptoms were investigated, veterans with ADHD reported more problems with attention and concentration than for non-ADHD veterans (P = .015). No group differences were identified for sleep issues, headaches, or memory, although there was a trend for the latter (P = .14).
Discussion
In this study, there was a 10.6% prevalence of ADHD in 690 OEF/OIF/OND combat veterans. This rate is considerably higher than estimates of prevalence of ADHD in adults (4.4%) made from a nationwide survey and worldwide prevalence estimates of 2.5% to 3.5%.4-6 Still, the current prevalence finding is consistent with a recent finding of ADHD in previous deploying U.S. soldiers military samples (10.4%).18 The high prevalence of ADHD in the current clinic population argues for increased provider awareness of this condition as a possible factor in postdeployment adjustment assessments.
Changes in prevalence estimates of ADHD may represent increased awareness of the condition over this interval of time, professional drift in the application of diagnostic criteria, or changes in societal attitudes about acceptability in pursuing treatment for the condition. For example, in nationwide surveys in 2003, 2007, and 2011, the CDC identified an increase from 7.8% to 9.5% to 11%, respectively, in diagnoses of ADHD in childhood.19 Also, considering that the current sample was predominantly male and the prevalence of ADHD in males is higher than in females, one might expect a higher ADHD prevalence rate in this study than that in the general population. In this regard, the ADHD prevalence rate in males remains comparable to that estimated by recent CDC survey data.19
When estimating ADHD population prevalence in the future, it is worth noting that a change in the diagnostic criteria for ADHD has occurred in DSM-5. Specifically, the age at which critical symptoms must be present to make the diagnosis of ADHD has been increased from age 7 years to age 12 years, and the number of critical symptoms to meet hyperactivity-impulsivity criteria has been lowered from 6 to 5 in older adolescents and adults.20 These changes in the diagnostic criteria for ADHD will have the net effect of increasing estimates of prevalence of ADHD.
The 73 individuals with an ADHD diagnoses in this study were found to have less education and be slightly younger than were the veterans who did not have an ADHD diagnosis. This finding is not unexpected, as individuals with ADHD are known to struggle in school and often drop out of high school and pursue alternative means of getting an equivalency degree or certification.21 Early departure from high school can be followed by earlier enlistment in the military. Prior studies by Krauss and colleagues found similar findings in an ADHD study of military recruits (ie, they were less likely to have education beyond a high school degree).7
ADHD and TBI
Given problems with attention, impulsivity, and high levels of aggressive behaviors associated with ADHD, individuals with ADHD have been found to be at higher risk for accidental injuries, including TBI, than are individuals without ADHD.21,22 Thus, soldiers with ADHD may be at greater risk for TBI during their time in the military. In the current sample, although veterans with ADHD showed a trend toward having more TBIs prior to joining the military relative to non-ADHD veterans, the veterans with ADHD had a similar rate of TBIs during their time in the military relative to non-ADHD veterans.
Although individuals with ADHD are reported to have a higher prevalence of mental health issues than does the general public, this was not evident in the current sample.21 Veterans with ADHD in this study did not have a disproportionate prevalence of PTSD, depression, anxiety, or substance abuse.
There was a nonsignificant trend for more individuals with an ADHD diagnosis compared with those without the diagnosis to report experiencing pain during the 30 days prior to their evaluation in the PC. Although not statistically significant, this finding would not be unexpected, in that individuals with ADHD are known to show less tolerance for frustration relative to that of the general population.21 In the current study, reports of pain in the ADHD group correlated with reports of being irritable and easily annoyed (r = .27, P = .024), but no correlation was observed with reports of poor frustration tolerance (r = .04, P = .74). Still, of note, > 90% of the OEF/OIF/OND veterans in this study, regardless of their ADHD diagnosis, reported pain symptoms of some type. The high prevalence of pain symptoms in this sample is consistent with a previous study that found pain to be one of the most common problems in polytrauma patients.10
Related: Civilian Stress Compounds Service-Related Stress
Not surprisingly, as shown in Table 2, veterans with ADHD compared with those without the diagnosis reported more problems with attention and concentration. The report of more attentional problems is seemingly not accounted for by group differences in reports of pain in general, headaches, sleep disturbance, or memory problems.
Study Strengths
A large sample of veterans constituted this study, and the data were gathered in consecutive referrals to the CJZVAMC PC over a 5-year period. Also, information on a number of comorbidities were captured simultaneously with the polytrauma and ADHD diagnoses, allowing much greater ability to investigate the interaction of multiple comorbidities as well as lingering reports of symptoms following discharge from active military service.
In these authors’ experience, veterans with ADHD benefit substantially from structured treatment interventions that are focused on developing compensatory skills for their problems with attention and impulsivity. Individuals with ADHD typically have a greater need for assistance with planning and organizing, making decisions, problem solving, and regulating their attention and affect. Individuals with ADHD may benefit from treatment strategies focused on ADHD behaviors in conjunction with traditional treatment strategies frequently used in the PC. These strategies include increased case management, medication trials, education regarding ADHD, vocational assistance, and consideration of both the school and work accommodations.
Studies have shown that treatments with stimulants improve functioning and reduce depression and substance use.21 In this study, < 5% of individuals with ADHD were taking stimulants at the time they were initially assessed in the PC, whereas the majority were taking stimulants after being referred for ADHD evaluation. Thus, identification of veterans with ADHD has clinical relevance in understanding the specific needs that guide development of individualized treatment plans to promote successful community reintegration.
Limitations
One limitation of the study is the lack of available medical records of historical ADHD diagnoses prior to military service. Also, although DSM-IV criteria for ADHD were operational in the psychodiagnostic clinics for these subjects, because the polytrauma study team did not conduct the evaluations in this sample, uniform diagnostic standards may not have been consistently applied when establishing the ADHD diagnosis. There was a 93% agreement between the 2 methods of diagnosis (ie, report of developmental diagnosis or positive adult evaluation), suggesting that diagnostic precision for ADHD in this study was reasonably accurate.
Another significant limitation of this study, apart from establishing medical and psychiatric status at the time of the initial referral to the PC, is the omission of functional outcome assessments regarding success of polytrauma treatment initiatives or ultimate community reintegration of successful psychosocial participation or academic and vocational achievements. Future longitudinal outcome studies are needed to determine whether ADHD has a significant impact on clinical outcomes. Of interest, pain was an overwhelmingly common factor (> 90%) for the military population studied at this site. Some degree of disturbance in attentional capacities is common in patients with chronic pain, which may aggravate ADHD symptoms and vice versa. Further investigations are needed to determine the potential functional impact of pain, including use of pain and psychotropic medications, on ADHD symptoms and the combined effect of these symptoms on overall outcome from rehabilitation and reintegration efforts.
Although these findings suggest that polytrauma veterans with ADHD do not have more psychiatric or physical comorbidities than do veterans without ADHD, it is premature to conclude that community reintegration can be optimally managed in the same way for both groups. Community reintegration of individuals with ADHD will likely be challenging, as these individuals often have struggled with functioning in their communities prior to their military service.
Studies of adult ADHD in the U.S. and in other countries have found that it is often associated with substantial impairment in managing the demands of functioning as an adult in society.4 Although some theorists have speculated that symptoms of ADHD may have been evolutionarily adaptive to survival in select environments (eg, predatory hunting environments), there is no clear evidence to support such adaptive benefits of the symptom in modern combat environments.23,24 Symptoms of ADHD are typically maladaptive to soldiers transitioning to civilian lives.
Conclusions
This investigation described the demographic and clinical characteristics of OEF/OIF/OND veterans referred for evaluation of TBI to the CJZVAMC PC during 5 years of operation from 2008 through 2012. The aim was to increase provider awareness of possible important variables that may influence recovery and community reintegration. This study may help to form the foundation for future lines of research into variables such as ADHD that may influence outcomes of rehabilitation and reintegration interventions.
To better understand the treatment needs of young veterans returning home from the wars in Iraq and Afghanistan, this study sought to identify the prevalence rate of ADHD, a condition known to complicate community adjustment. In this study, there was a 10.6% prevalence of ADHD among the 690 OEF/OIF/OND combat veterans seen over the 5-year period in the CJZVAMC PC, which is substantially higher than prevalence estimates in the U.S. general population but similar to estimates in previous military samples.
Compared with veterans who did not have ADHD, veterans with ADHD were younger, less well educated, and reported more problems with attention and concentration but did not have a greater incidence of military TBI or mental health comorbidities. The high prevalence of ADHD in this group argues for greater awareness of this clinical variable and development of intervention programs tailored to the specific skill deficiencies found in the condition, which can be included as part of the comprehensive treatment interventions.
Veterans with ADHD treated in the PC seem to benefit from structured treatment plans and education to promote self-awareness and veteran-centered self-management for effective symptom reduction and coping strategies. Development of effective integrated treatment options with a focus on educational and vocational resources and assistance could facilitate successful community reintegration. Future studies are needed to further assess outcomes of community reintegration, including academic and occupational outcomes, in this population.
Author disclosures
The authors report no actual or potential conflicts of interest with regard to this article.
Disclaimer
The opinions expressed herein are those of the authors and do not necessarily reflect those of Federal Practitioner, Frontline Medical Communications Inc., the U.S. Government, or any of its agencies. This article may discuss unlabeled or investigational use of certain drugs. Please review complete prescribing information for specific drugs or drug combinations—including indications, contraindications, warnings, and adverse effects—before administering pharmacologic therapy to patients.
1. Hoge CW, McGurk D, Thomas JL, Cox AL, Engel CC, Castro CA. Mild traumatic brain injury in U.S. soldiers returning from Iraq. N Engl J Med. 2008;358(5):453-463.
2. Screening and Evaluation of Possible Traumatic Brain Injury in Operation Enduring Freedom (OEF) and Operation Iraqi Freedom (OIF) Veterans. Washington, DC: Dept of Veterans Affairs; 2010. VHA Directive 2010-012.
3. Polytrauma System of Care. Washington, DC: Dept of Veterans Affairs; 2013. VHA Handbook 1172.01.
4. Kessler RC, Adler L, Barkley R, et al. The prevalence and correlates of adult ADHD in the United States: Results from the National Comorbidity Survey Replication. Am J Psychiatry. 2006;163(4):716-723.
5. Simon V, Czobor P, Bálint S, Mészáros A, Bitter I. Prevalence and correlates of adult attention-deficit hyperactivity disorder: Meta-analysis. Br J Psychiatry. 2009;194(3):204-211.
6. Fayyad J, De Graaf R, Kessler R, et al. Cross-national prevalence and correlates of adult attention-deficit hyperactivity disorder. Br J Psychiatry. 2007;190(5):402-409.
7. Krauss MR, Russell RK, Powers TE, Li Y. Accession standards for attention-deficit/hyperactivity disorder: A survival analysis of military recruits, 1995-2000. Mil Med. 2006;171(2):99-102.
8. Vanderploeg RD, Belanger HG, Horner RD, et al. Health outcomes associated with military deployment: Mild traumatic brain injury, blast, trauma, and combat associations in the Florida National Guard. Arch Phys Med Rehabil. 2012;93(11):1887-1895.
9. Theeler BJ, Flynn FG, Erickson JC. Headaches after concussion in US soldiers returning from Iraq or Afghanistan. Headache. 2010;50(8):1262-1272.
10. Sayer NA, Chiros CE, Sigford B, et al. Characteristics and rehabilitation outcomes among patients with blast and other injuries sustained during the Global War on Terror. Arch Phys Med Rehabil. 2008;89(1):163-170.
11. Sayer NA, Rettmann NA, Carlson KF, et al. Veterans with history of mild traumatic brain injury and posttraumatic stress disorder: Challenges from provider perspective. J Rehabil Res Dev. 2009;46(6):703-716.
12. Nampiaparampil DE. Prevalence of chronic pain after traumatic brain injury: A systematic review. JAMA. 2008;300(6):711-719.
13. Halbauer JD, Ashford JW, Zeitzer JM, Adamson MM, Lew HL, Yesavage JA. Neuropsychiatric diagnosis and management of chronic sequelae of war-related mild to moderate traumatic brain injury. J Rehabil Res Dev. 2009;46(6):757-796.
14. Romesser J, Shen S, Reblin M, et al. A preliminary study of the effect of a diagnosis of concussion on PTSD symptoms and other psychiatric variables at the time of treatment seeking among veterans. Mil Med. 2011;176(3):246-252.
15. Cicerone KD, Kalmar K. Persistent postconcussion syndrome: The structure of subjective complaints after mild traumatic brain injury. J Head Trauma Rehabil. 1995;10(3):1-17.
16. Weathers FW, Huska JA, Keane TM. PCL-C for DSM-IV. Boston, MA: National Center for PTSD–Behavioral Science Division; 1991.
17. American Psychiatric Association. Diagnostic and Statistical Manual of Mental Disorders, Text Revision (DSM-IV-TR). 4th ed. Washington, DC: American Psychiatric Association; 2000.
18. Hanson JA, Haub MD, Walker JJ, Johnston DT, Goff BS, Dretsch MN. Attention deficit hyperactivity disorder subtypes and their relation to cognitive functioning, mood states, and combat stress symptomatology in deploying U.S. soldiers. Mil Med. 2012;177(6):655-662.
19. Visser SN, Danielson ML, Bitsko RH, et al. Trends in the parent-report of health care provider-diagnosed and medicated attention-deficit/hyperactivity disorder: United States, 2003-2011. J Am Acad Child Adolesc Psychiatry. 2014;53(1):34-46.e2.
20. American Psychiatric Association. Diagnostic and Statistical Manual of Mental Disorders (DSM-5). 5th ed. Washington, DC: American Psychiatric Association; 2013.
21. Barkley, RA, Murphy KR, Fischer M. ADHD in Adults: What the Science Says. New York, NY: Guilford Press; 2008.
22. Barkley RA, Cox D. A review of driving risks and impairments associated with attention-deficit/hyperactivity disorder and the effects of stimulant medication on driving performance. J Safety Res. 2007;38(1):113-128.
23. Shelley-Tremblay JF, Rosén LA. Attention deficit hyperactivity disorder: An evolutionary perspective. J Genet Psychol. 1996;157(4):443-453.
24. Jensen PS, Mrazek D, Knapp PK, et al. Evolution and revolution in child psychiatry: ADHD as a disorder of adaptation. J Am Acad Child Adolesc Psychiatry. 1997;36(12):1672-1679.
Traumatic brain injury (TBI) and posttraumatic stress disorder (PTSD) are considered the signature injuries in veterans of the military operations in Iraq and Afghanistan.1 In 2007, the VA implemented the Polytrauma System of Care (PSC) to provide comprehensive screening, evaluation, and treatment of these multifaceted injuries.2,3 The VA defined polytrauma as “two or more injuries to physical regions or organ systems, one of which may be life threatening, resulting in physical, cognitive, psychological, or psychosocial impairments and functional disability.”3 The VA intended the PSC to provide a national system of integrated care to meet the unique needs of these combat service members.
In addition to the comprehensive evaluation and treatment of traumatic injuries, a critical mission of the PSC is to facilitate the reintegration of injured combat veterans into their home communities. Optimal community reintegration requires that the clinician also assess premorbid comorbidities, which may affect postdeployment adjustments. Attention-deficit/hyperactivity disorder (ADHD), with an estimated adult prevalence of 4.4% in the U.S. and 2.5% to 3.4% worldwide, is a common disorder in the general adult population that often is associated with chronic social and vocational adjustment difficulties.4-6 The increasing recognition that this disorder often persists into adulthood is of significance to veterans, largely young and male, who have left military service and are reintegrating into college and community job settings.7 Despite growing interest in adult ADHD, little is known about its prevalence and correlates in the veteran population.
The prevalence of ADHD in the Operation Enduring Freedom/Operation Iraqi Freedom/Operation New Dawn (OEF/OIF/OND) veteran polytrauma population has not been adequately studied. Studies have found that combat veterans with or without confirmed TBI diagnosis commonly have similar overlapping symptoms, such as memory problems, difficulty concentrating, poor attention, and sleep problems associated with other comorbidities such as pain, PTSD, ADHD, and other mental health diagnoses.8-14 Increased awareness of various clinical variables would enhance understanding of the population characteristics and specific needs for education and management.
Related: Preparing the Military Health System for the 21st Century
To begin to address the lack of information about ADHD in the VA polytrauma population, this study aimed to (1) identify the prevalence of ADHD in veterans referred to the Clement J. Zablocki (CJZ) VAMC Polytrauma Clinic (PC) in Milwaukee, Wisconsin; (2) describe demographic characteristics of polytrauma veterans with ADHD; (3) determine the comorbidity relationship between ADHD and TBI, PTSD, depression and anxiety disorders, and substance abuse; and (4) determine whether individuals with ADHD compared with those without ADHD report more physical and emotional symptomatic distress with particular attention given to reports of pain, headaches, and problems with attention and concentration, memory, and sleep.
Methods
The study population consisted of 690 OEF/OIF/OND soldiers and veterans who received a comprehensive TBI evaluation in the CJZVAMC PC from January 1, 2008, to December 31, 2012. Referrals to the PC were made by primary care physicians (PCPs) when OEF/OIF/OND veterans or service members enrolled at a VA facility for health care or transferred their care from another VA facility.
Either a prior diagnosis of TBI established by a qualified provider or positive responses to a 4-question screening tool for TBI prompted a referral to the PC. The 4 questions sought to establish (1) events that may increase risk of TBIs; (2) immediate symptoms following the event; (3) new or worsening symptoms following the event; and (4) current symptoms.1 Referrals to the clinic most commonly came from PCPs at the CJZVAMC and its associated community-based outpatient clinics but occasionally came from mental health service providers.
Study Design
The CJZVAMC Institutional Review Board approved this study. A population database was developed from a review of medical records, clinical interviews of patients, and completion of standard intake forms during the veterans’ initial evaluations in the CJZVAMC PC. The database aimed to abstract patient information relevant for understanding and treating the population seen in the clinic. The database contained information related to demographics, injury parameters, neurobehavioral and PTSD symptoms, past and current mental health disorders, substance abuse history, pain symptoms, and developmental history (eg, ADHD, learning disability).
Related: First Brain Wave Test to Diagnose ADHD
Prior to the PC intake interview, each veteran completed a packet of preclinic questionnaires that included information concerning deployment-related injury exposure and history; the 22-item Neurobehavioral Symptom Inventory (NSI), which assessed physical, cognitive, and emotional symptoms; current pain symptoms; and the Posttraumatic Stress Disorder Checklist-Civilian Version (PCLC).15,16 Intake interviews in the CJZVAMC PC were typically conducted with a minimum of 2 specialties present (physical medicine/rehabilitation and neuropsychology) and occasionally as many as 4 specialties present (also including health psychology and social work). Data collection and abstraction for the database were derived by all specialties present and assisted by the polytrauma program technician.
Diagnoses
The diagnosis of ADHD in a veteran was established through 1 of 2 methods: (1) report of a developmental history of behavioral adjustment difficulties consistent with ADHD that was coupled with formal psychiatric diagnosis and recommended treatment of ADHD in childhood; or (2) current diagnosis of ADHD as identified in the veteran’s active problem list. In most cases of report of developmental diagnosis, the veteran reported having been diagnosed and having received treatment with a stimulant medication for a period of time. In a few cases, the veteran reported having been diagnosed and stimulant medication was recommended, but the veteran’s parents declined the pharmacologic treatment in favor of behavioral treatment strategies.
In cases of current diagnosis, Diagnostic and Statistical Manual of Mental Disorders, Text Revision, 4th Edition (DSM-IV-TR), criteria were applied and supported by formal clinical examinations for ADHD conducted by psychologists, psychiatrists or neuropsychologists, or through VA disability (Compensation and Pension) evaluations where an issue related to ADHD diagnosis was raised.17 There was considerable overlap between these 2 diagnostic criteria (ie, through report of developmental history of diagnosis or formal adult evaluation) with 93% of cases being positive on both diagnostic methods.
Other comorbid psychiatric (eg, depression, anxiety, PTSD, substance abuse) and medical (eg, headache, pain) conditions also were abstracted from the veteran’s medical records at the time of the intake evaluation. Documentation of these conditions was derived from the veteran’s problem list and clinical notes that identified the condition as a diagnostic conclusion or focus of treatment. The comorbid conditions were not otherwise independently documented. Many veterans were taking psychotropic medications for mood, sleep, or chronic pain problems at the time of evaluation in the PC; however, use of medication and their effects were not systematically evaluated.
Statistical Analysis
In addition to documentation of the population prevalence for ADHD, analysis for disproportionate prevalence of comorbid conditions in individuals with ADHD compared with those without ADHD was done through the use of the chi-square test and/or Fisher exact test. For continuous variables, t tests were used to compare individuals with ADHD with individuals without ADHD. To control family-wise type I error to a P value of .05, a false discovery rate (FDR) was applied to studies of demographics, comorbidities, and ratings of symptomatic distress.
Results
The general population characteristics of the 690 veterans and soldiers are summarized in Table 1. The sample was predominantly male (96%), white (88%), and ranged in age from 22 to 55 years with a mean of 28 years. Active-duty service members and reservists from the U.S. Army, Marines, Navy, and Air Force were represented, but most were Army veterans (72%). Most (63%) had a high school education. About two-thirds of the veterans had a single deployment, and the remaining had multiple deployments.
The TBI clinic evaluations found that 58% of the patients had ≥ 1 TBI during their deployments, almost exclusively mild in severity. Seventy-three patients met study criteria for ADHD: 69 with an identified history of diagnosis in childhood and 68 with a current diagnosis, with 93% overlap of these groups. Table 2 provides a breakdown of demographic characteristics, comorbidities, and symptomatic distress in veterans with ADHD compared with those without the diagnosis.
Demographic Characteristics
Veterans with ADHD were found to be slightly younger (2.3 years younger, P = .003) and to have less education (greater frequency of less than high school and high school only, P = .003) compared with those who did not have the diagnosis. No significant group differences in sex, employment/school status, marital status, or number of deployments were identified in veterans with ADHD compared with non-ADHD veterans. Individuals with ADHD did not experience more physical, emotional, or sexual abuse as children than did their non-ADHD counterparts. The prevalence of TBI during deployment was similar in veterans with ADHD compared with that of non-ADHD veterans. There was a trend for veterans with ADHD to have more TBIs prior to military service than in non-ADHD veterans; however, this trend did not reach statistical significance (P = .188).
Comorbidities
After application of the FDR threshold, veterans with ADHD did not show a disproportionate prevalence of mental health diagnoses (eg, PTSD, depression and anxiety disorders, or substance abuse). There was a nonsignificant trend for more veterans with ADHD to report pain during the previous 30 days (P = .035) and more issues with substance abuse (P = .10) than for non-ADHD veterans, but these trends did not meet the FDR threshold of < .05.
Symptomatic Distress
Veterans with ADHD did not report significantly greater levels of distress on either the NSI or the PCLC survey compared with non-ADHD veterans.Not surprisingly, when select symptoms were investigated, veterans with ADHD reported more problems with attention and concentration than for non-ADHD veterans (P = .015). No group differences were identified for sleep issues, headaches, or memory, although there was a trend for the latter (P = .14).
Discussion
In this study, there was a 10.6% prevalence of ADHD in 690 OEF/OIF/OND combat veterans. This rate is considerably higher than estimates of prevalence of ADHD in adults (4.4%) made from a nationwide survey and worldwide prevalence estimates of 2.5% to 3.5%.4-6 Still, the current prevalence finding is consistent with a recent finding of ADHD in previous deploying U.S. soldiers military samples (10.4%).18 The high prevalence of ADHD in the current clinic population argues for increased provider awareness of this condition as a possible factor in postdeployment adjustment assessments.
Changes in prevalence estimates of ADHD may represent increased awareness of the condition over this interval of time, professional drift in the application of diagnostic criteria, or changes in societal attitudes about acceptability in pursuing treatment for the condition. For example, in nationwide surveys in 2003, 2007, and 2011, the CDC identified an increase from 7.8% to 9.5% to 11%, respectively, in diagnoses of ADHD in childhood.19 Also, considering that the current sample was predominantly male and the prevalence of ADHD in males is higher than in females, one might expect a higher ADHD prevalence rate in this study than that in the general population. In this regard, the ADHD prevalence rate in males remains comparable to that estimated by recent CDC survey data.19
When estimating ADHD population prevalence in the future, it is worth noting that a change in the diagnostic criteria for ADHD has occurred in DSM-5. Specifically, the age at which critical symptoms must be present to make the diagnosis of ADHD has been increased from age 7 years to age 12 years, and the number of critical symptoms to meet hyperactivity-impulsivity criteria has been lowered from 6 to 5 in older adolescents and adults.20 These changes in the diagnostic criteria for ADHD will have the net effect of increasing estimates of prevalence of ADHD.
The 73 individuals with an ADHD diagnoses in this study were found to have less education and be slightly younger than were the veterans who did not have an ADHD diagnosis. This finding is not unexpected, as individuals with ADHD are known to struggle in school and often drop out of high school and pursue alternative means of getting an equivalency degree or certification.21 Early departure from high school can be followed by earlier enlistment in the military. Prior studies by Krauss and colleagues found similar findings in an ADHD study of military recruits (ie, they were less likely to have education beyond a high school degree).7
ADHD and TBI
Given problems with attention, impulsivity, and high levels of aggressive behaviors associated with ADHD, individuals with ADHD have been found to be at higher risk for accidental injuries, including TBI, than are individuals without ADHD.21,22 Thus, soldiers with ADHD may be at greater risk for TBI during their time in the military. In the current sample, although veterans with ADHD showed a trend toward having more TBIs prior to joining the military relative to non-ADHD veterans, the veterans with ADHD had a similar rate of TBIs during their time in the military relative to non-ADHD veterans.
Although individuals with ADHD are reported to have a higher prevalence of mental health issues than does the general public, this was not evident in the current sample.21 Veterans with ADHD in this study did not have a disproportionate prevalence of PTSD, depression, anxiety, or substance abuse.
There was a nonsignificant trend for more individuals with an ADHD diagnosis compared with those without the diagnosis to report experiencing pain during the 30 days prior to their evaluation in the PC. Although not statistically significant, this finding would not be unexpected, in that individuals with ADHD are known to show less tolerance for frustration relative to that of the general population.21 In the current study, reports of pain in the ADHD group correlated with reports of being irritable and easily annoyed (r = .27, P = .024), but no correlation was observed with reports of poor frustration tolerance (r = .04, P = .74). Still, of note, > 90% of the OEF/OIF/OND veterans in this study, regardless of their ADHD diagnosis, reported pain symptoms of some type. The high prevalence of pain symptoms in this sample is consistent with a previous study that found pain to be one of the most common problems in polytrauma patients.10
Related: Civilian Stress Compounds Service-Related Stress
Not surprisingly, as shown in Table 2, veterans with ADHD compared with those without the diagnosis reported more problems with attention and concentration. The report of more attentional problems is seemingly not accounted for by group differences in reports of pain in general, headaches, sleep disturbance, or memory problems.
Study Strengths
A large sample of veterans constituted this study, and the data were gathered in consecutive referrals to the CJZVAMC PC over a 5-year period. Also, information on a number of comorbidities were captured simultaneously with the polytrauma and ADHD diagnoses, allowing much greater ability to investigate the interaction of multiple comorbidities as well as lingering reports of symptoms following discharge from active military service.
In these authors’ experience, veterans with ADHD benefit substantially from structured treatment interventions that are focused on developing compensatory skills for their problems with attention and impulsivity. Individuals with ADHD typically have a greater need for assistance with planning and organizing, making decisions, problem solving, and regulating their attention and affect. Individuals with ADHD may benefit from treatment strategies focused on ADHD behaviors in conjunction with traditional treatment strategies frequently used in the PC. These strategies include increased case management, medication trials, education regarding ADHD, vocational assistance, and consideration of both the school and work accommodations.
Studies have shown that treatments with stimulants improve functioning and reduce depression and substance use.21 In this study, < 5% of individuals with ADHD were taking stimulants at the time they were initially assessed in the PC, whereas the majority were taking stimulants after being referred for ADHD evaluation. Thus, identification of veterans with ADHD has clinical relevance in understanding the specific needs that guide development of individualized treatment plans to promote successful community reintegration.
Limitations
One limitation of the study is the lack of available medical records of historical ADHD diagnoses prior to military service. Also, although DSM-IV criteria for ADHD were operational in the psychodiagnostic clinics for these subjects, because the polytrauma study team did not conduct the evaluations in this sample, uniform diagnostic standards may not have been consistently applied when establishing the ADHD diagnosis. There was a 93% agreement between the 2 methods of diagnosis (ie, report of developmental diagnosis or positive adult evaluation), suggesting that diagnostic precision for ADHD in this study was reasonably accurate.
Another significant limitation of this study, apart from establishing medical and psychiatric status at the time of the initial referral to the PC, is the omission of functional outcome assessments regarding success of polytrauma treatment initiatives or ultimate community reintegration of successful psychosocial participation or academic and vocational achievements. Future longitudinal outcome studies are needed to determine whether ADHD has a significant impact on clinical outcomes. Of interest, pain was an overwhelmingly common factor (> 90%) for the military population studied at this site. Some degree of disturbance in attentional capacities is common in patients with chronic pain, which may aggravate ADHD symptoms and vice versa. Further investigations are needed to determine the potential functional impact of pain, including use of pain and psychotropic medications, on ADHD symptoms and the combined effect of these symptoms on overall outcome from rehabilitation and reintegration efforts.
Although these findings suggest that polytrauma veterans with ADHD do not have more psychiatric or physical comorbidities than do veterans without ADHD, it is premature to conclude that community reintegration can be optimally managed in the same way for both groups. Community reintegration of individuals with ADHD will likely be challenging, as these individuals often have struggled with functioning in their communities prior to their military service.
Studies of adult ADHD in the U.S. and in other countries have found that it is often associated with substantial impairment in managing the demands of functioning as an adult in society.4 Although some theorists have speculated that symptoms of ADHD may have been evolutionarily adaptive to survival in select environments (eg, predatory hunting environments), there is no clear evidence to support such adaptive benefits of the symptom in modern combat environments.23,24 Symptoms of ADHD are typically maladaptive to soldiers transitioning to civilian lives.
Conclusions
This investigation described the demographic and clinical characteristics of OEF/OIF/OND veterans referred for evaluation of TBI to the CJZVAMC PC during 5 years of operation from 2008 through 2012. The aim was to increase provider awareness of possible important variables that may influence recovery and community reintegration. This study may help to form the foundation for future lines of research into variables such as ADHD that may influence outcomes of rehabilitation and reintegration interventions.
To better understand the treatment needs of young veterans returning home from the wars in Iraq and Afghanistan, this study sought to identify the prevalence rate of ADHD, a condition known to complicate community adjustment. In this study, there was a 10.6% prevalence of ADHD among the 690 OEF/OIF/OND combat veterans seen over the 5-year period in the CJZVAMC PC, which is substantially higher than prevalence estimates in the U.S. general population but similar to estimates in previous military samples.
Compared with veterans who did not have ADHD, veterans with ADHD were younger, less well educated, and reported more problems with attention and concentration but did not have a greater incidence of military TBI or mental health comorbidities. The high prevalence of ADHD in this group argues for greater awareness of this clinical variable and development of intervention programs tailored to the specific skill deficiencies found in the condition, which can be included as part of the comprehensive treatment interventions.
Veterans with ADHD treated in the PC seem to benefit from structured treatment plans and education to promote self-awareness and veteran-centered self-management for effective symptom reduction and coping strategies. Development of effective integrated treatment options with a focus on educational and vocational resources and assistance could facilitate successful community reintegration. Future studies are needed to further assess outcomes of community reintegration, including academic and occupational outcomes, in this population.
Author disclosures
The authors report no actual or potential conflicts of interest with regard to this article.
Disclaimer
The opinions expressed herein are those of the authors and do not necessarily reflect those of Federal Practitioner, Frontline Medical Communications Inc., the U.S. Government, or any of its agencies. This article may discuss unlabeled or investigational use of certain drugs. Please review complete prescribing information for specific drugs or drug combinations—including indications, contraindications, warnings, and adverse effects—before administering pharmacologic therapy to patients.
1. Hoge CW, McGurk D, Thomas JL, Cox AL, Engel CC, Castro CA. Mild traumatic brain injury in U.S. soldiers returning from Iraq. N Engl J Med. 2008;358(5):453-463.
2. Screening and Evaluation of Possible Traumatic Brain Injury in Operation Enduring Freedom (OEF) and Operation Iraqi Freedom (OIF) Veterans. Washington, DC: Dept of Veterans Affairs; 2010. VHA Directive 2010-012.
3. Polytrauma System of Care. Washington, DC: Dept of Veterans Affairs; 2013. VHA Handbook 1172.01.
4. Kessler RC, Adler L, Barkley R, et al. The prevalence and correlates of adult ADHD in the United States: Results from the National Comorbidity Survey Replication. Am J Psychiatry. 2006;163(4):716-723.
5. Simon V, Czobor P, Bálint S, Mészáros A, Bitter I. Prevalence and correlates of adult attention-deficit hyperactivity disorder: Meta-analysis. Br J Psychiatry. 2009;194(3):204-211.
6. Fayyad J, De Graaf R, Kessler R, et al. Cross-national prevalence and correlates of adult attention-deficit hyperactivity disorder. Br J Psychiatry. 2007;190(5):402-409.
7. Krauss MR, Russell RK, Powers TE, Li Y. Accession standards for attention-deficit/hyperactivity disorder: A survival analysis of military recruits, 1995-2000. Mil Med. 2006;171(2):99-102.
8. Vanderploeg RD, Belanger HG, Horner RD, et al. Health outcomes associated with military deployment: Mild traumatic brain injury, blast, trauma, and combat associations in the Florida National Guard. Arch Phys Med Rehabil. 2012;93(11):1887-1895.
9. Theeler BJ, Flynn FG, Erickson JC. Headaches after concussion in US soldiers returning from Iraq or Afghanistan. Headache. 2010;50(8):1262-1272.
10. Sayer NA, Chiros CE, Sigford B, et al. Characteristics and rehabilitation outcomes among patients with blast and other injuries sustained during the Global War on Terror. Arch Phys Med Rehabil. 2008;89(1):163-170.
11. Sayer NA, Rettmann NA, Carlson KF, et al. Veterans with history of mild traumatic brain injury and posttraumatic stress disorder: Challenges from provider perspective. J Rehabil Res Dev. 2009;46(6):703-716.
12. Nampiaparampil DE. Prevalence of chronic pain after traumatic brain injury: A systematic review. JAMA. 2008;300(6):711-719.
13. Halbauer JD, Ashford JW, Zeitzer JM, Adamson MM, Lew HL, Yesavage JA. Neuropsychiatric diagnosis and management of chronic sequelae of war-related mild to moderate traumatic brain injury. J Rehabil Res Dev. 2009;46(6):757-796.
14. Romesser J, Shen S, Reblin M, et al. A preliminary study of the effect of a diagnosis of concussion on PTSD symptoms and other psychiatric variables at the time of treatment seeking among veterans. Mil Med. 2011;176(3):246-252.
15. Cicerone KD, Kalmar K. Persistent postconcussion syndrome: The structure of subjective complaints after mild traumatic brain injury. J Head Trauma Rehabil. 1995;10(3):1-17.
16. Weathers FW, Huska JA, Keane TM. PCL-C for DSM-IV. Boston, MA: National Center for PTSD–Behavioral Science Division; 1991.
17. American Psychiatric Association. Diagnostic and Statistical Manual of Mental Disorders, Text Revision (DSM-IV-TR). 4th ed. Washington, DC: American Psychiatric Association; 2000.
18. Hanson JA, Haub MD, Walker JJ, Johnston DT, Goff BS, Dretsch MN. Attention deficit hyperactivity disorder subtypes and their relation to cognitive functioning, mood states, and combat stress symptomatology in deploying U.S. soldiers. Mil Med. 2012;177(6):655-662.
19. Visser SN, Danielson ML, Bitsko RH, et al. Trends in the parent-report of health care provider-diagnosed and medicated attention-deficit/hyperactivity disorder: United States, 2003-2011. J Am Acad Child Adolesc Psychiatry. 2014;53(1):34-46.e2.
20. American Psychiatric Association. Diagnostic and Statistical Manual of Mental Disorders (DSM-5). 5th ed. Washington, DC: American Psychiatric Association; 2013.
21. Barkley, RA, Murphy KR, Fischer M. ADHD in Adults: What the Science Says. New York, NY: Guilford Press; 2008.
22. Barkley RA, Cox D. A review of driving risks and impairments associated with attention-deficit/hyperactivity disorder and the effects of stimulant medication on driving performance. J Safety Res. 2007;38(1):113-128.
23. Shelley-Tremblay JF, Rosén LA. Attention deficit hyperactivity disorder: An evolutionary perspective. J Genet Psychol. 1996;157(4):443-453.
24. Jensen PS, Mrazek D, Knapp PK, et al. Evolution and revolution in child psychiatry: ADHD as a disorder of adaptation. J Am Acad Child Adolesc Psychiatry. 1997;36(12):1672-1679.
Risk Factors for Postoperative Complications in Trigger Finger Release
Stenosing tenosynovitis, or trigger finger, is a pathology commonly referred to the plastic and hand surgery service of the North Florida/South Georgia Veterans Health System (NFSGVHS). Patients usually present to their primary care provider with symptoms of the finger being temporarily locked or stuck in the flexed position. This can be a painful problem due to the size mismatch between the flexor tendon and the pulley under which it glides.
Patients are typically referred to surgery after failing ≥ 1 attempt at nonoperative management. The surgery is relatively quick and straightforward; however, postoperative complications can lead to an unexpected costly and lengthy recovery. The objective of this study was to identify potential risk factors that can predispose patients to postoperative complications so that those risk factors may be better anticipated and modified, if possible.
Methods
A retrospective chart review of trigger finger release surgery was performed on-site at the Malcom Randall VAMC in Gainesville, Florida, from January 2005 to December 2010 to identify risk factors associated with postoperative complications. The study was approved by both the NFSGVHS Internal Review Board and the University of Florida Institutional Review Board. Patients who underwent surgery exclusively for ≥ 1 trigger fingers by the plastic surgery service were included in the study.
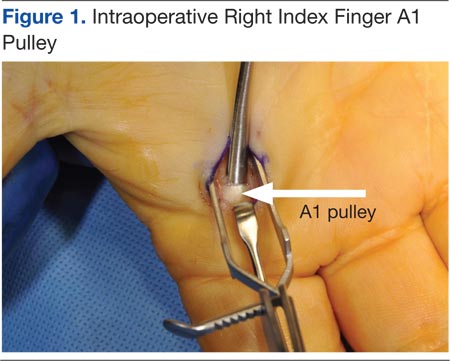
The surgery involves making an incision over the affected A1 pulley in the hand (Figure 1) and sharply releasing it (Figure 2) under direct vision. Potential risk factors for postoperative complications were recorded. These risk factors included smoking status, diabetic status, type of incision, and number of digits released during the surgical procedure.
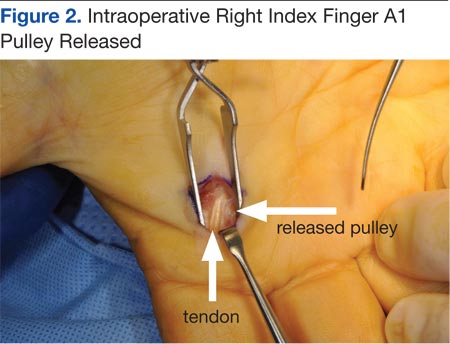
Results
Ninety-eight digits (on 81 hands) were identified as meeting inclusion criteria. Surgeries were performed using a longitudinal (43), transverse (48), oblique (5), or Brunner (2) incision. There were 10 complications: cellulitis (3), pyogenic flexor tenosynovitis (3), scar adhesion (1), delayed healing (2), and incomplete release (1). The overall complication rate was 10.2%. The authors compared risk factors with complications, using the chi square test and a determining of P < .05.
Related: Making the Case for Minimally Invasive Surgery
There was no link found between overall postoperative complications and diabetic status, incision type, or smoking status. There was a statistically significant link between diabetic patients and the incidence of postoperative infection (P = .002) and between 2 digits operated on during the same surgery and postoperative infection (P = .027)
Discussion
The routine practice of the NFSGVHS hand clinic is to offer a steroid injection as the initial treatment for trigger finger. Health care providers (HCPs) allow no more than 3 injections to the same digit to avoid the rare but potentially serious complication of a tendon rupture.1 Due to the large NFSGVHS catchment area, wait time for elective trigger finger surgery is several months. This 3-injection plan has been well received by patients and referring providers due to these wait times. However, a recent article by Kerrigan and Stanwix concluded that the most cost-efficient treatment strategy is 2 steroid injections before surgery.2
More often than not, trigger finger release is a short, outpatient surgery with a quick recovery. To minimize the risk of stiffness and scar adhesions, the NFSGVHS practice is to refer all postoperative hand cases for ≥ 1 hand therapy appointment on the same day as their first postoperative visit.
Cost Estimates
When complications occur, they can be costly to patients due to both time spent away from home and work and additional expenses. When the current procedural terminology (CPT) codes are run through the VistA integrated billing system, based on the VHA Chief Business Office Reasonable Charges, a complication can more than double the charges associated with A1 pulley surgery.
A flexor sheath incision and drainage (I+D) (CPT 26020) charges $8,935.35 (facility charge, $6,911.95 plus professional fee, $2,023.40), compared with open trigger finger release (CPT 26055) at $8,365.66 (facility charge, $6,911.95 plus professional fee, $1,453.71). According to a conversation with the finance service officer at NFSGVHS (2/11/2014), the anesthesia bill ($490.56/15 min), anticipated level 3 emergency department visits (facility charge, $889.22 plus professional fee $493.40), and inpatient stays (daily floor bed $786.19) can make an infectious complication costly.
Trigger finger can also be released percutaneously. This is a reasonable option that avoids the operating room, but NFSGVHS surgeons prefer the open surgery due to concerns for tendon and nerve injury that can result from a blind sweep of the needle.3,4
Related: Prevention of Venous Thromboembolism After Total Joint Replacement
Existing studies found complications for trigger finger release ranging from 1% to 31%.5,6 Wound complications and joint stiffness are known complications.5-7 In this study, 60% of the complications were infections, and 80% of the complications were wound complications. Six of 8 patients with wound-healing complications received perioperative antibiotics. Three patients returned to the operating room for an I+D of the flexor sheath. The results showed a statistically significant link between > 1 digit treated at the same surgery and postoperative complications (P = .027). A PubMed search revealed no existing hand literature with this association.
Risk Factors
Diabetes, tobacco use, type of incision, and number of digits treated were assessed as risk factors for complications after trigger finger surgery. Nicotine is widely accepted as increasing the risk for wound complications.8 Almost 20% of the U.S. population smokes, compared with 22% of the VA population and 32% of active-duty military personnel.9 One in 4 veterans has been diagnosed with diabetes, a well-known predisposing factor in delayed wound healing and infection.10,11 No prior studies were found comparing type of incision or multiple digits treated as complications risk factors.
There is also a well-known association between trigger finger and diabetes. Chronic hyperglycemia results in the accumulation of collagen within tendon sheaths due to impairment of collagen breakdown. Patients with diabetes tend to present with multiple digit involvement and respond less favorably to steroid injections compared with patients without diabetes.12 Wound healing is also impaired in patients with diabetes. All 6 wound infections in this study were in patients with diabetes. Proposed etiologies for wound-healing complications include pathologic angiogenesis, impaired fibroblast proliferation and migration, impaired circulation, decreased oxygenation, and a defective immune response to the injured site.13
Trigger finger may develop in multiple digits. Once surgery has been planned for 1 digit, patients may request surgery on another digit on the same hand that has not had an attempt at nonoperative intervention. The NFSGVHS plastic surgeons have raised the threshold to offer multiple surgical procedures on the same hand at the same operative visit to minimize recovery time and number of visits, particularly when patients are travelling long distances. This may be less convenient; however, the overall cost to the patient and the health care system in the event of a complication is significant. Plastic surgery providers also run an alcohol prep pad over the incision site to prevent inoculation of the flexor sheath during suture removal.
Current recommendations to ameliorate the postoperative risks to the patient and costs to the system include endorsing a more conservative approach to treating trigger finger than was previously practiced at NFSGVHS. The known, less favorable response of patients with diabetes to steroid injections plus their elevated risk of postoperative infection create a catch-22 for the treatment plan. Given the low risk of a single steroid injection to the flexor sheath, this procedure is still recommended as a first-line treatment.
Related: Experience Tells in Hip Arthroplasty
During the 5-year study there was a lower threshold for surgical management and for treatment of multiple digits during the same surgery than the one currently practiced, with an overall consensus of the hospital’s HCPs. The authors recommend that all patients start with a steroid injection before committing to surgery. Patients with diabetes are informed that the injection will cause a temporary rise in their blood glucose.14 If they are resistant to the injection, high-dose oral nonsteroidal anti-inflammatory drugs and/or proximal interphalangeal joint splinting is ordered.
Verification of A1C values showing better chronic management of blood sugar is a procedure HCPs from the NFSGVHS will begin to follow. Preoperative A1C values between 6.5% and 8% in patients known to have diabetes has been recommended.15 A1C values > 7% have been found to be an independent risk factor for stenosing tenosynovitis.16 The total number of trigger finger surgeries may drop with the benefit of improved utilization of resources.
Conclusion
The authors found a statistically significant association between postoperative infection and 2 patient populations: patients with diabetes (P = .002) and patients having > 1 digit released during the same surgery (P = .027). This outcome suggests using caution when offering A1 pulley release in select patient populations.
Acknowledgement
Justine Pierson, BS, research coordinator at University of Florida, for statistical analysis. Funding is through salary.
Author disclosures
The authors report no actual or potential conflicts of interest with regard to this article.
Disclaimer
The opinions expressed herein are those of the authors and do not necessarily reflect those of Federal Practitioner, Frontline Medical Communications Inc., the U.S. Government, or any of its agencies. This article may discuss unlabeled or investigational use of certain drugs. Please review complete prescribing information for specific drugs or drug combinations—including indications, contraindications, warnings, and adverse effects—before administering pharmacologic therapy to patients.
1. Yamada K, Masuko, T, Iwasaki N. Rupture of the flexor digitorum profundus tendon after injections of insoluble steroid for a trigger finger. J Hand Surg Eur. 2011;36(1):77-78.
2. Kerrigan CL, Stanwix MG. Using evidence to minimize the cost of trigger finger care. J Hand Surg Am. 2009;34(6):997-1005.
3. Habbu R, Putnam MD, Adams JE. Percutaneous Release of the A1 pulley: a cadaver study. J Hand Surg Am. 2012;37(11):2273-2277.
4. Guler F, Kose O, Ercan EC, Turan A, Canbora K. Open vs percutaneous release for the treatment of trigger thumb. Orthopedics. 2013;36(10):e1290-e1294.
5. Lim M-H, Lim K-K, Rasheed MZ, Narayana S, Tan B-H. Outcome of open trigger digit release. J Hand Surg Eur. 2007;32(4):457-479.
6. Will R, Lubahn J. Complications of open trigger finger release. J Hand Surg Am. 2010;35(4):594-596.
7. Lee WT, Chong AK. Outcome study of open trigger digit release. J Hand Surg Eur. 2011;36(4):339.
8. Rinker B. The evils of nicotine: An evidence-based guide to smoking and plastic surgery. Ann Plast Surg. 2013;70(5):599-605.
9. Bondurant S, Wedge R, eds. Combating Tobacco Use in Military and Veteran Populations. Washington, DC: The National Academies; 2009.
10. Shilling AM, Raphael J. Diabetes, hyperglycemia, and infections. Best Pract Res Clin Anaesthesiol. 2008;22(3):519-535.
11. Kuppersmith J, Francis J, Kerr E, et al. Advancing evidence-based care for diabetes: Lessons from the Veterans Health Administration. Health Aff. 2007;26(2):156-158.
12. Brown E, Genoway KA. Impact of diabetes on outcomes in hand surgery. J Hand Surg Am. 2011;36(12):2067-2072.
13. Francis-Goforth KN, Harken AH, Saba JD. Normalization of diabetic wound healing. Surgery. 2010;147(3):446-449.
14. Wang AA, Hutchinson DT. The effect of corticosteroid injection for trigger finger on blood glucose level in diabetic patients. J Hand Surg Am. 2006;31(6):979-981.
15. Underwood P, Askari R, Hurwitz S, Chamarthi B, Garg R. Preoperative A1C and Clinical Outcomes in patients with diabetes undergoing major noncardiac surgical procedures. Diabetes Care. 2014; 37(3): 611-616.
16. Vance MC, Tucker JJ, Harness NG. The association of hemoglobin A1c with the prevalence of stenosing tenosynovitis. J Hand Surg Am. 2012;37(9):1765-1769.
Stenosing tenosynovitis, or trigger finger, is a pathology commonly referred to the plastic and hand surgery service of the North Florida/South Georgia Veterans Health System (NFSGVHS). Patients usually present to their primary care provider with symptoms of the finger being temporarily locked or stuck in the flexed position. This can be a painful problem due to the size mismatch between the flexor tendon and the pulley under which it glides.
Patients are typically referred to surgery after failing ≥ 1 attempt at nonoperative management. The surgery is relatively quick and straightforward; however, postoperative complications can lead to an unexpected costly and lengthy recovery. The objective of this study was to identify potential risk factors that can predispose patients to postoperative complications so that those risk factors may be better anticipated and modified, if possible.
Methods
A retrospective chart review of trigger finger release surgery was performed on-site at the Malcom Randall VAMC in Gainesville, Florida, from January 2005 to December 2010 to identify risk factors associated with postoperative complications. The study was approved by both the NFSGVHS Internal Review Board and the University of Florida Institutional Review Board. Patients who underwent surgery exclusively for ≥ 1 trigger fingers by the plastic surgery service were included in the study.
The surgery involves making an incision over the affected A1 pulley in the hand (Figure 1) and sharply releasing it (Figure 2) under direct vision. Potential risk factors for postoperative complications were recorded. These risk factors included smoking status, diabetic status, type of incision, and number of digits released during the surgical procedure.
Results
Ninety-eight digits (on 81 hands) were identified as meeting inclusion criteria. Surgeries were performed using a longitudinal (43), transverse (48), oblique (5), or Brunner (2) incision. There were 10 complications: cellulitis (3), pyogenic flexor tenosynovitis (3), scar adhesion (1), delayed healing (2), and incomplete release (1). The overall complication rate was 10.2%. The authors compared risk factors with complications, using the chi square test and a determining of P < .05.
Related: Making the Case for Minimally Invasive Surgery
There was no link found between overall postoperative complications and diabetic status, incision type, or smoking status. There was a statistically significant link between diabetic patients and the incidence of postoperative infection (P = .002) and between 2 digits operated on during the same surgery and postoperative infection (P = .027)
Discussion
The routine practice of the NFSGVHS hand clinic is to offer a steroid injection as the initial treatment for trigger finger. Health care providers (HCPs) allow no more than 3 injections to the same digit to avoid the rare but potentially serious complication of a tendon rupture.1 Due to the large NFSGVHS catchment area, wait time for elective trigger finger surgery is several months. This 3-injection plan has been well received by patients and referring providers due to these wait times. However, a recent article by Kerrigan and Stanwix concluded that the most cost-efficient treatment strategy is 2 steroid injections before surgery.2
More often than not, trigger finger release is a short, outpatient surgery with a quick recovery. To minimize the risk of stiffness and scar adhesions, the NFSGVHS practice is to refer all postoperative hand cases for ≥ 1 hand therapy appointment on the same day as their first postoperative visit.
Cost Estimates
When complications occur, they can be costly to patients due to both time spent away from home and work and additional expenses. When the current procedural terminology (CPT) codes are run through the VistA integrated billing system, based on the VHA Chief Business Office Reasonable Charges, a complication can more than double the charges associated with A1 pulley surgery.
A flexor sheath incision and drainage (I+D) (CPT 26020) charges $8,935.35 (facility charge, $6,911.95 plus professional fee, $2,023.40), compared with open trigger finger release (CPT 26055) at $8,365.66 (facility charge, $6,911.95 plus professional fee, $1,453.71). According to a conversation with the finance service officer at NFSGVHS (2/11/2014), the anesthesia bill ($490.56/15 min), anticipated level 3 emergency department visits (facility charge, $889.22 plus professional fee $493.40), and inpatient stays (daily floor bed $786.19) can make an infectious complication costly.
Trigger finger can also be released percutaneously. This is a reasonable option that avoids the operating room, but NFSGVHS surgeons prefer the open surgery due to concerns for tendon and nerve injury that can result from a blind sweep of the needle.3,4
Related: Prevention of Venous Thromboembolism After Total Joint Replacement
Existing studies found complications for trigger finger release ranging from 1% to 31%.5,6 Wound complications and joint stiffness are known complications.5-7 In this study, 60% of the complications were infections, and 80% of the complications were wound complications. Six of 8 patients with wound-healing complications received perioperative antibiotics. Three patients returned to the operating room for an I+D of the flexor sheath. The results showed a statistically significant link between > 1 digit treated at the same surgery and postoperative complications (P = .027). A PubMed search revealed no existing hand literature with this association.
Risk Factors
Diabetes, tobacco use, type of incision, and number of digits treated were assessed as risk factors for complications after trigger finger surgery. Nicotine is widely accepted as increasing the risk for wound complications.8 Almost 20% of the U.S. population smokes, compared with 22% of the VA population and 32% of active-duty military personnel.9 One in 4 veterans has been diagnosed with diabetes, a well-known predisposing factor in delayed wound healing and infection.10,11 No prior studies were found comparing type of incision or multiple digits treated as complications risk factors.
There is also a well-known association between trigger finger and diabetes. Chronic hyperglycemia results in the accumulation of collagen within tendon sheaths due to impairment of collagen breakdown. Patients with diabetes tend to present with multiple digit involvement and respond less favorably to steroid injections compared with patients without diabetes.12 Wound healing is also impaired in patients with diabetes. All 6 wound infections in this study were in patients with diabetes. Proposed etiologies for wound-healing complications include pathologic angiogenesis, impaired fibroblast proliferation and migration, impaired circulation, decreased oxygenation, and a defective immune response to the injured site.13
Trigger finger may develop in multiple digits. Once surgery has been planned for 1 digit, patients may request surgery on another digit on the same hand that has not had an attempt at nonoperative intervention. The NFSGVHS plastic surgeons have raised the threshold to offer multiple surgical procedures on the same hand at the same operative visit to minimize recovery time and number of visits, particularly when patients are travelling long distances. This may be less convenient; however, the overall cost to the patient and the health care system in the event of a complication is significant. Plastic surgery providers also run an alcohol prep pad over the incision site to prevent inoculation of the flexor sheath during suture removal.
Current recommendations to ameliorate the postoperative risks to the patient and costs to the system include endorsing a more conservative approach to treating trigger finger than was previously practiced at NFSGVHS. The known, less favorable response of patients with diabetes to steroid injections plus their elevated risk of postoperative infection create a catch-22 for the treatment plan. Given the low risk of a single steroid injection to the flexor sheath, this procedure is still recommended as a first-line treatment.
Related: Experience Tells in Hip Arthroplasty
During the 5-year study there was a lower threshold for surgical management and for treatment of multiple digits during the same surgery than the one currently practiced, with an overall consensus of the hospital’s HCPs. The authors recommend that all patients start with a steroid injection before committing to surgery. Patients with diabetes are informed that the injection will cause a temporary rise in their blood glucose.14 If they are resistant to the injection, high-dose oral nonsteroidal anti-inflammatory drugs and/or proximal interphalangeal joint splinting is ordered.
Verification of A1C values showing better chronic management of blood sugar is a procedure HCPs from the NFSGVHS will begin to follow. Preoperative A1C values between 6.5% and 8% in patients known to have diabetes has been recommended.15 A1C values > 7% have been found to be an independent risk factor for stenosing tenosynovitis.16 The total number of trigger finger surgeries may drop with the benefit of improved utilization of resources.
Conclusion
The authors found a statistically significant association between postoperative infection and 2 patient populations: patients with diabetes (P = .002) and patients having > 1 digit released during the same surgery (P = .027). This outcome suggests using caution when offering A1 pulley release in select patient populations.
Acknowledgement
Justine Pierson, BS, research coordinator at University of Florida, for statistical analysis. Funding is through salary.
Author disclosures
The authors report no actual or potential conflicts of interest with regard to this article.
Disclaimer
The opinions expressed herein are those of the authors and do not necessarily reflect those of Federal Practitioner, Frontline Medical Communications Inc., the U.S. Government, or any of its agencies. This article may discuss unlabeled or investigational use of certain drugs. Please review complete prescribing information for specific drugs or drug combinations—including indications, contraindications, warnings, and adverse effects—before administering pharmacologic therapy to patients.
1. Yamada K, Masuko, T, Iwasaki N. Rupture of the flexor digitorum profundus tendon after injections of insoluble steroid for a trigger finger. J Hand Surg Eur. 2011;36(1):77-78.
2. Kerrigan CL, Stanwix MG. Using evidence to minimize the cost of trigger finger care. J Hand Surg Am. 2009;34(6):997-1005.
3. Habbu R, Putnam MD, Adams JE. Percutaneous Release of the A1 pulley: a cadaver study. J Hand Surg Am. 2012;37(11):2273-2277.
4. Guler F, Kose O, Ercan EC, Turan A, Canbora K. Open vs percutaneous release for the treatment of trigger thumb. Orthopedics. 2013;36(10):e1290-e1294.
5. Lim M-H, Lim K-K, Rasheed MZ, Narayana S, Tan B-H. Outcome of open trigger digit release. J Hand Surg Eur. 2007;32(4):457-479.
6. Will R, Lubahn J. Complications of open trigger finger release. J Hand Surg Am. 2010;35(4):594-596.
7. Lee WT, Chong AK. Outcome study of open trigger digit release. J Hand Surg Eur. 2011;36(4):339.
8. Rinker B. The evils of nicotine: An evidence-based guide to smoking and plastic surgery. Ann Plast Surg. 2013;70(5):599-605.
9. Bondurant S, Wedge R, eds. Combating Tobacco Use in Military and Veteran Populations. Washington, DC: The National Academies; 2009.
10. Shilling AM, Raphael J. Diabetes, hyperglycemia, and infections. Best Pract Res Clin Anaesthesiol. 2008;22(3):519-535.
11. Kuppersmith J, Francis J, Kerr E, et al. Advancing evidence-based care for diabetes: Lessons from the Veterans Health Administration. Health Aff. 2007;26(2):156-158.
12. Brown E, Genoway KA. Impact of diabetes on outcomes in hand surgery. J Hand Surg Am. 2011;36(12):2067-2072.
13. Francis-Goforth KN, Harken AH, Saba JD. Normalization of diabetic wound healing. Surgery. 2010;147(3):446-449.
14. Wang AA, Hutchinson DT. The effect of corticosteroid injection for trigger finger on blood glucose level in diabetic patients. J Hand Surg Am. 2006;31(6):979-981.
15. Underwood P, Askari R, Hurwitz S, Chamarthi B, Garg R. Preoperative A1C and Clinical Outcomes in patients with diabetes undergoing major noncardiac surgical procedures. Diabetes Care. 2014; 37(3): 611-616.
16. Vance MC, Tucker JJ, Harness NG. The association of hemoglobin A1c with the prevalence of stenosing tenosynovitis. J Hand Surg Am. 2012;37(9):1765-1769.
Arthritis, Infectious Tenosynovitis, and Tendon Rupture in a Patient With Rheumatoid Arthritis and Psoriasis
Compared with monoarticular arthritis, polyarticular arthritis may yield an initially narrower differential diagnosis that focuses on systemic inflammatory conditions, such as rheumatoid arthritis (RA). Approximately 15% to 30% of septic arthritis is polyarticular, of which about 45% is associated with underlying RA.1,2 Regardless of the number of joints involved, septic (infectious) arthritis is a valid consideration given the morbidity and mortality.
In a retrospective study in the United Kingdom (UK) between 1982 and 1991, the morbidity and mortality of septic arthritis was 31.6% and 11.5%, respectively, and 16% of the study population had RA.3 A review of the literature by Dubost and colleagues found that polyarticular septic arthritis (PASA) has a mortality of 31% to 42% compared with 4% to 8% for monoarticular septic arthritis, and RA was present in 67% of the PASA fatalities.1
Related: The Golden Era of Treatment in Rheumatology
Rheumatoid arthritis and its treatment predispose patients to septic arthritis. Septic arthritis in the UK general population is 0.42 per 100 patient-years for patients with RA on antitumor necrosis factor therapy.3,4 In a retrospective study in the U.S., the incidence of septic arthritis was 0.40 per 100 patient-years for patients with RA compared with 0.02 per 100 patient-years for patients without RA.5
Other complications of RA include infectious tenosynovitis and tendon rupture. The incidence and prevalence of infectious tenosynovitis and tendon rupture in RA are not firmly established in the literature.
We present a patient with RA and psoriasis who responded initially to acute management for RA but subsequently was diagnosed with culture-negative polyarticular arthritis and infectious tenosynovitis associated with beta hemolytic group G Streptococcus (GGS), a part of Streptococcus milleri (S. milleri). During surgery, he was also found to have bilateral extensor pollicus longus (EPL) tendon rupture. Given the possible morbidity, the authors believe this patient may be of interest to the medical community.
Case Presentation
A 69-year-old African American male presented with 3 to 4 days of swelling and pain of bilateral wrists, bilateral hands, and the left ankle with subjective, but resolved, fevers and chills. His medical history was significant for seropositive erosive RA, psoriasis, hypertension, hyperlipidemia, alcohol abuse, chronic tobacco use, osteoporosis, and glaucoma. He did not have diabetes, reported no IV drug abuse, and except for the immunosuppressive effects of his medications, was not otherwise immunocompromised.
For 2 years in the outpatient setting, the rheumatology clinic had been managing the patient’s rheumatoid factor (RF) positive and anti-cyclic citrullinated peptide (CCP) antibody positive erosive RA with etanercept 25 mg subcutaneously twice a week. The RA affected his hands, wrists, shoulders, and ankles bilaterally but was successfully controlled. The dermatology clinic was managing the patient’s psoriasis with calcipotriene cream 0.005% twice a week and clobetasol ointment 0.05% twice a week. Psoriatic plaques were noted on bilateral elbows, bilateral dorsal hands, and bilateral dorsal feet.
Initial Evaluation
At evaluation, the patient’s vital signs revealed a temperature of 36.3°C (97.3°F), pulse of 102 beats per minute, respiratory rate of 16 breaths per minute, oxygen saturation of 99% on room air, and blood pressure of 102/70 mm Hg. He was found to have edema, tenderness, and erythema of the wrists bilaterally and left metacarpophalangeal joints (MCPs) and edematous right MCPs and left medial ankle.
The patient had been nonadherent with etanercept for 5 monthsand restarted taking the medication only 2 weeks before presentation. He had noticed worsening arthritis for at least 1 month. His last RA flare was approximately 1 year before presentation. Additional symptoms included 4 days of nausea, nonbloody and nonbilious emesis, left lower quadrant pain, and diarrhea without melena or hematochezia.
Initial laboratory studies found 3.2 k/μL white blood cells (WBCs) with a differential of 11.9% lymphocytes, 4.2% monocytes, 83.3% neutrophils, 0.5% eosinophils, and 0.1% basophils; 165 k/μL platelets; 96 mm/h erythrocyte sedimentation rate (ESR); and 45 mg/dL C-reactive protein. The patient was diagnosed with viral gastroenteritis and RA flare and was admitted for inpatient management secondary to limited ability to care for himself.
Related: Infliximab-Induced Complications
The patient was started on prednisone 40 mg orally once a day (for 5 days) for empiric treatment of an RA flare and continued on etanercept. The inpatient rheumatology service was consulted. Further evaluation later that day found involvement of the proximal interphalangeal joints and elbows and tenderness of the tendons of the dorsal hand bilaterally. Over the next 2 days, the patient remained afebrile and WBCs were within normal limits. Edema, erythema, and tenderness of the involved joints somewhat improved, but tenderness along the tendons of the dorsal hand worsened, which concerned the managing teams for infectious tenosynovitis.
By day 4, the patient was afebrile and had a leukocytosis of 12.9 k/μLwith neutrophils 86.7%, but improvement of erythema, pain, and range of motion of involved joints and no tenderness to palpation of tendons was noted. The inpatient orthopedic surgery service evaluated the patient and did not find sufficient evidence necessitating surgical intervention.
Worsening Condition
On day 6, arthrocentesis of the left wrist was performed secondary to worsening of erythema and edema. The patient experienced new edema of the left shoulder and leukocytosis continued to trend upward (15.7 k/μL on day 6). Purulent aspirate (1.5 mL) was obtained from the fluctuance and tenosynovium of the left wrist. Empiric vancomycin 1 g IV twice daily and ceftriaxone 2 g IV daily were started and continued for 3 days. By this point in his hospital course, the patient had received 1 dose of etanercept. Prednisone and etanercept were previously discontinued because of the discovered infection. Blood cultures were drawn and had no growth (Table). Gastroenterology studies were limited to stool cultures and did not include colonoscopy. Leukocytosis began trending down.
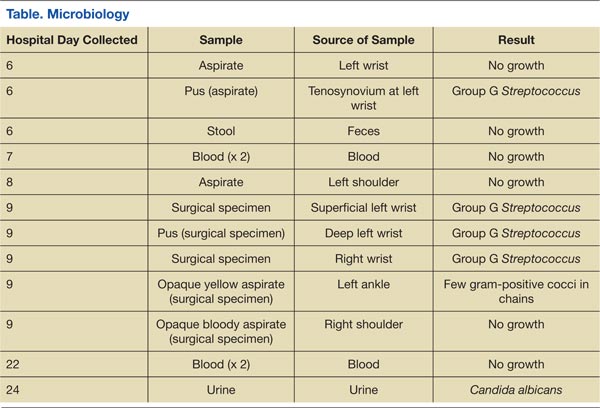
On day 8, antibiotics were tailored to penicillin G 4 million units IV every 4 hours following growth of GGS from the sample of the left wrist. Subsequently, synovial fluid (3 mL) from the left shoulder was obtained following initiation of antibiotic therapy and had no growth. Magnetic resonance imaging (MRI) found tenosynovitis of the left ankle and right wrist.
On day 9, transthoracic echocardiography was performed and found no evidence of infectious endocarditis. Later that night, the patient was taken to surgery for incision and drainage/debridement of bilateral wrists and left ankle, synovectomy of right wrist, and aspiration of right shoulder. Findings included abscess in the left wrist and inflammatory synovitis and bilateral EPL tendon rupture consistent with RA. Pus from the left ankle had few gram-positive cocci in chains with no growth, and the specimens from both wrists grew GGS. Aspirate from the left ankle was an opaque yellow fluid with 14,900/mm3 WBC, 30,000/mm3 red blood cells (RBC), 97% neutrophils, 1% macrophages, 2% lymphocytes, and 0% monocytes. Aspirate from the right shoulder was an opaque bloody fluid with 10,100/mm3 WBC, 40,000/mm3 RBC, 95% neutrophils, 2% macrophages, 1% lymphocytes, and 1% monocytes. On day 10, sulfasalazine 500 mg twice a day was initiated for RA.
Following surgery and continued antibiotics, the patient’s leukocytosis resolved, and improvement was seen in all joints with decreased edema, erythema, and pain and increased range of motion. Postoperative recovery was complicated by ileus, urinary retention, and fungal (Candida albicans) urinary tract infection, all of which resolved without significant complications. The inpatient rheumatology service restarted prednisone at a lower dose of 20 mg. The patient became afebrile and sufficiently stable for transfer to a lower level of care with continued physical therapy and IV antibiotics for another 3 weeks.
Discussion
The patient had 2 underlying systemic inflammatory conditions: RA and psoriasis. The underlying chronic arthritis was likely caused by RA, not psoriatic arthritis (PsA). The patient met the 2010 American College of Rheumatology criteria but failed to meet the classification criteria for PsA.6,7 However, the clinical features of RA and PsA overlap. Rheumatoid factor and CCP can be positive laboratory findings in both RA and PsA.8-14 Tenosynovitis is found in about half of RA patients and PsA patients (P > .05).15 In its evaluation of the patient, the inpatient rheumatology service suspected that the patient may have had RA with components of PsA.
Rheumatoid arthritis complicates the diagnosis of septic arthritis. In a study by Nolla and colleagues, a mean of 7.3 days (range 3 to 18 days) elapsed before a diagnosis of septic arthritis was made in 10 patients with RA on corticosteroids.2 Consideration of risk factors such as increasing age, male sex, tobacco use, extra-articular manifestations of RA, positive RF, rheumatoid nodules, poor functional capacity, high ESR, leukopenia, comorbidities (chronic lung disease, alcoholism, organic brain disease, and diabetes), and the use of corticosteroids may expedite the diagnosis of infections in patients with RA.16 In this case, the patient had some of these risk factors: age, male sex, alcoholism, chronic tobacco use, positive RF, high ESR, and leukopenia (at presentation).
Related: Trend Toward Concomitant Supplements and Medications
The history of medication nonadherence of etanercept with progressively worsening arthritis and early clinical improvement (reduction in erythema, edema, and pain and temporary loss of signs of tenosynovitis on examination) while on prednisone suggested that the patient had a RA flare. The prednisone likely alleviated the inflammatory process but created an immunosuppressed state that allowed GGS to invade and possibly disseminate. Alternately, the patient may have been infected before presentation. The lack of a definitive time line for his case prevented the authors from forming conclusions about a possible causal relationship between the infection and medications. The subjective fevers before admission were nonspecific and could have been caused by RA, presumed gastroenteritis, or other undiagnosed infectious processes. The observed leukocytosis may have been initially corticosteroid-induced.17
Septic Arthritis
The suspicion of septic arthritis and infectious tenosynovitis substantially increased on day 6 with worsening symptoms, involvement of additional joints, and spiking fevers. Group G Streptococcus was obtained from the aspirate of the left wrist and from the surgical specimens from the bilateral wrists. The clinical presentation, MRI imaging studies, and surgical and nonsurgical specimens supported a diagnosis of GGS tenosynovitis. However, there was no clear evidence (ie, positive culture with identified organism) of septic arthritis, likely secondary to early septic arthritis and initiation of antibiotics before joint aspirations. The aspirate from the left ankle was yellow and opaque, but the culture was negative.
The pathogenic organism in the patient was GGS. Group G Streptococcus is normal flora of the oral cavity, gastrointestinal (GI) tract, upper respiratory tract, genital tract, and skin, which were all possible sources of seeding.18 Streptococcal species account for about 20% of septic arthritis, and GGS arthritis accounts for 4% to 19% of streptococcal arthritis.19-22 From a review of the literature, 2 cases of GGS tenosynovitis have been published.23,24 However, in an ultrasound study and MRI study, 49% and 43%, respectively, of patients with RA had tenosynovitis of the tendons of the hands.15,25
GGS Demographics
About three-quarters (71%) of patients with GGS arthritis are male.19 The analysis of the literature by Bronze and colleagues found that chronic joint disease and alcoholism are present in 34% and 14% of patients with GGS arthritis, respectively. One-quarter (23% from Dubost and colleagues) to one-third (32% from Schattner and colleagues) of patients with GGS arthritis have RA.19,26
Fever is present in less than half (43%) of patients with GGS arthritis.19 Positive synovial fluid is expected in 90% of patients.19 Leukocytosis and elevated ESR need not be present.27,28 The arthritis is polyarticular in one-quarter of patients (24% from Bronze and colleagues and 26% from Dubost and colleagues).19,26
Positive blood cultures can be expected in one-fourth (26%) of patients with GGS arthritis.19 The patient’s blood cultures were negative. Blood cultures drawn before initiation of antibiotics yielded no growth, so if the spread was hematogenous, the bacteremia was transient or intermittent. Before and after initiation of antibiotics, specimens from the shoulders did not grow colonies, whereas specimens from the wrists did. If the shoulders were truly infected, these findings and the notably later involvement of the shoulders suggest that the shoulders may have been seeded later in the hospital course.
Trenkner and colleagues proposed that GI abnormalities provide a portal of entry for GGS, which is under the umbrella of S. milleri.29S. milleri is associated with abscess formation, usually of the GI tract.30-32 In the study patient, the possible gastroenteritis may have provided such a portal of entry and subsequent seeding to the joints, and an abscess was found in the left wrist.
Tendon Rupture
Additionally, bilateral EPL tendon rupture likely occurred as a consequence of the inflammatory process from RA and infectious tenosynovitis in the patient. According to Zheng and colleagues, tenosynovitis is an inflammatory process of the synovial tendon sheath that may result in degeneration and rupture of the tendons and may contribute to bone erosions, development of joint deformities, and loss of functional capacity.33 In a histologic study of a ruptured EPL tendon from a patient with RA, Harris observed a chronic inflammatory cellular reaction.34 Harris also described a male with RA with unconfirmed bilateral EPL rupture.34 Björkman and colleague identified previous injury, RA, and local or systemic steroids as important etiologic factors for EPL tendon rupture.35
As in the case of this patient, the utilization of both medical and surgical therapy is not uncommon for treating GGS infection. Antibiotic therapy typically consists of penicillin (74%).26 Surgical intervention is necessary in 16% to 37% of patients.19,26 This patient required both penicillin and incision and drainage/debridement before significant clinical improvement was noted. Prognosis of GGS arthritis is favorable with 5% mortality.26
Conclusion
Septic arthritis and infectious tenosynovitis are readily treatable with low mortality if promptly identified. Identification can be masked by other medical conditions, such as RA and psoriasis, and their associated immunosuppressive treatment. Bilateral EPL tendon rupture may be a complication of RA, particularly with an underlying septic arthritis and infectious tenosynovitis.
Author disclosures
The authors report no actual or potential conflicts of interest with regard to this article.
Disclaimer
The opinions expressed herein are those of the authors and do not necessarily reflect those of Federal Practitioner, Frontline Medical Communications Inc., the U.S. Government, or any of its agencies. This article may discuss unlabeled or investigational use of certain drugs. Please review the complete prescribing information for specific drugs or drug combinations—including indications, contraindications, warnings, and adverse effects—before administering pharmacologic therapy to patients.
1. Dubost JJ, Fis I, Denis P, et al. Polyarticular septic arthritis. Medicine (Baltimore). 1993;72(5):296-310.
2. Nolla JM, Gómez-Vaquero C, Fiter J, et al. Pyarthrosis in patients with rheumatoid arthritis: A detailed analysis of 10 cases and literature review. Semin Arthritis Rheum. 2000;30(2):121-126.
3.Weston VC, Jones AC, Bradbury N, Fawthrop F, Doherty M. Clinical features and outcome of septic arthritis in a single UK Health District 1982-1991. Ann Rheum Dis. 1999;58(4):214-219.
4. Galloway JB, Hyrich KL, Mercer LK, et al; BSR Biologics Register. Risk of septic arthritis in patients with rheumatoid arthritis and the effect of anti-TNF therapy: Results from the British Society for Rheumatology Biologics Register. Ann Rheum Dis. 2011;70(10):1810-1814.
5. Doran MF, Crowson CS, Pond GR, O’Fallon WM, Gabriel SE. Frequency of infection in patients with rheumatoid arthritis compared with controls: A population-based study. Arthritis Rheum. 2002;46(9):2287-2293.
6. Aletaha D, Neogi T, Silman AJ, et al. 2010 Rheumatoid arthritis classification criteria: An American College of Rheumatology/European League Against Rheumatism collaborative initiative. Arthritis Rheum. 2010;62(9):2569-2581.
7. Taylor W, Gladman D, Helliwell P, Marchesoni A, Mease P, Mielants H; CASPAR Study Group. Classification criteria for psoriatic arthritis: Development of new criteria from a large international study. Arthritis Rheum. 2006;54(8):2665-2673.
8. Gladman DD, Shuckett R, Russell ML, Thorne JC, Schachter RK. Psoriatic arthritis (PSA)—An analysis of 220 patients. Q J Med. 1987;62(238):127-141.
9. Bogliolo L, Alpini C, Caporali R, Scirè CA, Moratti R, Montecucco C. Antibodies to cyclic citrullinated peptides in psoriatic arthritis. J Rheumatol. 2005;32(3):511-515.
10. Vander Cruyssen B, Hoffman IE, Zmierczak H, et al. Anti-citrullinated peptide antibodies may occur in patients with psoriatic arthritis. Ann Rheum Dis. 2005;64(8):1145-1149.
11. Alenius GM, Berglin E, Rantapää Dahlgvist S. Antibodies against cyclic citrullinated peptide (CCP) in psoriatic patients with or without joint inflammation. Ann Rheum Dis. 2006;65(3):398-400.
12. Candia L, Marquez J, Gonzalez C, et al. Low frequency of anticyclic citrullinated peptide antibodies in psoriatic arthritis but not in cutaneous psoriasis. J Clin Rheumatol. 2006;12(5):226-229.
13. Inanc N, Dalkilic E, Kamali S, et al. Anti-CCP antibodies in rheumatoid arthritis and psoriatic arthritis. Clin Rheumatol. 2007;26(1):17-23.
14. Popescu C, Zofota S, Bojinca V, Ionescu R. Anti-cyclic citrullinated peptide antibodies in psoriatic arthritis—Cross-sectional study and literature review. J Med Life. 2013;6(4):376-382.
15. Schoellnast H, Deutschmann HA, Hermann J, et al. Psoriatic arthritis and rheumatoid arthritis: Findings in contrast-enhanced MRI. AJR Am J Roentgenol. 2006;187(2):351-357.
16. Doran MF, Crowson CS, Pond GR, O’Fallon WM, Gabriel SE. Predictors of infection in rheumatoid arthritis. Arthritis Rheum. 2002;46(9):2294-2300.
17. Shoenfeld Y, Gurewich Y, Gallant LA, Pinkhas J. Prednisone-induced leukocytosis. Influence of dosage, method and duration of administration on the degree of leukocytosis. Am J Med. 1981;71(5):773-778.
18. Gossling J. Occurrence and pathogenicity of the Streptococcus milleri group. Rev Infect Dis. 1988;10(2):257-285.
19. Dubost JJ, Soubrier M, De Champs C, Ristori JM, Sauvezie B. Streptococcal septic arthritis in adults. A study of 55 cases with a literature review. Joint Bone Spine. 2004;71(4):303-311.
20. Ryan MJ, Kavanagh R, Wall PG, Hazleman BL. Bacterial joint infections in England and Wales: Analysis of bacterial isolates over a four year period. Br J Rheumatol. 1997;36(3):370-373.
21. Morgan DS, Fisher D, Merianos A, Currie BJ. An 18 year clinical review of septic arthritis from tropical Australia. Epidemiol Infect. 1996;117(3):423-428.
22. Kaandorp CJ, Dinant HJ, van de Laar MA, Moens HJ, Prins AP, Dijkmans BA. Incidence and sources of native and prosthetic joint infection: A community based prospective survey. Ann Rheum Dis. 1997;56(8):470-475.
23. Bradlow A, Mitchell RG, Mowat AG. Group G streptococcal arthritis. Rheumatol Rehabil. 1982;21(4):206-210.
24. Meier JL, Gerster JC. Bursitis and tenosynovitis caused by group G streptococci. J Rheumatol. 1983;10(5):817-818.
25. Filippucci E, Gabba A, Di Geso L, Girolimetti R, Salaffi F, Grassi W. Hand tendon involvement in rheumatoid arthritis: An ultrasound study. Semin Arthritis Rheum. 2012;41(6):752-760.
26. Bronze MS, Whitby S, Schaberg DR. Group G streptococcal arthritis: Case report and review of the literature. Am J Med Sci. 1997;313(4):239-243.
27. Schattner A, Vosti KL. Bacterial arthritis due to beta-hemolytic streptococci of serogroups A, B, C, F, and G. Analysis of 23 cases and a review of the literature. Medicine (Baltimore). 1998;77(2):122-139.
28. Gaunt PN, Seal DV. Group G streptococcal infection of joints and joint prostheses. J Infect. 1986;13(2):115-123.
29. Trenkner SW, Braunstein EM, Lynn MD, Ike RW. Group G streptococcal arthritis and bowel disease: A rare enteropathic arthropathy. Gastrointest Radiol. 1987;12(3):265-267.
30. Bert F, Bariou-Lancelin M, Lambert-Zechovsky N. Clinical significance of bacteremia involving the “Streptococcus milleri” group: 51 cases and review. Clin Infect Dis. 1998;27(2):385-387.
31. Casariego E, Rodriguez A, Corredoira JC, et al. Prospective study of Streptococcus milleri bacteremia. Eur J Clin Microbiol Infect Dis. 1996;15(3):194-200.
32. Jacobs JA, Pietersen HG, Stobberingh EE, Soeters PB. Bacteremia involving the “Streptococcus milleri” group: Analysis of 19 cases. Clin Infect Dis. 1994;19(4):704-713.
33. Zheng S, Robinson E, Yeoman S, et al. MRI bone oedema predicts eight year tendon function at the wrist but not the requirement for orthopaedic surgery in rheumatoid arthritis. Ann Rheum Dis. 2006;65(5):607-611.
34. Harris R. Spontaneous rupture of the tendon of extensor pollicis longus as a complication of rheumatoid arthritis. Ann Rheum Dis. 1951;10(3):298-306.
35. Björkman A, Jörgsholm P. Rupture of the extensor pollicis longus tendon: A study of aetiological factors. Scand J Plast Reconstr Surg Hand Surg. 2004;38(1):32-35.
Compared with monoarticular arthritis, polyarticular arthritis may yield an initially narrower differential diagnosis that focuses on systemic inflammatory conditions, such as rheumatoid arthritis (RA). Approximately 15% to 30% of septic arthritis is polyarticular, of which about 45% is associated with underlying RA.1,2 Regardless of the number of joints involved, septic (infectious) arthritis is a valid consideration given the morbidity and mortality.
In a retrospective study in the United Kingdom (UK) between 1982 and 1991, the morbidity and mortality of septic arthritis was 31.6% and 11.5%, respectively, and 16% of the study population had RA.3 A review of the literature by Dubost and colleagues found that polyarticular septic arthritis (PASA) has a mortality of 31% to 42% compared with 4% to 8% for monoarticular septic arthritis, and RA was present in 67% of the PASA fatalities.1
Related: The Golden Era of Treatment in Rheumatology
Rheumatoid arthritis and its treatment predispose patients to septic arthritis. Septic arthritis in the UK general population is 0.42 per 100 patient-years for patients with RA on antitumor necrosis factor therapy.3,4 In a retrospective study in the U.S., the incidence of septic arthritis was 0.40 per 100 patient-years for patients with RA compared with 0.02 per 100 patient-years for patients without RA.5
Other complications of RA include infectious tenosynovitis and tendon rupture. The incidence and prevalence of infectious tenosynovitis and tendon rupture in RA are not firmly established in the literature.
We present a patient with RA and psoriasis who responded initially to acute management for RA but subsequently was diagnosed with culture-negative polyarticular arthritis and infectious tenosynovitis associated with beta hemolytic group G Streptococcus (GGS), a part of Streptococcus milleri (S. milleri). During surgery, he was also found to have bilateral extensor pollicus longus (EPL) tendon rupture. Given the possible morbidity, the authors believe this patient may be of interest to the medical community.
Case Presentation
A 69-year-old African American male presented with 3 to 4 days of swelling and pain of bilateral wrists, bilateral hands, and the left ankle with subjective, but resolved, fevers and chills. His medical history was significant for seropositive erosive RA, psoriasis, hypertension, hyperlipidemia, alcohol abuse, chronic tobacco use, osteoporosis, and glaucoma. He did not have diabetes, reported no IV drug abuse, and except for the immunosuppressive effects of his medications, was not otherwise immunocompromised.
For 2 years in the outpatient setting, the rheumatology clinic had been managing the patient’s rheumatoid factor (RF) positive and anti-cyclic citrullinated peptide (CCP) antibody positive erosive RA with etanercept 25 mg subcutaneously twice a week. The RA affected his hands, wrists, shoulders, and ankles bilaterally but was successfully controlled. The dermatology clinic was managing the patient’s psoriasis with calcipotriene cream 0.005% twice a week and clobetasol ointment 0.05% twice a week. Psoriatic plaques were noted on bilateral elbows, bilateral dorsal hands, and bilateral dorsal feet.
Initial Evaluation
At evaluation, the patient’s vital signs revealed a temperature of 36.3°C (97.3°F), pulse of 102 beats per minute, respiratory rate of 16 breaths per minute, oxygen saturation of 99% on room air, and blood pressure of 102/70 mm Hg. He was found to have edema, tenderness, and erythema of the wrists bilaterally and left metacarpophalangeal joints (MCPs) and edematous right MCPs and left medial ankle.
The patient had been nonadherent with etanercept for 5 monthsand restarted taking the medication only 2 weeks before presentation. He had noticed worsening arthritis for at least 1 month. His last RA flare was approximately 1 year before presentation. Additional symptoms included 4 days of nausea, nonbloody and nonbilious emesis, left lower quadrant pain, and diarrhea without melena or hematochezia.
Initial laboratory studies found 3.2 k/μL white blood cells (WBCs) with a differential of 11.9% lymphocytes, 4.2% monocytes, 83.3% neutrophils, 0.5% eosinophils, and 0.1% basophils; 165 k/μL platelets; 96 mm/h erythrocyte sedimentation rate (ESR); and 45 mg/dL C-reactive protein. The patient was diagnosed with viral gastroenteritis and RA flare and was admitted for inpatient management secondary to limited ability to care for himself.
Related: Infliximab-Induced Complications
The patient was started on prednisone 40 mg orally once a day (for 5 days) for empiric treatment of an RA flare and continued on etanercept. The inpatient rheumatology service was consulted. Further evaluation later that day found involvement of the proximal interphalangeal joints and elbows and tenderness of the tendons of the dorsal hand bilaterally. Over the next 2 days, the patient remained afebrile and WBCs were within normal limits. Edema, erythema, and tenderness of the involved joints somewhat improved, but tenderness along the tendons of the dorsal hand worsened, which concerned the managing teams for infectious tenosynovitis.
By day 4, the patient was afebrile and had a leukocytosis of 12.9 k/μLwith neutrophils 86.7%, but improvement of erythema, pain, and range of motion of involved joints and no tenderness to palpation of tendons was noted. The inpatient orthopedic surgery service evaluated the patient and did not find sufficient evidence necessitating surgical intervention.
Worsening Condition
On day 6, arthrocentesis of the left wrist was performed secondary to worsening of erythema and edema. The patient experienced new edema of the left shoulder and leukocytosis continued to trend upward (15.7 k/μL on day 6). Purulent aspirate (1.5 mL) was obtained from the fluctuance and tenosynovium of the left wrist. Empiric vancomycin 1 g IV twice daily and ceftriaxone 2 g IV daily were started and continued for 3 days. By this point in his hospital course, the patient had received 1 dose of etanercept. Prednisone and etanercept were previously discontinued because of the discovered infection. Blood cultures were drawn and had no growth (Table). Gastroenterology studies were limited to stool cultures and did not include colonoscopy. Leukocytosis began trending down.
On day 8, antibiotics were tailored to penicillin G 4 million units IV every 4 hours following growth of GGS from the sample of the left wrist. Subsequently, synovial fluid (3 mL) from the left shoulder was obtained following initiation of antibiotic therapy and had no growth. Magnetic resonance imaging (MRI) found tenosynovitis of the left ankle and right wrist.
On day 9, transthoracic echocardiography was performed and found no evidence of infectious endocarditis. Later that night, the patient was taken to surgery for incision and drainage/debridement of bilateral wrists and left ankle, synovectomy of right wrist, and aspiration of right shoulder. Findings included abscess in the left wrist and inflammatory synovitis and bilateral EPL tendon rupture consistent with RA. Pus from the left ankle had few gram-positive cocci in chains with no growth, and the specimens from both wrists grew GGS. Aspirate from the left ankle was an opaque yellow fluid with 14,900/mm3 WBC, 30,000/mm3 red blood cells (RBC), 97% neutrophils, 1% macrophages, 2% lymphocytes, and 0% monocytes. Aspirate from the right shoulder was an opaque bloody fluid with 10,100/mm3 WBC, 40,000/mm3 RBC, 95% neutrophils, 2% macrophages, 1% lymphocytes, and 1% monocytes. On day 10, sulfasalazine 500 mg twice a day was initiated for RA.
Following surgery and continued antibiotics, the patient’s leukocytosis resolved, and improvement was seen in all joints with decreased edema, erythema, and pain and increased range of motion. Postoperative recovery was complicated by ileus, urinary retention, and fungal (Candida albicans) urinary tract infection, all of which resolved without significant complications. The inpatient rheumatology service restarted prednisone at a lower dose of 20 mg. The patient became afebrile and sufficiently stable for transfer to a lower level of care with continued physical therapy and IV antibiotics for another 3 weeks.
Discussion
The patient had 2 underlying systemic inflammatory conditions: RA and psoriasis. The underlying chronic arthritis was likely caused by RA, not psoriatic arthritis (PsA). The patient met the 2010 American College of Rheumatology criteria but failed to meet the classification criteria for PsA.6,7 However, the clinical features of RA and PsA overlap. Rheumatoid factor and CCP can be positive laboratory findings in both RA and PsA.8-14 Tenosynovitis is found in about half of RA patients and PsA patients (P > .05).15 In its evaluation of the patient, the inpatient rheumatology service suspected that the patient may have had RA with components of PsA.
Rheumatoid arthritis complicates the diagnosis of septic arthritis. In a study by Nolla and colleagues, a mean of 7.3 days (range 3 to 18 days) elapsed before a diagnosis of septic arthritis was made in 10 patients with RA on corticosteroids.2 Consideration of risk factors such as increasing age, male sex, tobacco use, extra-articular manifestations of RA, positive RF, rheumatoid nodules, poor functional capacity, high ESR, leukopenia, comorbidities (chronic lung disease, alcoholism, organic brain disease, and diabetes), and the use of corticosteroids may expedite the diagnosis of infections in patients with RA.16 In this case, the patient had some of these risk factors: age, male sex, alcoholism, chronic tobacco use, positive RF, high ESR, and leukopenia (at presentation).
Related: Trend Toward Concomitant Supplements and Medications
The history of medication nonadherence of etanercept with progressively worsening arthritis and early clinical improvement (reduction in erythema, edema, and pain and temporary loss of signs of tenosynovitis on examination) while on prednisone suggested that the patient had a RA flare. The prednisone likely alleviated the inflammatory process but created an immunosuppressed state that allowed GGS to invade and possibly disseminate. Alternately, the patient may have been infected before presentation. The lack of a definitive time line for his case prevented the authors from forming conclusions about a possible causal relationship between the infection and medications. The subjective fevers before admission were nonspecific and could have been caused by RA, presumed gastroenteritis, or other undiagnosed infectious processes. The observed leukocytosis may have been initially corticosteroid-induced.17
Septic Arthritis
The suspicion of septic arthritis and infectious tenosynovitis substantially increased on day 6 with worsening symptoms, involvement of additional joints, and spiking fevers. Group G Streptococcus was obtained from the aspirate of the left wrist and from the surgical specimens from the bilateral wrists. The clinical presentation, MRI imaging studies, and surgical and nonsurgical specimens supported a diagnosis of GGS tenosynovitis. However, there was no clear evidence (ie, positive culture with identified organism) of septic arthritis, likely secondary to early septic arthritis and initiation of antibiotics before joint aspirations. The aspirate from the left ankle was yellow and opaque, but the culture was negative.
The pathogenic organism in the patient was GGS. Group G Streptococcus is normal flora of the oral cavity, gastrointestinal (GI) tract, upper respiratory tract, genital tract, and skin, which were all possible sources of seeding.18 Streptococcal species account for about 20% of septic arthritis, and GGS arthritis accounts for 4% to 19% of streptococcal arthritis.19-22 From a review of the literature, 2 cases of GGS tenosynovitis have been published.23,24 However, in an ultrasound study and MRI study, 49% and 43%, respectively, of patients with RA had tenosynovitis of the tendons of the hands.15,25
GGS Demographics
About three-quarters (71%) of patients with GGS arthritis are male.19 The analysis of the literature by Bronze and colleagues found that chronic joint disease and alcoholism are present in 34% and 14% of patients with GGS arthritis, respectively. One-quarter (23% from Dubost and colleagues) to one-third (32% from Schattner and colleagues) of patients with GGS arthritis have RA.19,26
Fever is present in less than half (43%) of patients with GGS arthritis.19 Positive synovial fluid is expected in 90% of patients.19 Leukocytosis and elevated ESR need not be present.27,28 The arthritis is polyarticular in one-quarter of patients (24% from Bronze and colleagues and 26% from Dubost and colleagues).19,26
Positive blood cultures can be expected in one-fourth (26%) of patients with GGS arthritis.19 The patient’s blood cultures were negative. Blood cultures drawn before initiation of antibiotics yielded no growth, so if the spread was hematogenous, the bacteremia was transient or intermittent. Before and after initiation of antibiotics, specimens from the shoulders did not grow colonies, whereas specimens from the wrists did. If the shoulders were truly infected, these findings and the notably later involvement of the shoulders suggest that the shoulders may have been seeded later in the hospital course.
Trenkner and colleagues proposed that GI abnormalities provide a portal of entry for GGS, which is under the umbrella of S. milleri.29S. milleri is associated with abscess formation, usually of the GI tract.30-32 In the study patient, the possible gastroenteritis may have provided such a portal of entry and subsequent seeding to the joints, and an abscess was found in the left wrist.
Tendon Rupture
Additionally, bilateral EPL tendon rupture likely occurred as a consequence of the inflammatory process from RA and infectious tenosynovitis in the patient. According to Zheng and colleagues, tenosynovitis is an inflammatory process of the synovial tendon sheath that may result in degeneration and rupture of the tendons and may contribute to bone erosions, development of joint deformities, and loss of functional capacity.33 In a histologic study of a ruptured EPL tendon from a patient with RA, Harris observed a chronic inflammatory cellular reaction.34 Harris also described a male with RA with unconfirmed bilateral EPL rupture.34 Björkman and colleague identified previous injury, RA, and local or systemic steroids as important etiologic factors for EPL tendon rupture.35
As in the case of this patient, the utilization of both medical and surgical therapy is not uncommon for treating GGS infection. Antibiotic therapy typically consists of penicillin (74%).26 Surgical intervention is necessary in 16% to 37% of patients.19,26 This patient required both penicillin and incision and drainage/debridement before significant clinical improvement was noted. Prognosis of GGS arthritis is favorable with 5% mortality.26
Conclusion
Septic arthritis and infectious tenosynovitis are readily treatable with low mortality if promptly identified. Identification can be masked by other medical conditions, such as RA and psoriasis, and their associated immunosuppressive treatment. Bilateral EPL tendon rupture may be a complication of RA, particularly with an underlying septic arthritis and infectious tenosynovitis.
Author disclosures
The authors report no actual or potential conflicts of interest with regard to this article.
Disclaimer
The opinions expressed herein are those of the authors and do not necessarily reflect those of Federal Practitioner, Frontline Medical Communications Inc., the U.S. Government, or any of its agencies. This article may discuss unlabeled or investigational use of certain drugs. Please review the complete prescribing information for specific drugs or drug combinations—including indications, contraindications, warnings, and adverse effects—before administering pharmacologic therapy to patients.
1. Dubost JJ, Fis I, Denis P, et al. Polyarticular septic arthritis. Medicine (Baltimore). 1993;72(5):296-310.
2. Nolla JM, Gómez-Vaquero C, Fiter J, et al. Pyarthrosis in patients with rheumatoid arthritis: A detailed analysis of 10 cases and literature review. Semin Arthritis Rheum. 2000;30(2):121-126.
3.Weston VC, Jones AC, Bradbury N, Fawthrop F, Doherty M. Clinical features and outcome of septic arthritis in a single UK Health District 1982-1991. Ann Rheum Dis. 1999;58(4):214-219.
4. Galloway JB, Hyrich KL, Mercer LK, et al; BSR Biologics Register. Risk of septic arthritis in patients with rheumatoid arthritis and the effect of anti-TNF therapy: Results from the British Society for Rheumatology Biologics Register. Ann Rheum Dis. 2011;70(10):1810-1814.
5. Doran MF, Crowson CS, Pond GR, O’Fallon WM, Gabriel SE. Frequency of infection in patients with rheumatoid arthritis compared with controls: A population-based study. Arthritis Rheum. 2002;46(9):2287-2293.
6. Aletaha D, Neogi T, Silman AJ, et al. 2010 Rheumatoid arthritis classification criteria: An American College of Rheumatology/European League Against Rheumatism collaborative initiative. Arthritis Rheum. 2010;62(9):2569-2581.
7. Taylor W, Gladman D, Helliwell P, Marchesoni A, Mease P, Mielants H; CASPAR Study Group. Classification criteria for psoriatic arthritis: Development of new criteria from a large international study. Arthritis Rheum. 2006;54(8):2665-2673.
8. Gladman DD, Shuckett R, Russell ML, Thorne JC, Schachter RK. Psoriatic arthritis (PSA)—An analysis of 220 patients. Q J Med. 1987;62(238):127-141.
9. Bogliolo L, Alpini C, Caporali R, Scirè CA, Moratti R, Montecucco C. Antibodies to cyclic citrullinated peptides in psoriatic arthritis. J Rheumatol. 2005;32(3):511-515.
10. Vander Cruyssen B, Hoffman IE, Zmierczak H, et al. Anti-citrullinated peptide antibodies may occur in patients with psoriatic arthritis. Ann Rheum Dis. 2005;64(8):1145-1149.
11. Alenius GM, Berglin E, Rantapää Dahlgvist S. Antibodies against cyclic citrullinated peptide (CCP) in psoriatic patients with or without joint inflammation. Ann Rheum Dis. 2006;65(3):398-400.
12. Candia L, Marquez J, Gonzalez C, et al. Low frequency of anticyclic citrullinated peptide antibodies in psoriatic arthritis but not in cutaneous psoriasis. J Clin Rheumatol. 2006;12(5):226-229.
13. Inanc N, Dalkilic E, Kamali S, et al. Anti-CCP antibodies in rheumatoid arthritis and psoriatic arthritis. Clin Rheumatol. 2007;26(1):17-23.
14. Popescu C, Zofota S, Bojinca V, Ionescu R. Anti-cyclic citrullinated peptide antibodies in psoriatic arthritis—Cross-sectional study and literature review. J Med Life. 2013;6(4):376-382.
15. Schoellnast H, Deutschmann HA, Hermann J, et al. Psoriatic arthritis and rheumatoid arthritis: Findings in contrast-enhanced MRI. AJR Am J Roentgenol. 2006;187(2):351-357.
16. Doran MF, Crowson CS, Pond GR, O’Fallon WM, Gabriel SE. Predictors of infection in rheumatoid arthritis. Arthritis Rheum. 2002;46(9):2294-2300.
17. Shoenfeld Y, Gurewich Y, Gallant LA, Pinkhas J. Prednisone-induced leukocytosis. Influence of dosage, method and duration of administration on the degree of leukocytosis. Am J Med. 1981;71(5):773-778.
18. Gossling J. Occurrence and pathogenicity of the Streptococcus milleri group. Rev Infect Dis. 1988;10(2):257-285.
19. Dubost JJ, Soubrier M, De Champs C, Ristori JM, Sauvezie B. Streptococcal septic arthritis in adults. A study of 55 cases with a literature review. Joint Bone Spine. 2004;71(4):303-311.
20. Ryan MJ, Kavanagh R, Wall PG, Hazleman BL. Bacterial joint infections in England and Wales: Analysis of bacterial isolates over a four year period. Br J Rheumatol. 1997;36(3):370-373.
21. Morgan DS, Fisher D, Merianos A, Currie BJ. An 18 year clinical review of septic arthritis from tropical Australia. Epidemiol Infect. 1996;117(3):423-428.
22. Kaandorp CJ, Dinant HJ, van de Laar MA, Moens HJ, Prins AP, Dijkmans BA. Incidence and sources of native and prosthetic joint infection: A community based prospective survey. Ann Rheum Dis. 1997;56(8):470-475.
23. Bradlow A, Mitchell RG, Mowat AG. Group G streptococcal arthritis. Rheumatol Rehabil. 1982;21(4):206-210.
24. Meier JL, Gerster JC. Bursitis and tenosynovitis caused by group G streptococci. J Rheumatol. 1983;10(5):817-818.
25. Filippucci E, Gabba A, Di Geso L, Girolimetti R, Salaffi F, Grassi W. Hand tendon involvement in rheumatoid arthritis: An ultrasound study. Semin Arthritis Rheum. 2012;41(6):752-760.
26. Bronze MS, Whitby S, Schaberg DR. Group G streptococcal arthritis: Case report and review of the literature. Am J Med Sci. 1997;313(4):239-243.
27. Schattner A, Vosti KL. Bacterial arthritis due to beta-hemolytic streptococci of serogroups A, B, C, F, and G. Analysis of 23 cases and a review of the literature. Medicine (Baltimore). 1998;77(2):122-139.
28. Gaunt PN, Seal DV. Group G streptococcal infection of joints and joint prostheses. J Infect. 1986;13(2):115-123.
29. Trenkner SW, Braunstein EM, Lynn MD, Ike RW. Group G streptococcal arthritis and bowel disease: A rare enteropathic arthropathy. Gastrointest Radiol. 1987;12(3):265-267.
30. Bert F, Bariou-Lancelin M, Lambert-Zechovsky N. Clinical significance of bacteremia involving the “Streptococcus milleri” group: 51 cases and review. Clin Infect Dis. 1998;27(2):385-387.
31. Casariego E, Rodriguez A, Corredoira JC, et al. Prospective study of Streptococcus milleri bacteremia. Eur J Clin Microbiol Infect Dis. 1996;15(3):194-200.
32. Jacobs JA, Pietersen HG, Stobberingh EE, Soeters PB. Bacteremia involving the “Streptococcus milleri” group: Analysis of 19 cases. Clin Infect Dis. 1994;19(4):704-713.
33. Zheng S, Robinson E, Yeoman S, et al. MRI bone oedema predicts eight year tendon function at the wrist but not the requirement for orthopaedic surgery in rheumatoid arthritis. Ann Rheum Dis. 2006;65(5):607-611.
34. Harris R. Spontaneous rupture of the tendon of extensor pollicis longus as a complication of rheumatoid arthritis. Ann Rheum Dis. 1951;10(3):298-306.
35. Björkman A, Jörgsholm P. Rupture of the extensor pollicis longus tendon: A study of aetiological factors. Scand J Plast Reconstr Surg Hand Surg. 2004;38(1):32-35.
Evaluation of Methadone-Induced QTc Prolongation in a Veteran Population
Estimates of the annual incidence of sudden cardiac death (SCD) vary from 180,000 to 456,000.1 About 80% to 85% of the cases of SCD are due to a ventricular arrhythmia.2 One type of ventricular arrhythmia, torsades de pointes (TdP), is caused by a prolongation of the QT interval. Because the QT interval is dependent on heart rate, clinicians use the corrected QT (QTc) interval, which has been adjusted for heart rate. The HHS recommends using a gender-independent threshold of 450 msec to define QTc prolongation when conducting research.3 Additionally, a QTc interval > 500 msec is associated with an increased risk for TdP.4 Female gender, hypokalemia, hypomagnesemia, and medical conditions such as congenital long QT syndrome, heart failure, and left ventricular hypertrophy can predispose a person to QTc prolongation.5
Methadone is a synthetic opioid used for chronic pain management or for opioid or heroin addiction. In 2006, the FDA issued a public health advisory, which was followed by the addition of a black box warning to the labeling of methadone regarding cardiac abnormalities that caused serious adverse effects, including QT prolongation, TdP, and death.6 Additional recommendations to evaluate the pharmacokinetic and pharmacodynamic drug interactions were also added to the labeling.
Related: Reducing Opioid Use for Chronic Pain
Several prospective studies, cross-sectional studies, and retrospective reviews have reported QTc prolongation with methadone.7-14 Many cases of QTc prolongation and TdP have been in patients receiving methadone in large doses (> 100 mg/d); however, incidences have also occurred in those receiving typical doses of methadone for addiction treatment.8,15,16 Multiple studies have demonstrated that methadone-induced QTc prolongation is dose-dependent.8,17-20 In an observational study of 90 subjects who were undergoing methadone maintenance treatment, the subjects taking < 60 mg/d of methadone had a 7.7 msec prolongation of the QTc interval, which was significantly less QTc prolongation than in those receiving 60 mg/d to 109 mg/d (15.6 msec, P < .001) and 110 mg/d to 150 mg/d (17.4 msec, P = .001).21
However, in the current literature there are few studies evaluating the QTc prolonging effects of methadone when used in lower doses for pain, such as those used at the Southern Arizona VA Health Care System (SAVAHCS).8 Given the increased risk of cardiac arrhythmias, it is important to understand the effects of methadone on the QTc interval in a veteran patient population using methadone at lower doses for pain. Understanding this risk can help clinicians develop strategies and protocols for the safe use of methadone.
The purpose of this study was to evaluate the effect of methadone on the QTc interval among patients at SAVAHCS. The primary objective was to determine whether methadone prolongs the QTc interval when used for pain. Secondary outcomes included evaluations of the (1) QTc interval when stratified by the QTc interval obtained while prescribed methadone; (2) effects of low, medium, and high doses of methadone on the QTc interval; (3) effects of the concurrent use of QTc prolonging medications on the QTc interval; and (4) effects of the concurrent use of strong inhibitors of methadone clearance on the QTc interval. It was hypothesized that methadone, when used for pain, causes a significant prolongation of the QTc interval, and methadone-induced QTc prolongation is dose-dependent. It was also hypothesized that the QTc interval will be more prolonged when methadone is used concurrently with other medications with a known or conditional risk of TdP or with medications that are strong inhibitors of methadone clearance.
Methods
Full Institutional Review Board approval was obtained prior to initiating this retrospective pre-post study. This study used the electronic medical records (EMRs) of SAVAHCS from July 1, 2004, to July 31, 2012, to compare the QTc interval of patients on stable doses of methadone with the baseline QTc interval. Patients included were aged 18 to 87 years and dispensed a new prescription for methadone between January 1, 2006, and July 31, 2010. Patients must have been adherent to methadone as defined by a medication possession ratio of ≥ 0.8. Patients without a baseline electrocardiogram (ECG) within the 18 months prior to starting methadone, without at least 1 follow-up ECG 7 days to 2 years after the initial prescription, who had a diagnosis of heart failure, or used an implanted cardiac defibrillator or pacemaker as indicated by ICD-9 codes were excluded.
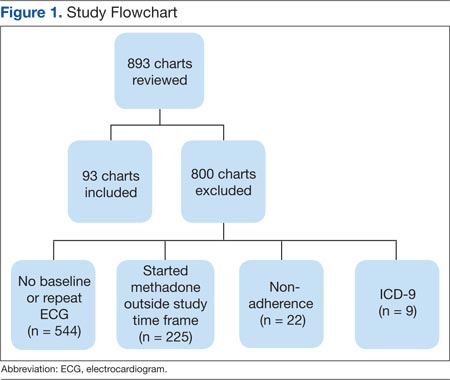
Information collected from the EMR included demographics (age and gender), the QTc interval before starting methadone (pre-QTc), the first QTc interval recorded while prescribed methadone (post-QTc) at a stable dose (defined as ≥ 7 days without a dose change), methadone total daily dose at the time of the post-QTc, concurrent QTc prolonging medications used at the time of each ECG, time elapsed between pre-QTc and post-QTc, time elapsed between the pre-QTc and initiation of methadone, and time elapsed between starting methadone and the post-QTc. All ECGs were recorded using a 12-lead ECG by the MAC 5500 Resting ECG Analysis System (GE Healthcare), which automatically calculates the QTc interval.
For the primary outcome, the mean pre-QTc and post-QTc were compared. These QTc intervals were further analyzed as secondary outcomes. The mean pre-QTc and post-QTc were compared when stratified by post-QTc of < 450 msec, 450 msec to 499 msec, and ≥ 500 msec. To analyze the dose effect of methadone, the mean pre-QTc and post-QTc were compared when stratified by methadone total daily dose: low (≤ 15 mg/d), medium (16-30 mg/d), and high (> 30 mg/d). Dose ranges were based on typical SAVAHCS prescriptions.
An additional secondary outcome was to determine the effect of the concurrent use of QTc prolonging medications on the QTc interval. The medications the subject was taking at the time of each ECG were reviewed to determine whether any of the medications were listed as Drugs with a risk of Torsades de Pointes or Drugs with a conditional risk of Torsades de Pointes on the CredibleMeds website.22,23 Drugs with a conditional risk of TdP are defined as drugs in which there is evidence that the drug prolongs the QTc interval and has a risk of TdP but only under certain conditions, such as high doses or drug interactions. The mean pre-QTc with and without concurrent use of QTc prolonging medications was compared with the mean post-QTc with QTc prolonging medications in addition to methadone.
Because methadone is extensively metabolized by cytochrome P450 3A4 (CYP3A4), another outcome was to determine the effect of the concurrent use of strong CYP3A4 inhibitors on the QTc interval. The medications the subject was taking at the time of each ECG were reviewed to determine whether any of the medications were listed as strong CYP3A4 inhibitors in The Pharmacist’s Letter/The Prescriber’s Letter.24 The mean pre-QTc with and without the concurrent use of strong CYP3A4 inhibitors was compared with the mean post-QTc with strong CYP3A4 inhibitors in addition to methadone.
Related: Pharmacist-Managed Collaborative Practice for Chronic Stable Angina
The primary and secondary outcomes were compared using a paired t test and descriptive statistics; demographics were analyzed using descriptive statistics. Based on the findings of a previous study, a minimum of 8 patients were needed to meet a power of 0.8 with an alpha 0.05 and a medium effect size when comparing the mean pre-QTc and post-QTc for the primary outcome.25
Results
Of 893 EMRs reviewed, 93 met inclusion criteria (Figure 1). The main reason for exclusion was lack of pre-QTc and/or post-QTc (n = 544). The mean age was 58 years (± 10 years), 92% were male, and the mean daily methadone dose at the time of the post-QTc was 29 mg (5 mg-160 mg) (Table 1). Thirty patients were prescribed ≥ 1 QTc prolonging medication at the time of the pre-QTc, 40 patients were prescribed ≥ 1 QTc prolonging medication at the time of the post-QTc, and 0 patients were prescribed a strong CYP3A4 inhibitor at the time of either QTc. There was an average of 151 days (0-554 days) between the pre-QTc and methadone initiation, 161 days (8-664 days) between methadone initiation and the post-QTc, and 312 days (10-1,003 days) between the pre-QTc and post-QTc.
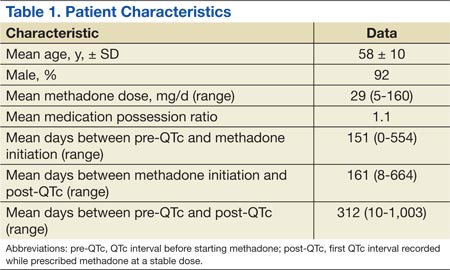
For the primary outcome, there was no significant increase in the QTc interval when comparing the pre-QTc and post-QTc (432 ± 26 msec vs 436 ± 28 msec, P = .221) (Figure 2). When stratified by post QTc, the group of patients with a post-QTc < 450 msec (n = 66) and the group with a post-QTc of ≥ 500 msec (n = 2) had no significant increase in the QTc interval (427 ± 26 msec vs 422 ± 16 msec and 422 ± 18 msec vs 533 ± 21 msec, respectively; P > .05) (Table 2). For the group of patients with a post-QTc of 450 msec to 499 msec (n = 25), methadone significantly prolonged the QTc interval (447 ± 21 msec vs 465 ± 12 msec, P < .001).
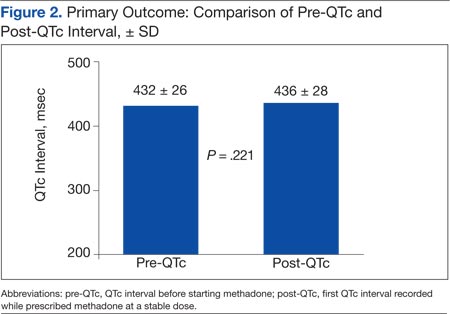
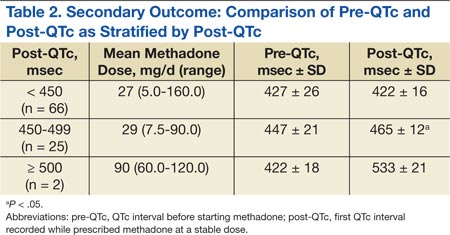
When stratified by methadone daily dose of ≤ 15 mg (n = 45), 16 mg to 30 mg (n = 27), and > 30 mg (n = 21), methadone did not significantly prolong the QTc interval in any group (428 ± 29 msec vs 430 ± 25 msec, 436 ± 16 msec vs 439 ± 21 msec, 437 ± 29 msec vs 446 ± 39 msec, respectively; P > .05) (Table 3). For the group of patients using ≥ 1 QTc prolonging medication at the time of the post-QTc and no QTc prolonging medications at the time of the pre-QTc, the addition of methadone did not significantly increase the QTc interval when compared with the pre-QTc (n = 15; 425 ± 23 msec vs 437 ± 31 msec, respectively; P > .05) (Table 4). For the group of patients prescribed ≥ 1 QTc prolonging medication at the pre-QTc and post-QTc, methadone did not significantly prolong the QTc interval (n = 25; 437 ± 32 msec vs 441 ± 33 msec, respectively; P > .05) (Table 5). No subjects were using strong CYP3A4 inhibitors; therefore, the effect of strong CYP3A4 inhibitors could not be assessed.
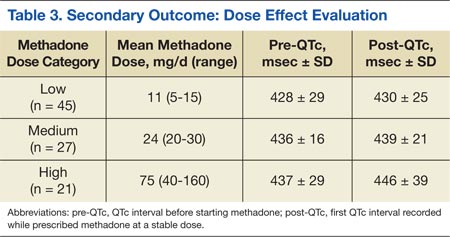
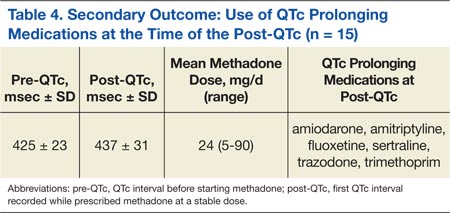
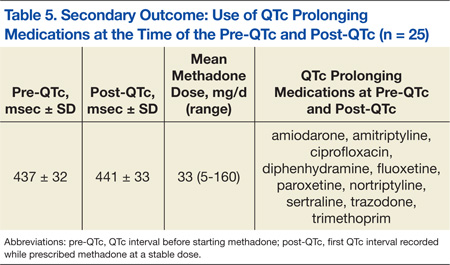
Discussion
The results of this study suggest that methadone-induced QTc interval prolongation may not be clearly evident at lower doses when used for pain. There was no significant increase in the QTc interval in the low-, medium-, and high-dose methadone groups, nor when analyzing the drug interactions. However, this study was powered based on the primary outcome, and it is possible that the study was underpowered to detect a difference in these secondary outcomes. When stratified by post-QTc, a significant increase in the QTc interval was noted for the group of patients with a post-QTc of 450 msec to 499 msec. The absolute mean differences between the pre-QTc and post-QTc for most of the secondary outcomes are unlikely to be clinically relevant, with the exception of the high-dose methadone group and the group stratified by post-QTc interval of 450 msec to 499 msec.
These results are supported by a prospective pilot study of 64 subjects with advanced cancer, which evaluated the QTc prolonging effects of methadone when used at lower doses (range 3-90 mg/d, median 23 mg/d).26 Only 1 of 64 subjects developed clinically significant QTc interval prolongation (QTc ≥ 500 msec) at the end of the second week of therapy. The mean QTc interval measured at baseline was 427 msec, which increased to a mean of 430 msec after 2 weeks of methadone use (mean dose 23 mg/d) and decreased thereafter (375 msec at 4 weeks with a mean dose of 15 mg/d and 373 msec at 8 weeks with a mean dose 28 mg/d; no P values reported). Additionally, no significant association was found between methadone dose and the QTc interval (P > .05).
This study evaluated the surrogate endpoint of QTc prolongation and found that 2 patients with a pre-QTc < 500 msec (434 msec and 409 msec) had a post-QTc > 500 msec (518 msec and 547 msec). These subjects were both in the high-dose methadone group receiving 120 mg/d and 60 mg/d of methadone, respectively. It is unclear what confounders were present at the time of the post-QTc.
Related: Using Dashboard Technology to Monitor Overdose
The study did not evaluate clinically relevant outcomes such as TdP or SCD; however, there is evidence that methadone when used within a therapeutic dose range is associated with SCD.27 In a prospective evaluation of SCD, 22 subjects using methadone found with therapeutic blood levels were compared with 106 subjects not using methadone. Most subjects were using methadone for pain control or opioid withdrawal. In 5 subjects (23%) in the methadone group, a cardiac abnormality (eg, coronary artery disease) that could have caused SCD was identified compared with 64 subjects (60%) in the group not using methadone (P = .002).
Limitations
There are several limitations of this study. This retrospective study does not allow for conclusions to be direct cause and effect, and the results relied on the EMR and methadone prescription fill dates to determine adherence to methadone, when methadone was initiated, and methadone daily dose. The exclusion criteria for the diagnosis of heart failure and the use of an implanted pacemaker and/or cardioverter defibrillator depended on the accuracy of the ICD-9 codes.
Also, many factors that affect the QTc interval were not assessed, such as potassium and magnesium levels, alcohol, cocaine, and amphetamine use. In addition, over-the-counter medications and medications obtained outside of SAVAHCS were not assessed. It is possible that any of those factors could be confounding variables. Furthermore, a majority of the subjects were male, and subjects with heart failure and those using an implanted pacemaker and/or cardioverter defibrillator were excluded from the study. In clinical practice, the results of the study cannot be generalized to those excluded patient populations. Additionally, the effect size of QTc prolongation observed was lower than was expected. Therefore, this study may not have been powered adequately to detect smaller differences in QTc prolongation.
Another limitation of the study is the high exclusion rate: about 90%. A majority of the patients were excluded due to the lack of ECG monitoring. The reason for obtaining an ECG was not assessed, and many subjects likely had an ECG obtained incidentally. Due to the high exclusion rate, selection bias may have been introduced into the study. Therefore, the 10% of subjects included in the study may not be representative of veterans using methadone for pain.
Very few studies of the effects of methadone on QTc prolongation in veterans have been published. A retrospective chart review by Fareed and colleagues sought to identify whether patients are at high risk for cardiac arrhythmias by adding an onsite ECG screening at baseline and annually for patients using methadone as part of a methadone maintenance program at the Atlanta VAMC.11 The patients in the study were an average age of 56 years, and 93% were male. The mean daily methadone dose was 90 ± 48 mg/d, and the mean duration of treatment was 38 ± 31 months. The mean QTc interval was significantly longer at the most recent QTc interval while using methadone compared with the baseline QTc interval (442 ± 25 msec vs 417 ± 30 msec, respectively; P < .001). Six percent of patients had a significant prolongation of the QTc interval from baseline to > 500 msec, and 27% had a significant prolongation of the QTc interval from baseline to 450 msec to 500 msec (P < .05).
This study and the study by Fareed and colleagues are similar in that both are retrospective, compare baseline QTc intervals and QTc intervals while using methadone, and include subjects of a similar age and gender. However, the subjects in the Fareed and colleagues study were using methadone for maintenance treatment at higher doses than in the present study. Additionally, the results of the studies differ. Fareed and colleagues found a prolongation of the QTc interval with methadone use. Although the present study has many limitations, it adds additional information to the medical literature regarding the QTc interval of veterans using methadone in lower doses at an average of 29 mg/d.
Conclusion
In this study of veterans using methadone for pain, methadone did not significantly increase the QTc interval. Two patients had a prolonged QTc interval of ≥ 500 msec while taking methadone. The QTc interval did not vary by methadone daily dose, and the concurrent use of QTc prolonging medications together with methadone did not increase the QTc interval. The concurrent use of strong CYP3A4 inhibitors could not be assessed, because none of the patients were on these medications.
Despite these findings, the study had several limitations, and there is a black box warning included in the labeling of methadone regarding QTc interval prolongation, TdP, and death. Therefore, it is advisable to monitor the QTc interval in patients using methadone, even at low doses. In those patients with a prolonged QTc interval and/or risk factors for QTc prolongation, methadone should either be avoided or used cautiously with close monitoring of the QTc interval.
Acknowledgments
This manuscript was prepared and research was conducted with resources and the use of facilities at the Southern Arizona VA Health Care System in Tucson, Arizona.
Author disclosures
The authors report no actual or potential conflicts of interest with regard to this article.
Disclaimer
The opinions expressed herein are those of the authors and do not necessarily reflect those of Federal Practitioner, Frontline Medical Communications Inc., the U.S. Government, or any of its agencies. This article may discuss unlabeled or investigational use of certain drugs. Please review complete prescribing information for specific drugs or drug combinations—including indications, contraindications, warnings, and adverse effects—before administering pharmacologic therapy to patients.
1. Kong MH, Fonarow GC, Peterson ED, et al. Systematic review of the incidence of sudden cardiac death in the United States. J Am Coll Cardiol. 2011;57(7): 794-801.
2. Josephson M, Wellens HJJ. Implantable defibrillators and sudden cardiac death. Circulation. 2004;109(22):2685-2691.
3. International Conference on Harmonisation-Quality. Guidance for Industry: E14 Clinical Evaluation of QT/QTc Interval Prolongation and Proarrhythmic Potential for Non-Antiarrhythmic Drugs. Rockville, MD: U.S. Food and Drug Administration; 2005.
4. Committee for Proprietary Medicinal Products. Points to Consider: The Assessment of the Potential for QT Interval Prolongation by Non-Cardiovascular Medicinal Products. London, UK: The European Agency for the Evaluation of Medicinal Products; 1997.
5. Stringer J, Welsh C, Tommasello A. Methadone-associated Q-T interval prolongation and torsades de pointes. Am J Health Syst Pharm. 2009;66(9):825-833.
6. Information for healthcare professionals: Methadone hydrochloride. U.S. Food and Drug Administration Website. http://www.fda.gov/Drugs/DrugSafety/PostmarketDrugSafetyInformationforPatientsandProviders/ucm142841.htm. Published November 2006. Updated August 23, 2013. Accessed January 9, 2015.
7. Anchersen K, Clausen T, Gossop M, Hansteen V, Waal H. Prevalence and clinical relevance of corrected QT interval prolongation during methadone and buprenorphine treatment: A mortality assessment study. Addiction. 2009;104(6):993-999.
8. Chang KC, Huang CL, Liang HY, et al. Gender-specific differences in susceptibility to low-dose methadone-associated QTc prolongation in patients with heroin dependence. J Cardiovasc Electrophysiol. 2012;23(5):527-533.
9. Cruciani RA, Sekine R, Homel P, et al. Measurement of QTc in patients receiving chronic methadone therapy. J Pain Symptom Manage. 2005;29(4):385-391.
10. Ehret GB, Voide C, Gex-Fabry M, et al. Drug-induced long QT syndrome in injection drug users receiving methadone: High frequency in hospitalized patients and risk factors. Arch Intern Med. 2006;166(12):1280-1287.
11. Fareed A, Vayalapalli S, Byrd-Sellers J, et al. Onsite QTc interval screening for patients in methadone maintenance treatment. J Addict Dis. 2010;29(1):15-22.
12. Fanoe S, Hvidt C, Ege P, Jensen GB. Syncope and QT prolongation among patients treated with methadone for heroin dependence in the city of Copenhagen. Heart. 2007;93(9):1051-1055.
13. Peles E, Bodner G, Kreek MJ, Rados V, Adelson M. Corrected-QT intervals as related to methadone dose and serum level in methadone maintenance treatment (MMT) patients: A cross-sectional study. Addiction. 2007;102(2):289-300.
14. Wedam EF, Bigelow GE, Johnson RE, Nuzzo PA, Haigney MC. QT-interval effects of methadone, levomethadyl, and buprenorphine in a randomized trial. Arch Intern Med. 2007;167(22):2469-2475.
15. DOLOPHINE [package insert]. Columbus, OH: Roxane Laboratories, Inc; 2012.
16. Krantz MJ, Martin J, Stimmel B, Mehta D, Haigney MC. QTc interval screening in methadone treatment. Ann Intern Med. 2009;150(6):387-395.
17. Krantz MJ, Kutinsky IB, Robertson AD, Mehler PS. Dose-related effects of methadone on QT prolongation in a series of patients with torsade de pointes. Pharmacotherapy. 2003;23(6):802-805.
18. Castro VM, Clements CC, Murphy SN, et al. QT interval and antidepressant use: A cross sectional study of electronic health records. BMJ. 2013;346:f288.
19. Florian J, Garnett CE, Nallani SC, Rappaport BA, Throckmorton DC. A modeling and simulation approach to characterize methadone QT prolongation using pooled data from five clinical trials in MMT patients. Clin Pharmacol Ther. 2012;91(4):666-672.
20. Fonseca F, Marti-Almor J, Pastor A, et al. Prevalence of long QTc interval in methadone maintenance patients. Drug Alcohol Depend. 2009;99(1-3):327-332.
21. Gheshlaghi F, Izadi-Mood N, Mardani A, Piri-Ardekani MR. Dose-dependent effects of methadone on the QT interval in patients under methadone maintenance treatment. Asia Pacific J Med Toxicol. 2013;2(1):6-9.
22. Drugs with a known risk of Torsades de Pointes. CredibleMeds Website. https://www.crediblemeds.org/new-drug-list. Updated January 14, 2015. Accessed January 14, 2015.
23. Drugs with a conditional risk of Torsades de Pointes. CredibleMeds Website. https://www.crediblemeds.org/new-drug-list. Updated January 14, 2015. Accessed January 14, 2015.
24. Cytochrome P450 drug interactions [full update October 2009]. Pharmacist’s Letter/Prescribers Letter. 2006;22(2):220233.
25. Huh B, Park CH. Retrospective analysis of low-dose methadone and QTc prolongation in chronic pain patients. Korean J Anesthesiol. 2010;58(4):338-343.
26. Reddy S, Hui D, El Osta B, et al. The effect of oral methadone on the QTc interval in advanced cancer patients: A prospective pilot study. J Palliat Med. 2010;13(1):33-38.
27. Chugh SS, Socoteanu C, Reinier K, Waltz J, Jui J, Gunson K. A community-based evaluation of sudden death associated with therapeutic levels of methadone. Am J Med. 2008;121(1):66-71.
Estimates of the annual incidence of sudden cardiac death (SCD) vary from 180,000 to 456,000.1 About 80% to 85% of the cases of SCD are due to a ventricular arrhythmia.2 One type of ventricular arrhythmia, torsades de pointes (TdP), is caused by a prolongation of the QT interval. Because the QT interval is dependent on heart rate, clinicians use the corrected QT (QTc) interval, which has been adjusted for heart rate. The HHS recommends using a gender-independent threshold of 450 msec to define QTc prolongation when conducting research.3 Additionally, a QTc interval > 500 msec is associated with an increased risk for TdP.4 Female gender, hypokalemia, hypomagnesemia, and medical conditions such as congenital long QT syndrome, heart failure, and left ventricular hypertrophy can predispose a person to QTc prolongation.5
Methadone is a synthetic opioid used for chronic pain management or for opioid or heroin addiction. In 2006, the FDA issued a public health advisory, which was followed by the addition of a black box warning to the labeling of methadone regarding cardiac abnormalities that caused serious adverse effects, including QT prolongation, TdP, and death.6 Additional recommendations to evaluate the pharmacokinetic and pharmacodynamic drug interactions were also added to the labeling.
Related: Reducing Opioid Use for Chronic Pain
Several prospective studies, cross-sectional studies, and retrospective reviews have reported QTc prolongation with methadone.7-14 Many cases of QTc prolongation and TdP have been in patients receiving methadone in large doses (> 100 mg/d); however, incidences have also occurred in those receiving typical doses of methadone for addiction treatment.8,15,16 Multiple studies have demonstrated that methadone-induced QTc prolongation is dose-dependent.8,17-20 In an observational study of 90 subjects who were undergoing methadone maintenance treatment, the subjects taking < 60 mg/d of methadone had a 7.7 msec prolongation of the QTc interval, which was significantly less QTc prolongation than in those receiving 60 mg/d to 109 mg/d (15.6 msec, P < .001) and 110 mg/d to 150 mg/d (17.4 msec, P = .001).21
However, in the current literature there are few studies evaluating the QTc prolonging effects of methadone when used in lower doses for pain, such as those used at the Southern Arizona VA Health Care System (SAVAHCS).8 Given the increased risk of cardiac arrhythmias, it is important to understand the effects of methadone on the QTc interval in a veteran patient population using methadone at lower doses for pain. Understanding this risk can help clinicians develop strategies and protocols for the safe use of methadone.
The purpose of this study was to evaluate the effect of methadone on the QTc interval among patients at SAVAHCS. The primary objective was to determine whether methadone prolongs the QTc interval when used for pain. Secondary outcomes included evaluations of the (1) QTc interval when stratified by the QTc interval obtained while prescribed methadone; (2) effects of low, medium, and high doses of methadone on the QTc interval; (3) effects of the concurrent use of QTc prolonging medications on the QTc interval; and (4) effects of the concurrent use of strong inhibitors of methadone clearance on the QTc interval. It was hypothesized that methadone, when used for pain, causes a significant prolongation of the QTc interval, and methadone-induced QTc prolongation is dose-dependent. It was also hypothesized that the QTc interval will be more prolonged when methadone is used concurrently with other medications with a known or conditional risk of TdP or with medications that are strong inhibitors of methadone clearance.
Methods
Full Institutional Review Board approval was obtained prior to initiating this retrospective pre-post study. This study used the electronic medical records (EMRs) of SAVAHCS from July 1, 2004, to July 31, 2012, to compare the QTc interval of patients on stable doses of methadone with the baseline QTc interval. Patients included were aged 18 to 87 years and dispensed a new prescription for methadone between January 1, 2006, and July 31, 2010. Patients must have been adherent to methadone as defined by a medication possession ratio of ≥ 0.8. Patients without a baseline electrocardiogram (ECG) within the 18 months prior to starting methadone, without at least 1 follow-up ECG 7 days to 2 years after the initial prescription, who had a diagnosis of heart failure, or used an implanted cardiac defibrillator or pacemaker as indicated by ICD-9 codes were excluded.
Information collected from the EMR included demographics (age and gender), the QTc interval before starting methadone (pre-QTc), the first QTc interval recorded while prescribed methadone (post-QTc) at a stable dose (defined as ≥ 7 days without a dose change), methadone total daily dose at the time of the post-QTc, concurrent QTc prolonging medications used at the time of each ECG, time elapsed between pre-QTc and post-QTc, time elapsed between the pre-QTc and initiation of methadone, and time elapsed between starting methadone and the post-QTc. All ECGs were recorded using a 12-lead ECG by the MAC 5500 Resting ECG Analysis System (GE Healthcare), which automatically calculates the QTc interval.
For the primary outcome, the mean pre-QTc and post-QTc were compared. These QTc intervals were further analyzed as secondary outcomes. The mean pre-QTc and post-QTc were compared when stratified by post-QTc of < 450 msec, 450 msec to 499 msec, and ≥ 500 msec. To analyze the dose effect of methadone, the mean pre-QTc and post-QTc were compared when stratified by methadone total daily dose: low (≤ 15 mg/d), medium (16-30 mg/d), and high (> 30 mg/d). Dose ranges were based on typical SAVAHCS prescriptions.
An additional secondary outcome was to determine the effect of the concurrent use of QTc prolonging medications on the QTc interval. The medications the subject was taking at the time of each ECG were reviewed to determine whether any of the medications were listed as Drugs with a risk of Torsades de Pointes or Drugs with a conditional risk of Torsades de Pointes on the CredibleMeds website.22,23 Drugs with a conditional risk of TdP are defined as drugs in which there is evidence that the drug prolongs the QTc interval and has a risk of TdP but only under certain conditions, such as high doses or drug interactions. The mean pre-QTc with and without concurrent use of QTc prolonging medications was compared with the mean post-QTc with QTc prolonging medications in addition to methadone.
Because methadone is extensively metabolized by cytochrome P450 3A4 (CYP3A4), another outcome was to determine the effect of the concurrent use of strong CYP3A4 inhibitors on the QTc interval. The medications the subject was taking at the time of each ECG were reviewed to determine whether any of the medications were listed as strong CYP3A4 inhibitors in The Pharmacist’s Letter/The Prescriber’s Letter.24 The mean pre-QTc with and without the concurrent use of strong CYP3A4 inhibitors was compared with the mean post-QTc with strong CYP3A4 inhibitors in addition to methadone.
Related: Pharmacist-Managed Collaborative Practice for Chronic Stable Angina
The primary and secondary outcomes were compared using a paired t test and descriptive statistics; demographics were analyzed using descriptive statistics. Based on the findings of a previous study, a minimum of 8 patients were needed to meet a power of 0.8 with an alpha 0.05 and a medium effect size when comparing the mean pre-QTc and post-QTc for the primary outcome.25
Results
Of 893 EMRs reviewed, 93 met inclusion criteria (Figure 1). The main reason for exclusion was lack of pre-QTc and/or post-QTc (n = 544). The mean age was 58 years (± 10 years), 92% were male, and the mean daily methadone dose at the time of the post-QTc was 29 mg (5 mg-160 mg) (Table 1). Thirty patients were prescribed ≥ 1 QTc prolonging medication at the time of the pre-QTc, 40 patients were prescribed ≥ 1 QTc prolonging medication at the time of the post-QTc, and 0 patients were prescribed a strong CYP3A4 inhibitor at the time of either QTc. There was an average of 151 days (0-554 days) between the pre-QTc and methadone initiation, 161 days (8-664 days) between methadone initiation and the post-QTc, and 312 days (10-1,003 days) between the pre-QTc and post-QTc.
For the primary outcome, there was no significant increase in the QTc interval when comparing the pre-QTc and post-QTc (432 ± 26 msec vs 436 ± 28 msec, P = .221) (Figure 2). When stratified by post QTc, the group of patients with a post-QTc < 450 msec (n = 66) and the group with a post-QTc of ≥ 500 msec (n = 2) had no significant increase in the QTc interval (427 ± 26 msec vs 422 ± 16 msec and 422 ± 18 msec vs 533 ± 21 msec, respectively; P > .05) (Table 2). For the group of patients with a post-QTc of 450 msec to 499 msec (n = 25), methadone significantly prolonged the QTc interval (447 ± 21 msec vs 465 ± 12 msec, P < .001).
When stratified by methadone daily dose of ≤ 15 mg (n = 45), 16 mg to 30 mg (n = 27), and > 30 mg (n = 21), methadone did not significantly prolong the QTc interval in any group (428 ± 29 msec vs 430 ± 25 msec, 436 ± 16 msec vs 439 ± 21 msec, 437 ± 29 msec vs 446 ± 39 msec, respectively; P > .05) (Table 3). For the group of patients using ≥ 1 QTc prolonging medication at the time of the post-QTc and no QTc prolonging medications at the time of the pre-QTc, the addition of methadone did not significantly increase the QTc interval when compared with the pre-QTc (n = 15; 425 ± 23 msec vs 437 ± 31 msec, respectively; P > .05) (Table 4). For the group of patients prescribed ≥ 1 QTc prolonging medication at the pre-QTc and post-QTc, methadone did not significantly prolong the QTc interval (n = 25; 437 ± 32 msec vs 441 ± 33 msec, respectively; P > .05) (Table 5). No subjects were using strong CYP3A4 inhibitors; therefore, the effect of strong CYP3A4 inhibitors could not be assessed.
Discussion
The results of this study suggest that methadone-induced QTc interval prolongation may not be clearly evident at lower doses when used for pain. There was no significant increase in the QTc interval in the low-, medium-, and high-dose methadone groups, nor when analyzing the drug interactions. However, this study was powered based on the primary outcome, and it is possible that the study was underpowered to detect a difference in these secondary outcomes. When stratified by post-QTc, a significant increase in the QTc interval was noted for the group of patients with a post-QTc of 450 msec to 499 msec. The absolute mean differences between the pre-QTc and post-QTc for most of the secondary outcomes are unlikely to be clinically relevant, with the exception of the high-dose methadone group and the group stratified by post-QTc interval of 450 msec to 499 msec.
These results are supported by a prospective pilot study of 64 subjects with advanced cancer, which evaluated the QTc prolonging effects of methadone when used at lower doses (range 3-90 mg/d, median 23 mg/d).26 Only 1 of 64 subjects developed clinically significant QTc interval prolongation (QTc ≥ 500 msec) at the end of the second week of therapy. The mean QTc interval measured at baseline was 427 msec, which increased to a mean of 430 msec after 2 weeks of methadone use (mean dose 23 mg/d) and decreased thereafter (375 msec at 4 weeks with a mean dose of 15 mg/d and 373 msec at 8 weeks with a mean dose 28 mg/d; no P values reported). Additionally, no significant association was found between methadone dose and the QTc interval (P > .05).
This study evaluated the surrogate endpoint of QTc prolongation and found that 2 patients with a pre-QTc < 500 msec (434 msec and 409 msec) had a post-QTc > 500 msec (518 msec and 547 msec). These subjects were both in the high-dose methadone group receiving 120 mg/d and 60 mg/d of methadone, respectively. It is unclear what confounders were present at the time of the post-QTc.
Related: Using Dashboard Technology to Monitor Overdose
The study did not evaluate clinically relevant outcomes such as TdP or SCD; however, there is evidence that methadone when used within a therapeutic dose range is associated with SCD.27 In a prospective evaluation of SCD, 22 subjects using methadone found with therapeutic blood levels were compared with 106 subjects not using methadone. Most subjects were using methadone for pain control or opioid withdrawal. In 5 subjects (23%) in the methadone group, a cardiac abnormality (eg, coronary artery disease) that could have caused SCD was identified compared with 64 subjects (60%) in the group not using methadone (P = .002).
Limitations
There are several limitations of this study. This retrospective study does not allow for conclusions to be direct cause and effect, and the results relied on the EMR and methadone prescription fill dates to determine adherence to methadone, when methadone was initiated, and methadone daily dose. The exclusion criteria for the diagnosis of heart failure and the use of an implanted pacemaker and/or cardioverter defibrillator depended on the accuracy of the ICD-9 codes.
Also, many factors that affect the QTc interval were not assessed, such as potassium and magnesium levels, alcohol, cocaine, and amphetamine use. In addition, over-the-counter medications and medications obtained outside of SAVAHCS were not assessed. It is possible that any of those factors could be confounding variables. Furthermore, a majority of the subjects were male, and subjects with heart failure and those using an implanted pacemaker and/or cardioverter defibrillator were excluded from the study. In clinical practice, the results of the study cannot be generalized to those excluded patient populations. Additionally, the effect size of QTc prolongation observed was lower than was expected. Therefore, this study may not have been powered adequately to detect smaller differences in QTc prolongation.
Another limitation of the study is the high exclusion rate: about 90%. A majority of the patients were excluded due to the lack of ECG monitoring. The reason for obtaining an ECG was not assessed, and many subjects likely had an ECG obtained incidentally. Due to the high exclusion rate, selection bias may have been introduced into the study. Therefore, the 10% of subjects included in the study may not be representative of veterans using methadone for pain.
Very few studies of the effects of methadone on QTc prolongation in veterans have been published. A retrospective chart review by Fareed and colleagues sought to identify whether patients are at high risk for cardiac arrhythmias by adding an onsite ECG screening at baseline and annually for patients using methadone as part of a methadone maintenance program at the Atlanta VAMC.11 The patients in the study were an average age of 56 years, and 93% were male. The mean daily methadone dose was 90 ± 48 mg/d, and the mean duration of treatment was 38 ± 31 months. The mean QTc interval was significantly longer at the most recent QTc interval while using methadone compared with the baseline QTc interval (442 ± 25 msec vs 417 ± 30 msec, respectively; P < .001). Six percent of patients had a significant prolongation of the QTc interval from baseline to > 500 msec, and 27% had a significant prolongation of the QTc interval from baseline to 450 msec to 500 msec (P < .05).
This study and the study by Fareed and colleagues are similar in that both are retrospective, compare baseline QTc intervals and QTc intervals while using methadone, and include subjects of a similar age and gender. However, the subjects in the Fareed and colleagues study were using methadone for maintenance treatment at higher doses than in the present study. Additionally, the results of the studies differ. Fareed and colleagues found a prolongation of the QTc interval with methadone use. Although the present study has many limitations, it adds additional information to the medical literature regarding the QTc interval of veterans using methadone in lower doses at an average of 29 mg/d.
Conclusion
In this study of veterans using methadone for pain, methadone did not significantly increase the QTc interval. Two patients had a prolonged QTc interval of ≥ 500 msec while taking methadone. The QTc interval did not vary by methadone daily dose, and the concurrent use of QTc prolonging medications together with methadone did not increase the QTc interval. The concurrent use of strong CYP3A4 inhibitors could not be assessed, because none of the patients were on these medications.
Despite these findings, the study had several limitations, and there is a black box warning included in the labeling of methadone regarding QTc interval prolongation, TdP, and death. Therefore, it is advisable to monitor the QTc interval in patients using methadone, even at low doses. In those patients with a prolonged QTc interval and/or risk factors for QTc prolongation, methadone should either be avoided or used cautiously with close monitoring of the QTc interval.
Acknowledgments
This manuscript was prepared and research was conducted with resources and the use of facilities at the Southern Arizona VA Health Care System in Tucson, Arizona.
Author disclosures
The authors report no actual or potential conflicts of interest with regard to this article.
Disclaimer
The opinions expressed herein are those of the authors and do not necessarily reflect those of Federal Practitioner, Frontline Medical Communications Inc., the U.S. Government, or any of its agencies. This article may discuss unlabeled or investigational use of certain drugs. Please review complete prescribing information for specific drugs or drug combinations—including indications, contraindications, warnings, and adverse effects—before administering pharmacologic therapy to patients.
1. Kong MH, Fonarow GC, Peterson ED, et al. Systematic review of the incidence of sudden cardiac death in the United States. J Am Coll Cardiol. 2011;57(7): 794-801.
2. Josephson M, Wellens HJJ. Implantable defibrillators and sudden cardiac death. Circulation. 2004;109(22):2685-2691.
3. International Conference on Harmonisation-Quality. Guidance for Industry: E14 Clinical Evaluation of QT/QTc Interval Prolongation and Proarrhythmic Potential for Non-Antiarrhythmic Drugs. Rockville, MD: U.S. Food and Drug Administration; 2005.
4. Committee for Proprietary Medicinal Products. Points to Consider: The Assessment of the Potential for QT Interval Prolongation by Non-Cardiovascular Medicinal Products. London, UK: The European Agency for the Evaluation of Medicinal Products; 1997.
5. Stringer J, Welsh C, Tommasello A. Methadone-associated Q-T interval prolongation and torsades de pointes. Am J Health Syst Pharm. 2009;66(9):825-833.
6. Information for healthcare professionals: Methadone hydrochloride. U.S. Food and Drug Administration Website. http://www.fda.gov/Drugs/DrugSafety/PostmarketDrugSafetyInformationforPatientsandProviders/ucm142841.htm. Published November 2006. Updated August 23, 2013. Accessed January 9, 2015.
7. Anchersen K, Clausen T, Gossop M, Hansteen V, Waal H. Prevalence and clinical relevance of corrected QT interval prolongation during methadone and buprenorphine treatment: A mortality assessment study. Addiction. 2009;104(6):993-999.
8. Chang KC, Huang CL, Liang HY, et al. Gender-specific differences in susceptibility to low-dose methadone-associated QTc prolongation in patients with heroin dependence. J Cardiovasc Electrophysiol. 2012;23(5):527-533.
9. Cruciani RA, Sekine R, Homel P, et al. Measurement of QTc in patients receiving chronic methadone therapy. J Pain Symptom Manage. 2005;29(4):385-391.
10. Ehret GB, Voide C, Gex-Fabry M, et al. Drug-induced long QT syndrome in injection drug users receiving methadone: High frequency in hospitalized patients and risk factors. Arch Intern Med. 2006;166(12):1280-1287.
11. Fareed A, Vayalapalli S, Byrd-Sellers J, et al. Onsite QTc interval screening for patients in methadone maintenance treatment. J Addict Dis. 2010;29(1):15-22.
12. Fanoe S, Hvidt C, Ege P, Jensen GB. Syncope and QT prolongation among patients treated with methadone for heroin dependence in the city of Copenhagen. Heart. 2007;93(9):1051-1055.
13. Peles E, Bodner G, Kreek MJ, Rados V, Adelson M. Corrected-QT intervals as related to methadone dose and serum level in methadone maintenance treatment (MMT) patients: A cross-sectional study. Addiction. 2007;102(2):289-300.
14. Wedam EF, Bigelow GE, Johnson RE, Nuzzo PA, Haigney MC. QT-interval effects of methadone, levomethadyl, and buprenorphine in a randomized trial. Arch Intern Med. 2007;167(22):2469-2475.
15. DOLOPHINE [package insert]. Columbus, OH: Roxane Laboratories, Inc; 2012.
16. Krantz MJ, Martin J, Stimmel B, Mehta D, Haigney MC. QTc interval screening in methadone treatment. Ann Intern Med. 2009;150(6):387-395.
17. Krantz MJ, Kutinsky IB, Robertson AD, Mehler PS. Dose-related effects of methadone on QT prolongation in a series of patients with torsade de pointes. Pharmacotherapy. 2003;23(6):802-805.
18. Castro VM, Clements CC, Murphy SN, et al. QT interval and antidepressant use: A cross sectional study of electronic health records. BMJ. 2013;346:f288.
19. Florian J, Garnett CE, Nallani SC, Rappaport BA, Throckmorton DC. A modeling and simulation approach to characterize methadone QT prolongation using pooled data from five clinical trials in MMT patients. Clin Pharmacol Ther. 2012;91(4):666-672.
20. Fonseca F, Marti-Almor J, Pastor A, et al. Prevalence of long QTc interval in methadone maintenance patients. Drug Alcohol Depend. 2009;99(1-3):327-332.
21. Gheshlaghi F, Izadi-Mood N, Mardani A, Piri-Ardekani MR. Dose-dependent effects of methadone on the QT interval in patients under methadone maintenance treatment. Asia Pacific J Med Toxicol. 2013;2(1):6-9.
22. Drugs with a known risk of Torsades de Pointes. CredibleMeds Website. https://www.crediblemeds.org/new-drug-list. Updated January 14, 2015. Accessed January 14, 2015.
23. Drugs with a conditional risk of Torsades de Pointes. CredibleMeds Website. https://www.crediblemeds.org/new-drug-list. Updated January 14, 2015. Accessed January 14, 2015.
24. Cytochrome P450 drug interactions [full update October 2009]. Pharmacist’s Letter/Prescribers Letter. 2006;22(2):220233.
25. Huh B, Park CH. Retrospective analysis of low-dose methadone and QTc prolongation in chronic pain patients. Korean J Anesthesiol. 2010;58(4):338-343.
26. Reddy S, Hui D, El Osta B, et al. The effect of oral methadone on the QTc interval in advanced cancer patients: A prospective pilot study. J Palliat Med. 2010;13(1):33-38.
27. Chugh SS, Socoteanu C, Reinier K, Waltz J, Jui J, Gunson K. A community-based evaluation of sudden death associated with therapeutic levels of methadone. Am J Med. 2008;121(1):66-71.
Poor Outcomes for African Americans in Cardiac Rehabilitation
African Americans—especially women and patients with diabetes—may need targeted interventions to make the most of cardiac rehabilitation (CR). A study at Wake Forest Baptist Medical Center in Winston-Salem, North Carolina, found that the CR program benefited all participants, but some more than others.
The study enrolled 169 African American patients and 927 white patients in a 12-week, 36-session CR program for ischemic heart disease or post cardiac surgery. The sessions included walking on a track or treadmill, using a stair climber, and engaging in light resistance exercise.
Related: Factors Affecting Heart Failure Readmission Rates in VA Patients
Both groups derived significant benefits from the CR, but the researchers also found substantial differences both at baseline and at follow-up. Overall, African Americans had lower baseline exercise capacity. They were also younger, more likely to be female, and had a higher prevalence of hypertension and diabetes compared with white patients.
White men saw the most improvements in outcomes such as quality of life, decreased risk factors, and exercise capacity; white women, to a lesser extent, also saw improvements. African Americans saw smaller gains. Moreover, although their blood pressure and low-density lipoprotein cholesterol (LDL-C) improved, weight, triglycerides (TGs), and high-density lipoprotein cholesterol (HDL-C) concentrations did not.
Related: 49-Year-Old Woman With a Broken Heart
Exercise capacity increased the least in African American women. Their body weight also declined only slightly, and body mass index remained unchanged. Similar to African American men, African American women did not notably improve in TGs or HDL-C concentrations, and LDL-C did not decline as much as was observed in white women.
Why African American women did not improve as much in this study is unclear, the researchers say. Although statin use was the same in both groups, the researchers say it is possible that African American women may require more potent dosages and/or more time to reach therapeutic goals.
African American patients with diabetes also did not fare as well as others in the study. Their “suboptimal” results included no significant weight loss, even in those patients who were obese. A “striking ethnic difference,” the researchers say, was seen in TG concentrations, which decreased by 50% in white participants with diabetes but remained unchanged in African Americans.
Related: Cardiology Collaboration in Washington, DC
Their findings have implications for secondary prevention of coronary disease in African Americans, the researchers say. The research may also help target individuals or groups who may benefit most from focused treatment.
Source
Johnson D, Sacrinty M, Mehta H, Douglas C, Paladenech C, Robinson K. Am Heart J. 2015;169(1):102-107.
doi: 10.1016/j.ahj.2014.09.009.
Hepatitis C Clinical Dashboards: Improving Liver Specialty Care Access and Quality
The VHA cares for 170,000 patients with chronic hepatitis C virus (HCV) infection, making it the largest single provider of medical care to chronic HCV patients in the U.S.1 Although HCV treatment rates within the VHA outpace those of the private sector, only half of patients with HCV infection within the VHA have accessed a liver specialist and less than a quarter have received antiviral medication.2-4
Newer HCV treatment regimens promise treatment sustained virologic response (SVR) rates—a marker of viral clearance posttreatment—of ≥ 90% in most cases but require careful patient selection and management.5 In particular, the estimated 24% of patients with HCV infection with advanced liver disease require more rapid consideration for therapy to reduce complications of cirrhosis such as liver failure, hepatocellular carcinoma, and death.6 With the advent of promising HCV therapies and rising rates of cirrhosis, there is an urgent need for population health management approach to deliver HCV care more widely and effectively.5,7
Rationale for Clinical Dashboards
Although the VHA hosts the largest integrated electronic medical record (EMR) system in the U.S., an EMR on its own does not guarantee improved patient care or access.8 EMRs can be used to document health care delivery, but they do not routinely provide information about the burden of disease in a population, nor do they identify patients most in need of care.
Clinical dashboards are tools that are geared to provide clinicians with relevant data to improve patient care. Early clinical dashboard development across the VHA was primary care focused, targeting patients with diabetes, ischemic heart disease, and hypertension. This national primary care dashboard provides clinically relevant, actionable data and enables the clinical provider to track patient progress. In addition, regional data can be aggregated for use by VISN managers.
While the impact of dashboards on quality of care is not well investigated, it remains a vital tool with the potential to transform care.9
HCV dashboards have been developed by individual VISNs and facilities across the VHA. HCV dashboards serve to identify patients most in need of antiviral therapy, expand outreach to those previously unseen by specialty care, sort patients by severity of liver disease, track treatment status, and calculate SVR.
Current HCV dashboards incorporate elements derived from the VA Corporate Data Warehouse (CDW), a national VA data repository consisting of data from all facilities’ electronic medical record systems. Updated information from the previous day is made available in VISN data warehouses and is refreshed nightly. The final result is user-friendly clinical data available in near-real time to dashboard users.
VISN 21 HCV Dashboard
Purpose and Elements
The VISN 21 HCV dashboard will be discussed as a prototype. Graphics of the VISN 21 dashboard interface are presented in Figure 1 and Figure 2. The VISN 21 HCV dashboard was developed by pharmacists with specialty training in medical informatics, health care analytics, and data management. The dashboard addresses 3 previously unmet needs in HCV care: population management, patient treatment outcome tracking, and administrative planning.
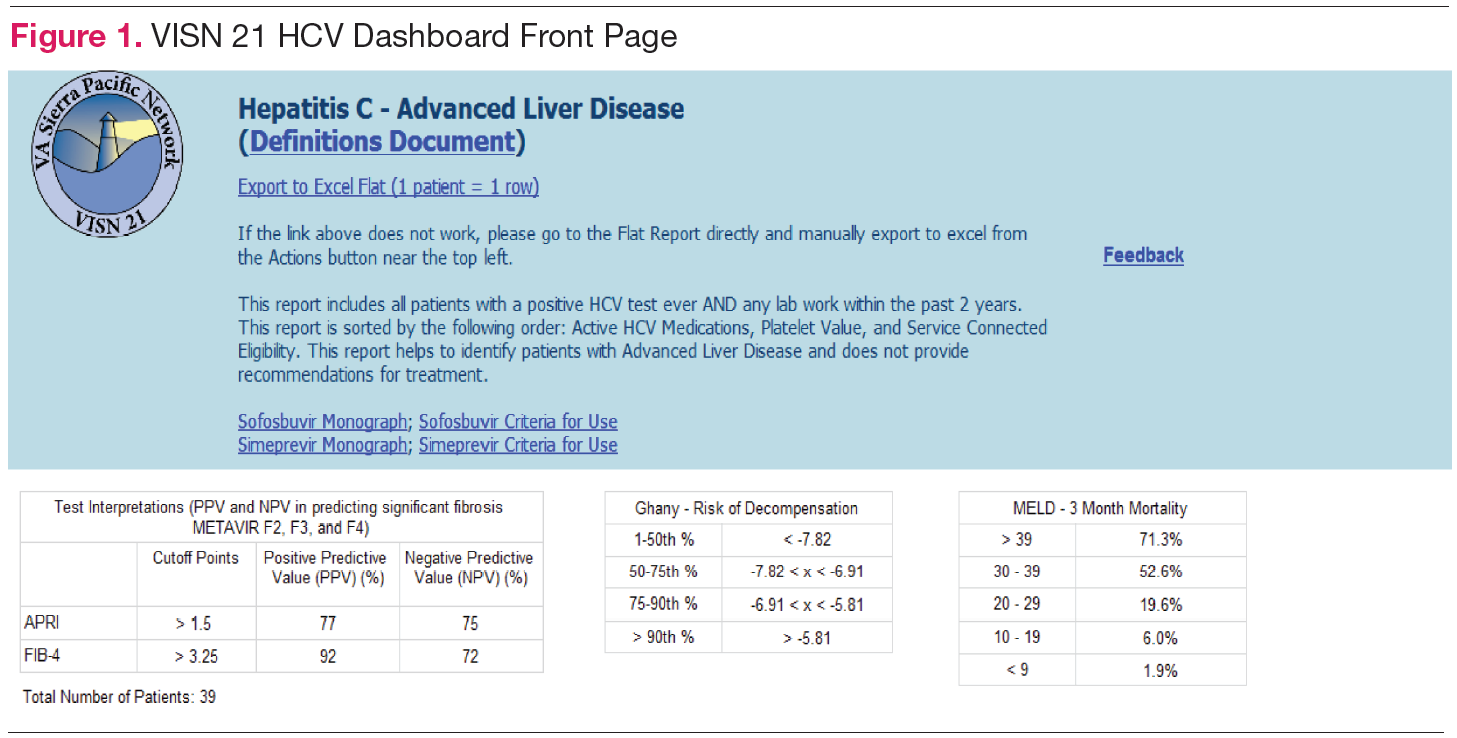
Population management. The VISN 21 HCV dashboard allows for a centralized approach to care across a large geographic area containing multiple facilities. One important function is to identify patients with advanced liver disease as well as those who have not been seen in specialty care within the previous 2 years. It also allows for pretreatment screening through identification of HCV viral characteristics (eg, genotype, viral load) and selected comorbidities (eg, renal function, mental health conditions) that may influence candidacy for specific antiviral therapies. Individual patient reports can be stratified by facility (eg, clinic or VAMC) to identify the burden of disease within a specific location.
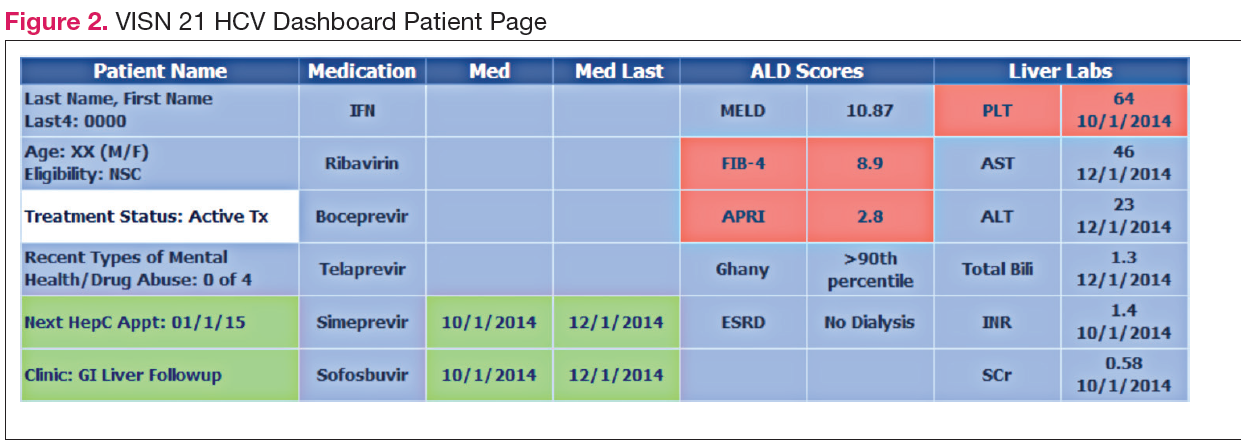
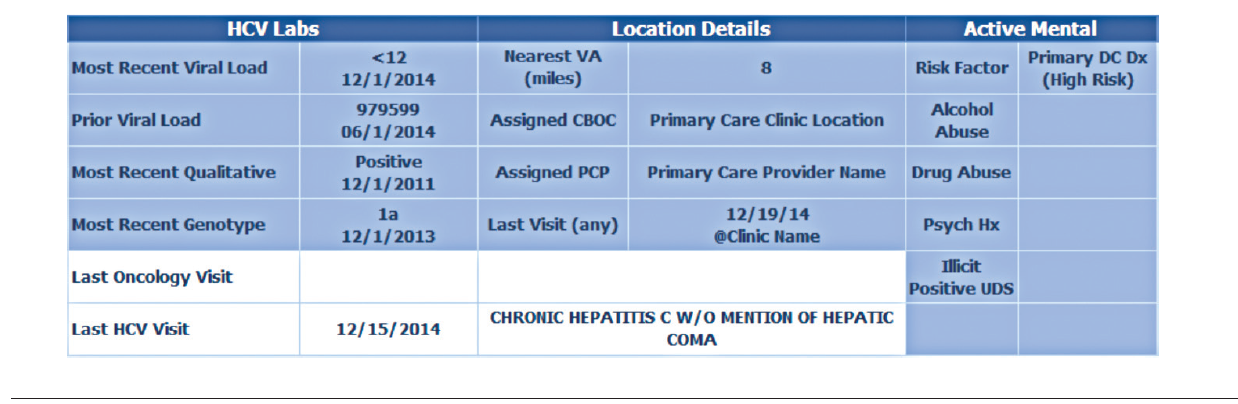
Patient treatment outcome tracking. The HCV dashboard allows tracking of the numbers and characteristics of patients who have previously received antiviral therapy. The number of patients achieving virologic cure may be tracked at the VISN and station levels, or displayed based on user-selected parameters, such as treatment history.
Administrative planning. The high costs of HCV antiviral medication requires careful budgetary planning and close communication with local and regional leadership. The VISN 21 HCV dashboard provides information crucial to assessing future treatment needs. Specifically, it allows administrators to view the number of patients actively being treated. The dashboard also allows for comparison of treatment rates among different facilities and help allocate resources where needed.
Design Architecture
To construct the source data for the dashboards, relevant data elements are pulled into a base table using Structured Query Language (SQL) code. Subsequently, SQL Server Reporting Services (SSRS) (Microsoft, Redmond, WA) compiles the dashboard output into an interactive and user-friendly interface that can be tailored to individual end users’ needs.
Dashboard development process. Through collaboration and survey of clinical providers, clinical factors necessary to decide patient and treatment readiness were identified. Relevant data elements include HCV genotype, selected medical and psychiatric comorbidities, prior receipt of treatment, and presence of advanced liver disease. While liver disease severity may be determined by invasive means, such as liver biopsy, the dashboard offers a noninvasive assessment using laboratory values (eg, calculated Fibrosis 4 score, Model for End Stage Liver Disease score).10,11
Once dashboard elements were selected, the variables were operationalized using data available in the CDW within the prescription, diagnostic, and laboratory data tables. As code was written, output was validated through chart review to ensure accuracy. Further validation was performed through comparison of the dashboard data with the clinical case registry, a registry of HCV viremic confirmed patients. Throughout dashboard development, the product was presented to end users to solicit requests for modifications. The code was refined over time to incorporate end user input.
Dashboard user interface. SSRS allows users to customize reports based on any variables defined within the data set including facility, severity of disease, HCV genotype, and prior antiviral treatment history among others. Results are displayed with summary information, including the total number of patients in the selected cohort, the number of patients who have been referred to a specialty liver clinic, and the number of patients who have been determined to achieve SVR. The end user has the option to export the results to excel for further use (eg, patient lists for telephone follow-up).
User recruitment. After piloting, the VISN 21 HCV dashboard was introduced during monthly pharmacy meetings and clinical telehealth encounters with providers. Feedback was solicited during the presentations and through postdevelopment surveys. In particular, providers requested spreadsheet-friendly formatting, additional informational fields consisting of mental health and substance abuse diagnoses, and identification of all patients with HCV regardless
of disease severity. A key element of dashboard refinement includes enhancing usability by solicitation of user feedback with subsequent tailoring of the user interface.12
Challenges
Many challenges exist in clinical dashboard development, expansion, and implementation including data integrity, workflow, and work culture. Data elements are often variable within a single facility, and this variation increases when identifying the same elements across facilities. For example, a laboratory test name (eg, “serum creatinine”) may exist with 2 to 3 different labels (eg, “creat,” “SCr,” “serum Cr”) within a single facility. As the variation increases, potential for inappropriate laboratory tests may be increased. Specialty clinic names also vary within and between facilities.
Local nomenclature for HCV clinic names may include “liver,” “infectious disease,” “hepatitis c,” or some variation, making it crucial for the dashboard developer to work closely with clinical staff to accurately matchspecialty clinic names being pulled from the data warehouse. Given the complexities of naming nomenclature within VA data, dashboard development requires a substantial investment of code customization and validation.
Ongoing dashboard maintenance is another important challenge due to the need for staff trained in SQL coding and familiarity with VA data warehouse architecture. Consequently, until the VHA dedicates resources to maintain such dashboards, only VISNs with existing technical knowledge and staffing will benefit from dashboards.
Usability, typically defined as “…effectiveness, efficiency and satisfaction with which the intended users can achieve their tasks in the intended context of product use,” is an additional consideration as the HCV clinical dashboard disseminates nationally.13 Standard clinic workflow is not always conducive to the use of dashboards. VHA providers use the Computerized Patient Record System (CPRS) to review and document patient notes. However, accessing the HCV dashboard involves a site hosted outside of CPRS, thereby requiring the user to take several extra steps. These and other usability factors will need to be considered as the dashboard disseminates more widely.
Finally, data describing the effectiveness of clinical dashboards is very limited. VISN 21 is tracking the number of users accessing the dashboard. However, further study is needed to determine if clinical dashboards improve patient access and quality of care as well as factors to enhance usability
Conclusion
Clinical dashboards have the ability to transform each clinical provider into a population health manager who can readily identify patients most in need of care within their facility catchment area and beyond. As HCV dashboard development and implementation grows across the VHA, there is a need to pair clinical and technological advancements with greater patient outreach and shared best practices. Understanding the factors that tie improved quality of care with usability as well as investment in dashboard development and related efforts will likely keep the VHA in the forefront of chronic care delivery.
Author disclosures
The authors report no actual or potential conflicts of interest with regard to this article.
Disclaimer
The opinions expressed herein are those of the authors and do not necessarily reflect those of Federal Practitioner, Frontline Medical Communications Inc., the U.S. Government, or any of its agencies. This article may discuss unlabeled or investigational use of certain drugs. Please review complete prescribing information for specific drugs or drug combinations—including indications, contraindications, warnings, and adverse effects—before administering pharmacologic therapy to patients.
1. Dominitz JA, Boyko EJ, Koepsell TD, et al. Elevated prevalence of hepatitis C infection in users of United States veterans medical centers. Hepatology. 2005;41(1):88-96.
2. United States Department of Veterans Affairs. HCV Viremic Veterans in VHA Care in 2013 with First Fill in the Year or Ever Filled a VHA Outpatient Prescription for a HCV Antiviral Medication for the Nation, by VISN and by Station Description. http://vaww.hepatitis.va.gov/data-reports/ccr2013/RegMed-AnyFirstEverInCare-Jan14-HCVVir-HCV-2013-All.asp. Accessed October 10, 2014.
3. Rongey C, Shen H, Hamilton N, Backus LI, Asch SM, Knight S. Impact of rural residence and health system structure on quality of liver care. PloS One. 2013;8(12):e84826.
4. Beste LA, Ioannou GN. Prevalence and Treatment of Chronic Hepatitis C Virus Infection in the U.S. Department of Veterans Affairs [published online ahead of print January 19, 2015]. Epidemiologic Reviews. doi: 10.1093/epirev/mxu002.
5. Lawitz E, Poordad FF, Pang PS, et al. Sofosbuvir and ledipasvir fixed-dose combination with and without ribavirin in treatment-naive and previously treated patients with genotype 1 hepatitis C virus infection (LONESTAR): an openlabel, randomised, phase 2 trial [published correction appears in Lancet. 2014;383(9920):870]. Lancet. 2014;383(9916):515-523.
6. United States Department of Veterans Affairs. HCV Viremic Veterans in VHA Care in 2013 who had a VHA Diagnosis of Fibrosis/Cirrhosis by FIB-4 in the year for the Nation, by VISN and by Station. http://vaww.hepatitis.va.gov/data-reports/ccr2013/Cond-FIB4CurInCare-Jan14HCVVir-2013-All.asp. Accessed October 10, 2014.
7. Kanwal F, Hoang T, Kramer JR, et al. Increasing prevalence of HCC and cirrhosis in patients with chronic hepatitis C virus infection. Gastroenterology. 2011;140(4):1182-1188.e1.
8. Furukawa MF, King J, Patel V, Hsiao CJ, Adler-Milstein J, Jha AK. Despite substantial progress in EHR adoption, health information exchange and patient engagement remain low in office settings. Health Aff (Millwood). 2014;33(9):1672-1679.
9. Vrieze SI, Docherty A, Thuras P, et al. Best practices: The electronic medical record is an invaluable clinical tool: Let’s start using it. Psychiatric Serv. 2013;64(10):946-949.
10. Vallet-Pichard A, Mallet V, Nalpas B, et al. FIB-4: An inexpensive and accurate marker of fibrosis in HCV infection. Comparison with liver biopsy and fibrotest. Hepatology. 2007;46(1):32-36.
11. Kamath PS, Kim WR; Advanced Liver Disease Study Group. The model for endstage liver disease (MELD). Hepatology. 2007;45(3):797-805.
12. Goldberg L, Lide B, Lowry S, et al. Usability and accessibility in consumer health informatics current trends and future challenges. Am J Prev Med. 2011;40(5 suppl 2):S187-S197.
13. Schumacher RM, Lowry SZ; National Institute of Standards and Technology. NIST Guide to the Processes Approach for Improving the Usability of Electronic Health Records. http://www.nist.gov/itl/hit/upload/Guide_Final_Publication_Version.pdf. Published November 29, 2010. Accessed November 24, 2014.
The VHA cares for 170,000 patients with chronic hepatitis C virus (HCV) infection, making it the largest single provider of medical care to chronic HCV patients in the U.S.1 Although HCV treatment rates within the VHA outpace those of the private sector, only half of patients with HCV infection within the VHA have accessed a liver specialist and less than a quarter have received antiviral medication.2-4
Newer HCV treatment regimens promise treatment sustained virologic response (SVR) rates—a marker of viral clearance posttreatment—of ≥ 90% in most cases but require careful patient selection and management.5 In particular, the estimated 24% of patients with HCV infection with advanced liver disease require more rapid consideration for therapy to reduce complications of cirrhosis such as liver failure, hepatocellular carcinoma, and death.6 With the advent of promising HCV therapies and rising rates of cirrhosis, there is an urgent need for population health management approach to deliver HCV care more widely and effectively.5,7
Rationale for Clinical Dashboards
Although the VHA hosts the largest integrated electronic medical record (EMR) system in the U.S., an EMR on its own does not guarantee improved patient care or access.8 EMRs can be used to document health care delivery, but they do not routinely provide information about the burden of disease in a population, nor do they identify patients most in need of care.
Clinical dashboards are tools that are geared to provide clinicians with relevant data to improve patient care. Early clinical dashboard development across the VHA was primary care focused, targeting patients with diabetes, ischemic heart disease, and hypertension. This national primary care dashboard provides clinically relevant, actionable data and enables the clinical provider to track patient progress. In addition, regional data can be aggregated for use by VISN managers.
While the impact of dashboards on quality of care is not well investigated, it remains a vital tool with the potential to transform care.9
HCV dashboards have been developed by individual VISNs and facilities across the VHA. HCV dashboards serve to identify patients most in need of antiviral therapy, expand outreach to those previously unseen by specialty care, sort patients by severity of liver disease, track treatment status, and calculate SVR.
Current HCV dashboards incorporate elements derived from the VA Corporate Data Warehouse (CDW), a national VA data repository consisting of data from all facilities’ electronic medical record systems. Updated information from the previous day is made available in VISN data warehouses and is refreshed nightly. The final result is user-friendly clinical data available in near-real time to dashboard users.
VISN 21 HCV Dashboard
Purpose and Elements
The VISN 21 HCV dashboard will be discussed as a prototype. Graphics of the VISN 21 dashboard interface are presented in Figure 1 and Figure 2. The VISN 21 HCV dashboard was developed by pharmacists with specialty training in medical informatics, health care analytics, and data management. The dashboard addresses 3 previously unmet needs in HCV care: population management, patient treatment outcome tracking, and administrative planning.
Population management. The VISN 21 HCV dashboard allows for a centralized approach to care across a large geographic area containing multiple facilities. One important function is to identify patients with advanced liver disease as well as those who have not been seen in specialty care within the previous 2 years. It also allows for pretreatment screening through identification of HCV viral characteristics (eg, genotype, viral load) and selected comorbidities (eg, renal function, mental health conditions) that may influence candidacy for specific antiviral therapies. Individual patient reports can be stratified by facility (eg, clinic or VAMC) to identify the burden of disease within a specific location.
Patient treatment outcome tracking. The HCV dashboard allows tracking of the numbers and characteristics of patients who have previously received antiviral therapy. The number of patients achieving virologic cure may be tracked at the VISN and station levels, or displayed based on user-selected parameters, such as treatment history.
Administrative planning. The high costs of HCV antiviral medication requires careful budgetary planning and close communication with local and regional leadership. The VISN 21 HCV dashboard provides information crucial to assessing future treatment needs. Specifically, it allows administrators to view the number of patients actively being treated. The dashboard also allows for comparison of treatment rates among different facilities and help allocate resources where needed.
Design Architecture
To construct the source data for the dashboards, relevant data elements are pulled into a base table using Structured Query Language (SQL) code. Subsequently, SQL Server Reporting Services (SSRS) (Microsoft, Redmond, WA) compiles the dashboard output into an interactive and user-friendly interface that can be tailored to individual end users’ needs.
Dashboard development process. Through collaboration and survey of clinical providers, clinical factors necessary to decide patient and treatment readiness were identified. Relevant data elements include HCV genotype, selected medical and psychiatric comorbidities, prior receipt of treatment, and presence of advanced liver disease. While liver disease severity may be determined by invasive means, such as liver biopsy, the dashboard offers a noninvasive assessment using laboratory values (eg, calculated Fibrosis 4 score, Model for End Stage Liver Disease score).10,11
Once dashboard elements were selected, the variables were operationalized using data available in the CDW within the prescription, diagnostic, and laboratory data tables. As code was written, output was validated through chart review to ensure accuracy. Further validation was performed through comparison of the dashboard data with the clinical case registry, a registry of HCV viremic confirmed patients. Throughout dashboard development, the product was presented to end users to solicit requests for modifications. The code was refined over time to incorporate end user input.
Dashboard user interface. SSRS allows users to customize reports based on any variables defined within the data set including facility, severity of disease, HCV genotype, and prior antiviral treatment history among others. Results are displayed with summary information, including the total number of patients in the selected cohort, the number of patients who have been referred to a specialty liver clinic, and the number of patients who have been determined to achieve SVR. The end user has the option to export the results to excel for further use (eg, patient lists for telephone follow-up).
User recruitment. After piloting, the VISN 21 HCV dashboard was introduced during monthly pharmacy meetings and clinical telehealth encounters with providers. Feedback was solicited during the presentations and through postdevelopment surveys. In particular, providers requested spreadsheet-friendly formatting, additional informational fields consisting of mental health and substance abuse diagnoses, and identification of all patients with HCV regardless
of disease severity. A key element of dashboard refinement includes enhancing usability by solicitation of user feedback with subsequent tailoring of the user interface.12
Challenges
Many challenges exist in clinical dashboard development, expansion, and implementation including data integrity, workflow, and work culture. Data elements are often variable within a single facility, and this variation increases when identifying the same elements across facilities. For example, a laboratory test name (eg, “serum creatinine”) may exist with 2 to 3 different labels (eg, “creat,” “SCr,” “serum Cr”) within a single facility. As the variation increases, potential for inappropriate laboratory tests may be increased. Specialty clinic names also vary within and between facilities.
Local nomenclature for HCV clinic names may include “liver,” “infectious disease,” “hepatitis c,” or some variation, making it crucial for the dashboard developer to work closely with clinical staff to accurately matchspecialty clinic names being pulled from the data warehouse. Given the complexities of naming nomenclature within VA data, dashboard development requires a substantial investment of code customization and validation.
Ongoing dashboard maintenance is another important challenge due to the need for staff trained in SQL coding and familiarity with VA data warehouse architecture. Consequently, until the VHA dedicates resources to maintain such dashboards, only VISNs with existing technical knowledge and staffing will benefit from dashboards.
Usability, typically defined as “…effectiveness, efficiency and satisfaction with which the intended users can achieve their tasks in the intended context of product use,” is an additional consideration as the HCV clinical dashboard disseminates nationally.13 Standard clinic workflow is not always conducive to the use of dashboards. VHA providers use the Computerized Patient Record System (CPRS) to review and document patient notes. However, accessing the HCV dashboard involves a site hosted outside of CPRS, thereby requiring the user to take several extra steps. These and other usability factors will need to be considered as the dashboard disseminates more widely.
Finally, data describing the effectiveness of clinical dashboards is very limited. VISN 21 is tracking the number of users accessing the dashboard. However, further study is needed to determine if clinical dashboards improve patient access and quality of care as well as factors to enhance usability
Conclusion
Clinical dashboards have the ability to transform each clinical provider into a population health manager who can readily identify patients most in need of care within their facility catchment area and beyond. As HCV dashboard development and implementation grows across the VHA, there is a need to pair clinical and technological advancements with greater patient outreach and shared best practices. Understanding the factors that tie improved quality of care with usability as well as investment in dashboard development and related efforts will likely keep the VHA in the forefront of chronic care delivery.
Author disclosures
The authors report no actual or potential conflicts of interest with regard to this article.
Disclaimer
The opinions expressed herein are those of the authors and do not necessarily reflect those of Federal Practitioner, Frontline Medical Communications Inc., the U.S. Government, or any of its agencies. This article may discuss unlabeled or investigational use of certain drugs. Please review complete prescribing information for specific drugs or drug combinations—including indications, contraindications, warnings, and adverse effects—before administering pharmacologic therapy to patients.
1. Dominitz JA, Boyko EJ, Koepsell TD, et al. Elevated prevalence of hepatitis C infection in users of United States veterans medical centers. Hepatology. 2005;41(1):88-96.
2. United States Department of Veterans Affairs. HCV Viremic Veterans in VHA Care in 2013 with First Fill in the Year or Ever Filled a VHA Outpatient Prescription for a HCV Antiviral Medication for the Nation, by VISN and by Station Description. http://vaww.hepatitis.va.gov/data-reports/ccr2013/RegMed-AnyFirstEverInCare-Jan14-HCVVir-HCV-2013-All.asp. Accessed October 10, 2014.
3. Rongey C, Shen H, Hamilton N, Backus LI, Asch SM, Knight S. Impact of rural residence and health system structure on quality of liver care. PloS One. 2013;8(12):e84826.
4. Beste LA, Ioannou GN. Prevalence and Treatment of Chronic Hepatitis C Virus Infection in the U.S. Department of Veterans Affairs [published online ahead of print January 19, 2015]. Epidemiologic Reviews. doi: 10.1093/epirev/mxu002.
5. Lawitz E, Poordad FF, Pang PS, et al. Sofosbuvir and ledipasvir fixed-dose combination with and without ribavirin in treatment-naive and previously treated patients with genotype 1 hepatitis C virus infection (LONESTAR): an openlabel, randomised, phase 2 trial [published correction appears in Lancet. 2014;383(9920):870]. Lancet. 2014;383(9916):515-523.
6. United States Department of Veterans Affairs. HCV Viremic Veterans in VHA Care in 2013 who had a VHA Diagnosis of Fibrosis/Cirrhosis by FIB-4 in the year for the Nation, by VISN and by Station. http://vaww.hepatitis.va.gov/data-reports/ccr2013/Cond-FIB4CurInCare-Jan14HCVVir-2013-All.asp. Accessed October 10, 2014.
7. Kanwal F, Hoang T, Kramer JR, et al. Increasing prevalence of HCC and cirrhosis in patients with chronic hepatitis C virus infection. Gastroenterology. 2011;140(4):1182-1188.e1.
8. Furukawa MF, King J, Patel V, Hsiao CJ, Adler-Milstein J, Jha AK. Despite substantial progress in EHR adoption, health information exchange and patient engagement remain low in office settings. Health Aff (Millwood). 2014;33(9):1672-1679.
9. Vrieze SI, Docherty A, Thuras P, et al. Best practices: The electronic medical record is an invaluable clinical tool: Let’s start using it. Psychiatric Serv. 2013;64(10):946-949.
10. Vallet-Pichard A, Mallet V, Nalpas B, et al. FIB-4: An inexpensive and accurate marker of fibrosis in HCV infection. Comparison with liver biopsy and fibrotest. Hepatology. 2007;46(1):32-36.
11. Kamath PS, Kim WR; Advanced Liver Disease Study Group. The model for endstage liver disease (MELD). Hepatology. 2007;45(3):797-805.
12. Goldberg L, Lide B, Lowry S, et al. Usability and accessibility in consumer health informatics current trends and future challenges. Am J Prev Med. 2011;40(5 suppl 2):S187-S197.
13. Schumacher RM, Lowry SZ; National Institute of Standards and Technology. NIST Guide to the Processes Approach for Improving the Usability of Electronic Health Records. http://www.nist.gov/itl/hit/upload/Guide_Final_Publication_Version.pdf. Published November 29, 2010. Accessed November 24, 2014.