User login
Relapsing-remitting MS best treated within 6 months of onset
BERLIN – according to real-world data from the Big Multiple Sclerosis Data Network.

Receiving disease-modifying treatments (DMTs) within 6 months of diagnosis was associated with a 28% reduction in the risk of reaching an Expanded Disability Status Scale score of 3.0 or more for the first time at 12 months versus receiving treatment after 6 months (hazard ratio, 0.72; 95% confidence interval, 0.59-0.90; P = .003).
Results were not significant, looking at all the other periods tested at 6-month intervals from 1 year up to 5 years after diagnosis. HRs (95% CIs) comparing a first DMT given at 1 year, 1.5 years, 2 years, 2.5 years, 3 years, 3.5 years, 4 years, 4.5 years, and 5 years were a respective 0.90 (0.78-1.03), 0.89 (0.79-1.01), 0.99 (0.88-1.11), 0.95 (0.85-1.06), 1.01 (0.90-1.12), 0.97 (0.86-1.09), 1.09 (0.96-1.22), 1.11 (0.98-1.25), and 1.06 (0.93-1.20).
“To date, these data represent the largest RRMS cohort with the longest follow-up ever analyzed to determine the long-term effectiveness of the early start of DMTs,” said Pietro Iaffaldano, MD, at the annual congress of the European Committee for Treatment and Research in Multiple Sclerosis.
“This study also provides evidence that data sharing from MS registries and databases is feasible,” noted Dr. Iaffaldano, who is assistant professor of neurology at the University of Bari (Italy). Such an approach can provide enough statistical power to detect the impact of treatment on disability outcomes in the long term, he suggested.
For the study, a cohort of 11,934 patients was obtained by screening more than 149,636 patients from five large registries and databases of MS patients – the Italian MS Registry, the Swedish MS Registry, the Danish MS Registry, OFSEP (Observatoire Français de al Sclérose en Plaques), and MSBase. Patients were included in the current analysis if they had at least 10 years of follow-up, had at least three EDSS evaluations, and at least one DMT prescription.
“It is well known that randomized, controlled trials support the early start of treatment in MS, but open-label extensions of the same trials reported inconsistent results about the long-term benefit on disability accumulation,” Dr. Iaffaldano explained. Further, recent observational studies have suggested that initiating DMTs early might not only delay the accumulation of disability but perhaps also death.
The aim of the research was thus to look at what effect the time interval from disease onset to the first administration of a DMT might have on long-term disability accumulation, as measured by the EDSS, in patients with RRMS.
The population of patients studied was mostly (71%) female, with a median age of 27 years at disease onset. The number of relapses prior to starting a DMT was two and the baseline EDSS was 2.0. In almost all (98.9%) cases, DMT was used as first-line treatment (second line in 1.1% of cases). The median follow-up was 13.2 years and cumulative DMT exposure was 10.5 years.
The work was supported by Biogen International on the basis of a sponsored research agreement with the Big Multiple Sclerosis Data Network. Dr. Iaffaldano has served on scientific advisory boards for and received funding for travel and/or speaker honoraria from Biogen and other companies that market DMTs for MS. Several study authors are employees of Biogen, and other study authors also reported financial ties to Biogen and other pharmaceutical companies.
SOURCE: Iaffaldano P et al. Mult Scler. 2018;24(Suppl 2):71-2, Abstract 204.
BERLIN – according to real-world data from the Big Multiple Sclerosis Data Network.
Receiving disease-modifying treatments (DMTs) within 6 months of diagnosis was associated with a 28% reduction in the risk of reaching an Expanded Disability Status Scale score of 3.0 or more for the first time at 12 months versus receiving treatment after 6 months (hazard ratio, 0.72; 95% confidence interval, 0.59-0.90; P = .003).
Results were not significant, looking at all the other periods tested at 6-month intervals from 1 year up to 5 years after diagnosis. HRs (95% CIs) comparing a first DMT given at 1 year, 1.5 years, 2 years, 2.5 years, 3 years, 3.5 years, 4 years, 4.5 years, and 5 years were a respective 0.90 (0.78-1.03), 0.89 (0.79-1.01), 0.99 (0.88-1.11), 0.95 (0.85-1.06), 1.01 (0.90-1.12), 0.97 (0.86-1.09), 1.09 (0.96-1.22), 1.11 (0.98-1.25), and 1.06 (0.93-1.20).
“To date, these data represent the largest RRMS cohort with the longest follow-up ever analyzed to determine the long-term effectiveness of the early start of DMTs,” said Pietro Iaffaldano, MD, at the annual congress of the European Committee for Treatment and Research in Multiple Sclerosis.
“This study also provides evidence that data sharing from MS registries and databases is feasible,” noted Dr. Iaffaldano, who is assistant professor of neurology at the University of Bari (Italy). Such an approach can provide enough statistical power to detect the impact of treatment on disability outcomes in the long term, he suggested.
For the study, a cohort of 11,934 patients was obtained by screening more than 149,636 patients from five large registries and databases of MS patients – the Italian MS Registry, the Swedish MS Registry, the Danish MS Registry, OFSEP (Observatoire Français de al Sclérose en Plaques), and MSBase. Patients were included in the current analysis if they had at least 10 years of follow-up, had at least three EDSS evaluations, and at least one DMT prescription.
“It is well known that randomized, controlled trials support the early start of treatment in MS, but open-label extensions of the same trials reported inconsistent results about the long-term benefit on disability accumulation,” Dr. Iaffaldano explained. Further, recent observational studies have suggested that initiating DMTs early might not only delay the accumulation of disability but perhaps also death.
The aim of the research was thus to look at what effect the time interval from disease onset to the first administration of a DMT might have on long-term disability accumulation, as measured by the EDSS, in patients with RRMS.
The population of patients studied was mostly (71%) female, with a median age of 27 years at disease onset. The number of relapses prior to starting a DMT was two and the baseline EDSS was 2.0. In almost all (98.9%) cases, DMT was used as first-line treatment (second line in 1.1% of cases). The median follow-up was 13.2 years and cumulative DMT exposure was 10.5 years.
The work was supported by Biogen International on the basis of a sponsored research agreement with the Big Multiple Sclerosis Data Network. Dr. Iaffaldano has served on scientific advisory boards for and received funding for travel and/or speaker honoraria from Biogen and other companies that market DMTs for MS. Several study authors are employees of Biogen, and other study authors also reported financial ties to Biogen and other pharmaceutical companies.
SOURCE: Iaffaldano P et al. Mult Scler. 2018;24(Suppl 2):71-2, Abstract 204.
REPORTING FROM ECTRIMS 2018
Key clinical point: Less disease progression occurs if disease-modifying treatments (DMTs) are given early in relapsing-remitting multiple sclerosis (RRMS).
Major finding: DMTs within 6 months vs. later decreased the risk of confirmed first disability progression at 12 months by 28% (P = .003).
Study details: 11,934 patients with RRMS with at least 10 years’ follow-up, three or more Expanded Disability Status Scale evaluations, and at least one DMT prescription.
Disclosures: The work was supported by Biogen International on the basis of a sponsored research agreement with the Big Multiple Sclerosis Data Network. Dr. Iaffaldano has served on scientific advisory boards for and received funding for travel and/or speaker honoraria from Biogen and other companies that market DMTs for MS. Several study authors are employees of Biogen, and other study authors also reported financial ties to Biogen and other pharmaceutical companies.
Source: Iaffaldano P et al. Mult Scler. 2018;24(Suppl 2):71-2, Abstract 204.
Mood disorders worsen multiple sclerosis disability
BERLIN – Depression and bipolar disorder are major risk factors for worsening disability in people with multiple sclerosis, according to the results of a large Swedish registry-based study.

The presence of depression increased the risk of having a sustained Expanded Disability Status Scale (EDSS) score of 3.0 by 54% and 4.0 by 87%, and it doubled the risk of an EDSS of 6.0.
Selective serotonin reuptake inhibitor treatment also upped the risk of greater disability, with patients exposed to SSRIs having a 40% increased risk of a sustained EDSS of 3.0, a 97% chance of having a sustained EDSS of 4.0, and 2.2-fold increased risk of a sustained EDSS of 6.0.
“We know that mood disorders are highly prevalent in people with multiple sclerosis,” Stefanie Binzer, MD, said at the annual congress of the European Committee for Treatment and Research in Multiple Sclerosis. She gave her presentation at the meeting on Oct. 10, which was World Mental Health Day.
The presence of mood disorders is associated with reduced quality of life, said Dr. Binzer of the department of clinical neuroscience at the Karolinska Institute in Stockholm. Furthermore, depression is the major risk factor for suicidality in patients with MS. However, before this study the effect of having a comorbid mood disorder on MS patients’ disability levels had not been established.
The investigators analyzed data from 5,875 patients in the Swedish MS registry between 2001 and 2014. By matching these patients to records in the Swedish National Patient Registry and the Swedish National Prescribed Drug Registry, they found that 8.5% (n = 502) had an International Classification of Diseases, 10th revision (ICD-10), code for depression. Of these, 261 had received a diagnosis of depression before their diagnosis of MS.
Of 3,817 patients with MS onset between 2005 and 2014, 27.4% (n = 1,048) had collected at least one prescription for an SSRI.
“What we found was that MS patients with either an ICD code for depression or having been exposed to SSRIs had a significantly increased risk of reaching EDSS 3.0,” Dr. Binzer reported. The age at which patients reached these milestones were younger in both groups when compared with MS patients without depression, she observed.
“The difference between the groups [MS with and MS without depression] seemed to increased with EDSS,” Dr. Binzer said.
Although not statistically significant, there was a trend for patients with depression to be more likely to convert to secondary progressive MS, with a hazard ratio of 1.38 (95% confidence interval, 0.91-2.1).
“For a sensitivity analysis, we found that those who had depression prior to their first MS symptom, the median age when they reached EDSS 3.0 and 4.0 was reduced by 3 and 7 years, respectively,” Dr. Binzer said, adding that, unfortunately, there wasn’t enough power to look at the other endpoints.
In regard to bipolar disorder, 1.5% (n = 200) of 13,125 MS patients diagnosed between 1973 and 2014 were identified with this mood disorder. Its presence significantly increased the risk of MS patients reaching an EDSS score of 4.0 by 58% (95% CI, 1.1-2.28), but not EDSS 3.0 (HR = 1.34; 95% CI, 0.94-1.92) or 6.0 (HR = 1.16; 95% CI, 0.79-1.69). The latter could be due to smaller sample size, Dr. Binzer suggested.
The investigators’ analysis of the results stratified by sex, conducted because men tend to fare worse than women with MS and progress faster, showed that for both depression and bipolar disorder, men were at significantly higher risk of reaching sustained disability milestones. Indeed, compared with women, men with depression had a 61% increased risk and those with bipolar disorder a 31% increased risk of reaching an EDSS score of 6.0. They also had 51% and 32% increased risks of conversion to secondary progressive MS.
“We don’t know the mechanisms that underlie these associations,” Dr. Binzer noted. “Irrespective of the underlying mechanisms, [the study] clearly shows that it’s imperative that we recognize, early, mood disorders in MS patients, and manage them effectively in order to provide better care and hopefully reduce MS disability worsening.”
The research was funded by the Swedish Research Council and the Swedish Brain Foundation. Dr. Binzer has received speaker fees and travel grants from Biogen.
SOURCE: Binzer S et al. Mult Scler. 2018;24(Suppl 2):41. Abstract 99.
BERLIN – Depression and bipolar disorder are major risk factors for worsening disability in people with multiple sclerosis, according to the results of a large Swedish registry-based study.
The presence of depression increased the risk of having a sustained Expanded Disability Status Scale (EDSS) score of 3.0 by 54% and 4.0 by 87%, and it doubled the risk of an EDSS of 6.0.
Selective serotonin reuptake inhibitor treatment also upped the risk of greater disability, with patients exposed to SSRIs having a 40% increased risk of a sustained EDSS of 3.0, a 97% chance of having a sustained EDSS of 4.0, and 2.2-fold increased risk of a sustained EDSS of 6.0.
“We know that mood disorders are highly prevalent in people with multiple sclerosis,” Stefanie Binzer, MD, said at the annual congress of the European Committee for Treatment and Research in Multiple Sclerosis. She gave her presentation at the meeting on Oct. 10, which was World Mental Health Day.
The presence of mood disorders is associated with reduced quality of life, said Dr. Binzer of the department of clinical neuroscience at the Karolinska Institute in Stockholm. Furthermore, depression is the major risk factor for suicidality in patients with MS. However, before this study the effect of having a comorbid mood disorder on MS patients’ disability levels had not been established.
The investigators analyzed data from 5,875 patients in the Swedish MS registry between 2001 and 2014. By matching these patients to records in the Swedish National Patient Registry and the Swedish National Prescribed Drug Registry, they found that 8.5% (n = 502) had an International Classification of Diseases, 10th revision (ICD-10), code for depression. Of these, 261 had received a diagnosis of depression before their diagnosis of MS.
Of 3,817 patients with MS onset between 2005 and 2014, 27.4% (n = 1,048) had collected at least one prescription for an SSRI.
“What we found was that MS patients with either an ICD code for depression or having been exposed to SSRIs had a significantly increased risk of reaching EDSS 3.0,” Dr. Binzer reported. The age at which patients reached these milestones were younger in both groups when compared with MS patients without depression, she observed.
“The difference between the groups [MS with and MS without depression] seemed to increased with EDSS,” Dr. Binzer said.
Although not statistically significant, there was a trend for patients with depression to be more likely to convert to secondary progressive MS, with a hazard ratio of 1.38 (95% confidence interval, 0.91-2.1).
“For a sensitivity analysis, we found that those who had depression prior to their first MS symptom, the median age when they reached EDSS 3.0 and 4.0 was reduced by 3 and 7 years, respectively,” Dr. Binzer said, adding that, unfortunately, there wasn’t enough power to look at the other endpoints.
In regard to bipolar disorder, 1.5% (n = 200) of 13,125 MS patients diagnosed between 1973 and 2014 were identified with this mood disorder. Its presence significantly increased the risk of MS patients reaching an EDSS score of 4.0 by 58% (95% CI, 1.1-2.28), but not EDSS 3.0 (HR = 1.34; 95% CI, 0.94-1.92) or 6.0 (HR = 1.16; 95% CI, 0.79-1.69). The latter could be due to smaller sample size, Dr. Binzer suggested.
The investigators’ analysis of the results stratified by sex, conducted because men tend to fare worse than women with MS and progress faster, showed that for both depression and bipolar disorder, men were at significantly higher risk of reaching sustained disability milestones. Indeed, compared with women, men with depression had a 61% increased risk and those with bipolar disorder a 31% increased risk of reaching an EDSS score of 6.0. They also had 51% and 32% increased risks of conversion to secondary progressive MS.
“We don’t know the mechanisms that underlie these associations,” Dr. Binzer noted. “Irrespective of the underlying mechanisms, [the study] clearly shows that it’s imperative that we recognize, early, mood disorders in MS patients, and manage them effectively in order to provide better care and hopefully reduce MS disability worsening.”
The research was funded by the Swedish Research Council and the Swedish Brain Foundation. Dr. Binzer has received speaker fees and travel grants from Biogen.
SOURCE: Binzer S et al. Mult Scler. 2018;24(Suppl 2):41. Abstract 99.
REPORTING FROM ECTRIMS 2018
Key clinical point:
Major finding: Depression and bipolar disorder increased the risk of reaching Expanded Disability Status Scale scores of 3.0, 4.0, and 6.0, particularly in men with MS.
Study details: Swedish registry study of nearly 6,000 individuals with confirmed MS, 8.5% of whom had depression and 1.5% of whom had bipolar disorder.
Disclosures: The research was funded by the Swedish Research Council and the Swedish Brain Foundation. Dr. Binzer has received speaker fees and travel grants from Biogen.
Source: Binzer S et al. Mult Scler. 2018;24(Suppl 2):41. Abstract 99.
Revamped MS criteria boost pediatric diagnoses
BERLIN –

The increased accuracy largely hinged on a positive finding of oligoclonal bands in cerebrospinal fluid – a diagnostic hallmark that was not included in the earlier criteria, Georgina Arrambide, MD, said at the annual congress of the European Committee for Treatment and Research in Multiple Sclerosis.
“Application to children of the new diagnostic criteria is limited,” said Dr. Arrambide, of the University Hospital Vall d’Hebron Multiple Sclerosis Centre of Catalonia, Barcelona. “And there are still some uncertainties with regard to fluid biomarkers and how they predict or confirm a diagnosis of MS in children, and also their relationship to the disease evolution.”
The updated McDonald criteria are intended to boost early, definitive MS diagnosis, leading to earlier initiation of therapy. They are intended primarily for patients aged 11 years and older who present with a typical clinically isolated syndrome and high probability of MS (Lancet Neurol. 2018;17[2]:162-73).
Dr. Arrambide and her colleagues used the revamped criteria to reassess MS diagnoses in a prospective Spanish cohort of children who experienced an acute first demyelinating event and were diagnosed with the 2010 criteria. The Kids-METOMS-MOGBCN Study enrolls children aged younger than 18 years within 1 year of a first acute demyelinating episode. It includes demographic, clinical, and imaging data, as well as data on oligoclonal bands and antibodies against aquaporin-4 and myelin oligodendrocyte glycoprotein (MoG). Of these fluid biomarkers, only oligoclonal bands are included in the new McDonald criteria.
The 55 children in Dr. Arrambide’s analysis were followed for a mean of 16 months. They included 25 (45%) girls with an overall median age of 6 years at the first acute event. Oligoclonal bands were present in 56%, and both anti-MoG and anti–aquaporin-4 antibodies in 82%.
All children had abnormal brain MRI at baseline, with about 33% having gadolinium-enhancing brain lesions. Spinal cord MRI was abnormal in 50%, with 39% having gadolinium-enhancing lesions. According to the 2010 criteria, only three had a definitive MS diagnosis at baseline. The diagnosis was acute disseminated encephalomyelitis in 51%, clinically isolated syndrome in 31%, radiologically isolated syndrome in 2%, and nonencephalopathic disseminated encephalomyelitis in the remainder.
At baseline, three of those had a definitive MS diagnosis, displaying dissemination in both space and time as required by both the 2010 and 2017 criteria. The addition of oligoclonal band positivity added one more patient over the 2010 criteria, and assessing the cohort with the complete 2017 criteria added three more definitive diagnoses. This was a significant increase in definitive MS diagnoses when compared against the earlier criteria (70% vs. 30%).
Diagnoses changed in 10 other patients during follow-up. The single patient with radiologically isolated syndrome was definitively diagnosed with MS. Of the seven with clinically isolated syndrome, six were diagnosed with MS and one with a relapsing optic neuritis. Of the 28 with a nonencephalopathic encephalitis, 2 were diagnosed with optic neuritis.
The study also confirmed the benefit of adding oligoclonal bands as a diagnostic marker in children. Of those with an MS diagnosis at last follow-up, 71% were positive for the cerebrospinal fluid finding, compared with just 4% of those with a non-MS diagnosis. However, none of those children had anti-MoG antibodies, compared with 58% of those with a non-MS diagnosis. None of the patients were positive for anti–aquaporin-4, regardless of diagnosis.
That finding does not necessarily mean that the absence of anti-MoG antibodies can rule out an MS diagnosis in children, Dr. Arrambide cautioned. Nevertheless, the finding is a useful clinical marker during a diagnostic work-up.
“The presence of oligoclonal bands and the absence of MOG-IgG are both useful biomarkers when evaluating the risk of MS in children with a first demyelinating event,” she said.
She disclosed financial relationships with several pharmaceutical companies.
SOURCE: Arrambide G et al. ECTRIMS 2018, Abstract 64
BERLIN –
The increased accuracy largely hinged on a positive finding of oligoclonal bands in cerebrospinal fluid – a diagnostic hallmark that was not included in the earlier criteria, Georgina Arrambide, MD, said at the annual congress of the European Committee for Treatment and Research in Multiple Sclerosis.
“Application to children of the new diagnostic criteria is limited,” said Dr. Arrambide, of the University Hospital Vall d’Hebron Multiple Sclerosis Centre of Catalonia, Barcelona. “And there are still some uncertainties with regard to fluid biomarkers and how they predict or confirm a diagnosis of MS in children, and also their relationship to the disease evolution.”
The updated McDonald criteria are intended to boost early, definitive MS diagnosis, leading to earlier initiation of therapy. They are intended primarily for patients aged 11 years and older who present with a typical clinically isolated syndrome and high probability of MS (Lancet Neurol. 2018;17[2]:162-73).
Dr. Arrambide and her colleagues used the revamped criteria to reassess MS diagnoses in a prospective Spanish cohort of children who experienced an acute first demyelinating event and were diagnosed with the 2010 criteria. The Kids-METOMS-MOGBCN Study enrolls children aged younger than 18 years within 1 year of a first acute demyelinating episode. It includes demographic, clinical, and imaging data, as well as data on oligoclonal bands and antibodies against aquaporin-4 and myelin oligodendrocyte glycoprotein (MoG). Of these fluid biomarkers, only oligoclonal bands are included in the new McDonald criteria.
The 55 children in Dr. Arrambide’s analysis were followed for a mean of 16 months. They included 25 (45%) girls with an overall median age of 6 years at the first acute event. Oligoclonal bands were present in 56%, and both anti-MoG and anti–aquaporin-4 antibodies in 82%.
All children had abnormal brain MRI at baseline, with about 33% having gadolinium-enhancing brain lesions. Spinal cord MRI was abnormal in 50%, with 39% having gadolinium-enhancing lesions. According to the 2010 criteria, only three had a definitive MS diagnosis at baseline. The diagnosis was acute disseminated encephalomyelitis in 51%, clinically isolated syndrome in 31%, radiologically isolated syndrome in 2%, and nonencephalopathic disseminated encephalomyelitis in the remainder.
At baseline, three of those had a definitive MS diagnosis, displaying dissemination in both space and time as required by both the 2010 and 2017 criteria. The addition of oligoclonal band positivity added one more patient over the 2010 criteria, and assessing the cohort with the complete 2017 criteria added three more definitive diagnoses. This was a significant increase in definitive MS diagnoses when compared against the earlier criteria (70% vs. 30%).
Diagnoses changed in 10 other patients during follow-up. The single patient with radiologically isolated syndrome was definitively diagnosed with MS. Of the seven with clinically isolated syndrome, six were diagnosed with MS and one with a relapsing optic neuritis. Of the 28 with a nonencephalopathic encephalitis, 2 were diagnosed with optic neuritis.
The study also confirmed the benefit of adding oligoclonal bands as a diagnostic marker in children. Of those with an MS diagnosis at last follow-up, 71% were positive for the cerebrospinal fluid finding, compared with just 4% of those with a non-MS diagnosis. However, none of those children had anti-MoG antibodies, compared with 58% of those with a non-MS diagnosis. None of the patients were positive for anti–aquaporin-4, regardless of diagnosis.
That finding does not necessarily mean that the absence of anti-MoG antibodies can rule out an MS diagnosis in children, Dr. Arrambide cautioned. Nevertheless, the finding is a useful clinical marker during a diagnostic work-up.
“The presence of oligoclonal bands and the absence of MOG-IgG are both useful biomarkers when evaluating the risk of MS in children with a first demyelinating event,” she said.
She disclosed financial relationships with several pharmaceutical companies.
SOURCE: Arrambide G et al. ECTRIMS 2018, Abstract 64
REPORTING FROM ECTRIMS 2018
Key clinical point: The revised McDonald criteria increased definitive multiple sclerosis diagnoses in children.
Major finding: The 2017 criteria boosted pediatric diagnostic accuracy by 40%.
Study details: The prospective cohort study comprised 55 patients.
Disclosures: Dr. Arrambide disclosed relationships with several pharmaceutical companies.
Source: Arrambide G et al. ECTRIMS 2018, Abstract 64.
No elevated cancer risk with MS therapies in COMBAT-MS data
BERLIN – The risk of cancer – and breast cancer in particular – was not elevated above background levels in a large cohort of multiple sclerosis patients taking disease-modifying therapies.
Those findings from the large Nordic cohort study COMBAT-MS stand in contrast to previous work showing an elevated cancer risk for some monoclonal antibodies.
After statistical adjustment and use of rituximab (Rituxan) as the standard, the hazard ratio (HR) for any malignancy with fingolimod (Gilenya) was 1.74 (95% confidence interval, 0.92-3.28). For natalizumab (Tysabri), the malignancy HR was 1.06 (95% CI, 0.53-2.10), said Peter Alping, a PhD student in the department of clinical neuroscience at the Karolinska Institute, Stockholm.
Only limited data exist for real-world multiple sclerosis (MS) cohorts who have been exposed to novel disease-modifying therapies, said Mr. Alping, presenting the findings at the annual congress of the European Committee for Treatment and Research in Multiple Sclerosis. Rituximab has been studied in patients with rheumatoid arthritis, but the treatment regimens differ, as do patient characteristics, he noted. However, surveillance for risk of malignancy is important in these therapies, he said, “since modern disease-modifying therapies exert a more profound effect on the immune system, and we know that the immune system is vital in fighting and preventing cancers.”
The anti-CD20 monoclonal antibody ocrelizumab was studied in the ORATORIO trial. “There, they saw an imbalance in the numbers of breast cancers between the ocrelizumab and placebo groups,” said Mr. Alping, with raw data showing four breast cancers in the ocrelizumab population. However, this would translate to 26.1 cancers per 10,000 person-years, as opposed to the zero breast cancers seen in the placebo group (N Engl J Med. 2017;376:209-20).
“To what degree is cancer risk a concern with novel [disease-modifying therapy] use in MS?” Mr. Alping asked.
To answer the question, he and his colleagues from the Karolinska Institute sought to compare the risk of cancer in MS patients who were treated with rituximab, fingolimod, and natalizumab.
To do this, they conducted a nationwide cohort study using the Swedish MS registry, looking at treatment episodes between 2011 and 2016. In Sweden, the MS registry is also linked to the overall patient registry, as well as registries for cancer and prescription drug use. In addition, patient data are linked to national census data.
Mr. Alping and his colleagues looked at data for the first instance of use for an MS patient of rituximab, natalizumab, and/or fingolimod between the years 2011 and 2016. Then, they matched patient records from the general population by age, sex, and geographic location, enrolling the matched controls at the same time point as the MS match entered the study.
Patients treated with mitoxantrone, those who emigrated, and those who died during the study period were excluded from the study.
The statistical analysis, Mr. Alping said, used an ever-treated approach and didn’t attempt to weight exposure duration or dose. However, statistical adjustments were made for patient and control demographics and medical history, for any previous history of cancer, and for MS disease characteristics.
At baseline, 1,558 patients had been treated with fingolimod, 1,761 with natalizumab, and 3,012 with rituximab. A little less than one-third of the patients (26.3%-31.6%) were male, and the mean age was 35-43 years. Most patients (66%-86%) had undergone one or two previous therapies. The mean Expanded Disability Status Scale (EDSS) score was 2.20-2.88. Few patients (0.9%-1.7%) had any history of previous cancer.
Overall, the incidence of cancer in the MS cohort ranged from 23.09 per 10,000 person-years for rituximab ever-takers to 46.28 for those who had ever taken fingolimod. Among the general population, rates of any malignancy were 29.62 per 10,000 person-years.
Looking just at breast cancer, rates in the MS cohort ranged from 2.19 to 2.92/10,000 person-years. For the general population, the rate was 12.07/10,000 person-years.
However, using a Cox regression analysis employing MS-specific covariates and using rituximab as the reference, Mr. Alping and his colleagues calculated an inverse proportion-weighted hazard ratio for any malignancy under the various treatment conditions. Using this analysis, the HR for any cancer with fingolimod was 1.74 (95% CI, 0.92-3.28). For natalizumab, the malignancy HR was 1.06 (95% CI, 0.53-2.10).
Among just women taking rituximab, 2,274 therapy starts occurred, and one breast cancer was seen in 4,050 person-years. This yielded an incidence of 2.32 cancers per 10,000 person-years (95% CI, 0.06-12.9). This contrasts with the adjusted incidence rate in the general female population of 11.06 breast cancers per 10,000 person-years.
Looking at all the therapy episodes captured in the cohort study, there were 6,660 incidences of therapy initiation, and 52 malignancies were seen over 17,283 person-years, Mr. Alping said.
“For malignant cancer of any type, we found no increased risk for rituximab, compared to fingolimod and natalizumab,” Mr. Alping said, pointing to the wide confidence intervals in all the adjusted data. The incidence of breast cancer in women who have taken rituximab, he said, is “comparable to, or possibly lower than, that of the general female population, and lower than the incidence rate reported in the ORATORIO trial for ocrelizumab.
“The overall cancer risk and risk of breast cancer might not be major concerns short term when treating MS patients with rituximab relative to other disease-modifying therapies,” he said.
The study was partially funded by the Patient-Centered Outcomes Research Institute. Mr. Alping reported no conflicts of interest. One study author reported relationships with several pharmaceutical companies.
[email protected]
SOURCE: Alping P et al. Mult Scler. 2018;24(Suppl 2):36. Abstract 89.
REPORTING FROM ECTRIMS 2018
Key clinical point:
Major finding: The hazard ratios for fingolimod and natalizumab versus rituximab were 1.74 and 1.06, respectively, with confidence intervals crossing 1.
Study details: Case-matched observational cohort study of 6,331 DMT-taking patients with MS.
Disclosures: The study was sponsored in part by the Patient-Centered Outcomes Research Institute. Mr. Alping reported no disclosures; one study author reported financial relationships with multiple pharmaceutical companies.
Source: Alping P et al. Mult Scler. 2018;24(Suppl 2):36. Abstract 89.
Studies reveal pregnancy trends in American women with MS
New evidence provides estimates of the pregnancy rates for American women with multiple sclerosis (MS), their complication rates, and the rates of relapse and disease-modifying drug treatment during different phases before and after pregnancy.
The two new studies, conducted by Maria K. Houtchens, MD, of Brigham and Women’s Hospital and Harvard Medical School, Boston, and her colleagues involved retrospective mining of U.S. commercial health plan data in the IQVIA Real-World Data Adjudicated Claims–U.S. database between Jan. 1, 2006, and June 30, 2015.
The mean age of pregnant women in the nine annual cohorts during that period was just over 32 years for those with MS and just over 29 years for those without. The percentage of women without MS who had a pregnancy-related claim in the database declined from 8.83% in 2006 to 7.75% in 2014 after adjusting for age, region, payer, and Charlson Comorbidity Index score, whereas the percentage increased in women with MS during the same period, from 7.91% to 9.47%. The investigators matched 2,115 women with MS and 2,115 without MS who had live births for a variety of variables and found that women with MS had higher rates of premature labor (31.4% vs. 27.4%; P = .005), infection in pregnancy (13.3% vs. 10.9%; P = .016), maternal cardiovascular disease (3.0% vs. 1.9%; P = .028), anemia or acquired coagulation disorder (2.5% vs. 1.3%; P = .007), neurologic complications in pregnancy (1.6% vs. 0.6%; P = .005), and sexually transmitted diseases in pregnancy (0.4% vs. 0%; P = .045). During labor and delivery, women with MS who had a live birth more often had a claim for acquired damage to the fetus (27.8% vs. 23.5%; P = .002) and congenital fetal malformations (13.2% vs. 10.3%; P = .004) than did women without MS.
In the second study, Dr. Houtchens and two coauthors from the first study of the database reported on a set of 2,158 women who had a live birth during the study period and had 1 year of continuous insurance eligibility before and after pregnancy. The odds for having an MS relapse declined during pregnancy (odds ratio, 0.623; 95% confidence interval, 0.521-0.744), rose during the 6-week postpartum puerperium (OR, 1.710; 95% CI, 1.358-2.152), and leveled off during the last three postpartum quarters to remain at a higher level than before pregnancy (OR, 1.216; 95% CI, 1.052-1.406). Disease-modifying drug treatment followed the same pattern with 20% using it before pregnancy, dropping to about 2% in the second trimester, and peaking in about a quarter of all patients 9-12 months post partum.
SOURCES: Houtchens MK et al. Neurology. 2018 Sep 28. doi: 10.1212/WNL.0000000000006382; Houtchens MK et al. Neurology. 2018 Sep 28. doi: 10.1212/WNL.0000000000006384.
FROM NEUROLOGY
Mobile App Rankings in Dermatology
As technology continues to advance, so too does its accessibility to the general population. In 2013, 56% of Americans owned a smartphone versus 77% in 2017.1With the increase in mobile applications (apps) available, it is no surprise that the market has extended into the medical field, with dermatology being no exception.2 The majority of dermatology apps can be classified as teledermatology apps, followed by self-surveillance, disease guide, and reference apps. Additional types of dermatology apps include dermoscopy, conference, education, photograph storage and sharing, and journal apps, and others.2 In this study, we examined Apple App Store rankings to determine the types of dermatology apps that are most popular among patients and physicians.
METHODS
A popular app rankings analyzer (App Annie) was used to search for dermatology apps along with their App Store rankings.3 Although iOS is not the most popular mobile device operating system, we chose to evaluate app rankings via the App Store because iPhones are the top-selling individual phones of any kind in the United States.4
We performed our analysis on a single day (July 14, 2018) given that app rankings can change daily. We incorporated the following keywords, which were commonly used in other dermatology app studies: dermatology, psoriasis, rosacea, acne, skin cancer, melanoma, eczema, and teledermatology. The category ranking was defined as the rank of a free or paid app in the App Store’s top charts for the selected country (United States), market (Apple), and device (iPhone) within their app category (Medical). Inclusion criteria required a ranking in the top 1500 Medical apps and being categorized in the App Store as a Medical app. Exclusion criteria included apps that focused on cosmetics, private practice, direct advertisements, photograph editing, or claims to cure skin disease, as well as non–English-language apps. The App Store descriptions were assessed to determine the type of each app (eg, teledermatology, disease guide) and target audience (patient, physician, or both).
Another search was performed using the same keywords but within the Health and Fitness category to capture potentially more highly ranked apps among patients. We also conducted separate searches within the Medical category using the keywords billing, coding, and ICD (International Classification of Diseases) to evaluate rankings for billing/coding apps, as well as EMR and electronic medical records for electronic medical record (EMR) apps.
RESULTS
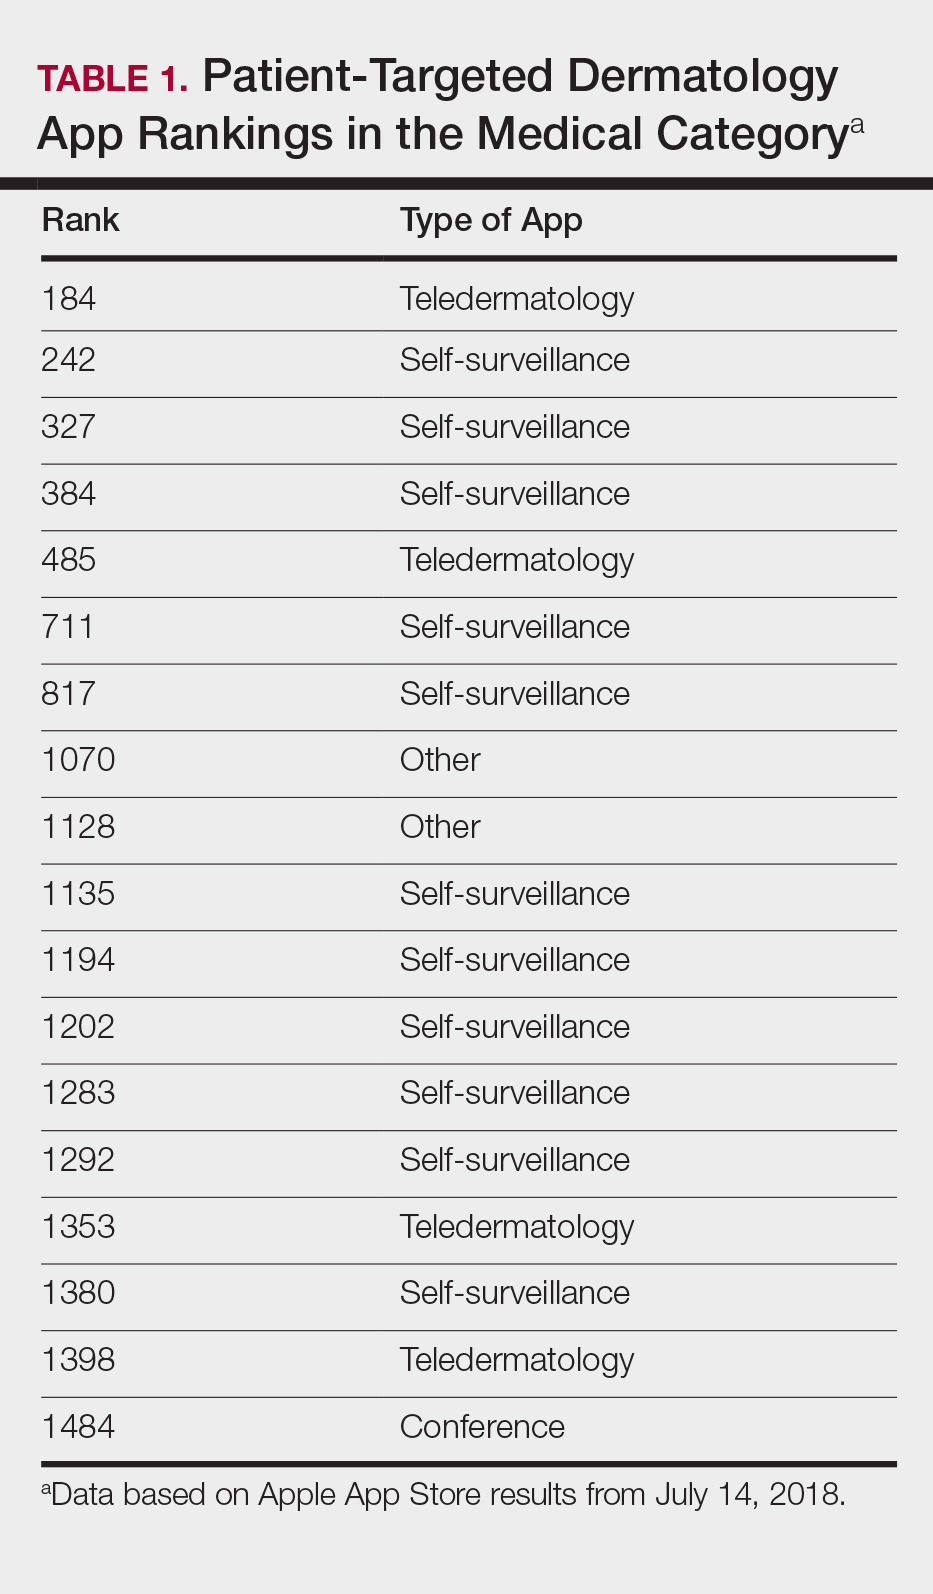
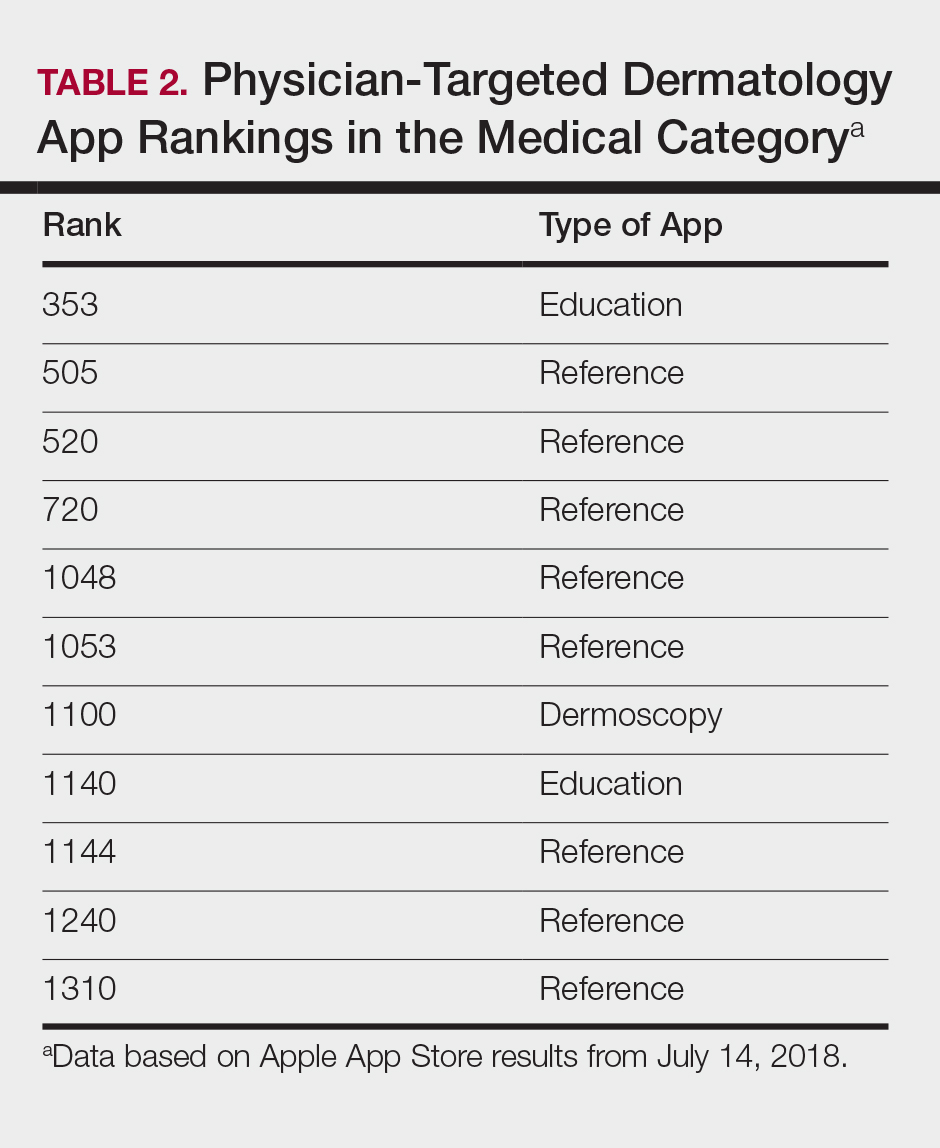
The initial search yielded 851 results, which was narrowed down to 29 apps after applying the exclusion criteria. Of note, prior to application of the exclusion criteria, one dermatology app that was considered to be a direct advertisement app claiming to cure acne was ranked fourth of 1500 apps in the Medical category. However, the majority of the search results were excluded because they were not popular enough to be ranked among the top 1500 apps. There were more ranked dermatology apps in the Medical category targeting patients than physicians; 18 of 29 (62%) qualifying apps targeted patients and 11 (38%) targeted physicians (Tables 1 and 2). No apps targeted both groups. The most common type of ranked app targeting patients was self-surveillance (11/18), and the most common type targeting physicians was reference (8/11). The highest ranked app targeting patients was a teledermatology app with a ranking of 184, and the highest ranked app targeting physicians was educational, ranked 353. The least common type of ranked apps targeting patients were “other” (2/18 [11%]; 1 prescription and 1 UV monitor app) and conference (1/18 [6%]). The least common type of ranked apps targeting physicians were education (2/11 [18%]) and dermoscopy (1/11 [9%]).
Our search of the Health and Fitness category yielded 6 apps, all targeting patients; 3 (50%) were self-surveillance apps, and 3 (50%) were classified as other (2 UV monitors and a conferencing app for cancer emotional support)(Table 3).

Our search of the Medical category for billing/coding and EMR apps yielded 232 and 164 apps, respectively; of them, 49 (21%) and 54 (33%) apps were ranked. These apps did not overlap with the dermatology-related search criteria; thus, we were not able to ascertain how many of these apps were used specifically by health care providers in dermatology.
COMMENT
Patient Apps
The most common apps used by patients are fitness and nutrition tracker apps categorized as Health and Fitness5,6; however, the majority of ranked dermatology apps are categorized as Medical per our findings. In a study of 557 dermatology patients, it was found that among the health-related apps they used, the most common apps after fitness/nutrition were references, followed by patient portals, self-surveillance, and emotional assistance apps.6 Our search was consistent with these findings, suggesting that the most desired dermatology apps by patients are those that allow them to be proactive with their health. It is no surprise that the top-ranked app targeting patients was a teledermatology app, followed by multiple self-surveillance apps. The highest ranked self-surveillance app in the Health and Fitness category focused on monitoring the effects of nutrition on symptoms of diseases including skin disorders, while the highest ranked (as well as the majority of) self-surveillance apps in the Medical category encompassed mole monitoring and cancer risk calculators.
Benefits of the ranked dermatology apps in the Medical and Health and Fitness categories targeting patients include more immediate access to health care and education. Despite this popularity among patients, Masud et al7 demonstrated that only 20.5% (9/44) of dermatology apps targeting patients may be reliable resources based on a rubric created by the investigators. Overall, there remains a research gap for a standardized scientific approach to evaluating app validity and reliability.
Teledermatology
Teledermatology apps are the most common dermatology apps,2 allowing for remote evaluation of patients through either live consultations or transmittance of medical information for later review by board-certified physicians.8 Features common to many teledermatology apps include accessibility on Android (Google Inc) and iOS as well as a web version. Security and Health Insurance Portability and Accountability Act compliance is especially important and is enforced through user authentications, data encryption, and automatic logout features. Data is not stored locally and is secured on a private server with backup. Referring providers and consultants often can communicate within the app. Insurance providers also may cover teledermatology services, and if not, the out-of-pocket costs often are affordable.
The highest-ranked patient app (ranked 184 in the Medical category) was a teledermatology app that did not meet the American Telemedicine Association standards for teledermatology apps.9 The popularity of this app among patients may have been attributable to multiple ease-of-use and turnaround time features. The user interface was simplistic, and the design was appealing to the eye. The entry field options were minimal to avoid confusion. The turnaround time to receive a diagnosis depended on 1 of 3 options, including a more rapid response for an increased cost. Ease of use was the highlight of this app at the cost of accuracy, as the limited amount of information that users were required to provide physicians compromised diagnostic accuracy in this app.
For comparison, we chose a nonranked (and thus less frequently used) teledermatology app that had previously undergone scientific evaluation using 13 evaluation criteria specific to teledermatology.10 The app also met the American Telemedicine Association standard for teledermatology apps.9 The app was originally a broader telemedicine app but featured a section specific to teledermatology. The user interface was simple but professional, almost resembling an EMR. The input fields included a comprehensive history that permitted a better evaluation of a lesion but might be tedious for users. This app boasted professionalism and accuracy, but from a user standpoint, it may have been too time-consuming.
Striking a balance between ensuring proper care versus appealing to patients is a difficult but important task. Based on this study, it appears that popular patient apps may in fact have less scientific rationale and therefore potentially less accuracy.
Self-surveillance
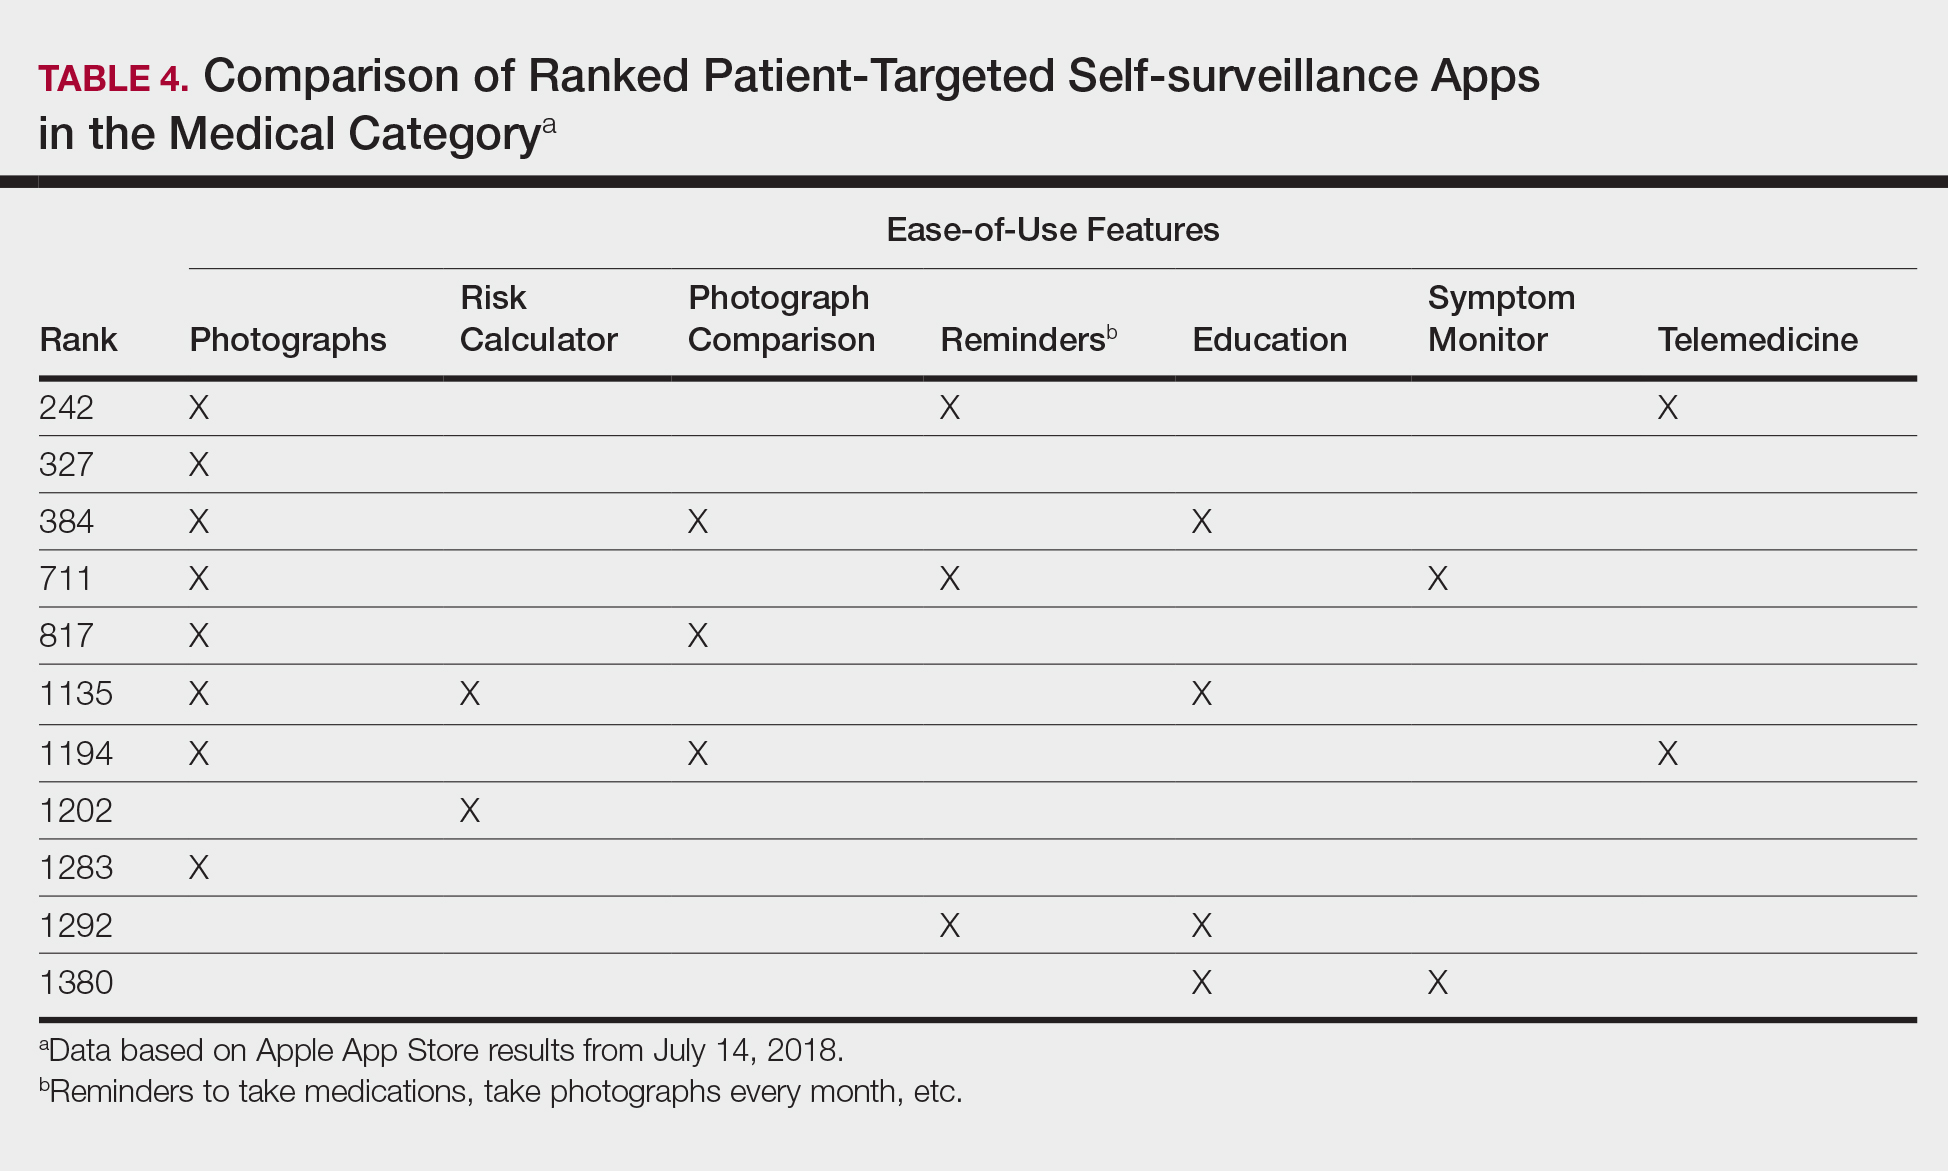
Although self-surveillance apps did not account for the highest-ranked app, they were the most frequently ranked app type in our study. Most of the ranked self-surveillance apps in the Medical category were for monitoring lesions over time to assess for changes. These apps help users take photographs that are well organized in a single, easy-to-find location. Some apps were risk calculators that assessed the risk for malignancies using a questionnaire. The majority of these self-surveillance apps were specific to skin cancer detection. Of note, one of the ranked self-surveillance apps assessed drug effectiveness by monitoring clinical appearance and symptoms. The lowest ranked self-surveillance app in the top 1500 ranked Medical apps in our search monitored cancer symptoms not specific to dermatology. Although this app had a low ranking (1380/1500), it received a high number of reviews and was well rated at 4.8 out of 5 stars; therefore, it seemed more helpful than the other higher-ranked apps targeting patients, which had higher rankings but minimal to no reviews or ratings. A comparison of the ease-of-use features of all the ranked patient-targeted self-surveillance apps in the Medical category is provided in Table 4.
Physician Apps
After examining the results of apps targeting physicians, we realized that the data may be accurate but may not be as representative of all currently practicing dermatology providers. Given the increased usage of apps among younger age groups,11 our data may be skewed toward medical students and residents, supported by the fact that the top-ranked physician app in our study was an education app and the majority were reference apps. Future studies are needed to reexamine app ranking as this age group transitions from entry-level health care providers in the next 5 to 10 years. These findings also suggest less frequent app use among more veteran health care providers within our specific search parameters. Therefore, we decided to do subsequent searches for available billing/coding and EMR apps, which were many, but as mentioned above, none were specific to dermatology.
General Dermatology References
Most of the dermatology reference apps were formatted as e-books; however, other apps such as the Amazon Kindle app (categorized under Books) providing access to multiple e-books within one app were not included. Some apps included study aid features (eg, flash cards, quizzes), and topics spanned both dermatology and dermatopathology. Apps provide a unique way for on-the-go studying for dermatologists in training, and if the usage continues to grow, there may be a need for increased formal integration in dermatology education in the future.
Journals
Journal apps were not among those listed in the top-ranked apps we evaluated, which we suspect may be because journals were categorized differently from one journal to the next; for example, the Journal of the American Academy of Dermatology was ranked 1168 in the Magazines and Newspapers category. On the other hand, Dermatology World was ranked 1363 in the Reference category. An article’s citation affects the publishing journal’s impact factor, which is one of the most important variables in measuring a journal’s influence. In the future, there may be other variables that could aid in understanding journal impact as it relates to the journal’s accessibility.
Limitations
Our study did not look at Android apps. The top chart apps in the Android and Apple App Stores use undisclosed algorithms likely involving different characteristics such as number of downloads, frequency of updates, number of reviews, ratings, and more. Thus, the rankings across these different markets would not be comparable. Although our choice of keywords stemmed from the majority of prior studies looking at dermatology apps, our search was limited due to the use of these specific keywords. To avoid skewing data by cross-comparison of noncomparable categories, we could not compare apps in the Medical category versus those in other categories.
CONCLUSION
There seems to be a disconnect between the apps that are popular among patients and the scientific validity of the apps. As app usage increases among dermatology providers, whose demographic is shifting younger and younger, apps may become more incorporated in our education, and as such, it will become more critical to develop formal scientific standards. Given these future trends, we may need to increase our current literature and understanding of apps in dermatology with regard to their impact on both patients and health care providers.
- Poushter J, Bishop C, Chwe H. Social media use continues to rise in developing countries but plateaus across developed ones. Pew Research Center website. http://www.pewglobal.org/2018/06/19/social-media-use-continues-to-rise-in-developing-countries-but-plateaus-across-developed-ones/#table. Published June 19, 2018. Accessed August 28, 2018.
- Flaten HK, St Claire C, Schlager E, et al. Growth of mobile applications in dermatology—2017 update. Dermatol Online J. 2018;24. pii:13030/qt3hs7n9z6.
- App Annie website. https://www.appannie.com/top/. Accessed August 28, 2018.
- Number of iPhone users in the United States from 2012 to 2016 (in millions). Statista website. https://www.statista.com/statistics/232790/forecast-of-apple-users-in-the-us/. Accessed August 28, 2018.
- Burkhart C. Medical mobile apps and dermatology. Cutis. 2012;90:278-281.
- Wolf JA, Moreau JF, Patton TJ, et al. Prevalence and impact of health-related internet and smartphone use among dermatology patients. Cutis. 2015;95:323-328.
- Masud A, Shafi S, Rao BK. Mobile medical apps for patient education: a graded review of available dermatology apps. Cutis. 2018;101:141-144.
- Walocko FM, Tejasvi T. Teledermatology applications in skin cancer diagnosis. Dermatol Clin. 2017;35:559-563.
- Krupinski E, Burdick A, Pak H, et al. American Telemedicine Association’s practice guidelines for teledermatology. Telemed J E Health. 2008;14:289-302.
- Ho B, Lee M, Armstrong AW. Evaluation criteria for mobile teledermatology applications and comparison of major mobile teledermatology applications. Telemed J E Health. 2013;19:678-682.
- Number of mobile app hours per smartphone and tablet app user in the United States in June 2016, by age group. Statista website. https://www.statista.com/statistics/323522/us-user-mobile-app-engagement-age/. Accessed September 18, 2018.
As technology continues to advance, so too does its accessibility to the general population. In 2013, 56% of Americans owned a smartphone versus 77% in 2017.1With the increase in mobile applications (apps) available, it is no surprise that the market has extended into the medical field, with dermatology being no exception.2 The majority of dermatology apps can be classified as teledermatology apps, followed by self-surveillance, disease guide, and reference apps. Additional types of dermatology apps include dermoscopy, conference, education, photograph storage and sharing, and journal apps, and others.2 In this study, we examined Apple App Store rankings to determine the types of dermatology apps that are most popular among patients and physicians.
METHODS
A popular app rankings analyzer (App Annie) was used to search for dermatology apps along with their App Store rankings.3 Although iOS is not the most popular mobile device operating system, we chose to evaluate app rankings via the App Store because iPhones are the top-selling individual phones of any kind in the United States.4
We performed our analysis on a single day (July 14, 2018) given that app rankings can change daily. We incorporated the following keywords, which were commonly used in other dermatology app studies: dermatology, psoriasis, rosacea, acne, skin cancer, melanoma, eczema, and teledermatology. The category ranking was defined as the rank of a free or paid app in the App Store’s top charts for the selected country (United States), market (Apple), and device (iPhone) within their app category (Medical). Inclusion criteria required a ranking in the top 1500 Medical apps and being categorized in the App Store as a Medical app. Exclusion criteria included apps that focused on cosmetics, private practice, direct advertisements, photograph editing, or claims to cure skin disease, as well as non–English-language apps. The App Store descriptions were assessed to determine the type of each app (eg, teledermatology, disease guide) and target audience (patient, physician, or both).
Another search was performed using the same keywords but within the Health and Fitness category to capture potentially more highly ranked apps among patients. We also conducted separate searches within the Medical category using the keywords billing, coding, and ICD (International Classification of Diseases) to evaluate rankings for billing/coding apps, as well as EMR and electronic medical records for electronic medical record (EMR) apps.
RESULTS
The initial search yielded 851 results, which was narrowed down to 29 apps after applying the exclusion criteria. Of note, prior to application of the exclusion criteria, one dermatology app that was considered to be a direct advertisement app claiming to cure acne was ranked fourth of 1500 apps in the Medical category. However, the majority of the search results were excluded because they were not popular enough to be ranked among the top 1500 apps. There were more ranked dermatology apps in the Medical category targeting patients than physicians; 18 of 29 (62%) qualifying apps targeted patients and 11 (38%) targeted physicians (Tables 1 and 2). No apps targeted both groups. The most common type of ranked app targeting patients was self-surveillance (11/18), and the most common type targeting physicians was reference (8/11). The highest ranked app targeting patients was a teledermatology app with a ranking of 184, and the highest ranked app targeting physicians was educational, ranked 353. The least common type of ranked apps targeting patients were “other” (2/18 [11%]; 1 prescription and 1 UV monitor app) and conference (1/18 [6%]). The least common type of ranked apps targeting physicians were education (2/11 [18%]) and dermoscopy (1/11 [9%]).
Our search of the Health and Fitness category yielded 6 apps, all targeting patients; 3 (50%) were self-surveillance apps, and 3 (50%) were classified as other (2 UV monitors and a conferencing app for cancer emotional support)(Table 3).
Our search of the Medical category for billing/coding and EMR apps yielded 232 and 164 apps, respectively; of them, 49 (21%) and 54 (33%) apps were ranked. These apps did not overlap with the dermatology-related search criteria; thus, we were not able to ascertain how many of these apps were used specifically by health care providers in dermatology.
COMMENT
Patient Apps
The most common apps used by patients are fitness and nutrition tracker apps categorized as Health and Fitness5,6; however, the majority of ranked dermatology apps are categorized as Medical per our findings. In a study of 557 dermatology patients, it was found that among the health-related apps they used, the most common apps after fitness/nutrition were references, followed by patient portals, self-surveillance, and emotional assistance apps.6 Our search was consistent with these findings, suggesting that the most desired dermatology apps by patients are those that allow them to be proactive with their health. It is no surprise that the top-ranked app targeting patients was a teledermatology app, followed by multiple self-surveillance apps. The highest ranked self-surveillance app in the Health and Fitness category focused on monitoring the effects of nutrition on symptoms of diseases including skin disorders, while the highest ranked (as well as the majority of) self-surveillance apps in the Medical category encompassed mole monitoring and cancer risk calculators.
Benefits of the ranked dermatology apps in the Medical and Health and Fitness categories targeting patients include more immediate access to health care and education. Despite this popularity among patients, Masud et al7 demonstrated that only 20.5% (9/44) of dermatology apps targeting patients may be reliable resources based on a rubric created by the investigators. Overall, there remains a research gap for a standardized scientific approach to evaluating app validity and reliability.
Teledermatology
Teledermatology apps are the most common dermatology apps,2 allowing for remote evaluation of patients through either live consultations or transmittance of medical information for later review by board-certified physicians.8 Features common to many teledermatology apps include accessibility on Android (Google Inc) and iOS as well as a web version. Security and Health Insurance Portability and Accountability Act compliance is especially important and is enforced through user authentications, data encryption, and automatic logout features. Data is not stored locally and is secured on a private server with backup. Referring providers and consultants often can communicate within the app. Insurance providers also may cover teledermatology services, and if not, the out-of-pocket costs often are affordable.
The highest-ranked patient app (ranked 184 in the Medical category) was a teledermatology app that did not meet the American Telemedicine Association standards for teledermatology apps.9 The popularity of this app among patients may have been attributable to multiple ease-of-use and turnaround time features. The user interface was simplistic, and the design was appealing to the eye. The entry field options were minimal to avoid confusion. The turnaround time to receive a diagnosis depended on 1 of 3 options, including a more rapid response for an increased cost. Ease of use was the highlight of this app at the cost of accuracy, as the limited amount of information that users were required to provide physicians compromised diagnostic accuracy in this app.
For comparison, we chose a nonranked (and thus less frequently used) teledermatology app that had previously undergone scientific evaluation using 13 evaluation criteria specific to teledermatology.10 The app also met the American Telemedicine Association standard for teledermatology apps.9 The app was originally a broader telemedicine app but featured a section specific to teledermatology. The user interface was simple but professional, almost resembling an EMR. The input fields included a comprehensive history that permitted a better evaluation of a lesion but might be tedious for users. This app boasted professionalism and accuracy, but from a user standpoint, it may have been too time-consuming.
Striking a balance between ensuring proper care versus appealing to patients is a difficult but important task. Based on this study, it appears that popular patient apps may in fact have less scientific rationale and therefore potentially less accuracy.
Self-surveillance
Although self-surveillance apps did not account for the highest-ranked app, they were the most frequently ranked app type in our study. Most of the ranked self-surveillance apps in the Medical category were for monitoring lesions over time to assess for changes. These apps help users take photographs that are well organized in a single, easy-to-find location. Some apps were risk calculators that assessed the risk for malignancies using a questionnaire. The majority of these self-surveillance apps were specific to skin cancer detection. Of note, one of the ranked self-surveillance apps assessed drug effectiveness by monitoring clinical appearance and symptoms. The lowest ranked self-surveillance app in the top 1500 ranked Medical apps in our search monitored cancer symptoms not specific to dermatology. Although this app had a low ranking (1380/1500), it received a high number of reviews and was well rated at 4.8 out of 5 stars; therefore, it seemed more helpful than the other higher-ranked apps targeting patients, which had higher rankings but minimal to no reviews or ratings. A comparison of the ease-of-use features of all the ranked patient-targeted self-surveillance apps in the Medical category is provided in Table 4.
Physician Apps
After examining the results of apps targeting physicians, we realized that the data may be accurate but may not be as representative of all currently practicing dermatology providers. Given the increased usage of apps among younger age groups,11 our data may be skewed toward medical students and residents, supported by the fact that the top-ranked physician app in our study was an education app and the majority were reference apps. Future studies are needed to reexamine app ranking as this age group transitions from entry-level health care providers in the next 5 to 10 years. These findings also suggest less frequent app use among more veteran health care providers within our specific search parameters. Therefore, we decided to do subsequent searches for available billing/coding and EMR apps, which were many, but as mentioned above, none were specific to dermatology.
General Dermatology References
Most of the dermatology reference apps were formatted as e-books; however, other apps such as the Amazon Kindle app (categorized under Books) providing access to multiple e-books within one app were not included. Some apps included study aid features (eg, flash cards, quizzes), and topics spanned both dermatology and dermatopathology. Apps provide a unique way for on-the-go studying for dermatologists in training, and if the usage continues to grow, there may be a need for increased formal integration in dermatology education in the future.
Journals
Journal apps were not among those listed in the top-ranked apps we evaluated, which we suspect may be because journals were categorized differently from one journal to the next; for example, the Journal of the American Academy of Dermatology was ranked 1168 in the Magazines and Newspapers category. On the other hand, Dermatology World was ranked 1363 in the Reference category. An article’s citation affects the publishing journal’s impact factor, which is one of the most important variables in measuring a journal’s influence. In the future, there may be other variables that could aid in understanding journal impact as it relates to the journal’s accessibility.
Limitations
Our study did not look at Android apps. The top chart apps in the Android and Apple App Stores use undisclosed algorithms likely involving different characteristics such as number of downloads, frequency of updates, number of reviews, ratings, and more. Thus, the rankings across these different markets would not be comparable. Although our choice of keywords stemmed from the majority of prior studies looking at dermatology apps, our search was limited due to the use of these specific keywords. To avoid skewing data by cross-comparison of noncomparable categories, we could not compare apps in the Medical category versus those in other categories.
CONCLUSION
There seems to be a disconnect between the apps that are popular among patients and the scientific validity of the apps. As app usage increases among dermatology providers, whose demographic is shifting younger and younger, apps may become more incorporated in our education, and as such, it will become more critical to develop formal scientific standards. Given these future trends, we may need to increase our current literature and understanding of apps in dermatology with regard to their impact on both patients and health care providers.
- Poushter J, Bishop C, Chwe H. Social media use continues to rise in developing countries but plateaus across developed ones. Pew Research Center website. http://www.pewglobal.org/2018/06/19/social-media-use-continues-to-rise-in-developing-countries-but-plateaus-across-developed-ones/#table. Published June 19, 2018. Accessed August 28, 2018.
- Flaten HK, St Claire C, Schlager E, et al. Growth of mobile applications in dermatology—2017 update. Dermatol Online J. 2018;24. pii:13030/qt3hs7n9z6.
- App Annie website. https://www.appannie.com/top/. Accessed August 28, 2018.
- Number of iPhone users in the United States from 2012 to 2016 (in millions). Statista website. https://www.statista.com/statistics/232790/forecast-of-apple-users-in-the-us/. Accessed August 28, 2018.
- Burkhart C. Medical mobile apps and dermatology. Cutis. 2012;90:278-281.
- Wolf JA, Moreau JF, Patton TJ, et al. Prevalence and impact of health-related internet and smartphone use among dermatology patients. Cutis. 2015;95:323-328.
- Masud A, Shafi S, Rao BK. Mobile medical apps for patient education: a graded review of available dermatology apps. Cutis. 2018;101:141-144.
- Walocko FM, Tejasvi T. Teledermatology applications in skin cancer diagnosis. Dermatol Clin. 2017;35:559-563.
- Krupinski E, Burdick A, Pak H, et al. American Telemedicine Association’s practice guidelines for teledermatology. Telemed J E Health. 2008;14:289-302.
- Ho B, Lee M, Armstrong AW. Evaluation criteria for mobile teledermatology applications and comparison of major mobile teledermatology applications. Telemed J E Health. 2013;19:678-682.
- Number of mobile app hours per smartphone and tablet app user in the United States in June 2016, by age group. Statista website. https://www.statista.com/statistics/323522/us-user-mobile-app-engagement-age/. Accessed September 18, 2018.
Practice Points
- As mobile application (app) usage increases among dermatology providers, whose demographic is shifting younger and younger, apps may become more incorporated in dermatology education. As such, it will become more critical to develop formal scientific standards.
- The most desired dermatology apps for patients were apps that allowed them to be proactive with their health.
- There seems to be a disconnect between the apps that are popular among patients and the scientific validity of the apps.

FDA Approves Galcanezumab for Migraine Prevention
The treatment is the third anti-CGRP antibody to receive regulatory approval.
ROCKVILLE, MD—The FDA has approved galcanezumab-gnlm (Emgality) for the preventive treatment of migraine in adults. Eli Lilly and Company manufactures the therapy. Emgality is the third calcitonin gene-related peptide (CGRP) antagonist to receive regulatory approval.
The approval is based on the results of three phase III clinical trials: EVOLVE-1, EVOLVE-2, and REGAIN. EVOLVE-1 and EVOLVE-2 were six-month, double-blind, placebo-controlled studies that included adults with episodic migraine. REGAIN was a three-month, double-blind, placebo-controlled study of adults with chronic migraine. The primary end point of all three trials was mean change from baseline in the number of monthly headache days.
In all trials, patients received either placebo, 120 mg of galcanezumab-gnlm after an initial loading dose of 240 mg, or 240 mg of galcanezumab-gnlm. In EVOLVE-1 and EVOLVE-2, people who received galcanezumab-gnlm had significantly fewer headache days per month than people who received placebo, and those who received galcanezumab-gnlm were also more likely to achieve a 50%, 75%, and 100% reduction in headache days.
In REGAIN, patients who received galcanezumab-gnlm experienced fewer monthly headache days than those who received placebo and were more likely to achieve a 50% reduction in headache days. There was no difference between groups in the likelihood of achieving a 75% or 100% reduction.
The recommended dosage, according to the label, is a monthly, 120-mg subcutaneous injection with an initial loading dose of 240 mg. The most common adverse event associated with galcanezumab-gnlm is injection-site reaction.
Galcanezumab-gnlm is under final review by the European Commission for approval in Europe.
—Lucas Franki
The treatment is the third anti-CGRP antibody to receive regulatory approval.
The treatment is the third anti-CGRP antibody to receive regulatory approval.
ROCKVILLE, MD—The FDA has approved galcanezumab-gnlm (Emgality) for the preventive treatment of migraine in adults. Eli Lilly and Company manufactures the therapy. Emgality is the third calcitonin gene-related peptide (CGRP) antagonist to receive regulatory approval.
The approval is based on the results of three phase III clinical trials: EVOLVE-1, EVOLVE-2, and REGAIN. EVOLVE-1 and EVOLVE-2 were six-month, double-blind, placebo-controlled studies that included adults with episodic migraine. REGAIN was a three-month, double-blind, placebo-controlled study of adults with chronic migraine. The primary end point of all three trials was mean change from baseline in the number of monthly headache days.
In all trials, patients received either placebo, 120 mg of galcanezumab-gnlm after an initial loading dose of 240 mg, or 240 mg of galcanezumab-gnlm. In EVOLVE-1 and EVOLVE-2, people who received galcanezumab-gnlm had significantly fewer headache days per month than people who received placebo, and those who received galcanezumab-gnlm were also more likely to achieve a 50%, 75%, and 100% reduction in headache days.
In REGAIN, patients who received galcanezumab-gnlm experienced fewer monthly headache days than those who received placebo and were more likely to achieve a 50% reduction in headache days. There was no difference between groups in the likelihood of achieving a 75% or 100% reduction.
The recommended dosage, according to the label, is a monthly, 120-mg subcutaneous injection with an initial loading dose of 240 mg. The most common adverse event associated with galcanezumab-gnlm is injection-site reaction.
Galcanezumab-gnlm is under final review by the European Commission for approval in Europe.
—Lucas Franki
New MS Subtype Shows Absence of Cerebral White Matter Demyelination
A new subtype of multiple sclerosis (MS) called myelocortical MS is characterized by demyelination only in the spinal cord and cerebral cortex and not in the cerebral white matter, according to a study published online ahead of print August 21 in Lancet Neurology. The findings are based on an examination of the brains and spinal cords of 100 patients who died of MS.
Bruce D. Trapp, PhD, the Morris R. and Ruth V. Graham Endowed Chair in Biomedical Research at the Lerner Research Institute at the Cleveland Clinic in Ohio, and his coauthors said that while the demyelination of cerebral white matter is a pathologic hallmark of MS, previous research has found that only around half of cerebral T2-weighted hyperintense white matter lesions are demyelinated, and these lesions account for less than a third of variance in the rate of brain atrophy.
“In the absence of specific MRI metrics for demyelination, the relationship between cerebral white-matter demyelination and neurodegeneration remains speculative,” they said.

In this study, researchers scanned the brains with MRI before autopsy, then took centimeter-thick hemispheric slices to study the white-matter lesions. They identified 12 individuals as having what they describe as myelocortical MS, characterized by the absence of areas of cerebral white-matter discoloration indicative of demyelinated lesions.
The authors then compared these individuals with 12 individuals with typical MS matched by age, sex, MRI protocol, MS disease subtype, disease duration, and Expanded Disability Status Scale score.
Not Typical MS
They found that while individuals with myelocortical MS did not have demyelinated lesions in the cerebral white matter, they had areas of demyelinated lesions in the cerebral cortex similar to those of individuals with typical MS (median 4.45% vs 9.74%, respectively). However, the individuals with myelocortical MS had a significantly smaller area of spinal cord demyelination (median 3.81% vs 13.81%).
Individuals with myelocortical MS also had significantly lower mean cortical neuronal densities, compared with healthy control brains, in layer III, layer V, and layer VI. But individuals with typical MS only had a lower cortical neuronal density in layer V when compared with controls.
Dr. Trapp and colleagues also saw that in typical MS, neuronal density decreased as the area of brain white-matter demyelination increased. However, this negative linear correlation was not seen in myelocortical MS.
On MRI, researchers were still able to see abnormalities in the cerebral white matter in individuals with myelocortical MS, in T2-weighted, T1-weighted, and magnetization transfer ratios (MTR) images. They also found similar total T2-weighted and T1-weighted lesion volumes in individuals with myelocortical MS and those with typical MS, although individuals with typical MS had significantly greater MTR lesion volumes.
The Hallmarks of Myelocortical MS
“We propose that myelocortical MS is characterized by spinal cord demyelination, subpial cortical demyelination, and an absence of cerebral white-matter demyelination,” Dr. Trapp and colleagues wrote. “Our findings indicate that abnormal cerebral white-matter T2-T1-MTR regions of interest are not always demyelinated, and this pathologic evidence suggests that cerebral white-matter demyelination and cortical neuronal degeneration can be independent events in myelocortical MS.”
The authors acknowledged that one limitation of their study may have been selection bias, as all the patients in the study died from complications of advanced MS. They suggested that it was therefore not appropriate to conclude that the prevalence of myelocortical MS seen in their sample would be similar across the entire MS population, nor were the findings likely to apply to pateints with earlier stage disease.
The study received funding from the NIH and the National MS Society. One author is an employee of Renovo Neural, and three authors are employees of Biogen. One author declared a pending patent related to automated lesion segmentation from MRI images, and four authors declared funding, fees, and nonfinancial support from pharmaceutical companies.
—Bianca Nogrady
Suggested Reading
Trapp BD, Vignos M, Dudman J, et al. Cortical neuronal densities and cerebral white matter demyelination in multiple sclerosis: a retrospective study. Lancet Neurol. 2018 Aug 21 [Epub ahead of print].
A new subtype of multiple sclerosis (MS) called myelocortical MS is characterized by demyelination only in the spinal cord and cerebral cortex and not in the cerebral white matter, according to a study published online ahead of print August 21 in Lancet Neurology. The findings are based on an examination of the brains and spinal cords of 100 patients who died of MS.
Bruce D. Trapp, PhD, the Morris R. and Ruth V. Graham Endowed Chair in Biomedical Research at the Lerner Research Institute at the Cleveland Clinic in Ohio, and his coauthors said that while the demyelination of cerebral white matter is a pathologic hallmark of MS, previous research has found that only around half of cerebral T2-weighted hyperintense white matter lesions are demyelinated, and these lesions account for less than a third of variance in the rate of brain atrophy.
“In the absence of specific MRI metrics for demyelination, the relationship between cerebral white-matter demyelination and neurodegeneration remains speculative,” they said.
In this study, researchers scanned the brains with MRI before autopsy, then took centimeter-thick hemispheric slices to study the white-matter lesions. They identified 12 individuals as having what they describe as myelocortical MS, characterized by the absence of areas of cerebral white-matter discoloration indicative of demyelinated lesions.
The authors then compared these individuals with 12 individuals with typical MS matched by age, sex, MRI protocol, MS disease subtype, disease duration, and Expanded Disability Status Scale score.
Not Typical MS
They found that while individuals with myelocortical MS did not have demyelinated lesions in the cerebral white matter, they had areas of demyelinated lesions in the cerebral cortex similar to those of individuals with typical MS (median 4.45% vs 9.74%, respectively). However, the individuals with myelocortical MS had a significantly smaller area of spinal cord demyelination (median 3.81% vs 13.81%).
Individuals with myelocortical MS also had significantly lower mean cortical neuronal densities, compared with healthy control brains, in layer III, layer V, and layer VI. But individuals with typical MS only had a lower cortical neuronal density in layer V when compared with controls.
Dr. Trapp and colleagues also saw that in typical MS, neuronal density decreased as the area of brain white-matter demyelination increased. However, this negative linear correlation was not seen in myelocortical MS.
On MRI, researchers were still able to see abnormalities in the cerebral white matter in individuals with myelocortical MS, in T2-weighted, T1-weighted, and magnetization transfer ratios (MTR) images. They also found similar total T2-weighted and T1-weighted lesion volumes in individuals with myelocortical MS and those with typical MS, although individuals with typical MS had significantly greater MTR lesion volumes.
The Hallmarks of Myelocortical MS
“We propose that myelocortical MS is characterized by spinal cord demyelination, subpial cortical demyelination, and an absence of cerebral white-matter demyelination,” Dr. Trapp and colleagues wrote. “Our findings indicate that abnormal cerebral white-matter T2-T1-MTR regions of interest are not always demyelinated, and this pathologic evidence suggests that cerebral white-matter demyelination and cortical neuronal degeneration can be independent events in myelocortical MS.”
The authors acknowledged that one limitation of their study may have been selection bias, as all the patients in the study died from complications of advanced MS. They suggested that it was therefore not appropriate to conclude that the prevalence of myelocortical MS seen in their sample would be similar across the entire MS population, nor were the findings likely to apply to pateints with earlier stage disease.
The study received funding from the NIH and the National MS Society. One author is an employee of Renovo Neural, and three authors are employees of Biogen. One author declared a pending patent related to automated lesion segmentation from MRI images, and four authors declared funding, fees, and nonfinancial support from pharmaceutical companies.
—Bianca Nogrady
Suggested Reading
Trapp BD, Vignos M, Dudman J, et al. Cortical neuronal densities and cerebral white matter demyelination in multiple sclerosis: a retrospective study. Lancet Neurol. 2018 Aug 21 [Epub ahead of print].
Alan M. Rapoport, MD, on Medication Overuse Headache
Neurology Reviews recently shared two poll questions with our Facebook followers about treatment medication overuse headache (MOH). I was very interested to see the results of our poll. While the number of responses was somewhat low, we do get some sense of what respondents are saying. In this commentary, I will first tell you my perspective on the answers and then we will see what some other headache specialists say about the answers to these questions.
Poll Results:
Can MOH be treated with preventive medications without detoxification?
33 votes
YES, 39%
NO, 61%
Can MOH be treated with the new preventive medications (the monoclonal antibodies to CGRP ligand or receptor) without detoxification?
26 votes
YES, 38%
NO, 62%
My Commentary:
Let me explain in more detail my thoughts on the first question, “Can MOH be treated with preventive medications without detoxification?”
If a patient had the diagnosis of MOH – meaning 15 or more headache days per month for at least 3 months, with use of stronger medications (triptans, ergots, opiates, butalbital-containing medications) for 10 days per month or milder treatment (aspirin, acetaminophen, nonsteroidal anti-inflammatory drugs [NSAIDs]) for 15 days per month – can they improve by being put on a traditional preventive medication without intentionally reducing their overused acute medications by a detoxification protocol ordered by a doctor or nurse?
Only 39% of our audience said yes. Yet some studies have shown that patients placed on onabotulinumtoxinA or topiramate might improve without them going through a detoxification of the overused medications. As a physician, I would suggest simultaneously decreasing in their acute medications. I think in some cases this approach creates additional improvement and makes the patient feel better. It would be better for their quality of life, as well as for their kidneys and possibly even their brains.
Here are my thoughts on the second question, “Can MOH be treated with the new preventive medications (the monoclonal antibodies to CGRP ligand or receptor), without detoxification?”
If a patient has MOH, can you expect them to improve after being placed on 1 of the 4 monoclonal antibodies to CGRP ligand or its receptor – all of which are either recently approved or currently in development – without suggesting that they decrease their overused acute care medications? Note that erenumab (Aimovig-aaoe) has been approved by the FDA and marketed as of the time of this writing; we expect 2 more products to be approved very soon.
Almost an identical percentage of our audience (38%) said yes. There is evidence in published clinical trials that those patients given these new medications did about as well with or without the presence of MOH, and both groups did better than the placebo patients. Note that most trials prohibited overuse of opiates and butalbital.
I am a firm believer of detoxifying patients from their overused over-the-counter (OTC) or prescription medications. I believe that opiates and butalbital-containing medications, when overused, are worse for patients than OTCs, NSAIDs, ergot and triptans, but all of these can cause MOH. There are many studies showing that both inpatient and outpatient detoxification alone can really help. However, it is difficult to detoxify patients and some refuse to try this approach.
So, what should we do as physicians? If a patient has MOH, I educate them, try to detoxify them slowly on an outpatient basis, and if I feel it will help, start them on a preventive medication, even before the detoxification begins so they can reach therapeutic levels. In the future, will I use one of the standard preventives, approved or off-label, for migraine prevention (beta blockers, topiramate and other anticonvulsants, antidepressants, angiotensin receptor blockers, onabotulinumtoxinA and others)? It remains to be seen. I am leaning towards the anti CGRP ligand and receptor monoclonal antibodies and preventive small molecule oral CGRP receptor blockers. While that might be enough to start with, I will continue explaining to my patients why they should actively begin a slow detoxification.
Let us see what some headache specialists said about both questions.
Robert Cowan, MD, FAAN:
There have been studies that show migraine can improve without the discontinuation of medication overuse. But that is not what the question asks. The question as posed is whether MOH can be treated with a preventive medication without detoxification. Since the diagnosis of MOH has, in the past, required the cessation of overuse leading to an improvement in the underlying headache, then technically, the answer would be “no.” But that being said, there is ample evidence that the number of headache days/months and other measures of headache can, in fact, improve with the introduction of a preventive, along with other measures such as lifestyle modification. The other ambiguity in the question has to do with what is meant by “detoxification.” Is this a hospital-based detox, or is a gradual decrease in the offending medicine in combination with the addition of a preventive, still considered “detoxification?” Also, does the response imply a sequential relationship between the detoxification and initiation of the preventive? Without further clarification, this response ratio to the question is very difficult to interpret.
There is animal data that suggests acute migraine medications may promote MOH in susceptible individuals through CGRP-dependent mechanisms and anti-CGRP antibodies may be useful for the MOH (Cephalalgia. 2017;37(6):560-570. doi: 10.1177/0333102416650702). While there are no published CGRP antibody studies that did not exclude MOH patients to my knowledge, an abstract by Silberstein et al at the recent AHS Scientific Meeting reported decreased use of overused medication with fremanazumab (Headache. 2018;58(S2):76-78).
Ira Turner, MD
There is clear data to suggest that it is not necessary to detoxify these patients before starting preventive therapy. This is true for the older and newer medications. In fact, not only do these preventive therapies still work in the presence of medication overuse, but they also help to reduce medication overuse. The one caveat that must be mentioned is that this may not apply to opiate overuse. Opiate over-users were excluded from these studies.
While it is of course our goal to reduce and stop acute medication overuse, it should not be done at the expense of delaying preventive therapy. In fact, it is desirable to do both simultaneously. This applies to oral preventive medications, botulinum toxin and CGRP monoclonal antibodies.
In view of this well-established data, it was quite surprising to me to see the results of the 2 polls cited. It seems as if we still have a lot of educating to do regarding migraine prevention in general and with medication overuse in migraine in particular.
Stewart Tepper, MD
Dr. Tepper did not have time to comment, but suggested we show you an abstract presented at the recent AHS meeting. It shows that erenumab-aaoe helps patients with MOH who have not been detoxified (Headache. 2018;58(S2):160-162).
###
Please write to us at Neurology Reviews Migraine Resource Center ([email protected]) with your opinions.
Alan M. Rapoport, MD
Editor-in-Chief
Migraine Resource Center
Clinical Professor of Neurology
The David Geffen School of Medicine at UCLA
Los Angeles, California
Neurofilaments: A Biomarker of Long-Term Outcome in MS?
Baseline measurement of CSF-NfL may add prognostic information and help identify patients who should start high-efficacy therapy as early as possible.
In patients with multiple sclerosis (MS), levels of light-chain neurofilament (NfL) in CSF at diagnosis seem to predict long-term clinical outcome and conversion from the relapsing-remitting phase of the disease to the secondary progressive phase, according to a study published in the September issue of Multiple Sclerosis Journal. “NfL is thought to reflect ongoing axonal degeneration, which dominates early in the disease phase, and our results support that increased early disease activity, as identified by increased levels of CSF-NfL, has a prognostic effect several years later,” said lead author Alok Bhan, MD, and colleagues. Dr. Bhan works in the Department of Neurology at Stavanger University Hospital in Norway.
Searching for Prognostic Markers
To test whether CSF-NfL levels in patients with MS could predict clinical outcome, Dr. Bhan and colleagues conducted standardized clinical assessments of patients with newly diagnosed MS at baseline and at five- and 10-year follow-up. Expanded Disability Status Scale (EDSS) progression between assessments was defined as an increase of 1 point or more for scores less than 6 and of 0.5 points or more for scores of 6 or greater. CSF obtained at baseline was analyzed for levels of NfL using enzyme-linked immunosorbent assay technology.
The study cohort included 44 patients, of whom 35 (80%) had relapsing-remitting MS, seven (16%) had secondary progressive MS, and two (4%) had primary progressive MS at baseline. Patients who progressed on EDSS tended to have higher median baseline CSF-NfL levels than patients who did not progress after five years (947 ng/L vs 246 ng/L, respectively) and those who did not progress after 10 years (708 ng/L vs 265 ng/L, respectively), although the latter difference was not statistically significant. Patients who converted from relapsing-remitting MS to secondary progressive MS at five years had a significantly higher median CSF level of NfL (2,122 ng/L), compared with those who did not convert (246 ng/L).
“We found a statistically significant correlation between NfL levels at baseline and EDSS progression and conversion from relapsing-remitting MS to secondary progressive MS at the five-year follow-up, but a weaker correlation at the 10-year follow-up,” the researchers said. “This [finding] may be due to the increasing number of patients on disease-modifying therapy throughout the study period, as only 16% received therapy at baseline, but 54% [did] at 10-year follow-up.”
The Predictive Value of NfL
“This is now another important report underscoring the predictive value of NfL levels for the evolution of future disability in MS, but the … study clearly suffers from the relatively low number of patients investigated,” said Michael Khalil, MD, PhD, in an accompanying editorial. Dr. Khalil is an Associate Professor of General Neurology at the Medical University of Graz in Austria. “Nevertheless, neurofilaments are currently the most promising markers to indicate neuro-axonal damage in MS and other neurologic diseases. The availability of a highly sensitive blood assay now facilitates its use for further research and in clinical practice.”
—Glenn S. Williams
Suggested Reading
Bhan A, Jacobsen C, Myhr KM, et al. Neurofilaments and 10-year follow-up in multiple sclerosis. Mult Scler. 2018; 24(10):1301-1307.
Khalil M. Are neurofilaments valuable biomarkers for long-term disease prognostication in MS? Mult Scler. 2018; 24(10):1270-1271.
Baseline measurement of CSF-NfL may add prognostic information and help identify patients who should start high-efficacy therapy as early as possible.
Baseline measurement of CSF-NfL may add prognostic information and help identify patients who should start high-efficacy therapy as early as possible.
In patients with multiple sclerosis (MS), levels of light-chain neurofilament (NfL) in CSF at diagnosis seem to predict long-term clinical outcome and conversion from the relapsing-remitting phase of the disease to the secondary progressive phase, according to a study published in the September issue of Multiple Sclerosis Journal. “NfL is thought to reflect ongoing axonal degeneration, which dominates early in the disease phase, and our results support that increased early disease activity, as identified by increased levels of CSF-NfL, has a prognostic effect several years later,” said lead author Alok Bhan, MD, and colleagues. Dr. Bhan works in the Department of Neurology at Stavanger University Hospital in Norway.
Searching for Prognostic Markers
To test whether CSF-NfL levels in patients with MS could predict clinical outcome, Dr. Bhan and colleagues conducted standardized clinical assessments of patients with newly diagnosed MS at baseline and at five- and 10-year follow-up. Expanded Disability Status Scale (EDSS) progression between assessments was defined as an increase of 1 point or more for scores less than 6 and of 0.5 points or more for scores of 6 or greater. CSF obtained at baseline was analyzed for levels of NfL using enzyme-linked immunosorbent assay technology.
The study cohort included 44 patients, of whom 35 (80%) had relapsing-remitting MS, seven (16%) had secondary progressive MS, and two (4%) had primary progressive MS at baseline. Patients who progressed on EDSS tended to have higher median baseline CSF-NfL levels than patients who did not progress after five years (947 ng/L vs 246 ng/L, respectively) and those who did not progress after 10 years (708 ng/L vs 265 ng/L, respectively), although the latter difference was not statistically significant. Patients who converted from relapsing-remitting MS to secondary progressive MS at five years had a significantly higher median CSF level of NfL (2,122 ng/L), compared with those who did not convert (246 ng/L).
“We found a statistically significant correlation between NfL levels at baseline and EDSS progression and conversion from relapsing-remitting MS to secondary progressive MS at the five-year follow-up, but a weaker correlation at the 10-year follow-up,” the researchers said. “This [finding] may be due to the increasing number of patients on disease-modifying therapy throughout the study period, as only 16% received therapy at baseline, but 54% [did] at 10-year follow-up.”
The Predictive Value of NfL
“This is now another important report underscoring the predictive value of NfL levels for the evolution of future disability in MS, but the … study clearly suffers from the relatively low number of patients investigated,” said Michael Khalil, MD, PhD, in an accompanying editorial. Dr. Khalil is an Associate Professor of General Neurology at the Medical University of Graz in Austria. “Nevertheless, neurofilaments are currently the most promising markers to indicate neuro-axonal damage in MS and other neurologic diseases. The availability of a highly sensitive blood assay now facilitates its use for further research and in clinical practice.”
—Glenn S. Williams
Suggested Reading
Bhan A, Jacobsen C, Myhr KM, et al. Neurofilaments and 10-year follow-up in multiple sclerosis. Mult Scler. 2018; 24(10):1301-1307.
Khalil M. Are neurofilaments valuable biomarkers for long-term disease prognostication in MS? Mult Scler. 2018; 24(10):1270-1271.