User login
Differences in COVID-19 Outcomes Among Patients With Type 1 Diabetes: First vs Later Surges
From Hassenfeld Children’s Hospital at NYU Langone Health, New York, NY (Dr Gallagher), T1D Exchange, Boston, MA (Saketh Rompicherla; Drs Ebekozien, Noor, Odugbesan, and Mungmode; Nicole Rioles, Emma Ospelt), University of Mississippi School of Population Health, Jackson, MS (Dr. Ebekozien), Icahn School of Medicine at Mount Sinai, New York, NY (Drs. Wilkes, O’Malley, and Rapaport), Weill Cornell Medicine, New York, NY (Drs. Antal and Feuer), NYU Long Island School of Medicine, Mineola, NY (Dr. Gabriel), NYU Langone Health, New York, NY (Dr. Golden), Barbara Davis Center, Aurora, CO (Dr. Alonso), Texas Children’s Hospital/Baylor College of Medicine, Houston, TX (Dr. Lyons), Stanford University, Stanford, CA (Dr. Prahalad), Children Mercy Kansas City, MO (Dr. Clements), Indiana University School of Medicine, IN (Dr. Neyman), Rady Children’s Hospital, University of California, San Diego, CA (Dr. Demeterco-Berggren).
Background: Patient outcomes of COVID-19 have improved throughout the pandemic. However, because it is not known whether outcomes of COVID-19 in the type 1 diabetes (T1D) population improved over time, we investigated differences in COVID-19 outcomes for patients with T1D in the United States.
Methods: We analyzed data collected via a registry of patients with T1D and COVID-19 from 56 sites between April 2020 and January 2021. We grouped cases into first surge (April 9, 2020, to July 31, 2020, n = 188) and late surge (August 1, 2020, to January 31, 2021, n = 410), and then compared outcomes between both groups using descriptive statistics and logistic regression models.
Results: Adverse outcomes were more frequent during the first surge, including diabetic ketoacidosis (32% vs 15%, P < .001), severe hypoglycemia (4% vs 1%, P = .04), and hospitalization (52% vs 22%, P < .001). Patients in the first surge were older (28 [SD,18.8] years vs 18.0 [SD, 11.1] years, P < .001), had higher median hemoglobin A1c levels (9.3 [interquartile range {IQR}, 4.0] vs 8.4 (IQR, 2.8), P < .001), and were more likely to use public insurance (107 [57%] vs 154 [38%], P < .001). The odds of hospitalization for adults in the first surge were 5 times higher compared to the late surge (odds ratio, 5.01; 95% CI, 2.11-12.63).
Conclusion: Patients with T1D who presented with COVID-19 during the first surge had a higher proportion of adverse outcomes than those who presented in a later surge.
Keywords: TD1, diabetic ketoacidosis, hypoglycemia.
After the World Health Organization declared the disease caused by the novel coronavirus SARS-CoV-2, COVID-19, a pandemic on March 11, 2020, the Centers for Disease Control and Prevention identified patients with diabetes as high risk for severe illness.1-7 The case-fatality rate for COVID-19 has significantly improved over the past 2 years. Public health measures, less severe COVID-19 variants, increased access to testing, and new treatments for COVID-19 have contributed to improved outcomes.
The T1D Exchange has previously published findings on COVID-19 outcomes for patients with type 1 diabetes (T1D) using data from the T1D COVID-19 Surveillance Registry.8-12 Given improved outcomes in COVID-19 in the general population, we sought to determine if outcomes for cases of COVID-19 reported to this registry changed over time.
Methods
This study was coordinated by the T1D Exchange and approved as nonhuman subject research by the Western Institutional Review Board. All participating centers also obtained local institutional review board approval. No identifiable patient information was collected as part of this noninterventional, cross-sectional study.
The T1D Exchange Multi-center COVID-19 Surveillance Study collected data from endocrinology clinics that completed a retrospective chart review and submitted information to T1D Exchange via an online questionnaire for all patients with T1D at their sites who tested positive for COVID-19.13,14 The questionnaire was administered using the Qualtrics survey platform (www.qualtrics.com version XM) and contained 33 pre-coded and free-text response fields to collect patient and clinical attributes.
Each participating center identified 1 team member for reporting to avoid duplicate case submission. Each submitted case was reviewed for potential errors and incomplete information. The coordinating center verified the number of cases per site for data quality assurance.
Quantitative data were represented as mean (standard deviation) or median (interquartile range). Categorical data were described as the number (percentage) of patients. Summary statistics, including frequency and percentage for categorical variables, were calculated for all patient-related and clinical characteristics. The date August 1, 2021, was selected as the end of the first surge based on a review of national COVID-19 surges.
We used the Fisher’s exact test to assess associations between hospitalization and demographics, HbA1c, diabetes duration, symptoms, and adverse outcomes. In addition, multivariate logistic regression was used to calculate odds ratios (OR). Logistic regression models were used to determine the association between time of surge and hospitalization separately for both the pediatric and adult populations. Each model was adjusted for potential sociodemographic confounders, specifically age, sex, race, insurance, and HbA1c.
All tests were 2-sided, with type 1 error set at 5%. Fisher’s exact test and logistic regression were performed using statistical software R, version 3.6.2 (R Foundation for Statistical Computing).
Results
The characteristics of COVID-19 cases in patients with T1D that were reported early in the pandemic, before August 1, 2020 (first surge), compared with those of cases reported on and after August 1, 2020 (later surges) are shown in Table 1.
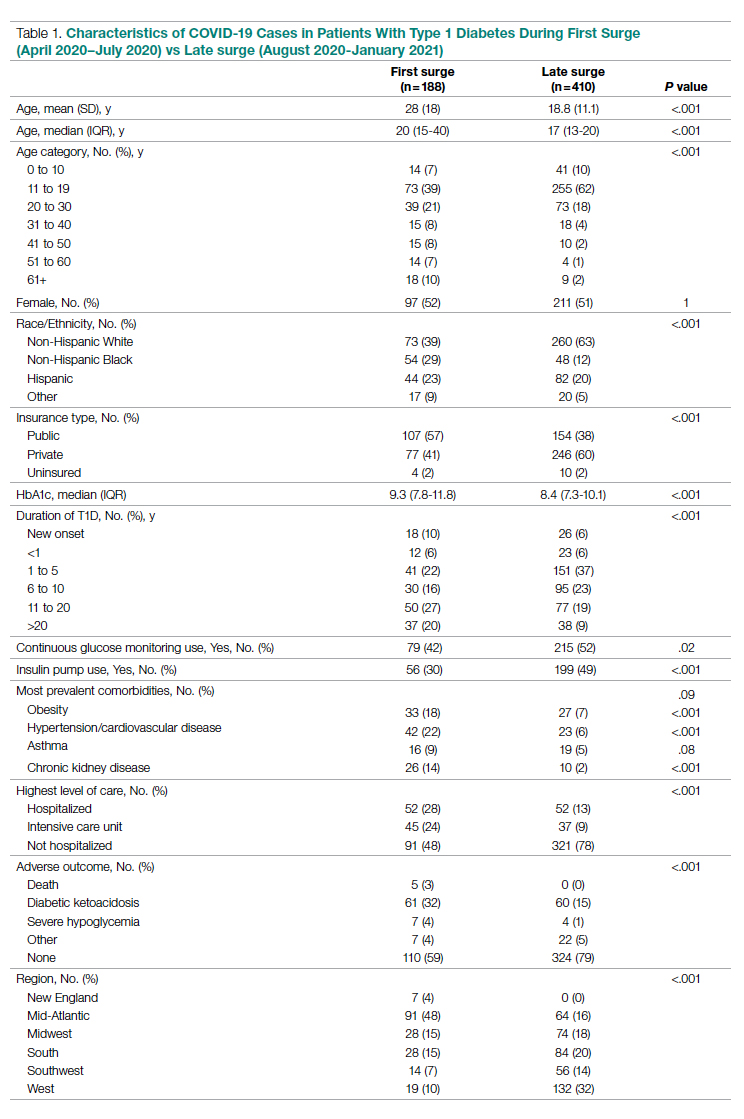
Patients with T1D who presented with COVID-19 during the first surge as compared to the later surges were older (mean age 28 [SD, 18.0] years vs 18.8 [SD, 11.1] years; P < .001) and had a longer duration of diabetes (P < .001). The first-surge group also had more patients with >20 years’ diabetes duration (20% vs 9%, P < .001). Obesity, hypertension, and chronic kidney disease were also more commonly reported in first-surge cases (all P < .001).
There was a significant difference in race and ethnicity reported in the first surge vs the later surge cases, with fewer patients identifying as non-Hispanic White (39% vs, 63%, P < .001) and more patients identifying as non-Hispanic Black (29% vs 12%, P < .001). The groups also differed significantly in terms of insurance type, with more people on public insurance in the first-surge group (57% vs 38%, P < .001). In addition, median HbA1c was higher (9.3% vs 8.4%, P < .001) and continuous glucose monitor and insulin pump use were less common (P = .02 and <.001, respectively) in the early surge.
All symptoms and adverse outcomes were reported more often in the first surge, including diabetic ketoacidosis (DKA; 32% vs 15%; P < .001) and severe hypoglycemia (4% vs 1%, P = .04). Hospitalization (52% vs 13%, P < .001) and ICU admission (24% vs 9%, P < .001) were reported more often in the first-surge group.
Regression Analyses
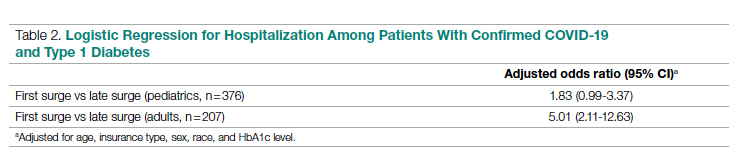
Table 2 shows the results of logistic regression analyses for hospitalization in the pediatric (≤19 years of age) and adult (>19 years of age) groups, along with the odds of hospitalization during the first vs late surge among COVID-positive people with T1D. Adult patients who tested positive in the first surge were about 5 times more likely to be hospitalized than adults who tested positive for infection in the late surge after adjusting for age, insurance type, sex, race, and HbA1c levels. Pediatric patients also had an increased odds for hospitalization during the first surge, but this increase was not statistically significant.
Discussion
Our analysis of COVID-19 cases in patients with T1D reported by diabetes providers across the United States found that adverse outcomes were more prevalent early in the pandemic. There may be a number of reasons for this difference in outcomes between patients who presented in the first surge vs a later surge. First, because testing for COVID-19 was extremely limited and reserved for hospitalized patients early in the pandemic, the first-surge patients with confirmed COVID-19 likely represent a skewed population of higher-acuity patients. This may also explain the relative paucity of cases in younger patients reported early in the pandemic. Second, worse outcomes in the early surge may also have been associated with overwhelmed hospitals in New York City at the start of the outbreak. According to Cummings et al, the abrupt surge of critically ill patients hospitalized with severe acute respiratory distress syndrome initially outpaced their capacity to provide prone-positioning ventilation, which has been expanded since then.15 While there was very little hypertension, cardiovascular disease, or kidney disease reported in the pediatric groups, there was a higher prevalence of obesity in the pediatric group from the mid-Atlantic region. Obesity has been associated with a worse prognosis for COVID-19 illness in children.16 Finally, there were 5 deaths reported in this study, all of which were reported during the first surge. Older age and increased rates of cardiovascular disease and chronic kidney disease in the first surge cases likely contributed to worse outcomes for adults in mid-Atlantic region relative to the other regions. Minority race and the use of public insurance, risk factors for more severe outcomes in all regions, were also more common in cases reported from the mid-Atlantic region.
This study has several limitations. First, it is a cross-sectional study that relies upon voluntary provider reports. Second, availability of COVID-19 testing was limited in all regions in spring 2020. Third, different regions of the country experienced subsequent surges at different times within the reported timeframes in this analysis. Fourth, this report time period does not include the impact of the newer COVID-19 variants. Finally, trends in COVID-19 outcomes were affected by the evolution of care that developed throughout 2020.
Conclusion
Adult patients with T1D and COVID-19 who reported during the first surge had about 5 times higher hospitalization odds than those who presented in a later surge.
Corresponding author: Osagie Ebekozien, MD, MPH, 11 Avenue de Lafayette, Boston, MA 02111; [email protected]
Disclosures: Dr Ebekozien reports receiving research grants from Medtronic Diabetes, Eli Lilly, and Dexcom, and receiving honoraria from Medtronic Diabetes.
1. Barron E, Bakhai C, Kar P, et al. Associations of type 1 and type 2 diabetes with COVID-19-related mortality in England: a whole-population study. Lancet Diabetes Endocrinol. 2020;8(10):813-822. doi:10.1016/S2213-8587(20)30272-2
2. Fisher L, Polonsky W, Asuni A, Jolly Y, Hessler D. The early impact of the COVID-19 pandemic on adults with type 1 or type 2 diabetes: A national cohort study. J Diabetes Complications. 2020;34(12):107748. doi:10.1016/j.jdiacomp.2020.107748
3. Holman N, Knighton P, Kar P, et al. Risk factors for COVID-19-related mortality in people with type 1 and type 2 diabetes in England: a population-based cohort study. Lancet Diabetes Endocrinol. 2020;8(10):823-833. doi:10.1016/S2213-8587(20)30271-0
4. Wargny M, Gourdy P, Ludwig L, et al. Type 1 diabetes in people hospitalized for COVID-19: new insights from the CORONADO study. Diabetes Care. 2020;43(11):e174-e177. doi:10.2337/dc20-1217
5. Gregory JM, Slaughter JC, Duffus SH, et al. COVID-19 severity is tripled in the diabetes community: a prospective analysis of the pandemic’s impact in type 1 and type 2 diabetes. Diabetes Care. 2021;44(2):526-532. doi:10.2337/dc20-2260
6. Cardona-Hernandez R, Cherubini V, Iafusco D, Schiaffini R, Luo X, Maahs DM. Children and youth with diabetes are not at increased risk for hospitalization due to COVID-19. Pediatr Diabetes. 2021;22(2):202-206. doi:10.1111/pedi.13158
7. Maahs DM, Alonso GT, Gallagher MP, Ebekozien O. Comment on Gregory et al. COVID-19 severity is tripled in the diabetes community: a prospective analysis of the pandemic’s impact in type 1 and type 2 diabetes. Diabetes Care. 2021;44:526-532. Diabetes Care. 2021;44(5):e102. doi:10.2337/dc20-3119
8. Ebekozien OA, Noor N, Gallagher MP, Alonso GT. Type 1 diabetes and COVID-19: preliminary findings from a multicenter surveillance study in the US. Diabetes Care. 2020;43(8):e83-e85. doi:10.2337/dc20-1088
9. Beliard K, Ebekozien O, Demeterco-Berggren C, et al. Increased DKA at presentation among newly diagnosed type 1 diabetes patients with or without COVID-19: Data from a multi-site surveillance registry. J Diabetes. 2021;13(3):270-272. doi:10.1111/1753-0407
10. O’Malley G, Ebekozien O, Desimone M, et al. COVID-19 hospitalization in adults with type 1 diabetes: results from the T1D Exchange Multicenter Surveillance study. J Clin Endocrinol Metab. 2021;106(2):e936-e942. doi:10.1210/clinem/dgaa825
11. Ebekozien O, Agarwal S, Noor N, et al. Inequities in diabetic ketoacidosis among patients with type 1 diabetes and COVID-19: data from 52 US clinical centers. J Clin Endocrinol Metab. 2021;106(4):e1755-e1762. doi:10.1210/clinem/dgaa920
12. Alonso GT, Ebekozien O, Gallagher MP, et al. Diabetic ketoacidosis drives COVID-19 related hospitalizations in children with type 1 diabetes. J Diabetes. 2021;13(8):681-687. doi:10.1111/1753-0407.13184
13. Noor N, Ebekozien O, Levin L, et al. Diabetes technology use for management of type 1 diabetes is associated with fewer adverse COVID-19 outcomes: findings from the T1D Exchange COVID-19 Surveillance Registry. Diabetes Care. 2021;44(8):e160-e162. doi:10.2337/dc21-0074
14. Demeterco-Berggren C, Ebekozien O, Rompicherla S, et al. Age and hospitalization risk in people with type 1 diabetes and COVID-19: Data from the T1D Exchange Surveillance Study. J Clin Endocrinol Metab. 2021;dgab668. doi:10.1210/clinem/dgab668
15. Cummings MJ, Baldwin MR, Abrams D, et al. Epidemiology, clinical course, and outcomes of critically ill adults with COVID-19 in New York City: a prospective cohort study. Lancet. 2020;395(10239):1763-1770. doi:10.1016/S0140-6736(20)31189-2
16. Tsankov BK, Allaire JM, Irvine MA, et al. Severe COVID-19 infection and pediatric comorbidities: a systematic review and meta-analysis. Int J Infect Dis. 2021;103:246-256. doi:10.1016/j.ijid.2020.11.163
From Hassenfeld Children’s Hospital at NYU Langone Health, New York, NY (Dr Gallagher), T1D Exchange, Boston, MA (Saketh Rompicherla; Drs Ebekozien, Noor, Odugbesan, and Mungmode; Nicole Rioles, Emma Ospelt), University of Mississippi School of Population Health, Jackson, MS (Dr. Ebekozien), Icahn School of Medicine at Mount Sinai, New York, NY (Drs. Wilkes, O’Malley, and Rapaport), Weill Cornell Medicine, New York, NY (Drs. Antal and Feuer), NYU Long Island School of Medicine, Mineola, NY (Dr. Gabriel), NYU Langone Health, New York, NY (Dr. Golden), Barbara Davis Center, Aurora, CO (Dr. Alonso), Texas Children’s Hospital/Baylor College of Medicine, Houston, TX (Dr. Lyons), Stanford University, Stanford, CA (Dr. Prahalad), Children Mercy Kansas City, MO (Dr. Clements), Indiana University School of Medicine, IN (Dr. Neyman), Rady Children’s Hospital, University of California, San Diego, CA (Dr. Demeterco-Berggren).
Background: Patient outcomes of COVID-19 have improved throughout the pandemic. However, because it is not known whether outcomes of COVID-19 in the type 1 diabetes (T1D) population improved over time, we investigated differences in COVID-19 outcomes for patients with T1D in the United States.
Methods: We analyzed data collected via a registry of patients with T1D and COVID-19 from 56 sites between April 2020 and January 2021. We grouped cases into first surge (April 9, 2020, to July 31, 2020, n = 188) and late surge (August 1, 2020, to January 31, 2021, n = 410), and then compared outcomes between both groups using descriptive statistics and logistic regression models.
Results: Adverse outcomes were more frequent during the first surge, including diabetic ketoacidosis (32% vs 15%, P < .001), severe hypoglycemia (4% vs 1%, P = .04), and hospitalization (52% vs 22%, P < .001). Patients in the first surge were older (28 [SD,18.8] years vs 18.0 [SD, 11.1] years, P < .001), had higher median hemoglobin A1c levels (9.3 [interquartile range {IQR}, 4.0] vs 8.4 (IQR, 2.8), P < .001), and were more likely to use public insurance (107 [57%] vs 154 [38%], P < .001). The odds of hospitalization for adults in the first surge were 5 times higher compared to the late surge (odds ratio, 5.01; 95% CI, 2.11-12.63).
Conclusion: Patients with T1D who presented with COVID-19 during the first surge had a higher proportion of adverse outcomes than those who presented in a later surge.
Keywords: TD1, diabetic ketoacidosis, hypoglycemia.
After the World Health Organization declared the disease caused by the novel coronavirus SARS-CoV-2, COVID-19, a pandemic on March 11, 2020, the Centers for Disease Control and Prevention identified patients with diabetes as high risk for severe illness.1-7 The case-fatality rate for COVID-19 has significantly improved over the past 2 years. Public health measures, less severe COVID-19 variants, increased access to testing, and new treatments for COVID-19 have contributed to improved outcomes.
The T1D Exchange has previously published findings on COVID-19 outcomes for patients with type 1 diabetes (T1D) using data from the T1D COVID-19 Surveillance Registry.8-12 Given improved outcomes in COVID-19 in the general population, we sought to determine if outcomes for cases of COVID-19 reported to this registry changed over time.
Methods
This study was coordinated by the T1D Exchange and approved as nonhuman subject research by the Western Institutional Review Board. All participating centers also obtained local institutional review board approval. No identifiable patient information was collected as part of this noninterventional, cross-sectional study.
The T1D Exchange Multi-center COVID-19 Surveillance Study collected data from endocrinology clinics that completed a retrospective chart review and submitted information to T1D Exchange via an online questionnaire for all patients with T1D at their sites who tested positive for COVID-19.13,14 The questionnaire was administered using the Qualtrics survey platform (www.qualtrics.com version XM) and contained 33 pre-coded and free-text response fields to collect patient and clinical attributes.
Each participating center identified 1 team member for reporting to avoid duplicate case submission. Each submitted case was reviewed for potential errors and incomplete information. The coordinating center verified the number of cases per site for data quality assurance.
Quantitative data were represented as mean (standard deviation) or median (interquartile range). Categorical data were described as the number (percentage) of patients. Summary statistics, including frequency and percentage for categorical variables, were calculated for all patient-related and clinical characteristics. The date August 1, 2021, was selected as the end of the first surge based on a review of national COVID-19 surges.
We used the Fisher’s exact test to assess associations between hospitalization and demographics, HbA1c, diabetes duration, symptoms, and adverse outcomes. In addition, multivariate logistic regression was used to calculate odds ratios (OR). Logistic regression models were used to determine the association between time of surge and hospitalization separately for both the pediatric and adult populations. Each model was adjusted for potential sociodemographic confounders, specifically age, sex, race, insurance, and HbA1c.
All tests were 2-sided, with type 1 error set at 5%. Fisher’s exact test and logistic regression were performed using statistical software R, version 3.6.2 (R Foundation for Statistical Computing).
Results
The characteristics of COVID-19 cases in patients with T1D that were reported early in the pandemic, before August 1, 2020 (first surge), compared with those of cases reported on and after August 1, 2020 (later surges) are shown in Table 1.
Patients with T1D who presented with COVID-19 during the first surge as compared to the later surges were older (mean age 28 [SD, 18.0] years vs 18.8 [SD, 11.1] years; P < .001) and had a longer duration of diabetes (P < .001). The first-surge group also had more patients with >20 years’ diabetes duration (20% vs 9%, P < .001). Obesity, hypertension, and chronic kidney disease were also more commonly reported in first-surge cases (all P < .001).
There was a significant difference in race and ethnicity reported in the first surge vs the later surge cases, with fewer patients identifying as non-Hispanic White (39% vs, 63%, P < .001) and more patients identifying as non-Hispanic Black (29% vs 12%, P < .001). The groups also differed significantly in terms of insurance type, with more people on public insurance in the first-surge group (57% vs 38%, P < .001). In addition, median HbA1c was higher (9.3% vs 8.4%, P < .001) and continuous glucose monitor and insulin pump use were less common (P = .02 and <.001, respectively) in the early surge.
All symptoms and adverse outcomes were reported more often in the first surge, including diabetic ketoacidosis (DKA; 32% vs 15%; P < .001) and severe hypoglycemia (4% vs 1%, P = .04). Hospitalization (52% vs 13%, P < .001) and ICU admission (24% vs 9%, P < .001) were reported more often in the first-surge group.
Regression Analyses
Table 2 shows the results of logistic regression analyses for hospitalization in the pediatric (≤19 years of age) and adult (>19 years of age) groups, along with the odds of hospitalization during the first vs late surge among COVID-positive people with T1D. Adult patients who tested positive in the first surge were about 5 times more likely to be hospitalized than adults who tested positive for infection in the late surge after adjusting for age, insurance type, sex, race, and HbA1c levels. Pediatric patients also had an increased odds for hospitalization during the first surge, but this increase was not statistically significant.
Discussion
Our analysis of COVID-19 cases in patients with T1D reported by diabetes providers across the United States found that adverse outcomes were more prevalent early in the pandemic. There may be a number of reasons for this difference in outcomes between patients who presented in the first surge vs a later surge. First, because testing for COVID-19 was extremely limited and reserved for hospitalized patients early in the pandemic, the first-surge patients with confirmed COVID-19 likely represent a skewed population of higher-acuity patients. This may also explain the relative paucity of cases in younger patients reported early in the pandemic. Second, worse outcomes in the early surge may also have been associated with overwhelmed hospitals in New York City at the start of the outbreak. According to Cummings et al, the abrupt surge of critically ill patients hospitalized with severe acute respiratory distress syndrome initially outpaced their capacity to provide prone-positioning ventilation, which has been expanded since then.15 While there was very little hypertension, cardiovascular disease, or kidney disease reported in the pediatric groups, there was a higher prevalence of obesity in the pediatric group from the mid-Atlantic region. Obesity has been associated with a worse prognosis for COVID-19 illness in children.16 Finally, there were 5 deaths reported in this study, all of which were reported during the first surge. Older age and increased rates of cardiovascular disease and chronic kidney disease in the first surge cases likely contributed to worse outcomes for adults in mid-Atlantic region relative to the other regions. Minority race and the use of public insurance, risk factors for more severe outcomes in all regions, were also more common in cases reported from the mid-Atlantic region.
This study has several limitations. First, it is a cross-sectional study that relies upon voluntary provider reports. Second, availability of COVID-19 testing was limited in all regions in spring 2020. Third, different regions of the country experienced subsequent surges at different times within the reported timeframes in this analysis. Fourth, this report time period does not include the impact of the newer COVID-19 variants. Finally, trends in COVID-19 outcomes were affected by the evolution of care that developed throughout 2020.
Conclusion
Adult patients with T1D and COVID-19 who reported during the first surge had about 5 times higher hospitalization odds than those who presented in a later surge.
Corresponding author: Osagie Ebekozien, MD, MPH, 11 Avenue de Lafayette, Boston, MA 02111; [email protected]
Disclosures: Dr Ebekozien reports receiving research grants from Medtronic Diabetes, Eli Lilly, and Dexcom, and receiving honoraria from Medtronic Diabetes.
1. Barron E, Bakhai C, Kar P, et al. Associations of type 1 and type 2 diabetes with COVID-19-related mortality in England: a whole-population study. Lancet Diabetes Endocrinol. 2020;8(10):813-822. doi:10.1016/S2213-8587(20)30272-2
2. Fisher L, Polonsky W, Asuni A, Jolly Y, Hessler D. The early impact of the COVID-19 pandemic on adults with type 1 or type 2 diabetes: A national cohort study. J Diabetes Complications. 2020;34(12):107748. doi:10.1016/j.jdiacomp.2020.107748
3. Holman N, Knighton P, Kar P, et al. Risk factors for COVID-19-related mortality in people with type 1 and type 2 diabetes in England: a population-based cohort study. Lancet Diabetes Endocrinol. 2020;8(10):823-833. doi:10.1016/S2213-8587(20)30271-0
4. Wargny M, Gourdy P, Ludwig L, et al. Type 1 diabetes in people hospitalized for COVID-19: new insights from the CORONADO study. Diabetes Care. 2020;43(11):e174-e177. doi:10.2337/dc20-1217
5. Gregory JM, Slaughter JC, Duffus SH, et al. COVID-19 severity is tripled in the diabetes community: a prospective analysis of the pandemic’s impact in type 1 and type 2 diabetes. Diabetes Care. 2021;44(2):526-532. doi:10.2337/dc20-2260
6. Cardona-Hernandez R, Cherubini V, Iafusco D, Schiaffini R, Luo X, Maahs DM. Children and youth with diabetes are not at increased risk for hospitalization due to COVID-19. Pediatr Diabetes. 2021;22(2):202-206. doi:10.1111/pedi.13158
7. Maahs DM, Alonso GT, Gallagher MP, Ebekozien O. Comment on Gregory et al. COVID-19 severity is tripled in the diabetes community: a prospective analysis of the pandemic’s impact in type 1 and type 2 diabetes. Diabetes Care. 2021;44:526-532. Diabetes Care. 2021;44(5):e102. doi:10.2337/dc20-3119
8. Ebekozien OA, Noor N, Gallagher MP, Alonso GT. Type 1 diabetes and COVID-19: preliminary findings from a multicenter surveillance study in the US. Diabetes Care. 2020;43(8):e83-e85. doi:10.2337/dc20-1088
9. Beliard K, Ebekozien O, Demeterco-Berggren C, et al. Increased DKA at presentation among newly diagnosed type 1 diabetes patients with or without COVID-19: Data from a multi-site surveillance registry. J Diabetes. 2021;13(3):270-272. doi:10.1111/1753-0407
10. O’Malley G, Ebekozien O, Desimone M, et al. COVID-19 hospitalization in adults with type 1 diabetes: results from the T1D Exchange Multicenter Surveillance study. J Clin Endocrinol Metab. 2021;106(2):e936-e942. doi:10.1210/clinem/dgaa825
11. Ebekozien O, Agarwal S, Noor N, et al. Inequities in diabetic ketoacidosis among patients with type 1 diabetes and COVID-19: data from 52 US clinical centers. J Clin Endocrinol Metab. 2021;106(4):e1755-e1762. doi:10.1210/clinem/dgaa920
12. Alonso GT, Ebekozien O, Gallagher MP, et al. Diabetic ketoacidosis drives COVID-19 related hospitalizations in children with type 1 diabetes. J Diabetes. 2021;13(8):681-687. doi:10.1111/1753-0407.13184
13. Noor N, Ebekozien O, Levin L, et al. Diabetes technology use for management of type 1 diabetes is associated with fewer adverse COVID-19 outcomes: findings from the T1D Exchange COVID-19 Surveillance Registry. Diabetes Care. 2021;44(8):e160-e162. doi:10.2337/dc21-0074
14. Demeterco-Berggren C, Ebekozien O, Rompicherla S, et al. Age and hospitalization risk in people with type 1 diabetes and COVID-19: Data from the T1D Exchange Surveillance Study. J Clin Endocrinol Metab. 2021;dgab668. doi:10.1210/clinem/dgab668
15. Cummings MJ, Baldwin MR, Abrams D, et al. Epidemiology, clinical course, and outcomes of critically ill adults with COVID-19 in New York City: a prospective cohort study. Lancet. 2020;395(10239):1763-1770. doi:10.1016/S0140-6736(20)31189-2
16. Tsankov BK, Allaire JM, Irvine MA, et al. Severe COVID-19 infection and pediatric comorbidities: a systematic review and meta-analysis. Int J Infect Dis. 2021;103:246-256. doi:10.1016/j.ijid.2020.11.163
Role and Experience of a Subintensive Care Unit in Caring for Patients With COVID-19 in Italy: The CO-RESP Study
From the Department of Emergency Medicine, Santa Croce e Carle Hospital, Cuneo, Italy (Drs. Abram, Tosello, Emanuele Bernardi, Allione, Cavalot, Dutto, Corsini, Martini, Sciolla, Sara Bernardi, and Lauria). From the School of Emergency Medicine, University of Turin, Turin, Italy (Drs. Paglietta and Giamello).
Objective: This retrospective and prospective cohort study was designed to describe the characteristics, treatments, and outcomes of patients with SARS-CoV-2 infection (COVID-19) admitted to subintensive care units (SICU) and to identify the variables associated with outcomes. SICUs have been extremely stressed during the pandemic, but most data regarding critically ill COVID-19 patients come from intensive care units (ICUs). Studies about COVID-19 patients in SICUs are lacking.
Setting and participants: The study included 88 COVID-19 patients admitted to our SICU in Cuneo, Italy, between March and May 2020.
Measurements: Clinical and ventilatory data were collected, and patients were divided by outcome. Multivariable logistic regression analysis examined the variables associated with negative outcomes (transfer to the ICU, palliation, or death in a SICU).
Results: A total of 60 patients (68%) had a positive outcome, and 28 patients (32%) had a negative outcome; 69 patients (78%) underwent continuous positive airway pressure (CPAP). Pronation (n = 37 [42%]) had been more frequently adopted in patients who had a positive outcome vs a negative outcome (n = 30 [50%] vs n = 7 [25%]; P = .048), and the median (interquartile range) Pa
Conclusion: SICUs have a fundamental role in the treatment of critically ill patients with COVID-19, who require long-term CPAP and pronation cycles. Diabetes, lymphopenia, and high D-dimer and LDH levels are associated with negative outcomes.
Keywords: emergency medicine, noninvasive ventilation, prone position, continuous positive airway pressure.
The COVID-19 pandemic has led to large increases in hospital admissions. Subintensive care units (SICUs) are among the wards most under pressure worldwide,1 dealing with the increased number of critically ill patients who need noninvasive ventilation, as well as serving as the best alternative to overfilled intensive care units (ICUs). In Italy, SICUs are playing a fundamental role in the management of COVID-19 patients, providing early treatment of respiratory failure by continuous noninvasive ventilation in order to reduce the need for intubation.2-5 Nevertheless, the great majority of available data about critically ill COVID-19 patients comes from ICUs. Full studies about outcomes of patients in SICUs are lacking and need to be conducted.
We sought to evaluate the characteristics and outcomes of patients admitted to our SICU for COVID-19 to describe the treatments they needed and their impact on prognosis, and to identify the variables associated with patient outcomes.
Methods
Study Design
This cohort study used data from patients who were admitted in the very first weeks of the pandemic. Data were collected retrospectively as well as prospectively, since the ethical committee approved our project. The quality and quantity of data in the 2 groups were comparable.
Data were collected from electronic and written medical records gathered during the patient’s entire stay in our SICU. Data were entered in a database with limited and controlled access. This study complied with the Declaration of Helsinki and was approved by the local ethics committees (ID: MEDURG10).
Study Population
Clinical Data
The past medical history and recent symptoms description were obtained by manually reviewing medical records. Epidemiological exposure was defined as contact with SARS-CoV-2–positive people or staying in an epidemic outbreak area. Initial vital parameters, venous blood tests, arterial blood gas analysis, chest x-ray, as well as the result of the nasopharyngeal swab were gathered from the emergency department (ED) examination. (Additional swabs could be requested when the first one was negative but clinical suspicion for COVID-19 was high.) Upon admission to the SICU, a standardized panel of blood tests was performed, which was repeated the next day and then every 48 hours. Arterial blood gas analysis was performed when clinically indicated, at least twice a day, or following a scheduled time in patients undergoing pronation. Charlson Comorbidity Index7 and MuLBSTA score8 were calculated based on the collected data.
Imaging
Chest ultrasonography was performed in the ED at the time of hospitalization and once a day in the SICU. Pulmonary high-resolution computed tomography (HRCT) was performed when clinically indicated or when the results of nasopharyngeal swabs and/or x-ray results were discordant with COVID-19 clinical suspicion. Contrast CT was performed when pulmonary embolism was suspected.
Medical Therapy
Hydroxychloroquine, antiviral agents, tocilizumab, and ruxolitinib were used in the early phase of the pandemic, then were dismissed after evidence of no efficacy.9-11 Steroids and low-molecular-weight heparin were used afterward. Enoxaparin was used at the standard prophylactic dosage, and 70% of the anticoagulant dosage was also adopted in patients with moderate-to-severe COVID-19 and D-dimer values >3 times the normal value.12-14 Antibiotics were given when a bacterial superinfection was suspected.
Oxygen and Ventilatory Therapy
Oxygen support or noninvasive ventilation were started based on patients’ respiratory efficacy, estimated by respiratory rate and the ratio of partial pressure of arterial oxygen and fraction of inspired oxygen (P/F ratio).15,16 Oxygen support was delivered through nasal cannula, Venturi mask, or reservoir mask. Noninvasive ventilation was performed by continuous positive airway pressure (CPAP) when the P/F ratio was <250 or the respiratory rate was >25 breaths per minute, using the helmet interface.5,17 Prone positioning during CPAP18-20 was adopted in patients meeting the acute respiratory distress syndrome (ARDS) criteria21 and having persistence of respiratory distress and P/F <300 after a 1-hour trial of CPAP.
The prone position was maintained based on patient tolerance. P/F ratio was measured before pronation (T0), after 1 hour of prone position (T1), before resupination (T2), and 6 hours after resupination (T3). With the same timing, the patient was asked to rate their comfort in each position, from 0 (lack of comfort) to 10 (optimal comfort). Delta P/F was defined as the difference between P/F at T3 and basal P/F at T0.
Outcomes
Statistical Analysis
Continuous data are reported as median and interquartile range (IQR); normal distribution of variables was tested using the Shapiro-Wilk test. Categorical variables were reported as absolute number and percentage. The Mann-Whitney test was used to compare continuous variables between groups, and chi-square test with continuity correction was used for categorical variables. The variables that were most significantly associated with a negative outcome on the univariate analysis were included in a stepwise logistic regression analysis, in order to identify independent predictors of patient outcome. Statistical analysis was performed using JASP (JASP Team) software.
Results
Study Population
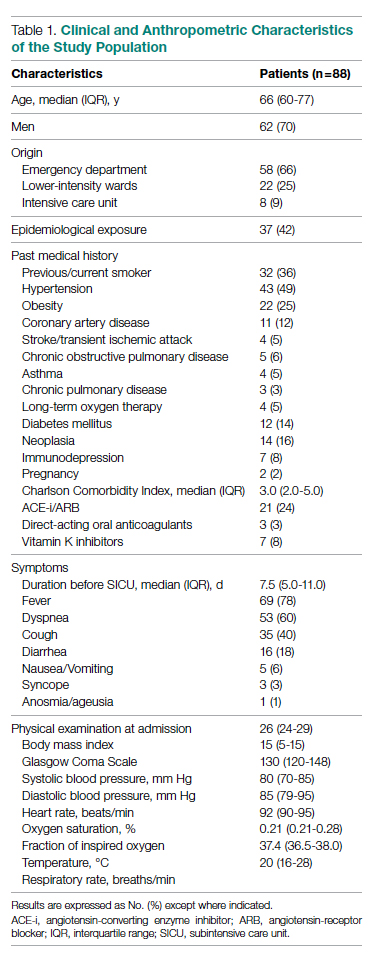
Of the 88 patients included in the study, 70% were male; the median age was 66 years (IQR, 60-77). In most patients, the diagnosis of COVID-19 was derived from a positive SARS-CoV-2 nasopharyngeal swab. Six patients, however, maintained a negative swab at all determinations but had clinical and imaging features strongly suggesting COVID-19. No patients met the exclusion criteria. Most patients came from the ED (n = 58 [66%]) or general wards (n = 22 [25%]), while few were transferred from the ICU (n = 8 [9%]). The median length of stay in the SICU was 4 days (IQR, 2-7). An epidemiological link to affected persons or a known virus exposure was identifiable in 37 patients (42%).
Clinical, Laboratory, and Imaging Data
The clinical and anthropometric characteristics of patients are shown in Table 1. Hypertension and smoking habits were prevalent in our population, and the median Charlson Comorbidity Index was 3. Most patients experienced fever, dyspnea, and cough during the days before hospitalization.
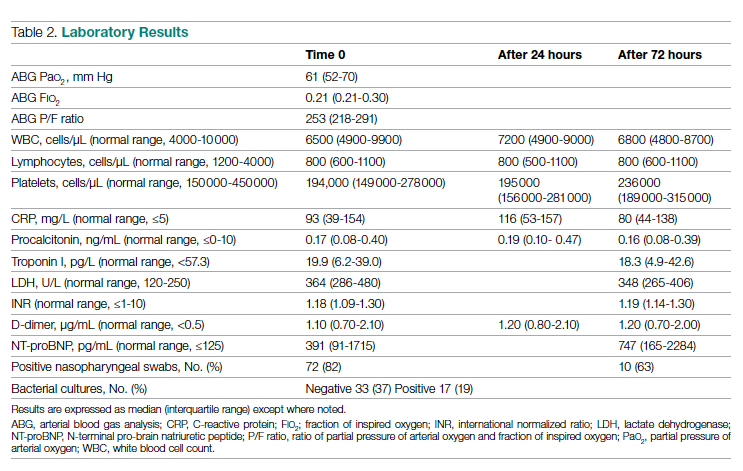
Laboratory data showed a marked inflammatory milieu in all studied patients, both at baseline and after 24 and 72 hours. Lymphopenia was observed, along with a significant increase of lactate dehydrogenase (LDH), C-reactive protein (CPR), and D-dimer, and a mild increase of procalcitonin. N-terminal pro-brain natriuretic peptide (NT-proBNP) values were also increased, with normal troponin I values (Table 2).
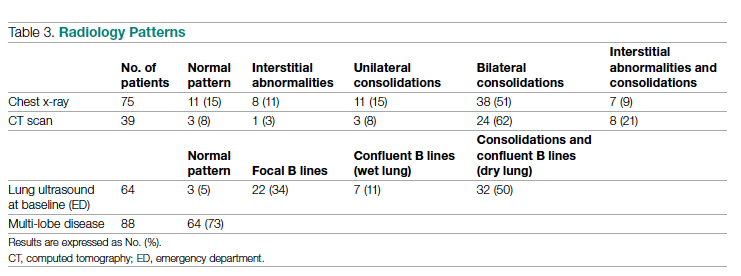
Chest x-rays were obtained in almost all patients, while HRCT was performed in nearly half of patients. Complete bedside pulmonary ultrasonography data were available for 64 patients. Heterogeneous pulmonary alterations were found, regardless of the radiological technique, and multilobe infiltrates were the prevalent radiological pattern (73%) (Table 3). Seven patients (8%) were diagnosed with associated pulmonary embolism.
Medical Therapy
Most patients (89%) received hydroxychloroquine, whereas steroids were used in one-third of the population (36%). Immunomodulators (tocilizumab and ruxolitinib) were restricted to 12 patients (14%). Empirical antiviral therapy was introduced in the first 41 patients (47%). Enoxaparin was the default agent for thromboembolism prophylaxis, and 6 patients (7%) received 70% of the anticoagulating dose.
Oxygen and Ventilatory Therapy
Outcomes
A total of 28 patients (32%) had a negative outcome in the SICU: 8 patients (9%) died, having no clinical indication for higher-intensity care; 6 patients (7%) were transferred to general wards for palliation; and 14 patients (16%) needed an upgrade of cure intensity and were transferred to the ICU. Of these 14 patients, 9 died in the ICU. The total in-hospital mortality of COVID-19 patients, including patients transferred from the SICU to general wards in fair condition, was 27% (n = 24). Clinical, laboratory, and therapeutic characteristics between the 2 groups are shown in Table 4.
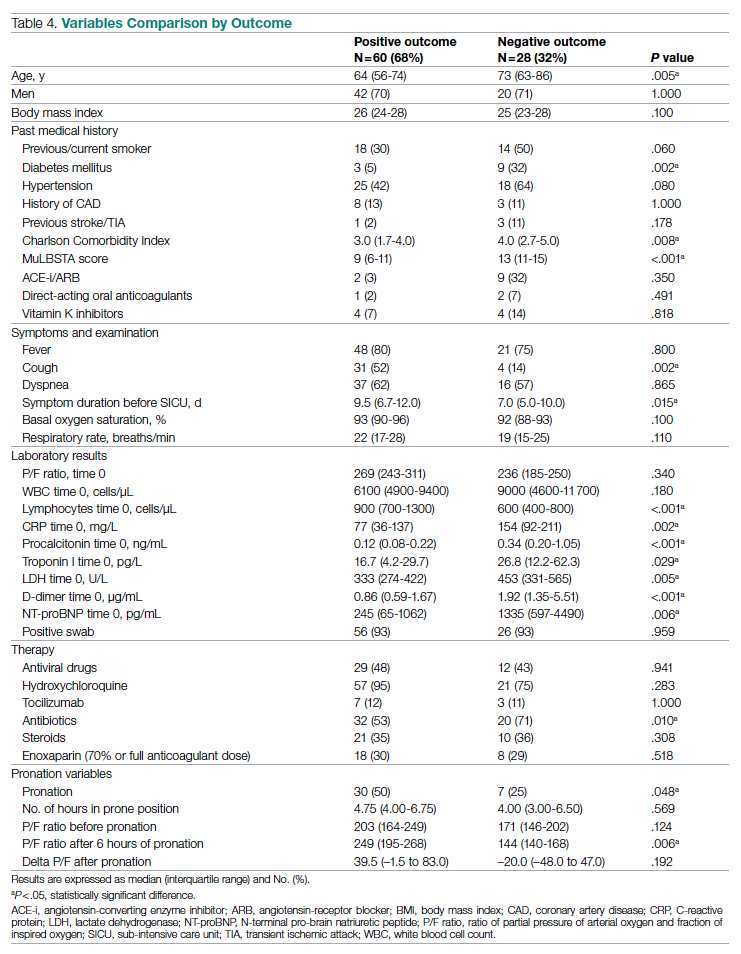
Patients who had a negative outcome were significantly older and had more comorbidities, as suggested by a significantly higher prevalence of diabetes and higher Charlson Comorbidity scores (reflecting the mortality risk based on age and comorbidities). The median MuLBSTA score, which estimates the 90-day mortality risk from viral pneumonia, was also higher in patients who had a negative outcome (9.33%). Symptom occurrence was not different in patients with a negative outcome (apart from cough, which was less frequent), but these patients underwent hospitalization earlier—since the appearance of their first COVID-19 symptoms—compared to patients who had a positive outcome. No difference was found in antihypertensive therapy with angiotensin-converting enzyme inhibitors or angiotensin-receptor blockers among outcome groups.
More pronounced laboratory abnormalities were found in patients who had a negative outcome, compared to patients who had a positive outcome: lower lymphocytes and higher C-reactive protein (CRP), procalcitonin, D-dimer, LDH, and NT-proBNP. We found no differences in the radiological distribution of pulmonary involvement in patients who had negative or positive outcomes, nor in the adopted medical treatment.
Data showed no difference in CPAP implementation in the 2 groups. However, prone positioning had been more frequently adopted in the group of patients who had a positive outcome, compared with patients who had a negative outcome. No differences of basal P/F were found in patients who had a negative or positive outcome, but the median P/F after 6 hours of prone position was significantly lower in patients who had a negative outcome. The delta P/F ratio did not differ in the 2 groups of patients.
Discussion
Role of Subintensive Units and Mortality
The novelty of our report is its attempt to investigate the specific group of COVID-19 patients admitted to a SICU. In Italy, SICUs receive acutely ill, spontaneously breathing patients who need (invasive) hemodynamic monitoring, vasoactive medication, renal replacement therapy, chest- tube placement, thrombolysis, and respiratory noninvasive support. The nurse-to-patient ratio is higher than for general wards (usually 1 nurse to every 4 or 5 patients), though lower than for ICUs. In northern Italy, a great number of COVID-19 patients have required this kind of high-intensity care during the pandemic: Noninvasive ventilation support had to be maintained for several days, pronation maneuvers required a high number of people 2 or 3 times a day, and strict monitoring had to be assured. The SICU setting allows patients to buy time as a bridge to progressive reduction of pulmonary involvement, sometimes preventing the need for intubation.
The high prevalence of negative outcomes in the SICU underlines the complexity of COVID-19 patients in this setting. In fact, published data about mortality for patients with severe COVID-19 pneumonia are similar to ours.22,23
Clinical, Laboratory, and Imaging Data
Our analysis confirmed a high rate of comorbidities in COVID-19 patients24 and their prognostic role with age.25,26 A marked inflammatory milieu was a negative prognostic indicator, and associated concomitant bacterial superinfection could have led to a worse prognosis (procalcitonin was associated with negative outcomes).27 The cardiovascular system was nevertheless stressed, as suggested by higher values of NT-proBNP in patients with negative outcomes, which could reflect sepsis-related systemic involvement.28
It is known that the pulmonary damage caused by SARS-CoV-2 has a dynamic radiological and clinical course, with early areas of subsegmental consolidation, and bilateral ground-glass opacities predominating later in the course of the disease.29 This could explain why in our population we found no specific radiological pattern leading to a worse outcome.
Medical Therapy
No specific pharmacological therapy was found to be associated with a positive outcome in our study, just like antiviral and immunomodulator therapies failed to demonstrate effectiveness in subsequent pandemic surges. The low statistical power of our study did not allow us to give insight into the effectiveness of steroids and heparin at any dosage.
PEEP Support and Prone Positioning
Continuous positive airway pressure was initiated in the majority of patients and maintained for several days. This was an absolute novelty, because we rarely had to keep patients in helmets for long. This was feasible thanks to the SICU’s high nurse-to-patient ratio and the possibility of providing monitored sedation. Patients who could no longer tolerate CPAP helmets or did not improve with CPAP support were evaluated with anesthetists for programming further management. No initial data on respiratory rate, level of hypoxemia, or oxygen support need (level of PEEP and F
Prone positioning during CPAP was implemented in 42% of our study population: P/F ratio amelioration after prone positioning was highly variable, ranging from very good P/F ratio improvements to few responses or no response. No significantly greater delta P/F ratio was seen after the first prone positioning cycle in patients who had a positive outcome, probably due to the small size of our population, but we observed a clear positive trend. Interestingly, patients showing a negative outcome had a lower percentage of long-term responses to prone positioning: 6 hours after resupination, they lost the benefit of prone positioning in terms of P/F ratio amelioration. Similarly, a greater number of patients tolerating prone positioning had a positive outcome. These data give insight on the possible benefits of prone positioning in a noninvasively supported cohort of patients, which has been mentioned in previous studies.30,31
Outcomes and Variables Associated With Negative Outcomes
After correction for age and sex, we found in multiple regression analysis that higher D-dimer and LDH values, lymphopenia, and history of diabetes were independently associated with a worse outcome. Although our results had low statistical significance, we consider the trend of the obtained odds ratios important from a clinical point of view. These results could lead to greater attention being placed on COVID-19 patients who present with these characteristics upon their arrival to the ED because they have increased risk of death or intensive care need. Clinicians should consider SICU admission for these patients in order to guarantee closer monitoring and possibly more aggressive ventilatory treatments, earlier pronation, or earlier transfer to the ICU.
Limitations
The major limitation to our study is undoubtedly its statistical power, due to its relatively low patient population. Particularly, the small number of patients who underwent pronation did not allow speculation about the efficacy of this technique, although preliminary data seem promising. However, ours is among the first studies regarding patients with COVID-19 admitted to a SICU, and these preliminary data truthfully describe the Italian, and perhaps international, experience with the first surge of the pandemic.
Conclusions
Our data highlight the primary role of the SICU in COVID-19 in adequately treating critically ill patients who have high care needs different from intubation, and who require noninvasive ventilation for prolonged times as well as frequent pronation cycles. This setting of care may represent a valid, reliable, and effective option for critically ill respiratory patients. History of diabetes, lymphopenia, and high D-dimer and LDH values are independently associated with negative outcomes, and patients presenting with these characteristics should be strictly monitored.
Acknowledgments: The authors thank the Informatica System S.R.L., as well as Allessando Mendolia for the pro bono creation of the ISCovidCollect data collecting app.
Corresponding author: Sara Abram, MD, via Coppino, 12100 Cuneo, Italy; [email protected].
Disclosures: None.
1. Plate JDJ, Leenen LPH, Houwert M, Hietbrink F. Utilisation of intermediate care units: a systematic review. Crit Care Res Pract. 2017;2017:8038460. doi:10.1155/2017/8038460
2. Antonelli M, Conti G, Esquinas A, et al. A multiple-center survey on the use in clinical practice of noninvasive ventilation as a first-line intervention for acute respiratory distress syndrome. Crit Care Med. 2007;35(1):18-25. doi:10.1097/01.CCM.0000251821.44259.F3
3. Patel BK, Wolfe KS, Pohlman AS, Hall JB, Kress JP. Effect of noninvasive ventilation delivered by helmet vs face mask on the rate of endotracheal intubation in patients with acute respiratory distress syndrome: a randomized clinical trial. JAMA. 2016;315(22):2435-2441. doi:10.1001/jama.2016.6338
4. Mas A, Masip J. Noninvasive ventilation in acute respiratory failure. Int J Chron Obstruct Pulmon Dis. 2014;9:837-852. doi:10.2147/COPD.S42664
5. Bellani G, Patroniti N, Greco M, Foti G, Pesenti A. The use of helmets to deliver non-invasive continuous positive airway pressure in hypoxemic acute respiratory failure. Minerva Anestesiol. 2008;74(11):651-656.
6. Lomoro P, Verde F, Zerboni F, et al. COVID-19 pneumonia manifestations at the admission on chest ultrasound, radiographs, and CT: single-center study and comprehensive radiologic literature review. Eur J Radiol Open. 2020;7:100231. doi:10.1016/j.ejro.2020.100231
7. Charlson ME, Pompei P, Ales KL, MacKenzie CR. A new method of classifying prognostic comorbidity in longitudinal studies: development and validation. J Chronic Dis. 1987;40:373-383. doi:10.1016/0021-9681(87)90171-8
8. Guo L, Wei D, Zhang X, et al. Clinical features predicting mortality risk in patients with viral pneumonia: the MuLBSTA score. Front Microbiol. 2019;10:2752. doi:10.3389/fmicb.2019.02752
9. Lombardy Section Italian Society Infectious and Tropical Disease. Vademecum for the treatment of people with COVID-19. Edition 2.0, 13 March 2020. Infez Med. 2020;28(2):143-152.
10. Wang M, Cao R, Zhang L, et al. Remdesivir and chloroquine effectively inhibit the recently emerged novel coronavirus (2019-nCoV) in vitro. Cell Res. 2020;30(3):269-271. doi:10.1038/s41422-020-0282-0
11. Cao B, Wang Y, Wen D, et al. A trial of lopinavir-ritonavir in adults hospitalized with severe Covid-19. N Engl J Med. 2020;382(19):1787-1799. doi:10.1056/NEJMoa2001282
12. Stone JH, Frigault MJ, Serling-Boyd NJ, et al; BACC Bay Tocilizumab Trial Investigators. Efficacy of tocilizumab in patients hospitalized with Covid-19. N Engl J Med. 2020;383(24):2333-2344. doi:10.1056/NEJMoa2028836
13. Shastri MD, Stewart N, Horne J, et al. In-vitro suppression of IL-6 and IL-8 release from human pulmonary epithelial cells by non-anticoagulant fraction of enoxaparin. PLoS One. 2015;10(5):e0126763. doi:10.1371/journal.pone.0126763
14. Milewska A, Zarebski M, Nowak P, Stozek K, Potempa J, Pyrc K. Human coronavirus NL63 utilizes heparin sulfate proteoglycans for attachment to target cells. J Virol. 2014;88(22):13221-13230. doi:10.1128/JVI.02078-14
15. Marietta M, Vandelli P, Mighali P, Vicini R, Coluccio V, D’Amico R; COVID-19 HD Study Group. Randomised controlled trial comparing efficacy and safety of high versus low low-molecular weight heparin dosages in hospitalized patients with severe COVID-19 pneumonia and coagulopathy not requiring invasive mechanical ventilation (COVID-19 HD): a structured summary of a study protocol. Trials. 2020;21(1):574. doi:10.1186/s13063-020-04475-z
16. Marshall JC, Cook DJ, Christou NV, Bernard GR, Sprung CL, Sibbald WJ. Multiple organ dysfunction score: a reliable descriptor of a complex clinical outcome. Crit Care Med. 1995;23(10):1638-1652. doi:10.1097/00003246-199510000-00007
17. Sinha P, Calfee CS. Phenotypes in acute respiratory distress syndrome: moving towards precision medicine. Curr Opin Crit Care. 2019;25(1):12-20. doi:10.1097/MCC.0000000000000571
18. Lucchini A, Giani M, Isgrò S, Rona R, Foti G. The “helmet bundle” in COVID-19 patients undergoing non-invasive ventilation. Intensive Crit Care Nurs. 2020;58:102859. doi:10.1016/j.iccn.2020.102859
19. Ding L, Wang L, Ma W, He H. Efficacy and safety of early prone positioning combined with HFNC or NIV in moderate to severe ARDS: a multi-center prospective cohort study. Crit Care. 2020;24(1):28. doi:10.1186/s13054-020-2738-5
20. Scaravilli V, Grasselli G, Castagna L, et al. Prone positioning improves oxygenation in spontaneously breathing nonintubated patients with hypoxemic acute respiratory failure: a retrospective study. J Crit Care. 2015;30(6):1390-1394. doi:10.1016/j.jcrc.2015.07.008
21. Caputo ND, Strayer RJ, Levitan R. Early self-proning in awake, non-intubated patients in the emergency department: a single ED’s experience during the COVID-19 pandemic. Acad Emerg Med. 2020;27(5):375-378. doi:10.1111/acem.13994
22. ARDS Definition Task Force; Ranieri VM, Rubenfeld GD, Thompson BT, et al. Acute respiratory distress syndrome: the Berlin Definition. JAMA. 2012;307(23):2526-2533. doi:10.1001/jama.2012.5669
23. Petrilli CM, Jones SA, Yang J, et al. Factors associated with hospital admission and critical illness among 5279 people with coronavirus disease 2019 in New York City: prospective cohort study. BMJ. 2020;369:m1966. doi:10.1136/bmj.m1966
24. Docherty AB, Harrison EM, Green CA, et al; ISARIC4C investigators. Features of 20 133 UK patients in hospital with Covid-19 using the ISARIC WHO Clinical Characterisation Protocol: prospective observational cohort study. BMJ. 2020;369:m1985. doi:10.1136/bmj.m1985
25. Richardson S, Hirsch JS, Narasimhan M, et al. Presenting characteristics, comorbidities, and outcomes among 5700 patients hospitalized with COVID-19 in the New York City area. JAMA. 2020;323(20):2052-2059. doi:10.1001/jama.2020.6775
26. Muniyappa R, Gubbi S. COVID-19 pandemic, coronaviruses, and diabetes mellitus. Am J Physiol Endocrinol Metab. 2020;318(5):E736-E741. doi:10.1152/ajpendo.00124.2020
27. Guo W, Li M, Dong Y, et al. Diabetes is a risk factor for the progression and prognosis of COVID-19. Diabetes Metab Res Rev. 2020:e3319. doi:10.1002/dmrr.3319
28. Chen N, Zhou M, Dong X, et al. Epidemiological and clinical characteristics of 99 cases of 2019 novel coronavirus pneumonia in Wuhan, China: a descriptive study. Lancet. 2020;395(10223):507-513. doi:10.1016/S0140-6736(20)30211-7
29. Kooraki S, Hosseiny M, Myers L, Gholamrezanezhad A. Coronavirus (COVID-19) outbreak: what the Department of Radiology should know. J Am Coll Radiol. 2020;17(4):447-451. doi:10.1016/j.jacr.2020.02.008
30. Coppo A, Bellani G, Winterton D, et al. Feasibility and physiological effects of prone positioning in non-intubated patients with acute respiratory failure due to COVID-19 (PRON-COVID): a prospective cohort study. Lancet Respir Med. 2020;8(8):765-774. doi:10.1016/S2213-2600(20)30268-X
31. Weatherald J, Solverson K, Zuege DJ, Loroff N, Fiest KM, Parhar KKS. Awake prone positioning for COVID-19 hypoxemic respiratory failure: a rapid review. J Crit Care. 2021;61:63-70. doi:10.1016/j.jcrc.2020.08.018
From the Department of Emergency Medicine, Santa Croce e Carle Hospital, Cuneo, Italy (Drs. Abram, Tosello, Emanuele Bernardi, Allione, Cavalot, Dutto, Corsini, Martini, Sciolla, Sara Bernardi, and Lauria). From the School of Emergency Medicine, University of Turin, Turin, Italy (Drs. Paglietta and Giamello).
Objective: This retrospective and prospective cohort study was designed to describe the characteristics, treatments, and outcomes of patients with SARS-CoV-2 infection (COVID-19) admitted to subintensive care units (SICU) and to identify the variables associated with outcomes. SICUs have been extremely stressed during the pandemic, but most data regarding critically ill COVID-19 patients come from intensive care units (ICUs). Studies about COVID-19 patients in SICUs are lacking.
Setting and participants: The study included 88 COVID-19 patients admitted to our SICU in Cuneo, Italy, between March and May 2020.
Measurements: Clinical and ventilatory data were collected, and patients were divided by outcome. Multivariable logistic regression analysis examined the variables associated with negative outcomes (transfer to the ICU, palliation, or death in a SICU).
Results: A total of 60 patients (68%) had a positive outcome, and 28 patients (32%) had a negative outcome; 69 patients (78%) underwent continuous positive airway pressure (CPAP). Pronation (n = 37 [42%]) had been more frequently adopted in patients who had a positive outcome vs a negative outcome (n = 30 [50%] vs n = 7 [25%]; P = .048), and the median (interquartile range) Pa
Conclusion: SICUs have a fundamental role in the treatment of critically ill patients with COVID-19, who require long-term CPAP and pronation cycles. Diabetes, lymphopenia, and high D-dimer and LDH levels are associated with negative outcomes.
Keywords: emergency medicine, noninvasive ventilation, prone position, continuous positive airway pressure.
The COVID-19 pandemic has led to large increases in hospital admissions. Subintensive care units (SICUs) are among the wards most under pressure worldwide,1 dealing with the increased number of critically ill patients who need noninvasive ventilation, as well as serving as the best alternative to overfilled intensive care units (ICUs). In Italy, SICUs are playing a fundamental role in the management of COVID-19 patients, providing early treatment of respiratory failure by continuous noninvasive ventilation in order to reduce the need for intubation.2-5 Nevertheless, the great majority of available data about critically ill COVID-19 patients comes from ICUs. Full studies about outcomes of patients in SICUs are lacking and need to be conducted.
We sought to evaluate the characteristics and outcomes of patients admitted to our SICU for COVID-19 to describe the treatments they needed and their impact on prognosis, and to identify the variables associated with patient outcomes.
Methods
Study Design
This cohort study used data from patients who were admitted in the very first weeks of the pandemic. Data were collected retrospectively as well as prospectively, since the ethical committee approved our project. The quality and quantity of data in the 2 groups were comparable.
Data were collected from electronic and written medical records gathered during the patient’s entire stay in our SICU. Data were entered in a database with limited and controlled access. This study complied with the Declaration of Helsinki and was approved by the local ethics committees (ID: MEDURG10).
Study Population
Clinical Data
The past medical history and recent symptoms description were obtained by manually reviewing medical records. Epidemiological exposure was defined as contact with SARS-CoV-2–positive people or staying in an epidemic outbreak area. Initial vital parameters, venous blood tests, arterial blood gas analysis, chest x-ray, as well as the result of the nasopharyngeal swab were gathered from the emergency department (ED) examination. (Additional swabs could be requested when the first one was negative but clinical suspicion for COVID-19 was high.) Upon admission to the SICU, a standardized panel of blood tests was performed, which was repeated the next day and then every 48 hours. Arterial blood gas analysis was performed when clinically indicated, at least twice a day, or following a scheduled time in patients undergoing pronation. Charlson Comorbidity Index7 and MuLBSTA score8 were calculated based on the collected data.
Imaging
Chest ultrasonography was performed in the ED at the time of hospitalization and once a day in the SICU. Pulmonary high-resolution computed tomography (HRCT) was performed when clinically indicated or when the results of nasopharyngeal swabs and/or x-ray results were discordant with COVID-19 clinical suspicion. Contrast CT was performed when pulmonary embolism was suspected.
Medical Therapy
Hydroxychloroquine, antiviral agents, tocilizumab, and ruxolitinib were used in the early phase of the pandemic, then were dismissed after evidence of no efficacy.9-11 Steroids and low-molecular-weight heparin were used afterward. Enoxaparin was used at the standard prophylactic dosage, and 70% of the anticoagulant dosage was also adopted in patients with moderate-to-severe COVID-19 and D-dimer values >3 times the normal value.12-14 Antibiotics were given when a bacterial superinfection was suspected.
Oxygen and Ventilatory Therapy
Oxygen support or noninvasive ventilation were started based on patients’ respiratory efficacy, estimated by respiratory rate and the ratio of partial pressure of arterial oxygen and fraction of inspired oxygen (P/F ratio).15,16 Oxygen support was delivered through nasal cannula, Venturi mask, or reservoir mask. Noninvasive ventilation was performed by continuous positive airway pressure (CPAP) when the P/F ratio was <250 or the respiratory rate was >25 breaths per minute, using the helmet interface.5,17 Prone positioning during CPAP18-20 was adopted in patients meeting the acute respiratory distress syndrome (ARDS) criteria21 and having persistence of respiratory distress and P/F <300 after a 1-hour trial of CPAP.
The prone position was maintained based on patient tolerance. P/F ratio was measured before pronation (T0), after 1 hour of prone position (T1), before resupination (T2), and 6 hours after resupination (T3). With the same timing, the patient was asked to rate their comfort in each position, from 0 (lack of comfort) to 10 (optimal comfort). Delta P/F was defined as the difference between P/F at T3 and basal P/F at T0.
Outcomes
Statistical Analysis
Continuous data are reported as median and interquartile range (IQR); normal distribution of variables was tested using the Shapiro-Wilk test. Categorical variables were reported as absolute number and percentage. The Mann-Whitney test was used to compare continuous variables between groups, and chi-square test with continuity correction was used for categorical variables. The variables that were most significantly associated with a negative outcome on the univariate analysis were included in a stepwise logistic regression analysis, in order to identify independent predictors of patient outcome. Statistical analysis was performed using JASP (JASP Team) software.
Results
Study Population
Of the 88 patients included in the study, 70% were male; the median age was 66 years (IQR, 60-77). In most patients, the diagnosis of COVID-19 was derived from a positive SARS-CoV-2 nasopharyngeal swab. Six patients, however, maintained a negative swab at all determinations but had clinical and imaging features strongly suggesting COVID-19. No patients met the exclusion criteria. Most patients came from the ED (n = 58 [66%]) or general wards (n = 22 [25%]), while few were transferred from the ICU (n = 8 [9%]). The median length of stay in the SICU was 4 days (IQR, 2-7). An epidemiological link to affected persons or a known virus exposure was identifiable in 37 patients (42%).
Clinical, Laboratory, and Imaging Data
The clinical and anthropometric characteristics of patients are shown in Table 1. Hypertension and smoking habits were prevalent in our population, and the median Charlson Comorbidity Index was 3. Most patients experienced fever, dyspnea, and cough during the days before hospitalization.
Laboratory data showed a marked inflammatory milieu in all studied patients, both at baseline and after 24 and 72 hours. Lymphopenia was observed, along with a significant increase of lactate dehydrogenase (LDH), C-reactive protein (CPR), and D-dimer, and a mild increase of procalcitonin. N-terminal pro-brain natriuretic peptide (NT-proBNP) values were also increased, with normal troponin I values (Table 2).
Chest x-rays were obtained in almost all patients, while HRCT was performed in nearly half of patients. Complete bedside pulmonary ultrasonography data were available for 64 patients. Heterogeneous pulmonary alterations were found, regardless of the radiological technique, and multilobe infiltrates were the prevalent radiological pattern (73%) (Table 3). Seven patients (8%) were diagnosed with associated pulmonary embolism.
Medical Therapy
Most patients (89%) received hydroxychloroquine, whereas steroids were used in one-third of the population (36%). Immunomodulators (tocilizumab and ruxolitinib) were restricted to 12 patients (14%). Empirical antiviral therapy was introduced in the first 41 patients (47%). Enoxaparin was the default agent for thromboembolism prophylaxis, and 6 patients (7%) received 70% of the anticoagulating dose.
Oxygen and Ventilatory Therapy
Outcomes
A total of 28 patients (32%) had a negative outcome in the SICU: 8 patients (9%) died, having no clinical indication for higher-intensity care; 6 patients (7%) were transferred to general wards for palliation; and 14 patients (16%) needed an upgrade of cure intensity and were transferred to the ICU. Of these 14 patients, 9 died in the ICU. The total in-hospital mortality of COVID-19 patients, including patients transferred from the SICU to general wards in fair condition, was 27% (n = 24). Clinical, laboratory, and therapeutic characteristics between the 2 groups are shown in Table 4.
Patients who had a negative outcome were significantly older and had more comorbidities, as suggested by a significantly higher prevalence of diabetes and higher Charlson Comorbidity scores (reflecting the mortality risk based on age and comorbidities). The median MuLBSTA score, which estimates the 90-day mortality risk from viral pneumonia, was also higher in patients who had a negative outcome (9.33%). Symptom occurrence was not different in patients with a negative outcome (apart from cough, which was less frequent), but these patients underwent hospitalization earlier—since the appearance of their first COVID-19 symptoms—compared to patients who had a positive outcome. No difference was found in antihypertensive therapy with angiotensin-converting enzyme inhibitors or angiotensin-receptor blockers among outcome groups.
More pronounced laboratory abnormalities were found in patients who had a negative outcome, compared to patients who had a positive outcome: lower lymphocytes and higher C-reactive protein (CRP), procalcitonin, D-dimer, LDH, and NT-proBNP. We found no differences in the radiological distribution of pulmonary involvement in patients who had negative or positive outcomes, nor in the adopted medical treatment.
Data showed no difference in CPAP implementation in the 2 groups. However, prone positioning had been more frequently adopted in the group of patients who had a positive outcome, compared with patients who had a negative outcome. No differences of basal P/F were found in patients who had a negative or positive outcome, but the median P/F after 6 hours of prone position was significantly lower in patients who had a negative outcome. The delta P/F ratio did not differ in the 2 groups of patients.
Discussion
Role of Subintensive Units and Mortality
The novelty of our report is its attempt to investigate the specific group of COVID-19 patients admitted to a SICU. In Italy, SICUs receive acutely ill, spontaneously breathing patients who need (invasive) hemodynamic monitoring, vasoactive medication, renal replacement therapy, chest- tube placement, thrombolysis, and respiratory noninvasive support. The nurse-to-patient ratio is higher than for general wards (usually 1 nurse to every 4 or 5 patients), though lower than for ICUs. In northern Italy, a great number of COVID-19 patients have required this kind of high-intensity care during the pandemic: Noninvasive ventilation support had to be maintained for several days, pronation maneuvers required a high number of people 2 or 3 times a day, and strict monitoring had to be assured. The SICU setting allows patients to buy time as a bridge to progressive reduction of pulmonary involvement, sometimes preventing the need for intubation.
The high prevalence of negative outcomes in the SICU underlines the complexity of COVID-19 patients in this setting. In fact, published data about mortality for patients with severe COVID-19 pneumonia are similar to ours.22,23
Clinical, Laboratory, and Imaging Data
Our analysis confirmed a high rate of comorbidities in COVID-19 patients24 and their prognostic role with age.25,26 A marked inflammatory milieu was a negative prognostic indicator, and associated concomitant bacterial superinfection could have led to a worse prognosis (procalcitonin was associated with negative outcomes).27 The cardiovascular system was nevertheless stressed, as suggested by higher values of NT-proBNP in patients with negative outcomes, which could reflect sepsis-related systemic involvement.28
It is known that the pulmonary damage caused by SARS-CoV-2 has a dynamic radiological and clinical course, with early areas of subsegmental consolidation, and bilateral ground-glass opacities predominating later in the course of the disease.29 This could explain why in our population we found no specific radiological pattern leading to a worse outcome.
Medical Therapy
No specific pharmacological therapy was found to be associated with a positive outcome in our study, just like antiviral and immunomodulator therapies failed to demonstrate effectiveness in subsequent pandemic surges. The low statistical power of our study did not allow us to give insight into the effectiveness of steroids and heparin at any dosage.
PEEP Support and Prone Positioning
Continuous positive airway pressure was initiated in the majority of patients and maintained for several days. This was an absolute novelty, because we rarely had to keep patients in helmets for long. This was feasible thanks to the SICU’s high nurse-to-patient ratio and the possibility of providing monitored sedation. Patients who could no longer tolerate CPAP helmets or did not improve with CPAP support were evaluated with anesthetists for programming further management. No initial data on respiratory rate, level of hypoxemia, or oxygen support need (level of PEEP and F
Prone positioning during CPAP was implemented in 42% of our study population: P/F ratio amelioration after prone positioning was highly variable, ranging from very good P/F ratio improvements to few responses or no response. No significantly greater delta P/F ratio was seen after the first prone positioning cycle in patients who had a positive outcome, probably due to the small size of our population, but we observed a clear positive trend. Interestingly, patients showing a negative outcome had a lower percentage of long-term responses to prone positioning: 6 hours after resupination, they lost the benefit of prone positioning in terms of P/F ratio amelioration. Similarly, a greater number of patients tolerating prone positioning had a positive outcome. These data give insight on the possible benefits of prone positioning in a noninvasively supported cohort of patients, which has been mentioned in previous studies.30,31
Outcomes and Variables Associated With Negative Outcomes
After correction for age and sex, we found in multiple regression analysis that higher D-dimer and LDH values, lymphopenia, and history of diabetes were independently associated with a worse outcome. Although our results had low statistical significance, we consider the trend of the obtained odds ratios important from a clinical point of view. These results could lead to greater attention being placed on COVID-19 patients who present with these characteristics upon their arrival to the ED because they have increased risk of death or intensive care need. Clinicians should consider SICU admission for these patients in order to guarantee closer monitoring and possibly more aggressive ventilatory treatments, earlier pronation, or earlier transfer to the ICU.
Limitations
The major limitation to our study is undoubtedly its statistical power, due to its relatively low patient population. Particularly, the small number of patients who underwent pronation did not allow speculation about the efficacy of this technique, although preliminary data seem promising. However, ours is among the first studies regarding patients with COVID-19 admitted to a SICU, and these preliminary data truthfully describe the Italian, and perhaps international, experience with the first surge of the pandemic.
Conclusions
Our data highlight the primary role of the SICU in COVID-19 in adequately treating critically ill patients who have high care needs different from intubation, and who require noninvasive ventilation for prolonged times as well as frequent pronation cycles. This setting of care may represent a valid, reliable, and effective option for critically ill respiratory patients. History of diabetes, lymphopenia, and high D-dimer and LDH values are independently associated with negative outcomes, and patients presenting with these characteristics should be strictly monitored.
Acknowledgments: The authors thank the Informatica System S.R.L., as well as Allessando Mendolia for the pro bono creation of the ISCovidCollect data collecting app.
Corresponding author: Sara Abram, MD, via Coppino, 12100 Cuneo, Italy; [email protected].
Disclosures: None.
1. Plate JDJ, Leenen LPH, Houwert M, Hietbrink F. Utilisation of intermediate care units: a systematic review. Crit Care Res Pract. 2017;2017:8038460. doi:10.1155/2017/8038460
2. Antonelli M, Conti G, Esquinas A, et al. A multiple-center survey on the use in clinical practice of noninvasive ventilation as a first-line intervention for acute respiratory distress syndrome. Crit Care Med. 2007;35(1):18-25. doi:10.1097/01.CCM.0000251821.44259.F3
3. Patel BK, Wolfe KS, Pohlman AS, Hall JB, Kress JP. Effect of noninvasive ventilation delivered by helmet vs face mask on the rate of endotracheal intubation in patients with acute respiratory distress syndrome: a randomized clinical trial. JAMA. 2016;315(22):2435-2441. doi:10.1001/jama.2016.6338
4. Mas A, Masip J. Noninvasive ventilation in acute respiratory failure. Int J Chron Obstruct Pulmon Dis. 2014;9:837-852. doi:10.2147/COPD.S42664
5. Bellani G, Patroniti N, Greco M, Foti G, Pesenti A. The use of helmets to deliver non-invasive continuous positive airway pressure in hypoxemic acute respiratory failure. Minerva Anestesiol. 2008;74(11):651-656.
6. Lomoro P, Verde F, Zerboni F, et al. COVID-19 pneumonia manifestations at the admission on chest ultrasound, radiographs, and CT: single-center study and comprehensive radiologic literature review. Eur J Radiol Open. 2020;7:100231. doi:10.1016/j.ejro.2020.100231
7. Charlson ME, Pompei P, Ales KL, MacKenzie CR. A new method of classifying prognostic comorbidity in longitudinal studies: development and validation. J Chronic Dis. 1987;40:373-383. doi:10.1016/0021-9681(87)90171-8
8. Guo L, Wei D, Zhang X, et al. Clinical features predicting mortality risk in patients with viral pneumonia: the MuLBSTA score. Front Microbiol. 2019;10:2752. doi:10.3389/fmicb.2019.02752
9. Lombardy Section Italian Society Infectious and Tropical Disease. Vademecum for the treatment of people with COVID-19. Edition 2.0, 13 March 2020. Infez Med. 2020;28(2):143-152.
10. Wang M, Cao R, Zhang L, et al. Remdesivir and chloroquine effectively inhibit the recently emerged novel coronavirus (2019-nCoV) in vitro. Cell Res. 2020;30(3):269-271. doi:10.1038/s41422-020-0282-0
11. Cao B, Wang Y, Wen D, et al. A trial of lopinavir-ritonavir in adults hospitalized with severe Covid-19. N Engl J Med. 2020;382(19):1787-1799. doi:10.1056/NEJMoa2001282
12. Stone JH, Frigault MJ, Serling-Boyd NJ, et al; BACC Bay Tocilizumab Trial Investigators. Efficacy of tocilizumab in patients hospitalized with Covid-19. N Engl J Med. 2020;383(24):2333-2344. doi:10.1056/NEJMoa2028836
13. Shastri MD, Stewart N, Horne J, et al. In-vitro suppression of IL-6 and IL-8 release from human pulmonary epithelial cells by non-anticoagulant fraction of enoxaparin. PLoS One. 2015;10(5):e0126763. doi:10.1371/journal.pone.0126763
14. Milewska A, Zarebski M, Nowak P, Stozek K, Potempa J, Pyrc K. Human coronavirus NL63 utilizes heparin sulfate proteoglycans for attachment to target cells. J Virol. 2014;88(22):13221-13230. doi:10.1128/JVI.02078-14
15. Marietta M, Vandelli P, Mighali P, Vicini R, Coluccio V, D’Amico R; COVID-19 HD Study Group. Randomised controlled trial comparing efficacy and safety of high versus low low-molecular weight heparin dosages in hospitalized patients with severe COVID-19 pneumonia and coagulopathy not requiring invasive mechanical ventilation (COVID-19 HD): a structured summary of a study protocol. Trials. 2020;21(1):574. doi:10.1186/s13063-020-04475-z
16. Marshall JC, Cook DJ, Christou NV, Bernard GR, Sprung CL, Sibbald WJ. Multiple organ dysfunction score: a reliable descriptor of a complex clinical outcome. Crit Care Med. 1995;23(10):1638-1652. doi:10.1097/00003246-199510000-00007
17. Sinha P, Calfee CS. Phenotypes in acute respiratory distress syndrome: moving towards precision medicine. Curr Opin Crit Care. 2019;25(1):12-20. doi:10.1097/MCC.0000000000000571
18. Lucchini A, Giani M, Isgrò S, Rona R, Foti G. The “helmet bundle” in COVID-19 patients undergoing non-invasive ventilation. Intensive Crit Care Nurs. 2020;58:102859. doi:10.1016/j.iccn.2020.102859
19. Ding L, Wang L, Ma W, He H. Efficacy and safety of early prone positioning combined with HFNC or NIV in moderate to severe ARDS: a multi-center prospective cohort study. Crit Care. 2020;24(1):28. doi:10.1186/s13054-020-2738-5
20. Scaravilli V, Grasselli G, Castagna L, et al. Prone positioning improves oxygenation in spontaneously breathing nonintubated patients with hypoxemic acute respiratory failure: a retrospective study. J Crit Care. 2015;30(6):1390-1394. doi:10.1016/j.jcrc.2015.07.008
21. Caputo ND, Strayer RJ, Levitan R. Early self-proning in awake, non-intubated patients in the emergency department: a single ED’s experience during the COVID-19 pandemic. Acad Emerg Med. 2020;27(5):375-378. doi:10.1111/acem.13994
22. ARDS Definition Task Force; Ranieri VM, Rubenfeld GD, Thompson BT, et al. Acute respiratory distress syndrome: the Berlin Definition. JAMA. 2012;307(23):2526-2533. doi:10.1001/jama.2012.5669
23. Petrilli CM, Jones SA, Yang J, et al. Factors associated with hospital admission and critical illness among 5279 people with coronavirus disease 2019 in New York City: prospective cohort study. BMJ. 2020;369:m1966. doi:10.1136/bmj.m1966
24. Docherty AB, Harrison EM, Green CA, et al; ISARIC4C investigators. Features of 20 133 UK patients in hospital with Covid-19 using the ISARIC WHO Clinical Characterisation Protocol: prospective observational cohort study. BMJ. 2020;369:m1985. doi:10.1136/bmj.m1985
25. Richardson S, Hirsch JS, Narasimhan M, et al. Presenting characteristics, comorbidities, and outcomes among 5700 patients hospitalized with COVID-19 in the New York City area. JAMA. 2020;323(20):2052-2059. doi:10.1001/jama.2020.6775
26. Muniyappa R, Gubbi S. COVID-19 pandemic, coronaviruses, and diabetes mellitus. Am J Physiol Endocrinol Metab. 2020;318(5):E736-E741. doi:10.1152/ajpendo.00124.2020
27. Guo W, Li M, Dong Y, et al. Diabetes is a risk factor for the progression and prognosis of COVID-19. Diabetes Metab Res Rev. 2020:e3319. doi:10.1002/dmrr.3319
28. Chen N, Zhou M, Dong X, et al. Epidemiological and clinical characteristics of 99 cases of 2019 novel coronavirus pneumonia in Wuhan, China: a descriptive study. Lancet. 2020;395(10223):507-513. doi:10.1016/S0140-6736(20)30211-7
29. Kooraki S, Hosseiny M, Myers L, Gholamrezanezhad A. Coronavirus (COVID-19) outbreak: what the Department of Radiology should know. J Am Coll Radiol. 2020;17(4):447-451. doi:10.1016/j.jacr.2020.02.008
30. Coppo A, Bellani G, Winterton D, et al. Feasibility and physiological effects of prone positioning in non-intubated patients with acute respiratory failure due to COVID-19 (PRON-COVID): a prospective cohort study. Lancet Respir Med. 2020;8(8):765-774. doi:10.1016/S2213-2600(20)30268-X
31. Weatherald J, Solverson K, Zuege DJ, Loroff N, Fiest KM, Parhar KKS. Awake prone positioning for COVID-19 hypoxemic respiratory failure: a rapid review. J Crit Care. 2021;61:63-70. doi:10.1016/j.jcrc.2020.08.018
Structural Ableism: Defining Standards of Care Amid Crisis and Inequity
Equitable Standards for All Patients in a Crisis
Health care delivered during a pandemic instantiates medicine’s perspectives on the value of human life in clinical scenarios where resource allocation is limited. The COVID-19 pandemic has fostered dialogue and debate around the ethical principles that underly such resource allocation, which generally balance (1) utilitarian optimization of resources, (2) equality or equity in health access, (3) the instrumental value of individuals as agents in society, and (4) prioritizing the “worst off” in their natural history of disease.1,2 State legislatures and health systems have responded to the challeges posed by COVID-19 by considering both the scarcity of intensive care resources, such as mechanical ventilation and hemodialysis, and the clinical criteria to be used for determining which patients should receive said resources. These crisis guidelines have yielded several concerning themes vis-à-vis equitable distribution of health care resources, particularly when the disability status of patients is considered alongside life-expectancy or quality of life.3
Crisis standards of care (CSC) prioritize population-level health under a utilitarian paradigm, explicitly maximizing “life-years” within a population of patients rather than the life of any individual patient.4 Debated during initial COVID surges, these CSC guidelines have recently been enacted at the state level in several settings, including Alaska and Idaho.5 In a setting with scarce intensive care resources, balancing health equity in access to these resources against population-based survival metrics has been a challenge for commissions considering CSC.6,7 This need for balance has further promoted systemic views of “disability,” raising concern for structural “ableism” and highlighting the need for greater “ability awareness” in clinicians’ continued professional learning.
Structural Ableism: Defining Perspectives to Address Health Equity
Ableism has been defined as “a system that places value on people’s bodies and minds, based on societally constructed ideas of normalcy, intelligence, excellence, and productivity…[and] leads to people and society determining who is valuable and worthy based on their appearance and/or their ability to satisfactorily [re]produce, excel, and ‘behave.’”8 Regarding CSC, concerns about systemic bias in guideline design were raised early by disability advocacy groups during comment periods.9,10 More broadly, concerns about ableism sit alongside many deeply rooted societal perspectives of disabled individuals as pitiable or, conversely, heroic for having “overcome” their disability in some way. As a physician who sits in a manual wheelchair with paraplegia and mobility impairment, I have equally been subject to inappropriate bias and inappropriate praise for living in a wheelchair. I have also wondered, alongside my patients living with different levels of mobility or ability, why others often view us as “worse off.” Addressing directly whether disabled individuals are “worse off,” disability rights attorney and advocate Harriet McBryde Johnson has articulated a predominant sentiment among persons living with unique or different abilities:
Are we “worse off”? I don’t think so. Not in any meaningful way. There are too many variables. For those of us with congenital conditions, disability shapes all we are. Those disabled later in life adapt. We take constraints that no one would choose and build rich and satisfying lives within them. We enjoy pleasures other people enjoy and pleasures peculiarly our own. We have something the world needs.11
Many physician colleagues have common, invisible diseases such as diabetes and heart disease; fewer colleagues share conditions that are as visible as my spinal cord injury, as readily apparent to patients upon my entry to their hospital rooms. This simultaneous and inescapable identity as both patient and provider has afforded me wonderful doctor-patient interactions, particularly with those patients who appreciate how my patient experience impacts my ability to partially understand theirs. However, this simultaneous identity as doctor and patient also informed my personal and professional concerns regarding structural ableism as I considered scoring my own acutely ill hospital medicine patients with CSC triage scores in April 2020.
As a practicing hospital medicine physician, I have been emboldened by the efforts of my fellow clinicians amid COVID-19; their efforts have reaffirmed all the reasons I pursued a career in medicine. However, when I heard my clinical colleagues’ first explanation of the Massachusetts CSC guidelines in April 2020, I raised my hand to ask whether the “life-years” to which the guidelines referred were quality-adjusted. My concern regarding the implicit use of quality-adjusted life years (QALY) or disability-adjusted life years in clinical decision-making and implementation of these guidelines was validated when no clinical leaders could address this question directly. Sitting on the CSC committee for my hospital during this time was an honor. However, it was disconcerting to hear many clinicians’ unease when estimating mean survival for common chronic diseases, ranging from end-stage renal disease to advanced heart failure. If my expert colleagues, clinical specialists in kidney and heart disease, could not confidently apply mean survival estimates to multimorbid hospital patients, then idiosyncratic clinical judgment was sure to have a heavy hand in any calculation of “life-years.” Thus, my primary concern was that clinicians using triage heuristics would be subject to bias, regardless of their intention, and negatively adjust for the quality of a disabled life in their CSC triage scoring. My secondary concern was that the CSC guidelines themselves included systemic bias against disabled individuals.
According to CSC schema, triage scores index heavily on Sequential Organ Failure Assessment (SOFA) scores to define short-term survival; SOFA scores are partially driven by the Glasgow Coma Scale (GCS). Following professional and public comment periods, CSC guidelines in Massachusetts were revised to, among other critical points of revision, change prognostic estimation via “life years” in favor of generic estimation of short-term survival (Table). I wondered, if I presented to an emergency department with severe COVID-19 and was scored with the GCS for the purpose of making a CSC ventilator triage decision, how would my complete paraplegia and lower-extremity motor impairment be accounted for by a clinician assessing “best motor response” in the GCS? The purpose of these scores is to act algorithmically, to guide clinicians whose cognitive load and time limitations may not allow for adjustment of these algorithms based on the individual patient in front of them. Individualization of clinical decisions is part of medicine’s art, but is difficult in the best of times and no easier during a crisis in care delivery. As CSC triage scores were amended and addended throughout 2020, I returned to the COVID wards, time and again wondering, “What have we learned about systemic bias and health inequity in the CSC process and the pandemic broadly, with specific regard to disability?”
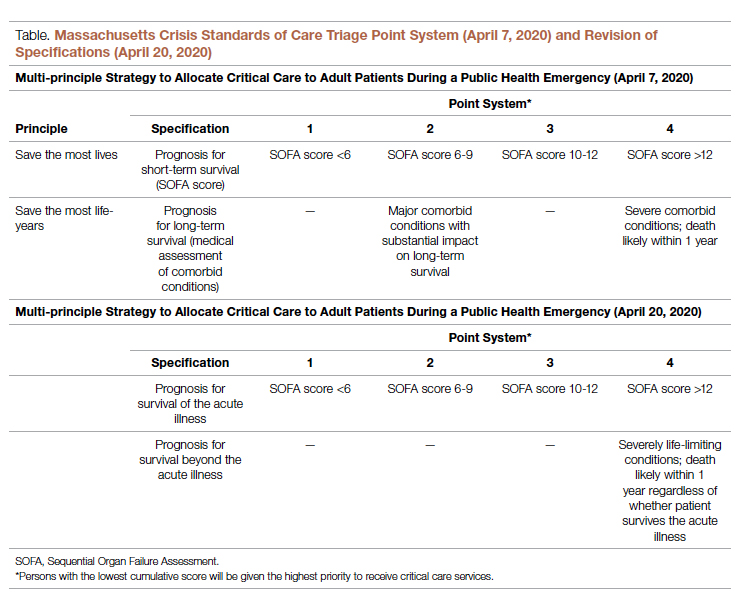
Ability Awareness: Room for Our Improvement
Unfortunately, there is reason to believe that clinical judgment is impaired by structural ableism. In seminal work on this topic, Gerhart et al12 demonstrated that clinicians considered spinal cord injury (SCI) survivors to have low self-perceptions of worthiness, overall negative attitudes, and low self-esteem as compared to able-bodied individuals. However, surveyed SCI survivors generally had similar self-perceptions of worth and positivity as compared to ”able-bodied” clinicians.12 For providers who care for persons with disabilities, the majority (82.4%) have rated their disabled patients’ quality of life as worse.13 It is no wonder that patients with disabilities are more likely to feel that their doctor-patient relationship is impacted by lack of understanding, negative sentiment, or simple lack of listening.14 Generally, this poor doctor-patient relationship with disabled patients is exacerbated by poor exposure of medical trainees to disability education; only 34.2% of internal medicine residents recall any form of disability education in medical school, while only 52% of medical school deans report having disability educational content in their curricula.15,16 There is a similar lack of disability representation in the population of medical trainees themselves. While approximately 20% of the American population lives with a disability, less than 2% of American medical students have a disability.17-19
While representation of disabled populations in medical practice remains poor, disabled patients are generally less likely to receive age-appropriate prevention, appropriate access to care, and equal access to treatment.20-22 “Diagnostic overshadowing” refers to clinicians’ attribution of nonspecific signs or symptoms to a patient’s chronic disability as opposed to acute illness.23 This phenomenon has led to higher rates of preventable malignancy in disabled patients and misattribution of common somatic symptoms to intellectual disability.24,25 With this disparity in place as status quo for health care delivery to disabled populations, it is no surprise that certain portions of the disabled population have accounted for disproportionate mortality due to COVID-19.26,27Disability advocates have called for “nothing about us without us,” a phrase associated with the United Nations Convention on the Rights of Persons with Disabilities. Understanding the profound neurodiversity among several forms of sensory and cognitive disabilities, as well as the functional difference between cognitive disabilities, mobility impairment, and inability to meet one’s instrumental activities of daily living independently, others have proposed a unique approach to certain disabled populations in COVID care.28 My own perspective is that definite progress may require a more general understanding of the prevalence of disability by clinicians, both via medical training and by directly addressing health equity for disabled populations in such calculations as the CSC. Systemic ableism is apparent in our most common clinical scoring systems, ranging from the GCS and Functional Assessment Staging Table to the Eastern Cooperative Oncology Group and Karnofsky Performance Status scales. I have reexamined these scoring systems in my own understanding given their general equation of ambulation with ability or normalcy. As a doctor in a manual wheelchair who values greatly my personal quality of life and professional contribution to patient care, I worry that these scoring systems inherently discount my own equitable access to care. Individualization of patients’ particular abilities in the context of these scales must occur alongside evidence-based, guideline-directed management via these scoring systems.
Conclusion: Future Orientation
Updated CSC guidelines have accounted for the unique considerations of disabled patients by effectively caveating their scoring algorithms, directing clinicians via disclaimers to uniquely consider their disabled patients in clinical judgement. This is a first step, but it is also one that erodes the value of algorithms, which generally obviate more deliberative thinking and individualization. For our patients who lack certain abilities, as CSC continue to be activated in several states, we have an opportunity to pursue more inherently equitable solutions before further suffering accrues.29 By way of example, adaptations to scoring systems that leverage QALYs for value-based drug pricing indices have been proposed by organizations like the Institute for Clinical and Economic Review, which proposed the Equal-Value-of Life-Years-Gained framework to inform QALY-based arbitration of drug pricing.30 This is not a perfect rubric but instead represents an attempt to balance consideration of drugs, as has been done with ventilators during the pandemic, as a scare and expensive resource while addressing the just concerns of advocacy groups in structural ableism.
Resource stewardship during a crisis should not discount those states of human life that are perceived to be less desirable, particularly if they are not experienced as less desirable but are experienced uniquely. Instead, we should consider equitably measuring our intervention to match a patient’s needs, as we would dose-adjust a medication for renal function or consider minimally invasive procedures for multimorbid patients. COVID-19 has reflected our profession’s ethical adaptation during crisis as resources have become scarce; there is no better time to define solutions for health equity. We should now be concerned equally by the influence our personal biases have on our clinical practice and by the way in which these crisis standards will influence patients’ perception of and trust in their care providers during periods of perceived plentiful resources in the future. Health care resources are always limited, allocated according to societal values; if we value health equity for people of all abilities, then we will consider these abilities equitably as we pursue new standards for health care delivery.
Corresponding author: Gregory D. Snyder, MD, MBA, 2014 Washington Street, Newton, MA 02462; [email protected].
Disclosures: None.
1. Emanuel EJ, Persad G, Upshur R, et al. Fair Allocation of scarce medical resources in the time of Covid-19. N Engl J Med. 2020;382(21):2049-2055. doi:10.1056/NEJMsb2005114
2. Savulescu J, Persson I, Wilkinson D. Utilitarianism and the pandemic. Bioethics. 2020;34(6):620-632. doi:10.1111/bioe.12771
3. Mello MM, Persad G, White DB. Respecting disability rights - toward improved crisis standards of care. N Engl J Med. 2020;383(5):e26. doi: 10.1056/NEJMp2011997
4. The Commonwealth of Massachusetts Executive Office of Health and Human Services Department of Public Health. Crisis Standards of Care Planning Guidance for the COVID-19 Pandemic. April 7, 2020. https://d279m997dpfwgl.cloudfront.net/wp/2020/04/CSC_April-7_2020.pdf
5. Knowles H. Hospitals overwhelmed by covid are turning to ‘crisis standards of care.’ What does that mean? The Washington Post. September 21, 2021. Accessed January 24, 2022. https://www.washingtonpost.com/health/2021/09/22/crisis-standards-of-care/
6. Hick JL, Hanfling D, Wynia MK, Toner E. Crisis standards of care and COVID-19: What did we learn? How do we ensure equity? What should we do? NAM Perspect. 2021;2021:10.31478/202108e. doi:10.31478/202108e
7. Cleveland Manchanda EC, Sanky C, Appel JM. Crisis standards of care in the USA: a systematic review and implications for equity amidst COVID-19. J Racial Ethn Health Disparities. 2021;8(4):824-836. doi:10.1007/s40615-020-00840-5
8. Cleveland Manchanda EC, Sanky C, Appel JM. Crisis standards of care in the USA: a systematic review and implications for equity amidst COVID-19. J Racial Ethn Health Disparities. 2021;8(4):824-836. doi:10.1007/s40615-020-00840-5
9. Kukla E. My life is more ‘disposable’ during this pandemic. The New York Times. March 19, 2020. Accessed January 24, 2022. https://www.nytimes.com/2020/03/19/opinion/coronavirus-disabled-health-care.html
10. CPR and Coalition Partners Secure Important Changes in Massachusetts’ Crisis Standards of Care. Center for Public Representation. December 1, 2020. Accessed January 24, 2022. https://www.centerforpublicrep.org/news/cpr-and-coalition-partners-secure-important-changes-in-massachusetts-crisis-standards-of-care/
11. Johnson HM. Unspeakable conversations. The New York Times. February 16, 2003. Accessed January 24, 2022. https://www.nytimes.com/2003/02/16/magazine/unspeakable-conversations.html
12. Gerhart KA, Koziol-McLain J, Lowenstein SR, Whiteneck GG. Quality of life following spinal cord injury: knowledge and attitudes of emergency care providers. Ann Emerg Med. 1994;23(4):807-812. doi:10.1016/s0196-0644(94)70318-3
13. Iezzoni LI, Rao SR, Ressalam J, et al. Physicians’ perceptions of people with disability and their health care. Health Aff (Millwood). 2021;40(2):297-306. doi:10.1377/hlthaff.2020.01452
14. Smith DL. Disparities in patient-physician communication for persons with a disability from the 2006 Medical Expenditure Panel Survey (MEPS). Disabil Health J. 2009;2(4):206-215. doi:10.1016/j.dhjo.2009.06.002
15. Stillman MD, Ankam N, Mallow M, Capron M, Williams S. A survey of internal and family medicine residents: Assessment of disability-specific education and knowledge. Disabil Health J. 2021;14(2):101011. doi:10.1016/j.dhjo.2020.101011
16. Seidel E, Crowe S. The state of disability awareness in American medical schools. Am J Phys Med Rehabil. 2017;96(9):673-676. doi:10.1097/PHM.0000000000000719
17. Okoro CA, Hollis ND, Cyrus AC, Griffin-Blake S. Prevalence of disabilities and health care access by disability status and type among adults - United States, 2016. MMWR Morb Mortal Wkly Rep. 2018;67(32):882-887. doi:10.15585/mmwr.mm6732a3
18. Peacock G, Iezzoni LI, Harkin TR. Health care for Americans with disabilities--25 years after the ADA. N Engl J Med. 2015;373(10):892-893. doi:10.1056/NEJMp1508854
19. DeLisa JA, Thomas P. Physicians with disabilities and the physician workforce: a need to reassess our policies. Am J Phys Med Rehabil. 2005;84(1):5-11. doi:10.1097/01.phm.0000153323.28396.de
20. Disability and Health. Healthy People 2020. Accessed January 24, 2022. https://www.healthypeople.gov/2020/topics-objectives/topic/disability-and-health
21. Lagu T, Hannon NS, Rothberg MB, et al. Access to subspecialty care for patients with mobility impairment: a survey. Ann Intern Med. 2013;158(6):441-446. doi: 10.7326/0003-4819-158-6-201303190-00003
22. McCarthy EP, Ngo LH, Roetzheim RG, et al. Disparities in breast cancer treatment and survival for women with disabilities. Ann Intern Med. 2006;145(9):637-645. doi: 10.7326/0003-4819-145-9-200611070-00005
23. Javaid A, Nakata V, Michael D. Diagnostic overshadowing in learning disability: think beyond the disability. Prog Neurol Psychiatry. 2019;23:8-10.
24. Iezzoni LI, Rao SR, Agaronnik ND, El-Jawahri A. Cross-sectional analysis of the associations between four common cancers and disability. J Natl Compr Canc Netw. 2020;18(8):1031-1044. doi:10.6004/jnccn.2020.7551
25. Sanders JS, Keller S, Aravamuthan BR. Caring for individuals with intellectual and developmental disabilities in the COVID-19 crisis. Neurol Clin Pract. 2021;11(2):e174-e178. doi:10.1212/CPJ.0000000000000886
26. Landes SD, Turk MA, Formica MK, McDonald KE, Stevens JD. COVID-19 outcomes among people with intellectual and developmental disability living in residential group homes in New York State. Disabil Health J. 2020;13(4):100969. doi:10.1016/j.dhjo.2020.100969
27. Gleason J, Ross W, Fossi A, Blonksy H, Tobias J, Stephens M. The devastating impact of Covid-19 on individuals with intellectual disabilities in the United States. NEJM Catalyst. 2021.doi.org/10.1056/CAT.21.0051
28. Nankervis K, Chan J. Applying the CRPD to people with intellectual and developmental disability with behaviors of concern during COVID-19. J Policy Pract Intellect Disabil. 2021:10.1111/jppi.12374. doi:10.1111/jppi.12374
29. Alaska Department of Health and Social Services, Division of Public Health, Rural and Community Health Systems. Patient care strategies for scarce resource situations. Version 1. August 2021. Accessed November 11, 2021, https://dhss.alaska.gov/dph/Epi/id/SiteAssets/Pages/HumanCoV/SOA_DHSS_CrisisStandardsOfCare.pdf
30. Cost-effectiveness, the QALY, and the evlyg. ICER. May 21, 2021. Accessed January 24, 2022. https://icer.org/our-approach/methods-process/cost-effectiveness-the-qaly-and-the-evlyg/
Equitable Standards for All Patients in a Crisis
Health care delivered during a pandemic instantiates medicine’s perspectives on the value of human life in clinical scenarios where resource allocation is limited. The COVID-19 pandemic has fostered dialogue and debate around the ethical principles that underly such resource allocation, which generally balance (1) utilitarian optimization of resources, (2) equality or equity in health access, (3) the instrumental value of individuals as agents in society, and (4) prioritizing the “worst off” in their natural history of disease.1,2 State legislatures and health systems have responded to the challeges posed by COVID-19 by considering both the scarcity of intensive care resources, such as mechanical ventilation and hemodialysis, and the clinical criteria to be used for determining which patients should receive said resources. These crisis guidelines have yielded several concerning themes vis-à-vis equitable distribution of health care resources, particularly when the disability status of patients is considered alongside life-expectancy or quality of life.3
Crisis standards of care (CSC) prioritize population-level health under a utilitarian paradigm, explicitly maximizing “life-years” within a population of patients rather than the life of any individual patient.4 Debated during initial COVID surges, these CSC guidelines have recently been enacted at the state level in several settings, including Alaska and Idaho.5 In a setting with scarce intensive care resources, balancing health equity in access to these resources against population-based survival metrics has been a challenge for commissions considering CSC.6,7 This need for balance has further promoted systemic views of “disability,” raising concern for structural “ableism” and highlighting the need for greater “ability awareness” in clinicians’ continued professional learning.
Structural Ableism: Defining Perspectives to Address Health Equity
Ableism has been defined as “a system that places value on people’s bodies and minds, based on societally constructed ideas of normalcy, intelligence, excellence, and productivity…[and] leads to people and society determining who is valuable and worthy based on their appearance and/or their ability to satisfactorily [re]produce, excel, and ‘behave.’”8 Regarding CSC, concerns about systemic bias in guideline design were raised early by disability advocacy groups during comment periods.9,10 More broadly, concerns about ableism sit alongside many deeply rooted societal perspectives of disabled individuals as pitiable or, conversely, heroic for having “overcome” their disability in some way. As a physician who sits in a manual wheelchair with paraplegia and mobility impairment, I have equally been subject to inappropriate bias and inappropriate praise for living in a wheelchair. I have also wondered, alongside my patients living with different levels of mobility or ability, why others often view us as “worse off.” Addressing directly whether disabled individuals are “worse off,” disability rights attorney and advocate Harriet McBryde Johnson has articulated a predominant sentiment among persons living with unique or different abilities:
Are we “worse off”? I don’t think so. Not in any meaningful way. There are too many variables. For those of us with congenital conditions, disability shapes all we are. Those disabled later in life adapt. We take constraints that no one would choose and build rich and satisfying lives within them. We enjoy pleasures other people enjoy and pleasures peculiarly our own. We have something the world needs.11
Many physician colleagues have common, invisible diseases such as diabetes and heart disease; fewer colleagues share conditions that are as visible as my spinal cord injury, as readily apparent to patients upon my entry to their hospital rooms. This simultaneous and inescapable identity as both patient and provider has afforded me wonderful doctor-patient interactions, particularly with those patients who appreciate how my patient experience impacts my ability to partially understand theirs. However, this simultaneous identity as doctor and patient also informed my personal and professional concerns regarding structural ableism as I considered scoring my own acutely ill hospital medicine patients with CSC triage scores in April 2020.
As a practicing hospital medicine physician, I have been emboldened by the efforts of my fellow clinicians amid COVID-19; their efforts have reaffirmed all the reasons I pursued a career in medicine. However, when I heard my clinical colleagues’ first explanation of the Massachusetts CSC guidelines in April 2020, I raised my hand to ask whether the “life-years” to which the guidelines referred were quality-adjusted. My concern regarding the implicit use of quality-adjusted life years (QALY) or disability-adjusted life years in clinical decision-making and implementation of these guidelines was validated when no clinical leaders could address this question directly. Sitting on the CSC committee for my hospital during this time was an honor. However, it was disconcerting to hear many clinicians’ unease when estimating mean survival for common chronic diseases, ranging from end-stage renal disease to advanced heart failure. If my expert colleagues, clinical specialists in kidney and heart disease, could not confidently apply mean survival estimates to multimorbid hospital patients, then idiosyncratic clinical judgment was sure to have a heavy hand in any calculation of “life-years.” Thus, my primary concern was that clinicians using triage heuristics would be subject to bias, regardless of their intention, and negatively adjust for the quality of a disabled life in their CSC triage scoring. My secondary concern was that the CSC guidelines themselves included systemic bias against disabled individuals.
According to CSC schema, triage scores index heavily on Sequential Organ Failure Assessment (SOFA) scores to define short-term survival; SOFA scores are partially driven by the Glasgow Coma Scale (GCS). Following professional and public comment periods, CSC guidelines in Massachusetts were revised to, among other critical points of revision, change prognostic estimation via “life years” in favor of generic estimation of short-term survival (Table). I wondered, if I presented to an emergency department with severe COVID-19 and was scored with the GCS for the purpose of making a CSC ventilator triage decision, how would my complete paraplegia and lower-extremity motor impairment be accounted for by a clinician assessing “best motor response” in the GCS? The purpose of these scores is to act algorithmically, to guide clinicians whose cognitive load and time limitations may not allow for adjustment of these algorithms based on the individual patient in front of them. Individualization of clinical decisions is part of medicine’s art, but is difficult in the best of times and no easier during a crisis in care delivery. As CSC triage scores were amended and addended throughout 2020, I returned to the COVID wards, time and again wondering, “What have we learned about systemic bias and health inequity in the CSC process and the pandemic broadly, with specific regard to disability?”
Ability Awareness: Room for Our Improvement
Unfortunately, there is reason to believe that clinical judgment is impaired by structural ableism. In seminal work on this topic, Gerhart et al12 demonstrated that clinicians considered spinal cord injury (SCI) survivors to have low self-perceptions of worthiness, overall negative attitudes, and low self-esteem as compared to able-bodied individuals. However, surveyed SCI survivors generally had similar self-perceptions of worth and positivity as compared to ”able-bodied” clinicians.12 For providers who care for persons with disabilities, the majority (82.4%) have rated their disabled patients’ quality of life as worse.13 It is no wonder that patients with disabilities are more likely to feel that their doctor-patient relationship is impacted by lack of understanding, negative sentiment, or simple lack of listening.14 Generally, this poor doctor-patient relationship with disabled patients is exacerbated by poor exposure of medical trainees to disability education; only 34.2% of internal medicine residents recall any form of disability education in medical school, while only 52% of medical school deans report having disability educational content in their curricula.15,16 There is a similar lack of disability representation in the population of medical trainees themselves. While approximately 20% of the American population lives with a disability, less than 2% of American medical students have a disability.17-19
While representation of disabled populations in medical practice remains poor, disabled patients are generally less likely to receive age-appropriate prevention, appropriate access to care, and equal access to treatment.20-22 “Diagnostic overshadowing” refers to clinicians’ attribution of nonspecific signs or symptoms to a patient’s chronic disability as opposed to acute illness.23 This phenomenon has led to higher rates of preventable malignancy in disabled patients and misattribution of common somatic symptoms to intellectual disability.24,25 With this disparity in place as status quo for health care delivery to disabled populations, it is no surprise that certain portions of the disabled population have accounted for disproportionate mortality due to COVID-19.26,27Disability advocates have called for “nothing about us without us,” a phrase associated with the United Nations Convention on the Rights of Persons with Disabilities. Understanding the profound neurodiversity among several forms of sensory and cognitive disabilities, as well as the functional difference between cognitive disabilities, mobility impairment, and inability to meet one’s instrumental activities of daily living independently, others have proposed a unique approach to certain disabled populations in COVID care.28 My own perspective is that definite progress may require a more general understanding of the prevalence of disability by clinicians, both via medical training and by directly addressing health equity for disabled populations in such calculations as the CSC. Systemic ableism is apparent in our most common clinical scoring systems, ranging from the GCS and Functional Assessment Staging Table to the Eastern Cooperative Oncology Group and Karnofsky Performance Status scales. I have reexamined these scoring systems in my own understanding given their general equation of ambulation with ability or normalcy. As a doctor in a manual wheelchair who values greatly my personal quality of life and professional contribution to patient care, I worry that these scoring systems inherently discount my own equitable access to care. Individualization of patients’ particular abilities in the context of these scales must occur alongside evidence-based, guideline-directed management via these scoring systems.
Conclusion: Future Orientation
Updated CSC guidelines have accounted for the unique considerations of disabled patients by effectively caveating their scoring algorithms, directing clinicians via disclaimers to uniquely consider their disabled patients in clinical judgement. This is a first step, but it is also one that erodes the value of algorithms, which generally obviate more deliberative thinking and individualization. For our patients who lack certain abilities, as CSC continue to be activated in several states, we have an opportunity to pursue more inherently equitable solutions before further suffering accrues.29 By way of example, adaptations to scoring systems that leverage QALYs for value-based drug pricing indices have been proposed by organizations like the Institute for Clinical and Economic Review, which proposed the Equal-Value-of Life-Years-Gained framework to inform QALY-based arbitration of drug pricing.30 This is not a perfect rubric but instead represents an attempt to balance consideration of drugs, as has been done with ventilators during the pandemic, as a scare and expensive resource while addressing the just concerns of advocacy groups in structural ableism.
Resource stewardship during a crisis should not discount those states of human life that are perceived to be less desirable, particularly if they are not experienced as less desirable but are experienced uniquely. Instead, we should consider equitably measuring our intervention to match a patient’s needs, as we would dose-adjust a medication for renal function or consider minimally invasive procedures for multimorbid patients. COVID-19 has reflected our profession’s ethical adaptation during crisis as resources have become scarce; there is no better time to define solutions for health equity. We should now be concerned equally by the influence our personal biases have on our clinical practice and by the way in which these crisis standards will influence patients’ perception of and trust in their care providers during periods of perceived plentiful resources in the future. Health care resources are always limited, allocated according to societal values; if we value health equity for people of all abilities, then we will consider these abilities equitably as we pursue new standards for health care delivery.
Corresponding author: Gregory D. Snyder, MD, MBA, 2014 Washington Street, Newton, MA 02462; [email protected].
Disclosures: None.
1. Emanuel EJ, Persad G, Upshur R, et al. Fair Allocation of scarce medical resources in the time of Covid-19. N Engl J Med. 2020;382(21):2049-2055. doi:10.1056/NEJMsb2005114
2. Savulescu J, Persson I, Wilkinson D. Utilitarianism and the pandemic. Bioethics. 2020;34(6):620-632. doi:10.1111/bioe.12771
3. Mello MM, Persad G, White DB. Respecting disability rights - toward improved crisis standards of care. N Engl J Med. 2020;383(5):e26. doi: 10.1056/NEJMp2011997
4. The Commonwealth of Massachusetts Executive Office of Health and Human Services Department of Public Health. Crisis Standards of Care Planning Guidance for the COVID-19 Pandemic. April 7, 2020. https://d279m997dpfwgl.cloudfront.net/wp/2020/04/CSC_April-7_2020.pdf
5. Knowles H. Hospitals overwhelmed by covid are turning to ‘crisis standards of care.’ What does that mean? The Washington Post. September 21, 2021. Accessed January 24, 2022. https://www.washingtonpost.com/health/2021/09/22/crisis-standards-of-care/
6. Hick JL, Hanfling D, Wynia MK, Toner E. Crisis standards of care and COVID-19: What did we learn? How do we ensure equity? What should we do? NAM Perspect. 2021;2021:10.31478/202108e. doi:10.31478/202108e
7. Cleveland Manchanda EC, Sanky C, Appel JM. Crisis standards of care in the USA: a systematic review and implications for equity amidst COVID-19. J Racial Ethn Health Disparities. 2021;8(4):824-836. doi:10.1007/s40615-020-00840-5
8. Cleveland Manchanda EC, Sanky C, Appel JM. Crisis standards of care in the USA: a systematic review and implications for equity amidst COVID-19. J Racial Ethn Health Disparities. 2021;8(4):824-836. doi:10.1007/s40615-020-00840-5
9. Kukla E. My life is more ‘disposable’ during this pandemic. The New York Times. March 19, 2020. Accessed January 24, 2022. https://www.nytimes.com/2020/03/19/opinion/coronavirus-disabled-health-care.html
10. CPR and Coalition Partners Secure Important Changes in Massachusetts’ Crisis Standards of Care. Center for Public Representation. December 1, 2020. Accessed January 24, 2022. https://www.centerforpublicrep.org/news/cpr-and-coalition-partners-secure-important-changes-in-massachusetts-crisis-standards-of-care/
11. Johnson HM. Unspeakable conversations. The New York Times. February 16, 2003. Accessed January 24, 2022. https://www.nytimes.com/2003/02/16/magazine/unspeakable-conversations.html
12. Gerhart KA, Koziol-McLain J, Lowenstein SR, Whiteneck GG. Quality of life following spinal cord injury: knowledge and attitudes of emergency care providers. Ann Emerg Med. 1994;23(4):807-812. doi:10.1016/s0196-0644(94)70318-3
13. Iezzoni LI, Rao SR, Ressalam J, et al. Physicians’ perceptions of people with disability and their health care. Health Aff (Millwood). 2021;40(2):297-306. doi:10.1377/hlthaff.2020.01452
14. Smith DL. Disparities in patient-physician communication for persons with a disability from the 2006 Medical Expenditure Panel Survey (MEPS). Disabil Health J. 2009;2(4):206-215. doi:10.1016/j.dhjo.2009.06.002
15. Stillman MD, Ankam N, Mallow M, Capron M, Williams S. A survey of internal and family medicine residents: Assessment of disability-specific education and knowledge. Disabil Health J. 2021;14(2):101011. doi:10.1016/j.dhjo.2020.101011
16. Seidel E, Crowe S. The state of disability awareness in American medical schools. Am J Phys Med Rehabil. 2017;96(9):673-676. doi:10.1097/PHM.0000000000000719
17. Okoro CA, Hollis ND, Cyrus AC, Griffin-Blake S. Prevalence of disabilities and health care access by disability status and type among adults - United States, 2016. MMWR Morb Mortal Wkly Rep. 2018;67(32):882-887. doi:10.15585/mmwr.mm6732a3
18. Peacock G, Iezzoni LI, Harkin TR. Health care for Americans with disabilities--25 years after the ADA. N Engl J Med. 2015;373(10):892-893. doi:10.1056/NEJMp1508854
19. DeLisa JA, Thomas P. Physicians with disabilities and the physician workforce: a need to reassess our policies. Am J Phys Med Rehabil. 2005;84(1):5-11. doi:10.1097/01.phm.0000153323.28396.de
20. Disability and Health. Healthy People 2020. Accessed January 24, 2022. https://www.healthypeople.gov/2020/topics-objectives/topic/disability-and-health
21. Lagu T, Hannon NS, Rothberg MB, et al. Access to subspecialty care for patients with mobility impairment: a survey. Ann Intern Med. 2013;158(6):441-446. doi: 10.7326/0003-4819-158-6-201303190-00003
22. McCarthy EP, Ngo LH, Roetzheim RG, et al. Disparities in breast cancer treatment and survival for women with disabilities. Ann Intern Med. 2006;145(9):637-645. doi: 10.7326/0003-4819-145-9-200611070-00005
23. Javaid A, Nakata V, Michael D. Diagnostic overshadowing in learning disability: think beyond the disability. Prog Neurol Psychiatry. 2019;23:8-10.
24. Iezzoni LI, Rao SR, Agaronnik ND, El-Jawahri A. Cross-sectional analysis of the associations between four common cancers and disability. J Natl Compr Canc Netw. 2020;18(8):1031-1044. doi:10.6004/jnccn.2020.7551
25. Sanders JS, Keller S, Aravamuthan BR. Caring for individuals with intellectual and developmental disabilities in the COVID-19 crisis. Neurol Clin Pract. 2021;11(2):e174-e178. doi:10.1212/CPJ.0000000000000886
26. Landes SD, Turk MA, Formica MK, McDonald KE, Stevens JD. COVID-19 outcomes among people with intellectual and developmental disability living in residential group homes in New York State. Disabil Health J. 2020;13(4):100969. doi:10.1016/j.dhjo.2020.100969
27. Gleason J, Ross W, Fossi A, Blonksy H, Tobias J, Stephens M. The devastating impact of Covid-19 on individuals with intellectual disabilities in the United States. NEJM Catalyst. 2021.doi.org/10.1056/CAT.21.0051
28. Nankervis K, Chan J. Applying the CRPD to people with intellectual and developmental disability with behaviors of concern during COVID-19. J Policy Pract Intellect Disabil. 2021:10.1111/jppi.12374. doi:10.1111/jppi.12374
29. Alaska Department of Health and Social Services, Division of Public Health, Rural and Community Health Systems. Patient care strategies for scarce resource situations. Version 1. August 2021. Accessed November 11, 2021, https://dhss.alaska.gov/dph/Epi/id/SiteAssets/Pages/HumanCoV/SOA_DHSS_CrisisStandardsOfCare.pdf
30. Cost-effectiveness, the QALY, and the evlyg. ICER. May 21, 2021. Accessed January 24, 2022. https://icer.org/our-approach/methods-process/cost-effectiveness-the-qaly-and-the-evlyg/
Children and COVID-19: The Omicron tide may have turned
The Omicron-fueled surge appears to have peaked as new cases of COVID-19 in U.S. children dropped for the first time since late November 2021, dipping back below the 1 million mark for the week, according to the American Academy of Pediatrics and the Children’s Hospital Association.
The total number of cases in children was up to 11.4 million as of Jan. 27, with children representing 18.6% of all cases reported since the pandemic started, the AAP and CHA said in their weekly COVID-19 report.
As children remain the largest reservoir of unvaccinated Americans, their share of the COVID case load continues to rise quickly. Just 2 weeks ago, children made up 17.8% of the cumulative number of cases, and at the end of December it was 17.4%, the AAP/CHA data show.
The latest data from the Centers for Disease Control and Prevention show that trends for admissions and emergency department visits reflect the decline in new cases. New admissions of children aged 0-17 years with diagnosed COVID-19 peaked at 1.25 per 100,000 population on Jan. 15 and were down to 0.95 per 100,000 on Jan. 29.
Daily ED visits for COVID-19, measured as a percentage of all ED visits, peaked at 13.9% on Jan. 14 for children aged 0-11 years and on Jan. 9 for both 12- to 15-year-olds (14.1%) and 16- to 17-year-olds (13.8%). By Jan. 28, the rates were down to 5.6% (0-11), 3.1% (12-15), and 3.3% (16-17), the CDC reported based on data from the National Syndromic Surveillance Program.
Trends involving more severe illness support observations that Omicron is milder than earlier variants. Children hospitalized with COVID-19 were less likely to be admitted to an intensive care unit over the last 2 months than during the Delta surge in the late summer and early fall or during the winter of 2020-2021, the CDC said based on data from the BD Insights Research Database, which includes 229,000 patients and 267 hospitals.
Those data show that the highest monthly rate occurred early on, in May of 2020, when 27.8% of children with COVID-19 ended up in the ICU. The rates for December 2021 and January 2022, by comparison, were 11.0% and 11.3%, respectively, the CDC said.
Vaccination lags in younger children
As reports surface about Pfizer-BioNTech filing an emergency use request to extend vaccine coverage to children aged 6 months to 5 years, it does appear that prevention efforts could use the proverbial shot in the arm.
As of Jan. 30, just 30.4% of children aged 5-11 have received at least one dose of the COVID-19 vaccine, and only 21.6% are fully vaccinated. At a comparable point in their timeline – just short of 3 months after approval – the respective numbers for children aged 12-15 were about 42% and 31%, CDC data show.
In the younger group, both initial doses and completions rose slightly in the first 2 weeks of January but then dropped in each of the last 2 weeks. There was a more significant surge in interest among the 12- to 17-year-olds in mid-January, but the last full week of the month brought declines of more than 50% in both measures, according to a separate AAP analysis.
Omicron subvariant 1.5 times more contagious than Omicron
according to CNBC.
The Statens Serum Institut, which monitors infectious diseases in Denmark, said that BA.2 is more contagious, but it doesn’t appear to increase hospitalizations or reduce how well the vaccine works.
BA.2 overtook BA.1 as the primary variant in Denmark within a few weeks, Troels Lillebaek, director of the institute, told CNBC. The subvariant has five unique mutations on a key part of the spike protein, which is what the coronavirus uses to invade human cells. This often means a higher rate of spreading.
The Omicron subvariant has been detected in at least 29 states in the United States and 56 countries, according to the latest update from Outbreak.info. The United States has detected 188 infections, with the worldwide total nearing 25,000.
Denmark has reported the highest number of cases, followed by the United Kingdom and India. Both Denmark and India have reported that BA.2 now accounts for about half of new COVID-19 cases in those countries.
On Jan. 28, the U.K. Health Security Agency said BA.2 has a “substantial” growth advantage over the original Omicron strain. The subvariant has spread faster in all regions of England where there were enough cases to conduct an analysis, the agency said in a report.
A preliminary evaluation found that BA.2 doesn’t appear to change how well the vaccine works compared to the original Omicron strain, the agency said. A booster dose was 70% effective at preventing symptomatic illness for BA.2, compared with 63% for the original Omicron strain.
The Centers for Disease Control and Prevention also said on Jan. 28 that, although the subvariant has become more common in some countries, it is currently at a low level in the United States and doesn’t appear to be more serious.
“Currently there is no evidence that the BA.2 lineage is more severe than the BA.1 lineage,” Kristen Nordlund, a CDC spokesperson, told CNBC.
The World Health Organization hasn’t labeled BA.2 a “variant of concern” so far but will continue to monitor it. WHO officials have said that new variants will arise as Omicron spreads across the world.
“The next variant of concern will be more fit, and what we mean by that is it will be more transmissible because it will have to overtake what is currently circulating,” Maria Van Kerkhove, the WHO’s COVID-19 technical lead, said during a livestream on Jan. 25.
“The big question is whether or not future variants will be more or less severe,” she said.
A version of this article first appeared on WebMD.com.
Pandemic pushed death rates to historic highs
Excess mortality is a way of quantifying the impact of a pandemic, based on overall mortality from nonpandemic periods. Mortality data over long periods of time are not available for many countries, but Switzerland, Sweden, and Spain have accumulated death count data for an uninterrupted period of more than 100 years.
In a study published in the Annals of Internal Medicine, Kaspar Staub, PhD, of the University of Zurich led a team of researchers in reviewing data on monthly excess deaths from all causes for Switzerland, Sweden, and Spain for 2020 to 2021. Dr. Staub and colleagues also compared these numbers to other pandemic and nonpandemic periods since the end of the 19th century. The starting years were 1877 for Switzerland, 1851 for Sweden, and 1908 for Spain.
The researchers collected data for monthly all-cause deaths from the statistical offices of each country and determined excess mortality by comparing these numbers to population size and age structure.
They found that 2020 showed the highest number of excess deaths since 1918, with relative excess of deaths of 12.5% in Switzerland, 8.5% in Sweden, and 17.3 % in Spain.
To put it another way, the number of excess deaths per 100,000 people was 100 for Switzerland, 75 for Sweden, and 155 for Spain.
“Our findings suggest that the pandemic led to the second-largest mortality disaster driven by a viral infection in more than 100 years in the three countries we studied, second only to the 1918 influenza pandemic,” the researchers wrote.
They explained that the excess mortality for the year 1918 was six to seven times higher than the 2020 numbers, but that the 2020 numbers might have been higher without the strong public health interventions taken worldwide to mitigate the impact of the COVID-19 pandemic.
“Early estimates suggest that vaccination prevented approximately 470,000 deaths in persons aged 60 years or older across 33 European countries between December 2019 and November 2021,” they wrote. However, because the COVID-19 pandemic is ongoing, “a more conclusive assessment will have to wait,” they added.
The 2020 numbers also were higher than most mortality rates since 1918, including peak years of previous influenza pandemics that occurred in 1957, 1968, 1977, and, most recently, the swine flu pandemic of 2009 which was caused by a novel strain of the H1N1 influenza virus.
The study findings had some limitations. For example, only three countries were included. Also, monthly death numbers according to sex, age, and cause of death were available only for the past 60 years, and data from years before the 20th century may not be reliable, the researchers said.
The new study does not account for the long-term effects of patients suffering from long COVID, they noted.
Study findings support strong public health response
“With the COVID-19 pandemic ongoing, this study reinforces the historic magnitude of the problem in terms of mortality and could add to the justification for ongoing public health measures such as vaccination drives and vaccine mandates to curb deaths,” said Suman Pal, MD, an internal medicine physician at the University of New Mexico, Albuquerque, in an interview.
“The results are surprising because when we view the rapid advancement in medical science over the last few decades, which have led to a decline in mortality from many previously fatal diseases, the scale of excess mortality from COVID-19 seems to have offset many such gains in the past 2 years.”
Prior studies of United States mortality data have estimated that excess deaths in the United States in 2020 exceeded the deaths attributed to COVID-19, said Dr. Pal. “The findings of this study could help clinicians in their discussion of the need for COVID-19 prevention measures with their patients” and inform discussions between doctors and patients about prevention strategies, he explained.
“Emphasizing that this pandemic is the second-largest cause of death due to a viral infection in a century could help patients understand the need for public health measures that may be viewed as unprecedented, such as government-imposed lockdowns, contact tracing, mask requirements, restrictions on travel, and vaccine mandates,” Dr. Pal noted. Better understanding of the evidence behind such measures may decrease the public’s resistance to following them, he added.As for additional research, “region-specific analysis of excess deaths may help estimate the impact of COVID-19 better, especially in regions where data reporting may be unreliable.”
Dr. F. Perry Wilson's take on study
“All-cause mortality is a key metric to assess the impact of the pandemic, because each death is treated equally,” said F. Perry Wilson, MD, of Yale University, in an interview. “With this type of analysis, there is no vague definition of a death from COVID or with COVID,” he explained. “A death is a death, and more deaths than expected is, of course, a bad thing. These analyses give a high-level view of the true human cost of the pandemic,” he said.

Dr. Wilson said he was not surprised by the findings. “There have been multiple studies, across multiple countries including the United States, which show similar findings—that observed deaths during this pandemic are substantially higher than expected,” he said. The current study findings are unique in that they compare the current pandemic to death rates in a nearly unbroken chain into the last century using data that only a few countries can provide, he noted.
The mortality data are “quite similar to what we see in the United States, with the exception that Spain was particularly hard-hit in the first COVID-19 wave in April 2020, said Dr. Wilson. By contrast, “the U.S. had substantially more excess deaths in the recent Delta wave, presumably due to lower vaccination uptake,” he added.
The current study is important for clinicians and their patients, said Dr. Wilson. “Data like these can help cut through some of the misinformation, such as the idea that only people who would have died anyway die of COVID, or that COVID is not severe,” he emphasized. “Overall death data are quite clear that far more people, millions more people, died over the last 22 months than could possibly be explained except by a global-level mortality event,” he said.
“One thing this study reminds us of is the value of high-quality data,” said Dr. Wilson. “Few countries have near complete vital statistics records on their entire populations and these can be so crucial to understand the true impact of pandemics and other disasters,” he explained. Of course, mortality data also serve as a reminder “that COVID is a serious disease: a once-in-a-century (we hope) pandemic,” he added.
The current study showed that excess death rates were similar, but not the same, from country to country, Dr. Wilson noted. “Moving forward, we need to learn what factors, from vaccination to social distancing strategies,” saved lives around the world,” he said.
The study was supported by the Foundation for Research in Science and the Humanities at the University of Zurich, the Swiss National Science Foundation, and the U.S. National Institute of Allergy and Infectious Diseases. The researchers, Dr. Pal, and Dr. Wilson had no financial conflicts.
*This article was updated on 2/1/2022.
Excess mortality is a way of quantifying the impact of a pandemic, based on overall mortality from nonpandemic periods. Mortality data over long periods of time are not available for many countries, but Switzerland, Sweden, and Spain have accumulated death count data for an uninterrupted period of more than 100 years.
In a study published in the Annals of Internal Medicine, Kaspar Staub, PhD, of the University of Zurich led a team of researchers in reviewing data on monthly excess deaths from all causes for Switzerland, Sweden, and Spain for 2020 to 2021. Dr. Staub and colleagues also compared these numbers to other pandemic and nonpandemic periods since the end of the 19th century. The starting years were 1877 for Switzerland, 1851 for Sweden, and 1908 for Spain.
The researchers collected data for monthly all-cause deaths from the statistical offices of each country and determined excess mortality by comparing these numbers to population size and age structure.
They found that 2020 showed the highest number of excess deaths since 1918, with relative excess of deaths of 12.5% in Switzerland, 8.5% in Sweden, and 17.3 % in Spain.
To put it another way, the number of excess deaths per 100,000 people was 100 for Switzerland, 75 for Sweden, and 155 for Spain.
“Our findings suggest that the pandemic led to the second-largest mortality disaster driven by a viral infection in more than 100 years in the three countries we studied, second only to the 1918 influenza pandemic,” the researchers wrote.
They explained that the excess mortality for the year 1918 was six to seven times higher than the 2020 numbers, but that the 2020 numbers might have been higher without the strong public health interventions taken worldwide to mitigate the impact of the COVID-19 pandemic.
“Early estimates suggest that vaccination prevented approximately 470,000 deaths in persons aged 60 years or older across 33 European countries between December 2019 and November 2021,” they wrote. However, because the COVID-19 pandemic is ongoing, “a more conclusive assessment will have to wait,” they added.
The 2020 numbers also were higher than most mortality rates since 1918, including peak years of previous influenza pandemics that occurred in 1957, 1968, 1977, and, most recently, the swine flu pandemic of 2009 which was caused by a novel strain of the H1N1 influenza virus.
The study findings had some limitations. For example, only three countries were included. Also, monthly death numbers according to sex, age, and cause of death were available only for the past 60 years, and data from years before the 20th century may not be reliable, the researchers said.
The new study does not account for the long-term effects of patients suffering from long COVID, they noted.
Study findings support strong public health response
“With the COVID-19 pandemic ongoing, this study reinforces the historic magnitude of the problem in terms of mortality and could add to the justification for ongoing public health measures such as vaccination drives and vaccine mandates to curb deaths,” said Suman Pal, MD, an internal medicine physician at the University of New Mexico, Albuquerque, in an interview.
“The results are surprising because when we view the rapid advancement in medical science over the last few decades, which have led to a decline in mortality from many previously fatal diseases, the scale of excess mortality from COVID-19 seems to have offset many such gains in the past 2 years.”
Prior studies of United States mortality data have estimated that excess deaths in the United States in 2020 exceeded the deaths attributed to COVID-19, said Dr. Pal. “The findings of this study could help clinicians in their discussion of the need for COVID-19 prevention measures with their patients” and inform discussions between doctors and patients about prevention strategies, he explained.
“Emphasizing that this pandemic is the second-largest cause of death due to a viral infection in a century could help patients understand the need for public health measures that may be viewed as unprecedented, such as government-imposed lockdowns, contact tracing, mask requirements, restrictions on travel, and vaccine mandates,” Dr. Pal noted. Better understanding of the evidence behind such measures may decrease the public’s resistance to following them, he added.As for additional research, “region-specific analysis of excess deaths may help estimate the impact of COVID-19 better, especially in regions where data reporting may be unreliable.”
Dr. F. Perry Wilson's take on study
“All-cause mortality is a key metric to assess the impact of the pandemic, because each death is treated equally,” said F. Perry Wilson, MD, of Yale University, in an interview. “With this type of analysis, there is no vague definition of a death from COVID or with COVID,” he explained. “A death is a death, and more deaths than expected is, of course, a bad thing. These analyses give a high-level view of the true human cost of the pandemic,” he said.
Dr. Wilson said he was not surprised by the findings. “There have been multiple studies, across multiple countries including the United States, which show similar findings—that observed deaths during this pandemic are substantially higher than expected,” he said. The current study findings are unique in that they compare the current pandemic to death rates in a nearly unbroken chain into the last century using data that only a few countries can provide, he noted.
The mortality data are “quite similar to what we see in the United States, with the exception that Spain was particularly hard-hit in the first COVID-19 wave in April 2020, said Dr. Wilson. By contrast, “the U.S. had substantially more excess deaths in the recent Delta wave, presumably due to lower vaccination uptake,” he added.
The current study is important for clinicians and their patients, said Dr. Wilson. “Data like these can help cut through some of the misinformation, such as the idea that only people who would have died anyway die of COVID, or that COVID is not severe,” he emphasized. “Overall death data are quite clear that far more people, millions more people, died over the last 22 months than could possibly be explained except by a global-level mortality event,” he said.
“One thing this study reminds us of is the value of high-quality data,” said Dr. Wilson. “Few countries have near complete vital statistics records on their entire populations and these can be so crucial to understand the true impact of pandemics and other disasters,” he explained. Of course, mortality data also serve as a reminder “that COVID is a serious disease: a once-in-a-century (we hope) pandemic,” he added.
The current study showed that excess death rates were similar, but not the same, from country to country, Dr. Wilson noted. “Moving forward, we need to learn what factors, from vaccination to social distancing strategies,” saved lives around the world,” he said.
The study was supported by the Foundation for Research in Science and the Humanities at the University of Zurich, the Swiss National Science Foundation, and the U.S. National Institute of Allergy and Infectious Diseases. The researchers, Dr. Pal, and Dr. Wilson had no financial conflicts.
*This article was updated on 2/1/2022.
FROM ANNALS OF INTERNAL MEDICINE
FDA grants full approval to Moderna COVID-19 vaccine
Moderna announced today that its mRNA COVID-19 vaccine has received full Food and Drug Administration approval for adults 18 years and older.
The move lifts an FDA emergency use authorization for the vaccine, which started Dec. 18, 2020.
The Moderna vaccine also now has a new trade name: Spikevax.
The FDA approval comes a little more than 5 months after the agency granted full approval to the Pfizer/BioNTech COVID-19 vaccine on Aug. 23. At the time, the Pfizer vaccine received the trade name Comirnaty.
The FDA approved the Moderna vaccine based on how well it works and its safety for 6 months after a second dose, including follow-up data from a phase 3 study, Moderna announced this morning through a news release. The FDA also announced the news.
Spikevax is the first Moderna product to be fully licensed in the United States.
The United States joins more than 70 other countries where regulators have approved the vaccine. A total of 807 million doses of Moderna’s COVID-19 vaccine were shipped worldwide in 2021, the company reported.
“The full licensure of Spikevax in the U.S. now joins that in Canada, Japan, the European Union, the U.K., Israel, and other countries, where the adolescent indication is also approved,” Stéphane Bancel, Moderna chief executive officer, said in the release.
A version of this article first appeared on WebMD.com.
Long COVID is real, and many real questions remain
Long story short, we still have a lot to learn about long COVID-19.
But it is a real phenomenon with real long-term health effects for people recovering from coronavirus infections. And diagnosing and managing it can get tricky, as some symptoms of long COVID-19 overlap with those of other conditions – and what many people have as they recover from any challenging stay in the ICU.
Risk factors remain largely unknown as well: What makes one person more likely to have symptoms like fatigue, “brain fog,” or headaches versus someone else? Researchers are just starting to offer some intriguing answers, but the evidence is preliminary at this point, experts said at a media briefing sponsored by the Infectious Diseases Society of America.
Unanswered questions include: Does an autoimmune reaction drive long COVID? Does the coronavirus linger in reservoirs within the body and reactivate later? What protection against long COVID do vaccines and treatments offer, if any?
To get a handle on these and other questions, nailing down a standard definition of long COVID would be a good start.
“Studies so far have used different definitions of long COVID,” Nahid Bhadelia, MD, founding director of the Boston University Center for Emerging Infectious Diseases Policy and Research, said during the briefing.
Fatigue is the most commonly symptom of long COVID in research so far, said Dr. Bhadelia, who is also an associate professor of medicine at Boston University.
“What’s difficult in this situation is it’s been 2 years in a global pandemic. We’re all fatigued. How do you tease this apart?” she asked.
Other common symptoms are a hard time thinking quickly – also known as “brain fog” – and the feeling that, despite normal oxygen levels, breathing is difficult, said Kathleen Bell, MD.
Headache, joint and muscle pain, and persistent loss of smell and taste are also widely reported, said Dr. Bell, a professor and chair of the department of physical medicine and rehabilitation at the University of Texas Southwestern Medical Center in Dallas.
Not all the symptoms are physical either.
“Pretty prominent things that we’re seeing are very high levels of anxiety, depression, and insomnia,” Dr. Bell said. These “actually seem to be associated independently with the virus as opposed to just being a completely reactive component.”
More research will be needed to distinguish the causes of these conditions.
A difficult diagnosis
the experts said.
“We are starting to see some interesting features of inaccurate attributions to COVID, both on the part of perhaps the person with long COVID symptoms and health care providers,” Dr. Bell said.“It’s sometimes a little difficult to sort it out.”
Dr. Bell said she was not suggesting misdiagnoses are common, “but it is difficult for physicians that don’t see a lot of people with long COVID.”
The advice is to consider other conditions. “You can have both a long COVID syndrome and other syndromes as well,” she said. “As one of my teachers used to say: ‘You can have both ticks and fleas.’ ”
Predicting long COVID
In a study getting attention, researchers identified four early things linked to greater chances that someone with COVID-19 will have long-term effects: type 2 diabetes at the time of diagnosis, the presence of specific autoantibodies, unusual levels of SARS-CoV-2 RNA in the blood, and signs of the Epstein-Barr virus in the blood.
The study, published in Cell, followed 309 people 2-3 months after COVID-19.
“That’s important work, but it’s early work,” Dr. Bhadelia said. “I think we still have a while to go in terms of understanding the mechanism of long COVID.”
Unexpected patients getting long COVID care
“We are seeing different populations than we all expected to see when this pandemic first started,” Dr. Bell said.
Instead of seeing primarily patients who had severe COVID-19, “the preponderance of people that we’re seeing in long COVID clinics are people who are enabled, were never hospitalized, and have what people might call mild to moderate cases of coronavirus infection,” she said.
Also, instead of just older patients, people of all ages are seeking long COVID care.
One thing that appears more certain is a lack of diversity in people seeking care at long COVID clinics nationwide.
“Many of us who have long COVID specialty clinics will tell you that we are tending to see fairly educated, socioeconomically stable population in these clinics,” Dr. Bell said. “We know that based on the early statistics of who’s getting COVID and having significant COVID that we may not be seeing those populations for follow-up.”
Is an autoinflammatory process to blame?
It remains unclear if a hyperinflammatory response is driving persistent post–COVID-19 symptoms. Children and some adults have developed multisystem inflammatory conditions associated with COVID-19, for example.
There is a signal, and “I think there is enough data now to show something does happen,” Dr. Bhadelia said. “The question is, how often does it happen?”
Spending time in critical care, even without COVID-19, can result in persistent symptoms after a hospital stay, such as acute respiratory distress syndrome. Recovery can take time because being in an ICU is “basically the physiologically equivalent of a car crash,” Dr. Bhadelia said. “So you’re recovering from that, too.”
Dr. Bell agreed. “You’re not only recovering from the virus itself, you’re recovering from intubation, secondary infections, secondary lung conditions, perhaps other organ failure, and prolonged bed rest. There are so many things that go into that, that it’s a little bit hard to sort that out from what long COVID is and what the direct effects of the virus are.”
Also a research opportunity
“I hate to call it this, but we’ve never had an opportunity [where] we have so many people in such a short amount of time with the same viral disorder,” Dr. Bell said. “We also have the technology to investigate it. This has never happened.
“SARS-CoV-2 is not the only virus. This is just the only one we’ve gotten whacked with in such a huge quantity at one time,” she said.
What researchers learn now about COVID-19 and long COVID “is a model that’s going to be able to be applied in the future to infectious diseases in general,” Dr. Bell predicted.
How long will long COVID last?
The vast majority of people with long COVID will get better over time, given enough support and relief of their symptoms, Dr. Bell said.
Type 2 diabetes, preexisting pulmonary disease, and other things could affect how long it takes to recover from long COVID, she said, although more evidence is needed.
“I don’t think at this point that anyone can say how long this long COVID will last because there are a variety of factors,” Dr. Bell said.
A version of this article first appeared on WebMD.com.
Immunocompromised patients should receive fourth COVID shot: CDC
The Centers for Disease Control and Prevention contacted pharmacies on Jan. 26 to reinforce the message that people with moderate to severe immune suppression should receive a fourth COVID-19 vaccine, according to Kaiser Health News.
The conference call came a day after the news outlet reported that immunocompromised people were being turned away by pharmacies. White House officials also emphasized on Jan. 26 that immunocompromised people should receive an additional shot.
During the call, the CDC “reiterated the recommendations, running through case examples,” Mitchel Rothholz, RPh, MBA, chief of governance and state affiliates for the American Pharmacists Association, told KHN.
While on the call, Mr. Rothholz asked for a “prepared document” with the CDC’s recommendations “so we can clearly and consistently communicate the message.” The CDC officials on the call said they would create a document but “don’t know how long that will take,” Mr. Rothholz told KHN.
The CDC recommends an additional shot -– or a fourth shot – for those who have weak immune systems, which makes them more at risk for severe COVID-19 and death. About 7 million American adults are considered immunocompromised, KHN reported, which includes people who have certain medical conditions that impair their immune response or who take immune-suppressing drugs because of organ transplants, cancer, or autoimmune diseases.
The CDC first recommended fourth shots for immunocompromised people in October. This month, the CDC shortened the time for booster shots from 6 months to 5 months, and some immunocompromised people who are due for another shot have begun to seek them. The agency has been educating pharmacists and other health providers since then, a CDC spokesperson told KHN.
While patients don’t need to provide proof that they are immunocompromised, according to the CDC, some have been turned away, KHN reported.
To improve communication with the public, large pharmacies could issue news releases and update their websites “explicitly stating that they are offering fourth doses” to immunocompromised people, Ameet Kini, MD, a professor of pathology and laboratory medicine at Loyola University Medical Center in Chicago, told KHN.
Pharmacies should also update their patient portals and provide “clear guidance for their pharmacists,” he said.
A version of this article first appeared on WebMD.com.
Hong Kong, U.S., Israeli data illuminate COVID vaccine myocarditis
Why some COVID-19 vaccines seem occasionally to cause a distinctive form of myocarditis, and why adolescent boys and young men appear most vulnerable, remain a mystery. But the entity’s prevalence, nuances of presentation, and likely clinical course have come into sharper view after recent additions to the literature.
Two new publications all but confirm that the rare cases of myocarditis closely following vaccination against SARS-CoV-2, primarily with one of the mRNA-based vaccines from Pfizer-BioNTech and Moderna, is a clinically different creature from myocarditis physicians were likely to see before the pandemic.
A third report unveils rates of hospitalization for myocarditis linked to Pfizer-BioNTech vaccination in the 12- to 15-year age group, based on active surveillance across Israel. Of note, the rates were lower than corresponding numbers among the country’s 16- to 19-year-olds published in late 2021 by the same authors.
No link with CoronaVac
A case-control study covering almost the entire population of Hong Kong from February to August 2021 confirms a slight but significant excess risk for myocarditis and, to a lesser degree, pericarditis, after injections of the Pfizer-BioNTech vaccine. As consistently reported from other studies, the risks were highest in adolescent and young adult males and after a second dose.
The study estimated an overall carditis incidence of 5.7 cases per million doses of Pfizer-BioNTech, for a risk 3.5 times that in the unvaccinated Hong Kong population. Carditis rates after a first dose were about 2.5 per million and 10 per million after a second dose.
Hong Kong launched its public SARS-CoV-2 immunization program in late February 2021 with the Chinese-made CoronaVac (Sinovac) inactivated-virus vaccine, and introduced the mRNA-based alternative several weeks later. By August 2021, the vaccines had reached about 3.3 million people in the region – 49% of the Hong Kong population at least 12 years of age.
In a novel finding, there were no excesses in carditis cases after CoronaVac vaccination. The difference between vaccines likely isn’t caused by chance, because three-fourths of the carditis-associated Pfizer-BioNTech injections arose within a week, whereas “71% of cases following the use of CoronaVac occurred more than 30 days after vaccination,” senior author Ian Chi Kei Wong, PhD, University of Hong Kong, said in an interview.
“This onset distribution for cases having received CoronaVac demonstrates that it is highly unlikely the carditis cases are related to the vaccine,” he said. And that “plausibly implies a specific underlying mechanism between vaccination and carditis that may only be applicable to mRNA vaccines.”
That inference is in line with case reports and other research, including large population-based studies from Israel and Denmark, although a recent study from the United Kingdom hinted at a potential excess myocarditis risk associated with the adenovirus-based AstraZeneca-Oxford vaccine.
The Hong Kong study identified 160 patients age 12 or older with a first diagnosis of carditis during February to August 2021, in electronic health records covering nearly the entire region.
“We used laboratory test results of troponin levels to further eliminate unlikely cases of carditis,” Dr. Wong said. The health records were linked to a “population-based vaccination record” maintained by the government’s department of health.
About 10 control patients from among all hospitalized patients without carditis were matched by age, sex, and admission date to each of the 160 carditis cases. About 83% of cases and 92% of the controls were unvaccinated.
Among those who received the Pfizer-BioNTech vaccine, representing 12.5% of cases and 4.2% of controls, the estimated carditis incidence was 0.57 per 100,000 doses. For those who received CoronaVac, representing 4.4% of cases and 3.9% of controls, it was 0.31 per 100,000 doses.
In adjusted analysis, the odds ratios for carditis among Pfizer-BioNTech vaccine recipients, compared with unvaccinated controls, were 3.57 (95% confidence interval, 1.93-6.60) overall, 4.68 (95% CI, 2.25-9.71) for males, 2.22 (95% CI, 0.57-8.69) for females, 2.41 (95% CI, 1.18-4.90) for ages 18 and older, and 13.8 (95% CI, 2.86-110.4) for ages 12-17
Myocarditis accounted for most of the excess cases, with an overall OR of 9.29 (95% CI, 3.94-21.9). The OR reached only 1.06 (95% CI, 0.35-3.22) for pericarditis alone.
The case-control study is noteworthy for its design, which contrasts with the many recent case series and passive or active surveillance studies, and even the more robust population-based studies of vaccine-related myocarditis, observed Dongngan Truong, MD, University of Utah and Primary Children’s Hospital, both in Salt Lake City, who wasn’t part of the study.
Among its strengths, she said in an interview, are its linkage of comprehensive hospital and vaccination data sets for two different vaccines; and that it corroborates other research suggesting there is “something in particular about mRNA vaccination that seems to be associated with the development of myocarditis.”
Active surveillance in Israel
In an October 2021 report based on an Israeli Ministry of Health database covering up to May 2021, rates of myocarditis arising within 21 days of a second Pfizer-BioNTech dose in 16- to 19-year-olds reached about 1 per 6,637 males and 1 per 99,853 females. Those numbers compared with 1 per 26,000 males and 1 per 218,000 females across all age groups.
Now authors led by Dror Mevorach, MD, Hadassah Medical Center, Jerusalem, have published corresponding numbers from the same data base for myocarditis associated with the same vaccine in males and females aged 12-15.
Their research covers 404,407 people in that age group who received a first dose of the mRNA-based vaccine and 326,463 who received the second dose from June to October, 2021. Only 18 cases of myocarditis were observed within 21 days of either dose.
The estimated rates for males were 0.56 cases per 100,000 after a first dose and 8.09 cases per 100,000 after a second dose.
For females, the estimates were 0 cases per 100,000 after a first dose and 0.69 cases per 100,000 after a second dose.
“The pattern observed, mainly following the second vaccination in males, suggests causality,” the group wrote.
Leveraging passive surveillance reports
Another new report adds a twist to updated numbers from the U.S. Vaccine Adverse Event Reporting System (VAERS).
Prevalences derived from the passive-surveillance data base, known for including case records of inconsistent quality or completeness, are considered especially prone to reporting bias, the authors acknowledged.
The current analysis, however, plunges deep into VAERS-reported cases of presumed SARS-CoV-2 vaccine-associated myocarditis to help clarify “more of the characteristics of the patients and some of the treatments and short-term outcomes,” Matthew E. Oster, MD, MPH, said in an interview.
Dr. Oster, from the Centers for Disease Control and Prevention and Emory University, Atlanta, is lead author on the study’s Jan. 25, 2022, publication in JAMA.
The group reviewed charts and interviewed involved clinicians to adjudicate and document presentations, therapies, and the clinical course of cases reported as SARS-CoV-2 vaccine–associated myocarditis from December 2020 to August 2021. Out of the nearly 2000 reports, which were limited to patients younger than 30, the group identified 1,626 likely cases of such myocarditis arising within 7 days of a second mRNA vaccine dose.
The confirmed cases consistently represented higher prevalences than expected compared with prepandemic myocarditis claims data for both sexes and across age groups spanning 12-29 years.
For example, rates were highest for adolescent males – about 106 and 71 cases per million second doses of the Pfizer-BioNTech vaccine in those aged 16-17 and 12-16, respectively, for example. They were lowest for women aged 25-29, at 2.23 cases per million second Pfizer-BioNTech doses; the highest rate among females was about 11 per million for the 16-17 age group.
The observed rates, Dr. Oster said, represent an update to VAERS numbers published June 2021 in Morbidity and Mortality Weekly Report covering cases through June 2021.
“Overall, the general risk of having myocarditis from the vaccines is still extremely low. Even in the highest risk groups, it is still extremely low, and still lower than the risk of having cardiac complications from COVID,” he noted.
How do patients fare clinically?
From their chart reviews and interviews with case clinicians, Dr. Oster said, “we started to learn quickly that this is really a different type of myocarditis.”
For example, its onset, typically within a few days of the potential immunologic cause, was more rapid than in viral myocarditis, and its symptoms resolved faster, the report notes. Clinical presentations tended to be less severe, treatments not as intensive, and outcomes not as serious, compared with “the kind of typical viral myocarditis that most of the providers were used to taking care of in the past,” he said. “The pattern for these cases was very consistent.”
The study covered VAERS reports of suspected myocarditis arising within a week of first dose of a mRNA-based vaccine from the United States launch of public vaccination in December 2020 to August 2021, the CDC-based group reported. By then, more than 192 million people in the country had received either the Pfizer-BioNTech (age 12 or older) or Moderna (age 18 or older) vaccines.
Of the 1,991 reports of myocarditis, including 391 also involving pericarditis, 1,626 met the study’s definition for myocarditis on adjudication; about 82% of the latter cases were in males.
Based on the investigators’ review of charts and clinician interviews connected with 826 cases that met their definition of myocarditis in patients younger than 30, 89% reported “chest pain, pressure, or discomfort” and 30% reported dyspnea or shortness of breath. Troponin levels were elevated in 98%, 72% of patients who underwent electrocardiography showed abnormalities, and 12% of those with echocardiography had left ventricular ejection fractions less than 50%.
About 96% were hospitalized, and presenting symptoms resolved by discharge in 87% of those with available data, the group noted. Among patients with data on in-hospital therapy, they wrote, NSAIDs were the most common therapy, in 87%.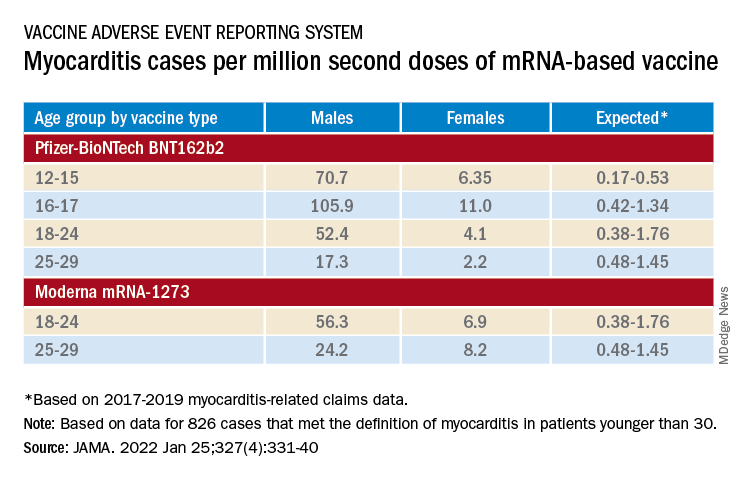
‘Mild and self-limiting’
The case-control study from Hong Kong didn’t specifically examine patients’ treatment and clinical course, but it does portray their vaccine-associated myocarditis as contrasting with more familiar viral myocarditis.
Patients with “typical” myocarditis tend to be “overall much sicker than what we’re seeing with myocarditis following vaccination,” Dr. Truong agreed. None of the 20 patients with myocarditis after Pfizer-BioNTech vaccination in Hong Kong were admitted to the intensive care unit. That, she added, suggests none required extracorporeal membrane oxygenation or vasoactive support, often necessary in viral myocarditis. “And they had shorter hospital stays.”
In contrast, Dr. Wong noted, 14 of the study’s unvaccinated patients required ICU admission; 12 of them died during the follow-up period. None with vaccine-related carditis died during the study’s follow-up. “We also showed that cases following [Pfizer-BioNTech] vaccination were all mild and self-limiting.”
Dr. Truong largely agreed that SARS-CoV-2 vaccine myocarditis and most myocarditis seen before the pandemic can be viewed as distinct clinical entities, “at least in the short term. I think we do need to follow these patients to look at more long-term outcomes, because at this point I don’t think we know the long-term implications. But at least in the short term, it seems like these patients are different, are much less sick, and recover pretty quickly overall.”
Dr. Oster emphasized that the many and varied acute and long-term hazards from contracting COVID-19 far outweigh any risk for myocarditis from vaccination. But for individuals who were hit with myocarditis soon after their first mRNA vaccine dose, who have already established their susceptibility, he and his colleagues would recommend that they “consider alternatives and not get the vaccine again.”
Dr. Oster reported no relevant financial relationships. Dr. Wong and colleagues did not report any relevant disclosures. Dr. Truong has previously disclosed serving as a consultant to Pfizer.
A version of this article first appeared on Medscape.com.