User login
Bringing you the latest news, research and reviews, exclusive interviews, podcasts, quizzes, and more.
div[contains(@class, 'read-next-article')]
div[contains(@class, 'nav-primary')]
nav[contains(@class, 'nav-primary')]
section[contains(@class, 'footer-nav-section-wrapper')]
nav[contains(@class, 'nav-ce-stack nav-ce-stack__large-screen')]
header[@id='header']
div[contains(@class, 'header__large-screen')]
div[contains(@class, 'read-next-article')]
div[contains(@class, 'main-prefix')]
div[contains(@class, 'nav-primary')]
nav[contains(@class, 'nav-primary')]
section[contains(@class, 'footer-nav-section-wrapper')]
footer[@id='footer']
section[contains(@class, 'nav-hidden')]
div[contains(@class, 'ce-card-content')]
nav[contains(@class, 'nav-ce-stack')]
div[contains(@class, 'view-medstat-quiz-listing-panes')]
div[contains(@class, 'pane-article-sidebar-latest-news')]
Spotted white fingernails

White nail changes are broadly called leukonychia: “leuko” meaning white and “nychia” referring to the nail. Scattered or single asymptomatic cloudy white nail lesions occurring without other associated skin or nail disorders are more specifically called punctate leukonychia.
Punctate leukonychia is theorized to be caused by trauma at the proximal nail matrix, affecting the developing nail.1 The trauma may result from aggressive nail care practices or damage to the cuticle. In many cases, there is no history of known trauma. For this patient with multiple lesions, who performed manual work, multiple small traumas may have induced the punctate leukonychia.
Other causes of leukonychia include superficial onychomycosis (in which discoloration may be whiter than the usual yellow-brown), renal disease, and arsenic toxicity.1 Arsenic toxicity causes transverse leukonychia in a band-like fashion, since it is a systemic insult to the growing nails. Longitudinal leukonychia is due to a more localized insult to the nail matrix, causing the white lines to grow out with the nail along the axis of the digit. Other than avoiding trauma, there is no treatment needed or recommended for punctate leukonychia.
The patient was counseled on the benign nature of his punctate leukonychia and assured that no treatment was necessary.
Photo courtesy of Daniel Stulberg, MD. Text courtesy of Daniel Stulberg, MD, FAAFP, Department of Family and Community Medicine, University of New Mexico School of Medicine, Albuquerque.
1. Iorizzo M, Starace M, Pasch MC. Leukonychia: what can white nails tell us? Am J Clin Dermatol. 2022;23:177-193. doi: 10.1007/s40257-022-00671-6
White nail changes are broadly called leukonychia: “leuko” meaning white and “nychia” referring to the nail. Scattered or single asymptomatic cloudy white nail lesions occurring without other associated skin or nail disorders are more specifically called punctate leukonychia.
Punctate leukonychia is theorized to be caused by trauma at the proximal nail matrix, affecting the developing nail.1 The trauma may result from aggressive nail care practices or damage to the cuticle. In many cases, there is no history of known trauma. For this patient with multiple lesions, who performed manual work, multiple small traumas may have induced the punctate leukonychia.
Other causes of leukonychia include superficial onychomycosis (in which discoloration may be whiter than the usual yellow-brown), renal disease, and arsenic toxicity.1 Arsenic toxicity causes transverse leukonychia in a band-like fashion, since it is a systemic insult to the growing nails. Longitudinal leukonychia is due to a more localized insult to the nail matrix, causing the white lines to grow out with the nail along the axis of the digit. Other than avoiding trauma, there is no treatment needed or recommended for punctate leukonychia.
The patient was counseled on the benign nature of his punctate leukonychia and assured that no treatment was necessary.
Photo courtesy of Daniel Stulberg, MD. Text courtesy of Daniel Stulberg, MD, FAAFP, Department of Family and Community Medicine, University of New Mexico School of Medicine, Albuquerque.
1. Iorizzo M, Starace M, Pasch MC. Leukonychia: what can white nails tell us? Am J Clin Dermatol. 2022;23:177-193. doi: 10.1007/s40257-022-00671-6
1. Iorizzo M, Starace M, Pasch MC. Leukonychia: what can white nails tell us? Am J Clin Dermatol. 2022;23:177-193. doi: 10.1007/s40257-022-00671-6

Dermatology and monkeypox: What you need to know
.

Diagnosing cases “can be hard and folks should keep a very open mind and consider monkeypox virus,” said Misha Rosenbach, MD, a University of Pennsylvania dermatologist and member of the American Academy of Dermatology’s ad hoc task force to develop monkeypox content.
Although it’s named after a primate, it turns out that monkeypox is quite the copycat. As dermatologists have learned, its lesions can look like those caused by a long list of other diseases including herpes, varicella, and syphilis. In small numbers, they can even appear to be insect bites.
To make things more complicated, a patient can have one or two lesions – or dozens. They often cluster in the anogenital area, likely reflecting transmission via sexual intercourse, unlike previous outbreaks in which lesions appeared all over the body. “We have to let go of some of our conceptions about what monkeypox might look like,” said dermatologist Esther Freeman, MD, PhD, associate professor of dermatology, Harvard University, Boston, and a member of the AAD task force.

To make things even more complicated, “the spectrum of illness that we are seeing has ranged from limited, subtle lesions to dramatic, widespread, ulcerative/necrotic lesions,” said Dr. Rosenbach, associate professor of dermatology at the University of Pennsylvania, Philadelphia.
But monkeypox has unique traits that can set it apart and pave the way toward a diagnosis, dermatologists say. And important patient data can help dermatologists gauge the likelihood of a case: Almost 99% of cases with data available have been in men, and among men with available information, 94% reported male-to-male sexual or close intimate contact during the 3 weeks before developing symptoms, according to a CDC report tracking cases from May through late July. So far, cases in women and children are extremely rare, although there have been some reported in the United States.
Are dermatologists likely to see monkeypox in the clinic? It’s unclear so far. Of four dermatologists interviewed for this article, only one has seen patients with monkeypox in person. But others say they’ve been sought for consultations. “I have been asked by infectious disease colleagues for advice remotely but have not seen it,” said dermatologist Howa Yeung, MD, MSc, assistant professor of dermatology, Emory University, Atlanta. “Most of the time, they’re catching all the symptomatic cases before any need for dermatology in-person referrals.”

Still, the rapid rate of growth of the outbreak – up from 3,487 in the United States on July 25 to 12,689 as of Aug.16 – suggests that more dermatologists will see cases, and consultations may become more common too.
Know your lesions
Lesions are the telltale signs of symptomatic monkeypox. According to a recent New England Journal of Medicine study of 528 monkeypox cases from 16 nations, diagnosed between April 27 and June 24, 2022, 95% had skin lesions (58% were vesiculopustular), most commonly in the anogenital area (73%), and on the trunk/arms/or legs (55%) and face (25%), and the palms/soles (10%).
However, “the current monkeypox outbreak often presents differently from the multiple classic vesiculopustules on the skin we see in textbooks,” Dr. Yeung said. “Sometimes people can present with throat pain or rectal pain, with isolated pharyngitis or proctitis. Sometimes there are so few lesions on the skin that it can be easily confused with a bug bite, folliculitis, herpes, dyshidrotic eczema, or other skin problems. This is where dermatologists will get consulted to clarify the diagnosis while the monkeypox PCR test is pending.”
Dr. Rosenbach, who has provided consultation services to other physicians about cases, said the lesions often appear to be vesicles or pustules, “but if you go to ‘pop’ it – e.g., for testing – it’s firm and without fluid. This is likely due to pox virus inclusion, similar to other diseases such as molluscum,” caused by another pox virus, he said. Molluscum lesions are “characteristically umbilicated, with a dimple in the center, and monkeypox lesions seem to be showing a roughly similar morphology with many bowl- or caldera-shaped lesions that are donut-like in appearance,” he added.
Over time, Dr. Rosenbach said, “lesions tend to evolve slowly from smaller flesh-colored or vaguely white firm papules to broader more umbilicated/donut-shaped lesions which may erode, ulcerate, develop a crust or scab, and then heal. The amount of scarring is not yet clear, but we anticipate it to be significant, especially in patients with more widespread or severe disease.”
Jon Peebles, MD, a dermatologist at Kaiser Permanente in Largo, Md., who has treated a few in-person monkeypox cases, said the lesions can be “exquisitely painful,” although he’s also seen patients with asymptomatic lesions. “Lesions are showing a predilection for the anogenital skin, though they can occur anywhere and not uncommonly involve the oral mucosa,” said Dr. Peebles, also a member of the AAD monkeypox task force.

Dr. Yeung said it’s important to ask patients about their sexual orientation, gender identity, and sexual behaviors. “That is the only way to know who your patients are and the only way to understand who else may be at risks and can benefit from contact tracing and additional prevention measures, such as vaccination for asymptomatic sex partners.” (The Jynneos smallpox vaccine is Food and Drug Administration–approved to prevent monkeypox, although its efficacy is not entirely clear, and there’s controversy over expanding its limited availability by administering the vaccine intradermally.)
It’s also important to keep in mind that sexually transmitted infections (STIs) are common in gay and bisexual men. “Just because the patient is diagnosed with gonorrhea or syphilis does not mean the patient cannot also have monkeypox,” Dr. Rosenbach said. Indeed, the NEJM study reported that of 377 patients screened, 29% had an STI other than HIV, mostly syphilis (9%) and gonorrhea (8%). Of all 528 patients in the study (all male or transgender/nonbinary), 41% were HIV-positive, and the median number of sex partners in the last 3 months was 5 (range, 3-15).
Testing is crucial to rule monkeypox in – or out
While monkeypox lesions can be confused for other diseases, Dr. Rosenbach said that a diagnosis can be confirmed through various tests. Varicella zoster virus (VZV) and herpes simplex virus (HSV) have distinct findings on Tzanck smears (nuclear molding, multinucleated cells), and have widely available fairly rapid tests (PCR, or in some places, DFA). “Staph and bacterial folliculitis can usually be cultured quickly,” he said. “If you have someone with no risk factors/exposure, and you test for VZV, HSV, folliculitis, and it’s negative – you should know within 24 hours in most places – then you can broaden your differential diagnosis and consider alternate explanations, including monkeypox.”
Quest Diagnostics and Labcorp, two of the largest commercial labs in the United States, are now offering monkeypox tests. Labcorp says its test has a 2- to 3-day turnaround time.
As for treatment, some physicians are prescribing off-label use of tecovirimat (also known as TPOXX or ST-246), a smallpox antiviral treatment. The CDC offers guidelines about its use. “It seems to work very fast, with patients improving in 24-72 hours,” Dr. Rosenbach said. However, “it is still very challenging to give and get. There’s a cumbersome system to prescribe it, and it needs to be shipped from the national stockpile. Dermatologists should be working with their state health department, infection control, and infectious disease doctors.”
It’s likely that dermatologists are not comfortable with the process to access the drug, he said, “but if we do not act quickly to control the current outbreak, we will all – unfortunately – need to learn to be comfortable prescribing it.”
In regard to pain control, an over-the-counter painkiller approach may be appropriate depending on comorbidities, Dr. Rosenbach said. “Some patients with very severe disease, such as perianal involvement and proctitis, have such severe pain they need to be hospitalized. This is less common.”
Recommendations pending on scarring prevention
There’s limited high-quality evidence about the prevention of scarring in diseases like monkeypox, Dr. Rosenbach noted. “Any recommendations are usually based on very small, limited, uncontrolled studies. In the case of monkeypox, truly we are off the edge of the map.”
He advises cleaning lesions with gentle soap and water – keeping in mind that contaminated towels may spread disease – and potentially using a topical ointment-based dressing such as a Vaseline/nonstick dressing or Vaseline-impregnated gauze. If there’s concern about superinfection, as can occur with staph infections, topical antibiotics such as mupirocin 2% ointment may be appropriate, he said.
“Some folks like to try silica gel sheets to prevent scarring,” Dr. Rosenbach said. “There’s not a lot of evidence to support that, but they’re unlikely to be harmful. I would personally consider them, but it really depends on the extent of disease, anatomic sites involved, and access to care.”
Emory University’s Dr. Yeung also suggested using silicone gel or sheets to optimize the scar appearance once the lesions have crusted over. “People have used lasers, microneedling, etc., to improve smallpox scar appearance,” he added, “and I’m sure dermatologists will be the ones to study what works best for treating monkeypox scars.”
As for the big picture, Dr. Yeung said that dermatologists are critical in the fight to control monkeypox: “We can help our colleagues and patients manage symptoms and wound care, advocate for vaccination and treatment, treat long-term scarring sequelae, and destigmatize LGBTQ health care.”
The dermatologists interviewed for this article report no disclosures.
.
Diagnosing cases “can be hard and folks should keep a very open mind and consider monkeypox virus,” said Misha Rosenbach, MD, a University of Pennsylvania dermatologist and member of the American Academy of Dermatology’s ad hoc task force to develop monkeypox content.
Although it’s named after a primate, it turns out that monkeypox is quite the copycat. As dermatologists have learned, its lesions can look like those caused by a long list of other diseases including herpes, varicella, and syphilis. In small numbers, they can even appear to be insect bites.
To make things more complicated, a patient can have one or two lesions – or dozens. They often cluster in the anogenital area, likely reflecting transmission via sexual intercourse, unlike previous outbreaks in which lesions appeared all over the body. “We have to let go of some of our conceptions about what monkeypox might look like,” said dermatologist Esther Freeman, MD, PhD, associate professor of dermatology, Harvard University, Boston, and a member of the AAD task force.
To make things even more complicated, “the spectrum of illness that we are seeing has ranged from limited, subtle lesions to dramatic, widespread, ulcerative/necrotic lesions,” said Dr. Rosenbach, associate professor of dermatology at the University of Pennsylvania, Philadelphia.
But monkeypox has unique traits that can set it apart and pave the way toward a diagnosis, dermatologists say. And important patient data can help dermatologists gauge the likelihood of a case: Almost 99% of cases with data available have been in men, and among men with available information, 94% reported male-to-male sexual or close intimate contact during the 3 weeks before developing symptoms, according to a CDC report tracking cases from May through late July. So far, cases in women and children are extremely rare, although there have been some reported in the United States.
Are dermatologists likely to see monkeypox in the clinic? It’s unclear so far. Of four dermatologists interviewed for this article, only one has seen patients with monkeypox in person. But others say they’ve been sought for consultations. “I have been asked by infectious disease colleagues for advice remotely but have not seen it,” said dermatologist Howa Yeung, MD, MSc, assistant professor of dermatology, Emory University, Atlanta. “Most of the time, they’re catching all the symptomatic cases before any need for dermatology in-person referrals.”
Still, the rapid rate of growth of the outbreak – up from 3,487 in the United States on July 25 to 12,689 as of Aug.16 – suggests that more dermatologists will see cases, and consultations may become more common too.
Know your lesions
Lesions are the telltale signs of symptomatic monkeypox. According to a recent New England Journal of Medicine study of 528 monkeypox cases from 16 nations, diagnosed between April 27 and June 24, 2022, 95% had skin lesions (58% were vesiculopustular), most commonly in the anogenital area (73%), and on the trunk/arms/or legs (55%) and face (25%), and the palms/soles (10%).
However, “the current monkeypox outbreak often presents differently from the multiple classic vesiculopustules on the skin we see in textbooks,” Dr. Yeung said. “Sometimes people can present with throat pain or rectal pain, with isolated pharyngitis or proctitis. Sometimes there are so few lesions on the skin that it can be easily confused with a bug bite, folliculitis, herpes, dyshidrotic eczema, or other skin problems. This is where dermatologists will get consulted to clarify the diagnosis while the monkeypox PCR test is pending.”
Dr. Rosenbach, who has provided consultation services to other physicians about cases, said the lesions often appear to be vesicles or pustules, “but if you go to ‘pop’ it – e.g., for testing – it’s firm and without fluid. This is likely due to pox virus inclusion, similar to other diseases such as molluscum,” caused by another pox virus, he said. Molluscum lesions are “characteristically umbilicated, with a dimple in the center, and monkeypox lesions seem to be showing a roughly similar morphology with many bowl- or caldera-shaped lesions that are donut-like in appearance,” he added.
Over time, Dr. Rosenbach said, “lesions tend to evolve slowly from smaller flesh-colored or vaguely white firm papules to broader more umbilicated/donut-shaped lesions which may erode, ulcerate, develop a crust or scab, and then heal. The amount of scarring is not yet clear, but we anticipate it to be significant, especially in patients with more widespread or severe disease.”
Jon Peebles, MD, a dermatologist at Kaiser Permanente in Largo, Md., who has treated a few in-person monkeypox cases, said the lesions can be “exquisitely painful,” although he’s also seen patients with asymptomatic lesions. “Lesions are showing a predilection for the anogenital skin, though they can occur anywhere and not uncommonly involve the oral mucosa,” said Dr. Peebles, also a member of the AAD monkeypox task force.
Dr. Yeung said it’s important to ask patients about their sexual orientation, gender identity, and sexual behaviors. “That is the only way to know who your patients are and the only way to understand who else may be at risks and can benefit from contact tracing and additional prevention measures, such as vaccination for asymptomatic sex partners.” (The Jynneos smallpox vaccine is Food and Drug Administration–approved to prevent monkeypox, although its efficacy is not entirely clear, and there’s controversy over expanding its limited availability by administering the vaccine intradermally.)
It’s also important to keep in mind that sexually transmitted infections (STIs) are common in gay and bisexual men. “Just because the patient is diagnosed with gonorrhea or syphilis does not mean the patient cannot also have monkeypox,” Dr. Rosenbach said. Indeed, the NEJM study reported that of 377 patients screened, 29% had an STI other than HIV, mostly syphilis (9%) and gonorrhea (8%). Of all 528 patients in the study (all male or transgender/nonbinary), 41% were HIV-positive, and the median number of sex partners in the last 3 months was 5 (range, 3-15).
Testing is crucial to rule monkeypox in – or out
While monkeypox lesions can be confused for other diseases, Dr. Rosenbach said that a diagnosis can be confirmed through various tests. Varicella zoster virus (VZV) and herpes simplex virus (HSV) have distinct findings on Tzanck smears (nuclear molding, multinucleated cells), and have widely available fairly rapid tests (PCR, or in some places, DFA). “Staph and bacterial folliculitis can usually be cultured quickly,” he said. “If you have someone with no risk factors/exposure, and you test for VZV, HSV, folliculitis, and it’s negative – you should know within 24 hours in most places – then you can broaden your differential diagnosis and consider alternate explanations, including monkeypox.”
Quest Diagnostics and Labcorp, two of the largest commercial labs in the United States, are now offering monkeypox tests. Labcorp says its test has a 2- to 3-day turnaround time.
As for treatment, some physicians are prescribing off-label use of tecovirimat (also known as TPOXX or ST-246), a smallpox antiviral treatment. The CDC offers guidelines about its use. “It seems to work very fast, with patients improving in 24-72 hours,” Dr. Rosenbach said. However, “it is still very challenging to give and get. There’s a cumbersome system to prescribe it, and it needs to be shipped from the national stockpile. Dermatologists should be working with their state health department, infection control, and infectious disease doctors.”
It’s likely that dermatologists are not comfortable with the process to access the drug, he said, “but if we do not act quickly to control the current outbreak, we will all – unfortunately – need to learn to be comfortable prescribing it.”
In regard to pain control, an over-the-counter painkiller approach may be appropriate depending on comorbidities, Dr. Rosenbach said. “Some patients with very severe disease, such as perianal involvement and proctitis, have such severe pain they need to be hospitalized. This is less common.”
Recommendations pending on scarring prevention
There’s limited high-quality evidence about the prevention of scarring in diseases like monkeypox, Dr. Rosenbach noted. “Any recommendations are usually based on very small, limited, uncontrolled studies. In the case of monkeypox, truly we are off the edge of the map.”
He advises cleaning lesions with gentle soap and water – keeping in mind that contaminated towels may spread disease – and potentially using a topical ointment-based dressing such as a Vaseline/nonstick dressing or Vaseline-impregnated gauze. If there’s concern about superinfection, as can occur with staph infections, topical antibiotics such as mupirocin 2% ointment may be appropriate, he said.
“Some folks like to try silica gel sheets to prevent scarring,” Dr. Rosenbach said. “There’s not a lot of evidence to support that, but they’re unlikely to be harmful. I would personally consider them, but it really depends on the extent of disease, anatomic sites involved, and access to care.”
Emory University’s Dr. Yeung also suggested using silicone gel or sheets to optimize the scar appearance once the lesions have crusted over. “People have used lasers, microneedling, etc., to improve smallpox scar appearance,” he added, “and I’m sure dermatologists will be the ones to study what works best for treating monkeypox scars.”
As for the big picture, Dr. Yeung said that dermatologists are critical in the fight to control monkeypox: “We can help our colleagues and patients manage symptoms and wound care, advocate for vaccination and treatment, treat long-term scarring sequelae, and destigmatize LGBTQ health care.”
The dermatologists interviewed for this article report no disclosures.
Exaggerated Facial Lines on the Forehead and Cheeks
The Diagnosis: Pachydermoperiostosis
Histopathology of the forehead punch biopsy demonstrated sebaceous hyperplasia with an occupation rate of greater than 40%, increased mucin, elastic fiber degeneration, and fibrosis. Pachydermia is graded from 0 to 3 depending on the degree of these changes; our patient met criteria for grade 3 pachydermia (Figure 1). Radiography revealed diffuse cortical thickening of the long bones that was most marked in the left femur (Figure 2); however, no other findings were demonstrative of Paget disease.
. B, Colloidal iron stain demonstrated increased mucin (original magnification ×4). C, Verhoeff-van Gieson stain showed elastic fiber")
Pachydermoperiostosis (PDP)(also known as Touraine-Solente-Golé syndrome or primary hypertrophic osteoarthropathy) is a rare genetic condition that affects both the dermatologic and skeletal systems. Clinical features of the disease include progressive thickening and furrowing of the skin on the scalp and face (known as pachydermia), digital clubbing, and periostosis. Other potential cutaneous features include seborrhea, acne, hyperhidrosis of the palms and soles, cutis verticis gyrata, eczema, and a burning sensation of the hands and feet. Myelofibrosis and gastrointestinal abnormalities also have been reported.1

The disease typically affects males (7:1 ratio); also, men typically display a more severe phenotype of the disease.2 It most commonly begins during puberty and follows a generally progressive course of 5 to 20 years before eventually stabilizing. Both autosomal-dominant with incomplete penetrance and recessive inheritance versions of PDP can occur. Prostaglandin E2 (PGE2) has been implicated in the pathogenesis of PDP; PGE2 is important in the inflammatory response and may evolve from disrupted protein degradation pathways.3 Sasaki et al4 additionally reported that the severity of pachydermia clinically and histologically appeared to correlate with the serum PGE2 levels in affected patients. Prostaglandin E2 causes a vasodilatory effect, perhaps explaining the clubbing observed in PDP, and also modifies the activity of osteoblasts and osteoclasts, causing the bone remodeling observed in the disease.4
In our patient, the initial differential diagnosis included PDP, as well as lepromatous leprosy, acromegaly, Paget disease of the bone, amyloidosis, scleromyxedema, and cutaneous T-cell lymphoma. However, the time course of the disease, lack of numerous symmetric thickened plaques and madarosis, and pathology argued against lepromatous leprosy. Acromegaly was ruled out due to lack of macroglossia as well as laboratory analysis within reference range including IGF-1 levels and thyroid function tests. Biopsy findings ultimately ruled out amyloidosis and cutaneous T-cell lymphoma. The bone scan revealed diffuse cortical thickening consistent with PDP, and there were no other radiologic findings suggestive of Paget disease. Pachydermoperiostosis is diagnosed using the Borochowitz criteria, which entails that 2 of the following 4 fulfillment criteria must be met: familial transmission, pachydermia, digital clubbing, and/or bony involvement with evidence of radiologic alterations or pain. Our patient met all 4 criteria. The clinical manifestations of PDP are variable with respect to skin and bone changes. The various clinical expressions include the complete form (ie, pachydermia, cutis verticis gyrata, periostosis), the incomplete form (ie, absence of cutis verticis gyrata), and forme fruste (ie, pachydermia with minimal or absent periostosis).5
Management for PDP involves surgical correction for cosmesis as well as for functional concerns if present. Symptoms secondary to periostosis should be managed with symptomatic treatment such as nonsteroidal antiinflammatory drugs. Patients managed with etoricoxib, a COX-2–selective nonsteroidal anti-inflammatory drug, have had normalized inflammatory markers that resulted in the lessening of forehead skin folds. Oral aescin has been shown to relieve joint pain due to its antiedematous effect.6 Our patient received treatment with nonsteroidal anti-inflammatory drugs for symptomatic management of the associated joint pain but unfortunately was lost to follow-up.
- Castori M, Sinibaldi L, Mingarelli R, et al. Pachydermoperiostosis: an update. Clin Genet. 2005;68:477-486.
- Reginato AJ, Shipachasse V, Guerrero R. Familial idiopathic hypertrophic osteoarthropathy and cranial suture defects in children. Skel Radiol. 1982;8:105-109.
- Coggins KG, Coffman TM, Koller BH. The Hippocratic finger points the blame at PGE2. Nat Genet. 2008;40:691-692.
- Sasaki T, Niizeki H, Shimizu A, et al. Identification of mutations in the prostaglandin transporter gene SLCO2A1 and its phenotype-genotype correlation in Japanese patients with pachydermoperiostosis. J Dermatol Sci. 2012;68:36-44.
- Bhaskaranand K, Shetty RR, Bhat AK. Pachydermoperiostosis: three case reports. J Orthop Surg (Hong Kong). 2001;9:61-66.
- Zhang H, Yang B. Successful treatment of pachydermoperiostosis patients with etoricoxib, aescin, and arthroscopic synovectomy: two case reports. Medicine (Baltimore). 2017;96:E8865.
The Diagnosis: Pachydermoperiostosis
Histopathology of the forehead punch biopsy demonstrated sebaceous hyperplasia with an occupation rate of greater than 40%, increased mucin, elastic fiber degeneration, and fibrosis. Pachydermia is graded from 0 to 3 depending on the degree of these changes; our patient met criteria for grade 3 pachydermia (Figure 1). Radiography revealed diffuse cortical thickening of the long bones that was most marked in the left femur (Figure 2); however, no other findings were demonstrative of Paget disease.
Pachydermoperiostosis (PDP)(also known as Touraine-Solente-Golé syndrome or primary hypertrophic osteoarthropathy) is a rare genetic condition that affects both the dermatologic and skeletal systems. Clinical features of the disease include progressive thickening and furrowing of the skin on the scalp and face (known as pachydermia), digital clubbing, and periostosis. Other potential cutaneous features include seborrhea, acne, hyperhidrosis of the palms and soles, cutis verticis gyrata, eczema, and a burning sensation of the hands and feet. Myelofibrosis and gastrointestinal abnormalities also have been reported.1
The disease typically affects males (7:1 ratio); also, men typically display a more severe phenotype of the disease.2 It most commonly begins during puberty and follows a generally progressive course of 5 to 20 years before eventually stabilizing. Both autosomal-dominant with incomplete penetrance and recessive inheritance versions of PDP can occur. Prostaglandin E2 (PGE2) has been implicated in the pathogenesis of PDP; PGE2 is important in the inflammatory response and may evolve from disrupted protein degradation pathways.3 Sasaki et al4 additionally reported that the severity of pachydermia clinically and histologically appeared to correlate with the serum PGE2 levels in affected patients. Prostaglandin E2 causes a vasodilatory effect, perhaps explaining the clubbing observed in PDP, and also modifies the activity of osteoblasts and osteoclasts, causing the bone remodeling observed in the disease.4
In our patient, the initial differential diagnosis included PDP, as well as lepromatous leprosy, acromegaly, Paget disease of the bone, amyloidosis, scleromyxedema, and cutaneous T-cell lymphoma. However, the time course of the disease, lack of numerous symmetric thickened plaques and madarosis, and pathology argued against lepromatous leprosy. Acromegaly was ruled out due to lack of macroglossia as well as laboratory analysis within reference range including IGF-1 levels and thyroid function tests. Biopsy findings ultimately ruled out amyloidosis and cutaneous T-cell lymphoma. The bone scan revealed diffuse cortical thickening consistent with PDP, and there were no other radiologic findings suggestive of Paget disease. Pachydermoperiostosis is diagnosed using the Borochowitz criteria, which entails that 2 of the following 4 fulfillment criteria must be met: familial transmission, pachydermia, digital clubbing, and/or bony involvement with evidence of radiologic alterations or pain. Our patient met all 4 criteria. The clinical manifestations of PDP are variable with respect to skin and bone changes. The various clinical expressions include the complete form (ie, pachydermia, cutis verticis gyrata, periostosis), the incomplete form (ie, absence of cutis verticis gyrata), and forme fruste (ie, pachydermia with minimal or absent periostosis).5
Management for PDP involves surgical correction for cosmesis as well as for functional concerns if present. Symptoms secondary to periostosis should be managed with symptomatic treatment such as nonsteroidal antiinflammatory drugs. Patients managed with etoricoxib, a COX-2–selective nonsteroidal anti-inflammatory drug, have had normalized inflammatory markers that resulted in the lessening of forehead skin folds. Oral aescin has been shown to relieve joint pain due to its antiedematous effect.6 Our patient received treatment with nonsteroidal anti-inflammatory drugs for symptomatic management of the associated joint pain but unfortunately was lost to follow-up.
- Castori M, Sinibaldi L, Mingarelli R, et al. Pachydermoperiostosis: an update. Clin Genet. 2005;68:477-486.
- Reginato AJ, Shipachasse V, Guerrero R. Familial idiopathic hypertrophic osteoarthropathy and cranial suture defects in children. Skel Radiol. 1982;8:105-109.
- Coggins KG, Coffman TM, Koller BH. The Hippocratic finger points the blame at PGE2. Nat Genet. 2008;40:691-692.
- Sasaki T, Niizeki H, Shimizu A, et al. Identification of mutations in the prostaglandin transporter gene SLCO2A1 and its phenotype-genotype correlation in Japanese patients with pachydermoperiostosis. J Dermatol Sci. 2012;68:36-44.
- Bhaskaranand K, Shetty RR, Bhat AK. Pachydermoperiostosis: three case reports. J Orthop Surg (Hong Kong). 2001;9:61-66.
- Zhang H, Yang B. Successful treatment of pachydermoperiostosis patients with etoricoxib, aescin, and arthroscopic synovectomy: two case reports. Medicine (Baltimore). 2017;96:E8865.
A 36-year-old man presented to the emergency department with an olecranon fracture after falling from a tree. The patient had a medical history of type 2 diabetes mellitus and a surgical history of facial cosmetic surgery. He underwent internal fixation with orthopedic surgery for the olecranon fracture, and dermatology subsequently was consulted due to diffuse skin changes on the face. He reported that these dermatologic changes began around 17 years of age and had progressed to the current presentation. He denied itching, burning, pain, or contact with armadillos. A family history revealed the patient’s brother also had a similar appearance. Physical examination revealed exaggerated facial lines on the forehead (top) and cheeks. Digital clubbing and skin thickening were noted on the hands (bottom) and feet; examination of the back revealed multiple hypopigmented patches. Observation of the scalp showed multiple symmetric ridges and grooves with sparse overlying hair consistent with cutis verticis gyrata. A punch biopsy of the forehead was obtained as well as bone radiography taken previously by the primary team.


Children and COVID: ED visits and new admissions change course
New child cases of COVID-19 made at least a temporary transition from slow increase to decrease, and emergency department visits and new admissions seem to be following a downward trend.
, according to a report from the American Academy of Pediatrics and the Children’s Hospital Association. For some historical perspective, the latest weekly count falls below last year’s Delta surge figure of 121,000 (Aug. 6-12) but above the summer 2020 total of 26,000 (Aug. 7-13).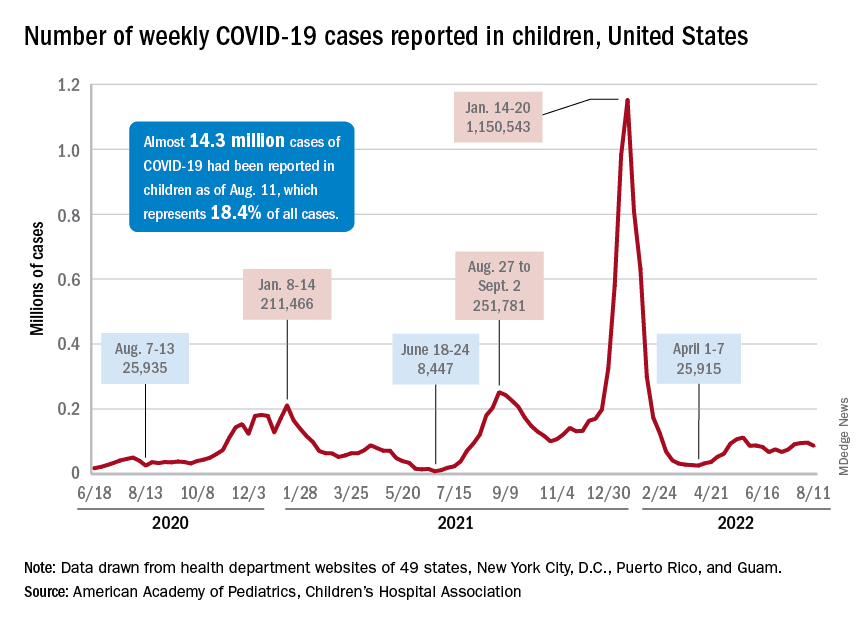
Measures of serious illness finally head downward
The prolonged rise in ED visits and new admissions over the last 5 months, which continued even through late spring when cases were declining, seems to have peaked, CDC data suggest.
That upward trend, driven largely by continued increases among younger children, peaked in late July, when 6.7% of all ED visits for children aged 0-11 years involved diagnosed COVID-19. The corresponding peaks for older children occurred around the same time but were only about half as high: 3.4% for 12- to 15-year-olds and 3.6% for those aged 16-17, the CDC reported.
The data for new admissions present a similar scenario: an increase starting in mid-April that continued unabated into late July despite the decline in new cases. By the time admissions among children aged 0-17 years peaked at 0.46 per 100,000 population in late July, they had reached the same level seen during the Delta surge. By Aug. 7, the rate of new hospitalizations was down to 0.42 per 100,000, the CDC said on its COVID Data Tracker.
The vaccine is ready for all students, but …
As children all over the country start or get ready to start a new school year, the only large-scale student vaccine mandate belongs to the District of Columbia. California has a mandate pending, but it will not go into effect until after July 1, 2023. There are, however, 20 states that have banned vaccine mandates for students, according to the National Academy for State Health Policy.
Nonmandated vaccination of the youngest children against COVID-19 continues to be slow. In the approximately 7 weeks (June 19 to Aug. 9) since the vaccine was approved for use in children younger than 5 years, just 4.4% of that age group has received at least one dose and 0.7% are fully vaccinated. Among those aged 5-11 years, who have been vaccine-eligible since early November of last year, 37.6% have received at least one dose and 30.2% are fully vaccinated, the CDC said.
Hearing aids available in October without a prescription
The White House announced today that the Food and Drug Administration will move forward with plans to make hearing aids available over the counter in pharmacies, other retail locations, and online.
This major milestone aims to make hearing aids easier to buy and more affordable, potentially saving families thousands of dollars.
An estimated 28.8 million U.S. adults could benefit from using hearing aids, according to numbers from the National Institute on Deafness and Other Communication Disorders. But only about 16% of people aged 20-69 years who could be helped by hearing aids have ever used them.
The risk for hearing loss increases with age. Among Americans ages 70 and older, only 30% who could hear better with these devices have ever used them, the institute reports.
Once the FDA final rule takes effect, Americans with mild to moderate hearing loss will be able to buy a hearing aid without a doctor’s exam, prescription, or fitting adjustment.
President Joe Biden announced in 2021 he intended to allow hearing aids to be sold over the counter without a prescription to increase competition among manufacturers. Congress also passed bipartisan legislation in 2017 requiring the FDA to create a new category for hearing aids sold directly to consumers. Some devices intended for minors or people with severe hearing loss will remain available only with a prescription.
“This action makes good on my commitment to lower costs for American families, delivering nearly $3,000 in savings to American families for a pair of hearing aids and giving people more choices to improve their health and wellbeing,” the president said in a statement announcing the news.
The new over-the-counter hearing aids will be considered medical devices. To avoid confusion, the FDA explains the differences between hearing aids and personal sound amplification products (PSAPs). For example, PSAPs are considered electronic devices designed for people with normal hearing to use in certain situations, like birdwatching or hunting.
A version of this article first appeared on WebMD.com.
Diagnosing children with long COVID can be tricky: Experts
When Spencer Siedlecki got COVID-19 in March 2021, he was sick for weeks with extreme fatigue, fevers, a sore throat, bad headaches, nausea, and eventually, pneumonia.
That was scary enough for the then-13-year-old and his parents, who live in Ohio. More than a year later, Spencer still had many of the symptoms and, more alarming, the once-healthy teen had postural orthostatic tachycardia syndrome, a condition that has caused dizziness, a racing heart when he stands, and fainting. Spencer missed most of the last few months of eighth grade because of long COVID.
“He gets sick very easily,” said his mother, Melissa Siedlecki, who works in technology sales. “The common cold that he would shake off in a few days takes weeks for him to feel better.”
The transformation from regular teen life to someone with a chronic illness “sucked,” said Spencer, who will turn 15 in August. “I felt like I was never going to get better.” Fortunately, after some therapy at a specialized clinic, Spencer is back to playing baseball and golf.
Spencer’s journey to better health was difficult; his regular pediatrician told the family at first that there were no treatments to help him – a reaction that is not uncommon. “I still get a lot of parents who heard of me through the grapevine,” said Amy Edwards, MD, director of the pediatric COVID clinic at University Hospitals Rainbow Babies & Children’s and an assistant professor of pediatrics at Case Western Reserve University, both in Cleveland. “The pediatricians either are unsure of what is wrong, or worse, tell children ‘there is nothing wrong with you. Stop faking it.’ ” Dr. Edwards treated Spencer after his mother found the clinic through an internet search.
Alexandra Yonts, MD, a pediatric infectious diseases doctor and director of the post-COVID program clinic at Children’s National Medical Center in Washington, has seen this too. she said.
But those who do get attention tend to be White and affluent, something Dr. Yonts said “doesn’t jibe with the epidemiologic data of who COVID has affected the most.” Black, Latino, and American Indian and Alaska Native children are more likely to be infected with COVID than White children, and have higher rates of hospitalization and death than White children.
It’s not clear whether these children have a particular risk factor, or if they are just the ones who have the resources to get to the clinics. But Dr. Yonts and Dr. Edwards believe many children are not getting the help they need. High-performing kids are coming in “because they are the ones whose symptoms are most obvious,” said Dr. Edwards. “I think there are kids out there who are getting missed because they’re already struggling because of socioeconomic reasons.”
Spencer is one of 14 million children who have tested positive for SARS-CoV-2 since the start of the pandemic. Many pediatricians are still grappling with how to address cases like Spencer’s. The American Academy of Pediatrics has issued only brief guidance on long COVID in children, in part because there have been so few studies to use as a basis for guidance.
The federal government is aiming to change that with a newly launched National Research Action Plan on Long COVID that includes speeding up research on how the condition affects children and youths, including their ability to learn and thrive.
A CDC study found children with COVID were significantly more likely to have smell and taste disturbances, circulatory system problems, fatigue and malaise, and pain. Those who had been infected had higher rates of acute blockage of a lung artery, myocarditis and weakening of the heart, kidney failure, and type 1 diabetes.
Difficult to diagnose
Even with increased media attention and more published studies on pediatric long COVID, it’s still hard for a busy primary care doctor “to sort through what could just be a cold or what could be a series of colds and trying to look at the bigger picture of what’s been going on in a 1- to 3-month period with a kid,” Dr. Yonts said.
Most children with potential or definite long COVID are still being seen by individual pediatricians, not in a specialized clinic with easy access to an army of specialists. It’s not clear how many of those pediatric clinics exist. Survivor Corps, an advocacy group for people with long COVID, has posted a map of locations providing care, but few are specialized or focus on pediatric long COVID.
Long COVID is different from multisystem inflammatory syndrome in children (MIS-C), which occurs within a month or so of infection, triggers high fevers and severe symptoms in the gut, and often results in hospitalization. MIS-C “is not subtle,” said Dr. Edwards.
The long COVID clinic doctors said most of their patients were not very sick at first. “Anecdotally, of the 83 kids that we’ve seen, most have had mild, very mild, or even asymptomatic infections initially,” and then went on to have long COVID, said Dr. Yonts.
“We see it even in children who have very mild disease or even are asymptomatic,” agreed Allison Eckard, MD, director of pediatric infectious diseases at the Medical University of South Carolina, Charleston.
Fatigue, mood problems
Dr. Yonts said 90% of her patients have fatigue, and many also have severe symptoms in their gut. Those and other long COVID symptoms will be looked at more closely in a 3-year study the Children’s National Medical Center is doing along with the National Institute of Allergy and Infectious Diseases.
There are no treatments for long COVID itself.
“Management is probably more the correct term for what we do in our clinic at this point,” said Dr. Yonts. That means dealing with fatigue and managing headache and digestive symptoms with medications or coping strategies. Guidelines from the American Academy of Physical Medicine and Rehabilitation help inform how to help kids safely resume exercise.
At the Children’s National Medical Center clinic, children will typically meet with a team of specialists including infectious diseases doctors on the same day, said Dr. Yonts. Psychologists help children with coping skills. Dr. Yonts is careful not to imply that long COVID is a psychological illness. Parents “will just shut down, because for so long, they’ve been told this is all a mental thing.”
In about a third of children, symptoms get better on their own, and most kids get better over time. But many still struggle. “We don’t talk about cure, because we don’t know what cure looks like,” said Dr. Edwards.
Vaccination may be best protection
Vaccination seems to help reduce the risk of long COVID, perhaps by as much as half. But parents have been slow to vaccinate children, especially the very young. The AAP reported that, as of Aug. 3, just 5% of children under age 5, 37% of those ages 5-11, and 69% of 12- to 17-year-olds have received at least one dose of a COVID-19 vaccine.
“We have tried to really push vaccine as one of the ways to help prevent some of these long COVID syndromes,” said Dr. Eckard. But that advice is not always welcome. Dr. Eckard told the story of a mother who refused to have her autistic son vaccinated, even as she tearfully pleaded for help with his long COVID symptoms, which had also worsened his autism. The woman told Dr. Eckard: “Nothing you can say will convince me to get him vaccinated.” She thought a vaccine could make his symptoms even worse.
The best prevention is to avoid being infected in the first place.
“The more times you get COVID, the more you increase your risk of getting long COVID,” said Dr. Yonts. “The more times you roll the dice, eventually your number could come up.
A version of this article first appeared on WebMD.com.
‘Obesity paradox’ in AFib challenged as mortality climbs with BMI
The relationship between body mass index (BMI) and all-cause mortality in patients with atrial fibrillation (AFib) is U-shaped, with the risk highest in those who are underweight or severely obese and lowest in patients defined simply as obese, a registry analysis suggests. It also showed a similar relationship between BMI and risk for new or worsening heart failure (HF).
Mortality bottomed out at a BMI of about 30-35 kg/m2, which suggests that mild obesity was protective, compared even with “normal-weight” or “overweight” BMI. Still, mortality went up sharply from there with rising BMI.
But higher BMI, a surrogate for obesity, apparently didn’t worsen outcomes by itself. The risk for death from any cause at higher obesity levels was found to depend a lot on related risk factors and comorbidities when the analysis controlled for conditions such as diabetes and hypertension.
The findings suggest an inverse relationship between BMI and all-cause mortality in AFib only for patients with BMI less than about 30. They therefore argue against any “obesity paradox” in AFib that posits consistently better survival with increasing levels of obesity, say researchers, based on their analysis of patients with new-onset AFib in the GARFIELD-AF registry.
“It’s common practice now for clinicians to discuss weight within a clinic setting when they’re talking to their AFib patients,” observed Christian Fielder Camm, BM, BCh, University of Oxford (England), and Royal Berkshire NHS Foundation Trust, Reading, England. So studies suggesting an inverse association between BMI and AFib-related risk can be a concern.
Such studies “seem to suggest that once you’ve got AFib, maintaining a high or very high BMI may in some way be protective – which is contrary to what would seem to make sense and certainly contrary to what our results have shown,” Dr. Camm told this news organization.
“I think that having further evidence now to suggest, actually, that greater BMI is associated with a greater risk of all-cause mortality and heart failure helps reframe that discussion at the physician-patient interaction level more clearly, and ensures that we’re able to talk to our patients appropriately about risks associated with BMI and atrial fibrillation,” said Dr. Camm, who is lead author on the analysis published in Open Heart.
“Obesity is a cause of most cardiovascular diseases, but [these] data would support that being overweight or having mild obesity does not increase the risk,” observed Carl J. Lavie, MD, of the John Ochsner Heart and Vascular Institute, New Orleans, La., and the Ochsner Clinical School at the University of Queensland, Brisbane, Australia.
“At a BMI of 40, it’s very important for them to lose weight for their long-term prognosis,” Dr. Lavie noted, but “at a BMI of 30, the important thing would be to prevent further weight gain. And if they could keep their BMI of 30, they should have a good prognosis. Their prognosis would be particularly good if they didn’t gain weight and put themselves in a more extreme obesity class that is associated with worse risk.”

The current analysis, Dr. Lavie said, “is way better than the AFFIRM study,” which yielded an obesity-paradox report on its patients with AFib about a dozen years ago. “It’s got more data, more numbers, more statistical power,” and breaks BMI into more categories.
That previous analysis based on the influential AFFIRM randomized trial separated its 4,060 patients with AFib into normal (BMI, 18.5-25), overweight (BMI, 25-30), and obese (BMI, > 30) categories, per the convention at the time. It concluded that “obese patients with atrial fibrillation appear to have better long-term outcomes than nonobese patients.”
Bleeding risk on oral anticoagulants
Also noteworthy in the current analysis, variation in BMI didn’t seem to affect mortality or risk for major bleeding or nonhemorrhagic stroke according to choice of oral anticoagulant – whether a new oral anticoagulant (NOAC) or a vitamin K antagonist (VKA).
“We saw that even in the obese and extremely obese group, all-cause mortality was lower in the group taking NOACs, compared with taking warfarin,” Dr. Camm observed, “which goes against the idea that we would need any kind of dose adjustments for increased BMI.”
Indeed, the report notes, use of NOACs, compared with VKA, was associated with a 23% drop in risk for death among patients who were either normal weight or overweight and also in those who were obese or extremely obese.
Those findings “are basically saying that the NOACs look better than warfarin regardless of weight,” agreed Dr. Lavie. “The problem is that the study is not very powered.”
Whereas the benefits of NOACs, compared to VKA, seem similar for patients with a BMI of 30 or 34, compared with a BMI of 23, for example, “none of the studies has many people with 50 BMI.” Many clinicians “feel uncomfortable giving the same dose of NOAC to somebody who has a 60 BMI,” he said. At least with warfarin, “you can check the INR [international normalized ratio].”
The current analysis included 40,482 patients with recently diagnosed AFib and at least one other stroke risk factor from among the registry’s more than 50,000 patients from 35 countries, enrolled from 2010 to 2016. They were followed for 2 years.
The 703 patients with BMI under 18.5 at AFib diagnosis were classified per World Health Organization definitions as underweight; the 13,095 with BMI 18.5-25 as normal weight; the 15,043 with BMI 25-30 as overweight; the 7,560 with BMI 30-35 as obese; and the 4,081 with BMI above 35 as extremely obese. Their ages averaged 71 years, and 55.6% were men.
BMI effects on different outcomes
Relationships between BMI and all-cause mortality and between BMI and new or worsening HF emerged as U-shaped, the risk climbing with both increasing and decreasing BMI. The nadir BMI for risk was about 30 in the case of mortality and about 25 for new or worsening HF.
The all-cause mortality risk rose by 32% for every 5 BMI points lower than a BMI of 30, and by 16% for every 5 BMI points higher than 30, in a partially adjusted analysis. The risk for new or worsening HF rose significantly with increasing but not decreasing BMI, and the reverse was observed for the endpoint of major bleeding.
The effect of BMI on all-cause mortality was “substantially attenuated” when the analysis was further adjusted with “likely mediators of any association between BMI and outcomes,” including hypertension, diabetes, HF, cerebrovascular events, and history of bleeding, Dr. Camm said.
That blunted BMI-mortality relationship, he said, “suggests that a lot of the effect is mediated through relatively traditional risk factors like hypertension and diabetes.”
The 2010 AFFIRM analysis by BMI, Dr. Lavie noted, “didn’t even look at the underweight; they actually threw them out.” Yet, such patients with AFib, who tend to be extremely frail or have chronic diseases or conditions other than the arrhythmia, are common. A take-home of the current study is that “the underweight with atrial fibrillation have a really bad prognosis.”
That message isn’t heard as much, he observed, “but is as important as saying that BMI 30 has the best prognosis. The worst prognosis is with the underweight or the really extreme obese.”
Dr. Camm discloses research funding from the British Heart Foundation. Disclosures for the other authors are in the report. Dr. Lavie has previously disclosed serving as a speaker and consultant for PAI Health and DSM Nutritional Products and is the author of “The Obesity Paradox: When Thinner Means Sicker and Heavier Means Healthier” (Avery, 2014).
A version of this article first appeared on Medscape.com.
The relationship between body mass index (BMI) and all-cause mortality in patients with atrial fibrillation (AFib) is U-shaped, with the risk highest in those who are underweight or severely obese and lowest in patients defined simply as obese, a registry analysis suggests. It also showed a similar relationship between BMI and risk for new or worsening heart failure (HF).
Mortality bottomed out at a BMI of about 30-35 kg/m2, which suggests that mild obesity was protective, compared even with “normal-weight” or “overweight” BMI. Still, mortality went up sharply from there with rising BMI.
But higher BMI, a surrogate for obesity, apparently didn’t worsen outcomes by itself. The risk for death from any cause at higher obesity levels was found to depend a lot on related risk factors and comorbidities when the analysis controlled for conditions such as diabetes and hypertension.
The findings suggest an inverse relationship between BMI and all-cause mortality in AFib only for patients with BMI less than about 30. They therefore argue against any “obesity paradox” in AFib that posits consistently better survival with increasing levels of obesity, say researchers, based on their analysis of patients with new-onset AFib in the GARFIELD-AF registry.
“It’s common practice now for clinicians to discuss weight within a clinic setting when they’re talking to their AFib patients,” observed Christian Fielder Camm, BM, BCh, University of Oxford (England), and Royal Berkshire NHS Foundation Trust, Reading, England. So studies suggesting an inverse association between BMI and AFib-related risk can be a concern.
Such studies “seem to suggest that once you’ve got AFib, maintaining a high or very high BMI may in some way be protective – which is contrary to what would seem to make sense and certainly contrary to what our results have shown,” Dr. Camm told this news organization.
“I think that having further evidence now to suggest, actually, that greater BMI is associated with a greater risk of all-cause mortality and heart failure helps reframe that discussion at the physician-patient interaction level more clearly, and ensures that we’re able to talk to our patients appropriately about risks associated with BMI and atrial fibrillation,” said Dr. Camm, who is lead author on the analysis published in Open Heart.
“Obesity is a cause of most cardiovascular diseases, but [these] data would support that being overweight or having mild obesity does not increase the risk,” observed Carl J. Lavie, MD, of the John Ochsner Heart and Vascular Institute, New Orleans, La., and the Ochsner Clinical School at the University of Queensland, Brisbane, Australia.
“At a BMI of 40, it’s very important for them to lose weight for their long-term prognosis,” Dr. Lavie noted, but “at a BMI of 30, the important thing would be to prevent further weight gain. And if they could keep their BMI of 30, they should have a good prognosis. Their prognosis would be particularly good if they didn’t gain weight and put themselves in a more extreme obesity class that is associated with worse risk.”
The current analysis, Dr. Lavie said, “is way better than the AFFIRM study,” which yielded an obesity-paradox report on its patients with AFib about a dozen years ago. “It’s got more data, more numbers, more statistical power,” and breaks BMI into more categories.
That previous analysis based on the influential AFFIRM randomized trial separated its 4,060 patients with AFib into normal (BMI, 18.5-25), overweight (BMI, 25-30), and obese (BMI, > 30) categories, per the convention at the time. It concluded that “obese patients with atrial fibrillation appear to have better long-term outcomes than nonobese patients.”
Bleeding risk on oral anticoagulants
Also noteworthy in the current analysis, variation in BMI didn’t seem to affect mortality or risk for major bleeding or nonhemorrhagic stroke according to choice of oral anticoagulant – whether a new oral anticoagulant (NOAC) or a vitamin K antagonist (VKA).
“We saw that even in the obese and extremely obese group, all-cause mortality was lower in the group taking NOACs, compared with taking warfarin,” Dr. Camm observed, “which goes against the idea that we would need any kind of dose adjustments for increased BMI.”
Indeed, the report notes, use of NOACs, compared with VKA, was associated with a 23% drop in risk for death among patients who were either normal weight or overweight and also in those who were obese or extremely obese.
Those findings “are basically saying that the NOACs look better than warfarin regardless of weight,” agreed Dr. Lavie. “The problem is that the study is not very powered.”
Whereas the benefits of NOACs, compared to VKA, seem similar for patients with a BMI of 30 or 34, compared with a BMI of 23, for example, “none of the studies has many people with 50 BMI.” Many clinicians “feel uncomfortable giving the same dose of NOAC to somebody who has a 60 BMI,” he said. At least with warfarin, “you can check the INR [international normalized ratio].”
The current analysis included 40,482 patients with recently diagnosed AFib and at least one other stroke risk factor from among the registry’s more than 50,000 patients from 35 countries, enrolled from 2010 to 2016. They were followed for 2 years.
The 703 patients with BMI under 18.5 at AFib diagnosis were classified per World Health Organization definitions as underweight; the 13,095 with BMI 18.5-25 as normal weight; the 15,043 with BMI 25-30 as overweight; the 7,560 with BMI 30-35 as obese; and the 4,081 with BMI above 35 as extremely obese. Their ages averaged 71 years, and 55.6% were men.
BMI effects on different outcomes
Relationships between BMI and all-cause mortality and between BMI and new or worsening HF emerged as U-shaped, the risk climbing with both increasing and decreasing BMI. The nadir BMI for risk was about 30 in the case of mortality and about 25 for new or worsening HF.
The all-cause mortality risk rose by 32% for every 5 BMI points lower than a BMI of 30, and by 16% for every 5 BMI points higher than 30, in a partially adjusted analysis. The risk for new or worsening HF rose significantly with increasing but not decreasing BMI, and the reverse was observed for the endpoint of major bleeding.
The effect of BMI on all-cause mortality was “substantially attenuated” when the analysis was further adjusted with “likely mediators of any association between BMI and outcomes,” including hypertension, diabetes, HF, cerebrovascular events, and history of bleeding, Dr. Camm said.
That blunted BMI-mortality relationship, he said, “suggests that a lot of the effect is mediated through relatively traditional risk factors like hypertension and diabetes.”
The 2010 AFFIRM analysis by BMI, Dr. Lavie noted, “didn’t even look at the underweight; they actually threw them out.” Yet, such patients with AFib, who tend to be extremely frail or have chronic diseases or conditions other than the arrhythmia, are common. A take-home of the current study is that “the underweight with atrial fibrillation have a really bad prognosis.”
That message isn’t heard as much, he observed, “but is as important as saying that BMI 30 has the best prognosis. The worst prognosis is with the underweight or the really extreme obese.”
Dr. Camm discloses research funding from the British Heart Foundation. Disclosures for the other authors are in the report. Dr. Lavie has previously disclosed serving as a speaker and consultant for PAI Health and DSM Nutritional Products and is the author of “The Obesity Paradox: When Thinner Means Sicker and Heavier Means Healthier” (Avery, 2014).
A version of this article first appeared on Medscape.com.
FROM OPEN HEART
Strength training overcomes bone effects of vegan diet
People who maintain a vegan diet show significant deficits in bone microarchitecture, compared with omnivores; however, resistance training not only appears to improve those deficits but may have a stronger effect in vegans, suggesting an important strategy in maintaining bone health with a vegan diet.
“We expected better bone structure in both vegans and omnivores who reported resistance training,” first author Robert Wakolbinger-Habel, MD, PhD, of St. Vincent Hospital Vienna and the Medical University of Vienna, said in an interview.
“However, we expected [there would still be] differences in structure between vegans and omnivores [who practiced resistance training], as previous literature reported higher fracture rates in vegans,” he said. “Still, the positive message is that ‘pumping iron’ could counterbalance these differences between vegans and omnivores.”
The research was published online in The Endocrine Society’s Journal of Clinical Endocrinology & Metabolism.
Exercise significantly impacts bone health in vegans
The potential effects of the plant-based vegan diet on bone health have been reported in studies linking the diet to an increased risk of fractures and lower bone mineral density (BMD), with common theories including lower bone- and muscle-building protein in vegan diets.
However, most previous studies have not considered other key factors, such as the effects of exercise, the authors noted.
“While previous studies on bone health in vegans only took BMD, biochemical and nutritional parameters into account, they did not consider the significant effects of physical activity,” they wrote.
“By ignoring these effects, important factors influencing bone health are neglected.”
For the study, 88 participants were enrolled in Vienna, with vegan participants recruited with the help of the Austrian Vegan Society.
Importantly, the study documented participants’ bone microarchitecture, a key measure of bone strength that has also not been previously investigated in vegans, using high-resolution peripheral quantitative CT.
Inclusion criteria included maintaining an omnivore diet of meat and plant-based foods or a vegan diet for at least 5 years, not being underweight or obese (body mass index [BMI], 18.5-30 kg/m2), being age 30-50 years, and being premenopausal.
Of the participants, 43 were vegan and 45 were omnivores, with generally equal ratios of men and women.
Vegan bone deficits disappear with strength training
Overall, compared with omnivores, the vegan group showed significant deficits in 7 of 14 measures of BMI-adjusted trabecular and cortical structure (all P < .05).
Among participants who reported no resistance training, vegans still showed significant decreases in bone microarchitecture, compared with omnivores, including radius trabecular BMD, radius trabecular bone volume fraction, and other tibial and cortical bone microarchitecture measures.
However, among those who did report progressive resistant training (20 vegans and 25 omnivores), defined as using machines, free weights, or bodyweight resistance exercises at least once a week, those differences disappeared and there were no significant differences in BMI-adjusted bone microarchitecture between vegans and omnivores after the 5 years.
Of note, no significant differences in bone microarchitecture were observed between those who performed exclusively aerobic activities and those who reported no sports activities in the vegan or omnivore group.
Based on the findings, “other types of exercise such as aerobics, cycling, etc, would not be sufficient for a similar positive effect on bone [as resistance training],” Dr. Wakolbinger-Habel said.
Although the findings suggest that resistance training seemed to allow vegans to “catch up” with omnivores in terms of bone microarchitecture, Dr. Wakolbinger-Habel cautioned that a study limitation is the relatively low number of participants.
“The absolute numbers suggest that in vegans the differences, and the relative effect, respectively of resistance training might be larger,” he said. “However, the number of participants in the subgroups is small and it is still an observational study, so we need to be careful in drawing causal conclusions.”
Serum bone markers were within normal ranges across all subgroups. And although there were some correlations between nutrient intake and bone microarchitecture among vegans who did and did not practice resistance training, no conclusions could be drawn from that data, the authors noted.
“Based on our data, the structural [differences between vegans and omnivores] cannot solely be explained by deficits in certain nutrients according to lifestyle,” the authors concluded.
Mechanisms
The mechanisms by which progressive resistance training could result in the benefits include that mechanical loads trigger stimulation of key pathways involved in bone formation, or mechanotransduction, the authors explained.
The unique effects have been observed in other studies, including one study showing that, among young adult runners, the addition of resistance training once a week was associated with significantly greater BMD.
“Veganism is a global trend with strongly increasing numbers of people worldwide adhering to a purely plant-based diet,” first author Christian Muschitz, MD, also of St. Vincent Hospital Vienna and the Medical University of Vienna, said in a press statement.
“Our study showed resistance training offsets diminished bone structure in vegan people when compared to omnivores,” he said.
Dr. Wakolbinger-Habel recommended that, based on the findings, “exercise, including resistance training, should be strongly advocated [for vegans], I would say, at least two times per week.”
The authors reported no relevant financial relationships.
A version of this article first appeared on Medscape.com.
FROM THE JOURNAL OF CLINICAL ENDOCRINOLOGY & METABOLISM
Review cautions against influencer-promoted hair-growth remedies
One day in 2020, Ronda S. Farah, MD, was spending some downtime from her dermatology practice scrolling through social media. When she opened TikTok, she came across something that piqued her interest: A popular content creator was promoting the supplement biotin as a way to grow hair. Dr. Farah was immediately alarmed, because not only was the evidence that biotin increases hair growth shoddy, but the FDA had also warned that biotin supplements may interfere with lab tests for troponin.
Dr. Farah was moved to action and made a brief TikTok stating that use of biotin does not result in hair growth for most patients, which quickly shot up to over half a million views. She was flooded with messages from influencers and people desperate for an answer to their hair growth questions.
From that point on, Dr. Farah was immersed in the world of hairfluencers, the social media personalities who promote hair care trends, which formed the basis of a review, published in the Journal of Cosmetic Dermatology that she conducted with her colleagues at the University of Minnesota, Minneapolis. .
They reviewed five treatments that represent some of the most frequently discussed hair-growth trends on social media: rosemary, onion juice, rice water, castor oil, and aloe vera. For each, they evaluated recommendations on how the treatments were applied, possible harmful effects to the user, claims that weren’t totally based on scientific evidence, and the theoretical mechanism of action. “Overall,” they concluded, “there is little to no literature supporting these social media trends for hair growth.”
Of the five, rosemary, applied to the scalp or hair, has perhaps the most significant research behind it, according to Dr. Farah and coauthors. Methods of applying rosemary described on social media included use of prepackaged oil, boiling fresh rosemary leaves, adding leaves to oils and spraying it on or massaging it on the scalp, applying it in the hair, or using it as a rinse. Dr. Farah noted that the literature supporting the use of rosemary for hair growth does not represent the most robust science; the studies had small sample sizes and used nonstandardized methods of measuring hair growth.
“It didn’t really meet rigorous, strong study methods that a board-certified dermatologist with their expertise would consider a really solid study,” she said.
For the remaining methods, there was little research to support their use for hair growth. A few, the authors pointed out, can cause scalp burns (aloe vera), damage to hair follicles (rice water), contact dermatitis (aloe vera, onion juice), and, in the case of castor oil, hair felting..
Dr. Farah thinks social media can be a great tool to reach patients, but that people should be wary of what kind of information they’re consuming “and need to be aware of who their hairfluencer is,” she said. And, as she and her coauthors wrote: “We call on dermatologists, as hair and scalp disease experts, to serve as authorities on ‘hairfluencer’ trends and appropriately counsel patients.”
The study was independently supported. Dr. Farah reports no relevant financial relationships.
A version of this article first appeared on Medscape.com.
FROM THE JOURNAL OF COSMETIC DERMATOLOGY
Blood pressure smartphone app fails to beat standard self-monitoring
Here’s another vote for less screen time.
“By itself, standard self-measured blood pressure (SMBP) has minimal effect on BP control,” wrote lead author Mark J. Pletcher, MD, of the University of California, San Francisco, and colleagues in JAMA Internal Medicine. “To improve BP control, SMBP must be accompanied by patient feedback, counseling, or other cointerventions, and the BP-lowering effects of SMBP appear to be proportional to the intensity of the cointervention.”
While this is known, higher-intensity cointerventions demand both money and time, prompting development of new devices that link with smartphone apps, they continued.
In the prospective randomized trial, patients with hypertension were randomly assigned to self-measure their blood pressure using a standard device that paired with a connected smartphone application or to self-measure their blood pressure with a standard device alone. Both groups achieved about an 11 mm Hg reduction in systolic BP over 6 months, reported similar levels of satisfaction with the monitoring process, and shared their readings with their physicians with similar frequency.
Methods
Dr. Pletcher and colleagues enrolled 2,101 adults who self-reported a systolic BP greater than 145 mm Hg and expressed a commitment to reduce their BP by at least 10 points in their trial. The participants, who were generally middle-aged or older, were randomized in a 1:1 ratio to monitor their BP using standard SMBP or “enhanced” SMBP. The standard group used the OMRON BP monitor alone, while the enhanced group used the same BP monitor coupled with the OMRON Connect smartphone app.
After 6 months of follow-up for each patient, mean BP reduction from baseline in the standard group was 10.6 mm Hg, compared with 10.7 mm Hg in the enhanced group, a nonsignificant difference (P = .81). While slightly more patients in the enhanced group achieved a BP lower than 140/90 mm Hg (32% vs. 29%; odds ratio, 1.17; 95% confidence interval, 1.01-1.34), this trend did not extend below the 130/80 mm Hg threshold.
Other secondary outcomes were also similar between groups. For example, 70% of participants in the enhanced group said they would recommend their SMBP process to a friend, compared with 69% of participants who followed the standard monitoring approach. The smartphone app had little impact on sharing readings with physicians, either, based on a 44% share rate in the enhanced group versus 48% in the standard group (P = .22).
“Enhanced SMBP does not provide any additional reduction in BP,” the investigators concluded.
New devices that link with smartphone apps, like the one used in this trial, “transmit BP measurements via wireless connection to the patient’s smartphone, where they are processed in a smartphone application to support tracking, visualization, interpretation, reminders to measure BP and/or take medications; recommendations for lifestyle interventions, medication adherence, or to discuss their BP with their clinician; and communications (for example, emailing a summary to a family member or clinician),” the researchers explained. While these devices are “only slightly more expensive than standard SMBP devices,” their relative efficacy over standard SMBP is “unclear.”
Findings can likely be extrapolated to other apps
Although the trial evaluated just one smartphone app, Dr. Pletcher suggested that the findings can likely be extrapolated to other apps.
“Most basic BP-tracking apps have some version or subset of the same essential functionality,” he said, in an interview. “My guess is that apps that meet this description without some substantially different technology or feature would likely show the same basic results as we did.”
Making a similar remark, Matthew Jung, MD, of Keck Medicine of USC, Los Angeles, stated that the findings can be “reasonably extrapolated” to other BP-tracking apps with similar functionality “if we put aside the study’s issues with power.”
When it comes to smartphone apps, active engagement is needed to achieve greater impacts on blood pressure, Dr. Pletcher said, but “there is so much competition for people’s attention on their phone that it is hard to maintain active engagement with any health-related app for long.”
Still, Dr. Pletcher hasn’t given up on biometric apps, noting that “with the right technology and connectivity and user experience (for both patient and clinician), they still could be game-changing for managing chronic conditions like hypertension.”
To this end, he and his colleagues are exploring technologies to passively monitor health-related measurements like BP, potentially sidestepping the pitfall of active engagement.
Dr. Jung said the study is noteworthy for several reasons, including its large size, similar level of comfort with technology reported by both groups, and representation of Black and Hispanic participants, who accounted for almost one-third of the population.
Study limitations
Dr. Jung pointed out several study limitations, including the lack of standardized measurement of BP, which left more than one-third of patients unevaluated via chart review, as well as gaps in usage data, such as that one-third of the participants never confirmed receipt of a device, and less than half of the enhanced group reported using the smartphone application.
These limitations “may have detracted from its ability to identify the true efficacy of an enhanced app-based BP tracking device,” he said. “In contrast, each of these issues also helped us get a better picture for how well these devices may work in the real world.”
Dr. Jung also commented on the duration of the study, noting that only 10 weeks passed, on average, from baseline to follow-up BP measurement, which “may not have been sufficient for a possible difference between enhanced and standard BP monitoring to become noticeable.”
“This may be especially important when taking into consideration the time required to mail the devices out to patients, for patients to become familiar with usage of the devices, and for them to start using the devices in a meaningful way,” he added.
The study was supported the Patient-Centered Outcomes Research Institute, the American Medical Association, and the American Heart Association. The investigators disclosed additional relationships with Pfizer, Bristol Myers Squibb, and Novartis. Dr. Jung, who was not involved in the study, disclosed no relevant conflicts of interest.
FROM JAMA INTERNAL MEDICINE