User login
Native Americans Embrace the COVID-19 Vaccines ‘to Protect the Community and Preserve the Culture’
A large portion of the general American public is still feeling wary of the COVID-19 vaccines. In a recent Pew Research survey, about 40% of respondents said they “would not get the vaccine” (although about half of that group allowed for flexibility and said they might when more information becomes available). In the Native American community, however, it’s a different story.
According to the Seattle-based Urban Indian Health Institute (UIHI), one of 12 Tribal Epidemiology Centers in the US, 75% of the 1,435 American Indian/Alaska Native participants in its National COVID-19 Vaccination Survey were willing to receive the vaccine. A big reason is that the emphasis in Native American communities has been on “we,” rather than “me.” Even though the respondents might feel reluctant due to “historical and current abuse from healthcare and government institutions,” the UIHI says, they ultimately felt the heavy cost of COVID-19 for them, their friends, families, and community outweighed potential risks.
Where there is hesitancy, it’s often due to concern about the exceptional speed of the clinical trials assessing the vaccines. Of those who were willing to get vaccinated, two-thirds were confident that the vaccines had been adequately tested for safety and effectiveness among Native people, in contrast to 31% of the “unwilling.” Seventy-five percent of the unwilling perceive the vaccine as dangerous to their health.
The willingness to receive a COVID-19 vaccine varied by Indian Health Services (IHS) region, with California Area having the lowest proportion (64%) and Albuquerque Area the highest (86%). The survey also asked about perceptions of COVID-19: 75% of those unwilling to get vaccinated felt they were at risk of being infected with COVID-19, compared with 85% of those willing to get a vaccine. Interestingly, though, the majority in the “unwilling” group takes the infection seriously and acknowledges the spread of COVID-19 in the state where they live.
The primary motivation for getting vaccinated, UIHI says, is a “strong sense of responsibility to protect the Native community and preserve cultural ways”—74% of all participants supported this concept. That’s a unique difference when compared with other communities of color, UIHI says. By comparison, only 36% of black communities and 53% of Latinx communities have been found to perceive vaccination as a community responsibility. The finding illustrates the importance of community in Native American culture—although that also differs within the 2 groups surveyed: Of those willing to get vaccinated, 87% believe it’s their communal responsibility, whereas 66% of the unwilling believe it’s an individual choice.
Tribal campaigns that emphasize the good individuals can do for the tribe appear to appeal. In an interview with NBC News, Abigail Echo-Hawk, director of UIHI, said the Seattle Indian Health Board, for example, went from about 7,000 calls a month about the vaccine to nearly 5,000 on 1 day.
But it isn’t just the appeal to communal feeling that spurs participation—it’s also the knowledge that protecting people protects the culture. The Cherokee Tribe, for instance, has been mobilizing to get as many people vaccinated as possible, starting with some of the “most endangered members of the tribe”: those who still speak Cherokee. “We put Cherokee-fluent speakers, most of whom are elders, at the front of the line,” Principal Chief Chuck Hoskin Jr., leader of the Cherokee Nation, told NBC News. The tribe was able to put its roughly 22,000 Cherokee speakers at the top of the list because it answers to the IHS, not the state of Oklahoma, which has people aged < 65 years in Phase 4 of its vaccine rollout.
Appealing to the reverence for Native American culture and tradition is a wise move. Not only because it protects people, but also because vaccinating elders and fluent speakers may reassure others. “When fluent speakers got the vaccine, I think that helped people’s anxiety subside,” Hoskins said. “And I think people felt sort of a renewed obligation to try and protect the culture by being vaccinated.”
Many of the survey respondents viewed getting vaccinated as an act of love, protecting others. One participant planned to get the vaccine to “protect the knowledge keepers; ensuring knowledge is passed to our future generations.”
A majority of UIHI survey respondents who were unwilling to get vaccinated indicated they would be willing at some point in the future—often at least one year from now. This, UIHI says, “may suggest with proper messaging and education on the efficacy and safety of vaccine, hesitancy can be addressed.”
That could depend on who’s delivering the message. The greatest difference between the 2 groups, the UIHI says, was that those who were willing to take vaccines trusted government organizations (ie,Centers for Disease Control and prevention, Food and Drug Administration, and National Institutes of Health) and their regular doctor. Those unwilling to get vaccinated had the highest trust in Urban Indian health clinics, their regular doctor, and Tribal clinics, respectively. The biggest divide? Almost all of the willing group “mostly” or “completely” trusts Dr. Anthony Fauci and the scientists working on the vaccines. Most of the unwilling group does not.
Factors such as convenience, cost, and advice all entered into the respondents’ decision making. But one of the UIHI’s key recommendations is to continue to draw connections between getting vaccinated and the preservation of Native traditions, cultural pride, and love and respect for family, elders, and the broader Native community. Elders, Native community leaders, and Tribal leaders were among the top ambassadors for getting the message out, the UIHI survey found.
Ultimately, each individual decides who to trust. One of the survey respondents said, “Although the US government should have and could have done so much more for all people living here, if we turn down the vaccine, we not only risk our lives and the lives of others…we undermine all the struggles our tribes have gone through to keep our people safe. Even when the US government has directly worked against our tribal checkpoints and safety efforts. To not get vaccinated, is to say the US government’s failure to protect the people is right, and our tribal efforts, wisdom, and courage is wrong.”
Introducing this year’s Recognition Prize recipients
“AGA Recognition Prizes allow members to honor their contemporaries for their exceptional contributions to the field of gastroenterology and hepatology,” said Hashem B. El-Serag, MD, MPH, AGAF, chair of AGA. “The 2021 AGA Recognition Prize winners represent only a small group of our widely distinguished and exceptional members who help make AGA such an accomplished organization. We are honored that such esteemed individuals are representatives of AGA.”
This year the AGA Recognition Prizes will be presented virtually in May 2021.
- Michael Camilleri, MD, AGAF, Julius Friedenwald Medal
- Byron Cryer, MD, Distinguished Service Award in Diversity, Equity and Inclusion
- Sandra Quezada, MD, MS, Distinguished Service Award in Diversity, Equity and Inclusion
- Kim Barrett, Distinguished Achievement Award in Basic Science
- David Y. Graham, William Beaumont Prize
- Griffin Rodgers, MD, MACP, Research Service Award
- Lin Chang, Distinguished Educator Award
- Nimish Vakil, MD, AGAF, FASGE, Distinguished Clinician Award in Private Practice
- Peter H.R. Green, Distinguished Clinician Award in Academic Practice
- Vay Liang “Bill” Go, MD, AGAF, Distinguished Mentor Award
- Shahnaz Sultan, MD, MHSc, AGAF, Outstanding Service Award
- Osama Altayar, MD, Outstanding Service Award
- Perica Davitkov, MD, Outstanding Service Award
- Joseph D. Feuerstein, MD, Outstanding Service Award
- Shazia M. Siddique, MD, MSHP, Outstanding Service Award
- Yngve T. Falck-Ytter, MD, AGAF, Outstanding Service Award
- Joseph K. Lim, MD, AGAF, Outstanding Service Award
To learn more about our 2021 AGA recognition prize recipients, visit https://gastro.org/2021awards.
Transplant-related mortality higher with CD34 selection
In a clinical trial comparing three graft-versus-host disease (GVHD)–prevention regimens in patients undergoing hematopoietic stem cell transplants, a calcineurin inhibitor (CNI)–free strategy using CD34-selected peripheral blood stem cells (PBSCs) was associated with a nearly twofold increase in transplant-related mortality, compared with either a different CNI-free regimen or tacrolimus plus methotrexate, investigators reported.
In the phase 3 Progress II trial, patients who received CD34-selected PBSCs without post-transplant immune suppression had a hazard ratio for death of 1.74 compared with patients who received T-cell depletion with posttransplant cyclophosphamide, and a HR of 1.78, compared with patients who received tacrolimus and methotrexate after a bone marrow graft, Miguel-Angel Perales , MD, from Memorial Sloan Kettering Cancer Center, New York, reported at the Transplant & Cellular Therapies Meetings.
“CD34 selection was associated with worse overall survival, which offset any benefit from lower rates of moderate to severe chronic GVHD,” he said at the meeting held by the American Society for Blood and Marrow Transplantation and the Center for International Blood and Marrow Transplant Research.
Neither of the two CNI-free interventions were superior to tacrolimus/methotrexate with bone marrow–derived stem cells for preventing chronic GVHD, and there were no differences in the primary endpoint of chronic GVHD/relapse-free survival, Dr. Perales said.
T-cell depletion vs. CNI
The Progress II trial was designed to see whether either of two CNI-free, T-cell depletion approaches could improve chronic GVHD rates post transplant over a CNI-based regimen.
The investigators enrolled patients aged 65 years or younger with acute leukemia or myelodysplasia with fewer than 5% blasts and a HLA-matched related or unrelated donor.
The patients were randomly assigned to either bone marrow grafts with tacrolimus/methotrexate (118 patients), bone marrow with in vivo posttransplant cyclophosphamide (114), or PBSCs with ex vivo CD34-selected cells (114).
The primary endpoint of chronic GVHD/relapse-free survival (CRFS) was a time-to-event outcome defined as moderate to severe chronic GVHD according to National Institutes of Health consensus criteria, disease relapse or progression, or death from any cause.
As noted before, there were no between-arm differences in the primary CRFS endpoint, and in multivariate analysis controlling for donor type, patient characteristics, disease category and disease risk index, the only factor significantly predictive for CRFS was being aged 50 years or older.
The 2-year posttransplant survival rates were 61.6% in the CD34-selected arm, 76.7% in the posttransplant cyclophosphamide arm, and 74.2% in the tacrolimus/methotrexate arm.
As noted before, the HR for CRFS with CD34 versus tacrolimus/methotrexate was 1.74, and for CD34 versus cyclophosphamide was 1.78 (P = .02 for both comparisons). In contrast, there was no difference in CRFS between posttransplant cyclophosphamide and tacrolimus/methotrexate.
Both relapse-free survival and transplant-related mortality were worse with the CD34-selected group, compared with the other two groups, but there were no significant differences among the arms in disease relapse.
Hematologic recovery was faster in the CD34 arm, but there were no significant differences in graft failure.
In addition, the incidence of grade II-IV acute GVHD was increased in the posttransplant cyclophosphamide group, compared with the other two, while chronic GVHD and moderate to severe chronic GVHD were reduced in the CD34 group.
There were no differences in quality of life measures among the groups, Dr. Perales said.
Practice changing?
In the question-and answer-session following the presentation, comoderator Sarah Nikiforow , MD, PhD, from the Dana-Farber Cancer Institute in Boston, who was not involved in the study, asked whether the trial results could be considered as practice changing for any centers that historically have done CD34 selection, or whether CD34 selection is still a viable approach to GVHD prophylaxis.
“That’s obviously a key question from the study, and a question that we’re asking ourselves,” Dr. Perales said. “I think the lesson that we took from this study as it pertains to CD34 selection is obviously the increased mortality, likely related to regimen toxicity, and I think the use of high-dose radiation is something that we have to reexamine.”
He said that his center is also considering whether to reduce antithymocyte globulin dosing, move it earlier in the process, and to use pharmokinetic-directed ATG as a possible means of decreasing nonrelapse mortality.
“I think it remains a useful platform for adoptive cell therapy, potentially targeting relapsed disease,” he added.
The study was supported by the National Heart, Lung, and Blood Institute. Dr. Perales disclosed advisory board activities and consulting for multiple companies, and receiving research funding for clinical trials from several more. Dr. Nikiforow disclosed a consulting/advisory role for Kite Pharma, and travel accommodations and expense from Celyad Oncology.
FROM TCT 2021
Detailed glioblastoma map could lead to better treatment approaches
An integrated analysis of data derived from 99 treatment-naive glioblastomas has identified characteristics that could help stratify patients for more effective treatment, according to the investigators.
The analysis provides a detailed map of genes, proteins, infiltrating cells, and signaling pathways that play key roles in driving glioblastoma, Liang-Bo Wang, MD, of Washington University in St. Louis, and colleagues reported in Cancer Cell.
For example, the team identified key phosphorylation events as potential mediators of oncogenic pathway activation and potential targets for EGFR-, TP53-, and RB1-altered tumors. Specifically, phosphorylated PTPN11 and PLCG1 represent a signaling hub in RTK-altered tumors, they found.
The investigators also identified four immune glioblastoma tumor subtypes characterized by distinct immune cell populations. Type 1 tumors have a high macrophage count and few T cells, type 2 tumors have a moderate macrophage count, type 3 tumors have a high T-cell count and few macrophages, and type 4 tumors have few or no immune cells of any type.
They also found that mesenchymal subtype EMT signature is specific to tumor cells but not to stroma, and histone H2B acetylation is enriched in classical glioblastomas with low macrophage content.
“To improve therapies for this deadly cancer, understanding the tumor cells themselves is important but not enough,” senior author Li Ding, PhD, a professor of medicine and genetics and director of computational biology in the division of oncology at Washington University stated in a press release. “We also must understand the tumor cells’ interactions with the surrounding environment, including immune cells and the connective tissues and blood vessels.”
The investigators, including researchers from Pacific Northwest National Laboratory, Case Western Reserve University, and the National Cancer Institute, performed high-resolution and high-depth analyses on 99 tumors.
“Harnessing new technologies, including proteomics, metabolomics, and single-cell sequencing, this study is an extremely deep dive into glioblastoma tumor biology, revealing new possibilities for therapy,” Dr. Ding said.
The study, which is part of the NCI’s Clinical Proteomic Tumor Analysis Consortium (CPTAC), is the largest and most detailed schematic of glioblastoma tumors to date, according to the press release.
The most immediate implication of the findings is better clinical trial design, study coauthor Milan G. Chheda, MD, stated in the press release.
Stratifying patients by tumor type, as identified in the current analysis, could allow researchers to test targeted therapies in the tumors most likely to respond to those therapies, explained Dr. Chheda, of Siteman Cancer Center at Barnes Jewish Hospital and Washington University.
The findings, particularly of multiple glioblastoma tumor subtypes, may explain the negative findings of trials looking at various immunotherapies for treating glioblastoma. Investigators for those trials haven’t considered the possibility of immune subgroups that may respond differently, the authors note, adding that research is underway to identify the best drugs to assess for the newly identified glioblastoma tumor types.
The study was supported by grants from the National Cancer Institute’s Clinical Proteomic Tumor Analysis Consortium, the National Human Genome Research Institute, and the National Institutes of Health.
Dr. Wang and Dr. Ding reported having no disclosures. Dr. Chheda receives research support from NeoimmuneTech and Orbus Therapeutics, and royalties from UpToDate.
[email protected]
FROM CANCER CELL
Oxford launches COVID-19 vaccine study in children
Oxford University is starting a COVID-19 vaccine study with children and young adults aged between 6 and 17 years.
At Oxford and three partner sites in London, Southampton, and Bristol, the phase 2 clinical trial will test whether kids and teens have a good immune response to the AstraZeneca vaccine. Previous trials have shown that the shot is safe in children.
“While most children are relatively unaffected by coronavirus and are unlikely to become unwell with the infection, it is important to establish the safety and immune response to the vaccine in children and young people as some children may benefit from vaccination,” Andrew Pollard, PhD, the chief investigator for the trial and a professor of pediatric infection and immunity at Oxford, said in a statement.
The new trial will enroll 300 volunteers, with up to 240 receiving the vaccine. The control group will receive a meningitis vaccine, which is safe in children and produces similar side effects to the COVID-19 vaccine, such as a sore arm.
COVID-19 vaccine trials have included children over age 12, so this marks the youngest group to be tested so far. Pfizer, Moderna, and Janssen have announced plans to start trials in younger children this spring, according to the Washington Post. Widespread vaccination in children likely won’t occur until 2022, the newspaper reported.
The trial launched on Feb. 12, and the first vaccinations are expected by the end of the month. Parents can visit Oxford’s COVID-19 Vaccine Trial website to sign their children up for the study.
“This study will play an important role in helping to protect children in the future,” Grace Li, a pediatric clinical research fellow for the Oxford Vaccine Group, said in the statement.
“We’ve already seen that the vaccine is safe and effective in adults, and our understanding of how children are affected by the coronavirus continues to evolve,” she said.
A version of this article first appeared on WebMD.com.
One in 10 family docs with burnout consider quitting medicine
and 1 in 10 said it was serious enough to make them consider leaving medicine.
Yet, responses to the Medscape Family Medicine Physician Lifestyle, Happiness & Burnout Report 2021 also indicate that family physicians are in the middle of the pack again this year in rankings by specialty of physician happiness outside work. Overall, more than 12,000 physicians from more than 29 specialties responded to this year’s survey, conducted between Aug. 30 and Nov. 5, 2020.
Happiness levels sink for physicians
In light of the COVID-19 pandemic, happiness levels took a sharp drop among physicians across the board. Last year, for instance, the happiness level was highest for physicians practicing in diabetes and endocrinology, at 89%. They remain the happiest this year, but the proportion saying they were happy dropped to 73%. Infectious disease physicians were the least happy outside work both last year and this year, with the proportion reporting they were happy dropping from 69% to 45%.
For family physicians, happiness levels outside work plunged from 79% last year to 57% this year.
Burnout and depression levels, however, remained steady. The portion saying they were either burned out or burned out and depressed was up only 1 percentage point, rising to 47%.
Fifteen percent of family physicians have had thoughts of suicide, and 1% said they had attempted it, according to the survey responses.
The most common strategy for coping with burnout, reported by 48% of family physicians, is talking with family members and close friends, followed closely by exercise, reported by 46%.
Sixty-eight percent of family physicians say they exercise at least twice a week, and 12% exercise every day.
However, not all coping strategies were as positive: Forty-five percent said they cope by isolating themselves from others; 40% turned to junk food; and 23%-24% said they drank alcohol or were binge-eating to cope. Respondents could choose more than one answer.
Among family physicians, 75% expressed anxiety about their futures, given the pandemic, which is similar to the proportion among physicians overall (77%) who had the same worries.
Work-life balance biggest worry
The survey also asked what workplace issues concern family physicians the most. The biggest concern, by far, was work-life balance, chosen by 51%. Next highest was compensation, at 19%, followed by combining parenthood and work (9%) and relationships with colleagues/staff (6%).
More than half (52%) of family doctors said they would take a cut in pay to have better work-life balance.
A little more than a third (36%) of family physicians – about the same percentage as physicians overall – said they always or most of the time spend enough time on their own health and wellness. One in five said they rarely or never do.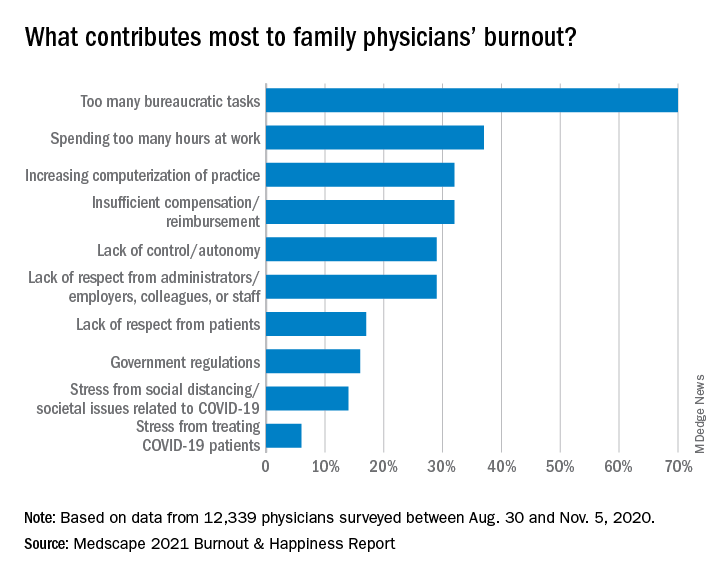
The amount of work required beyond the bedside continues to frustrate family physicians.
Again this year, the top cause of burnout, chosen by 70% of family physicians, was “too many bureaucratic tasks.” That was followed by “spending too many hours at work” (37%) and “increasing computerization of practice” (32%).
A large majority (82%) of family doctors report that they work online up to 10 hours a week, a number that could increase with the rise of telemedicine; 64% are personally online up to 10 hours a week. But even with combined personal and professional Internet time, family doctors don’t come close to the average time spent online among all Internet users, which Hootsuite and We Are Social report is an average of 7 hours per day.
Most in committed, satisfying relationships
Most family medicine physicians are juggling committed relationships with work life. In this survey, 78% said they were married, and another 5% said they were living with a partner.
A little more than half of married family doctors described their marriages as very good (51%). The rest were good (32%); fair (13%); poor (2%); and very poor (2%). Some (15%) had spouses who were also physicians, and 25% said their spouses worked in the health care field but were not physicians.
Almost all family physicians were able to take some vacation time during this reporting period – 43% took 3-4 weeks; 35% took 1-2 weeks; 10% took less than 1 week; 9% took 5-6 weeks; and 4% took more than 6 weeks.
If they drove to vacation destinations, they were likely to be in their favorite make of vehicle, which for family physicians were Toyotas (22%), Hondas (14%) and Fords (11%), according to the survey responses. Physicians overall favored Toyotas, Hondas, and BMWs.
A version of this article first appeared on Medscape.com.

Six-month follow-up shows continuing morbidity for COVID-19 survivors
In December 2019, a cluster of cases of what was first identified as a “mysterious pneumonia” was reported in the central Chinese city of Wuhan. Within a few short months, the disease had spread all over the world.
Wuhan was essentially “ground zero” for the novel coronavirus, or COVID-19, and now researchers report that many of the early survivors continue to experience a variety of lingering health issues.
At 6 months, for example, pulmonary and immune function have still not returned to normal in many of the patients who had been critically ill, said Zhiyong Peng, MD, PhD, an intensivist and medical researcher, in the department of critical care medicine, Zhonnan Hospital, Wuhan.
In addition, many are still experiencing varying degrees of psychiatric disability and physical morbidity.
The results of the report were presented at the Critical Care Congress sponsored by the Society of Critical Care Medicine.
In 2020, Dr. Peng and colleagues conducted a single-center case series involving 138 patients with coronavirus pneumonia in order to describe the clinical characteristics of this new disease. Within this group, 26% of patients required admission to the intensive care unit and 4.3% died. As of Feb. 3, 2020, 26% required ICU care, 34.1% were discharged, 4.3% died, and 61.6% remained hospitalized. (JAMA. 2020 Mar 17;323[11]:1061-69) Not surprisingly, those requiring critical care experienced a higher rate of severe complications, including shock, arrythmias, acute cardiac injury and acute respiratory distress syndrome, compared with non-ICU patients.
“However, the long-term outcomes of survivors were unknown,” said Dr. Peng. Thus, the goal of the current study was to analyze the outcomes based on pulmonary function, physical morbidity, immunological status, health-related quality of life, cognitive impairment, and psychiatric disability.
The cohort included patients from four hospitals in Wuhan, who had been treated in the adult ICU and required mechanical ventilation (invasive or noninvasive), or had a high FiO2 concentration, or needed an intravenous infusion of vasopressors.
In all, 171 critically ill patients were admitted to the four designated hospitals, and of this group, 110 were discharged from ICU and 106 survived. At the 3-month follow-up, 92 patients were evaluated and at 6 months, 72 were evaluated.
Pulmonary function tests were performed, and all patients received a chest CT scan, and did the “6-minute walk test.” For immune function, lymphocyte counts and function assays were performed. The SF-36 questionnaire was used to evaluate health related quality of life, and cognitive and psychological assessments were conducted with a variety of tools including the Mini-Mental State Examination and Montreal Cognitive Assessment. Depression and anxiety were measured with Zung’s Self-Rating Anxiety Scale and the Hamilton Rating Scale.
At 3 months, 5 patients (5.4%) were seropositive for IgM and 9 (9.8%) were seronegative, while at 6 months, 9 patients (12.9%) tested seropositive for IgM and 12 (16.67%) tested seronegative.
A high proportion of patients also reported tachypnea after exercising (54%), heart palpitations (51.8%), fatigue (44.6%), and joint pain (20.5%).
In terms of lung function, survivors who had been intubated scored worse on pulmonary function tests and had a significant decrease in diffusing capacity for carbon monoxide (DLCO), compared with those who had not been intubated.
At 6 months, the DLCO remained at 76% of the predicted level, but the walking test and chest CT scan improved over time. “In multivariate analysis tracheostomy was a risk factor associated with distance walked in 6 minutes,” said Dr. Peng.
Other results showed that B cells were lower in survivors who had been intubated, compared with those who weren’t, and they were still low at 3 and 6 months, compared with normal values. T-cell subsets were also persistently low.
“Hyperfunction of T lymphocytes and hypofunction of NK cells were detected, which had not improved at 6 months,” said Dr. Peng.
Cognitive dysfunction and depression were reported in some survivors. Cognitive dysfunction at 3 months affected 12.8% of survivors, but it improved by 6 months, affecting on only 2.9% of the cohort (P = .029). However, rates of depression more than doubled from 3 to 6 months (20% vs. 47.8%, P < .001), and anxiety showed a slight increase (15.6% vs. 17.6%, P = .726).
“Further follow-up will be performed to confirm these findings,” Dr. Peng concluded.
Rahul Kashyap, MBBS, MBA, a research scientist and assistant professor of anesthesiology at the Mayo Clinic, Rochester, Minn., noted that currently the research from Wuhan is showing the follow-up for 6 months, but it takes time to gather and analyze the data. “I suspect we will be seeing results from the 1-year follow-up by June,” he said.

Dr. Kashyap, who was approached for an independent comment, also pointed out that in follow-up of SARS patients, some of them recovered but went on to develop chronic fatigue syndrome which is characterized by extreme fatigue that doesn’t improve with rest. “So the scientific community is contemplating if this will be true for patients with COVID-19 infection as well,” he said. “We have already seen that some of the ‘long haulers’ continue to have symptoms such as shortness of breath, joint pain, fatigue, loss of smell and taste, and even hearing loss in extreme cases.”
Some research is also confirming what has been reported from Wuhan. “Data from Ireland, that looked at 150 survivors, showed that almost 60% said they did not feel they were back to full health, regardless of the severity of the disease,” Dr. Kashyap said. “So, aside from Wuhan, we are now getting data from other sources that is similar. But what is interesting about the data from Ireland is that not all of the patients had severe illness or were in ICU.”
He added that data continue to come in from the United States and other countries, looking at long-term effects. “More and more patients are surviving as the care is getting better,” he said. “But beyond a year, we just don’t know yet.”
There was no outside sponsor listed. Dr. Peng and Dr. Kashyap have no disclosures.
In December 2019, a cluster of cases of what was first identified as a “mysterious pneumonia” was reported in the central Chinese city of Wuhan. Within a few short months, the disease had spread all over the world.
Wuhan was essentially “ground zero” for the novel coronavirus, or COVID-19, and now researchers report that many of the early survivors continue to experience a variety of lingering health issues.
At 6 months, for example, pulmonary and immune function have still not returned to normal in many of the patients who had been critically ill, said Zhiyong Peng, MD, PhD, an intensivist and medical researcher, in the department of critical care medicine, Zhonnan Hospital, Wuhan.
In addition, many are still experiencing varying degrees of psychiatric disability and physical morbidity.
The results of the report were presented at the Critical Care Congress sponsored by the Society of Critical Care Medicine.
In 2020, Dr. Peng and colleagues conducted a single-center case series involving 138 patients with coronavirus pneumonia in order to describe the clinical characteristics of this new disease. Within this group, 26% of patients required admission to the intensive care unit and 4.3% died. As of Feb. 3, 2020, 26% required ICU care, 34.1% were discharged, 4.3% died, and 61.6% remained hospitalized. (JAMA. 2020 Mar 17;323[11]:1061-69) Not surprisingly, those requiring critical care experienced a higher rate of severe complications, including shock, arrythmias, acute cardiac injury and acute respiratory distress syndrome, compared with non-ICU patients.
“However, the long-term outcomes of survivors were unknown,” said Dr. Peng. Thus, the goal of the current study was to analyze the outcomes based on pulmonary function, physical morbidity, immunological status, health-related quality of life, cognitive impairment, and psychiatric disability.
The cohort included patients from four hospitals in Wuhan, who had been treated in the adult ICU and required mechanical ventilation (invasive or noninvasive), or had a high FiO2 concentration, or needed an intravenous infusion of vasopressors.
In all, 171 critically ill patients were admitted to the four designated hospitals, and of this group, 110 were discharged from ICU and 106 survived. At the 3-month follow-up, 92 patients were evaluated and at 6 months, 72 were evaluated.
Pulmonary function tests were performed, and all patients received a chest CT scan, and did the “6-minute walk test.” For immune function, lymphocyte counts and function assays were performed. The SF-36 questionnaire was used to evaluate health related quality of life, and cognitive and psychological assessments were conducted with a variety of tools including the Mini-Mental State Examination and Montreal Cognitive Assessment. Depression and anxiety were measured with Zung’s Self-Rating Anxiety Scale and the Hamilton Rating Scale.
At 3 months, 5 patients (5.4%) were seropositive for IgM and 9 (9.8%) were seronegative, while at 6 months, 9 patients (12.9%) tested seropositive for IgM and 12 (16.67%) tested seronegative.
A high proportion of patients also reported tachypnea after exercising (54%), heart palpitations (51.8%), fatigue (44.6%), and joint pain (20.5%).
In terms of lung function, survivors who had been intubated scored worse on pulmonary function tests and had a significant decrease in diffusing capacity for carbon monoxide (DLCO), compared with those who had not been intubated.
At 6 months, the DLCO remained at 76% of the predicted level, but the walking test and chest CT scan improved over time. “In multivariate analysis tracheostomy was a risk factor associated with distance walked in 6 minutes,” said Dr. Peng.
Other results showed that B cells were lower in survivors who had been intubated, compared with those who weren’t, and they were still low at 3 and 6 months, compared with normal values. T-cell subsets were also persistently low.
“Hyperfunction of T lymphocytes and hypofunction of NK cells were detected, which had not improved at 6 months,” said Dr. Peng.
Cognitive dysfunction and depression were reported in some survivors. Cognitive dysfunction at 3 months affected 12.8% of survivors, but it improved by 6 months, affecting on only 2.9% of the cohort (P = .029). However, rates of depression more than doubled from 3 to 6 months (20% vs. 47.8%, P < .001), and anxiety showed a slight increase (15.6% vs. 17.6%, P = .726).
“Further follow-up will be performed to confirm these findings,” Dr. Peng concluded.
Rahul Kashyap, MBBS, MBA, a research scientist and assistant professor of anesthesiology at the Mayo Clinic, Rochester, Minn., noted that currently the research from Wuhan is showing the follow-up for 6 months, but it takes time to gather and analyze the data. “I suspect we will be seeing results from the 1-year follow-up by June,” he said.
Dr. Kashyap, who was approached for an independent comment, also pointed out that in follow-up of SARS patients, some of them recovered but went on to develop chronic fatigue syndrome which is characterized by extreme fatigue that doesn’t improve with rest. “So the scientific community is contemplating if this will be true for patients with COVID-19 infection as well,” he said. “We have already seen that some of the ‘long haulers’ continue to have symptoms such as shortness of breath, joint pain, fatigue, loss of smell and taste, and even hearing loss in extreme cases.”
Some research is also confirming what has been reported from Wuhan. “Data from Ireland, that looked at 150 survivors, showed that almost 60% said they did not feel they were back to full health, regardless of the severity of the disease,” Dr. Kashyap said. “So, aside from Wuhan, we are now getting data from other sources that is similar. But what is interesting about the data from Ireland is that not all of the patients had severe illness or were in ICU.”
He added that data continue to come in from the United States and other countries, looking at long-term effects. “More and more patients are surviving as the care is getting better,” he said. “But beyond a year, we just don’t know yet.”
There was no outside sponsor listed. Dr. Peng and Dr. Kashyap have no disclosures.
FROM CCC50
How do you run a hospital with no running water?
It’s bad enough that this month’s historic snowstorm left ordinary Texans scrambling for heat and resorting to melted snow for drinking, washing, and flushing. But what about hospitals, where sanitation is paramount and ample water is a sine qua non?
As pipes burst, pumps froze, and water pressure plummeted, patient care was affected as well as maintenance, food preparation, laundry, and heat. To counter the problems, several Texas hospitals stepped up to the plate with inventive responses.
“At the worst point, two of our hospitals, Houston Methodist West and Houston Methodist Baytown, had no city water supply, one for over 48 hours and the other for 72 hours,” said Marc L. Boom, MD, MBA, Houston Methodist’s president and CEO.
Although the main hospital had a reserve supply of potable water, a supply of water for laundry, cooking, and cleaning was another matter. “We introduced significant water restrictions and had to have 6,000-gallon tankers bring in extra water,” Dr. Boom said.
One hospital in the network got creative. When it rained the day after the ice storm, the staff rigged up a rain collection system using the huge bins that move linens around the hospital to collect nonpotable water for cleaning and flushing toilets, Dr. Boom said. Another hospital was able to provide showers for staff by bringing in bathroom trailers with self-contained water supplies of the kind used at some sporting events.
And at some facilities, patients were discharged into the lobby as they could not return home with transportation, electricity, and water systems crippled. With widespread challenges continuing, even as temperatures warmed, President Biden signed a major disaster declaration Feb. 20 that will provide emergency assistance to residents and businesses in more than a third of Texas counties, including those surrounding Houston, Dallas, and Austin.
Although conditions forced the rescheduling of some nonemergent surgeries, the water shortage had no impact on COVID-19 care, except for the unavailability of showers in the case of mobile patients. “At the worst, they just had to use bucket flushing for the toilets,” Dr. Boom said.
And in an unexpected win, when a Harris County freezer for COVID-19 vaccine storage failed and threatened to spoil 8,400 precious doses, Dr. Boom’s center was able to take delivery on 1,000 doses and administer them in 3 hours at a hastily set up ad hoc immunization center.
In all this, the lessons of the pandemic had a positive preparatory role. “2020 taught us to be agile as things change and to align our goals across different medical teams,” said Ben Saldana, MD, medical director of Houston Methodist’s emergency care centers. “And we were prepared for hurricanes, but not for snow.”
Increased pressure on emergency departments
As the outages continued and stress levels in the community rose, the network started seeing exacerbations of chronic conditions after the power shut-down incapacitated electrical devices running machines for heart assistance, oxygen delivery, and sleep apnea. “We started seeing food-borne illness and carbon monoxide poisoning, as well as more heart attacks, strokes, and sepsis,” Dr. Saldana said.
One serious strain on the network’s main hospital was the sudden need to accommodate large numbers of patients on dialysis, a procedure that uses a lot of water and is typically performed in small, vulnerable community facilities with limited infrastructure and no generators. “The hospitals are their backup and act as a safety net for them,” Boom said. Some hospital areas generally used for other types of conditions had to be marshaled for renal care.
Emergency rooms became pop-up dialysis centers, Dr. Saldana said. “And if the water pressure dropped, we had to cut dialysis time from the standard 4 hours to 2. That’s like putting a band-aid on patients.”
Fortunately, municipal water pressure in the Houston area has steadily risen and is almost back to normal. And according to Dr. Boom, the brutal storm may yet have a silver lining: a decline in county coronavirus cases as the storm and icy road conditions forced people to stay sequestered at home.
Further north in Austin, a number of hospitals lost municipal water pressure, creating a series of problems. Among them was St. David’s South Austin Medical Center, at which, according to reports in the Austin American-Statesman, staff members were at one point asked to use trash bags to remove waste from toilets, to refrain from showering, and to clean their hands only with sanitizer.
A statement issued by David Huffstutler, CEO of St. David’s HealthCare, acknowledged that the heating system is based on a water-fed boiler. When the building lost heat owing to lack of water, some patients had to be transferred elsewhere or discharged. The hospital distributed jugs and bottles of water for handwashing and drinking, and was working with city officials to obtain portable toilets.
Meanwhile, officials at Austin’s Dell Children’s Medical Center acknowledged in a memo that its toilets no longer had “flushing capabilities.” Other area hospitals in the Ascension Seton network were also suffering from compromised water supplies last week, according to local news reports.
Washroom facilities were affected elsewhere as well. A post on a medical association Facebook page referred to a memo ordering staff to use a single toilet in an outpatient area for bowel movements and warned them to limit their time there. No paper or other products were to be used in other toilets designated for urination.
‘The pandemic was the prelude to the ice storm’
Some hospitals fared better. Along the Coastal Bend, Corpus Christi Medical Center managed to maintain its electricity and water supply to ensure continuity of hospital services after the storm, according to a statement.
But back in Houston, Liz Youngblood, MBA, RN, president of Baylor St. Luke’s Medical Center, said a number of hospitals in her network experienced low water pressure after the storm.
“Fortunately, we had water conservation measures and low-water alerts in place for such emergencies,” she said. “And we rely on water tankers to help maintain enough pressure for the basics.”
Some of the challenges posed by the storm are quite similar to what St. Luke’s faced after Hurricane Harvey in 2017. “We had already made plans to address them and so we felt prepared,” Ms. Youngblood said.
And thanks to COVID-19, Texas hospitals have been operating in crisis mode for the past year. “The pandemic was the prelude to the ice storm,” said Gina Blocker, MD, a St. Luke’s ED physician, “so we had measures and teams in place. We did have some reduction in water pressure, though the pressure was still good.”
But the hospital was inundated with patients looking for shelter. “Some were just scared about what might happen to them if their heat didn’t come back on and they wanted to be where they could get care,” Dr. Blocker said. Others came in with expected storm-related injuries such as hypothermia and carbon monoxide poisoning.
According to Ms. Youngblood, little compromise in patient care was necessary except for the cancellation of some operations and vaccinations owing to the treacherous travel conditions. “But one of the biggest remaining issues is that we need plenty of blood, so we’re encouraging people to donate at their local centers.”
A version of this article first appeared on Medscape.com
Long-term CPAP use linked with more physical activity
in new research.

“The aim of this study was to determine whether long-term CPAP treatment affects self-reported physical activity among participants with moderate-severe OSA and comorbid CV disease,” wrote David Stevens, PhD, of Flinders University, Adelaide, Australia, and his colleagues. The findings were recently published in the Journal of Clinical Sleep Medicine.
Researchers conducted a secondary analysis of the Sleep apnea cardiovascular endpoints (SAVE) trial that enrolled 2,687 adults aged 45-75 years old with OSA and confirmed CVD. In the study, participants were randomized to receive either CPAP plus usual care or usual care alone.
Physical activity levels were self-reported using the Leisure-Time Exercise Questionnaire (LTEQ) at baseline and at 6-, 24-, and 48-month follow-up intervals. The physical functioning subscale of the 36-item short form questionnaire (SF-36) was used to determine if activity levels were consistent with expert recommendations and to evaluate the effects on any self-perceived limitation of physical activity.
Moderate physical activity was higher among CPAP users
After a mean follow-up duration of 3.7 years, participants in the CPAP arm had approximately 20% higher levels of moderate physical activity, compared with the control arm (adjusted mean scores]: 8.7 points vs. 7.3 points; 95% confidence interval, 7.5-9.9 vs. 6.1-8.5; P = .003).
However, no significant difference was observed between treatment arms for mild physical activity (adjusted mean scores, 14.4 points vs. 14.2 points; 95% CI, 13.5-15.3 vs. 13.3-15.1; P = 0.599) or vigorous physical activity (adjusted mean scores, 3.4 points vs. 2.9 points; 95% CI 2.6-4.2 vs. 2.1-3.7; P = .125).
In addition, participants in the CPAP group reported less limitation in physical activity (adjusted between-group difference in SF-36 physical functioning subscale score = 1.66; 95% CI, 0.87-2.45; P < .001) and were more likely to report activity levels consistent with guideline recommendations.
“We were pleasantly surprised to find that people assigned to CPAP reported more physical activity than their counterparts who received usual care, despite being given no specific exercise instructions,” Kelly A. Loffler, PhD, a coauthor of the study, said in an interview.
“While I don’t think this will result in any immediate changes to guidelines, it is a helpful reminder to clinicians who are treating such patients, that the symptomatic benefits people experience with CPAP present a window of opportunity to improve health more holistically,” Dr. Loffler explained.
The researchers acknowledged that a key limitation of the study was the use of self-reported outcome measures. In future studies, they recommended that recent technological innovations, such as the availability of activity tracking devices, should be used to measure physical activity.
They also noted that patients with excessive sleepiness and severe hypoxemia were excluded from the SAVE trial; thus, the findings may not be generalizable to all patients.
Study reinforces CPAP’s health benefits
Emerson M. Wickwire, PhD, associate professor of psychiatry and medicine at the University of Maryland, Baltimore, explained that CPAP treatment is associated with well-documented health benefits among patients with CVD, as well as enhanced quality of life.
“These results provide further evidence that treating OSA can provide direct and indirect health benefits, suggesting that increased physical activity can be a vital pathway to improved cardiovascular health and enjoyment of life,” Dr. Wickwire, who is also director of the Insomnia Program at the University of Maryland Midtown Medical Center, Baltimore, said in an interview.
Steven M. Scharf, MD, a pulmonologist who is director of the Sleep Disorders Center (Adults) at the University of Maryland, also said the study findings were consistent with previous research involving patients treated for OSA.

“It is no surprise that treatment of OSA improves patient’s daily physical functioning,” explained Dr. Scharf, who is also a clinical professor, in an interview. “These results are expected, but very welcome, and I was glad to see them.”
The study was funded by the National Health and Medical Research Council of Australia, the Respironics Sleep and Respiratory Research Foundation, and Philips Respironics. Some authors reported financial affiliations with medical device and pharmaceutical companies. Dr. Loffler, Dr. Wickwire, and Dr. Scharf reported no conflicts of interest related to this work.
in new research.
“The aim of this study was to determine whether long-term CPAP treatment affects self-reported physical activity among participants with moderate-severe OSA and comorbid CV disease,” wrote David Stevens, PhD, of Flinders University, Adelaide, Australia, and his colleagues. The findings were recently published in the Journal of Clinical Sleep Medicine.
Researchers conducted a secondary analysis of the Sleep apnea cardiovascular endpoints (SAVE) trial that enrolled 2,687 adults aged 45-75 years old with OSA and confirmed CVD. In the study, participants were randomized to receive either CPAP plus usual care or usual care alone.
Physical activity levels were self-reported using the Leisure-Time Exercise Questionnaire (LTEQ) at baseline and at 6-, 24-, and 48-month follow-up intervals. The physical functioning subscale of the 36-item short form questionnaire (SF-36) was used to determine if activity levels were consistent with expert recommendations and to evaluate the effects on any self-perceived limitation of physical activity.
Moderate physical activity was higher among CPAP users
After a mean follow-up duration of 3.7 years, participants in the CPAP arm had approximately 20% higher levels of moderate physical activity, compared with the control arm (adjusted mean scores]: 8.7 points vs. 7.3 points; 95% confidence interval, 7.5-9.9 vs. 6.1-8.5; P = .003).
However, no significant difference was observed between treatment arms for mild physical activity (adjusted mean scores, 14.4 points vs. 14.2 points; 95% CI, 13.5-15.3 vs. 13.3-15.1; P = 0.599) or vigorous physical activity (adjusted mean scores, 3.4 points vs. 2.9 points; 95% CI 2.6-4.2 vs. 2.1-3.7; P = .125).
In addition, participants in the CPAP group reported less limitation in physical activity (adjusted between-group difference in SF-36 physical functioning subscale score = 1.66; 95% CI, 0.87-2.45; P < .001) and were more likely to report activity levels consistent with guideline recommendations.
“We were pleasantly surprised to find that people assigned to CPAP reported more physical activity than their counterparts who received usual care, despite being given no specific exercise instructions,” Kelly A. Loffler, PhD, a coauthor of the study, said in an interview.
“While I don’t think this will result in any immediate changes to guidelines, it is a helpful reminder to clinicians who are treating such patients, that the symptomatic benefits people experience with CPAP present a window of opportunity to improve health more holistically,” Dr. Loffler explained.
The researchers acknowledged that a key limitation of the study was the use of self-reported outcome measures. In future studies, they recommended that recent technological innovations, such as the availability of activity tracking devices, should be used to measure physical activity.
They also noted that patients with excessive sleepiness and severe hypoxemia were excluded from the SAVE trial; thus, the findings may not be generalizable to all patients.
Study reinforces CPAP’s health benefits
Emerson M. Wickwire, PhD, associate professor of psychiatry and medicine at the University of Maryland, Baltimore, explained that CPAP treatment is associated with well-documented health benefits among patients with CVD, as well as enhanced quality of life.
“These results provide further evidence that treating OSA can provide direct and indirect health benefits, suggesting that increased physical activity can be a vital pathway to improved cardiovascular health and enjoyment of life,” Dr. Wickwire, who is also director of the Insomnia Program at the University of Maryland Midtown Medical Center, Baltimore, said in an interview.
Steven M. Scharf, MD, a pulmonologist who is director of the Sleep Disorders Center (Adults) at the University of Maryland, also said the study findings were consistent with previous research involving patients treated for OSA.
“It is no surprise that treatment of OSA improves patient’s daily physical functioning,” explained Dr. Scharf, who is also a clinical professor, in an interview. “These results are expected, but very welcome, and I was glad to see them.”
The study was funded by the National Health and Medical Research Council of Australia, the Respironics Sleep and Respiratory Research Foundation, and Philips Respironics. Some authors reported financial affiliations with medical device and pharmaceutical companies. Dr. Loffler, Dr. Wickwire, and Dr. Scharf reported no conflicts of interest related to this work.
FROM JOURNAL OF CLINICAL SLEEP MEDICINE
Akathisia: “Ants in the Pants”
Potentially poor outcome if untreated
Case
The patient is a 65-year-old female with increasing anxiety and agitation. She completed cycle 2 of chemotherapy for breast cancer several hours ago. Her premedication was Reglan (metoclopramide); her only other medication is tamoxifen. Other than breast cancer, she suffers only from osteoarthritis.
She is found pacing about the ward – almost uncontrollably. She feels she must move, only to have to stop and, shortly afterwards, feels the urge to move again. This has never happened to her before. She must move despite being fatigued. She also complains of an odd overall feeling; something akin to “ant in the pants.” She is nervous and exhausted. What is her diagnosis and what clues to it are in her presentation?
Background
The word “akathisia” is derived from the Greek language and means “unable to sit.” It is thought to occur as a consequence of dopaminergic blockade in the midbrain region. The decrease in dopaminergic activity leads to a subsequent decrease in inhibitory motor control which, in turn, manifests as involuntary movements.

In this malady, the patient is seen as perpetually in motion. The patient feels the need to move until they must stop. But once static, they have the urge to move again. They pace, they rock and they ‘fidget’ – they just cannot sit still. This feeling has been likened to having “ants in the pants.” Patients become anxious, agitated, and suffer from insomnia. They cannot rest.
If left unresolved akathisia can torment patients to sheer exhaustion. For some it serves as a harbinger of suicide. This toxicity is more commonly seen in the psychiatric pharmacy with the most common offender being haloperidol. The causative agents of the least notoriety are the non-antipsychotics.
Diagnosis and treatment
Akathisia is an extrapyramidal symptom found largely but NOT exclusively with psychiatric medications. There are drugs in the non-psychiatric field that can also cause it, including antiemetics (e.g., metoclopramide), antihypertensives (e.g., diltiazem), and narcotics (e.g., cocaine). Metoclopramide is given under circumstances ranging from diabetic gastroparesis to premedicating chemotherapy. It is a peripheral and centrally acting dopamine antagonist. There are no lab tests or radiographic workups to diagnose akathisia. Its manifestations are erratic and disturbing, and the prognosis is doleful if unresolved.
The primary intervention for the treatment of akathisia is its recognition and the discontinuation of the offending drug. Beyond this, for symptomatic care, there is a compendium of case reports and small studies supporting many drugs, but only a few have received consistent recommendation. Beta-adrenergic antagonists, such as propranolol, are considered the gold standard, the first choice for the treatment of akathisia. Their toxicities include orthostatic hypotension and bradycardia. Additionally, they are contraindicated in the setting of asthma.
Anticholinergics, such as benztropine (cogentin) and trihexylphenidyl (artane) are considered in the literature as 2nd line treatments, behind beta-blockers. However, the data advocating their use is limited. They have multiple side-effects including sedation, memory impairment, visual impairment, and urinary retention. They are also contraindicated in patients with closed-angle glaucoma.
An equivalent alternative to beta-blockers could also be the 5HT2a receptor antagonists such as mirtazapine (remeron) and cyproheptadine (periactin). This class of medications is thought to act by an inhibitory control of dopaminergic neurons. Sedation and weight gain are the primary toxicities, and they are contraindicated in patients who are breastfeeding.
Benzodiazepines, such as clonazepam (klonopin), have shown some efficacy in improving symptoms but the data is very limited. The risk of tolerance and dependence, coupled with the problems of sedation impacting the elderly, prompts their placement in reserve. Vitamin B6 (pyridoxine), when given in a high dose format, causes significant improvement in akathisia. However, it can cause headache and nausea. Chronic administration of high doses has also been found to cause a severe and irreversible sensory neuropathy as well as lead to seizures. Many other agents have been studied, but the data are too small to warrant recommendation.
Conclusion
Akathisia remains an extreme reaction to drugs not always in the psychotropic class. The hospitalist will likely deal with the acute onset, a dramatic form, and a potentially poor outcome if untreated. The patient’s only true defense is the physician’s clinical acumen and their ability to recognize it.
Dr. Killeen is a physician in Tampa, Fla. He practices internal medicine, hematology, and oncology, and has worked in hospice and hospital medicine.
Recommended reading
Van Gool AR, Doorduijn JK, Sevnaeve C. Severe akathisia as a side effect of metoclopramide. Pharm World Sci. 2010; 32(6):704-706.
Loonen AJM, Stahl SM. The mechanism of drug-induced akathisia. CNS Spectr. 2010;15(11):491-494.
Forcen FE, Matsoukas K, Alici Y. Antipsychotic-induced akathisia in delirium: A systemic review. Palliat Support Care. 2016;14(1):77-84.
Sethuram K, Gedzior J. Akathisia: Case presentation and review of newer treatment agents. Psychiatric Annals. 2014;44(8):391-396.
Pringsheim T, et al. The assessment and treatment of antipsychotic-induced akathisia. Can J Psychiatry. 2018;63(11): 719-729.
Tachere RO, Mandana M. Beyond anxiety and agitation: A clinical approach to akathisia. Royal Australian Coll Gen Practitioners. 2017;46(5): 296-298.
Key points
- Although associated more with psychiatric medications, akathisia can occur with non-psychotropics as well.
- To recognize the illness, the clinician must notice the repetitive involuntary movements and pacing as well as the “ants in the pants” fidgeting involved.
- Primary treatment consists of medication discontinuation with pharmaceutical intervention as a backup.
- Recognition is the key to successful treatment.
Classic signs of akathisia
- Fidgeting – “ants in the pants”
- Swinging the legs while seated
- Rocking from foot to foot
- Walking while in a static position
- Inability to sit or stand still – pacing
- Onset appears with the initiation or dose adjustment of an offending drug
Quiz
1. Which of the following findings occur in Akathisia?
A. Fidgeting
B. Pacing
C. Swinging the legs while seated
D. All the above
Answer: D
Akathisia is manifest as involuntary hyperactivity of the extremities, particularly the lower extremities. People feel the urge to move, to continue endlessly in motion, stopping only when fatigue sets in. The fidgeting has been described by patients as feeling like “ants in the pants.”
2. Which of the following interventions are used to treat akathisia?
A. Drug discontinuation
B. Propranolol
C. Mirtazapine
D. All the above
Answer: D
All the interventions mentioned are used to treat akathisia. The foremost is to stop the offending drug. Failing this, propranolol is the “gold standard” while 5HT2a antagonists, such as mirtazapine, are favored when beta-blockers either fail or are contraindicated.
3. The use of pyridoxine (Vitamin B6) in the treatment of akathisia is associated with what toxicities?
A. Headache
B. Nausea
C. Seizures
D. All the above
Answer: D
The use of Vitamin B6 in the treatment of akathisia has several drawbacks. Its administration is associated with headache and nausea, and high dose usage increases the risk of seizure.
4. If unresolved, akathisia can lead to which of the following?
A. Insomnia
B. Suicide
C. Physical exhaustion
D. All the above
Answer: D
Akathisia, left unrecognized and untreated, can eventually lead to physical exhaustion, and is compounded by difficulties in trying to rest, hence insomnia. The physical and mental torment of this malady can lead to suicide.
Potentially poor outcome if untreated
Potentially poor outcome if untreated
Case
The patient is a 65-year-old female with increasing anxiety and agitation. She completed cycle 2 of chemotherapy for breast cancer several hours ago. Her premedication was Reglan (metoclopramide); her only other medication is tamoxifen. Other than breast cancer, she suffers only from osteoarthritis.
She is found pacing about the ward – almost uncontrollably. She feels she must move, only to have to stop and, shortly afterwards, feels the urge to move again. This has never happened to her before. She must move despite being fatigued. She also complains of an odd overall feeling; something akin to “ant in the pants.” She is nervous and exhausted. What is her diagnosis and what clues to it are in her presentation?
Background
The word “akathisia” is derived from the Greek language and means “unable to sit.” It is thought to occur as a consequence of dopaminergic blockade in the midbrain region. The decrease in dopaminergic activity leads to a subsequent decrease in inhibitory motor control which, in turn, manifests as involuntary movements.
In this malady, the patient is seen as perpetually in motion. The patient feels the need to move until they must stop. But once static, they have the urge to move again. They pace, they rock and they ‘fidget’ – they just cannot sit still. This feeling has been likened to having “ants in the pants.” Patients become anxious, agitated, and suffer from insomnia. They cannot rest.
If left unresolved akathisia can torment patients to sheer exhaustion. For some it serves as a harbinger of suicide. This toxicity is more commonly seen in the psychiatric pharmacy with the most common offender being haloperidol. The causative agents of the least notoriety are the non-antipsychotics.
Diagnosis and treatment
Akathisia is an extrapyramidal symptom found largely but NOT exclusively with psychiatric medications. There are drugs in the non-psychiatric field that can also cause it, including antiemetics (e.g., metoclopramide), antihypertensives (e.g., diltiazem), and narcotics (e.g., cocaine). Metoclopramide is given under circumstances ranging from diabetic gastroparesis to premedicating chemotherapy. It is a peripheral and centrally acting dopamine antagonist. There are no lab tests or radiographic workups to diagnose akathisia. Its manifestations are erratic and disturbing, and the prognosis is doleful if unresolved.
The primary intervention for the treatment of akathisia is its recognition and the discontinuation of the offending drug. Beyond this, for symptomatic care, there is a compendium of case reports and small studies supporting many drugs, but only a few have received consistent recommendation. Beta-adrenergic antagonists, such as propranolol, are considered the gold standard, the first choice for the treatment of akathisia. Their toxicities include orthostatic hypotension and bradycardia. Additionally, they are contraindicated in the setting of asthma.
Anticholinergics, such as benztropine (cogentin) and trihexylphenidyl (artane) are considered in the literature as 2nd line treatments, behind beta-blockers. However, the data advocating their use is limited. They have multiple side-effects including sedation, memory impairment, visual impairment, and urinary retention. They are also contraindicated in patients with closed-angle glaucoma.
An equivalent alternative to beta-blockers could also be the 5HT2a receptor antagonists such as mirtazapine (remeron) and cyproheptadine (periactin). This class of medications is thought to act by an inhibitory control of dopaminergic neurons. Sedation and weight gain are the primary toxicities, and they are contraindicated in patients who are breastfeeding.
Benzodiazepines, such as clonazepam (klonopin), have shown some efficacy in improving symptoms but the data is very limited. The risk of tolerance and dependence, coupled with the problems of sedation impacting the elderly, prompts their placement in reserve. Vitamin B6 (pyridoxine), when given in a high dose format, causes significant improvement in akathisia. However, it can cause headache and nausea. Chronic administration of high doses has also been found to cause a severe and irreversible sensory neuropathy as well as lead to seizures. Many other agents have been studied, but the data are too small to warrant recommendation.
Conclusion
Akathisia remains an extreme reaction to drugs not always in the psychotropic class. The hospitalist will likely deal with the acute onset, a dramatic form, and a potentially poor outcome if untreated. The patient’s only true defense is the physician’s clinical acumen and their ability to recognize it.
Dr. Killeen is a physician in Tampa, Fla. He practices internal medicine, hematology, and oncology, and has worked in hospice and hospital medicine.
Recommended reading
Van Gool AR, Doorduijn JK, Sevnaeve C. Severe akathisia as a side effect of metoclopramide. Pharm World Sci. 2010; 32(6):704-706.
Loonen AJM, Stahl SM. The mechanism of drug-induced akathisia. CNS Spectr. 2010;15(11):491-494.
Forcen FE, Matsoukas K, Alici Y. Antipsychotic-induced akathisia in delirium: A systemic review. Palliat Support Care. 2016;14(1):77-84.
Sethuram K, Gedzior J. Akathisia: Case presentation and review of newer treatment agents. Psychiatric Annals. 2014;44(8):391-396.
Pringsheim T, et al. The assessment and treatment of antipsychotic-induced akathisia. Can J Psychiatry. 2018;63(11): 719-729.
Tachere RO, Mandana M. Beyond anxiety and agitation: A clinical approach to akathisia. Royal Australian Coll Gen Practitioners. 2017;46(5): 296-298.
Key points
- Although associated more with psychiatric medications, akathisia can occur with non-psychotropics as well.
- To recognize the illness, the clinician must notice the repetitive involuntary movements and pacing as well as the “ants in the pants” fidgeting involved.
- Primary treatment consists of medication discontinuation with pharmaceutical intervention as a backup.
- Recognition is the key to successful treatment.
Classic signs of akathisia
- Fidgeting – “ants in the pants”
- Swinging the legs while seated
- Rocking from foot to foot
- Walking while in a static position
- Inability to sit or stand still – pacing
- Onset appears with the initiation or dose adjustment of an offending drug
Quiz
1. Which of the following findings occur in Akathisia?
A. Fidgeting
B. Pacing
C. Swinging the legs while seated
D. All the above
Answer: D
Akathisia is manifest as involuntary hyperactivity of the extremities, particularly the lower extremities. People feel the urge to move, to continue endlessly in motion, stopping only when fatigue sets in. The fidgeting has been described by patients as feeling like “ants in the pants.”
2. Which of the following interventions are used to treat akathisia?
A. Drug discontinuation
B. Propranolol
C. Mirtazapine
D. All the above
Answer: D
All the interventions mentioned are used to treat akathisia. The foremost is to stop the offending drug. Failing this, propranolol is the “gold standard” while 5HT2a antagonists, such as mirtazapine, are favored when beta-blockers either fail or are contraindicated.
3. The use of pyridoxine (Vitamin B6) in the treatment of akathisia is associated with what toxicities?
A. Headache
B. Nausea
C. Seizures
D. All the above
Answer: D
The use of Vitamin B6 in the treatment of akathisia has several drawbacks. Its administration is associated with headache and nausea, and high dose usage increases the risk of seizure.
4. If unresolved, akathisia can lead to which of the following?
A. Insomnia
B. Suicide
C. Physical exhaustion
D. All the above
Answer: D
Akathisia, left unrecognized and untreated, can eventually lead to physical exhaustion, and is compounded by difficulties in trying to rest, hence insomnia. The physical and mental torment of this malady can lead to suicide.